Embed Size (px)
Citation preview

Chapter 6
Chemical Thermodynamics and theStudy of Magmas
Mark S. GhiorsoOFM Research, Seattle, WA, USA
Guilherme A.R. GualdaEarth and Environmental Sciences, Vanderbilt University, Nashville, TN, USA
Chapter Outline1. Introduction 144
2. Thermodynamic Potentials and Modeling the
Equilibrium State 145
3. The Minimization of a Thermodynamic Potential 152
4. Computational Thermodynamics Tools Available
to the Volcanologist/Igneous Petrologist 154
4.1. Geothermometers, Geobarometers, and
Geohygrometers for Magmatic Systems 155
4.2. Mineral and Melt Thermodynamic Property
Calculators for Magmatic Phases 157
4.3. Solubility Calculators for Volatiles in Magmatic
Systems 157
4.4. Computation of Phase Equilibria 157
5. Future Directions of Chemical Thermodynamic
Applications in Magmatic Systems 158
Acknowledgments 159
Further Reading 159
GLOSSARY
activity A thermodynamic measure of the energetically effectiveconcentration of a component in a solution.
chemical potential A thermodynamic quantity that describes howthe Gibbs free energy of the system changes by addition of onemole of a system component; formally the partial derivative of theGibbs free energy with respect to the number of moles of aparticular component, evaluated at constant temperature, pres-sure, and the molar abundances of all other components in thesystem.
(thermodynamic) component An independent variable that de-scribes the abundance of a chemical constituent in a thermody-namic system.
enthalpy A thermodynamic potential that characterizes the equilib-rium state under conditions of fixed entropy content, pressure, andbulk composition; the “heat content” of a thermodynamic systemat fixed pressure; this thermodynamic potential is minimizedwhen entropy, pressure and bulk composition are set, with otherthermodynamic quantities (e.g., temperature, volume, etc.) beingderived quantities.
entropy In an equilibrium (reversible) state, a measure of the totalheat content of a thermodynamic system; under more general(irreversible) conditions, a measure related to the energetic drive
(the chemical affinity) that brings a system to an equilibriumstate.
equilibrium state The state under which a thermodynamic systemcan no longer evolve; a state of rest characterized by a globalminimum in the thermodynamic potentials (e.g., Gibbs freeenergy, enthalpy, Helmholtz free energy) of the system.
fugacity The energetically effective partial pressure of a componentin a thermodynamic system.
Gibbs free energy A thermodynamic potential that characterizes theequilibrium state under conditions of fixed temperature, pressure,and bulk composition; this thermodynamic potential is minimizedwhen temperature, pressure and bulk composition are set, withother thermodynamic quantities (e.g., entropy, volume, etc.) beingderived quantities.
GibbseDuhem relation A differential equation that relates variationin the chemical potentials of system components to changes intemperature or pressure; a more generalized statement of thepetrologic phase rule.
Helmholtz free energy A thermodynamic potential that character-izes equilibrium under conditions of fixed temperature, volume,and bulk composition; this thermodynamic potential is minimizedwhen temperature, volume and bulk composition are set, withother thermodynamic quantities (e.g., entropy, pressure, etc.)being derived quantities.
The Encyclopedia of Volcanoes. http://dx.doi.org/10.1016/B978-0-12-385938-9.00006-7
Copyright ! 2015 Elsevier Inc. All rights reserved.
143
The Encyclopedia of Volcanoes, Second Edition, 2015, 143e161
Author's personal copy

internal energy A thermodynamic potential that characterizesequilibrium under conditions of fixed entropy content, volume,and bulk composition; this thermodynamic potential is minimizedwhen entropy, volume and bulk composition are set, with otherthermodynamic quantities (e.g., temperature, pressure, etc.) beingderived quantities.
isenthalpic process A process in a thermodynamic system at fixedenthalpy content; a reversible adiabatic process at fixed pressure.
isentropic process A process in a thermodynamic system at fixedentropy content; any reversible adiabatic process.
isochoric process A process in a thermodynamic system at fixedvolume.
Korzhinskii potential Any thermodynamic potential applicable to asystem that is open to mass transfer of a perfectly mobilecomponent across its boundaries; the potential is defined in such away that the energetic properties of that mobile component arefixed externally and imposed upon the thermodynamic system.
latent heat Heat generated by a system as a result of a change in thethermodynamic state of a phase (e.g., crystallization of a magma).
(thermodynamic) phase Any compositionally homogeneous macro-scopic region of a thermodynamic system.
(thermodynamic) potential An energetic measure of a thermody-namic system whose value is uniquely determined by a set ofindependent variables (i.e., the state of the system); a function thatdepends only on the current state of the system, and not on themanner in which the system acquired that state.
sensible heat Heat generated by a system as a result of changing thetemperature in the absence of a change in the thermodynamicstate of a phase (see latent heat).
(thermodynamic) system A macroscopic region that contains acollection of one or more phases; the system is closed if theboundary is impermeable to mass transfer.
1. INTRODUCTION
Chemical thermodynamics provides a theoretical frame-work that relates the composition of a system to its energy.A system is something that you are interested in studying.It can be broadly defined, as for example a magma bodyresiding in the shallow crust, or narrowly focused, as aphenocryst or a rock. Composition in the system need notbe homogeneously distributed, nor even contiguous. Inchemical thermodynamics, we speak of the system beingpartitioned into compositionally homogeneous regionsand refer to these as phases. We express the compositionof the system in terms of a linearly independent set ofvariables, called components. The chemical thermody-namics relates how the energy of the system varies ascomponents are partitioned between the phases and as theproportions of phases vary. This relationship is oftennonintuitive; gravity is intuitive, Newton’s laws are intu-itive, but how the structure of a material and its compo-sition determine its potential energy is not. The practicalchallenge of chemical thermodynamics when applied tomagmatic systems is to illuminate as clearly and simply as
possible how the energy of the system relates to its phaseassemblage.
It is important to appreciate that chemical thermody-namics is applicable to a dynamically evolving system. Thecommon perception is that thermodynamics is the study ofthe equilibrium state, that is, the state of the system forwhich the energy is at a minimum and from which there canbe no further spontaneous evolution of phase compositionsand proportions. This view stems from the fact that theprinciples of thermodynamics uniquely characterize thesystem at equilibrium, which is determined by minimizingsome energetic measure of the system. Yet, thermody-namics allows us to assess the energy of a system in allstates, not just the equilibrium one; it thus allows calcula-tion of differences in energy between diverse disequilib-rium states and the unique equilibrium state of the system.In this way, chemical thermodynamics gives us a measureof the energetic drive to achieve an equilibrium state, whichthrough the application of kinetic theory, can inform therates of chemical reactions and the timescales of systemevolution.
Despite this direct connection to kinetics, in the appli-cation of chemical thermodynamics to magmatic systemswe are usually concerned with the equilibrium state. Theestimation of the temperature and pressure of coexistencebetween phases (geothermometry and geobarometry), theanalysis of trace element partitioning between phases, themodeling of volatile phase saturation in silicate liquids, andthe estimation of phase stabilities and elemental partition-ing between phases, all assume that the system of interest isat equilibrium. Even computational tools that do notconform to the theory of thermodynamics still assume anunderlying state of equilibrium. While tools may or maynot be based upon computational thermodynamics, thoserooted in the foundations of thermodynamics generate themost comprehensive view of elemental partitioning in thesystem. There is an intrinsic advantage of using a long-established (and never refuted!) theory for the depen-dence of composition, temperature, and pressure on energy;thermodynamics provides constraints on the functionalform of the underlying mathematical expressions, which inturn reveals the best method of extrapolation of experi-mental data sets.
In this chapter we cannot make an encompassingreview of the application of chemical thermodynamics tomagmatic systems, but instead we will focus on an over-view of the application of thermodynamics to the esti-mation of phase relations in magmatic systems, utilizing abroad spectrum of boundary constraints. Additionally, wewill provide a summary of available tools in computa-tional thermodynamics for the calculation of phaserelations, volatile solubilities, and geothermometry andgeobarometry. For comprehensive treatments of thechemical thermodynamics, presented with an orientation
144 PART | I Origin and Transport of Magma
The Encyclopedia of Volcanoes, Second Edition, 2015, 143e161
Author's personal copy

directed to the earth sciences, the reader should consult theexcellent texts by Ganguly (2008) and Spear (1993). Theclassic texts by Pitzer and Brewer (1961) and Prigogineand Defay (1954) are timeless and definitive referenceworks.
2. THERMODYNAMIC POTENTIALS ANDMODELING THE EQUILIBRIUM STATE
Solution of most problems in chemical thermodynamicsrests on the exercise of calculating an equilibrium assem-blage and its properties. This is done through the minimi-zation of a thermodynamic potential (or state function), ameasure of the energy content of the system as a function ofa set of independent variables (see Table 6.1). The practicalquestion is then which thermodynamic potential is appro-priate in which scenario.
The Gibbs1 free energy (G) is the thermodynamic po-tential that is minimal in a chemical system at equilibriumfor the necessary conditions of fixed bulk composition,temperature (T), and pressure (P). The omnipresence of theGibbs free energy in discussions of chemical thermody-namics in earth sciences suggests some higher standing forthis potential. This is not so. The apparent obsession for theGibbs free energy is simply due to (1) the fact that it isrelatively easy to perform experiments at fixed T and P in
the laboratory and (2) the fact that it is in many casesreasonable to assume that geologic processes take place atfixed T and P.
The necessary conditions associated with any ther-modynamic potential are essential, and should be under-stood and applied with care. An open system, e.g., one forwhich oxygen or hydrogen transfer occurs across theboundaries, or for which a phase or part of a phase issequestered from chemical communication with the otherphases in the system, does not have fixed bulk composi-tion. Such a system can still be in equilibrium, but thenecessary conditions must be altered to account for masstransfer across the permeable boundary. In this case, theGibbs free energy is not the thermodynamic potential ofchoice. Thermodynamic potentials that are applicable toequilibrium calculations in open systems are calledKorzhinskii potentials2 (Ghiorso and Kelemen, 1987)and may be constructed via suitable mathematical trans-formations of the Gibbs free energy. The reader is referredto the discussion in Ganguly (2008, p. 53) or Callen (1985,Chapter 5) on the method of Legendre transforms for moredetails. An open system is at equilibrium when thechemical potential (m, definition below) of the mobilecomponent is specified and fixed. A typical example that isapplicable to magmatic systems involves equilibriumcalculations at fixed redox state. The redox state of a
TABLE 6.1 Thermodynamic Potentials and Their Differential Forms
Name
Independent
Variables Definition Differential
Gibbs freeenergy (G)
T, P, n1, n2,., nc G¼ E" TSþ PV dG ¼ "SdT þ VdP þPc
i midni Isobariccrystallization
Korzhinskiioxygen (L)
T, P, n1, n2,., ncfor all componentsexcept O2, mO2
L ¼ G " nO2mO2dG ¼ "SdT þ VdP þ
PcisO2
midni þ nO2dmO2Isobaric, fixed fO2
crystallization
Enthalpy (H) S, P, n1, n2,., nc H¼Gþ TS dH ¼ TdS þ VdP þPc
i midni Magma mixing,wall rockassimilation
Helmholtzfree energy (A)
T, V, n1, n2,., nc A¼G" PV dA ¼ "SdT " PdV þPc
i midni Isochoric (con-stant volume)crystallization
Internalenergy (E)
S, V, n1, n2,., nc E¼Gþ TS" PV DE ¼ TdS " PdV þPc
i midni Crystallization byheat loss undervariable volumeconstraints
In the above table S denotes the entropy of the system.
1 Josiah Willard Gibbs, 1839e1903, see the preface of Bumstead and VanName (1906).
2 After Dmitri Sergeyevich Korzhinskii, 1899e1985, a petrologist whofirst formulated and applied the phase rule to rock systems open to volatiletransfer.
145Chapter | 6 Chemical Thermodynamics and the Study of Magmas
The Encyclopedia of Volcanoes, Second Edition, 2015, 143e161
Author's personal copy

magma is generally specified by constraining the oxygenfugacity ðfO2
Þ, which is simply the “effective” partialpressure of oxygen ðpO2
Þ; the difference between fO2and
pO2is due to energetic interaction between oxygen and
other system components. The fugacity can be greater thanor less than the partial pressure, depending on whether thesystem energy is raised or lowered by the energeticinteraction; the specific relation requires experimentalmeasurement or first-principles computational assessment.The oxygen fugacity is related to the chemical potential ofoxygen via the definition
mO2¼ m0O2
þ RT lnfO2
f 0O2
(6.1)
where R is the universal gas constant and the superscriptzero denotes the standard state, which generally refers tothe properties of the pure substance3. Formally, the chem-ical potential is defined as the partial derivative of the Gibbsfree energy with respect to the molar concentration of acomponent in the system:
mO2¼
!vG
vnO2
"
T ;P;nisO2
(6.2)
The derivative is taken while holding T, P, and the con-centrations of all other components in the system constant.Physically, the chemical potential assesses the infinitesimalchange in the Gibbs free energy of the system associatedwith an infinitesimal increase in the concentration of thespecified component. The chemical potential is the essenceof chemical thermodynamics. All we desire to know aboutthe relation between composition and energy is embodiedin the system chemical potentials. Their definition is sim-ple, and the great triumph of Gibbs. Their practical calcu-lation is complex and often elusive, but neverthelessrepresents the holy grail of chemical thermodynamicmodeling and the focus of attention of practitioners ofchemical thermodynamics for over a century.
Gibbs (1878; eq. 88, p. 87 in Bumstead and van Name,1906) derived a remarkable equation (which we now knowas the GibbseDuhem relation) that establishes that in asystem at equilibrium, the chemical potential of a givencomponent must be the same in all phases. This condition isoften taken as the definition of an equilibrium state, and isequivalent to the previously stated criterion that the Gibbsfree energy of the system is minimal at equilibrium.
As stated above, equilibrium in an open system can becalculated by constructing a Korzhinskii potential for thecase where the chemical potential of the mobile componentis specified. In our example case of a fixed oxygen redoxstate, this potential (L, see Table 6.1 and Ghiorso and
Kelemen, 1987) is minimal at equilibrium when T, P, mO2,
and the concentrations of all other system components areheld fixed. Oxygen is released or absorbed across the sys-tem boundary in order to maintain the fixed chemical po-tential constraint. It is worth recalling that a large numberof experimental determinations of phase equilibria inmagmatic systems are performed at fixed oxygen redox
1000 1050 1100 1150 1200
–0.6
–0.4
–0.2
0
0.2
0.4
∆log
10 f O
2
Gibbs (closed)Korzhinskii (open)
1000 1050 1100 1150 1200T (ºC)
–2
–1
0
1
2∆(
Clo
sed–
Ope
n)
LiquidSpinelFeldsparOlivinecpxopxIlmenite
1000 1050 1100 1150 1200
–12
–11
–10
–9
MORB
QFM-1
Closed > Open
Open > Closed
QFM-1
FIGURE 6.1 Equilibrium crystallization of MORB under closed-systemconditions (minimization of the Gibbs free energy) and open-systemconditions (boundary open to oxygen transfer; minimization of theKorzhinskii potential). Top panel: redox state of the system, expressed asthe base 10 logarithm (log10) of the fugacity of O2 (fO2
) relative to thequartzefayaliteemagnetite buffer minus one log10 unit (QFM-1), plottedas a function of T. Red line shows the open system, blue curve the closedsystem. Note that the phase assemblage for the closed system is plotted as afunction of T in Figure 6.2. The inset shows the variation of absolutelog10fO2
as a function of T for the open system; the oxygen buffer itself is astrong function of temperature over the entire crystallization interval.Lower panel: difference in phase abundances between closed- and open-system evolutions plotted as a function of T. Calculations performedusingMELTS (Ghiorso and Sack, 1995) with a 5 &C resolution. In the open-system scenario the redox state is buffered. In the closed-system evolutionthe system initially oxidizes because precipitating solid phases are enrichedin ferrous iron relative to ferric iron, thereby lowering the ferrous to totaliron ratio of the liquid with crystallization. The oxidation trend is reversedwhen a solid phase (here magnetite) appears on the liquidus that has aferrous to total iron ratio lower than that of the liquid. cpx: clinopyroxene,opx: orthopyroxene. (See Ghiorso and Carmichael (1985) and Ghiorso(1997) for further discussion.)
3 In this case the chemical potential or the fugacity of pure oxygen gas atthe temperature of interest and the specific pressure of 0.1 MPa.
146 PART | I Origin and Transport of Magma
The Encyclopedia of Volcanoes, Second Edition, 2015, 143e161
Author's personal copy

state, e.g., with an imposed oxygen fugacity buffer. Assuch, these experiments seek to minimize the Korzhinskiipotential in their quest to describe the equilibrium state.
To illustrate the consequences of Gibbs or Korzhinskiipotential minimization on magmatic phase relations,closed- and open-system equilibrium crystallization ofMid-ocean ridge basalt (MORB) magma is illustrated inFigures 6.1 and 6.2. The results are obtained by applicationof the MELTS (Ghiorso and Sack, 1995; Gualda et al.,2012) thermodynamic modeling software (see below) andillustrate the very different evolution paths experienced bythe magma cooling under these alternate constraints. Notethat in the closed system scenario the redox state, relative toa fixed oxygen buffer, varies in response to the solid phaseassemblage that is crystallizing, with the redox stateeffectively set by the ratio of ferric to total iron in the liquidphase (Kress and Carmichael, 1991); this ratio varies as aconsequence of the differential partitioning of ferrous and
ferric iron in the coexisting crystals whose identity andcompositions vary as a function of crystallization. Somedetails are presented in the figure legend. For a morethorough discussion of the redox evolution accompanyingmagmatic crystallization see Osborn (1959, 1962), Ghiorsoand Carmichael (1985), Carmichael and Ghiorso (1990),and Ghiorso (1997).
Not all near-equilibrium magmatic processes and evo-lution scenarios can best be described as Gibbs or Korz-hinskii potential minimization problems, despite the factthat intuitively, we are comfortable with using T and P asconstraint variables in thinking about the state and evolu-tion of magma bodies. This intuition comes naturally fromthe realization that both variables are common controls onexperimental phase relations, both are accessible to oureveryday experience, and both are independent of the massof the system being considered. Our intuition to choosethese constraint variables, however, does not always lead us
1000 1050 1100 1150 1200
20
40
60
80
wt% Liquid
SpinelFeldsparOlivinecpx
740 750 760 770 780 790
20
40
60
80
wt%Liquid
WaterSanidineQuartzspn, ilm, etc.Plagioclase
1000 1050 1100 1150 1200
T (oC)
2300
2400
2500
2600
2700
2240
2280
2320
2360
2400
2440
2480
1000 1050 1100 1150 1200
345
350
355
360
365
370
740 750 760 770 780 790
T (oC)
460
470
480
490
500
510
520
Volume (cc/kg) Entropy (J/K-kg)
Volume (cc/kg)
Entropy (J/K-kg)
MORB High-silica rhyolite
100 MPa
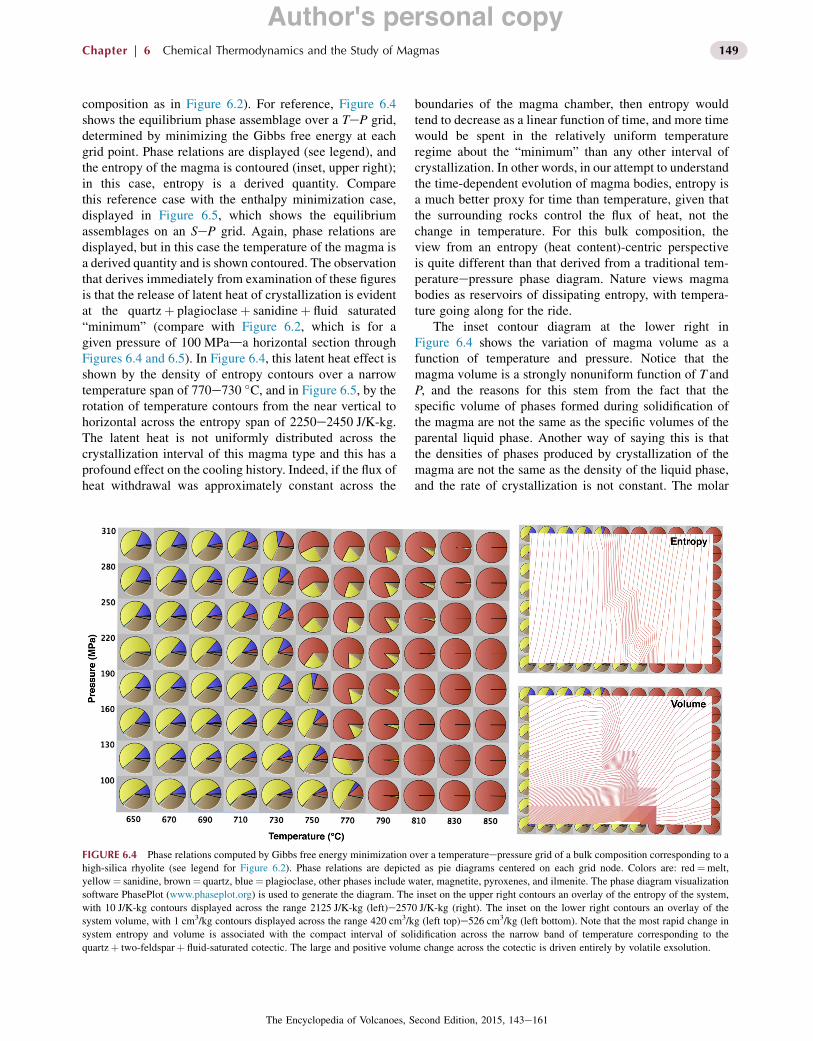
FIGURE 6.2 Closed system equilibrium crystallization of MORB (left) and high-silica rhyolite (right) as a function of T at fixed pressure (100 MPa).Upper panels show phase proportions in wt%. Note that crystallization for the MORB extends over 250 &C, while that for the rhyolite is substantiallycompleted over a 20 &C interval, highlighting the fact that rhyolite bulk composition is near-eutectic in nature. The lower panels show variation in entropyand volume with T. The contribution of latent heat to the entropy production is clearly seen for the rhyolite around the “eutectic,” which is not apparent forthe MORB composition. The decrease in system volumewith crystallization for the MORB case is typical, and contrasts with the rapid increase in volumeaccompanying volatile exsolution demonstrated by the rhyolite composition. Compare the volume and entropy trends for the high-silica rhyolite with thecontour diagrams plotted in Figure 6.4. Calculations are performed using rhyolite-MELTS (Gualda et al., 2012) with a 1 &C resolution. MORBcomposition (grams): SiO2, 48.68; TiO2, 1.01; Al2O3, 17.64; Fe2O3, 0.89; Cr2O3, 0.042; FeO, 7.59; MgO, 9.1; CaO, 12.45; Na2O, 2.65; K2O, 0.03; P2O5,0.08; H2O, 0.2. High-silica rhyolite composition (grams): SiO2, 77.8; TiO2, 0.09; Al2O3, 12.0; Fe2O3, 0.196; FeO, 0.474; MgO, 0.04; CaO, 0.45; Na2O,3.7; K2O, 5.36; H2O, 3.74. cpx: clinopyroxene, ilm: ilmenite, spn: spinel.
147Chapter | 6 Chemical Thermodynamics and the Study of Magmas
The Encyclopedia of Volcanoes, Second Edition, 2015, 143e161
Author's personal copy

down the best path of understanding how magma bodiesrespond to the dynamically changing mantle and crustalenvironments in which they reside. Consider, for example,a magma body in a mid- to shallow-crustal setting. Howdoes this body evolve? Discounting for the moment theconsequences of eruption, recharge, and assimilation,the body evolves principally by withdrawal of heat to thecountry rock (Figure 6.3). The heat withdrawal (DQ) takesplace by conductive cooling and perhaps some degreeof convective removal supported by fluid circulationthrough the medium of the country rocks. The magmabodydregardless of the nature or style of internal con-vectiondpartitions this withdrawn heat between loweringthe temperature of the body (the portion of heat known assensible heat), crystallizing the liquid phase (the portionknown as latent heat), and perhaps converting one solidphase to another (generating a negative or positive heat ofreaction). The natural operative variable in this scenario isthe heat content of the body and not the temperature. Thetemperature is a derived value, determined by the nature ofthe phase diagram that describes crystallization behaviorof the bulk composition of interest. To see how the natureof the phase diagram controls the thermal evolution,compare the evolution of a MORB with that of a high-silicarhyolite, in which crystallization takes place over a verynarrow temperature interval, leading to a very nonuniformpartitioning between sensible and latent heat (Figure 6.2).Additionally, temperature is critically controlled by the sizeof the magma reservoir, because heat content is an exten-sive thermodynamic quantity; it depends on mass and
hence, the size of the body. It would be more natural,therefore, to consider modeling the evolution of this crustalmagma reservoir by specifying the heat content and thepressure of the body, and determining phase compositions,phase abundances, and T as modeled outcomes.
The equilibrium crystallization scenario described inthe previous paragraph can easily be modeled. The secondlaw of thermodynamics tells us that for a reversibleprocessda process modeled as a series of equilibriumstepsdthe change in heat content of a system is equivalentto a change in entropy (S),
DS ¼ DQrev
T(6.3)
The thermodynamic potential that is minimal in a system atequilibrium subject to fixed bulk composition, fixed pres-sure, and fixed entropy (i.e., heat content) is the enthalpy(H, see Table 6.1). Consequently, by minimizing theenthalpy of the magma for specified S, P, and bulkcomposition, we can calculate the phase compositions,phase proportions, and the temperature of the magmabody; the entropy content can be linked to the heat flow outof the body dictated by heat transfer rates through thesurrounding country rocks. An example of a calculation ofthis nature is shown in Figures 6.4 and 6.5. For thiscalculation the software PhasePlot (www.phaseplot.org)has been utilized, which implements the underlying ther-modynamic models of the rhyolite-MELTS packagedescribed in Gualda et al. (2012). The bulk compositionchosen for this example is a high-silica rhyolite (same
∆Q
∆Q
∆Q∆Q
∆Q∆Q
er usser p cit at sohtiL∆V
Viscoelastic response of crustal rocks
noitpurE
Recharge
How does temperature andpressure vary with position?How does temperature and
pressure vary with position?
FIGURE 6.3 Magma body residing in the mid- to shallow-crust. The magma body is surrounded by a viscoelastic container of country rocks. Lithostaticpressure is vertical. Heat is lost (DQ) from the magma body to the country rock by cooling. Heat sources within the magma body are derived from sensibleand latent contributions. The latter arise from phase change. Cooling also induces volume change (DV) of the magma body, similarly arising from sensibleand latent contributions. The volume change associated with magmatic crystallization is generally negative, but it can be strongly positive in the case ofvolatile exsolution at low pressures (see Figure 6.2). If the magma DV accompanying magmatic heat loss is not exactly compensated by the viscoelasticresponse of the crustal rocks, an internal pressure field will develop within the magma reservoir that does not match the external lithostatic pressure. Thispressure differential has the potential of driving either recharge or eruption.
148 PART | I Origin and Transport of Magma
The Encyclopedia of Volcanoes, Second Edition, 2015, 143e161
Author's personal copy
composition as in Figure 6.2). For reference, Figure 6.4shows the equilibrium phase assemblage over a TeP grid,determined by minimizing the Gibbs free energy at eachgrid point. Phase relations are displayed (see legend), andthe entropy of the magma is contoured (inset, upper right);in this case, entropy is a derived quantity. Comparethis reference case with the enthalpy minimization case,displayed in Figure 6.5, which shows the equilibriumassemblages on an SeP grid. Again, phase relations aredisplayed, but in this case the temperature of the magma isa derived quantity and is shown contoured. The observationthat derives immediately from examination of these figuresis that the release of latent heat of crystallization is evidentat the quartzþ plagioclaseþ sanidineþ fluid saturated“minimum” (compare with Figure 6.2, which is for agiven pressure of 100 MPada horizontal section throughFigures 6.4 and 6.5). In Figure 6.4, this latent heat effect isshown by the density of entropy contours over a narrowtemperature span of 770e730 &C, and in Figure 6.5, by therotation of temperature contours from the near vertical tohorizontal across the entropy span of 2250e2450 J/K-kg.The latent heat is not uniformly distributed across thecrystallization interval of this magma type and this has aprofound effect on the cooling history. Indeed, if the flux ofheat withdrawal was approximately constant across the
boundaries of the magma chamber, then entropy wouldtend to decrease as a linear function of time, and more timewould be spent in the relatively uniform temperatureregime about the “minimum” than any other interval ofcrystallization. In other words, in our attempt to understandthe time-dependent evolution of magma bodies, entropy isa much better proxy for time than temperature, given thatthe surrounding rocks control the flux of heat, not thechange in temperature. For this bulk composition, theview from an entropy (heat content)-centric perspectiveis quite different than that derived from a traditional tem-peratureepressure phase diagram. Nature views magmabodies as reservoirs of dissipating entropy, with tempera-ture going along for the ride.
The inset contour diagram at the lower right inFigure 6.4 shows the variation of magma volume as afunction of temperature and pressure. Notice that themagma volume is a strongly nonuniform function of T andP, and the reasons for this stem from the fact that thespecific volume of phases formed during solidification ofthe magma are not the same as the specific volumes of theparental liquid phase. Another way of saying this is thatthe densities of phases produced by crystallization of themagma are not the same as the density of the liquid phase,and the rate of crystallization is not constant. The molar
FIGURE 6.4 Phase relations computed by Gibbs free energy minimization over a temperatureepressure grid of a bulk composition corresponding to ahigh-silica rhyolite (see legend for Figure 6.2). Phase relations are depicted as pie diagrams centered on each grid node. Colors are: red¼melt,yellow¼ sanidine, brown¼ quartz, blue¼ plagioclase, other phases include water, magnetite, pyroxenes, and ilmenite. The phase diagram visualizationsoftware PhasePlot (www.phaseplot.org) is used to generate the diagram. The inset on the upper right contours an overlay of the entropy of the system,with 10 J/K-kg contours displayed across the range 2125 J/K-kg (left)e2570 J/K-kg (right). The inset on the lower right contours an overlay of thesystem volume, with 1 cm3/kg contours displayed across the range 420 cm3/kg (left top)e526 cm3/kg (left bottom). Note that the most rapid change insystem entropy and volume is associated with the compact interval of solidification across the narrow band of temperature corresponding to thequartzþ two-feldsparþ fluid-saturated cotectic. The large and positive volume change across the cotectic is driven entirely by volatile exsolution.
149Chapter | 6 Chemical Thermodynamics and the Study of Magmas
The Encyclopedia of Volcanoes, Second Edition, 2015, 143e161
Author's personal copy

volume of a volatile phase (principally H2OeCO2 fluidsolutions) is, at shallow crustal pressures, much larger thanthe partial molar volumes of dissolved H2O or CO2 in themelt, and the specific volumes of solid phases are generallysmaller than the corresponding compositionally equivalentmass of liquid. These generalizations are intriguingbecause if one views the magma body as residing in adeformable pile of crustal rocks, then the question arises asto whether the crustal container can deform quickly enoughto compensate the volume change associated with phasetransformations in the solidifying magma and maintain aconstant pressure within the magma body. If crustaldeformation is not fast enough, a pressure drop or rise in themagma will follow, leading to decoupling of the internalpressure field of the magma body from the lithostaticpressure field of the crustal rocks. The critical thermody-namic variables that govern the internal pressure of themagma are consequently the volume of the magmacontainer, and the bulk compressibility (b; or its inverse thebulk modulus, K) of the magmatic liquidþ solidþ fluidassemblage. The latter quantifies how the volume changesdue to a change in applied pressure.
In order to access the consequences of magmaticcrystallization on the condition of chamber volumedictated by crustal deformation rates, we must find a
thermodynamic potential that is minimal under conditionsof specified volume (V), temperature, and bulk composi-tion. That potential is the Helmholtz free energy (A, seeTable 6.1). Minimizing A at fixed V, T, and bulk compo-sition yields the equilibrium compositions and proportionsof phases and values for the dependent quantity pressure.An illustration of this calculation, again for the high-silicarhyolite composition used in Figures 6.2, 6.4, and 6.5, canbe performed with PhasePlot and is presented inFigure 6.6. One sees from the pressure contour diagramthat overlays the VeT phase relation grid (inset, lowerright), that pressure changes dramatically as a conse-quence of exsolution of a volatile phase, a not altogethersurprising result given the drastic difference in density ofthe volatile phase compared with that of the solids andliquids. The pressure contours are subhorizontal in theVeT subgrid where volume change is dominated bythermal deflation; pressure contours become verticalwhere the DV of phase change induced by a temperaturedrop dominates (see figure legend for additional discus-sion). A detailed application of Helmholtz minimizationto phase equilibria and evolution of the Campanianmagma body is presented by Fowler et al. (2007) for thespecific end-member case of isochoric (constant volume;infinitely rigid crust) crystallization.
FIGURE 6.5 Phase relations computed by enthalpy minimization over an entropyepressure grid of a bulk composition corresponding to a high-silicarhyolite. Phase relations are depicted, labeled, and computed as in Figure 6.4. The inset on the upper right contours an overlay of the temperature of thesystem, with 1 &C contours displayed across the range 676 &C (left)e818 &C (right). The inset on the lower right contours an overlay of the system volume,with 1 cm3/kg contours displayed across the range 419 cm3/kg (top)e525 cm3/kg (left bottom). Note that the temperature contours change orientationfrom nearly vertical to nearly horizontal as the quartzþ two-feldsparþ volatile-saturated cotectic is traversed. Compare the volume contour diagram withthat shown in Figure 6.4 and note that the compact volume change in temperature space is extended over a much broader interval of entropy space. As theentropy (or heat content) of the magma is changed, the temperature response is dominated by sensible heat, where the temperature contours are vertical, orlatent heat, where the temperature contours approach the horizontal.
150 PART | I Origin and Transport of Magma
The Encyclopedia of Volcanoes, Second Edition, 2015, 143e161
Author's personal copy

None of the results presented in Figures 6.4, 6.5, or 6.6bear the greatest fidelity to the more realistic boundaryconstraints on upper crustal magma chamber evolution thatare dictated by simultaneous and competing rates of heatwithdrawal and crustal deformation. The operative ther-modynamic variables in this general case are the total heatcontent of the magma (the entropy in the equilibriumapproximation) and the chamber volume. The thermody-namic potential that is minimal for specified values of en-tropy, volume, and bulk composition is the internal energy(E, see Table 6.1). Minimizing E at fixed S, V, and bulkcomposition yields the equilibrium proportions and com-positions of phases in the system as well as values for thedependent variables, T and P. We illustrate such a calcu-lation with results from PhasePlot in Figure 6.7, again usingthe same high-silica rhyolite composition as before. Notethat the temperatureepressure field changes in a nonlinearfashion over the SeV grid. The key thermodynamic quan-tities that translate heat and volume to temperature andpressure are the isobaric heat capacity (CP) and, as notedabove, the isothermal compressibility (b). Both quantitieshave been measured experimentally (for compilations seeLange and Carmichael, 1990; Ghiorso and Kress, 2004). Sand V are the “natural” thermodynamic variables for un-derstanding the thermal and mechanical coupling betweenthe state of a magma body and surrounding environment.They are not the intuitive variables that we are used to
thinking and working with. But, viewing the evolution of amagma body as a pool of dissipating entropy residing in adeforming container is the proper mind-set for under-standing the thermodynamic constraints under which thesystem evolves.
How the pressureetemperature field of a magma bodyevolves in detail will be mandateddat both a local andglobal scaledby heat content and volume constraints,which are in turn a product of a combination of internal andexternal factors. Phase transformations, or more generallythe phase diagram of the magma, dictate the internal con-tributions to S and V, while the mechanics of deformationand the vagaries of heat flow dictate the external factors.Predictions of specific outcomes are difficult to generalizeand must be computed by numerical models that couplethermodynamic and dynamic (and kinetic) contributions.Such models are state of the art in computational petrologyand beyond the realm of this brief chapter, but severalimportant features of these coupled models should beappreciated. Even the simplest coupled models of magma-body crustal evolution must admit the compressibility ofthe magmatic fluid, which is commonly ignored byimposing the Boussinesq approximation in standarddynamical modeling. Volume change on phase trans-formation must appear in a realistic coupled model as mustthe dependence of the latent heat production on volumefraction of melt. These are first-order physical phenomena
FIGURE 6.6 Phase relations computed by Helmholtz free minimization over a temperatureevolume grid of a bulk composition corresponding to a high-silica rhyolite. Phase relations are depicted, labeled, and computed as in Figure 6.4. The inset on the upper right contours an overlay of the entropy of thesystem, with 10 J/K-kg contours displayed across the range 2100 J/K-kg (left)e2570 J/K-kg (right). The inset on the lower right contours an overlay ofthe system pressure, with 20 MPa contours displayed across the range 76 MPa (right top)e966 MPa (right bottom). The abrupt change in the slope of thepressure contours corresponds to the onset of volatile saturation.
151Chapter | 6 Chemical Thermodynamics and the Study of Magmas
The Encyclopedia of Volcanoes, Second Edition, 2015, 143e161
Author's personal copy

that prescribe the evolution of the TeP field in the magmareservoir, and all these phenomena are dictated by the phasediagram of the magma. Phase diagrams can be determinedby experiment under controlled T and P conditions. Wemake thermodynamic models of these datadmeaning thatwe generate expressions for Gibbs free energies of thephases that contribute to the phase diagram. We require thetheory of chemical thermodynamics, however, to utilizethese data in the broadest possible context, which allows usto calculate outcomes that are not directly obtainable fromexperiment, but that can be computed in ways that are adirect and internally consistent consequence of the primaryobservations.
3. THE MINIMIZATION OF ATHERMODYNAMIC POTENTIAL
Often the statement that the equilibrium state of asystem is given by the minimum in an appropriatelyconstrained thermodynamic potential leaves the studentin a quandary. How is that minimization actually done?It turns out that the method is not really all thatcomplicated, but in most cases the process is tedious,and inevitably for real systems, must be accomplished byiterative approximation.
Any thermodynamic potential that is minimal in anequilibrium state can be thought of as defining a geomet-rical or topographical landscape with hills and valleys
(Figure 6.8). The height of the landscape is the value of thesystem energy. The coordinates of the landscape (and ingeneral, there are more than two) constitute the temperatureor entropy, pressure or volume, and independent compo-sition variables of the system. In thermodynamic modelingwe seek the lowest point on this energy landscape(Figure 6.8). All other points represent states that are not in
FIGURE 6.7 Phase relations computed by internal energy minimization over an entropyevolume grid of a bulk composition corresponding to a high-silica rhyolite. Phase relations are depicted, labeled, and computed as in Figure 6.4. The inset on the upper right contours an overlay of the temperature ofthe system, with 5 &C contours displayed across the range 680 &C (left)e860 &C (right). The inset on the lower right contours an overlay of the systempressure, with 20 MPa contours displayed across the range 76 MPa (top)e992 MPa (right bottom).
FIGURE 6.8 Hypothetical thermodynamic potential surface for a one-component system, illustrating an energy landscape with independentvariables temperature and pressure (G), temperature and volume (A), en-tropy and pressure (H), and entropy and volume (E). See Table 6.1. Varioustopological features are displayed. The global minimum is the deepestvalley in the energy landscape.
152 PART | I Origin and Transport of Magma
The Encyclopedia of Volcanoes, Second Edition, 2015, 143e161
Author's personal copy

equilibrium and correspond to metastable phase assem-blages. The system might reside at an apparently stablelocal minimum and not the global minimum, but undersuch circumstances it would be metastable (Figure 6.8); thephases may be in exchange equilibrium with respect to oneor more components, or some critical phase may be sup-pressed from the assemblage due to kinetic barriers to itsformation.
To determine the equilibrium state of a system the taskin computational thermodynamics is twofold: (1) theidentity of the equilibrium phase assemblage must bedetermined and (2) the system components must be parti-tioned between those phases in order to reduce the energyof the system as much as possible. The first task is the keyto success. A global minimum will not be achieved unlessthe correct phase assemblage is specified. Simply choosingan arbitrary point on an energy landscape and ridingdownhill to the nearest minimum does not guarantee thatyou will end up at the global minimum and consequentlydoes not guarantee that the correct equilibrium phaseassemblage will be deduced. The procedure that must beemployed to assure attainment of an equilibrium assem-blage involves a periodic interrogation of the stability orinstability of all potential phases that might contribute tothe assemblage. Identifying the stability condition of aphase vis-a-vis a potential assemblage of phases that are
candidates for an equilibrium assemblage, can be formu-lated and solved as an iterative but algebraic problem with aguaranteed solution (Ghiorso, 2013; illustrated also inFigure 6.9). Accordingly, the most complex task of theequilibrium algorithm is the one of finding the minimumenergy of the system once a hypothetical phase assemblagehas been identified. There are many ways to solve thiscomputational problem. The method employed in Phase-Plot or the MELTS family of phase calculators (Ghiorso,1985; Ghiorso and Sack, 1995) is illustrated in Figure 6.10.
No matter what the order of complexity of the energylandscape for a thermodynamic system, the topology canalways be locally approximated about any point of interestby a tangential paraboloid (the multidimensional equivalentof a parabola). This approximation is done by constructingthe paraboloid using the first and second derivatives of thetrue energy surface, evaluating both at the point of interest(see Figure 6.10). The first derivative of the energy surfacein practice is a vector and the second derivative is a sym-metric matrix of second partial derivatives, but regardlessof these details, this quadratic geometrical approximation isalways possible. The point of interest, of course, is an initialguess to the phase compositions and proportions as deter-mined utilizing the phase stability algorithms alluded topreviously. A minimum of the locally tangential paraboloidcan always be located by construction or numerical
0 0.2 0.4 0.6 0.8 1X
12
14
16
18
20
22
Mol
ar G
ibbs
free
ene
rgy
OC phase
Target phase
Tangent line L
F
1
2
A1
AF
A2
Liquid
Solid
FIGURE 6.9 Illustration of a saturation state detection algorithm for a solid phase referenced to a liquid phase of composition XL. The Gibbs freeenergies of the two phases are illustrated by the heavy solid curves. The dashed line labeled “tangent line” is tangent to the liquid phase at “composition”XL. This line has the same slope as the tangent to the target phase at XF. Points 1, 2, etc. refer to the sequence of intermediate solutions that converge to F.The chords labeled Ai are geometrical representations of the chemical affinity, which is a direct measure of the degree to which the solid phase is un-dersaturated with respect to the liquid phase. When the affinity is zero (i.e., when the tangent line touches both the liquid and solid Gibbs free energysurface) the solid is in equilibrium with the liquid phase. The dotted curves are “ideal mixing” approximations of the solid phase. The algorithm forlocating XF and a value for AF is taken from Ghiorso (2013). The procedure is to approximate the solid phase as a succession of pseudoideal solutions,until that approximation converges on the properties of the real solution. For implementation details, consult the reference. OC phase: omnicomponentphase.
153Chapter | 6 Chemical Thermodynamics and the Study of Magmas
The Encyclopedia of Volcanoes, Second Edition, 2015, 143e161
Author's personal copy

evaluation. The only complication to this exercise is thatthe location of the parabolic minimum must satisfy, as didthe initial feasible point, all of the imposed constraints thatqualify the equilibrium condition. For the Gibbs free en-ergy, these would be fixed T, P, and bulk composition, andfor the Helmholtz energy, fixed T, V, and bulk composition,etc. The mechanics of imposing these constraints isstraightforward and discussed elsewhere (Ghiorso, 1985),but the important thing to understand is that the parabolicminimum is chosen in such a way that the constraints areenforced and the solution is physically viable.
As shown schematically in Figure 6.10, the vector fromthe initial point of interest to the parabolic minimum istaken as a feasible direction of extrapolation along which a“linear” search is made to locate the lowest position on theenergy landscape. Once this location is found, a newparaboloid is constructed tangential to this position and thewhole process is repeated until the true minimum islocated. Generally, four to five parabolic approximationssuffice to locate the true minimum. Once found, phase-stability checks either discredit the minimum by the addi-tion of more stable phases to the assemblage, or verify theminimum as global if no additional phases are found to bemore stable than the current assemblage. This procedure
can be programed for very rapid execution, particularly ifthe thermodynamic derivatives of all of the phases involvedin the calculation are coded analytically. As an example,execution time for a typical Gibbs free energy minimiza-tion in rhyolite-MELTS (Gualda et al., 2012) for a five-phase system with w25 optimal variables and 10 activeconstraints requires about 100 ms on a 3-GHz processor.
4. COMPUTATIONALTHERMODYNAMICS TOOLS AVAILABLETO THE VOLCANOLOGIST/IGNEOUSPETROLOGIST
We will end this brief chapter with a summary and notesregarding freely available tools for computational chemicalthermodynamics applications in volcanology and igneouspetrology. These applications fall into four general cate-gories: (1) geothermometers, geobarometers, and geo-hygrometers, (2) mineral and melt thermodynamic propertycalculators, (3) solubility calculators for volatiles inmagmatic systems, and (4) phase equilibrium calculators.Our summary is by no means exhaustive, and emphasis hasbeen placed on calculators that are web-based or run on a
Gib
bs fr
ee e
nerg
yQuadratic approximationto the Gibbs free energy
Quadratic search direction in the null space of bulk composition constraints
Minimum
Actual Gibbs free energy
Linear step alongquadratic searchdirection
Phase proportions, phase compositions
FIGURE 6.10 The minimum of a thermodynamic potential, like that of the system Gibbs free energy illustrated, is obtained by choosing an initial guessto the energy minimum, illustrated here as the left most filled green circle, and constructing at that point a parabolic approximation to the energy, whichhas the same first and second derivatives as the energy surface at the point of interest. In this figure that parabolic approximation is shown as a yellowcurve. The initial guess must be independently estimated, perhaps using some form of the saturation state algorithm illustrated in Figure 6.9; it consists ofapproximate phase proportions and compositions that might characterize a good guess of the equilibrium assemblage. A search direction is poised startingfrom the initial point and projecting through the minimum of the parabolic approximation. A “linear search” is extended along that direction (theillustrated green vector) until a lower point on the actual energy surface is reached; this procedure derives new and better values of phase compositions andproportions. This new “low point” becomes the next guess, and the procedure is repeated until the true minimum is reached. Typically this takes four orfive parabolic or “quadratic” iterations. The illustrated algorithm is given in detail in Ghiorso (1985). Mathematically, the method is a concrete example ofa projected second-order Newton method.
154 PART | I Origin and Transport of Magma
The Encyclopedia of Volcanoes, Second Edition, 2015, 143e161
Author's personal copy

variety of computer systems. Commercial software prod-ucts are not included.
4.1. Geothermometers, Geobarometers,and Geohygrometers for MagmaticSystems
Geothermometers are tools that utilize compositionalpartitioning of elements between coexisting phases to infersomething quantitative about the temperature under whichthe assemblage formed. Geobarometers do the same forpressure. Geohygrometers describe the effect of dissolvedwater in one phase (generally the liquid) on elementalpartitioning between the liquid and another coexistingsolid phase, allowing estimation of water content in theliquid in equilibrium with the solid. These tools arealways calibrated from underlying experimental data setsand generally their formulation is thermodynamically“inspired,” but incomplete; the formalism is based onthermodynamic theory but is generally not developed into acomplete internally consistent description of the Gibbs freeenergy of all phases that participate in the assemblage. Allgeothermometers, geobarometers, and geohygrometers relyon the establishment of exchange equilibrium that governspredictable partitioning of an element or elements ofinterest between the phases of interest. It is important tobear in mind that two phases can be in exchange equilib-rium and still constitute a metastable phase assemblage(e.g., exchange equilibrium could correspond to a localminimum or a saddle point, see Figure 6.8); as noted above,only at the global minimum of the energy landscape is thetrue equilibrium phase assemblage manifest.
An excellent summary of geothermometers and geo-barometers applicable to volcanic rocks is provided inPutirka (2008); see Table 6.2. Also in the table, we listadditional sources of information and direct links to othercommonly utilized formulations. Of particular note are theTi-in-quartz (Wark and Watson, 2006) and the Ti-in-zircon (Watson et al., 2006) geothermobarometers.These tools rely on knowing the partitioning behavior ofTi between melt and mineral phases and have wideapplication in the study of silicic rocks. Both requireestimation of the activity of TiO2 in the coexisting liquidphase; for this purpose see the method of Ghiorso andGualda (2012). A number of thermometric calculatorsderived from solidesolid elemental exchange are alsolisted in Table 6.2, most notably the elegant method ofAndersen et al. (1993; QUILF), which is an example of ageneralized geothermobarometric approach that examineselemental partitioning between multiple phases, therebygenerating a more reliable estimate of T and P thanmethods based on a single exchange. The widely utilizedFeeTi oxide geothermometer and oxygen barometer isalso listed. This method relies on the calibration of FeeTi
TABLE 6.2 Computational Thermodynamic Tools
Source Type Notes/URLs
Putirka (2008) Volcanic geothermometers andgeobarometersReview and summary. Links to Excelworkbook implementations:Clinopyroxene P-TFeldspar-liquid P-T-H2OMantle Potential TemperaturesOlivine and glass thermometersOpx thermobarometersSilica activity barometersTwo-feldspar thermometersTwo-pyroxene thermobarometers
Anderson et al. (2008) Plutonic geothermometers andgeobarometers
Wark and Watson(2006), Thomas et al.(2010), Huang andAudetat (2012)
Ti-in-quartz geothermometer andgeobarometerTitaniQ
Hayden et al. (2008) Sphene (titanite) geobarometer andgeothermometer
Watson et al. (2006),Ferry and Watson (2007)
Ti-in-zircon, Zr-in-rutilegeothermometer
Berman (2007) Thermobarometric calculationsusing an extended Berman (1988)databasehttp://serc.carleton.edu/research_education/equilibria/twq.html
Tim Holland Mineral activity models, geother-mometers, and geobarometershttps://www.esc.cam.ac.uk/research/research-groups/holland(AX: activity models, HBPL:hornblende-plagioclasegeothermometer)
Ghiorso and Evans(2008)
FeeTi oxide geothermometeroxygen barometerhttp://ctserver.ofm-research.org/OxideGeothrm/OxideGeothrm.php
Sack and Ghiorso (1991) Olivineespinel geothermometerhttp://ctserver.ofm-research.org/Olv_Spn_Opx/index.php
Lange et al. (2009) Plagioclaseeliquid hygrometer andthermometerhttp://www.lsa.umich.edu/earth/people/faculty/ci.langerebecca_ci.detail
Gualda and Ghiorso(2014)
Quartz + feldspar +melt barometry
Andersen et al. (1993) Multivariate equilibrium assessmentQUILF. Program may be down-loaded from the journal archives
(Continued)
155Chapter | 6 Chemical Thermodynamics and the Study of Magmas
The Encyclopedia of Volcanoes, Second Edition, 2015, 143e161
Author's personal copy

exchange between coexisting spinel and ilmenite. Itshould be noted that alternative calibrations of the FeeTioxide geothermometer oxygen barometer exist and can beaccessed via QUILF. Finally, the plagioclase hygrometer/thermometer of Lange et al. (2009) is an extraordinarilyuseful tool for understanding the mutual effect of tem-perature and melt water content on the stability relationsof plagioclase in intermediate to silicic magmas.
TABLE 6.2 Computational ThermodynamicToolsdcont’d
Source Type Notes/URLs
Berman (1988) Thermodynamic database: end-member properties, reactionproperties, univariant curveshttp://ctserver.ofm-research.org/ThermoDataSets/Berman.php
OFM Research Sack and Ghiorso mineral solutionmodelshttp://ctserver.ofm-research.org/phaseProp.htmlhttp://melts.ofm-research.org/CalcForms/index.html
Kress (1997, 2000,2007), Kress et al.(2008)
Solution models of sulfide liquidsThe system OeSeFeeNieCu
OFM Research Web services: RESTand SOAP basedhttp://ctserver.ofm-research.org/webservices.html
Newman andLowenstern (2002)
MelteH2OeCO2 fluid solubilitymodelhttp://volcanoes.usgs.gov/observatories/yvo/jlowenstern/other/software_jbl.html
Papale et al. (2006) MelteH2OeCO2 fluid solubilitymodelhttp://ctserver.ofm-research.org/Papale/Papale.php
Moore (2008) H2O, CO2, and mixed fluid volatilesolubility in magmasReview and critical summary; hisTable 3dGeneral models for mixedfluids
Wallace andCarmichael (1992),Moretti and Ottonello(2005), Moretti andBaker (2008)
Sulfur solubility and speciation inmagmas
Kress et al. (2004) CeOeHeSeCleF gas speciationExcel workbook available as journalsupplement
Connolly (2005) Phase equilibrium calculationsPerpleX: http://serc.carleton.edu/research_education/equilibria/perplex.html
Powell et al. (1998) Phase equilibrium calculationsTHERMOCALC: http://serc.carleton.edu/research_education/equilibria/thermocalc.html
de Capitani andPetrakakis (2010)
Phase equilibrium calculationsTheriak/Domino: http://serc.carleton.edu/research_education/equilibria/theriak-domino.html
TABLE 6.2 Computational ThermodynamicToolsdcont’d
Source Type Notes/URLs
Frank Spear Phase equilibrium calculationsProgram Gibbs: http://ees2.geo.rpi.edu/MetaPetaRen/Software/GibbsWeb/Gibbs.html
Ariskin (1999) Phase equilibria in basaltic magmasCOMAGMAT: http://geo.web.ru/wkbs/
Ghiorso and Sack(1995), Asimow andGhiorso (1998), Ghiorsoet al. (2002), Gualdaet al. (2012)
Magmatic phase equilibriaMELTSdlow pressure, broadcomposition range,pMELTSd1e3 GPa, mantle-likebulk compositions,rhyolite-MELTSdlike MELTS, withimproved modeling of silicic two-feldspar + quartz + fluid-saturatedsystemshttp://melts.ofm-research.org/
Asimow et al. (2004),Smith and Asimow(2005), Thompson et al.(2007), Antoshechkinaet al. (2010)
Mantle phase equilibriaalphaMELTSdpMELTS plus traceelements and water in nominallyanhydrous mantle minerals.Numerous option enhancements;batch processinghttp://magmasource.caltech.edu/alphamelts/
OFM Research PhasePlotGridded phase equilibriumcalculations for magmatic systems,utilizing the MELTS and pMELTSthermochemical data/modelcollectionshttp://phaseplot.org/Macintosh App Store
Bohrson and Spera(2001, 2003, 2007),Spera and Bohrson(2001, 2002, 2004),Bohrson et al. (in press)
Energy-constrained open-systemmagmatic processeshttp://magma.geol.ucsb.edu/papers/ECAFC.html
Kress and Ghiorso(2004)
Postentrapment crystallization ofmelt inclusionshttp://brimstone.ess.washington.edu/
156 PART | I Origin and Transport of Magma
The Encyclopedia of Volcanoes, Second Edition, 2015, 143e161
Author's personal copy

4.2. Mineral and Melt ThermodynamicProperty Calculators for Magmatic Phases
Table 6.2 lists several sources of information (all online) forthermodynamic property calculators (pure end-memberproperties and mixing properties, e.g., activities). Whenusing any of these tools it is very important to understandthat pure end-member properties and solution or mineralactivities are related through the definition of the chemicalpotential, as
mi ¼ m0i þ RT ln ai (6.4)
The only bit of reality in Eqn (6.4) is the end-memberchemical potential, mi. That quantity and its temperatureand pressure derivatives are calibrated against experimentalmeasurement. The chemical potential is partitioned byconvenience into a pure end-member contribution (m0i ) andan end-member activity (ai), and unless there is indepen-dent experimental evidence to fix one or the other, the twoare correlated quantities and the model that derives one ofthese quantities must be internally consistent with thecalibration of the other. So, the reader is advised to be verycareful in mixing and matching mineral/melt activities witharbitrary pure end-member properties. The two are notalways consistent unless care is taken to make them so.Failure to heed this warning can lead to incorrect estimatesof solution properties and perhaps erroneous predictionsof phase stability, elemental partition, temperature, orpressure.
4.3. Solubility Calculators for Volatilesin Magmatic Systems
There are a number of thermodynamically basedmethods for estimating volatile solubilities in magmaticsystems. The majority of work has focused on pure H2Oor pure CO2 fluids; Moore (2008) provides a compre-hensive review. For mixed-fluid (H2OeCO2) saturationapplications a number of compositionally restricted for-mulations exist (e.g., Iacono-Marziano et al., 2012), buttwo general methods are in common use and are listed inTable 6.2. The calibration of Papale et al. (2006) coversthe broadest compositional range, and is most generallyapplied to the interpretation of melt inclusions. Moore(2008) assesses the accuracy of this calibration againstexperimental measurements.
Almost all the models of H2O solubility in magmaticliquids make the assumption that the solubility of silicatematerial in the fluid phase is either negligible or has littleeffect on the chemical potential of H2O in the fluid. Thisassumption is thermodynamically inconsistent, but exper-imental data are limited to assess the consequences quan-titatively. The main exceptions are the SiO2eH2O and
NaAlSi3O8eH2O systems, for which experimental data areavailable to define the extent of solution on both sides of thebinary. Hunt and Manning (2012) have calibrated anelegant thermodynamic model for the SiO2eH2O binarythat accounts for the mutual solubility of end-members andthe closure of the miscibility gap to form a continuoussolution above the second critical endpoint of the system.As interest focuses on the nature of volatile saturation atmantle temperatures and pressures, it will become neces-sary to extend all of the meltevolatile thermodynamicsolubility treatments to incorporate the concept of mutualsolubility and complete solution. This is an exciting chal-lenge for the future.
Thermodynamic models describing the solubility ofreduced and oxidized sulfur gas species in silicate melts arealso listed in Table 6.2. These formulations have yet to beintegrated with ferriceferrous redox calibrations (Kressand Carmichael, 1991) for the melt phase. Coupling the twomodels and merging the sulfur saturation state models withthose for water and carbon dioxide remains another chal-lenge for future thermodynamic models of volatilesaturation.
We are not aware of any thermodynamic models ofvolatile saturation for other components such as Cl, F, or,for that matter, reduced carbon species. If the focus is onthe gas state, however, the 2004 model of Kress et al.(2004) may be utilized to estimate species abundances,activities, and fugacities in the system CeOeHeSeCleF,on the assumption of ideal mixing.
4.4. Computation of Phase Equilibria
We list at the bottom of Table 6.2, descriptions and links tosoftware that perform calculations of phase equilibria(generalized phase diagrams) for both subsolidus crustal-and mantle-like bulk compositions, and for magmatic sys-tems. The latter category includes COMAGMAT, which isoptimized for low-pressure, basaltic magmas; MELTS (andrhyolite-MELTS), which is applicable over a broadercompositional range, but still restricted to pressures belowabout 1 GPa; and pMELTS, which is a calibration opti-mized for mantle-like bulk compositions in the range1e3 GPa. MELTS and pMELTS consist of collections ofthermodynamic models for silicate liquid, mineral, andfluid phases, with the liquid-phase properties derived inpart from experimental liquidesolid phase equilibriumdata. These models suffer from the serious limitationsof incomplete data coverage, inconsistent data, and in-adequacies of the underlying thermodynamic solution the-ory. One particular hindrance is a lack of high-qualityexperimental data characterizing elemental partitioningbetween amphibole and liquid and between biotite andliquid. This data deficiency precludes the development ofappropriate solution models for these solid phases and
157Chapter | 6 Chemical Thermodynamics and the Study of Magmas
The Encyclopedia of Volcanoes, Second Edition, 2015, 143e161
Author's personal copy

prevents modeling magmatic evolution scenarios whereeither phase plays a dominant role. PhasePlot is an imple-mentation of the MELTS and pMELTS computationalinfrastructure with a user interface best suited for visuali-zation of phase relations on grids, and for the computationof phase diagrams.
A derivative of the pMELTS thermochemical data/model collection is alphaMELTS (previously phMELTSand Adiabat_1ph) with addition of trace element parti-tioning and H2O partitioning into nominally anhydrousphases. It is optimized for a number of computing plat-forms and can function without a graphical user interface. Itis the tool of choice for modeling melt production in themantle by fractional or batch melting along adiabatic ascentpaths.
While MELTS and pMELTS can be utilized to performmodeling in closed or open (to oxygen) systems in eitherequilibrium crystallization or fractionation modes, they canalso be used for isochoric (constant volume, Helmholtzfree energy minimization), isentropic (constant entropy,enthalpy minimization), and isenthalpic (constantenthalpy, entropy maximization) thermodynamic paths.The last is especially useful for exploring energy-constrained assimilation scenarios at constant pressure(Bowen, 1922; Ghiorso and Kelemen, 1987). The EC-AFCmodels of Bohrson and Spera (Table 6.2) explore thisconcept and develop a modeling infrastructure for trackingmajor- and trace-element evolution in a fractionatingmagma body subjected to energy-constrained assimilation,magma recharge, and periodic eruption. The latest incar-nation of this modeling software is termed the MagmaChamber Simulator (Bohrson et al., 2014) that utilizesrhyolite-MELTS as the computational phase equilibriumengine.
The final entry in Table 6.2 is a modeling packageaimed at simulating (and reverse calculating) the effectsof postentrapment crystallization within melt inclusionstrapped within host crystals. The scheme accounts forvolume change on crystallization and the constraintsimposed upon the inclusion by the thermal expansionand compressibility of the enclosing crystal. The phaseequilibrium engine utilized for these calculations isMELTS.
5. FUTURE DIRECTIONS OF CHEMICALTHERMODYNAMIC APPLICATIONS INMAGMATIC SYSTEMS
The application of chemical thermodynamics to the study ofmagmas has come a long way since the pioneering work ofVerhoogen (1949) and Carmichael et al. (1970). Theseprescient applications of chemical thermodynamics to the
study of the origin and evolution of magmas laid the foun-dation for all subsequent work. Although much has beenaccomplished over the last half century, much still needs tobe done. The future is bright for applications of chemicalthermodynamics to magmatic systems. One could say thatthe whole field is just beginning to mature to facilitate thecreation of a working infrastructure for general applications.
One of the main research objectives driving the field isthe integration of thermodynamics-based phase propertyengines into computational fluid dynamics (CFD) simu-lation of magma chamber processes and melt generation.Until very recently, the computer cycles required tocompute phase properties and proportions at each gridnode in a CFD computation rendered this level of inte-gration impractical. With the advent of cheap, cluster-based computing and the improvement in numericalalgorithms for nonlinear multidimensional optimization,this obstacle is rapidly disappearing. Couple this evolutionwith the realization that thermodynamic calculations areintrinsically local and can be largely decoupled fromneighboring computations in a spatial grid, and itbecomes clear that the rate-limiting step in CFD simula-tions is no longer the time consumed in evaluating theconstitutive relations. Casting the CFD simulation interms of a heat content field rather than a temperature field(e.g., Figure 6.5) serves to nearly eliminate Stefanboundary issues that would otherwise require high-densitygrid spacing around phase transformation fronts.
Refinement and broadening of chemical thermodynamicmodels for magmatic systems awaits acquisition of moreand better data on the physical properties of earth materialsas well as the chemical partitioning of elements betweenmagmatic phases. These data can be acquired by eitherphysical or computational experiment, the latter arisingfrom first-principles and molecular dynamics simulations.Increasingly, the accuracy of first-principles-potential andempirical-potential molecular dynamics simulations ofhigh-temperature silicate liquids and minerals has shownthat these tools are capable of generating fundamental datafor the purpose of calibration of thermodynamic models(Karki, 2010; Ghiorso and Spera, 2010; Stixrude andLithgow-Bertelloni, 2010), especially at elevated pressureswhere traditional physical experimentation is not yetachievable, too costly, or too difficult for routine systematicstudies. But, the emergence and success of theoreticalcomputation methods does not diminish the need for high-quality physical experiments. What is desperately neededin this regard are experimental studies aimed specifically atgenerating data for the calibration of thermodynamicmodels. This objective requires fully characterized samplesthrough careful chemical analysis and textural documenta-tion, and studies that focus on illuminating the relationsbetween the concentration of an element in a phase and its
158 PART | I Origin and Transport of Magma
The Encyclopedia of Volcanoes, Second Edition, 2015, 143e161
Author's personal copy

effective energetic concentration, that is, its activity. Thatperspective is seldom pursued in phase equilibrium exper-imentation, but when it is, the results can be spectacular andrewarding beyond the mere documentation of phaserelations. Additionally, experimental data that illuminate thefundamental properties (entropy, enthalpy of formation,heat of solution, heat capacity, and equation of state) are byno means complete for magmatic phases, even under crustalconditions. Many of the fundamental data that are used inmodels that calculate temperatures, pressures, volatile sol-ubilities, or phase relations in magmatic systems are based,in part, on assumed values of thermodynamic constants andinternally consistent interpolations or extrapolations ofprimary data. These models are only as good as their un-derlying data, and improvement in data quality is bothwelcome and necessary.
The objective of this chapter on application of chemicalthermodynamic to magmatic processes is to highlight therole chemical thermodynamics can play in the day-to-dayassessment of petrologic and volcanologic hypotheses.Thermodynamics is the platform upon which kinetic theoryis built. It is the framework for our understanding of thesystematics of phase equilibria, which provides us with ameans of understanding why minerals appear in rocks. It isthe underlying theory behind the validity of all geo-thermometers, geobarometers, and any methods used forthe estimation of other intensive variables in magmaticsystems. Chemical thermodynamics will continue to play avital role in making the connection between the chemistryof a magma and its energy, thereby permitting thedynamical evolution of magmatic systems to be coupleddirectly and quantitatively to the chemical signaturesobserved in the rock record.
ACKNOWLEDGMENTS
Material support from the National Science Foundation (EAR 11-19297 to Ghiorso; EAR 1151337 and EAR 0948528 to Gualda)is gratefully acknowledged. The first author is indebted to JeanVerhoogen, Hal Helgeson, and Ian Carmichael, whose astoundingcontributions to chemical thermodynamics of Earth materials continueto inspire.
FURTHER READING
Anderson, J.L., Barth, A.P., Wooden, J.L., Mazdab, F., 2008. Ther-
mometers and thermobarometers in granitic systems. In:
Putirka, K.D., Tepley III, F.J. (Eds.), Minerals, Inclusions and Vol-
canic Processes. Reviews in Mineralogy and Geochemistry, vol. 69,
pp. 121e142.
Andersen, D.J., Lindsley, D.H., Davidson, P.M., 1993. QUILF: a Pascal
program to acces equilibria among Fe-Mg-Ti oxides, pyroxenes,
olivine, and quartz. Computers in Geosciences 19, 1333e1350.
Antoshechkina, P.M., Asimow, P.D., Hauri, E.H., Luffi, P.I., 2010. Effect
of water on mantle melting and magma differentiation, as modeled
using Adiabat_1ph 3.0. In: American Geophysical Union, Fall
Meeting 2010 abstract #V53C-2264.
Ariskin, A.A., 1999. Phase equilibria modeling in igneous petrology: use
of COMAGMAT model for simulating fractionation of ferro-basaltic
magmas and the genesis of high-alumina basalt. Journal of Volca-
nology and Geothermal Research 90, 115e162.
Asimow, P.D., Dixon, J.E., Langmuir, C.H., 2004. A hydrous melting and
fractionation model for mid-ocean ridge basalts: application to the
Mid-Atlantic Ridge near the Azores. Geochemistry Geophysics
Geosystems 5. http://dx.doi.org/10.1029/2003GC000568.
Asimow, P.D., Ghiorso, M.S., 1998. Algorithmic modifications extending
MELTS to calculate subsolidus phase relations. American Mineral-
ogist 83, 1127e1132.
Berman, R.G., 1988. Internally-consistent thermodynamic data for min-
erals in the system Na2O-K2O-CaO-MgO-FeO-Fe2O3-Al2O3-SiO2-
TiO2-H2O-CO2. Journal of Petrology 29, 445e522.
Berman, R.G., 2007. winTWQ (version 2.3): a software package
for performing internally-consistent thermobarometric calcula-
tions. Geological Survey of Canada. Open File 5462, (ed. 2.32),
41 pp.
Bohrson, W.A., Spera, F.J., 2001. Energy-constrained open-system
magmatic processes. II: application of energy-constrained assimila-
tion-fractional crystallization (EC-AFC) model to magmatic systems.
Journal of Petrology 42, 1019e1041.
Bohrson, W.A., Spera, F.J., 2003. Energy-constrained open-system
magmatic processes. IV: geochemical, thermal and mass conse-
quences of energy-constrained recharge, assimilation and fractional
crystallization (EC-RAFC). Geochemistry, Geophysics, Geosystems 4.
http://dx.doi.org/10.1029/2002GC00316.
Bohrson, W.A., Spera, F.J., 2007. Energy-constrained recharge, assimi-
lation, and fractional crystallization (EC-RA/E’/FC): a Visual Basic
computer code for calculating trace element and isotope variations of
open-system magmatic systems. Geochemistry, Geophysics, Geo-
systems 8. http://dx.doi.org/10.1029/2007GC001781.
Bohrson, W.A., Spera, F.J., Ghiorso, M.S., Creamer, J. Thermodynamic
model for energy-constrained open system evolution of crustal magma
bodies undergoing simultaneous assimilation, recharge and crystalli-
zation: the magma chamber simulator. Journal of Petrology, in press.
Bowen, N.L., 1922. The behavior of inclusions in igneous magmas.
Journal of Geology 30, 513e570.
Bumstead, H.A., Van Name, R.G. (Eds.), 1906. The Scientific Papers of
J. Willard Gibbs. Thermodynamics, vol. 1. Longmans Green and Co.,
464 pp.
Callen, H.B., 1985. Thermodynamics and an Introduction to Thermo-
statics, second ed. John Wiley and Sons, New York. 493 pp.
Carmichael, I.S.E., Ghiorso, M.S., 1990. The effect of oxygen fugacity on
the redox state of natural liquids and their crystallizing phases. In:
Nicholls, J., Russell, J.K. (Eds.), Modern Methods of Igneous
Petrology: Understanding Magmatic Processes. Reviews in Miner-
alogy and Geochemistry, vol. 24, pp. 191e212.
Carmichael, I.S.E., Nicholls, J., Smith, A.L., 1970. Silica activity in
igneous rocks. American Mineralogist 55, 246e263.
Connolly, J.A.D., 2005. Computation of phase equilibria by linear pro-
gramming: a tool for geodynamic modeling and its application to
subduction zone decarbonation. Earth and Planetary Science Letters
236, 524e541.
159Chapter | 6 Chemical Thermodynamics and the Study of Magmas
The Encyclopedia of Volcanoes, Second Edition, 2015, 143e161
Author's personal copy

de Capitani, C., Petrakakis, K., 2010. The computation of equilibrium
assemblage diagrams with Theriak/Domino software. American
Mineralogist 95, 1006e1016.
Ferry, J.M., Watson, E.B., 2007. New thermodynamic models and revised
calibrations for the Ti-in-zircon and Zr-in-rutile thermometers.
Contributions to Mineralogy and Petrology 154, 429e437.
Fowler, S.J., Spera, F.J., Bohrson, W.A., Belkin, H.E., de Vivo, B., 2007.
Phase equilibria constraints on the chemical and physical evolution of
the Campanian Ignimbrite. Journal of Petrology 48, 459e493.
Ganguly, J., 2008. Thermodynamics in Earth and Planetary Sciences.
Springer-Verlag, Berlin, 501 pp.
Ghiorso, M.S., 1985. Chemical mass transfer in magmatic processes. I.
Thermodynamic relations and numerical algorithms. Contributions to
Mineralogy and Petrology 90, 107e120.
Ghiorso, M.S., 1997. Thermodynamic models of igneous processes.
Annual Reviews of Earth and Planetary Sciences 25, 221e241.
Ghiorso, M.S., 2013. A globally convergent saturation state algorithm
applicable to thermodynamic systems with a stable or metastable omni-
component phase. Geochimica et Cosmochimica Acta 103, 295e300.
Ghiorso, M.S., Carmichael, I.S.E., 1985. Chemical mass transfer in
magmatic processes. II. Applications in equilibrium crystallization,
fractionation and assimilation. Contributions to Mineralogy and
Petrology 90, 121e141.
Ghiorso, M.S., Evans, B.W.E., 2008. Thermodynamics of rhombohedral
oxide solid solutions and a revision of the Fe-Ti two-oxide geo-
thermometer and oxygen-barometer. American Journal of Science
308, 957e1039.
Ghiorso, M.S., Gualda, G.A.R., 2012. A method for estimating the ac-
tivity of titania in magmatic liquids from the compositions of coex-
isting rhombohedral and cubic ironetitanium oxides. Contributions
to Mineralogy and Petrology 165, 73e81.
Ghiorso, M.S., Hirschmann, M.M., Reiners, P.W., Kress III, V.C., 2002.
The pMELTS: A revision of MELTS for improved calculation of
phase relations and major element partitioning related to partial
melting of the mantle to 3 GPa. Geochemistry, Geophysics, Geo-
systems 3. http://dx.doi.org/10.1029/2001GC000217.
Ghiorso, M.S., Kelemen, P.B., 1987. Evaluating reaction stoichiometry
in magmatic systems evolving under generalized thermodynamic
constraints: examples comparing isothermal and isenthalpic
assimilation. In: Mysen, B. (Ed.), Magmatic Processes: Physi-
ochemical Principles, Geochemical Society Special Publication,
vol. 1, pp. 319e336.
Ghiorso, M.S., Kress, V.C., 2004. An equation of state for silicate melts.
II. Calibration of volumetric properties at 105 Pa. American Journal
of Science 204, 679e751.
Ghiorso, M.S., Sack, R.O., 1995. Chemical mass transfer in magmatic
processes. IV. A revised and internally consistent thermodynamic
model for the interpolation and extrapolation of solid-liquid equi-
libria in magmatic systems at elevated temperatures and pressures.
Contributions to Mineralogy and Petrology 119, 197e212.
Ghiorso, M.S., Spera, F.J., 2010. Large scale simulations. In:
Wentzcovitch, R., Stixrude, L. (Eds.), Theoretical and Computational
Methods in Mineral Physics. Reviews in Mineralogy and Geochem-
istry, vol. 71, pp. 437e462.
Gibbs, J.W., 1878. On the equilibrium of heterogeneous substances.
Transactions of the Connecticut Academy III, 108e248 and 343e524.
Gualda, G.A.R., Ghiorso, M.S., Lemons, R.V., Carley, T.L., 2012.
Rhyolite-MELTS: a modified calibration of MELTS optimized for
silica-rich, fluid-bearing magmatic systems. Journal of Petrology 53,
875e890.
Gualda, G.A.R., Ghiorso, M.S., 2014. Phase-equilibrium geobarometers
for silicic rocks based on rhyolite-MELTS. Contributions to Miner-
alogy and Petrology 168, 1033.
Hayden, L.A., Watson, E.B., Wark, D.A., 2008. A thermobarometer for
sphene (titanite). Contributions to Mineralogy and Petrology 155,
529e540.
Huang, R., Audetat, A., 2012. The titanium-in-quartz (TitaniQ) thermo-
barometer: a critical examination and re-calibration. Geochimica et
Cosmochimica Acta 84, 75e89.
Hunt, J.D., Manning, C.E., 2012. A thermodynamic model for the system
SiO2eH2O near the upper critical end point based on quartz solu-
bility experiments at 500e1100 &C and 5e20 kbar. Geochimica et
Copsmochimica Acta 86, 196e213.
Iacono-Marziano, G., Morizet, Y., le Trong, E., Gaillard, F., 2012. New
experimental data and semi-empirical parameterization of H2OeCO2
solubility in mafic melts. Geochimica et Cosmochimica Acta 97, 1e23.
Karki, B.B., 2010. First-principles molecular dynamics simulations of
silicate melts: structural and dynamical properties. In:
Wentzcovitch, R., Stixrude, L. (Eds.), Theoretical and Computational
Methods in Mineral Physics. Reviews in Mineralogy and Geochem-
istry, vol. 71, pp. 355e386.
Kress, V.C., 1997. Thermochemistry of sulfide liquids I. The system O-S-
Fe at 1 bar. Contributions to Mineralogy and Petrology 127,
176e186.
Kress, V.C., 2000. Thermochemistry of sulfide liquids II. Associated so-
lution model for sulfide liquids in the system O-S-Fe. Contributions
to Mineralogy and Petrology 139, 316e325.
Kress, V.C., 2007. Thermochemistry of sulfide liquids III. Ni-bearing
liquids at 1-bar. Contributions to Mineralogy and Petrology 154,
191e204.
Kress, V.C., Carmichael, I.S.E., 1991. The compressibility of silicate
liquids containing Fe2O3 and the effect of composition, temperature,
oxygen fugacity and pressure on their redox states. Contributions to
Mineralogy and Petrology 108, 82e92.
Kress, V.C., Ghiorso, M.S., 2004. Thermodynamic modeling of post-
entrapment crystallization in igneous phases. Journal of Volca-
nology and Geothermal Research 137, 247e260.
Kress, V.C., Ghiorso, M.S., Lastuka, C., 2004. Microsoft EXCEL
spreadsheet-based program for calculating equilibrium gas speciation
in the C-O-H-S-Cl-F system. Computers and Geosciences 30,
211e214.
Kress, V.C., Greene, L.E., Ortiz, M.D., Mioduszewski, L., 2008. Ther-
mochemistry of sulfide liquids IV: density measurements and the
thermodynamics of OeSeFeeNieCu liquids at low to moderate
pressures. Contributions to Mineralogy and Petrology 156,
785e797.
Lange, R.A., Carmichael, I.S.E., 1990. Thermodynamic properties of
silicate liquids with emphasis on density, thermal expansion and
compressibility. In: Nicholls, J., Russell, J.K. (Eds.), Modern
Methods of Igneous Petrology: Understanding Magmatic Processes.
Reviews in Mineralogy and Geochemistry, vol. 24, pp. 25e64.
Lange, R.A., Frey, H.M., Hector, J., 2009. A thermodynamic model for
the plagioclase-liquid hygrometer/thermometer. American Mineral-
ogist 94, 494e506.
Moore, G., 2008. Interpreting H2O and CO2 contents in melt inclusions:
constraints from solubility experiments and modeling. In:
160 PART | I Origin and Transport of Magma
The Encyclopedia of Volcanoes, Second Edition, 2015, 143e161
Author's personal copy

Putirka, K.D., Tepley III, F.J. (Eds.), Minerals, Inclusions and Vol-
canic Processes. Reviews in Mineralogy and Geochemistry, vol. 69,
pp. 333e361.
Moretti, R., Baker, D.R., 2008. Modeling the interplay of fO2 and fS2along the FeS-silicate melt equilibrium. Chemical Geology 256,
286e298.
Moretti, R., Ottonello, G., 2005. Solubility and speciation of sulfur in
silicate melts, the Conjugated ToopeSamiseFloodeGrjotheim
(CTSFG) model. Geochimica Cosmochimica Acta 69, 801e823.
Newman, S., Lowenstern, J.B., 2002. VolatileCalc: a silicate
melteH2OeCO2 solution model written in Visual Basic for excel.
Computers and Geosciences 28, 597e604.
Osborn, E.F., 1959. Role of oxygen pressure in the crystallization and
differentiation of basaltic magma. American Journal of Science 257,
609e647.
Osborn, E.F., 1962. Reaction series for sub-alkaline igneous rocks based
on different oxygen pressure conditions. American Mineralogist 47,
211e226.
Papale, P., Moretti, R., Barbato, D., 2006. The compositional dependence
of the saturation surface of H2O þ CO2 fluids in silicate melts.
Chemical Geology 229, 78e95.
Pitzer, K.S., Brewer, L., 1961. Thermodynamics. McGraw-Hill, New
York, 723 pp.
Powell, R., Holland, T.J.B., Worley, B., 1998. Calculating phase diagrams
involving solid solutions via non-linear equations, with examples
using THERMOCALC. Journal of Metamorphic Geology 16,
577e588.
Prigogine, I., Defay, R., 1954. Chemical Thermodynamics. Longmans
Green and Co., London, 543 pp.
Putirka, K.D., 2008. Thermometers and barometers for volcanic systems.
In: Putirka, K.D., Tepley III, F.J. (Eds.), Minerals, Inclusions and
Volcanic Processes. Reviews in Mineralogy and Geochemistry, vol.
69, pp. 61e120.
Sack, R.O., Ghiorso, M.S., 1991. Chromium spinels as petrogenetic in-
dicators: thermodynamics and petrological applications. American
Mineralogist 87, 79e98.
Smith, P.M., Asimow, P.D., 2005. Adiabat_1ph: a new public front-end to
the MELTS, pMELTS, and pHMELTS models. Geochemistry,
Geophysics, Geosystems 6. http://dx.doi.org/10.1029/2004GC000816.
Spear, F.S., 1993. Metamorphic Phase Equilibria and Pressure-
Temperature-Time Paths. Mineralogical Society of America Mono-
graph, 799 pp.
Spera, F.J., Bohrson, W.A., 2001. Energy-constrained open-system
magmatic processes. I: general model and energy-constrained
assimilation and fractional crystallization (EC-AFC) formulation.
Journal of Petrology 42, 999e1018.
Spera, F.J., Bohrson, W.A., 2002. Energy-constrained open-system
magmatic processes. III: energy-constrained recharge, assimilation
and fractional crystallization (EC-RAFC). Geochemistry, Geophysics,
Geosystems 3. http://dx.doi.org/10.1029/2002GC00315.
Spera, F.J., Bohrson, W.A., 2004. Open-system magma chamber evolu-
tion: an energy-constrained geochemical model incorporating the
effects of concurrent eruption, recharge, variable assimilation and
fractional crystallization (EC-E’RAFC). Journal of Petrology 45,
2459e2480.
Stixrude, L., Lithgow-Bertelloni, C., 2010. Thermodynamics of the
Earth’s mantle. In: Wentzcovitch, R., Stixrude, L. (Eds.), Theoretical
and Computational Methods in Mineral Physics. Reviews in Miner-
alogy and Geochemistry, vol. 71, pp. 465e484.
Thomas, J.B., Watson, E.B., Spear, F.S., 2010. TitaniQ under pressure: the
effect of pressure and temperature on the solubility of Ti in quartz.
Contributions to Mineralogy and Petrology 160, 743e759.
Thompson, R.N., Riches, A.J.V., Antoshechkina, P.M., Pearson, D.G.,
Nowell, G.M., Ottley, C.J., Dickin, A.P., Hards, V.L., Nguno, A.-K.,
Niku-Paavola, V., 2007. Origin of CFB magmatism: multi-tiered
intracrustal picriteerhyolite magmatic plumbing at Spitzkoppe,
Western Namibia, during Early Cretaceous Etendeka magmatism.
Journal of Petrology 48, 1119e1154.
Verhoogen, J., 1949. Thermodynamics of a magmatic gas phase, vol. 28.
University of California Publications. Bulletin of the Department of
Geological Sciences, 91e135.
Wallace, P., Carmichael, I.S.E., 1992. Sulfur in basaltic magma. Geo-
chimica et Cosmochimica Acta 56, 1863e1874.
Wark, D.A., Watson, E.B., 2006. TitaniQ: a titanium-in-quartz geo-
thermometer. Contributions toMineralogyandPetrology 152, 743e754.
Watson, E.B., Wark, D.A., Thomas, J.B., 2006. Crystallization ther-
mometers for zircon and rutile. Contributions to Mineralogy and
Petrology 151, 413e433.
161Chapter | 6 Chemical Thermodynamics and the Study of Magmas
The Encyclopedia of Volcanoes, Second Edition, 2015, 143e161
Author's personal copy