Embed Size (px)
Citation preview
The University of Southern Mississippi The University of Southern Mississippi
The Aquila Digital Community The Aquila Digital Community
Dissertations
Spring 5-2008
Use of Monoclonal ∆-9-Tetrahydrocannabinol Antibodies Use of Monoclonal -9-Tetrahydrocannabinol Antibodies
Chemically Bound to a Polystyrene Surface Using Glutaraldehyde Chemically Bound to a Polystyrene Surface Using Glutaraldehyde
for the Purpose of Extracting ∆-9-Tetrahydrocannabinol and for the Purpose of Extracting -9-Tetrahydrocannabinol and
∆-9-Tetrahydrocannabinol Carboxylic Acid from Postmortem -9-Tetrahydrocannabinol Carboxylic Acid from Postmortem
Whole Blood Samples for Analysis by Gas Chromatography Mass Whole Blood Samples for Analysis by Gas Chromatography Mass
Spectrometry Spectrometry
Thomas Sidney Pittman University of Southern Mississippi
Follow this and additional works at: https://aquila.usm.edu/dissertations
Part of the Analytical, Diagnostic and Therapeutic Techniques and Equipment Commons, Biology
Commons, and the Pharmacology, Toxicology and Environmental Health Commons
Recommended Citation Recommended Citation Pittman, Thomas Sidney, "Use of Monoclonal ∆-9-Tetrahydrocannabinol Antibodies Chemically Bound to a Polystyrene Surface Using Glutaraldehyde for the Purpose of Extracting ∆-9-Tetrahydrocannabinol and ∆-9-Tetrahydrocannabinol Carboxylic Acid from Postmortem Whole Blood Samples for Analysis by Gas Chromatography Mass Spectrometry" (2008). Dissertations. 1189. https://aquila.usm.edu/dissertations/1189
This Dissertation is brought to you for free and open access by The Aquila Digital Community. It has been accepted for inclusion in Dissertations by an authorized administrator of The Aquila Digital Community. For more information, please contact [email protected].

The University of Southern Mississippi
USE OF MONOCLONAL A-9-TETRAHYDROCANNABINOL ANTIBODIES
CHEMICALLY BOUND TO A POLYSTYRENE SURFACE USING
GLUTARALDEHYDE FOR THE PURPOSE OF EXTRACTING
A-9-TETRAHYDROCANNABINOL AND A-9-TETRAHYDROCANNABINOL
CARBOXYLIC ACID FROM POSTMORTEM WHOLE BLOOD SAMPLES FOR
ANALYSIS BY GAS CHROMATOGRAPHY MASS SPECTROMETRY
by
Thomas Sidney Pittman
A Dissertation Submitted to the Graduate Studies Office of The University of Southern Mississippi in Partial Fulfillment of the Requirements
for the Degree of Doctor of Philosophy
Approved:
May 2008

COPYRIGHT BY
THOMAS SIDNEY PITTMAN
2008

The University of Southern Mississippi
USE OF MONOCLONAL A-9-TETRAHYDROCANNABINOL ANTIBODIES
CHEMICALLY BOUND TO A POLYSTYRENE SURFACE USING
GLUTARALDEHYDE FOR THE PURPOSE OF EXTRACTING
A-9-TETRAHYDROCANNABINOL AND A-9-TETRAHYDROCANNABINOL
CARBOXYLIC ACID FROM POSTMORTEM WHOLE BLOOD SAMPLES FOR
ANALYSIS BY GAS CHROMATOGRAPHY MASS SPECTROMETRY
by
Thomas Sidney Pittman
Abstract of a Dissertation Submitted to the Graduate Studies Office of The University of Southern Mississippi in Partial Fulfillment of the Requirements
for the Degree of Doctor of Philosophy
May 2008
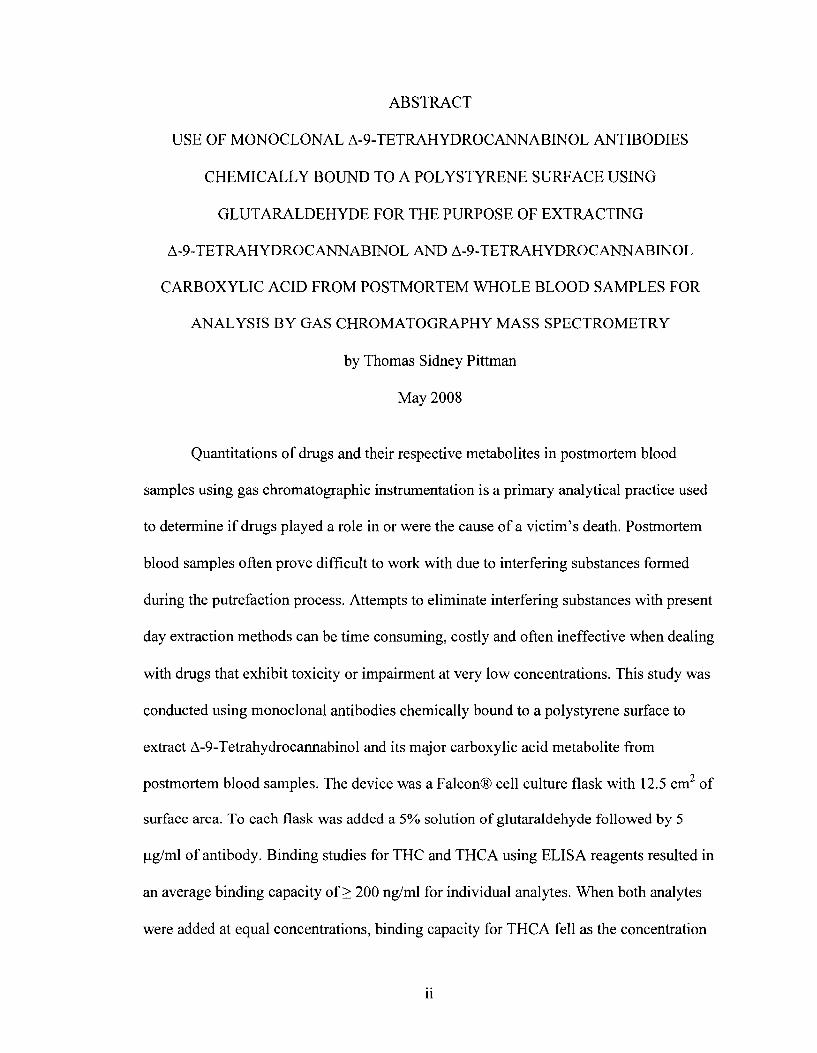
ABSTRACT
USE OF MONOCLONAL A-9-TETRAHYDROCANNABINOL ANTIBODIES
CHEMICALLY BOUND TO A POLYSTYRENE SURFACE USING
GLUTARALDEHYDE FOR THE PURPOSE OF EXTRACTING
A-9-TETRAHYDROCANNABINOL AND A-9-TETRAHYDROCANNABINOL
CARBOXYLIC ACID FROM POSTMORTEM WHOLE BLOOD SAMPLES FOR
ANALYSIS BY GAS CHROMATOGRAPHY MASS SPECTROMETRY
by Thomas Sidney Pittman
May 2008
Quantitations of drugs and their respective metabolites in postmortem blood
samples using gas chromatographic instrumentation is a primary analytical practice used
to determine if drugs played a role in or were the cause of a victim's death. Postmortem
blood samples often prove difficult to work with due to interfering substances formed
during the putrefaction process. Attempts to eliminate interfering substances with present
day extraction methods can be time consuming, costly and often ineffective when dealing
with drugs that exhibit toxicity or impairment at very low concentrations. This study was
conducted using monoclonal antibodies chemically bound to a polystyrene surface to
extract A-9-Tetrahydrocannabinol and its major carboxylic acid metabolite from
postmortem blood samples. The device was a Falcon® cell culture flask with 12.5 cm2 of
surface area. To each flask was added a 5% solution of glutaraldehyde followed by 5
ug/ml of antibody. Binding studies for THC and THCA using ELISA reagents resulted in
an average binding capacity of > 200 ng/ml for individual analytes. When both analytes
were added at equal concentrations, binding capacity for THCA fell as the concentration
n

for THC was increased. Percent yield studies demonstrated an average 54% yield for
THC and an average of 49% yield for THCA. Paired t test for THC demonstrated a
significant difference in two runs where t o.i(8) = 3.355 and paired t values were 4.384 and
6.034. Two runs for THCA were t .01(27) = 2.771 had paired t values of 9.596 and 8.827
which also demonstrate a significant difference. All samples reported as "None Detected"
for THC or THCA by MCL were found to contain no THC or THCA by this extraction
method. Ten samples reported by MCL as "unable to report due to interfering
substances" for THC were run twice with two samples showing no THC detected and
eight of the samples showed no interferences present when using this extraction device.
111

ACKNOWLEDGEMENTS
There are no words that express my gratitude for the gentlemen that served as my
committee members. They all readily volunteered without hesitation and allowed this
project to come to fruition. Each in their own way has played a role in my being a better
scientist and laboratorian even though they may not realize this fact.
Dr. Bobby Middlebrooks gave me the understanding of the difference between
basic research and simple method development. Dr. Gordon Cannon over the years has
always encouraged the completion of this degree and its importance. Dr. R.D. Ellender
with both his insight and humor allowed me to see both the diligence and fun in science.
Dr. Raymond Scheetz has been a mentor and friend for many years with words of
encouragement, wisdom and tough questions that made me use my meager talents to their
fullest.
To my children, Matthew and Nancy Jane, for their love and knowledge that I had
what it took to succeed as a scientist and father.
Finally to my wife Kim, who has endured through all for the past 31 years. Her
gentle yet persistent pushing is the real reason for this achievement. Without her love
and devotion, I would have quit several years ago and given up the desire and dream to
complete my education. So for all practical intents and purposes, this is really for her.
IV

TABLE OF CONTENTS
ABSTRACT ii
ACKNOWLEDGMENTS iv
LIST OF ILLUSTRATIONS vi
LIST OF TABLES viii
CHAPTER
I. INTRODUCTION 1
Statement of Problem Significance of the Study
II. REVIEW OF LITERATURE 5
III. METHODS AND MATERIALS 16
Phase I Phase II
IV. EXPERIMENTAL RESULTS 30
V. DISCUSSION 103
APPENDIX 131
BIBLIOGRAPHY 140
CURRICULUM VITAE' 149
v
LIST OF ILLUSTRATIONS
Results from Initial ELISA Test 33
ELISA Results with All Four Analytes 34
Negative Sample from ELISA Wells 38
Positive Sample from ELISA Wells 39
Photograph of Falcon® Cell Culture Flask 41
Photograph of Treated Postmortem Sample 42
Photograph of Flasks with ELISA Reagents 45
Binding Capacity: Experiment 1 46
Binding Capacity: Experiment 2 47
Binding Capacity: Experiment 3 48
Binding Capacity: Experiment 4 49
Binding Capacity: Experiment 5 50
Error Bar Graph Showing Averages of Binding Experiments 52
Graph Showing Effect of Increasing Concentrations of THC on
the Binding Capacity of THCA 64
THC Single Analyte Curve 66
THCA Single Analyte Curve 67
THC Linear Curve with Internal Standard 68 Bar Graph Showing Comparisons of Mississippi Crime Laboratory THC Values and Values Found Using New Device 80
Bar Graph Showing Comparisons of Mississippi Crime Laboratory THCA Values and Values Found using New Device 95
vi

20. Bar Graph Showing Comparisons of Values Found from Samples
with Interfering Substances Using the New Device 101
21. Chromatogram Showing Possible Interfering Peaks 102
22. Negative THC Sample from Mississippi Crime Laboratory 119
23. Negative THCA Sample from Mississippi Crime Laboratory 120
24. Internal Standard Ions from Sample in Figure 12 121
25. Internal Standard Ions from Sample in Figure 13 122
26. Positive THC Sample from Mississippi Crime Laboratory 124
27. Internal Standard Ions from Figure 16 Sample 125
28. Positive THCA Sample from Mississippi Crime Laboratory 126
29. Internal Standard Ions from Figure 17 Sample 127
30. THC Calibration Curve from Run 083007A 131
31. THCA Calibration Curve from Run 082707A 132
32. Chromatogram and Corresponding Ions from Sample Reported with Interfering Substances 140
33. Chromatogram and Corresponding Ions from Negative Sample Reported with Interfering Substances 141
34. Chromatogram and Corresponding Ions of THCA Sample 142
vn

LIST OF TABLES
Table
1. Drug Standard Dilution Protocol 31
2. Internal Standard Dilution Protocol 32
3. ELISA Absorbance Readings: All Four Analytes 36
4. Absorbance Readings from Flask Binding Experiments 51
5. Percent Yield Results: A-9-THC and A-9-THCA 52
6. Quantify Summary Report: Percent Yield THC Experiment 1 54
7. Quantify Summary Report: Percent Yield THC Experiment 2 55
8. Quantify Summary Report: Percent Yield THC Experiment 3 56
9. Quantify Summary Report: Percent Yield THC Experiment 4 57
10. Quantify Summary Report: Percent Yield THC Experiment 5 58
11. Quantify Summary Report: Percent Yield THCA Experiment 1 59
12. Quantify Summary Report: Percent Yield THCA Experiment 2 60
13. Quantify Summary Report: Percent Yield THCA Experiment 3 61
14. Quantify Summary Report: Percent Yield THCA Experiment 4 62
15. Quantify Summary Report: Percent Yield THCA Experiment 5 63
16. Quantify Summary Report: Negative THC Samples 69
16. continued 70
17. Quantify Summary Report: Negative THC Samples 71
17. continued 72
18. Quantify Summary Report: Quantitated THC Samples 74
18. continued 75
viii

19. Quantify Summary Report: Quantitated THC Samples 76
19. continued 77
20. Paired t Test: THC Samples Run A 78
21. Paired t Test: THC Samples Run B 79
22. Quantify Summary Report: Quantitated THCA Samples 81
22. continued 82
23. Quantify Summary Report: Quantitated THCA Samples 83
23. continued 84
24. Quantify Summary Report: Quantitated THCA Samples 85
24. continued 86
25. Quantify Summary Report: Quantitated THCA Samples 87
25. continued 88
26. Quantify Summary Report: Quantitated THCA Samples 89
26. continued 90
27. Quantify Summary Report: Quantitated THCA Samples 91
27. continued 92
28. Paired t Test: THCA Samples Run A 93
29 Paired / Test: THCA Samples Run B 94
30. Quantify Summary Report: THC Interfering Substance Samples 97
30. continued 98
31. Quantify Summary Report: THC Interfering Substance Samples 99
31. continued 100
32. Quantify Summary Report: THC LOD Samples 133
ix

33. Quantify Summary Report: THC LOQ Samples 134
34. Quantify Summary Report: THCA LOD Samples 135
35. Quantify Summary Report: THCA LOQ Samples 136
x

1
CHAPTER I
INTRODUCTION
Chromatographic analysis for and quantitations of drugs along with their
respective metabolites in postmortem blood samples is a primary analytical practice used
in forensic toxicology to determine whether drugs played a role in or were the cause of a
victim's death because drug testing is the only objective means to determine use
(Niedbala et al., 2001). Postmortem blood samples often prove a difficult matrix to
analyze due to interfering substances produced during the natural putrefaction process
that begins shortly after death. Other natural constituents of whole blood or other drugs
can also cause problems when working with postmortem blood samples.
Liquid/liquid extraction schemes of drugs from biological matrices where first devised in
the 1850s (Levine, 2003) and the process and chemistry of such extractions of drugs from
postmortem biological samples remain basically the same today. Procedures with added
steps can be used in efforts to remove interfering substances such as back extractions of
samples into acids or alkaline buffers and then a second extraction at an acid or alkaline
pH, but these steps add time and cost to the process. The following is an example of
how a back extraction would proceed. To a 16x125 screw cap glass tube, 1-2 ml of
sample would be buffered to pH 4.5 with 1-2 ml of an acetate buffer, vortexed and then
8-10 ml of an appropriate organic solvent added. The sample would then be shaken or
rotated from 15 to 30 min followed by centrifugation for 20 min. The organic phase
would be transferred to a clean tube and 1-2 ml of an alkaline buffer added to the organic
solvent. The solvent would again be shaken or rotated and centrifuged. The organic
phase this time would be discarded and an acidic buffer added to the aqueous phase. An

2
appropriate organic solvent would be added, 8-10 ml, and the sample shaken or rotated
for a third time followed by centrifugation. The organic layer would be transferred to a
new tube and evaporated to dryness. The extract would be dissolved in a desired
injection solvent for analysis. There have now been three extraction steps, several
milliliters of buffer and up to 20 ml of an organic solvent used in this procedure.
Depending on the number of calibrators, controls and samples, a back extraction
procedure may take 4-6 hours to complete.
Percent recovery of drugs becomes an issue with the use of multiple extraction
steps. Many drugs encountered today result in impairment or toxicity with
concentrations in the ng/ml range and few extraction procedures achieve 100% recovery.
With each extraction step, a portion of the drug is lost which may result in not being able
to detect, confirm or quantitate a drug during analysis.
Solid phase extraction techniques (SPE) provide an alternative to liquid/liquid
extractions for drugs in biological matrices. Forensic SPE procedures were initially
designed for extraction of illicit drugs from urine samples for confirmation testing
required by employee drug testing programs. The use of SPE columns is also used to
extract drugs from serum or plasma, but these two matrices do not present the same type
problems found with postmortem whole blood samples.
SPE is done by either negative or positive pressure devices. Negative pressure
systems have a vacuum chamber that pulls the sample through the columns. A positive
pressure system simply pushes the sample through the columns. Both type SPE systems
possess inherent problems of clogging when postmortem whole blood is the sample
being extracted. Degradation products in whole blood often cannot be centrifuged into a
pellet or filtered out of the sample and it is these components that clog SPE columns.

3
Once a column is clogged, it can no longer be used and the sample is lost.
There are critical steps in SPE that makes the procedure work most efficiently.
One is the wetting of the columns with water and an alcohol prior to adding the sample.
Next is the controlling of how fast the sample flows through the column to ensure the
analyte of interest is retained. The third step is the drying of the column prior to elution.
If any of the steps is not strictly controlled, the extraction procedure will fail.
Time consuming steps such as the need to make fresh reagents for daily use and
maintenance of equipment add cost to SPE methods, and elution of interfering substances
remain problematic as in liquid/liquid extractions.
Another issue that arises from present extraction procedures is maintenance of
chromatographic instrumentation. The principle behind gas chromatography is to
volatilize an injected sample and use a gas to move the constituents through the column
achieving separation. Heated injection liners of gas chromatographs and
chromatographic columns are subject to contamination from various breakdown products
of blood and other type biological samples that do not volatilize and adhere to the
injection liner and the front several inches of the column. Analytes of interest that adhere
to the these contaminants often fail to elute, show a reduction in concentration or poor
peak shape making quantitations difficult at best. The glass liners often have to be
discarded and the at least 18 inches from the front of the column cut to restore quality
chromatography. Once a column has been cut, retention times of all analytes will change
requiring altering SIM windows or gas chromatographic settings changed to maintain
established retention times.
Degradation products that do flow through the column will eventually result in a
loss of mass spectral sensitivity. Compounds are deposited on the metal lenses of the

4
mass spectral source causing a film to develop that interferes with the electronic tuning of
the mass spectrometer. Once the internal stainless steel lenses have become sufficiently
dirty and the instrument cannot be Autotuned to specifications, a cleaning of the lenses is
necessary. Cleaning requires shutting down the instrument for at least one day to
accomplish. After cleaning, the instrument must be recalibrated to ensure the cleaning
was successful. If not, the cleaning must be repeated. When many whole blood samples
are routinely analyzed, cleaning becomes a common routine that requires an inventory of
expensive replacement parts that are of one time use or are not amenable to cleaning.
Loss of sensitivity due to dirty extractions is a major concern when analyzing drugs such
as marijuana that play a role in accidental deaths due to impairment of an individual's
central nervous system.
Therefore, there is a need for a simple, inexpensive and robust device for
extraction of drugs from postmortem blood samples that does not suffer from or that will
significantly reduce problems with interfering substances. The chemical binding of
antibodies to a polystyrene surface for the purpose of extracting a drug from postmortem
blood samples is a feasible theory to the approach, possibly reducing many if not all the
problems discussed above.

5
CHAPTER II
REVIEW OF LITERATURE
Marijuana
Marijuana is the common name given to the plant Cannabis sativa. There are
reportedly some 400 chemicals in marijuana with approximately 61 being classified as
cannabinoids (Marnell, 2006). Historically marijuana has been used by man for
thousands of years. The plant has provided fibers from the branches and stems for ropes,
clothing, and sails for ships as well as food from seeds and oils found in the flowering
parts of the plant. Marijuana was used as medicine in China and India as early as 3000
B.C.
Marijuana is not a native plant to North America (Marnell, 2006). The plant was
introduced by Europeans colonizing North America and grown as a cash crop. The plant
grew well in most all areas of North America and thus successfully spread across what is
today the United States. Marijuana continued to be grown as a cash crop in the United
States until the around 1937 when the Federal government became concerned about its
abuse as a drug and passed the Marijuana Tax Act in an attempt to stop the growing and
The psychoactive constituent in marijuana is A-9-tetrahydrocannabinol (A-9-THC) and is
classified mainly as a central nervous system hallucinogenic although the psychological
effect of the drug varies from person to person and by dosage (Huestis, 2003). The
concentration of A-9-THC considered to cause central nervous system impairment
resulting in an individual's inability to safely operate a motor vehicle is considered 2
ng/ml and above in the United States and other countries (Garriott et al., 1986; McBay,
1988; Samyn et al., 2002; Lin & Lin, 2005). This means on any given analysis of
marijuana for purposes of determination of impairment of an individual a GC/MS with

6
ectron impact (EI) mass spectral instrument the limit of detection (LOD) and limit of
quantitation (LOQ) must be less than 2 ng/ml to ensure that a quantitative result of 2
ng/ml is accurate since marijuana is the most abused illegal drug in the majority of
countries including the United States (Mason & McBay, 1984; Crouch et al., 1993;
Niedbalaetal.,2001).
The pharmacodynamics of marijuana show several modes of action (Hollister,
1992). The human brain demonstrates high stereospecific receptors for the levo (-)
isomer of A-9-THC with some five times the potential effect on the user when compared
to the dextro (+) isomer. Five distinct areas of the brain have been identified with the
levo specific receptors.
A-9-THC is highly lipophilic and produces effects on cell membranes similar to
several other drugs of different classifications such as ethanol, LSD, amphetamines and
morphine. These differing actions make it difficult to classify marijuana within a drug
group.
Smoking is the most common means of introducing A-9-THC into the central
nervous system. Peak concentrations of 19-26 ng/ml were reached within 10 min of
smoking a cigarette containing 10 mg of A-9-THC (Agurell et al., 1973). These levels
decreased to less than 5 ng/ml within 2 hours. Other studies have shown peak
concentrations of A-9-THC ranging from 46-188 ng/ml following smoking of a single
marijuana cigarette (Rosenfeld, Bowins, Roberts, Perkins & MacPherson, 1974; Mason,
A.P., Perez-Reyes, M., McBay, A.J. & Foltz, R.L., 1983 & Kelly et al., 1993). In these
studies, the concentration levels of A-9-THC fell to or below 5 ng/ml within a two hour
period.
Oral ingestion of marijuana after being cooked shows much slower absorption

7
rates via the gastrointestinal tract with peak blood concentrations being reached in 1-3
hours. The peak concentrations are lower than levels seen in smoking only averaging 6
ng/ml when 20 mg of A-9-THC was ingested (Baselt, 1982).
A major problem that exists in the extraction of marijuana for analysis at these
levels is the inability to eliminate interfering substances during the extraction process in
many samples. A-9-THC is extracted most efficiently in a liquid/liquid extraction at an
acid pH of 4.5 (Chu & Drummer, 2002). Acidic extracts tend to produce "dirty" extracts
due to interaction with and denaturing of proteins. Neutral compounds and lipids are also
extracted more efficiently into organic solvents at an acid pH adding to the possible range
of interfering substances in the final extract. This is the rational behind using a back
extraction to reduce unwanted compounds when performing an extraction for acidic
drugs. Back extractions will improve the chromatography by eliminating some
contaminants, but the problem arises whenever extraction efficiency of a drug is poor and
the expected concentration is in the ng/ml range.
SPE extractions where both A-9-THC and A-9-THCA are extracted using the
same column also use an acidic elution solvent for the A-9-THCA resulting in the same
problems. Some SPE procedures have proven successful for extracting both analytes
from the same column (Moeller, M.R., Doerr, G. & Warth, S., 1992; D'Asaro, 2000;
Gustafson, R.A., Moolchan, E.T., Barnes, A., Levine B., & Heutis, M.A., 2003) but with
plasma samples and not whole blood samples. Compounds that remain on the column
following initial washing steps at a neutral pH for A-9-THC are eluted by the acidic
solvent into the final extract of A-9-THCA. These interfering substances are often
responsible for failed analyses in samples containing low concentrations of A-9-THC.
A key requirement of confirmations is ion ratios that must fall within a specified

8
range to be considered acceptable and the drug confirmed present. Interfering substances
are the reason most analyses fail in not meeting the ion ratio criteria. Methods for whole
blood extractions that have proven reliant for confirmation and meeting ion ratio criteria
often combine extraction protocols of liquid/liquid and SPE with GC/MS analysis
(Thompson & Cone, 1987; Felgate & Dinan, 2000). The need to use to separate methods
is time consuming and expensive.
Antibodies
Antibodies are "Y" shaped glycoproteins made up of two heavy chains and two
light chains bound together by disulfide bonds (Kindt, Goldsby & Osborne, 2007). The
light chains and heavy chains form two binding regions located at their two amino
terminal ends that are highly variable in their amino acid sequence. These highly
variable regions provide specificity for binding to most any molecule, including metals
(Wylie et al., 1992; Love et al., 1993).
Antibodies treated with either the enzymes pepsin or papain result in particular
fragments. Antibody treated with pepsin result in fragments called "Fab" and "Fc". The
Fab fragments consist of the light and heavy chains that form the upper area containing
the two binding sites as individual pieces. The Fc fragment is the lower portion or tail of
the antibody consisting of two heavy chains. When treated with papain, the only
fragment recovered is the "F(ab')r which is the two amino terminal ends still attached by
disulfide bonds. The biological role served by antibodies is to bind a specific area or
epitope located on an antigen and aid in its' destruction or removal from the body.
B cells are formed within and released from bone marrow with each B cell
carrying antibodies bound to their cell membranes. The B cells are referred to naive since
they have yet to encounter antigen that has an epitope that will bind their specific

9
antibody. When these B cells come into contact with an antigen possessing an epitope
that matches the binding area of the antibody, the B cells are up regulated and begin to
divide. The new cells produced become either memory B cells or plasma cells.
Plasma cells secrete antibodies identical to the ones found on the original B cell.
These cells can be isolated and used for the purpose of producing antibodies against
specific analytes of interest such as drugs or classes of drugs.
For a substance to be immunogenic it must have a molecular weight around 2000
daltons or larger. Smaller molecules will not evoke an immune response that will result
in the production of antibodies. Most drugs do not have molecular weights in that range
and must be bound to a larger protein structure (Smith, 1999). Bovine serum albumin
(BSA) and bovine thyroid globulin (BTG) are two proteins used for attachment of drugs
through linking molecules used to produce an immune response adequate for the
production of antibodies.
To facilitate the drug to act as the epitope, spacer molecules are placed between
the drug and protein so the drug is not located directly on the protein thereby increasing
the chances of the drug itself binding antibodies on B cells. The protein-drug complex is
injected into a suitable host such as a goat or rabbit and the immune response of the host
animal is allowed to proceed. Some portion of the drug or the entire drug molecule may
act as an epitope that binds an antibody with sufficient affinity resulting in cellular
division of plasma cells that will produce antibodies specific for that drug structure.
Plasma cells that produce the most specific antibodies are isolated from the host
animal and mixed with mouse tumor cells to form hybridomas. These hybridoma cells
are cultivated and continue the production of antibodies. Next the hybridoma cells are
separated and screened to determine which cell line is producing the most specific
10
antibody. This specific cell line is isolated for culturing and further purification of its
antibodies. Antibodies that come from a single cell line are called monoclonal antibodies
and demonstrate the best specificity for drug assays.
Immunoassay Methods
Catt and Niall (1967) were one of the first to report on using a solid support for
immobilization of antibodies for use in radio-immunoassays (RIA). The technique of
binding antibodies to a solid surface for the isolation or testing of presence of specific
analytes of interest has since found widespread use in various scientific disciplines. Most
of these immunoassay or affinity techniques were initially used for the purification of
proteins, hormones and other ligands of interest in biochemistry and diagnostic and
clinical chemistry testing (Hage, 1998). An example of a clinical test is the analysis of
fibrinogen in plasma. Here a specific anti-fibrinogen antibody is used to capture
fibrinogen dissolved in an aqueous solution similar to plasma as it flows through a
column. Other constituents that are not bound by the ligand are washed from the column
prior to switching solvents to elute the fibrinogen. The fibrinogen can now be quantitated
by a UV/VIS detector.
RIA methods led to the development of several other immunoassay techniques.
All these methods take advantage of specific antibodies to achieve the desired result of
screening for the presence and/or quantitation of specific analytes. Enzyme multiplied
immunoassay technique (EMIT), fluorescent polarization immunoassay (FPIA), cloned
enzyme drug immunoassay (CEDIA) and enzyme linked Immunosorbent assay (ELISA)
are all techniques used in the forensic field as screening assays for illicit and therapeutic
drugs. The forensic field uses such techniques for the expressed purpose of screening for
the presence of illicit drugs and not for quantitation or confirmation as seen in the clinical

11
area.
Affinity Chromatography
Affinity chromatography has been an analytical method since around 1910 (Axen,
Porath & Ernback, 1967). The purpose of the technique is to separate specific molecules
from all others within a complex matrix. A key to using antibodies bound to a solid
surface is that the system can be used over and over (Kim, H.O., Durance, T.D., & Li-
Chan, E.C., 1999). Such devices used in a forensic setting could only be used once
which is a reason for development of a simplified device at low cost.
Initially, the method was used to isolate and purify large biomolecules such as
proteins, carbohydrates and nucleic acids. The first solid supports for affinity ligands
were polysaccharides activated using cyanogen bromide (Axen et al., 1967). More
recently affinity chromatography has been applied to the isolation of drugs from either
humans or in food products from animals. Haagsma and van de Water (1992) used
affinity chromatography for isolating antibiotic residues in food products generated from
animals. Identification of drugs in human urine using an online immunoaffinity method
coupled with high performance liquid chromatography mass spectrometry was performed
by Rule and Henion (1992).
Webb et al. (1996) developed an immunoaffinity extraction technique for the
analysis of LSD which was also coupled with a high performance liquid chromatographic
system, but the experiments demonstrated poor consistency between analyses. Their
study used an affinity gel made from Protein A Sepharose CL-4B containing antiserum
against LSD. Each cartridge contained 0.36 g of the gel and 0.2 ml urine was added for
analysis. The column was rinsed prior to elution of LSD with phosphate buffer, water
and 0.5 ml absolute ethanol. LSD was eluted with 1.5 ml ethanol, dried and then

12
reconstituted with 100 uL of mobile phase. The internal standard, methysergide, was
added following extraction which may account for the inconsistent results. The only
publication using gas chromatography with an EI mass-spectrometer found to date is
Bagnati et al. (1991) who identified zeronal and the metabolite P-zeronal in calf urine
using a gel based extraction method.
There are several methods that have been developed for the binding of molecules
to a solid matrix such as a polystyrene surface for the subsequent binding of specific
types of ligands (Hermanson et al., 1992). The manner and orientation of ligand
attachment to the matrix is one of the most important questions to consider prior to
developing an affinity based extraction device. The best type of attachment is covalent
bonding between the surface and the ligand (Nisnevitch & Firer, 2001). This ensures the
ligand remains in place during wash steps that remove unwanted substances. Secondly
the ligand must also remain attached during the elution of the analyte of interest so that
the ligand itself does not become a contaminant. Hale (1995) used an iminodiacetate
resin in conjunction with C0CI2 and H2O2 for attachment of antibody specifically using
the Fc region to ensure proper orientation of binding sites.
Many of the methods developed for use by affinity chromatography for
subsequent purification and identification use some form of a high performance liquid
chromatography system (HPLC) coupled with various types of detectors such UV/VIS,
diode array or multiple mass spectrometer techniques (Johns et al., 1996; Hage, 1998;
Thompson & Cone, 1987).
Polystyrene is a matrix that possesses a hydrophobic surface that contains no
functional groups for direct attachment of either spacer molecules or ligands (Hermanson
et al., 1992). The surface may be treated with alkaline buffers in the pH range of 9.0 to

13
9.5 making the surface amenable to passive, noncovalent absorption of affinity ligands
such as antibodies. The problem that arises with this type preparation is there is no way
to ensure the ligand will not be removed from the surface during experiments.
Glutaraldehyde has been used for many years as a linking molecule for attaching
proteins to polystyrene surfaces (Klasen et al., 1982). Polystyrene plates can be
modified with glutaraldehyde to provide a covalent linking molecule for attachment of
proteins. The chemical reaction of binding one end of glutaraldehyde to the polystyrene
is accomplished at an acidic pH by producing radical vinyl bonds between the
polystyrene and one end of the glutaraldehyde molecule (Hermanson et al., 1992).
Antibodies are then attached to this layer of glutaraldehyde molecules at an alkaline pH
(8-9.5) with chemical bonds formed between the free aldehyde groups with amino groups
located on the antibody. This is a simple procedure that does not require any specialized
instrumentation or chemicals and can be carried out in most all laboratories with ease.
The one drawback to the procedure is the orientation of antibodies cannot be controlled.
Thus, a sufficient concentration of antibodies and surface area are required to ensure
sufficient numbers of binding sites will be available for drug capture.
Another consideration of orientation is positioning of antibody in a device. The
issue becomes how far an antigen may have to diffuse when dealing with a flat surface
(Stenberg & Nygren, 1988). Once antibodies in a given area are bound with antigen,
then unbound antigens must be able to diffuse to non-bound antibodies. If this distance is
too far, then a reduction in percent yield can be expected.
Enzyme Linked Immunosorbent Assay
Enzyme linked immunosorbent assays were initially developed for special clinical
applications followed in time for specific drug quantitations in serum or plasma and for

14
drug screening in urine and whole blood for drugs of abuse. ELISA assays work based
on competitive binding between analyte and enzyme tagged analyte for antibody binding
sites in reaction wells. In general, the more analyte present the more antibody sites will
be bound by analyte. An enzyme tagged with the same analyte of interest will bind
antibody sites that are free. A color reagent is added as a substrate for the enzyme to
create a color change. The reaction is stopped using a solution designed to inhibit the
enzyme and an absorbance reading taken of each well at a specified wave length of light.
The lower the absorbance value the higher the concentration of analyte in the sample.
Conversely, the higher the absorbance value the lower the concentration of the analyte.
Each assay kit has a cutoff threshold standard at a given concentration or set of
calibrators for determination of a positive sample and concentration in clinical testing.
A clinical ELISA test developed to quantitate mannose-6-phospahte receptors in
cells is an example of using immobilized antibodies for the capture and purification of
proteins of interest (Suresh et. al, 2002). In this study, goat antibodies specific for protein
receptors MPR 300 and MPR 46 were bound to each well of 96 well microtiter plates.
Purified membrane extracts were added to designated wells and then washed prior to
adding anti-goat IgG conjugated to alkaline phosphatase. Methods such as this use an
enzyme and substrate to generate a color which is measured at specific wave lengths of
light for quantitative purposes. Clinically it is acceptable to rely on such an assay
without further testing that the assay is actually measuring the analyte of interest based
solely on the specificity of the antibodies produced. Such is not the case in forensic
science.
ELISA testing in forensic science is used for the purpose of screening biological
samples for the presence of specific drugs or drug classes (Levine, 2003). The assays use

15
monoclonal or polyclonal antibodies developed against a specific drug or specific drug
class that demonstrate sufficient cross reactivity to other drugs within the same class.
This type testing is used strictly for drug screening due to the phenomenon of cross
reactivity. As an example immunoassay kits designed for amphetamines will cross react
with several over-the-counter medications that contain drugs very similar in molecular
structure to the amphetamines resulting in presumptive positive results when present in
biological samples being tested (Kelly et al., 1993).
When testing is performed for a class of drugs such as opiates, barbiturates or
benzodiazepines a positive result only indicates the possible presence of one or more of
the drugs within the class, but does not indicate which drug or drugs is/are actually
present. This is the reason behind confirmatory testing so that the drug(s) may be
positively identified by a more specific methodology such as gas chromatography-mass
spectroscopy.
Quantitations of drugs by ELIS A as well as other immunoassay techniques is
forensically unacceptable due to cross reactivity when it is not known which specific
drug(s) of a given class of drugs is present. Each drug within a class cross reacts at a
different binding percentage based on its concentration as compared to the drug for which
the antibody was specifically designed against. This makes quantitations of drugs
basically impossible when using ELISA test kits as a testing method in forensic settings.

16
CHAPTER III
MATERIALS AND METHODS
Phase I
Experimental Protocol
This project was designed to develop an extraction device that can be easily
adopted for use with a gas-chromatograph coupled to an EI+ mass-spectrometer along
with other typical chromatographic instrumentation used in forensic laboratories.
An experimental protocol was developed to test the hypothesis that A-9-THC
within a complex biological matrix could be bound by antibodies specific for A-9-THC,
remain bound during several washing steps and subsequently recovered from a 96 well
ELISA microtiter plate for qualitative analysis by GC/MS.
The second step in the research protocol was immobilization of sufficient A-9-
THC monoclonal antibodies onto a solid surface of polystyrene using glutaraldehyde as
the linking molecule. One goal of this project was to develop a device of sufficient
surface area to which antibody specific for A-9-THC could be chemically bound without
any sophisticated equipment. The device had to be capable of holding 1 to 2 ml of a
biological matrix in a manner to ensure exposure of analyte to antibody.
Third a rinsing protocol designed to eliminate interfering substances was established
without releasing the bound drug from antibodies. Once interfering substances were
removed, the final step in preparation for analysis was the release of all analyte from
antibodies using a minimum volume of an organic solvent. At this point, a minimum
volume of solution containing primarily the drug and/or metabolites of interest was
evaporated and prepared for analysis by GC/MS. The purified extraction was
accomplished using a short incubation period, limited number of rinse steps, and a

17
minimum volume of organic solvent.
Drug Standards
Standard solutions of A-9-THC at a concentration of 1.0 mg/ml and A-9-THCA at
a concentration of 1 mg/ml in methanol were purchased from Cerilliant (Round Rock,
TX). These standard solutions were used to make stock and working standard solutions
for use in all experiments. Deuterated standards of A-9-THC-D3 and A-9-THCA-D3
were also purchased from Cerilliant containing 100 ug/ml of analyte for use in
quantitation A-9THC and A-9-THCA. Stock solutions for all analytes were made from
the purchased standards. Stock drug solutions where used to prepare working solutions
of individual analytes for spiking all calibrators and controls. Postmortem blood samples
from the Mississippi Crime Laboratory were spiked with internal standard solutions.
ELISA Kit Testing
An ELISA Cannabinoid kit was purchased from Immunalysis (Pomona, CA) for
the initial phase of the project. The ELISA kit contained five 96 well plates with 12
removable rows of cannabinoid antibody coated wells with eight wells per row. Each
coated well had the capacity to hold approximately 300 uL of total fluid. Individual
plates were designated based on concentration of analyte added and incubation time
during initial experiments. The kit also came with THC derivative solution conjugated to
horseradish peroxidase, synthetic negative blood, 3, 3', 5, 5' tetramethylbenzidine (TBM
chromogenic substrate) and 1 N hydrochloric acid as a stopping agent.
The first experiment was run to establish that the kit would perform as described
by the manufacturer. Synthetic blood was spiked with A-9-THC at a concentration of 25
ng/ml and added to seven rows with the first row representing a negative sample.
The second experimental protocol followed was based on the manufacture's

18
instructions with the exception of sample dilution prior to analysis. Volumes of sample
(125 uL) and THC-conjugate added to each well were also altered to achieve
approximately 1 ml of sample per eight wells for binding studies. The decision not to
dilute the samples was necessary for later determination of analyte percent yield by
GC/MS analysis. The protocol used for the first two experiments were as follows:
1. 125 uL of sample was added to a designated well.
2. Plates were incubated for 1 hr at room temperature.
3. Plates were washed five times with 250 uL DI water using an
automated plate washer.
4. Following initial wash steps, 125 uL of THC-conjugate derivative was
added to each well.
5. Plates were incubated for 1 hr at room temperature and then washed
five times with DI water using an automated plate washer.
6. Plates were inverted and slapped on dry paper towels to ensure no
THC-conjugate remained and wells were dry of fluid.
7. 125 uL of TMB chromogenic substrate was added to each well and
incubated in the dark at room temperature for 30 min.
8. 125 uL of IN HC1 (stop reagent) was added to each well and the plates
tapped several times to insure complete mixing.
9. Developed color of all wells was measured using a Victor 3 (Perkin
Elmer, Shelton, CT) automated plate reader at 450 nm and
absorbances recorded.
The protocol for the analyte recovery experiments was as follows:
1. Perform steps 1 -6 as described above.

19
2. 250 uL of acidic methanol, hexane or N-butyl chloride was added to
each well of their respective plates and incubated for 1 hr.
3. Recovery of solvent from a single row of eight wells was collected and
placed in a single labeled 16x125 mm screw cap tube.
4. Tubes were refrigerated until ready for analysis.
The third experiment performed was addition of A-9-THC, A-9-THCA and their
respective deuterated internal standards at 25 ng/ml each to duplicate rows in order to
determine the antibodies would bind and be retained through the method protocol.
Incubation Period Determination for Percent Yield Study
An optimum incubation period for analyte recovery was performed by
incubating spiked samples for 15, 30 and 60 min in the microtiter plates. All analytes
were added to specified rows of wells at a concentration of 25 ng/ml and run through the
method.
Once the optimum time frame was established, this time was used for the
remainder of the ELISA experiments. Four drug free synthetic blood samples of 1 ml
each were spiked individually with A-9THC, A-9-THCA and their respective deuterated
internal standards at concentrations of 25 ng. Plates were then run through the recovery
protocol as described above.
A 0.1% methanolic HCL solution was prepared by adding 0.1 ml of concentrated
HCL to 90 ml methanol, mixing and then brought to a final volume of 100 ml. Hexane
and N-butyl chloride solvents were used directly from stock bottles. These three
solutions were used to release the analytes from the antibody following the washing
procedure. Into each well was pipetted 250 uL of a releasing solution and allowed to
stand for 30 min. Solvent from each well was collected and the contents of each

designated row were placed in a labeled 16x125 mm screw cap tube for storage at 4 C
until ready for analysis by GC/MS.
Tubes containing the different releasing solutions were evaporated to dryness.
To each tube, 40 uL of O-Bis (trimethylsilyl) trifluroacetamide (BSTFA) was added for
derivatization of analytes. Each tube was then capped and incubated for 60 minutes at
70° C. Derivatized samples were analyzed by GC/MS operating in the Selected Ion Mode
(SIM). Ions chosen for A-9-THC were 386, 343 and 303 amu. The ions chosen for the
internal standard of A-9-THC were 389 and 306. The ions chosen for A-9-THCA were
371, 473 and 488 amu with 374 and 476 amu as the internal standard ions.
Phase II
Experimental Protocol
Phase 2 of the research began with developing a protocol to immobilize drug
specific A-9-THC monoclonal antibodies within a polystyrene cell culture flask. Two
methods were chosen for binding of antibodies to the polystyrene surface; 1) passive
absorption and 2) chemical linkage with glutaraldehyde. Two methods were chosen to
first establish if one was more efficient to prepare and secondly which one would be
more robust in performing the experiments.
Passive Immobilization of Antibody
Antibodies were mixed in an alkaline buffer and allowed to incubate in the
extraction flask for absorption to take place prior to a blocking agent being added to the
device: Devices were made fresh for each batch run. The protocol for the absorption
experiment is given below:
1. A 0.1 M buffer of sodium carbonate (Na2C03-H20), pH 11.3, was
prepared by accurately weighting out 12.4 g and dissolving in 950 ml

21
Type III water. The pH was checked with an Accumet XL 25 (Fisher
Scientific, Houston, TX) and the solution was brought to a final
volume of 1000 ml.
2. A 0.1 M buffer of sodium bicarbonate (NaCH03), pH 8.3, was
prepared by accurately weighting out 8.4 g and dissolving in 950 ml
Type III water. The pH was checked as above and the solution
brought to a final volume of 1000 ml.
3. 400 ml of the 0.1 M carbonate buffer was measured out and the pH
was brought to 9.25 by addition of the sodium bicarbonate buffer up to
a volume of 500 ml.
4. 0.5 mg of A-9-THC antibody solution was added to 100 ml of the
carbonate buffer for a concentration of 5 |ag antibody per ml of buffer,
pH 9.25.
5. 1 ml of the buffered antibody solution was placed in each extraction
device and allowed to incubate overnight at room temperature.
6. The following day each device was rinsed five times with phosphate
buffered saline (PBS), pH 7.2.
7. A 0.1M solution of 1-lysine was added to each device and allowed to
incubate for 3 hrs at room temperature: L-lysine served as a blocking
agent for any remaining active sites.
8. The devices were then washed 5 times with PBS and allowed to air
dry.
9. 1 ml synthetic blood samples were spiked with 25 ng A-9-THC and
added to 10 devices and incubated for 1 hr on a platform rotator

22
moving at 25 revolutions per min.
Following the respective incubation periods, the devices were removed from the
platform rotator and the contents poured into a biohazard waste container. Each device
was then washed 5 times with sodium phosphate buffer (pH 7.2) to remove any
remaining contaminants. The devices were allowed to drain for 30 min followed by
addition of 2 ml of the releasing solvent. The devices were incubated in the releasing
solvent for a period of 30 min. The 2 ml of releasing agent from each device was
decanted into a clean 16 x 125 mm screw cap tube and labeled. Great care was taken not
to collect any remaining traces of water or buffer from any devices during this step.
Collected aliquots of solvent were dried at 60° C under vacuum. Forty (40) uL of
BSTFA with 1% TMS was added to each tube. The tubes were then capped, vortexed
and incubated at 70° C for 1 hr for derivatization prior to analysis by GC/MS.
Glutar aldehyde Immobilization of Antibody
The second method used glutaraldehyde as the linking molecule to chemically
bind the antibody to the polystyrene surface. The protocol for gluteraldehyde bonding to
a polystyrene surface is given below:
1. A 0.1 M solution of sodium phosphate dibasic (Na2HP04), pH 9.5,
was made by accurately weighting out 14.2 g and dissolving in 950 ml
Type III water and brought to a final volume of 1000 ml.
2. A 0.1 M solution of sodium phosphate monobasic (NaH2P04), pH 4.5,
was made by accurately weighting out 12.0 g dissolving in 950 ml
Type III water and brought to a final volume of 1000 ml.
3. 450 ml of the monobasic buffer was measured and the pH adjusted to
5.0 using the 0.1 M solution of sodium phosphate dibasic solution and

23
brought to a final volume of 500 ml. Final pH of 5.0 was checked
using an Accumet 25 XL pH meter.
4. 10 ml of a 25% glutaraldehyde solution was added to 40 ml of sodium
phosphate buffer (pH 5.0) for 50 ml of a 5% glutaraldehyde solution.
5. A sodium phosphate buffer at pH 8.0 was made by using the two
buffer solutions above. 400 ml of the sodium dibasic buffer was
measured out and brought to the proper pH as necessary using 0.1 M
of sodium phosphate monobasic solution and brought to a final
volume of 500 ml.
6. 1 ml of the glutaraldehyde solution was pipetted into 10 devices and
allowed to incubate at room temperature for a minimum of 4 hrs.
7. Following incubation, each device was thoroughly washed with
sodium phosphate buffer, pH 5.0.
8. 0.5 mg of A-9-THC monoclonal antibody was added to 100 ml of a
sodium phosphate buffer, pH 8.0, for a concentration of 5 ug antibody
per ml of buffer.
9. 1 ml of antibody solution was added to an extraction device and
incubated at 37° C for a minimum of 3 hrs.
10. Devices were allowed to cool to room temperature and washed with
pH 8.0 sodium phosphate buffer 3 times.
11. Each device was drained and washed twice with phosphate buffer, pH
7.2, made from 0.1M solution of sodium phosphate monobasic and
0.1M sodium phosphate dibasic followed by 2 washes with Type III
water.

24
12. 1 ml synthetic blood samples were spiked with 25 ng A-9-THC.
13. While vortexing, 1 ml of acetonitrile was added drop-wise using a
variable pipettor.
14. The samples were then centrifuged for 25 min at 3000 rpm and then
the upper layer was transferred to a clean 15x125 mm screw cap tube.
15. The acetonitrile layer was evaporated to approximately 250 mcl and
then reconstituted with 1 ml of a 0.5% saline solution, vortexed and
centrifuged at 3000 rpm for 25 min.
16. The saline solution was transferred to prepared device and capped.
17. The devices were incubated for 120 min on a platform rotator moving
at 25 revolutions per min.
The devices were treated as described under the "Passive Immobilization"
section above.
Monoclonal A-9-THC Antibodies
Monoclonal drug antibodies produced against A-9- THC were purchased in 1 mg
lots from BioDesign Co (Saco, ME). The purchase of a 1 mg lot of monoclonal
antibodies was sufficient to make 200 extraction devices at a concentration of 5 ug of
antibody per device. Description of the antibody purchased is as follows:
1. Catalog # G82922M
2. Description - monoclonal antibody to A-9-THC
3. Clone D81 from Mouse ascites
4. Immunogen - 8-THC-BSA
5. Isotype IgGi
6. Specificity to A-9-THC and metabolites

25
7. Buffer-PBSpH7.2
8. Lot number 8D09407
Extraction Device
A Falcon® tissue flask (Thermo-Fisher Scientific, Houston, TX) with 12.5 cm2
bottom surface area along with a canted neck and screw cap was chosen as the prototype
container. The flask could be sealed with a non-vented screw cap and had a large enough
orifice to easily add 1 to 2 ml of buffered sample and to pour off 2 to 3 ml of rinse
solution and drug releasing solvent. The flasks have a flat bottom and were easy to stack
for incubation on a platform rotator.
Analyte Releasing Solvents
The releasing solvents tested were an organic solvents and an acidic alcohol
normally used in forensic laboratories in general extraction procedure for A-9-THC and
A-9-THCA extraction purposes. The solvents chosen were hexane and 0.1% methanolic
HC1. Each solvent was used individually to determine which was the most efficient. The
releasing solution found optimal in Phase 1 of the study was tested first. Releasing
solutions were collected in 16X125 mm borosilicate glass screw cap tubes and placed in
a RapidVap® evaporator for drying under vacuum at 50°C. The dried extracts were
reconstituted with 40 uL BSTFA plus 1% TMS, capped, vortexed and incubated for 60
min at 70°C for derivatization.
Gas Chromatograph and Mass Spectrometer Parameters
The gas chromatograph injection port was set up in the splitless mode for
injection of 2 uL of extracted samples using an autoinjector. The mass spectrometer was
set up in the SIM mode to monitor 3 characteristic ions of each analyte and two ions for
each internal standard. Secondary ion ratios were monitored to assure compliance within

26
the ± 20% criteria for confirmation. Gas chromatograph parameters were set as follows:
1. GC was a Clarus 600 manufactured by Perkin Elmer, (Shelton, CT)
2. Injection port temperature 250° C
3. Initial oven temperature 120° C with an initial hold of 1.00 min
4. Following 1 min hold, temperature was ramped 15° C/min to 320° C
for a total run time of 14.33 min
5. Column was a MS 5, 30 m in length with a 250 um diameter
purchased from Perkin Elmer, (Shelton, CT) containing 5% phenyl
and 95% polysiloxane
Mass spectrometer parameters were set as follows:
1. Mass Spectrometer was a Clarus 600 electron impact (EI+) quadrapole
manufactured by Perkin Elmer, (Shelton, CT)
2. Solvent delay from 0 to 10.62 min
3. THC ions monitored were 303,386 and 387 (BSTFA+1 % TMS
derivative)
4. THCA ions monitored were 371, 473 and 488 (BSTFA+1% TMS
derivative)
5. A-9-THC-D3 and A-9-THCA-D3 ions monitored were 306, 389 and
374, 476 respectfully.
6. Window for THC was 10.63 to 11.63 min
7. Window for THCA was 12.57 to 14.33 min
8. Dwell times were 0.050 s for each ion
9. Ion mode was EI+
10. Inter channel delay was 0.01 s for each ion monitored

ELISA Testing of Glutaraldehyde Prepared Devices
Extraction devices were prepared as described under the glutaraldehyde antibody
immobilization section. One of the devices was treated as a negative with no analyte
added. A-9-THC at concentrations of 10, 50, 100, 200, 500 and 1000 ng/ml A-9-THC
were added to the remaining six devices. A total of five batch runs were performed.
Following initial incubation and wash steps, 1 ml of conjugated THC-derivative
was added to each device and incubated for 1 hr. The devices were washed six times
with DI water following this second incubation to remove all traces of conjugated THC-
derivative. Next 1 ml of TMB color reagent was added to each device. Each device was
mixed well by gentle swirling and allowed to incubate in the dark for 30 min. Stop
reagent (1 N HC1) was added to each device following the 30 min incubation and the
devices were thoroughly mixed again by gentle swirling to ensure reaction between TMB
and conjugate was completely stopped.
The contents from each device were transferred to labeled, 2 ml polystyrene
cuvettes for reading absorbance values of each solution using a Lambda 35 UV/VIS
spectrophotometer (Perkin Elmer, Shelton, CT) at 450 nm.
Percent Yield Studies
Percent yield of A-9-THC was determined by spiking ten, 1 ml aliquots of
synthetic whole blood with 25 ng of the analyte and extracting these samples using
devices prepared the day of analysis. A 25 ng/ml direct standard was used to determine
the results of the extracted samples. A total of 5 experiments using 10 devices for each
analyte were conducted on different days for a total of 50 experiments A-9-THC and A-9-
THCA. Percent yield data from experiments were compared using a Paired t test to
determine if data demonstrated any significant statistical differences among the different

28
daily experiments.
A second round of experiments to determine binding specificity was conducted
by adding both A-9-THC and A-9-THCA to the same extraction device in order to
determine if there was an appreciable effect on the recovery of THCA or both of the
analytes. Both analytes were added to prepared extraction devices at equal
concentrations of 10, 50, 100, and 150 ng/ml. Effect on binding specificity for THCA
was determined by direct comparison of results from the respective analytes. The
experiment was conducted five times.
Linearity of Single Extracted Analytes
One ml whole blood aliquots ranging from 3 to 50 ng/ml of each analyte were
analyzed by the glutaraldehyde procedure and judged for acceptability. Criteria
designated as acceptable linearity was a line having a correlation coefficient of r > 0.985.
This procedure was conducted daily using five devices per run for a minimum of 50
samples run over a 5 day period to test within run and day-to-day consistency of device
preparation.
Linearity of Extracted Analytes with Deuterated Internal Standards
Deuterated internal standards (IS) were added to the next phase of the study.
Whole blood samples were spiked at 25 ng/ml A-9-THC-D3 and 50 ng/ml A-9-THCA-D3
with appropriate concentrations of A-9- THC and A-9-THCA to prepare a set of five
calibrators ranging from 2.0 to 50 ng/ml for A-9-THC and 2.0 to 50 ng/ml for A-9-
THCA. These standards were prepared for the purpose of demonstrating linearity (r2 >
0.985).
Establishing limits of quantitation (LOQ) and limits of detection (LOD) for each
analyte was accomplished by extracting 10 samples at designated concentrations. Ten

29
samples were spiked at a concentration of 0.5 ng/ml A-9-THC for LOD determination.
Ten samples at a concentration of 1.0 ng/mlA-9-THC were extracted to determine LOQ.
The same protocol was followed for A-9-THCA with concentrations of 2 and 5 ng/ml for
LOD and LOQ, respectfully.
Once linearity was established, quality control samples were prepared using
standards from a separate lot of drug standards from the same vendor with concentrations
that tested the low and high portions of the calibration curve; 5 and 30 ng/ml for A-9-
THC and 10 and 40 ng/ml for A-9-THCA. Acceptable criteria of controls were set at ±
20% of expected concentration.
Analysis of Postmortem Samples
The final step in Phase 2 of the study was the analysis of postmortem blood
samples secured from the Mississippi Crime Laboratory that had been previously
analyzed by a reputable laboratory and extracting these samples using the new device.
All experiments were conducted twice on different days to ensure the devices were
consistent between runs. This experiment step consisted of two parts: 1) extraction of
samples with known reported concentrations of one or both analytes, and 2) extraction
of samples where concentrations of A-9-THC could not be reported due to interfering
substances. Appropriate statistical tests were performed to evaluate the validity of the
new extraction procedure where reported sample concentrations were known. Samples
where values were not reported due to interfering substances were compared to the new
extraction procedure to evaluate if interfering substances had been removed, thus
allowing reporting of quantitative results. A-9-THCA was analyzed on all 30 samples
following the same protocol.

CHAPTER IV
EXPERIMENTAL RESULTS
Preparation of Drug and Internal Standards
Drug standards of A-9-THC, A-9-THCA, A-9-THC-D3 and A-9-THCA-D3 were
purchased from Cerilliant Corp. (Round Rock, TX). A-9-THC and A-9-THCA were
purchased in concentrations of 1 mg/ml while the two deuterated internal standards were
purchased in concentrations of 100 ug/ml. Stock standards of A-9-THC and A-9-THCA
were made by diluting 1 ml of the respective analyte with 9 ml methanol for final
concentrations of 100 |j,g/ml each. Stock standards for internal standards were 0.5 and
1.0 mcg/ml for A-9-THC-D3 and A-9-THCA-D3 respectfully (Liu, et al., 1995). See
Tables 1 and 2 for complete dilution protocols for making working solutions.
Results of Phase 1 ELISA Experiments
The first experiment was conducted by spiking separate 1.0 ml aliquots of
synthetic blood in 16x125 mm screw cap tubes with 25 ng/ml of A-9-THC. As stated in
the method protocol, 125 uL of spiked solution was placed in 56 designated wells and
125 uL of negative blood was placed in first eight wells (see Figure 1) to establish the
method worked in my laboratory as described by the manufacturer. Absorbance readings
were measured for all wells using a Victor 3, 96 well plate-reader operating at 450 nm.
Figure 1 demonstrates the cannabinoid ELISA kit worked as described by the
manufacturer. The synthetic negative sample gave negative results as expected and the
spiked samples at 25 ng/ml A-9-THC gave positive results. Analysis of the absorbance

31
Table 1
Dilution protocol for Making Stock and Working Standards
Stock Standards A-9-THC - 1 ml of a 1 mg/ml Standard + 9.0 ml MEOH = 100 mcg/ml: Stock Std 1
1 ml of Stock Std 1 + 9.0 ml MEOH = 10 mcg/ml: Stock Std 2
A-9-THC Working Standards 1 ml of Stock Std 2 + 9.0 ml MEOH = 1 mcg/ml: Working Std 1 0.4 ml Stock Std 2 + 9.6 ml MEOH = 0.4 mcg/ml: Working Std 2 0.2 ml Stock Std 2 + 9.8 ml MEOH = 0.2 mcg/ml: Working Std 3 0.1 ml Stock Std 2 + 9.9 ml MEOH = 0.1 mcg/ml: Working Std 4
Calibrators 50 uL Working Std 1 in 1 ml blood = 50 ng/ml A-9-THC 50 uL Working Std 2 in 1 ml blood = 20 ng/ml A-9-THC 50 uL Working Std 3 in 1 ml blood = 10 ng/ml A-9-THC 30 uL Working Std 4 in 1 ml blood = 3 ng/ml A-9-THC
Stock Standards A-9-THCA - 1 ml of a 1 mg/ml Standard + 9.0 ml MEOH = 100 mcg/ml: Stock Std 3
1 ml of Stock Std 3 + 9.0 ml MEOH = 10 mcg/ml: Stock Std 4
A-9-THCA Working Standards 1 ml Stock Std 2 + 9.0 ml MEOH = 1 ng/ml: Working Std 5 0.4 ml Stock Std 2 + 9.6 ml MEOH = 0.4 ug/ml: Working Std 6 0.2 ml Stock Std 2 + 9.8 ml MEOH = 0.2 ng/ml: Working Std 7 0.1 ml Stock Std 2 + 9.9 ml MEOH = 0.1 ng/ml: Working Std 8
Calibrators 50 uL Working Std 5 in 1 ml blood = 50 ng/ml A-9-THCA 50 nL Working Std 6 in 1 ml blood = 20 ng/ml A-9-THCA 50 nL Working Std 7 in 1 ml blood = 10 ng/ml A-9-THCA 50 nL Working Std 8 in 1 ml blood = 5 ng/ml A-9-THCA
Table 1: Calibrators of A-9-THC and A-9-THCA were made by adding amounts shown in the table to 1 ml aliquots of postmortem blood. Calibrators were made new for each run of 10 samples from the Mississippi Crime Laboratory.

Table 2
Dilution Protocol for Making Internal Standard Spiking Solutions
Stock Standard A-9-THC-D3
1 ml of 100 ug A-9-THC-D3 + 9 ml MEOH = 10 ug/ml: Stock Solution 1 ml of 10 ig/ml A-9-THC-D3 + 9 ml MEOH = 1 ug/ml: Working Solution
25 uL of Working Solution to 1 ml sample = 25 ng/ml A-9-THC-D3
Stock Standard A-9-THCA-D3
1 ml of 100 A-9-THCA-D3 + 9 ml MEOH = 10 ug/ml: Stock Solution 1 ml of 10 mcg/ml A-9-THCA-D3 + 4 ml MEOH = 2 mcg/ml: Working Solution
25 uL of Working Solution to 1 ml sample = 50 ng/ml A-9-THCA-D3
Table 2: 25 uL of each internal standard is added to all calibrators, controls and samples to be used for quantitation curves and determination of control and sample values.

Figure 1
33
~S> Wallac 1 420 Manager
Fte Instrument Tools Help ^lDlJSl
i®Jitl JLI _ll JfJ Instrument control Live display | Temperature |
Scale
Type
A
B
C
D
E
F
G
H
|0.000A-2.000A:Absorbance Scale (for photometrii) ^ J
<~ Logarithm f* Linear
1 ! 2 1 3 1 4 | 5 | 6 i 7 | 8 1 9 j 10 | 11 | 12 |
O•••••••«OG (^••••••••OOO o • • • • • • • • o o o • • • • • • • • o o o • • • • • • # • o o o o • • • • • • • • o o o • • • • • • • • o o • • • • • • • • o o
Legend •-2.000A
•17I0A
-1.430A
•1.140A
-0.8GQA
•0.570A
•0.290A
-0 000 A
• MeasweiiierR tniminauuii ; Measured assay 891 using protocol THC 450 wavelength'.
For Help, press F l Temp: 27.0
Figure 1: Display from Victor 3 showing the results from an ELISA run. The first row in red is a negative whole blood sample. The blue samples are positive results from whole blood samples spiked with 25 ng/ml A-9-THC. The figure demonstrates the ELISA kit worked as described by the manufacturer in my laboratory.
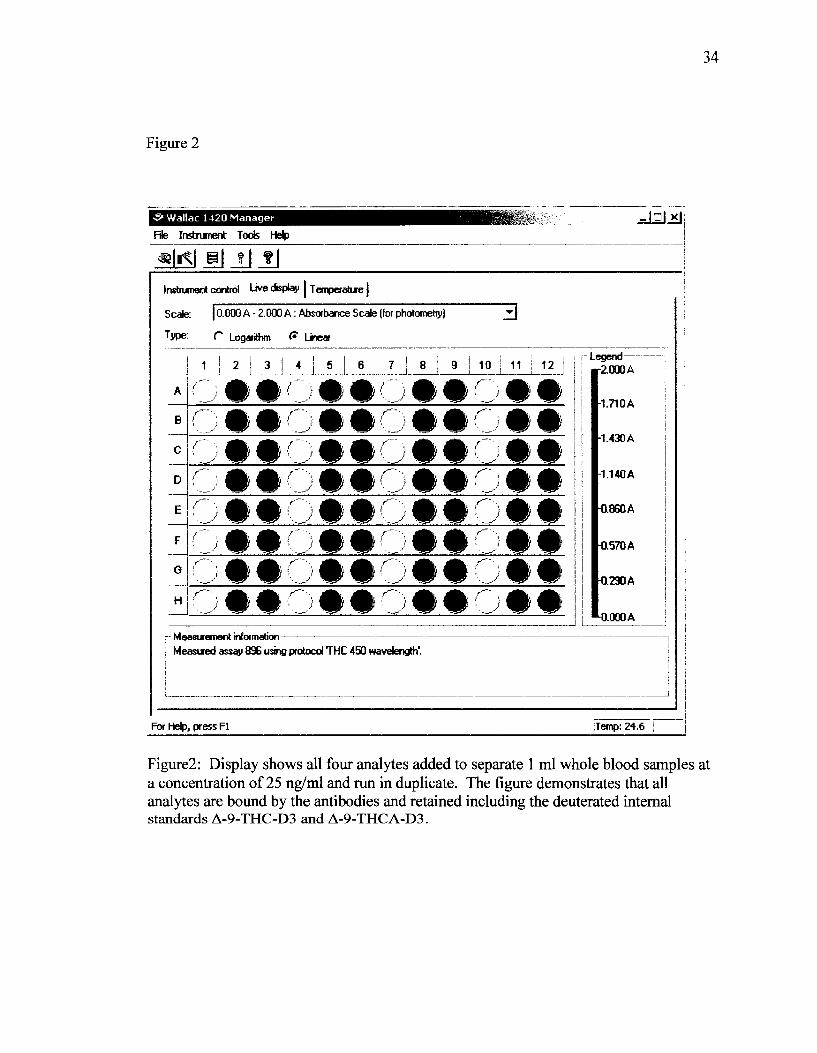
Figure 2
•» Wallac 1420 Manager
File Instrument Tools Help
Jnjj«j
lt|^J_Ll_i Instrument control Live display J Temperature I
Scale: 10.000 A - 2.000 A: Absorbance Scale (for photometry)
Type: r Logarithm <* Linear
~3
1 i i
8 9 I 10 j 11 j 12
mmommommomm ttofOitoii iiuiiQiiOt» ^w ^ P '•• •'' ^& ^w '—''' ^w ^BF ' J P ^ ^
»»o»»o»»o»» ••QiiQiiOii ••©••o##o## f o t i o t t o i t
- Measurement information Measured assay 896 using protocol THC 450 wavelength'.
Legend— 2000 A
-1.710A
1.430A
1.140A
-0.860A
•0.570 A
-0.290 A
-O.O0OA
For Help, press Fl (Temp: 24.6
Figure2: Display shows all four analytes added to separate 1 ml whole blood samples a concentration of 25 ng/ml and run in duplicate. The figure demonstrates that all analytes are bound by the antibodies and retained including the deuterated internal standards A-9-THC-D3 and A-9-THCA-D3.

35
values for the eight negative readings gave a mean of 1.824 with a standards deviation of
0.231. The positive samples resulted in a mean of 0.224 and a standard deviation of
0.023. The values achieved indicate that the pipetting was precise and the automated
washer worked as expected in removing all unbound traces of the conjugated THC-
derivative. The results also demonstrated that A-9-THC remained attached to the
antibody during the washing procedure and was not released.
Results of Second ELISA Experiment
Synthetic blood aliquots spiked individually with 25 ng of all four analytes were
pipetted into 16 different wells and results shown in Table 3 demonstrated that the
antibody cross-reacted with all four analytes tested with basically equal affinity given the
closely related absorbance values. The results also indicate that the three other analytes
of interest were held by the antibody during the washing steps and not released from the
antibody.
Results of Releasing Agent Experiment
Synthetic blood aliquots of 1 ml were spiked with 25 ng A-9-THC and carried
through the ELISA protocol as described for the recovery experiments. The appropriate
volume (125 uL) of a selected solution was added to designated wells and allowed to
incubate for the times stated above. The 0.1% acidic methanol resulted in the best
recovery of A-9-THC averaging 22%. Hexane was the second best with an average
recovery of 15%. N-butyl chloride reacted with the polystyrene resulting in no recovery
of analytes. The 25 ng/ml spiked solutions did have analyte present from both releasing
agents as shown in Figure 3. Two major ions were present with no interfering peaks
present.

36
Table 3
EUSA ASSAY on A-9-THC; A-9-THCA; A-THC-D3; A-9-THCA-D3
Plate 1
Repeat Erci time Start temp. Erai temp. 8arC«fe 11:07:14 PM 24.5 24.5 WA
Absorbance @ 450 (1,0s) (A) ^1.000
Avg. Abs
0.20D 0.200 0211 0.208 0.235 0.206 0.204 0.207 0.209
0.224 0.209 0.209 0.204 0.22S 0.207 0.205 0537 0.215
<£"••"• .K'~ . • - : •
••>•':. •>:.•<•'.
. -• : :>K :>^
. . ' . . • • ' • : •
>... .:• ..•>.
g; :f $
0.203 0.220 0.199 0.1S7 0.227 0.212 0.204 0.203 0.208
0.200 :: 0.197 ';! 0.234 :. 0.233 : :
0.207 I; 0.205 =! 0200 :. 0.204 !-;
0.210
: ; j ; : : ; : : 0.422 : ; i ! ; . | : - . ' ! 0.427 ; ! : ; ; ; : j ; : = 0.451 : ; : - : j : : ; '[ 0.514 X ;!: ; ; : : 0.488
j l : : : ; : i : i j : 0.SS8
0.497
0.419 0.444 0.522 0.436 0.498 0.409 0.420 0.414 0.445
g ? g ^ ! : ^ :£W^i*§£ 5Sj™^:|§i SSSfeSSSSI
iilli • 0.249 0.255 0.261 0.259 0.277 0.257 0.266 0.267 0.261
0.254 0.254 0.260 0.281 0.263 0.262 0.258 0.267 0.260
0.198 0.1S7 0.207 0.204 0.230 0.202 0.201 0.203
0.220 ;•::;; 0.208 :;:;:: 0.204 :;;.-:: 0.199 !:;:'•: 0.222 ;;;:;• 0.203 ; : . ; i : : 0.201 •;:;••: 0.231 ;-|:;i
:;•;:;. 0.200
\--\::.-: 0.213 ;•;•:•• 0.20s : : i ; . ' i : 0.193 :•:••:• 0.223 .;;••!:; 0.209 ::;•::••; 0.200 : | i ' : : . : . 0.200
0.196 : 0.193 •; 0.229 : 8.227 : 0.212 : 0.201 : 0.197 ; 0.202 :
:j:j:;:j:j: ; : ; • : • ' : ; • : • : ;
I 0.412 : 0.416 • 0.441 : 0.503 | 0.487 : 0.587 : 0.574 i 0.472
0.409 •.:: : 0.434 : ::: ::- :
0513 : . : ' : ; : 0.426 •;:••.: 0.482 -::• :: 0.499 : : : ; :
; r 0.418 •.;:•:••: 0.403 : : : i : : :
:. - : . 0.249 :;; . ; : ; 0.256 |: :•':, 0.262 ::::':.:- 0.259 ••::;:. 0.279 •.:'.:•:: 0.257 :::::-:: Q.267 .-•:;. 0266
0.254 0.254 0.259 0.260 0.263 0.261 0.258 0.268
Avg. Abs 0.205 0.211 0.205 0.207 0.487 0.448 0.262 0.260
Table 3: Absorbance values from ELISA analysis of all four analytes of interest at 25 ng/ml. From left to right the analytes are A-9-THC, A-9-THCA, A-9-THCA-D3 and A-9-THC-D3. All have consistent readings with the exception of A-9-THCA-D3 which shows absorbance values approximately two times the other three analytes.

37
The samples collected of each solution from the designated row of wells
representing a negative sample, were evaporated to dryness with air in a 60 C water bath.
To each tube 40 uL of O-Bis (trimethylsilyl) trifluroacetamide (BSTFA) was added for
derivatization. Each negative sample tube was analyzed by GC/MS in the same manner
as those containing analyte. Figure 3 shows that no A-9-THC was found in the tubes
representing the negative sample. This finding indicates that the pipettor, saline solution,
derivatization solvent and ELISA plate and reagents were not contaminated with A-9-
THC.
Figure 4 shows an example of A-9-THC that was extracted using the ELISA
plates. The three ions were all present and met ratio criteria for confirmation. The
recovery of A-9-THC using these plates is poor as noted by the high baseline. A-9-
THCA recovery was also poor using the ELISA plates. The three ions of interest did
meet the confirmation criteria.
Acceptable calibration curves could not be demonstrated using the ELISA plates
for either A-9-THC or A-9-THCA. Poor recovery of analytes using the plates would
explain the inability to recover analytes with a degree of precision. Internal standards of
A-9-THC-D3 or A-9-THCA-D3 were not used in any of the extractions procedures from
the ELISA plates or to see if an acceptable calibration curve could be obtained given the
ELISA plates were not the device of choice for final experiments.

Figure 3
38
100-,
%
11.11
1066 1 0 7 g 10.82 11.19 11.28 I ^ S ^ ^ 11 52 11 57
n i /
100-
%-j 10.71 10.82 10.86 10.93
I i i i i I i i i i I i • i i I i i i i I i i i i I i i i i
11-27 n.59
11.03 " J 1 11-35/l>1-29 11.43 1 1 ^ A ^163
VAvv
100-
% •
I I I I I I I T 1
10.79
10.65 / \
I • ' i ' I « ' ' ' I • i i l i i i i l i
-*S V, 10.82 10.89 11.03 11.11
^ 7 V A 3 S ! / - 2 9 11-40 11.47 11.59 i i i i i i i i i l i i i i i i i i i i i i i i I i i i i i i i i i i i i i i i i i i i I — i i i i
10.73 10.93 11.13 11.33 11.53 Time
Figure 3: Negative sample of A-9-THC showing that the three ion of interest are not present and would not meet ratio criteria for being considered acceptable. The figure also shows none of the items used to prepare the sample were contaminated with A-9-THC.

Figure 4
100- 1 1 U
10CH
I I | I I I I | T I I I | I I T I | I I I I | I I I I | I I I I
11.14
0
100
% •
I i i i | i i i i | i i '^~y[' I i i I | i I i i | i i i i | i i i i | i" i i q T T T T Y T T I i
11.14
A j ^ 6 5 1080 1 l 5 l i \ _
J — - — i • i " ^ T V r i i i i | i i • • | i • i i i r i r~ i | • i i i ! i i • i | i i i i | i i i i T i m e 10.73 10.93 11.13 11.33 11.53
Figure 4: Shows the three ions monitored for A-9-THC by GC/MS analysis. The figure represents a 25 ng/ml sample that was extracted from an ELISA plate using 0.1% acidic methanol. Recovery is poor as demonstrated by the low baseline levels. Ions peaks pictured for A-9-THC are 386, 303 and 387 from top to bottom.

40
Falcon® Cell Culture Flask Chosen As Extraction Device
A 25 ml Falcon® cell culture flask was chosen as the device for binding of
antibodies and extraction of samples (see Figure 5). The device was easy to handle and
had several qualities that may it a good choice for initial experiments.
Sample Treatment with Acetonitrile
As described under the Methods and Material chapter, postmortem samples had to
be treated with acetonitrile prior to use with the extraction devices. Figure 6 shows the
difference in sample appearance following the acetonitrile treatment. A-9-THC or A-9-
THCA could not be extracted from postmortem samples using untreated blood samples.
Results of Passive Immobilization of Antibodies
The passive method for immobilizing the antibodies was not deemed successful
to the point of continuing experiments using this method. Recovery of A-9-THC was
poor only averaging 20% with a range of 0 to 32%. There was no recovery of analyte in
some 40% of the experiments conducted.
One of the problems was the 1-lysine used as a blocking agent. The acidic
methanol releasing solution would extract this compound leaving a white film of 1-lysine
in the tubes following evaporation. The 1-lysine would dissolve in the BSTFA leaving
the BSTFA solution white and opaque. This created chromatographic problems requiring
cleaning or changing of the glass injection inserts following approximately every 15
injections. Removing the step of adding the lysine reduced the chromatographic
problems but did not improve recovery of analyte using the acidic methanol or hexane.
Use of hexane as the releasing solution did not appear to remove the lysine from
the extraction devices given there was no white film visible in evaporated tubes and did
not result in any chromatographic problems or required cleaning of injection inserts.

41
Figure 5
Figure 5: Photographs of 25 ml Falcon® cell culture flasks used as extraction devices. The flasks have 12.5 cm2 surface area on the bottom surface which was adequate for chemically binding 5 meg of antibody.

Figure 6
* *mm*tw-+ ^ # f c ^ | > # l « » ^
^ P 111 > #fflf* 4|}t C * * iHHi -/*& iHl i €Hl § ^ ^ " W ^ ^WBP' *m*P ^mm
Figure 6: Tube on the left is a postmortem sample prior to any treatment with acetonitrile. The middle tube represents the sample after treatment and centrifugation and decanting into a clean tube. The tube on the right is the final sample following evaporation of the acetonitrile and addition of 1 ml buffered saline.

43
However, the recovery of analyte did not improve as compared to the acidic methanol
and many devices showed no recovery of analytes.
Given that these two releasing solutions both demonstrated poor if any recovery
of analyte using this method of immobilization of antibody, lead to two conclusions as to
why this method did not work. One was that there was insufficient antibody bound to the
extraction devices and/or that the antibody was removed during the washing steps. This
experimental protocol was abandoned with no further attempts to improve its
performance.
Results ofELISA Testing ofGlutaraldehyde Bound Antibody
Five experiments were conducted where flasks treated with glutaraldehyde for
antibody immobilization had 1 ml samples at concentrations of A-9-THC of 0,10, 50,
100,200, 500 and 1000 ng added and allowed to incubate for 1 hour. The flasks were
washed as described in the method protocol and dried. ELISA reagents were then used to
estimate binding capacity of the flasks for A-9-THC as described in the ELISA method
(see Figure 7). All experiments showed an inverse relationship of absorbance to
concentration as expected. A concentration > 200 ng A-9-THC approached the limit of
the flask to show any further binding capacity (see Figures 8, 9,10,11 and 12). Average
absorbance values from the five experiments were 3.1323 for 0 ng, 2.5765 for 10 ng,
1.8673 for 50 ng, 0.6063 for 100 ng, 0.2172 for 200 ng, 0.0229 for 500 ng and 0.0015 for
1000 ng (see Table 4 and Figure 13).
Percent Yield Results with Glutaraldehyde Immobilized Antibodies
Ten flasks were then carried through the antibody attachment protocol on five
different days for % yield studies. Each sample was spiked with 25 ng A-9-THC and
carried through the extraction process. The average yield for A-9-THC was 54% with a

44
range of 50 to 61%. The same study was performed using A-9-THCA resulting in an
average % yield of 47% with a range of 37 to 52% (see Table 5 and Tables 6-15).
Paired / test statistical analyses were run on the percent yield results for A-9-THC
to see if there was a significant difference between the groups. Each group was
compared statistically to all other groups during these analyses. There was a statistically
significant difference found between all the groups demonstrating the difference did not
occur by chance.
The same statistical analyses were conducted on the A-9-THCA results for the
five experiments. The statistical analyses showed a significant difference between each
group. Again these analyses show that the device is working as designed for both A-9-
THC and A-9-THCA and the production from day-to-day is consistent.
Experiments were conducted as above when adding both A-9-THCand A-9-
THCA at 25 ng each to determine ant difference in recovery when both analytes were
present. There was no significant difference in recovery at this concentration of analytes.
Next devices were made according to the glutaraldehyde protocol and both analytes were
added to a single device at increasing concentrations. The concentrations were 10,20,
40, 60, 80, 100 and 150 ng/ml. Recovery of both analytes was consistent from 10 to 60
ng/ml. The recovery of A-9-THCA began to fall when the concentration of A-9-THC
began to approach 80 ng (see Figure 14). Concentrations of A-9-THC above 80 ng/ml
showed continued recovery while the A-9-THCA recovery fell at each rise in
concentration A-9-THC.
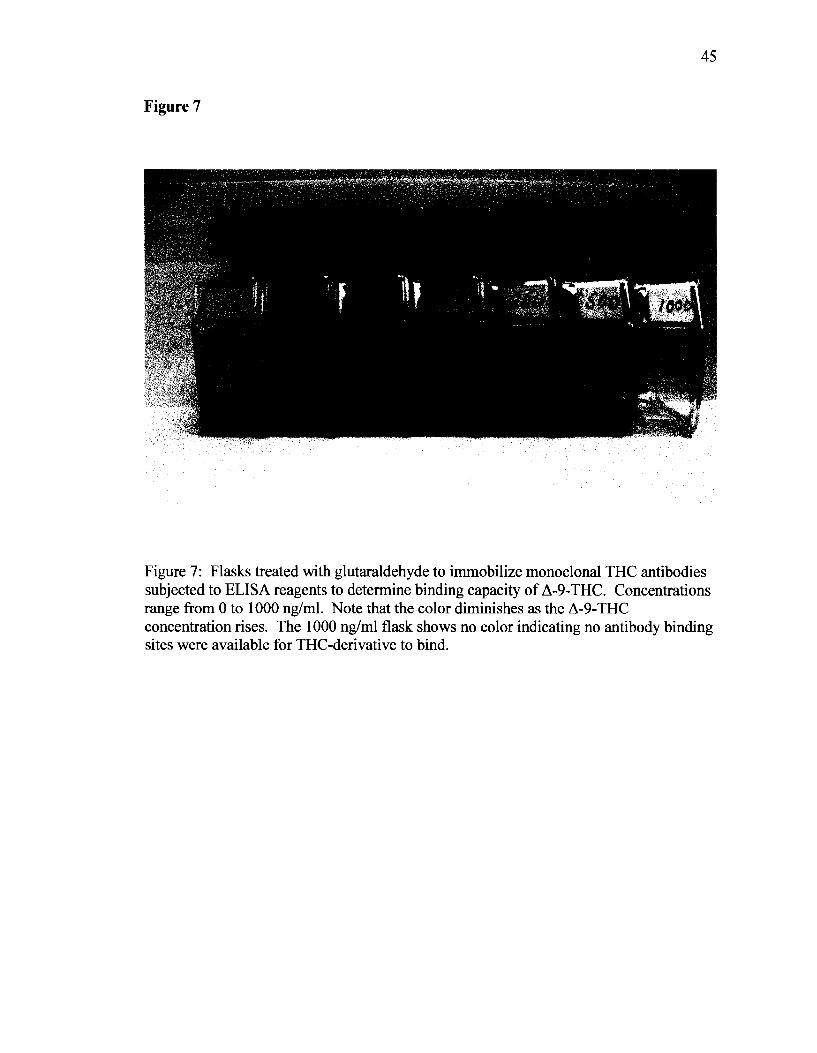
Figure 7
45
Mm - 4 * ^
m
Figure 7: Flasks treated with glutaraldehyde to immobilize monoclonal THC antibodies subjected to ELISA reagents to determine binding capacity of A-9-THC. Concentrations range from 0 to 1000 ng/ml. Note that the color diminishes as the A-9-THC concentration rises. The 1000 ng/ml flask shows no color indicating no antibody binding sites were available for THC-derivative to bind.

Figure 8
46
Experiment 1 of Binding Capacity of Extraction Device
3.5000
3.0000
2.5000
E c a 2.0000
e
| 1.5000 M
<
1.0000
0.5000
0.Q00G
0.0 ng 'ml 10 ng/'ml 50 rig/ml 100ng/ml 200 ng/'ml 500 ng/ml 1000ng/ml
Figure 8: Bar graph shows the absorbance values from flasks treated with glutaraldehyde for immobilization of antibodies and subjected to ELISA reagents to determine binding capacity of A-9-THC.

Figure 9
47
Experiment 2 of Binding Capacity of Extraction Device
4.0000 T
3.5000
3.0000
£ 2.5000
3
• 2.0000 u c * €
1.0000
0.5000
0.0000 M CO ng/'ml 10ng/ml 50 ng/'ml 100 ngj'ml 200 ng/'ml 500 ngJml 100Qng..'ml
Figure 9: Bar graph shows the absorbance values from second experiment of flasks treated with glutaraldehyde for immobilization of antibodies and subjected to ELISA reagents to determine binding capacity of A-9-THC.

Figure 10
48
Experiment 3 of Binding Capacity of Extraction Device
3.5000 -,
3.0000
2.5000
E e 2 2.0000
» u c (E •£ 1.5000 o • XI
<
1.0000
0.5000
0.0000 T. 0.0 ng/ml 10ng>'ml 50 ng/'ml 100ng/ml 200 ngMil 500 ng/'ml 1000ng/ml
Figure 10: Bar graph shows the absorbance values from third experiment of flasks treated with glutaraldehyde for immobilization of antibodies and subjected to ELISA reagents to determine binding capacity of A-9-THC.

Figure 11
Experiment 4 of Binding Capacity of Extraction Device
3.EQ0C
.0000
2.5000
E c o 2.0000
c
f 1.5000
.a
1.0000
0.5000
0.0000 0.0 ng>'ml 10ngr'ml 50 ng/ml 100 ng/ml 200 ng/'ml 500 ng/ml 1000 ng/ml
THC Concentration
Figure 11: Bar graph shows the absorbance values from fourth experiment of flasks treated with glutaraldehyde for immobilization of antibodies and subjected to ELISA reagents to determine binding capacity of A-9-THC.

50
Figure 12
Experiment 5 of Binding Capacity of Extraction Device
3.5000
3.0G0G
2.S00C
E c o 2.0000
•£ 1.5000 o « •a
1.0000
0.5000
0.0000 0.0 ng>'ml 10ng/ml E-Q ng/ml 100ng/'ml 200 ng/'ml 500 ngAnl 1000 ng/ml
THC Concentration
Figure 12: Bar graph shows the absorbance values from fifth experiment of flasks treated with glutaraldehyde for immobilization of antibodies and subjected to ELISA reagents to determine binding capacity of A-9-THC.

Table 4
51
Mean Abs.
Values
0.0 ng/ml 3.1321 3.4588 3.1855 2.8851 3.0001
3.1323
10 ng/ml 2.1056 2.8121
2.6996 2.4439 2.8211
2.5765
50 ng/ml 1.9555 1.8663 1.7063 1.8850 1.9232
1.8673
100 ng/ml 0.6201 0.7452 0.5332 0.5002 0.5330
0.6063
200 ng/ml 0.2860 0.2956
0.1569 0.1877 0.1596
0.2172
500 ng/ml 0.0145 0.0289 0.0097 0.0180 0.0433
0.0229
1000 ng/ml 0.0023 0.0010 0.0005 0.0013 0.0023
0.0015
Table 4: Original absorbance values from five experiments of flasks treated with ELISA reagents in determining capacity of A-9-THC to be bound by extraction devices.

Figure 13
52
0-
__
( 1
(
1
1
I
1
I
1
I
1 1 1 0 ngtoil 10 ng/nil 50 ng/hii 1Q0ng/iiil 200 ng/hil 500ng/ml 1000ng/ml
Figure 13: Error bars show variations of absorbance readings from binding capacity experiments using the extraction flasks. As the concentration of A-9-THC increases, the variation becomes smaller as more binding sites are unavailable for binding the THC derivative that generates the color change.

53
Table 5
PERCENT YIELD DATA for THC EXPERIMENTS
EXP1 EXP 2 EXP 3 EXP 4 EXP 5
Mean ng/ml 15.3 13.1 13.0 12.6 13.8
Avg. % Yield
% Yield 0.61 0.52 0.52 0.50 0.55
0.54
PERCENT YIELD DATA for THCA EXPERIMENTS
EXP1 EXP 2 EXP 3 EXP 4 EXP 5
Mean ng/ml 12.9 9.3 12.6 11.5 12.8
Avg. % Yield
% Yield 0.52 0.37 0.50 0.46 0.51
0.47
Table 5: Shows the average percent recovery in ng/ml of A-9-THC and A-9-THCA when compared to a direct standard at a concentration of 25 ng/ml. Data is from five experiments of 10 samples individually spiked and carried through the glutaraldehyde antibody bound procedure.

54
Table 6
Quantify Sample Summary Report Sample List: C:\TurboMass\USMFSC.PRO\SampleDB\072707A Last Modified: Monday Jul 27 14:48:35 2007 Method: C:\TurboMass\USMFSC\MethDB\THC Printed: Fri Jul 27 10:48:51 2007
Sample Name: 072707A1 THC
Sample Qualifiers Cone. RT P/F ng/ml
Sample ID: 25 ng/ml CAL1 11.13 Pass 25
Sample Name: 072707A2 THC
Sample ID: Spike 1 11.14 Pass 14.5
Sample Name: 072707A3 THC
Sample ID: Spike 2 11.13 Pass 17.3
Sample Name: 072707A4 THC
Sample ID: Spike 3 11.13 Pass 13.4
Sample Name: 072707A5 THC
Sample ID: Spike 4 11.14 Pass 15.9
Sample Name: 072707A6 THC
Sample ID: Spike 5 11.13 Pass 18.2
Sample Name: 072707A7 THC
Sample ID: Spike 6 11.13 Pass 14.9
Sample Name: 072707A8 THC
Sample ID: Spike 7 11.13 Pass 13.7
Sample Name: 072707A9 THC
Sample ID: Spike 8 11.13 Pass 18.8
Sample Name: 072707A10 THC
Sample ID: Spike 9 11.13 Pass 11.6
Sample Name: 072707A11 THC
Sample ID: Spike 10 11.13 Pass 15.1
Table 6: Experiment 1 of percent yield studies for A-9-THC. The first injection was a direct 25 ng/ml standard. The 10 subsequent injections were compared to the direct standard for determination of A-9-THC yield from extraction devices.
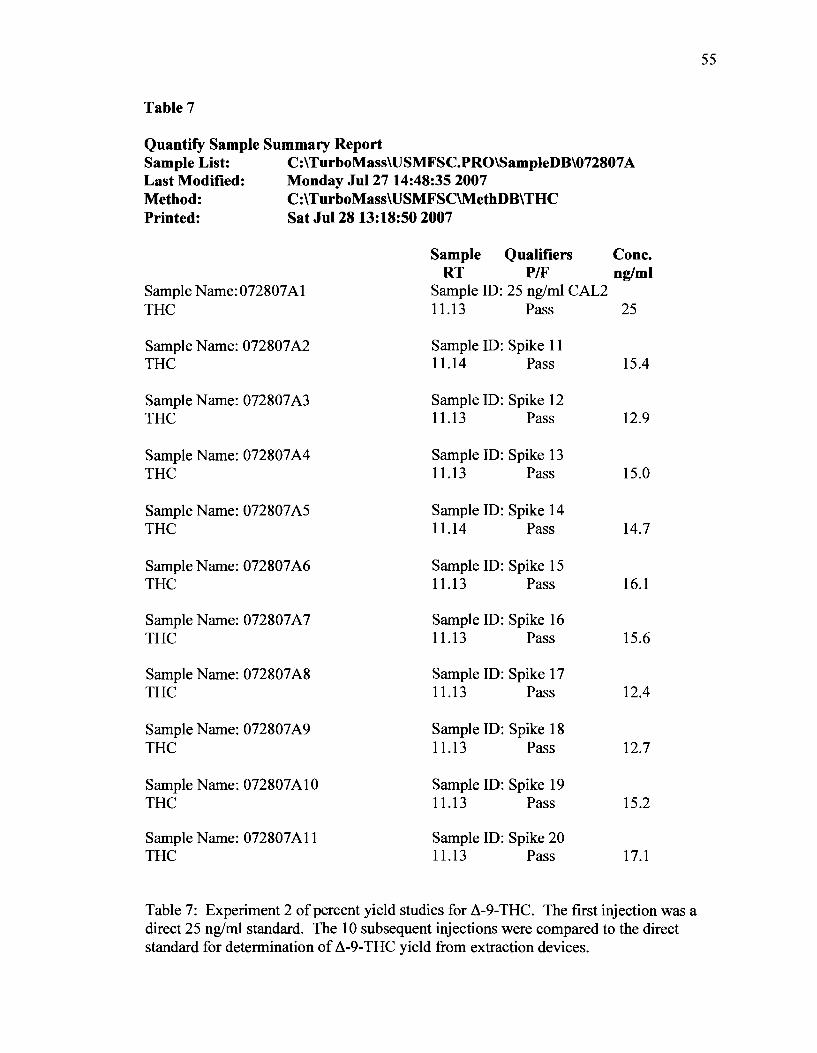
55
Table 7
Quantify Sample Summary Report Sample List: C:\TurboMass\USMFSC.PRO\SampleDB\072807A Last Modified: Monday Jul 27 14:48:35 2007 Method: C:\TurboMass\USMFSC\MethDB\THC Printed: Sat Jul 28 13:18:50 2007
Sample Qualifiers Cone. RT P/F ng/ml
Sample Name: 072807A1 Sample ID: 25 ng/ml CAL2 THC 11.13 Pass 25
Sample Name: 072807A2 Sample ID: Spike 11 THC 11.14 Pass 15.4
Sample Name: 072807A3 Sample ID: Spike 12 THC 11.13 Pass 12.9
Sample Name: 072807A4 Sample ID: Spike 13 THC 11.13 Pass 15.0
Sample Name: 072807A5 Sample ID: Spike 14 THC 11.14 Pass 14.7
Sample Name: 072807A6 Sample ID: Spike 15 THC 11.13 Pass 16.1
Sample Name: 072807A7 Sample ID: Spike 16 THC 11.13 Pass 15.6
Sample Name: 072807A8 Sample ID: Spike 17 THC 11.13 Pass 12.4
Sample Name: 072807A9 Sample ID: Spike 18 THC 11.13 Pass 12.7
Sample Name: 072807A10 Sample ID: Spike 19 THC 11.13 Pass 15.2
Sample Name: 072807A11 Sample ID: Spike 20 THC 11.13 Pass 17.1
Table 7: Experiment 2 of percent yield studies for A-9-THC. The first injection was a direct 25 ng/ml standard. The 10 subsequent injections were compared to the direct standard for determination of A-9-THC yield from extraction devices.

56
Table 8
Quantify Sample Summary Report Sample List: C:\TurboMass\USMFSC.PRO\SampleDB\073007A Last Modified: Monday Jul 27 14:48:35 2007 Method: C:\TurboMass\USMFSC\MethDB\THC Printed: Tue Jul 30 19:32:30 2007
Sample Name: 073007A1 THC
Sample Qualifiers Cone. RT P/F ng/ml
Sample ID: 25 ng/ml CAL3 11.13 Pass 25
Sample Name: 073007A2 THC
Sample ID: Spike 21 11.14 Pass 15.0
Sample Name: 073007A3 THC
Sample ID: Spike 22 11.13 Pass 15.3
Sample Name: 073007A4 THC
Sample ID: Spike 23 11.13 Pass 12.1
Sample Name: 073007A5 THC
Sample ID: Spike 24 11.14 Pass 12.9
Sample Name: 073007A6 THC
Sample ID: Spike 25 11.13 Pass 17.2
Sample Name: 073007A7 THC
Sample ID: Spike 26 11.13 Pass 11.0
Sample Name: 073007A8 THC
Sample ID: Spike 27 11.13 Pass 15.8
Sample Name: 073007A9 THC
Sample ID: Spike 28 11.13 Pass 13.0
Sample Name: 073007A10 THC
Sample ID: Spike 29 11.13 Pass 14.3
Sample Name: 073007A11 THC
Sample ID: Spike 30 11.13 Pass 17.5
Table 8: Experiment 3 of percent yield studies for A-9-THC. The first injection was a direct 25 ng/ml standard. The 10 subsequent injections were compared to the direct standard for determination of A-9-THC yield from extraction devices.

57
Table 9
Quantify Sample Summary Report Sample List: C:\TurboMass\USMFSC.PRO\SampleDB\073107A Last Modified: Monday Jul 27 14:48:35 2007 Method: C:\TurboMass\USMFSC\MethDB\THC Printed: Tue Jul 31 16:12:33 2007
Sample Name: 073107A1 THC
Sample Qualifiers Cone. RT P/F ng/ml
Sample ID: 25 ng/ml CAL 4 11.13 Pass 25
Sample Name: 073107A2 THC
Sample ID: Spike 31 11.14 Pass 12.6
Sample Name: 073107A3 THC
Sample ID: Spike 32 11.13 Pass 11.8
Sample Name: 073107A4 THC
Sample ID: Spike 33 11.13 Pass 13.3
Sample Name: 073107A5 THC
Sample ID: Spike 34 11.14 Pass 12.0
Sample Name: 073107A6 THC
Sample ID: Spike 35 11.13 Pass 15.9
Sample Name: 073107A7 THC
Sample ID: Spike 36 11.13 Pass 14.1
Sample Name: 073107A8 THC
Sample ID: Spike 37 11.13 Pass 12.6
Sample Name: 073107A9 THC
Sample ID: Spike 38 11.13 Pass 13.4
Sample Name: 073107A10 THC
Sample ID: Spike 39 11.13 Pass 11.6
Sample Name: 073107A11 THC
Sample ID: Spike 40 11.13 Pass 14.2
Table 9: Experiment 4 of percent yield studies for A-9-THC. The first injection was a direct 25 ng/ml standard. The 10 subsequent injections were compared to the direct standard for determination of A-9-THC yield from extraction devices.

58
Table 10
Quantify Sample Summary Report Sample List: C:\TurboMass\USMFSC.PRO\SampleDB\080107A Last Modified: Monday Jul 27 14:48:35 2007 Method: C:\TurboMass\USMFSC\MethDB\THC Printed: Wed Aug 01 17:12:49 2007
Sample Qualifiers Cone. RT P/F ng/ml
Sample Name:080107Al Sample ID: 25 ng/ml CAL 5 THC 11.13 Pass 25
Sample Name: 080107A2 Sample ID: Spike 41 THC 11.14 Pass 16.1
Sample Name: 080107A3 Sample ID: Spike 42 THC 11.13 Pass 12.0
Sample Name: 080107A4 Sample ID: Spike 43 THC 11.13 Pass 13.6
Sample Name: 080107A5 Sample ID: Spike 44 THC 11.14 Pass 13.6
Sample Name: 080107A6 Sample ID: Spike 45 THC 11.13 Pass 13.2
Sample Name: 080107A7 Sample ID: Spike 46 THC 11.13 Pass 14.1
Sample Name: 080107A8 Sample ID: Spike 47 THC 11.13 Pass 16.2
Sample Name: 080107A9 Sample ID: Spike 48 THC 11.13 Pass 13.7
Sample Name: 080107A10 Sample ID: Spike 49 THC 11.13 Pass 14.2
Sample Name: 080107A11 Sample ID: Spike 50 THC 11.13 Pass 16.3
Table 10: Experiment 5 of percent yield studies for A-9-THC. The first injection was a direct 25 ng/ml standard. The 10 subsequent injections were compared to the direct standard for determination of A-9-THC yield from extraction devices.

59
Table 11
Quantify Sample Summary Report Sample List: C:\TurboMass\USMFSC.PRO\SampleDB\072707A Last Modified: Monday Jul 27 14:48:35 2007 Method: C:\TurboMass\USMFSCYMethDB\THCA Printed: Fri Jul 27 10:48:51 2007
Sample Name:072707A12 THCA
Sample Qualifiers Cone. RT P/F ng/ml
Sample ID: 25 ng/ml CAL 1 13.07 Pass 25
Sample Name: 072707A13 THCA
Sample ID: Spike 1 13.08 Pass 12.2
Sample Name: 072707A14 THCA
Sample ID: Spike 2 13.07 Pass 10.5
Sample Name: 072707A15 THCA
Sample ID: Spike 3 13.07 Pass 11.7
Sample Name: 072707A16 THCA
Sample ID: Spike 4 13.07 Pass 12.0
Sample Name: 072707A17 THCA
Sample ID: Spike 5 13.07 Pass 10.3
Sample Name: 072707A18 THCA
Sample ID: Spike 6 13.07 Pass 11.3
Sample Name: 072707A19 THCA
Sample ID: Spike 7 13.07 Pass 14.0
Sample Name: 072707A20 THCA
Sample ID: Spike 8 13.07 Pass 14.6
Sample Name: 072707A21 THCA
Sample ID: Spike 9 13.07 Pass 10.2
Sample Name: 072707A22 THCA
Sample ID: Spike 10 13.07 Pass 12.9
Table 11: Experiment 1 of percent yield studies for A-9-THCA. The first injection was a direct 25 ng/ml standard. The 10 subsequent injections were compared to the direct standard for determination of A-9-THCA yield from extraction devices.

60
Table 12
Quantify Sample Summary Report Sample List: C:\TurboMass\USMFSC.PRO\SampleDB\072807A Last Modified: Monday Jul 27 14:48:35 2007 Method: C:\TurboMass\USMFSC\MethDB\THCA Printed: Sat Jul 28 13:18:50 2007
Sample Name:072807A12 THCA
Sample Qualifiers Cone. RT P/F ng/ml
Sample ID: 25 ng/ml CAL 2 13.07 Pass 25
Sample Name: 072807A13 THCA
Sample ID: Spike 11 13.07 Pass 15.4
Sample Name: 072807A14 THCA
Sample ID: Spike 12 13.08 Pass 12.9
Sample Name: 072807A15 THCA
Sample ID: Spike 13 13.07 Pass 15.0
Sample Name: 072807A16 THCA
Sample ID: Spike 14 13.07 Pass 14.7
Sample Name: 072807A17 THCA
Sample ID: Spike 15 13.07 Pass 16.1
Sample Name: 072807A18 THCA
Sample ID: Spike 16 13.07 Pass 15.6
Sample Name: 072807A19 THCA
Sample ID: Spike 17 13.08 Pass 12.4
Sample Name: 072807A20 THCA
Sample ID: Spike 18 13.07 Pass 12.7
Sample Name: 072807A21 THCA
Sample ID: Spike 19 13.07 Pass 15.2
Sample Name: 072807A22 THCA
Sample ID: Spike 20 13.07 Pass 17.1
Table 12: Experiment 2 of percent yield studies for A-9-THCA. The first injection was a direct 25 ng/ml standard. The 10 subsequent injections were compared to the direct standard for determination of A-9-THCA yield from extraction devices.

61
Table 13
Quantify Sample Summary Report Sample List: C:\TurboMass\USMFSC.PRO\SampleDB\073007A Last Modified: Monday Jul 27 14:48:35 2007 Method: C:\TurboMass\USMFSC\MethDB\THCA Printed: Mon Jul 30 16:12:33 2007
Sample Name: 073007A12 THCA
Sample Qualifiers Cone. RT P/F ng/ml
Sample ID: 25 ng/ml CAL 3 13.07 Pass 25
Sample Name: 073007A13 THCA
Sample ID: Spike 21 13.07 Pass 13.6
Sample Name: 073007A14 THCA
Sample ID: Spike 22 13.08 Pass 14.0
Sample Name: 073007A15 THCA
Sample ID: Spike 23 13.07 Pass 13.7
Sample Name: 073007A16 THCA
Sample ID: Spike 24 13.07 Pass 12.6
Sample Name: 073007A17 THCA
Sample ID: Spike 25 13.08 Pass 13.1
Sample Name: 073007A18 THCA
Sample ID: Spike 26 13.08 Pass 14.9
Sample Name: 073007A19 THCA
Sample ID: Spike 27 13.08 Pass 15.2
Sample Name: 073007A20 THCA
Sample ID: Spike 28 13.07 Pass 13.4
Sample Name: 073007A21 THCA
Sample ID: Spike 29 13.07 Pass 10.3
Sample Name: 073007A22 THCA
Sample ID: Spike 30 13.07 Pass 11.6
Table 13: Experiment 3 of percent yield studies for A-9-THCA. The first injection was a direct 25 ng/ml standard. The 10 subsequent injections were compared to the direct standard for determination of A-9-THCA yield from extraction devices.

62
Table 14
Quantify Sample Summary Report Sample List: C:\TurboMass\USMFSC.PRO\SampleDB\073107A Last Modified: Monday Jul 27 14:48:35 2007 Method: C:\TurboMass\USMFSC\MethDB\THCA Printed: Tue Jul 31 19:32:303 2007
Sample Name: 073107A12 THCA
Sample Qualifiers Cone. RT P/F ng/ml
Sample ID: 25 ng/ml CAL 4 13.07 Pass 25
Sample Name: 073107A13 THCA
Sample ID: Spike 31 13.08 Pass 10.6
Sample Name: 073107A14 THCA
Sample ID: Spike 32 13.07 Pass 11.4
Sample Name: 073107A15 THCA
Sample ID: Spike 33 13.07 Pass 11.5
Sample Name: 073107A16 THCA
Sample ID: Spike 34 13.07 Pass 12.0
Sample Name: 073107A17 THCA
Sample ID: Spike 35 13.07 Pass 13.2
Sample Name: 073107A18 THCA
Sample ID: Spike 36 13.08 Pass 11.9
Sample Name: 073107A19 THCA
Sample ID: Spike 37 13.07 Pass 10.6
Sample Name: 073107A20 THCA
Sample ID: Spike 38 13.07 Pass 13.0
Sample Name: 073107A21 THCA
Sample ID: Spike 39 13.07 Pass 11.2
Sample Name: 073107A22 THCA
Sample ID: Spike 40 13.08 Pass 11.5
Table 14: Experiment 4 of percent yield studies for A-9-THCA. The first injection was a direct 25 ng/ml standard. The 10 subsequent injections were compared to the direct standard for determination of A-9-THCA yield from extraction devices.

63
Table 15
Quantify Sample Summary Report Sample List: C:\TurboMass\USMFSC.PRO\SampleDB\080107A Last Modified: Monday Jul 27 14:48:35 2007 Method: C:\TurboMass\USMFSC\MethDB\THCA Printed: Wed Aug 0117:12:49 2007
Sample Name:080107Al THCA
Sample Qualifiers Cone. RT P/F ng/ml
Sample ID: 25 ng/ml CAL 5 13.07 Pass 25
Sample Name: 080107A2 THCA
Sample ID: Spike 41 13.07 Pass 12.4
Sample Name: 080107A3 THCA
Sample ID: Spike 42 13.08 Pass 11.7
Sample Name: 080107A4 THCA
Sample ID: Spike 43 13.11 Pass 11.9
Sample Name: 080107A5 THCA
Sample ID: Spike 44 13.07 Pass 13.3
Sample Name: 080107A6 THCA
Sample ID: Spike 45 13.08 Pass 13.2
Sample Name: 080107A7 THCA
Sample ID: Spike 46 13.07 Pass 12.1
Sample Name: 080107A8 THCA
Sample ID: Spike 47 13.07 Pass 13.1
Sample Name: 080107A9 THCA
Sample ID: Spike 48 13.08 Pass 11.0
Sample Name: 080107A10 THCA
Sample ID: Spike 49 13.07 Pass 13.2
Sample Name: 080107A11 THCA
Sample ID: Spike 50 13.08 Pass 13.8
Table 15: Experiment 5 of percent yield studies for A-9-THCA. The first injection was a direct 25 ng/ml standard. The 10 subsequent injections were compared to the direct standard for determination of A-9-THC A yield from extraction devices.

64
Figure 14
Effect of Incresed THC Concentration on Binding Capacity for THCA
150
110
C
to C _o ra ^ c a> u c o o a>
Q. CO
70
30
-10
-•-THC -•-THCA
m _2D_ JHL ng/ml ng/ml
_8D_ JQ0_ 15JL
ng/ml ng/ml ng/ml ng/ml ng/ml
Found Concentrations: ng/ml
ng/ml
Figure 14: Demonstrates the effect of increasing the concentration of A-9-THC on the binding capacity of A-9-THCA by the glutaraldehyde bound antibody in an extraction device. The antibody is monoclonal for A-9-THC and has a greater affinity for that analyte over A-9-THCA.

65
Linearity of Individual Extracted Analytes
One ml of negative synthetic blood was added to one treated flask as a negative
sample and 1 ml aliquots of spiked synthetic blood with concentrations of 5,10,30, and
50 ng of A-9-THC were added to glutaraldehyde treated flasks. The extraction of these
spiked samples produced a linear curve with an r value of 0.998 (see Figure 15). The
same experiment was run with A-9-THCA at 2, 5, 20, 50 ng/ml which also produced a
linear curve with an r value of 0.997 (see Figure 16).
Linearity Using Deuterated Internal Standard
Seven 1 ml synthetic blood aliquots were spiked with 25 ng of A-9-THC-D3 as an
internal standard and then with A-9-THC at concentrations of 0, 2, 5, 10, 25 and 50 ng/ml
to test extraction of both analytes and determine linearity. The extraction produced a
linear curve with a r value of 0.995 (see Figure 17).
The same experiment was run with A-9-THCA-D3 and A-9-THCA, with the
exception of a 1 ng sample. Results were also linear to 50 ng/ml.
Analyses of Postmortem Samples
The first group of postmortem samples analyzed was those secured from the
Mississippi Crime Laboratory were those samples reported as "None Detected". These
10 samples were analyzed on two different days using the extraction. All samples were
found to be negative for A-9-THC. These findings are in agreement with the results
reported by the Mississippi Crime Laboratory (see Tables 16 and 17). The negative
findings also demonstrate that none of the solutions or hardware used during the
experiments were or became contaminated with analytes of interest.

Figure 15
. 12-APR-200" Compound 1 name: THC Coefficient of Determination: 0.997082 Calibration curve: 66.0536 * x + 0 Response type: External Std, Area Curve type: Linear, Origin: Force, Weighting: Null, Axis trans: None
3.30e3
+ 11:20:16
Response
1 1 1 1 1 1 1 1 1 1 1 1 1 1 1
5.0 15.0 i i I i i i i |
25.0 35.0 45.0 ng/ml
Figure 15: Calibration curve of A-9-THC extracted as a single analyte. The lvalue is 0.997082 which exceeds the criteria of > 0.985 to be considered linear. The range is linear to 50 ng/ml.

67
Figure 16
. 13-MAY-200" + 15:28:18 Compound 1 name: THCA Coefficient of Determination: 0.993907 Calibration curve: 2.98898 *x + 0 Response type: External Std, Area Curve type: Linear, Origin: Force, Weighting: , Axis trans: None
Response
11 i 111 11 1 1 1 1 1 1 1 1 1 1 1 1 1 111 11 i 11 11 i i i 11 11 11 11 11 i | ng/ml
5.0 15.0 25.0 35.0 45.0
Figure 16: Calibration curve of A-9-THCA extracted as a single analyte. The r2 value is 0.993907 which exceeds the criteria of > 0.985 to be considered linear. The range is linear to 50 ng/ml.

68
Figure 17
, 9-APR-200" Compound 1 name: THC Coefficient of Determination: 0.998088 Calibration curve: 0.0187199 *x + 0 Response type: Internal std (Ref 2) , Area * (IS Cone. / IS Area) Curve type: Linear, Origin: Force, Weighting: Null, Axis trans: None
0.947
+ 12:59:50
Response-]
T 35.0
ng/ml
Figure 17: Shows a linear curve of A-9-THC using the internal standard method. Extracted calibrators ranged from 2 - 5 0 ng/ml.

Table 16
Quantify Sample Summary Report Sample List: C:\TurboMass\USMFSC.PRO\SampleDB\083007A Last Modified: Monday Bug 27 14:48:35 2007 Method: C:\TurboMass\USMFSC\MethDB\THC Printed: Fri Bug 31 16:40:21 2007
Sample Name: THC THC-D3 Sample Name: THC THC-D3 Sample Name: THC THC-D3 Sample Name: THC THC-D3 Sample Name: THC THC-D3 Sample Name: THC THC-D3 Sample Name: THC THC-D3 Sample Name: THC THC-D3 Sample Name: THC THC-D3 Sample Name: THC THC-D3 Sample Name: THC THC-D3 Sample Name: THC THC-D3
083007A1
083007A2
083007 A3
083007A4
083007 A5
083007A6
083007A7
083007A8
083007A9
083007A10
083007A11
083007A12
Sample Qualifiers Cone. RT P/F ng/ml
Sample ID: 0 ng/ml BLK NF Fail 0.0 11.12 Pass 1.0 Sample ID: 3 ng/ml CAL 11.11 Pass 2.8 11.12 Pass 1.0 Sample ID: 10 ng/ml CAL 11.11 Pass 10.8 11.09 Pass 1.0 Sample ID: 20 ng/ml CAL 11.11 Pass 19.6 11.08 Pass 1.0 Sample ID: 50 ng/ml CAL 11.11 Pass 49.6 11.08 Pass 1.0 Sample ID: 5 ng/ml CTRL 11.11 Pass 4.9 11.08 Pass 1.0 Sample ID: FSC1A (13995) 11.11 Pass 5.2 11.07 Pass 1.0 Sample ID: FSC2A (8516) NF Fail 0 11.08 Pass 1.0 Sample ID: FSC 3A (13298) NF Fail 0 11.08 Pass 1.0 Sample ID: FSC 4A (14876) NF Fail 0 11.08 Pass 1.0 Sample ID: FSC 5A (14886) NF Fail 0 11.08 Pass 1.0 Sample ID: FSC 6A (6342) NF Fail 0 11.09 Pass 1.0

70
Table 16, (continued)
Sample Name: THC THC-D3 Sample Name: THC THC-D3 Sample Name: THC THC-D3 Sample Name: THC THC-D3 Sample Name: THC THC-D3
083007A13
083007A14
083007A15
083007A16
083007A17
Sample ID: NF 11.08 Sample ID: NF 11.09 Sample ID: NF 11.10 Sample ID: NF 11.09 Sample ID: NF 11.08
FSC7A(8011) Fail Pass
FSC8A(8106) Fail Pass
FSC 9A (8245) Fail Pass
FSC 10 (8464) Fail Pass
30 ng/ml CTRL Pass Pass
0 1.0
0 1.0
0 1.0
0 1.0
28.6 1.0
Table 16: Represents first run of samples from the Mississippi Crime Laboratory reported as "None Detected" for A-9-THC. Page 1 shows the calibrators, low control and 5 samples. Page 2 shows 5 samples and the high control. Results match results reported from the Mississippi Crime Laboratory.

71
Table 17
Quantify Sample Summary Report Sample List: C:\TurboMass\USMFSC.PRO\SampleDB\083007B Last Modified: Monday Bug 27 14:48:35 2007 Method: C:\TurboMass\USMFSC\MethDB\THC Printed: Fri Bug 3116:52:33 2007
Sample Name: 083007B1 THC THC-D3 Sample Name: 083007B2 THC THC-D3 Sample Name: 083007B3 THC THC-D3 Sample Name: 083007B4 THC THC-D3 Sample Name: 083007B5 THC THC-D3 Sample Name: 083007B6 THC THC-D3 Sample Name: 083007B7 THC THC-D3 Sample Name: 083007B8 THC THC-D3 Sample Name: 083007B9 THC THC-D3 Sample Name: 083007B10 THC THC-D3 Sample Name: 083007B11 THC THC-D3 Sample Name: 083007B12 THC THC-D3
Sample Qualifiers ' RT P/F
Sample ID: 0 ng/ml BLK NF Fail 11.12 Pass Sample ID: 3 ng/ml CAL 11.11 Pass 11.12 Pass Sample ID: 10 ng/ml CAL 11.11 Pass 11.09 Pass Sample ID: 20 ng/ml CAL 11.11 Pass 11.08 Pass Sample ID: 50 ng/ml CAL 11.11 Pass 11.08 Pass Sample ID: 5 ng/ml CTRL 11.11 Pass 11.08 Pass Sample ID: FSC IB (13995) 11.11 Fail 11.07 Pass Sample ID: FSC 2B (8516) NF Fail 11.08 Pass Sample ID: FSC 3B (13298) NF Fail 11.08 Pass Sample ID: FSC 4B (14876) NF Fail 11.08 Pass Sample ID: FSC 5B (14886) NF Fail 11.08 Pass Sample ID: FSC 6B (6342) NF Fail 11.09 Pass
Cone. ng/ml
0.0 1.0
3.0 1.0
10.1 1.0
19.8 1.0
50.3 1.0
5.1 1.0
0 1.0
0 1.0
0 1.0
0 1.0
0 1.0
0 1.0

72
Table 17, (continued)
Sample Name: THC THC-D3 Sample Name: THC THC-D3 Sample Name: THC THC-D3 Sample Name: THC THC-D3 Sample Name: THC THC-D3
083007B13
083007B14
083007B15
083007B16
083007B17
Sample ID: FSC 7B (8011) NF Fail 11.08 Pass Sample ID: FSC 8B (8106) NF Fail 11.09 Pass Sample ID: FSC 9B (8245) NF Fail 11.10 Pass Sample ID: FSC 10B (8464) NF Fail 11.09 Pass Sample ID: 30 ng/ml CTRL NF Pass 11.08 Pass
0 1.0
0 1.0
0 1.0
0 1.0
32 1.0
Table 17: Represents second run of samples from the Mississippi Crime Laboratory reported as "None Detected" for A-9-THC. Page 1 shows the calibrators, low control and 5 samples. Page 2 shows 5 samples and the high control. Results match results reported from the Mississippi Crime Laboratory.

73
The next group of samples from the Mississippi Crime Laboratory run was those
reported with quantitative values for A-9-THC. These ten samples were run on two
separate occasions along with calibrators and controls (see Table 18). All samples were
found to contain A-9-THC using the extraction device and all met the criteria for
considered reportable (see Figure 18).
Statistical analysis was performed using the Paired t test. Group A was compared
to the values reported by the Mississippi Crime Laboratory and a significant difference
was found. The critical value for t$\ ^ is 3.250. The statistical analysis found the Paired
t value to be 4.384 (see Table 20). The average difference between the groups was 0.32
ng/ml. The largest difference was 0.7 ng/ml while the smallest difference was 0.2 ng/ml.
A second run of the same samples using a different set of devices was performed
and analyzed statistically as stated above (see Table 19). Again a significant difference
was found were the Paired t value was calculated to be 6.034 (see Table 21). The
average difference in concentration was 0.35 ng/ml with a range of 0.1 to 0.6 ng/ml.
All samples received from the Mississippi Crime Laboratory were run for
A-9-THCA (see Figure 19). No A-9-THCA was found in two of the samples which
agreed with values reported by the crime laboratory (see Tables 22-24). A second run
was performed with similar results (see Tables 25-27).
A Paired t test was performed for the A-9-THCA results in the same manner as
for A-9-THC. The first group showed a significant with a Paired / value of 9.596 where t
.oi(27) is 2.771 (see Table 28). The second run was subjected to the same statistical
analysis also demonstrating a significant difference with the critical t value being 8.827
(see Table 29).

Table 18
Summary Report C:\TurboMass\USMFSCPRO\SampleDB\082707A Monday Jul 27 14:48:35 2007 C:\TurboMass\USMFSC\MethDB\THC Fri Aug 31 14:48:51 2007
Sample Name: 082707A1 THC THC-D3 Sample Name: 082707A2 THC THC-D3 Sample Name: 082707A3 THC THC-D3 Sample Name: 082707A4 THC THC-D3 Sample Name: 082707A5 THC THC-D3 Sample Name: 082707A6 THC THC-D3 Sample Name: 082707A7 THC THC-D3 Sample Name: 082707A8 THC THC-D3 Sample Name: 082707A9 THC THC-D3 Sample Name: 082707A10 THC THC-D3 Sample Name: 082707A11 THC THC-D3
Sample Qualifiers < RT P/F
Sample ID: 0 ng/ml CAL 1 11.13 Fail 11.12 Pass Sample ID: 3 ng/ml CAL 11.14 Pass 11.12 Pass Sample ID: 10 ng/ml CAL 11.13 Pass 11.12 Pass Sample ID: 20 ng/ml CAL 11.13 Pass 11.12 Pass Sample ID: 50 ng/ml CAL 11.14 Pass 11.12 Pass Sample ID: 5 ng/ml CTRL 111.14 Pass 11.12 Pass Sample ID: FSC11A (3330) 11.14 Pass 11.12 Pass Sample ID: FSC 12 A (4086] 11.13 Pass 11.12 Pass Sample ID: FSC 13 A (6279^ 11.13 Pass 11.12 Pass Sample ID: FSC 14 A (6349] 11.13 Pass 11.12 Pass Sample ID: FSC 15 A (6352] 11.13 Pass 11.12 Pass
Cone. ng/ml
0 1.0
3.11 1.0
8.71 1.0
19.93 1.0
49.88 1.0
5.3 1.0
1.8 1.0
10.3 1.0
1.4 1.0
2.6 1.0
3.3 1.0
Quantify Sample Sample List: Last Modified: Method: Printed:

75
Table 18, (continued)
Sample Name: 082707A12 THC THC-D3 Sample Name: 082707A13 THC THC-D3 Sample Name: 082707A14 THC THC-D3 Sample Name: 082707A15 THC THC-D3 Sample Name: 082707A16 THC THC-D3 Sample Name: 082707A17 THC THC-D3
Table 18: Run B of A-9-THC samples from Mississippi Crime Laboratory reported with quantitated results. Table shows calibrators, controls and individual sample results. All results are from analyses conducted using the extraction device bound with monoclonal A-9-THC antibodies. All calibrators, controls and samples met criteria for confirmation and statistical analysis.
Sample ID: 11.13 11.12 Sample ID: 11.13 11.12 Sample ID: 11.13 11.12 Sample ID: 11.13 11.12 Sample ID: 11.13 11.12 Sample ID: 11.13 11.12
FSC16A(8573) Pass 5.0 Pass 1.0
FSC 17 A (1778) Pass 2.8 Pass 1.0
FSC 18 A (14275) Pass 3.1 Pass 1.0
FSC 19 A (2946) Pass 1.8 Pass 1.0
FSC 20 A (15667) Pass 8.1 Pass 1.0
30 ng/ml CTRL Pass 27.0 Pass 1.0

76
Table 19
Quantify Sample Summary Report Sample List: C:\TurboMass\USMFSC.PRO\SampleDB\082707A Last Modified: Monday Jul 27 14:48:35 2007 Method: C:\TurboMass\USMFSC\MethDB\THC Printed: Fri Aug 3114:48:51 2007
Sample Qualifiers Cone.
Sample Name: 082707B1 THC THC-D3 Sample Name: 082707B2 THC THC-D3 Sample Name: 082707B3 THC THC-D3 Sample Name: 082707B4 THC THC-D3 Sample Name: 082707B5 THC THC-D3 Sample Name: 082707B6 THC THC-D3 Sample Name: 082707B7 THC THC-D3 Sample Name: 082707B8 THC THC-D3 Sample Name: 082707B9 THC THC-D3 Sample Name: 082707B10 THC THC-D3 Sample Name: 082707B11 THC THC-D3
RT P/F i Sample ID: 0 ng/ml CAL 1 11.13 Fail 11.12 Pass Sample ID: 3 ng/ml CAL 11.14 Pass 11.12 Pass Sample ID: 10 ng/ml CAL 11.13 Pass 11.12 Pass Sample ID: 20 ng/ml CAL 11.13 Pass 11.12 Pass Sample ID: 50 ng/ml CAL 11.14 Pass 11.12 Pass Sample ID: 5 ng/ml CTRL 111.14 Pass 11.12 Pass Sample ID: FSC1 IB (3330) 11.14 Pass 11.12 Pass Sample ID: FSC 12 B (4086) 11.13 Pass 11.12 Pass Sample ID: FSC 13 B (6279) 11.13 Pass 11.12 Pass Sample ID: FSC 14 B (6349) 11.13 Pass 11.12 Pass Sample ID: FSC 15 B (6352) 11.13 Pass 11.12 Pass
ng/ml
0 1.0
2.96 1.0
8.95 1.0
20.23 1.0
49.91 1.0
4.6 1.0
1.9 1.0
10.6 1.0
1.4 1.0
2.5 1.0
3.1 1.0

77
Table 19, (continued)
Sample Name: 082707B12 THC THC-D3 Sample Name: 082707B13 THC THC-D3 Sample Name: 082707B14 THC THC-D3 Sample Name: 082707B15 THC THC-D3 Sample Name: 082707B16 THC THC-D3 Sample Name: 082707B17 THC THC-D3
Sample ID: 11.13 11.12 Sample ID: 11.13 11.12 Sample ID: 11.13 11.12 Sample ID: 11.13 11.12 Sample ID: 11.13 11.12 Sample ID: 11.13 11.12
FSC16B(8573) Pass 4.8 Pass 1.0
FSC17B(1778) Pass 2.6 Pass 1.0
FSC 18 B (14275) Pass 3.1 Pass 1.0
FSC 19 B (2946) Pass 2.0 Pass 1.0
FSC 20 B (15667) Pass 7.9 Pass 1.0
30 ng/ml CTRL Pass 31.0 Pass 1.0
Table 19: Run B of A-9-THC samples from Mississippi Crime Laboratory reported with quantitated results. Table shows calibrators, controls and individual sample results. All results are from analyses conducted using the extraction device bound with monoclonal A-9-THC antibodies. All calibrators, controls and samples met criteria for confirmation and statistical analysis.

78
Table 20
Direct-Difference Statistical Evaluation of THC Values:
Testing Group t
Sample Identification
3330 4086 6279 6349 6352 8573 1778
14275 2946 15667
Group Means
CK
MCL Results
X1 2 11 1.6 2.9 3.6 5.4 3
3.5 2.1 8.3
1X1 = 43.4
MCL 4.340
Paired t Ratio
EXP- A Results Difference
X2
1.8 10.3 1.4 2.6 3.3 5
2.8 3.1 1.8 8.1
1X2 = 40.2
EXP-A 4.020
Mean Difference Between Groups (MD) 0.320
Standard Deviation of Difference (SDD)
£ D 2 / N = .15
Standard Error of Differences (SED)
Paired f Ratio =
t oi(9) 3.250
MD/SED = 4.384
(Significant Difference)
SD2 =
MD2 = 0.102
SED =
DX1-X2
0.2 0.7 0.2 0.3 0.3 0.4 0.2 0.4 0.3 0.2
V(£D2/N)-MD2
V.05 = 0.22
SDD/(VN-1)
Difference Squared
D2
0.04 0.49 0.04 0.09 0.09 0.16 0.04 0.16 0.09 004
ZD2 = 1.5
0.073
Table 20: Direct Difference Test (Paired t Test) of first run of THC samples. The test identifies a significant difference between the groups indicating differences in results are not attributable to chance. The average difference between the groups is 0.32 ng/ml.

Table 21
Direct-Difference Statistical Evaluation of THC Values: Testing Group
Sample
Identification 3330 4086 6279 6349 6352 8537 1778 14275 2946 15667
Group Means
B
MCL Results
XI 2 11 1.6 2.9 3.6 5.4 3
3.5 2.1 8.3
XXI =43.4
MCL 4.340
Mean Difference Between Groups (MD]
Standard Deviation of Difference (SDD
£ D 2 / N = .15
Standard Error of Differences (SED)
Paired t Ratio =
t .oi(9) 3.250
= MD/SED = 6.034
(Significant Difference)
Paired t Ratio
EXP- B Results Difference
X2 1.9
10.6 1.4 2.5 3.1 4.8 2.6 3.1 2
7.9 £X2 = 39.9
EXP-B 3.990
0.350
SD2 =
MD2 = 0.123
SED =
DX1-X2 0.1 0.4 0.2 0.4 0.5 0.6 0.1 0.4 0.1 0.4
V(£D2/N)-MD2
V0.03 = 0.173
SDD/(VN-1)
Difference Squared
D2 0.01 0.16 0.04 0.16 0.25 0.36 0.01 0.16 0.01 016
£D2=1.5
0.058
Table 21: Direct Difference Test (Paired t Test) of second run of THC samples. The test identifies a significant difference between the groups indicating the differences in results are not attributable to chance. The average difference between the groups is 0.35 ng/ml.

80
Figure 18
THC Comparisons
12
o>
10
8
• MCL Results j
• Exp1 Results;
D Exp 2 Results
0
r
m i
~l
mill
i _
1 2 3 4 5 6 7 8 9 10 Number of Samples
Figure 18: Comparison of A-9-THC results reported by the Mississippi Crime Laboratory versus separate extractions using the glutaraldehyde treated flasks with A-9-THC monoclonal antibodies. The light blue bar represents results from the Mississippi Crime Laboratory while the purple and white bars represent results using the extraction device. Note there is a slight negative bias using the extraction device.

81
Table 22
Quantify Sample Summary Report Sample List: C:\TurboMass\USMFSC.PRO\SampleDB\082707A Last Modified: Monday Jul 27 14:48:35 2007 Method: C:\TurboMass\USMFSC\MethDB\THCA Printed: Fri Aug 31 15:03:44 2007
Sample Name: 082707A1 THCA THCA-D3 Sample Name: 082707A2 THCA THCA-D3 Sample Name: 082707A3 THCA THCA-D3 Sample Name: 082707A4 THCA THCA-D3 Sample Name: 082707A5 THCA THCA-D3 Sample Name: 082707A6 THCA THCA-D3 Sample Name: 082707A7 THCA THCA-D3 Sample Name: 082707A8 THCA THCA-D3 Sample Name: 082707A9 THCA THCA-D3 Sample Name: 082707A10 THCA THCA-D3 Sample Name: 082707A11 THCA THCA-D3
Sample Qualifiers < RT P/F
Sample ID: 0 ng/ml CAL 1 NF Fail 13.05 Pass Sample ID: 5 ng/ml CAL 13.07 Pass 13.05 Pass Sample ID: 10 ng/ml CAL 13.07 Pass 13.05 Pass Sample ID: 20 ng/ml CAL 13.07 Pass 13.05 Pass Sample ID: 50 ng/ml CAL 13.07 Pass 13.05 Pass Sample ID: 10 ng/ml CTRL 13.07 Pass 13.05 Pass Sample ID: FSC 1 A (3330) NF Pass 13.05 Pass Sample ID: FSC 2 A (4086) 13.07 Pass 13.05 Pass Sample ID: FSC 3 A (6279) 13.07 Pass 13.05 Pass Sample ID: FSC 4 A (6349) 13.07 Pass 13.05 Pass Sample ID: FSC 5 A (6352) 13.07 Pass 13.05 Pass
Cone. ng/ml
0 1.0
4.80 1.0
10.21 1.0
18.98 1.0
49.91 1.0
9.0 1.0
13 1.0
49 1.0
37 1.0
24 1.0
60 1.0

82
Table 22, (continued)
Sample Name: THCA THCA-D3 Sample Name: THCA THCA-D3 Sample Name: THCA THCA-D3 Sample Name: THCA THCA-D3 Sample Name: THCA THCA-D3 Sample Name: THCA THCA-D3
082707A12
082707A13
082707A14
082707A15
082707A16
082707A17
Sample ID: FSC 6 A (8573) 13.07 Pass 49 13.05 Pass 1.0 Sample ID: FSC 7 A (1778) 13.07 Pass 58 13.05 Pass 1.0 Sample ID: FSC 8 A (14275) 13.07 Pass 9 13.05 Pass 1.0 Sample ID: FSC 9 A (2946) 13.07 Pass 22 13.05 Pass 1.0 Sample ID: FSC 10 A (15667) 13.07 Pass 34 13.05 Pass 1.0 Sample ID: 30 ng/ml CTRL 13.07 Pass 42.0 13.05 Pass 1.0
Table 22: Run A often A-9-THCA samples from Mississippi Crime Laboratory reported with quantitated results. Table shows calibrators, controls and individual sample results. All results are from analyses conducted using the extraction device bound with monoclonal A-9-THCA antibodies. All calibrators, controls and samples met criteria for confirmation and statistical analysis.

83
Table 23
Quantify Sample Summary Report Sample List: C:\TurboMass\USMFSC.PRO\SampleDB\083007A Last Modified: Monday Jul 27 14:48:35 2007 Method: C:\TurboMass\USMFSC\MethDB\THCA Printed: Fri Aug 31 16:40:21 2007
Sample Name: 083007A1 THCA THCA-D3 Sample Name: 083007A2 THCA THCA-D3 Sample Name: 083007A3 THCA THCA-D3 Sample Name: 083007A4 THCA THCA-D3 Sample Name: 083007A5 THCA THCA-D3 Sample Name: 083007A6 THCA THCA-D3 Sample Name: 083007A7 THCA THCA-D3 Sample Name: 083007A8 THCA THCA-D3 Sample Name: 083007A9 THCA THCA-D3 Sample Name: 083007A10 THCA THCA-D3 Sample Name: 083007A11 THCA THCA-D3
Sample Qualifiers RT P/F
Sample ID: 0 ng/ml CAL 1 NF Fail 13.05 Pass Sample ID: 5 ng/ml CAL 13.07 Pass 13.05 Pass Sample ID: 10 ng/ml CAL 13.07 Pass 13.05 Pass Sample ID: 20 ng/ml CAL 13.07 Pass 13.05 Pass Sample ID: 50 ng/ml CAL 13.07 Pass 13.05 Pass Sample ID: 10 ng/ml CTRL 13.07 Pass 13.05 Pass
Cone. ng/ml
0 1.0
4.86 1.0
10.10 1.0
19.41 1.0
50.17 1.0
10.5 1.0
Sample ID: FSC 11 A (13995) NF Fail 13.05 Pass
0 1.0
Sample ID: FSC 12 A (8516) 13.07 Pass 13.05 Pass
21 1.0
Sample ID: FSC 13 A (13298) 13.07 Pass 13.05 Pass
16 1.0
Sample ID: FSC 14 A (14876) 13.07 Pass 13.05 Pass
13 1.0
Sample ID: FSC 15 A (11457) 13.07 Pass 13.05 Pass
20 1.0

84
Table 23, (continued)
Sample Name: THCA THCA-D3 Sample Name: THCA THCA-D3 Sample Name: THCA THCA-D3 Sample Name: THCA THCA-D3 Sample Name: THCA THCA-D3 Sample Name: THCA THCA-D3
083007A12
083007A13
083007A14
083007A15
083007A16
083007A17
Sample ID: FSC 16 A (6342) 13.07 Pass 7 13.05 Pass 1.0 Sample ID: FSC 17 A (8011) 13.07 Pass 8 13.05 Pass 1.0 Sample ID: FSC 18 A (8106) 13.07 Pass 10 13.05 Pass 1.0 Sample ID: FSC 19 A (8245) 13.07 Pass 5 13.05 Pass 1.0 Sample ID: FSC 20 A (8464) 13.07 Pass 7 13.05 Pass 1.0 Sample ID: 30 ng/ml CTRL 13.07 Pass 41.0 13.05 Pass 1.0
Table 23: Run A often A-9-THCA samples from Mississippi Crime Laboratory reported with quantitated results. Table shows calibrators, controls and individual sample results. All results are from analyses conducted using the extraction device bound with monoclonal A-9-THCA antibodies. All calibrators, controls and samples met criteria for confirmation and statistical analysis.

85
Table 24
Quantify Sample Summary Report Sample List: C:\TurboMass\USMFSC.PRO\SampleDB\090407A Last Modified: Monday Jul 27 14:48:35 2007 Method: C:\TurboMass\USMFSC\MethDB\THCA Printed: Fri Sep 7 17:22:11 2007
Sample Name: 090407A1 THCA THCA-D3 Sample Name: 090407A2 THCA THCA-D3 Sample Name: 090407A3 THCA THCA-D3 Sample Name: 090407A4 THCA THCA-D3 Sample Name: 090407A5 THCA THCA-D3 Sample Name: 090407A6 THCA THCA-D3 Sample Name: 090407A7 THCA THCA-D3 Sample Name: 090407A8 THCA THCA-D3 Sample Name: 090407A9 THCA THCA-D3 Sample Name: 090407A10 THCA THCA-D3 Sample Name: 090407A11 THCA THCA-D3
Sample Qualifiers RT P/F
Sample ID: 0 ng/ml CAL 1 NF Fail 13.05 Pass Sample ID: 5 ng/ml CAL 13.07 Pass 13.05 Pass Sample ID: 10 ng/ml CAL 13.07 Pass 13.05 Pass Sample ID: 20 ng/ml CAL 13.07 Pass 13.05 Pass Sample ID: 50 ng/ml CAL 13.07 Pass 13.05 Pass Sample ID: 10 ng/ml CTRL 13.07 Pass 13.05 Pass
Cone. ng/ml
0 1.0
5.06 1.0
9.70 1.0
21.19 1.0
49.99 1.0
10.3 1.0
Sample ID: FSC 21 A (14621) 13.07 Pass 13.05 Pass
51 1.0
Sample ID: FSC 22 A (16804) 13.07 Pass 13.05 Pass
6 1.0
Sample ID: FSC 23 A (1662) 13.07 Pass 13.05 Pass
20 1.0
Sample ID: FSC 24 A (6482) 13.07 Pass 13.05 Pass
5 1.0
Sample ID: FSC 25 A (6701) 13.07 Pass 13.05 Pass
11 1.0

86
Table 24, (continued)
Sample Name: 090407A12 Sample ID: FSC 26 A (8789) THCA NF Fail 0 THCA-D3 13.05 Pass 1.0 Sample Name: 090407A13 Sample ID: FSC 27 A (9500) THCA 13.07 Pass 5 THCA-D3 13.05 Pass 1.0 Sample Name: 090407A14 Sample ID: FSC 28 A (9861) THCA 13.07 Pass 16 THCA-D3 13.05 Pass 1.0 Sample Name: 090407A15 Sample ID: FSC 29 A (9873) THCA 13.07 Pass 23 THCA-D3 13.05 Pass 1.0 Sample Name: 090407A16 Sample ID: FSC 30 A (11461) THCA THCA-D3 Sample Name: 090407A17 THCA THCA-D3
Table 24: Run A often A-9-THCA samples from Mississippi Crime Laboratory reported with quantitated results. Table shows calibrators, controls and individual sample results. All results are from analyses conducted using the extraction device bound with monoclonal A-9-THCA antibodies. All calibrators, controls and samples met criteria for confirmation and statistical analysis.
13.07 13.05 Sample 13.07 13.05
ID:
Pass Pass
30 ng/ml Pass Pass
CTRL
5 1.0
41.0 1.0

Table 25
Quantify Sample Summary Report Sample List: C:\TurboMass\USMFSC.PRO\SampleDB\082807B Last Modified: Monday Jul 27 14:48:35 2007 Method: C:\TurboMass\USMFSC\MethDB\THCA Printed: Fri Aug 31 15:03:33 2007
Sample Name: 082807B1 THCA THCA-D3 Sample Name: 082807B2 THCA THCA-D3 Sample Name: 082807B3 THCA THCA-D3 Sample Name: 082807B4 THCA THCA-D3 Sample Name: 082807B5 THCA THCA-D3 Sample Name: 082807B6 THCA THCA-D3 Sample Name: 082807B7 THCA THCA-D3 Sample Name: 082807B8 THCA THCA-D3 Sample Name: 082807B9 THCA THCA-D3 Sample Name: 082807B10 THCA THCA-D3 Sample Name: 082807B11 THCA THCA-D3
Sample Qualifiers RT P/F
Sample ID: 0 ng/ml CAL 1 NF Fail 13.05 Pass Sample ID: 5 ng/ml CAL 13.07 Pass 13.05 Pass Sample ID: 10 ng/ml CAL 13.07 Pass 13.05 Pass Sample ID: 20 ng/ml CAL 13.07 Pass 13.05 Pass Sample ID: 50 ng/ml CAL 13.07 Pass 13.05 Pass Sample ID: 10 ng/ml CTRL 13.07 Pass 13.05 Pass Sample ID: FSC 1 B (3330) NF Pass 13.05 Pass Sample ID: FSC 2 B (4086) 13.07 Pass 13.05 Pass Sample ID: FSC 3 B (6279) 13.07 Pass 13.05 Pass Sample ID: FSC 4 B (6349) 13.07 Pass 13.05 Pass Sample ID: FSC 5 B (6352) 13.07 Pass 13.05 Pass
Cone. ng/ml
0 1.0
5.91 1.0
9.93 1.0
20.49 1.0
50.62 1.0
9.0 1.0
11 1.0
51 1.0
34 1.0
22 1.0
55 1.0

88
Table 25, (continued)
Sample Name: THCA THCA-D3 Sample Name: THCA THCA-D3 Sample Name: THCA THCA-D3 Sample Name: THCA THCA-D3 Sample Name: THCA THCA-D3 Sample Name: THCA THCA-D3
082807B12
082807B13
082807B14
082807B15
082807B16
082807B17
Sample ID: FSC 6 B (8573) 13.07 Pass 52 13.05 Pass 1.0 Sample ID: FSC 7 B (1778) 13.07 Pass 59 13.05 Pass 1.0 Sample ID: FSC 8 B (14275) 13.07 Pass 9 13.05 Pass 1.0 Sample ID: FSC 9 B (2946) 13.07 Pass 24 13.05 Pass 1.0 Sample ID: FSC 10 B (15667) 13.07 Pass 32 13.05 Pass 1.0 Sample ID: 30 ng/ml CTRL 13.07 Pass 38.0 13.05 Pass 1.0
Table 25: Run B often A-9-THCA samples from Mississippi Crime Laboratory reported with quantitated results. Table shows calibrators, controls and individual sample results. All results are from analyses conducted using the extraction device bound with monoclonal A-9-THCA antibodies. All calibrators, controls and samples met criteria for confirmation and statistical analysis.

89
Table 26
Quantify Sample Summary Report Sample List: C:\TurboMass\USMFSC.PRO\SampleDB\083007B Last Modified: Monday Jul 27 14:48:35 2007 Method: C:\TurboMass\USMFSC\MethDB\THCA Printed: Fri Aug 31 16:52:33 2007
Sample Name: 083007B1 THCA THCA-D3 Sample Name: 083007B2 THCA THCA-D3 Sample Name: 083007B3 THCA THCA-D3 Sample Name: 083007B4 THCA THCA-D3 Sample Name: 083007B5 THCA THCA-D3 Sample Name: 083007B6 THCA THCA-D3 Sample Name: 083007B7 THCA THCA-D3 Sample Name: 083007B8 THCA THCA-D3 Sample Name: 083007B9 THCA THCA-D3 Sample Name: 083007B10 THCA THCA-D3 Sample Name: 083007B11 THCA THCA-D3
Sample Qualifiers RT P/F
Sample ID: 0 ng/ml CAL 1 NF Fail 13.05 Pass Sample ID: 5 ng/ml CAL 13.07 Pass 13.05 Pass Sample ID: 10 ng/ml CAL 13.07 Pass 13.05 Pass Sample ID: 20 ng/ml CAL 13.07 Pass 13.05 Pass Sample ID: 50 ng/ml CAL 13.07 Pass 13.05 Pass Sample ID: 10 ng/ml CTRL 13.07 Pass 13.05 Pass
Cone. ng/ml
0 1.0
4.02 1.0
11.10 1.0
18.85 1.0
49.81 1.0
8.8 1.0
Sample ID: FSC 11 B (13995) NF Fail 13.05 Pass
0 1.0
Sample ID: FSC 12 B (8516) 13.07 Pass 13.05 Pass
19 1.0
Sample ID: FSC 13 B (13298) 13.07 Pass 13.05 Pass
17 1.0
Sample ID: FSC 14 B (14876) 13.07 Pass 13.05 Pass
12 1.0
Sample ID: FSC 15 B (11457) 13.07 Pass 13.05 Pass
21 1.0

90
Table 26, (continued)
Sample Name: THCA THCA-D3 Sample Name: THCA THCA-D3 Sample Name: THCA THCA-D3 Sample Name: THCA THCA-D3 Sample Name: THCA THCA-D3 Sample Name: THCA THCA-D3
083007B12
083007B13
083007B14
083007B15
083007B16
083007B17
Sample ID: FSC 16 B (6342) 13.07 Pass 6 13.05 Pass 1.0 Sample ID: FSC 17 B (8011) 13.07 Pass 6 13.05 Pass 1.0 Sample ID: FSC 18 B (8106) 13.07 Pass 8 13.05 Pass 1.0 Sample ID: FSC 19 B (8245) 13.07 Pass 5 13.05 Pass 1.0 Sample ID: FSC 20 B (8464) 13.07 Pass 6 13.05 Pass 1.0 Sample ID: 30 ng/ml CTRL 13.07 Pass 37.0 13.05 Pass 1.0
Table 26: Run B often A-9-THCA samples from Mississippi Crime Laboratory reported with quantitated results. Table shows calibrators, controls and individual sample results. All results are from analyses conducted using the extraction device bound with monoclonal A-9-THCA antibodies. All calibrators, controls and samples met criteria for confirmation and statistical analysis.
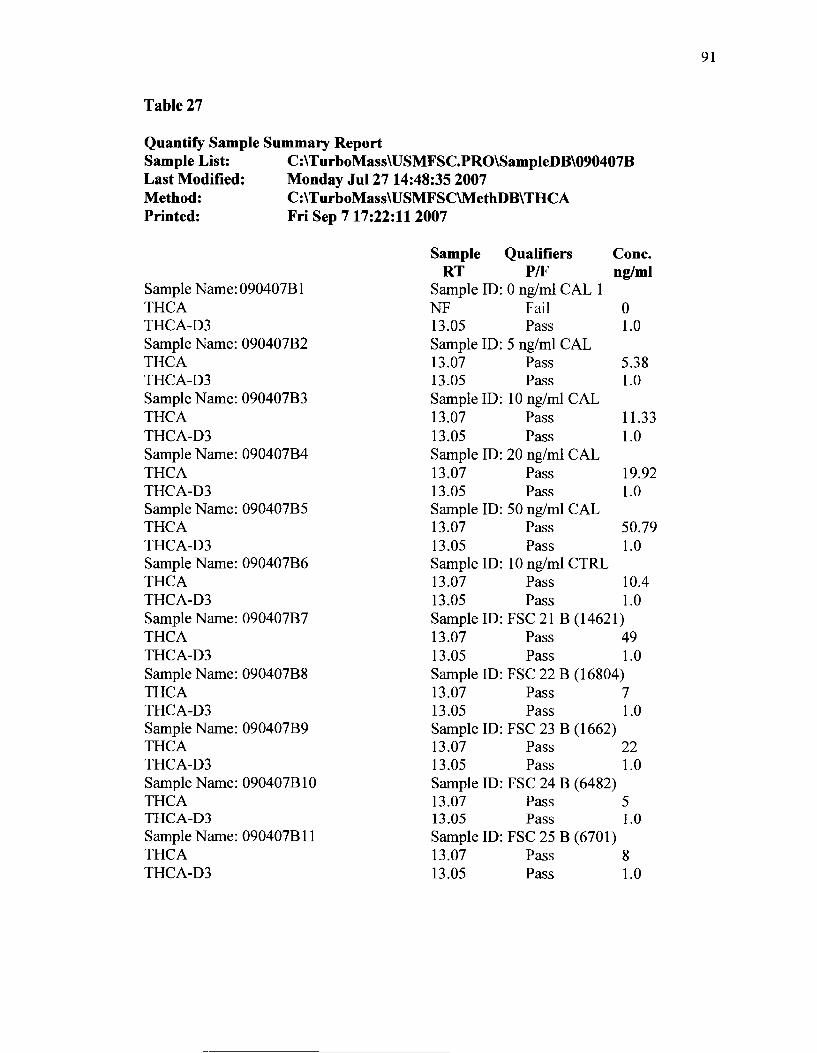
91
Table 27
Quantify Sample Summary Report Sample List: C:\TurboMass\USMFSC.PRO\SampleDB\090407B Last Modified: Monday Jul 27 14:48:35 2007 Method: C:\TurboMass\USMFSC\MethDB\THCA Printed: Fri Sep 7 17:22:11 2007
Sample Name: 090407B1 THCA THCA-D3 Sample Name: 090407B2 THCA THCA-D3 Sample Name: 090407B3 THCA THCA-D3 Sample Name: 090407B4 THCA THCA-D3 Sample Name: 090407B5 THCA THCA-D3 Sample Name: 090407B6 THCA THCA-D3 Sample Name: 090407B7 THCA THCA-D3 Sample Name: 090407B8 THCA THCA-D3 Sample Name: 090407B9 THCA THCA-D3 Sample Name: 090407B10 THCA THCA-D3 Sample Name: 090407B11 THCA THCA-D3
Sample Qualifiers < RT P/F
Sample ID: 0 ng/ml CAL 1 NF Fail 13.05 Pass Sample ID: 5 ng/ml CAL 13.07 Pass 13.05 Pass Sample ID: 10 ng/ml CAL 13.07 Pass 13.05 Pass Sample ID: 20 ng/ml CAL 13.07 Pass 13.05 Pass Sample ID: 50 ng/ml CAL 13.07 Pass 13.05 Pass Sample ID: 10 ng/ml CTRL 13.07 Pass 13.05 Pass
Cone. ng/ml
0 1.0
5.38 1.0
11.33 1.0
19.92 1.0
50.79 1.0
10.4 1.0
Sample ID: FSC 21 B (14621) 13.07 Pass 13.05 Pass
49 1.0
Sample ID: FSC 22 B (16804) 13.07 Pass 13.05 Pass Sample ID: FSC 23 B (1662: 13.07 Pass 13.05 Pass Sample ID: FSC 24 B (6482^ 13.07 Pass 13.05 Pass Sample ID: FSC 25 B (6701] 13.07 Pass 13.05 Pass
7 1.0
I 22 1.0
I 5 1.0
) 8 1.0

92
Table 27, (continued)
Sample Name: THCA THCA-D3 Sample Name: THCA THCA-D3 Sample Name: THCA THCA-D3 Sample Name: THCA THCA-D3 Sample Name: THCA THCA-D3 Sample Name: THCA THCA-D3
090407B12
090407B13
090407B14
090407B15
090407B16
090407B17
Sample ID: FSC 26 B (8789) NF Fail 0 13.05 Pass 1.0 Sample ID: FSC 27 B (9500) 13.07 Pass 5 13.05 Pass 1.0 Sample ID: FSC 28 B (9861) 13.07 Pass 14 13.05 Pass 1.0 Sample ID: FSC 29 B (9873) 13.07 Pass 25 13.05 Pass 1.0 Sample ID: FSC 30 B (11461) 13.07 Pass 5 13.05 Pass 1.0 Sample ID: 30 ng/ml CTRL 13.07 Pass 37.0 13.05 Pass 1.0
Table 27: Run B often A-9-THCA samples from Mississippi Crime Laboratory reported with quantitated results. Table shows calibrators, controls and individual sample results. All results are from analyses conducted using the extraction device bound with monoclonal A-9-THCA antibodies. All calibrators, controls and samples met criteria for confirmation and statistical analysis.

93
Table 28
Direct Difference Statistical Evaluation of THCA Values: Paired t test Testing Group A
Sample
Identification
8516 13298 14876 11457 6342 8011 8106 8245 8464 3330 4086
6279 6349 6352 8573 1778 14275 2946 15667 14621 16804 1662 6482 7601 9500 9861 9873 11461
MCL Results
26 21 17 28 10 10 14 6 11 18 60 43 30 69 58 68 13 27 40 63 11 28 7 13 7 21 30 6
^Xl= 755 £X2=
EXP-A
Results
21 16 13 20 7 8 10 5 7 13 49 37 24 60 49 58 9 22 34 51 6 20 5 11 5 16 23 5 604
Difference
D = X1-X2
5 5 4 8 3 2 4 1 4 5 11 6 6 9 9 10 4 5 6 12 5 8 2 2 2 5 7 1
Difference
Squared (D
ID2=
25 25 16 64 9 4 16 1 16 25 121 36 36 81 81 100 16 25 36 144 25 64 4 4 4 25 49 1
1053
Group Means MCL = 26.964 EXP-A = 21.571 Mean Difference of Groups - MCL - EXP-A 26.964-21.571= 5.393 Standard Deviation of Difference (SDD) SDD = V (£D2/N) - MD2
V37.607-29.083 = 2.920 Standard Error of Difference (SED) SED = SDD/(VN-1) = 0.562
Paired t Ratio = MD/SED = 9.596
t oi(27)= 2.771 Significant Difference Found
Table 28: Paired t test on the first run of A-9-THCA results reported from the Mississippi Crime Laboratory. The test shows a significant difference indicating the differences were not by chance.

Table 29
Direct Difference Statistical Evaluation of THCA Values: Paired t test Testing Group B
Sample Identification
8516 13298 14786 11457 6342 8011 8106 8245 8464 3330 4086 6279 6349 6352 8573 1778 14275 2946 15667 14621 16804 1662 6482 7601 9500 9861 9873 11461
MCL Results
26 21 17 25 10 10 14 6 11 18 60 43 30 69 58 68 13 27 40 63 11 28 7 13 7 21 30 6
£X1= 755 £X2=
EXP-B
Results
19 17 12 21 6 6 8 5 6 11 51 34 22 55 52 59 9 24 32 49 7 22 5 8 5 14 25 5 589
Difference
D = X1-X2
7 4 5 7 4 4 6 1 5 7 9 9 8 14 6 9 4 3 8 14 4 6 2 5 2 7 5 1
Difference
Squared (D
ZD2=
49 16 25 49 16 16 36 1 25 49 81 81 64 196 36 81 16 9 64 196 16 36 4 25 4 49 25 1
1266
Group Means MCL = 26.964 EXP-A = 21.036 Mean Difference of Groups - MCL - EXP-A 26.964 - 21.036 = 5.929 Standard Deviation of Difference (SDD) SDD = V (£D2/N) - MD2
V45.214-35.148 = 3.173 Standard Error of Difference (SED) SED = SDD/(VN-1) = 0.611 Paired t Ratio = MD/SED = 8.827 t .oi(27) = 2.771 Significant Difference Found Table 29: Paired t test on the second run of A-9-THCA results reported from the Mississippi Crime Laboratory. The test shows a significant difference indicating the differences were not by chance.

95
Figure 19
THCA Comparisons
70
60
50
• MCL Results
• Exp 1 Results
• Exp 2 Results
OJ
40
30 I
20
10
0 1 I 3 5 7 9 11 13 15 17 19 21 23 25 27
Number of Samples
Figure 19: Comparison of A-9-THCA Mississippi Crime Laboratory results versus results from two separate extractions using the glutaraldehyde treated flasks with A-9-THC monoclonal antibodies. The white bars represent the results reported by the Mississippi Crime Laboratory while the blue and red bars represent results from the extraction device. Note there is a negative bias using the extraction devices.

96
The last set of samples analyzed from the Mississippi Crime Laboratory was those
A-9-THC samples reported as "None Detected Due to Interfering Substance". These ten
samples were treated the same as all other samples when analyzed using the extraction
device. The ten samples were all run twice on separate days.
Two of the samples were found to be "none detected" at 1 ng/ml. Eight of the
samples were found to contain A-9-THC at various concentrations. The remaining eight
samples met the requirements for confirmation and quantitation (see Tables 30 and 31).
A Paired t test was not run for statistical comparison since there were no results
from the Mississippi Crime Laboratory for comparison. A statistical evaluation of the
groups themselves did not reveal a significant difference between the groups using the
Paired t test. Mean values were 10.13 ng/ml for group A and 8.75 ng/ml for group B.
These results are significant in that the extraction method using bound antibodies
appears to have removed any interfering substances and allow quantitative results to be
obtained (see Figure 20). Any interfering substances would have been removed during
the washing steps while the analytes remained bound prior to release for analysis.
A liquid/liquid extraction was performed in my laboratory to see if any interfering
peaks were found (see Figure 21). There are two unidentified peaks located to the right
of the A-9-THC peak in this extraction. These two peaks may account for the
interference noted in the original report. The two peaks were clearly separated in this
analysis which may be due to the fact a new column was used for the analysis and a
different oven temperature program. A column used on a daily basis for routine analyses
over a few months time would probably not separate these peaks at some point.

97
Table 30
Quantify Sample Summary Report Sample List: C:\TurboMass\USMFSC.PRO\SampleDB\090407B Last Modified: Monday Jul 27 14:48:35 2007 Method: C:\TurboMass\USMFSC\MethDB\THC Printed: Fri Sep 7 17:22:11 2007
Sample Name: THC THC-D3 Sample Name: THC THC-D3 Sample Name: THC THC-D3 Sample Name: THC THC-D3 Sample Name: THC THC-D3 Sample Name: THC THC-D3 Sample Name: THC THC-D3 Sample Name: THC THC-D3 Sample Name: THC THC-D3 Sample Name: THC THC-D3 Sample Name: THC THC-D3
090407A1
090407 A2
090407 A3
090407A4
090407A5
090407A6
090407A7
090407A8
090407A9
090407A10
090407A11
Sample RT
Sample ID: NF 11.12 Sample ID: 11.13 11.12 Sample ID: 11.14 11.12 Sample ID: 11.13 11.12 Sample ID: 11.14 11.12 Sample ID: 11.13 11.12 Sample ID: 11.13 11.12 Sample ID: 11.14 11.12 Sample ID: 11.13 11.12 Sample ID: NF 11.12 Sample ID: 11.13 11.12
Qualifiers P/F
0 ng/ml CAL 1 Fail Pass
3 ng/ml CAL Pass Pass
10 ng/ml CAL Pass Pass
20 ng/ml CAL Pass Pass
50 ng/ml CAL Pass Pass
10 ng/ml CTRL Pass Pass
Cone, ng/ml
0 1.0
2.87 1.0
9.46 1.0
20.09 1.0
49.79 1.0
8.8 1.0
FSC 11 B (14621) Pass 7.3 Pass 1.0
FSC 12 B (16804) Pass 1.6 Pass
FSC 13 B (166T Pass Pass
FSC 14 B (6482; Fail Pass
FSC15B(670i; Pass Pass
1.0 )
4.1 1.0
) 0 1.0
) 3.1 1.0

98
Table 30, (continued)
Sample Name: THC THC-D3 Sample Name: THC THC-D3 Sample Name: THC THC-D3 Sample Name: THC THC-D3 Sample Name: THC THC-D3 Sample Name: THC THC-D3
090407A12
090407A13
090407A14
090407A15
090407A16
090407A17
Sample ID: FSC 16 B (8789) 11.13 Pass 13.0 11.12 Pass 1.0 Sample ID: FSC 17 B (9500) 11.13 Pass 2.3 11.12 Pass 1.0 Sample ID: FSC 18 B (9861) 11.14 Pass 2.4 11.12 Pass 1.0 Sample ID: FSC 19 B (9873) 11.13 Pass 2.6 11.12 Pass 1.0 Sample ID: FSC 20 B (11461) NF Fail 0 11.12 Pass 1.0 Sample ID: 30 ng/ml CTRL 11.14 Pass 37.0 11.12 Pass 1.0
Table 30: Run A often A-9-THC samples from Mississippi Crime Laboratory reported as "Unable to Report Due to Interfering Substances". Table shows calibrators, controls and individual sample results. All results are from analyses conducted using the extraction device bound with monoclonal A-9-THC antibodies. All calibrators, controls and samples met criteria for confirmation and statistical analysis. All samples were reportable using the extraction device.

Table 31
Summary Report C:\TurboMass\USMFSC.PRO\SampleDB\090507B Monday Jul 27 14:48:35 2007 C:\TurboMass\USMFSC\MethDB\THC Fri Sep 7 17:42:46 2007
Sample Name: 090507B1 THC THC-D3 Sample Name: 090507B2 THC THC-D3 Sample Name: 090507B3 THC THC-D3 Sample Name: 090507B4 THC THC-D3 Sample Name: 090507B5 THC THC-D3 Sample Name: 090507B6 THC THC-D3 Sample Name: 090507B7 THC THC-D3 Sample Name: 090507B8 THC THC-D3 Sample Name: 090507B9 THC THC-D3 Sample Name: 090507B10 THC THC-D3 Sample Name: 090507B11 THC THC-D3
Sample Qualifiers ' RT P/F
Sample ID: 0 ng/ml CAL 1 NF Fail 11.12 Pass Sample ID: 3 ng/ml CAL 11.13 Pass 11.12 Pass Sample ID: 10 ng/ml CAL 11.14 Pass 11.12 Pass Sample ID: 20 ng/ml CAL 11.13 Pass 11.12 Pass Sample ID: 50 ng/ml CAL 11.14 Pass 11.12 Pass Sample ID: 10 ng/ml CTRL 11.13 Pass 11.12 Pass
Cone. ng/ml
0 1.0
2.87 1.0
9.46 1.0
20.09 1.0
49.79 1.0
8.8 1.0
Sample ID: FSC 11 B (14621) 11.13 Pass 11.12 Pass
7.3 1.0
Sample ID: FSC 12 B (16804) 11.14 Pass 11.12 Pass Sample ID: FSC 13 B (1662; 11.13 Pass 11.12 Pass Sample ID: FSC 14 B (6482; NF Fail 11.12 Pass Sample ID: FSC 15 B(670i; 11.13 Pass 11.12 Pass
1.6 1.0
) 4.1 1.0
) 0 1.0
> 3.1 1.0
Quantify Sample Sample List: Last Modified: Method: Printed:

Table 31, (continued)
Sample Name: THC THC-D3 Sample Name: THC THC-D3 Sample Name: THC THC-D3 Sample Name: THC THC-D3 Sample Name: THC THC-D3 Sample Name: THC THC-D3
090507B12
090507B13
090507B14
090507B15
090507B16
090507B17
Sample ID: FSC 16 B (8789) 11.13 Pass 13.0 11.12 Pass 1.0 Sample ID: FSC 17 B (9500) 11.13 Pass 2.3 11.12 Pass 1.0 Sample ID: FSC 18 B (9861) 11.14 Pass 2.4 11.12 Pass 1.0 Sample ID: FSC 19 B (9873) 11.13 Pass 2.6 11.12 Pass 1.0 Sample ID: FSC 20 B (11461) NF Fail 0 11.12 Pass 1.0 Sample ID: 30 ng/ml CTRL 11.14 Pass 37.0 11.12 Pass 1.0
Table 31: Run B often A-9-THC samples from Mississippi Crime Laboratory reported as "Unable to Report Due to Interfering Substances". Table shows calibrators, controls and individual sample results. All results are from analyses conducted using the extraction device bound with monoclonal A-9-THC antibodies. All calibrators, controls and samples met criteria for confirmation and statistical analysis. All samples were reportable using the extraction device.

101
Figure 20
THC Comparisons: Interfering Substances
c
; D Exp 1 Results i
i • Exp 2 Results \
artfW 3 4 5 6
Samples
8
Figure 20: Graph represents 8 of the 10 samples reported from the Mississippi Crime Laboratory as "Unable to Report Due to Interfering substances". Two of the samples were found to be negative for A-9-THC. The other 8 samples extracted using the device could have been quantitated and reported as shown above.

Figure 21
100n
%J
THC Peak
11 i i i i i i i i i i i i i i i i i 1111 1111 i i i 11111111111 111111111111111 TimR
10.73 10.93 11.13 11.33 11.53
Figure 21: Chromatogram of sample reported with an interfering substance following a liquid/liquid extraction in my laboratory. Note the two peaks to the right of the THC peak which may have caused the interference in the original report.

103
CHAPTER V
DISCUSSION
This project was designed to prove the concept of using monoclonal antibodies
chemically bound to a solid polystyrene surface to extract A-9-THC, A-9-THCA and their
respective internal standards from postmortem blood samples for analysis by EI+
GC/MS. A self-contained extraction device capable of extracting these analytes and
removing interfering substances from postmortem blood samples would improve the
reporting percentage of A-9-THC. Fewer reports stating "None Detected Due to
Interfering Substance" for the presence of A-9-THC would be advantageous for medical
examiners and toxicologists in determining if the cause of a victim's death was related in
some manner to the use marijuana.
Antibodies have been used for many years in various methods for both
purification and detection of analytes of interest. Both monoclonal and polyclonal
antibodies play a vital role in both clinical and forensic testing. A major difference
between the disciplines is that the clinical field can use data generated directly from
immunoassay testing. Forensic analyses require a second more specific test to confirm
any positive immunoassay result. The most common instrument used in forensic
laboratories to accomplish confirmations is an EI+ GC/MS.
Monoclonal antibodies are considered more specific for the analyte of interest with fewer
problems of cross reactivity with compounds similar in structure even those that belong
to the same drug class. Polyclonal antibodies demonstrate the most cross reactivity and
are used more in drug screening assays which must be followed by a confirmation
analysis. Monoclonal antibodies were chosen for this project because of the interest was
mainly in the extraction of A-9-THC after removal of interfering substances.

104
Polyclonal antibodies were considered for use but no vendor was found that could supply
the polyclonal antibodies at a known concentration.
Gas Chromatography Mass Spectrometry
Gas chromatography mass spectrometry is a combination of two methods each
providing unique information about an analyte. A gas chromatograph (GC) provides
information in the form of retention times due to its ability to separate a complex mixture
into constituent components within samples. The ability to separate such mixtures is
accomplished by use of a mobile phase in the form of a gas and a stationary phase within
a chromatographic column. As the gas moves the mixture through the column, the
interaction of constituents between both phases brings about the separation. Some
constituents are retained in the system longer than others resulting in differences in
elution times.
An electron impact (EI+) mass spectrometer is an instrument that provides
information about the structure of molecules such as drugs through a fragmentation
process. As molecules elute from the GC into the mass spectrometer, they collide with
electrons and fragment in a specific pattern. This fragmentation pattern is consistent
from instrument to instrument as long as the EI parameters are held the same. Such
consistency is why this type of mass spectrometer has been chosen for performing drug
confirmations in general and has been accepted by the legal community as the gold
standard method.
Two key pieces of information are given by the fragmentation pattern. First is the
pattern itself which can be placed in mass spectral libraries for searching and
identification purposes. Second specific ion fragments can be measured against one
another to provide a ratio for further confidence in the results. It is these three pieces of

105
information, retention time, fragmentation pattern and ion ratios, that give the GC/MS the
ability to positively identify a compound.
One of the major problems with a GC/MS is the need to maintain the system so
that the chromatography and the mass spectral patterns are free of unwanted
contaminants. Such contaminants are compounds from extractions that tend to stay in the
chromatographic column or co-elute with compounds of interest making fragmentation
patterns difficult to discern. The development of an extraction device that eliminates
most or all such interfering substances is one of the key reasons for pursuing this project.
Initial ELISA Experiments
Initial experiments in this project using ELISA 96 well plates demonstrated that
antibody bound A-9-THC could be subsequently recovered for analysis by GC/MS
following several wash steps to remove possible interfering substances. The ELISA
experiments also showed that antibody bound A-9-THCA and both deuterated internal
standards for GC/MS analysis could be recovered in a single extraction process. These
experimental results gave credence to the concept of producing a device using A-9-THC
antibodies that could be used to extract these analytes from postmortem whole blood
while removing interfering substances. The extraction results from the ELISA plates
were both positive but did point out some issues that had to be over come.
One positive point as stated above was mainly that the analytes of interest
remained bound during the protocol and could be recovered for analysis by GC/MS. This
meant that a larger device built on the same principle should perform in the same manner.
Analytes could be introduced, bound by antibody, washed to remove interfering
substances and then the analyte of interest recovered for analysis.
One of the negative issues noted was that recovery of analytes was poor and

inconsistent at best. Since the samples were not diluted, as would be the case normally,
poor recovery may have stemmed from an analytes inability to diffuse within the blood
sample to the sides or bottom of the wells where the antibodies were located: ELISA
plates are held static during the incubation period. Another reason may be that whole
blood contains many large and complex substances that may have played a role in steric
hindrance preventing analyte from binding the antibody. Dilution of the sample in
ELISA testing would reduce to some degree the inability for an analyte to diffuse within
the sample by removing many of the large molecules and at the same time increase the
ratio of antibody to analyte enhancing chances for binding.
Two steps were put in the extraction protocol to overcome these issues. First an
excess of antibody was placed in each device, five meg of antibody per device.
Secondly, the device was rotated to facilitate the movement of analyte within the device
to increase the likelihood of contacting antibody for binding. These steps did improve
the percent yield, 54% for A-9-THC when using the device as compared to the 28% from
ELISA plates. The percent yield was much more consistent with the extraction device.
Extraction Device Chosen for Experiments
The device chosen for main portion of this project was a 25 ml Falcon® cell
culture flask. The flask's bottom measured 12.5 cm2 which 1 ml of fluid would just
cover. The shallow depth of a solution ensured the glutaraldehyde would contact the
surface for binding and that the antibody solution would come into contact with the
glutaraldehyde for chemical binding. The flask had a screw cap for closure and was large
enough to easily decant sample into and out of the flask as well as wash and releasing
solutions. The flat bottom was ideal for stacking the flasks on the platform

107
rotator during experiments without tilting or falling. There were some problems
observed with this flask during the project.
First the 90° angle formed on three sides served as a collection area for all
solutions during rotation. A solution would naturally go to the sides as the flask rotated
no matter how slow the rotation rate. Flasks that contain an internal angle along the sides
may prevent fluid build up of solutions and samples around the edges and provide
consistent coverage of the bottom area during rotation.
A second solution would be to use a rocker to ensure a solution covered the entire
bottom area during an experiment as it moved back and fourth. However, a means of
securing the flasks to the rocker would have to be devised in order to place several flasks
on at one time.
Another problem seen with the flasks was cracking that occurred during the
experiments. Hairline cracks would begin to appear when a releasing solvent was added
to the flasks. The cracks were seen in the top of the flask, along the sides, but not in the
bottom area of the flasks. At no time were the cracks of sufficient width to leak any of
the releasing solution during incubation.
The worst area for cracking noted was around the neck area under the cap. After
removing the cap, often small pieces of polystyrene came off while pouring the releasing
solvent into the glass tubes. These small pieces of polystyrene would then interfere with
the analysis by GC/MS by clogging the Autosampler needle and/or dissolving in the
derivatization solvent coating the injection liner and column which on occasion would
alter the retention times of the analytes. The hairline cracks were believed due to
pressure changes within the flasks from the heating step and the various types of aqueous
and organic solutions used during an extraction.

108
The cracks under the cap were found to come more from over tightening the cap.
When the cap was allowed to remain lose, the cracking was much less severe which in
turn eliminated the chromatographic problems encountered from this problem. This
same device is also sold with a vented cap which should be tried in future experiments.
The device overall proved to be a good choice for initial experiments. There was
sufficient surface area for antibody binding and pipetting reagents into or decanting
reagents out of the opening was adequate. Once the problems with cracking under the
caps were resolved, no other issues arouse from using this device.
Antibody Binding Methods
Two methods for attaching antibody to the device were chosen; 1) Passive
attachment and 2) chemical attachment with glutaraldehyde. Two methods were chosen
to test which one would be most efficient for preparing the devices, which method would
provide the best percent yield of analyte and the one demonstrating the best robustness
during the extraction protocol.
First the passive adhesion was attempted by simply allowing 1 ml of the antibody
solution containing 5 meg of antibody at a pH of 9.2 to incubate overnight at ambient
temperature. The premise for adherence to the polystyrene surface passively is the
alkaline pH would cause the antibody to slightly unfold exposing some hydrophobic
regions. These regions would tend to adhere to the hydrophobic polystyrene. The
devices were then washed three times with pH 7.2 sodium phosphate buffer followed by
two washing of Type III water. Synthetic blood solutions containing 25 ng/ml of A-9-
THC were added to individual extraction flasks and allowed to incubate on a platform
rotator for 1 hr. The flasks contents were poured into a biohazard container and the
flasks rinsed with PBS. Two ml of Hexane and 0.1% acidic methanol were added to

separate flasks as releasing solvents to test which releasing solvent worked best with the
devices. The releasing solvents were collected, prepared and analyzed by GC/MS.
Results of these experiments were considered unsuccessful given recovery of any
analyte occurred only 60 percent of the time. Even when the experiments did result in
analyte recovery, percent yield of analyte was inconsistent to the point linearity, LOQ or
LOD could not be determined. The main problem with this type of immobilization is
leaching of the antibody during removal of the analyte of interest (Nisnevitch and Frier,
2001). After several attempts to improve passive antibody binding by longer incubation
times, use of a detergent and altering pH values, this procedure was abandoned.
The second method chosen was to bind gluteraldehyde to the flask bottom
surface using the method of Hermanson, et al. (1992). The initial protocol called for
using 2% glutaraldehyde in a pH 5.0 sodium phosphate buffer. One ml of this solution
was added to four extraction devices and allowed to incubate for 4 hours at room
temperature. The devices were then washed 5 times with the pH 5.0 phosphate buffer.
Each device was tapped over paper towels to remove excess liquid and then allowed to
drain for 10 minutes.
The second step was adding one ml of the antibody solution containing 5 meg of
antibody per ml of a sodium phosphate buffer, pH 8.0, was added to each device and
incubated at 37° C for a minimum of 3 hr. Each device was then washed 3 times with a
sodium phosphate buffer, pH 8.0, tapped to remove excess buffer and allowed to drain
for lOmin.
One ml samples of synthetic blood containing no drug were added to two devices
and 1 ml samples containing 25 ng/ml A-9-THC were added to two other devices. All
four devices were carried through the extraction protocol. The four devices were washed

110
5 times with a sodium phosphate buffer, pH 7.2 and allowed to drain for 30 min. Two ml
of hexane was added to one of the negative and one of the spiked devices and 0.1% acidic
methanol was added to the other two devices in order to determine which solvent
produced the best recovery of analyte using the flasks as well as which resulted in the
least interference with the GC/MS assay.
Hexane proved to be the best releasing reagent with an analyte yield of 28% as
compared to a 17% yield with acidic methanol. The two negative samples did not show
any recovery of A-9-THC. This experiment was repeated three times with similar results.
In order to raise the percent yield, the glutaraldehyde solution was increased to a
5% solution for binding the antibodies within the device. This change did increase the
percent yield from 28% to an average of 38% using hexane as the releasing solvent.
Again hexane was a better releasing solvent than 0.1% acidic methanol. Hexane also
provided a cleaner extract when compared to the 0.1% acidic methanol when inspecting
glass injection liners following a series of injections. The difference may be in the
manner by which the antibodies are bound to the polystyrene. The binding of antibodies
in ELISA plates from Immunalysis is proprietary and probably does not release any
antibody during the releasing step whether using hexane or acidic methanol. The same
may not be true for antibodies bound to polystyrene using glutaraldehyde.
A concern using this type of attachment is the orientation and spread of the
antibodies over the bottom surface of the flasks. The antibodies can orient in any
direction given the attachment between the glutaraldehyde and the antibody uses amine
groups. Amine groups are available for bonding in many areas of the antibody including
the terminal ends where the binding sites are located. There is also no way to control
exactly where the antibodies bind the glutaraldehyde as to position in the 12.5 cm2

I l l
surface area of the flask bottom. This is the reason for having to add what is considered
an excess of antibody, 5 meg, to each device to extract approximately 100 - 200 ng of
analytes.
Experiments Using Synthetic Whole Blood
Initial experiments used synthetic whole blood purchased from Immunalysis with
the ELISA kits. The lypholized whole blood was prepared according to instructions
received in the ELISA kits and used for initial experiments of percent yield and linearity
studies with the new devices. The synthetic blood had a homogeneous consistency with
no clots and showed no precipitation when analytes in methanol solutions were added.
Linearity was established from 0 to 50 ng/ml using internal standards for both
analytes. Limit of Detection (LOD) for A-9-THC was calculated to be 1.0 ng/ml. The
Limit of Quantitation (LOQ) was found to be 1.0 ng/ml which was higher than desired
but at an acceptable level for reporting of A-9-THC. LOD for A-9-THCA was found to
be 2.0 ng/ml with a LOQ of 3.0 ng/ml. The values for A-9-THCA are excellent for this
analyte for most laboratories do not report A-9-THCA present or give a quantitative value
below 5 ng/ml.
Use of the synthetic blood bolstered the concept that the device was working as
designed and that future research would only make the device better and more efficient.
This was until testing of actual samples began.
Experiments Using Actual Postmortem Samples
Thirty postmortem samples were secured from the Mississippi Crime Laboratory
that had been previously analyzed for A-9-THC and A-9-THCA. Ten of the samples had
been found to contain no A-9-THC at 0.5 ng/ml, ten of the samples had been reported
with A-9-THC present plus quantitated and ten samples had been reported as "None

112
Detected Due to Interfering Substance". Twenty eight of the samples reported A-9-
THCA as present and quantitated with two samples being reported as "None Detected at
5 ng/ml". This group of samples provided an excellent challenge to using the new device
for they covered all aspects of the original experimental design.
Initially five devices were made and 1 ml of postmortem samples added to each
and run through the protocol simply to establish both analytes would be recovered.
Surprisingly, only two of the five had any recovery of analytes and the percent yield was
approximately half that seen with the synthetic blood samples. Five more devices were
prepared and the experiment repeated after each individual postmortem sample was
mixed over night. The results of the second experiment were basically the same as the
first with the exception of A-9-THCA being recovered from a third sample. No internal
standards were added for quantitations during these first two experiments so no
information was gained concerning those two analytes during the initial experiments with
postmortem samples.
New batches of all buffers and the 5% glutaraldehyde were made for a third
experiment on the postmortem samples. Two devices were prepared and 1 ml of a
postmortem sample reported as "None Detected" was spiked with 25 ng/ml A-9-THC and
placed in one device and 1 ml of a postmortem sample reported as "None Detected" was
spiked with 25 ng/ml A-9-THCA and placed in the second device. The two devices were
carried through the protocol with fresh reagents. Recovery of the A-9-THC was still poor
and the sample spiked with A-9-THCA demonstrated no recovery of analyte.
At this point, experiments were conducted again using the synthetic blood to
reaffirm original results and test the antibody solution for deterioration of the antibody.
Two devices were used spiked as described in the previous paragraph. Analytes from

113
both devices were recovered as expected using the synthetic blood. This meant that the
problem was with the postmortem samples themselves and not any reagents, antibody or
prepared devices.
Wong et al. (1982) did a study on the effect of long term storage of A-9-THC in
blood and serum. Their study looked at the storage of spiked samples of A-9-THC in
whole blood and serum in several storage environments and at several temperatures
ranging from -20° to 60° C over a 25 week period. No appreciable loss of A-9-THC was
found at any storage temperature or environment until around week 17. After this point,
recovery of A-9-THC from blood or serum became inconsistent and was not achievable
after week 25. The article's authors concluded that the inability to recover the analyte
was not due to degradation of the molecule or surface absorption onto the container, but
rather a binding of the molecule to degrading proteins in the sample.
A method to separate the drug from any protein had to be developed to release
any bound A-9-THC. Two solvents were chosen to attempt to denature proteins and
allow recovery of both A-9-THC and A-9-THCA; 1) methanol and 2) acetonitrile.
A 1 ml sample of the synthetic blood spiked with 25 ng/ml A-9-THC was placed
in a 16X125 mm screw cap borosilicate glass tube. While vortexing the sample, 1 ml
methanol was slowly added one drop at a time. Vortexing continued for 30 seconds after
the last drop of methanol was added. The sample was then centrifuged at 3000 rpm for
25 minutes. The sample was removed and checked to see if a pellet was present and the
supernatant was fairly transparent. The supernatant was then transferred to a clean
16X125 mm tube and stored at 4° C for later analysis. The same procedure was
conducted using acetonitrile in place of methanol. The acetonitrile supernatant was more
transparent than the methanol sample. The acetonitrile sample was handled in the same

114
manner and stored for later analysis.
Two devices were prepared to use with the samples prepared above and taken
through the protocol. Recovery of analyte was achieved using both solvents with more
analyte being recovered with acetonitrile, however recovery of analytes were less than
with previous runs. This raised the question of were the organic solvents were reacting
with the antibodies resulting in the poor recovery of analytes.
The procedure was performed two more times using acetonitrile only with spiked
synthetic blood samples. A new step was added following centrifugation and transfer of
the supernatant to a clean tube. The acetonitrile was evaporated almost to dryness under
a vacuum at 50° C. To each of the two tubes was added 1 ml of a 0.5% saline solution
and the tubes vortexed a second time. The tubes were then centrifuged at 3000 rpm for
25 minutes. The supernatant was transferred into a device which was carried through the
protocol. Recovery of the analyte from both tubes improved and was found to be in the
50% range as compared to 38% in the initial experiments using the synthetic blood.
Two postmortem negative samples were taken and spiked with 25 ng/ml A-9-
THC and treated with the acetonitrile procedure. The samples were then carried through
the extraction protocol. Results matched percent yield studies conducted with the
synthetic blood samples using this same procedure. The percent yield increase held true
for A-9-THCA experiments using the acetonitrile procedure prior to extraction. From
this point forward all experiments were conducted using the acetonitrile procedure to
prepare the samples.
Antibody Binding Studies Using Extraction Device
Seven extraction devices were prepared using the glutaraldehyde protocol and
then tested using ELISA reagents to determine the approximate binding capacity for A-9-

115
THC and A-9-THCA of a device. This experiment was conducted five different times.
Samples spiked from 10 to 1000 ng/ml were used plus a negative sample. Absorbance
values from the experiments followed an inverse curve as expected. Those devices
containing the lowest concentration of analyte showed the largest range of absorbance
readings while increasing the concentration, narrowed the absorbance values seen.
As the antibody sites became saturated with analyte, fewer of the enzyme-tagged
THC derivatives were able to be bound and subsequently washed out of the devices prior
to adding the color reagent. The fewer the THC derivatives bound within a device the
expectation would be decreased to no color change. This is exactly what is shown by the
experiments. One would also expect the absorbance value ranges to become narrower as
the concentration of analyte increased for the same reasons. This is also shown in the
experimental results.
The devices showed the ability to bind a concentration of A-9-THC of between
200 and 500 ng/ml. At 1000 ng/ml, the device was found to be totally saturated with no
color change noted. The absorbance range at 500 ng/ml was 0.0097 to 0.0433 which
indicates that this concentration probably saturates most all antibody sites since the
absorbance values differ by only 0.0336. At the 200 ng/ml concentration, absorbance
demonstrated a range difference of 0.1360 which indicates that binding sites were still
available.
For each of the 35 devices to show a binding capacity of 200 ng/ml or more is
adequate for performing extractions on postmortem blood samples. The concentration of
A-9-THC usually seen in postmortem blood samples is less than 20 ng/ml: The highest
value that this researcher has seen in a postmortem blood sample was 53 ng/ml in an
individual who was smoking marijuana at the time of death. Taking into account the
116
addition of 25 ng/ml of A-9-THC-D3 and 50 ng/ml of A-9-THCA-D3, this totals less than
100 ng/ml which leaves sufficient binding capacity for extracting A-9-THCA. The 35
devices made for this experiment demonstrates that this protocol is consistent from batch
to batch for extractions of both analytes.
Percent Yield Studies
Percent yield studies were conducted to determine the average concentration
recovered from a spiked 1 ml sample as compared to a direct standard. These
experiments were conducted for A-9-THC and A-9-THCA at 25 ng/ml separately using
100 prepared devices (50 for each analyte) over a ten day timeframe. The average
percent yield for A-9-THC was 54% with a range of 50 - 61%. A-9-THCA had a 47%
yield with a range of 37 - 52%. These experiments were conducted using the acetonitrile
clean up protocol which had previously been shown to provide the best percent yield
from extraction devices. These results are fairly consistent in regards again to the making
of extraction devices but need to be improved with future research. A standard statistical
test of reliability was performed for both analytes to ensure the values obtained met
Cronbach's alpha for reliability within each experiment. Both A-9-THC and A-9-THCA
met the criteria having alpha scores of 0.954 and 0.803 respectfully.
Research using different chemical linking molecules or choosing a different
device that would allow for consistent orientation of antibodies, possess fewer variables
for spread of bound antibodies and/or are more resistant to organic solvents and heat are
all areas for future research in drug extractions from difficult matrices. Improvement of
extraction efficiency would also allow lower detection and quantitation levels to be
achieved.

117
Effect ofA-9-THC Concentration on Binding ofA-9-THCA
A study was conducted where both A-9-THC and A-9-THCA were added together
in the same device at equal concentrations to establish if the there was an effect on the
binding capacity of A-9-THCA. Concentrations ranged from 10 - 150 ng for each
analyte. Percent yield of both analytes were practically the same until the concentration
of A-9-THC was greater than 60 ng. The percent yield of A-9-THCA began to fall above
this level and continued to fall as the concentration of A-9-THC was further increased.
When the concentration of A-9-THC was 150 ng approximately 30 ng of A-9-THCA was
recovered even though 150 ng of A-9-THCA had been added to the device.
These results speak to the specificity of the antibody for A-9-THC as compared to
A-9-THCA. However, this finding would have limited impact on using the device as an
extraction method for both analytes. It must be pointed out again that these levels of both
analytes would not be found in a real sample.
Linearity Studies
Two types of linearity studies were performed during this project. The first was
extracting each analyte singly and the second was an extraction of both analytes along
with their respective internal standards.
Negative blood samples were spiked at concentrations of 5, 10, 25 and 50 ng/ml
of A-9-THC. The samples were extracted and then analyzed by GC/MS. Extraction of
A-9-THC gave a linear curve with an r2 of 0.998. Extraction of A-9-THCA gave a linear
curve with a r of 0.997. No attempt was made to extend the curve using the single
analytes since no real extraction would be done without using deuterated internal
standards.
The linear curves for both analytes with their internal standards was performed by
118
spiking negative blood samples at 2, 5,10,25 and 50 ng/ml of A-9-THC and A-9-THCA
along with 25 ng/ml A-9-THC-D3 and 50 ng/ml A-9-THCA-D3. Limiting the curve to
50 ng/ml was due to the loss of A-9-THCA when A-9-THC concentration went above 60
ng/ml. Both analytes were extracted simultaneously in runs using the extraction device.
Results of the curves were r2 of 0.995 for A-9-THC and 0.997 for A-9-THCA.
These experiments demonstrate the ability to extract both analytes of interest from
a single device which means that real samples can be handled in the same manner with
both analytes being extracted in one run. This is the only extraction method this
researcher is aware of where both analytes are extracted in a single step.
First Analysis of True Postmortem Samples
Analyses of postmortem samples received from the Mississippi were divided into
four groups. The first group analyzed for A-9-THC was those samples reported as "None
Detected". The ten samples were prepared using the acetonitrile protocol and then
extracted using prepared devices the same day. A set of calibrators ranging from 3 - 5 0
ng/ml and two controls at 5 and 30 ng/ml were also run with the samples. The calibration
curve met the criteria for being linear and the controls were within ± 20% of expected
values. The samples were run twice on separate days under the same conditions.
Both groups agreed with the findings reported by the Mississippi Crime
Laboratory. There was no A-9-THC detected in any of the 10 samples during either run
(see Figures 22 and 23). Internal standards added were recovered and met the criteria for
being acceptable (see Figures 24 and 25).

119
Figure 22
CcnpMidrr l:
RetHbiThw:
CoioeitalM:
PaK.fal:
me mil
ig.tnl
Tone I
Ft .mil. trie H'ljlt
Oudllti I
The Raigs
Qidller2 owtqr
Palo Paige Pa* Hf iy.*il
IIO90 11.130
Figure 22: Represents a negative sample of A-9-THC as reported by the Mississippi Crime Laboratory. The three required ions are not present as indicated by failure of the computer to integrate and would not fit any confirmation criteria.

Figure 23
Compound # 1:
Retention Time:
Concentration:
Pass/Fail:
THCA
min
ng*m
BOS07A3EA
100
80907A3GA
100i
3:SIR 0+ 488.00
"•Tune
13.100
BOHFA35A
100
BOGOTA^
100
Tsg*l
Rt (min) mh Height Time Range Ratio Range Ratio P/F ngAnl
Figure 23: Represent a negative sample from the Mississippi Crime Laboratory for A-9-THCA. The three ions are obviously not present and would not meet criteria for confirmation.

Figure 24
Compound IP 2:
Retention Tine:
Concentration:
Pass/Fail:
THCJK
11.11 mm
USMngM
Pass
P90507A34A
hoo 11.11
11.100
P9090WMA
hoo 11,11
11.100
1:SIR EI+
11:W
" Time
Rt (min) mA
11.IK 38900
II.Ill 3030)
Height
I ISO}
7333
Time Range
'Haiin:
Ratio Range Ratio
\(x>a
O'Xriqf
P/F ngAnl
Pact IflM
P3«
Figure 24: Internal standard ions recovered from extraction of negative A-9-THC sample seen in figure 22. Note the ions passed criteria for being acceptable.

Figure 25
Compound 12:
Retention Tone:
Concentration:
Pass/Fail:
THCA.D3
13.06 inn
UKMngAnl
Pass
P90SJ7A5A
hOOi 13,06 3:SIR FJ+
374 ? C r f i
13.100 "•Tune
3:SIR EI+
?43rf
'Time
Tmel
Rt (min) mk
tTSOO
Height
:*30x
S223Q
lime Range Ratio Range
350 » 0
Ratio
O'NIfqf
P/F ngrtnl
IOOJO Paw
256 Pa«
Figure 25: Internal standard ions recovered from negative A-9-THCA sample seen in figure 23. Note the ions met criteria for being considered acceptable.

123
The second group of samples analyzed was those reported with A-9-THC present
and quantitated (see Figures 26 and 27). Paired t results from the first run were compared
to a critical value for t ,oi(9) was 3.250. The Paired t value found was 4.384 indicating a
significant difference between the results. The samples extracted with the device showed
a negative bias averaging 0.32 ng/ml. The second group analyzed also showed a
significant difference between the groups as well with a Paired / value of 6.034. A
negative bias was noted again with a slight average difference of 0.35 ng/ml.
These results indicate the device is capable of extracting A-9-THC and the results
obtained are comparable to results from another laboratory using a different extraction
technique. This is a critical element of the project for it clearly demonstrates the ability
to accurately quantitate A-9-THC that is important in postmortem blood samples because
this is the compound that is responsible for impairment of the central nervous system.
The third group of samples to discuss is the finding for A-9-THC A which was
analyzed twice for all 30 samples. Two of the 30 samples were found to be negative
which agrees with the reports from the Mississippi Crime Laboratory. The other 28
samples were reported to contain A-9-THCA (see Figures 28 and 29). Those samples
that had a reported value above 50 ng/ml were diluted in order to bring them in the linear
range of the assay and then multiplied by the dilution factor for their final result.
The A-9-THCA samples were analyzed 10 at a time along with their respective A-
9-THC analyses. Statistical analysis of the first group of 28 showed a significant
difference between the results obtained with the extraction device and the results reported
by the Mississippi Crime Laboratory as was described in the results chapter.

Figure 26
124
Compound # 1:
Retention Time:
Concentration:
Pass/Fail:
THC
11.14mm
2.000 ngAnl
Pass
390SQ7A27A 100
1:SIR Q+ 11,14 386I
R4q«i
11.T00 11200
BGSJ7A27A 100
B0907A27A 100
0 M • ' ' i ' ' • l 'Time
11.100 11200 0 1 ' " i • • • • i 'Time
11.100 11200
BC507AZ7A 100
I | T i ,,,->l l l l | • f j m e
11.100 11200
T«0fl
Rt (min) mfz Height Time Range
Guaiiitr::
Ratio Range Ratio
Osttlqi
flf ngAnl
I I . IK 39SB0
11.136 WTflO
11.136 303JQO
25.*
555
» 6
3J.9
1000
305
7^.1
Pace
Pace
Pac«
;a»
Figure 26: Shows the three ions present from a sample whose concentration was calculated to be 2.0 ng/ml of A-9-THC. All three ions meet ration criteria for being considered confirmed and quantitation acceptable. This is sample 2946 from Mississippi Crime Laboratory.

Figure 27
125
Compound* 2:
Retention Time:
Concentration:
Passtfail:
THC.D3
11 12 mm
1.000 ng/M
Pass
B0907A27A
100
1:SIR EI+ 11.12 389j
771*4
0 1 ' ' ' i ' ' ' h ' ' 'Time 11.100
P90907A27A 1:SIR EI+ 11.12 306.00
R7M
11.100 'Time
B0907A27A
100i
11.100
Tag* I
Rt (min) mfc Height Time Range
ouaittr;
Ratio Range Ratio
11.121
M.I2I
33»AO
MSOO
Q*xj\at
P/F ngAnl
Pace IO10
Pace
Figure 27: Internal standards ions recovered with sample seen in figure 26.

Figure 28
126
Compound 11:
Retention Time:
Concentration:
Pass/Fail:
THCA
13.08 mm
22.00 ngjml
Pass
BCB07A27A
100
3:SIR Eh-
i i I 1 " 13.100
^Time
BCB07A77A
100i 13,03 3:SIR Eh-
488.C0
Time 13.100
D90907AZ7A
13.100
Taqtl
Rt (min) m/z Height Time Range
Ouelllet 2
Ratio Range Ratio
QjttiOj
Ptf ng/ml
I3D76
13B76
13376
ru»
«33i»
*T3fl0
;tas>
3 8 »
735:
no Pac?
Pact
Figure 28: A-9-THCA extracted from Mississippi Crime Laboratory sample 2946. Note all three ions are present and the result is 22 ng/ml. This analyte was extracted at the same time as the A-9-THC extracted from the same device shown in Figure 26.

Figure 29
127
Compound 12:
Retention Trnie:
Concentration:
Pass/Fail:
THCA.D3
13.07 mil
1.000 naM
Pass
BC507A27A 3:SR Q+ 1 0 0 1307 371
%
"•Time 13.100
p905)7AZ7A noo
3:SIREI+ 13,07 476.00I
"'Time T3.100
D90907A27A
hoo 13,07
3:SR EI+
1/Rrf
'"'Time 13.100
Tajel
Rt (min) m/i Height Time Range
Qurilltr;
Ratio Range Ratio
o«iiqr
P/T ng/ml
I3D56
13066
37*00
tTSOO
133100
33JSO
13010 13.130
JOfl » £
I00O Face
25fl P*CC
Figure 29: A-9-THCA internal standard ions from sample 2946 shown in figure 28.

128
There was a negative bias noted averaging 5.4 ng/ml less than the reported values.
The calculated mean for the first group was 21.6 with a range of 5 - 60 ng/ml.
The second analytical run also showed a significant difference between the results with a
mean of 21 ng/ml again with a negative bias of 5.9 ng/ml. The mean value for the
reported values was 27.0 with a range of 6 - 69 ng/ml.
There were four samples that had to be diluted X2 because of values above the
linear range of 50 ng/ml. All eight results came back well within 20% of the reported
value. Given A-9-THCA only indicates previous use and does not apply to impairment,
these values would be acceptable for reporting.
The last A-9-THC group to be discussed was the samples reported as "None
Detected Due to Interfering Substance". This group is considered the most critical of all
the analyses run for it tests whether the extraction process actually removed the
interfering substances.
Two of the ten samples were found to contain no A-9-THC at a concentration of 1
ng/ml. The other eight samples did confirm the presence of and give quantitative results
for A-9-THC. These findings indicate that any substance that interfered with the analysis
of these samples when performed by another laboratory using a different extraction
technique had been removed.
The extraction device performed as anticipated proving an extraction approach
using such device with bound antibody for a specific drug is a viable option. The device
proved to be simple to use, of low cost and not require the multiple steps encountered
with today's common extraction procedures.
One of the main obstacles encountered during the project was the time required to
bind the antibodies to the polystyrene flask in preparation for extractions. The initial step

was a four hour incubation to bind the glutaraldehyde to the flask followed by a three
hour incubation period of binding the antibodies to the glutaraldehyde. Take into
account the time for washing steps in between the two incubation periods along with the
minimum of one hour for incubation of the sample, 20 min wash in hexane to release the
analytes, 20 min evaporation of the hexane and one hour incubation for derivatization,
the total time from start to instrument was approximately 10 hours. Research should be
performed to establish if any of these times could be shortened by using different binding
chemistries or different type devices.
Future projects for other drugs using this approach could be LSD, 6-
monoacetylmorphine, morphine, oxycodone, alprazolam and others that demonstrate
impairment or toxicity at concentrations in the ng/ml range. Extraction devices that
would hold specific antibodies to different drugs within the same device need to be
investigated.
Such projects are anticipated thesis projects and research for students pursuing
graduate degrees in the field of forensic science with an emphasis in the areas of
Toxicology or Implied Consent.
The new device and process could bring to the field of toxicology the advances
enjoyed in biochemistry and molecular biology in separation and purification of proteins
and DNA from complex matrices using the technique of affinity chromatography. With
no or reduced interfering substances to deal with, instrumentation maintenance and
supply cost would be reduced by as much as 50% and analytical extraction procedures
could be shortened by several hours, thus, improving turn around time for data reporting.
Training of laboratory personnel on this new device would be extremely simple
with basically no learning curve involved. The only steps are adding the buffered sample,

130
incubation, rinsing the device and then releasing the drug for analysis. From that point
forward, the steps are the same as any other extraction protocol for analyzing drugs on
chromatographic instruments.
There is an excellent opportunity for commercial production of the device and
making it available for purchase and use by all laboratories dealing with postmortem drug
testing. The device as envisioned is not costly to produce. The device also eliminates the
use and disposal of high volumes of organic solvents, buffers and glassware presently
used for extraction procedures. Savings on instrument maintenance and supplies would
offset costs even further.
The device also lends itself to extraction of substances other than drugs from
complex matrices provided a specific antibody can be produced against the antigen of
interest. Furthermore, the device is small and portable which makes it practical for use in
the field for collection of suspected toxins or chemicals for later analysis.

APPENDIX
Figure 30
Compound 1 name: THC Coefficient of Determination: 0.994990 Calibration curve: 0.0377391 * x + 0 Response type: Internal Std ( Ref 2 ), Area * (IS Cone. / IS Area )
1.89n
Response-
0 y11111 i i 1111111111 i i 11111111111111111111111111 ii 111 ng/ml 5.0 15.0 25.0 35.0 45.0
Figure 30: A calibration curve for A-9-THC from run 083007A.

Figure 31
Compound 1 name: THCA Coefficient of Determination: 0.996439 Calibration curve: 0.0280418*x + 0 Response type: Internal Std ( Ref 2 ), Area * (IS Cone. / IS Area )
1.43-
Response-I
0 Yi 1111111111111111111111111111111111111111111111111 n g / m l
5.0 15.0 25.0 35.0 45.0
Figure 31: A calibration curve for A-9-THCA from run 082707A.

Table 32
Quantify Sample Summary Report Sample List: C:\TurboMass\USMFSCPRO\SampleDB\061207 Last Modified: Monday May 27 08:18:39 2007 Method: C:\TurboMass\USMFSC\MethDB\THCA Printed: Wed Jun 12 09:10:30 2007
Sample Name: 0612071 THC THC-D3 Sample Name: 0612072 THC THC-D3 Sample Name: 0612073 THC THC-D3 Sample Name: 0612074 THC THC-D3 Sample Name: 0612075 THC THC-D3 Sample Name: 0612076 THC THC-D3 Sample Name: 0612077 THC THC-D3 Sample Name: 0612078 THC THC-D3 Sample Name: 0612079 THC THC-D3 ample Name: 06120710 THC THC-D3 Sample Name: 06120711 THC THC-D3
Sample Qualifiers RT P/F
Sample ID: 2 ng/ml CAL 11.11 Pass 11.12 Pass Sample ID: Spike 1 11.10 Pass 11.12 Pass Sample ID: Spike 2 NF Fail 11.12 Pass Sample ID: Spike 3 11.09 Pass 11.12 Pass Sample ID: Spike 4 NF Fail 11.12 Pass Sample ID: Spike 5 NF Fail 11.12 Pass Sample ID: Spike 6 11.11 Pass 11.12 Pass Sample ID: Spike 7 NF Fail 11.12 Pass Sample ID: Spike 8 NF Fail 11.12 Pass Sample ID: Spike 9 NF Fail 11.12 Pass Sample ID: Spike 10 NF Fail 11.12 Pass
Cone. ng/ml
2.0 1.0
0.6 1.0
0 1.0
0.2 1.0
0 1.0
0 1.0
0.4 1.0
0 1.0
0 1.0
0 1.0
0 1.0
Table 32: Experiment for LOD at 0.5 ng/ml. The first injection was a 2.0 ng/ml extracted standard. The 10 subsequent injections were to determine the Limit of Detection for A-9-THC. Samples failed 7 out of 10 injections.

Table 33
Quantify Sample Summary Report Sample List: C:\TurboMass\USMFSC.PRO\SampleDB\061207 Last Modified: Monday May 27 08:18:39 2007 Method: C:\TurboMass\USMFSC\MethDB\THCA Printed: Wed Jun 12 19:21:00 2007
Sample Name: THC THC-D3 Sample Name: THC THC-D3 Sample Name: THC THC-D3 Sample Name: THC THC-D3 Sample Name: THC THC-D3 Sample Name: THC THC-D3 Sample Name: THC THC-D3 Sample Name: THC THC-D3 Sample Name: THC THC-D3 Sample Name: THC THC-D3 Sample Name: THC THC-D3
06120712
06120713
06120714
06120715
06120716
06120717
06120718
06120719
06120720
06120721
06120722
Sample Qualifiers RT P/F
Sample ID: 2 ng/ml CAL 11.11 Pass 11.12 Pass Sample ID: Spike 1 11.10 Pass 11.12 Pass Sample ID: Spike 2 11.11 Pass 11.12 Pass Sample ID: Spike 3 11.09 Pass 11.12 Pass Sample ID: Spike 4 11.10 Pass 11.12 Pass Sample ID: Spike 5 11.10 Pass 11.12 Pass Sample ID: Spike 6 11.11 Pass 11.12 Pass Sample ID: Spike 7 11.10 Pass 11.12 Pass Sample ID: Spike 8 11.10 Pass 11.12 Pass Sample ID: Spike 9 11.11 Pass 11.12 Pass Sample ID: Spike 10 11.10 Pass 11.12 Pass
Cone. ng/ml
2.0 1.0
0.8 1.0
1.1 1.0
0.9 1.0
1.2 1.0
1.2 1.0
1.1 1.0
0.9 1.0
0.8 1.0
1.1 1.0
1.1 1.0
Table 33: Experiment for LOQ at 1.0 ng/ml. The first injection was a 2.0 ng/ml extracted standard. The 10 subsequent injections were to determine the Limit of Quantitation for A-9-THC. Analysis gave a mean of 1.02 ng/ml. All samples met criteria 10 out of 10 injections.

Table 34
Quantify Sample Summary Report Sample List: C:\TurboMass\USMFSC.PRO\SampleDB\061207 Last Modified: Monday May 27 08:18:39 2007 Method: C:\TurboMass\USMFSC\MethDB\THCA Printed: Wed Jun 12 09:41:07 2007
Sample Name: 0612071 THCA THCA-D3 Sample Name: 0612072 THCA THCA-D3 Sample Name: 0612073 THCA THCA-D3 Sample Name: 0612074 THCA THCA-D3 Sample Name: 0612075 THCA THCA-D3 Sample Name: 0612076 THCA THCA-D3 Sample Name: 0612077 THCA THCA-D3 Sample Name: 0612078 THCA THCA-D3 Sample Name: 0612079 THCA THCA-D3 Sample Name: 06120710 THCA THCA-D3 Sample Name: 06120711 THCA THCA-D3
Sample Qualifiers RT P/F
Sample ID: 5 ng/ml CAL 13.09 Pass 13.07 Pass Sample ID: Spike 1 13.09 Pass 13.07 Pass Sample ID: Spike 2 13.08 Pass 13.07 Pass Sample ID: Spike 3 13.09 Pass 13.06 Pass Sample ID: Spike 4 13.09 Pass 13.07 Pass Sample ID: Spike 5 13.09 Pass 13.07 Pass Sample ID: Spike 6 13.08 Pass 13.06 Pass Sample ID: Spike 7 13.10 Pass 13.08 Pass Sample ID: Spike 8 13.09 Pass 13.07 Pass Sample ID: Spike 9 13.09 Pass 13.07 Pass Sample ID: Spike 0 13.09 Pass 13.06 Pass
Cone. ng/ml
5.0 1.0
0.8 1.0
1.5 1.0
0.9 1.0
1.7 1.0
1.1 1.0
2.1 1.0
1.9 1.0
0.8 1.0
1.1 1.0
1.5 1.0
Table 34: Experiment for LOD at 2.0 ng/ml. The first injection was a 5.0 ng/ml extracted standard. The 10 subsequent injections were to determine the Limit of Detection for A-9-THCA. All samples met criteria 10 out of 10 injections.

Table 35
Quantify Sample Summary Report Sample List: C:\TurboMass\USMFSC.PRO\SampleDB\061207 Last Modified: Monday May 27 08:18:39 2007 Method: C:\TurboMass\USMFSC\MethDB\THCA Printed: Wed Jun 12 09:41:07 2007
Sample Name: THCA THCA-D3 Sample Name: THCA THCA-D3 Sample Name THCA THCA-D3 Sample Name THCA THCA-D3 Sample Name: THCA THCA-D3 Sample Name THCA THCA-D3 Sample Name THCA THCA-D3 Sample Name THCA THCA-D3 Sample Name THCA THCA-D3 Sample Name THCA THCA-D3 Sample Name THCA THCA-D3
06120712
06120713
: 06120714
06120715
06120716
06120717
06120718
06120719
06120720
06120721
06120722
Sample Qualifiers RT P/F
Sample ID: 5 ng/ml CAL 13.09 Pass 13.07 Pass Sample ID: Spike 1 13.09 Pass 13.07 Pass Sample ID: Spike 2 13.08 Pass 13.07 Pass Sample ID: Spike 3 13.09 Pass 13.06 Pass Sample ID: Spike 4 13.09 Pass 13.07 Pass Sample ID: Spike 5 13.09 Pass 13.07 Pass Sample ID: Spike 6 13.08 Pass 13.06 Pass Sample ID: Spike 7 13.10 Pass 13.08 Pass Sample ID: Spike 8 13.09 Pass 13.07 Pass Sample ID: Spike 9 13.09 Pass 13.07 Pass Sample ID: Spike 10 13.09 Pass 13.06 Pass
Cone. ng/ml
5.0 1.0
2.9 1.0
3.2 1.0
2.8 1.0
3.1 1.0
3.1 1.0
3.0 1.0
2.8 1.0
2.9 1.0
3.1 1.0
3.2 1.0
Table 35: Experiment for LOQ at 3.0 ng/ml. The first injection was a 5.0 ng/ml extracted standard. The 10 subsequent injections were to determine the Limit of Quantitation for A-9-THCA. All samples met criteria 10 out of 10 injections.

Figure 32
100-
28
306
303 \
389
386 \
\ 1 1 1 1 1 1 1 1 * • 11 1 1 1 1 1 1 1 1 1 1
6 306 326 i i i I i i i i | i i i i | i i i i | i i i i | i i i i i1 i
346 366 386 111111111 m/z
406
(?|J&I@I ^Iffll lb|M|lt£MEtf| CD|fJ.|©| \H\t\ n c U l *
100-
%
85 10.73
1: SIR of 5 Channels EI+ TIC
6.46e4
I I I I I I I I
10.93 11.13 i i 11 1111111 M i | M 111 i i i i Time
11.33 11.53
Figure 32: Chromatographic peak and selected ions for A-9-THC from sample 1662. This sample was reported with interfering substances and unable to quantitate. Using the device, there were no interfering substances noted and 4.1 ng/ml was found present.

Figure 33
100i
%H
306 389
286
303 \ i I i i I ' I
306 I " " l ' '
326
387 \ m/z
346 366 386 406
G g [ & l a l ^91H) N i l I L ^ | ^ l L l i | ^ | ^ | j a | f & _©] _tfe) nc| + | »
100-
1: SIR of 5 Channels EI+ TIC
2.25e5
10.75 10.95 11.15 11.35 11.55 T Time
Figure 33: A sample reported with interfering substances. This is sample 6482 from the Mississippi crime Laboratory. There are no interfering substances noted and the sample was found to be negative for A-9-THC.

Figure 34
10CH
%H
374
371 \
473 488
11111111 l'i 1111111111111111111111111111111111111111111111111 I'I 111 i • 111111111
350 370 390 410 430 450 470 490 510 m/z
l i i ir il - ^ ^ ^ ^ il r ^ ^ ^ i I 1 j J - - - . . I - 1 . I j . . . . J ^ ^ T .1 . . . . ..]__ 1 . T ^ —J *-""* J 1 -. . . .1
100n
I I | I I I I | I I
12.71 • i i •
12.91
3: SIR of 5 Channels EI+ TIC
1.34e5
I M I | I I I I | l I I I | I I I I | I I I I
13.11 13.31 13.51 Time
Figure 35: Sample 2946 for A-9-THCA. 24 ng/ml were found present in this analysis as compared to 27 ng/ml reported by the Mississippi Crime Laboratory.

140
BIBLIOGRAPHY
Argurell, S., Hallidin, J., Lindgren, E., Ohlson, A., Widman, M., Gillespie, H., &
Hollister, L. (1973). Pharmocokinetics and Metabolism of A-9-
Tetrahydrocannabinol and other Cannabinoids with emphasis on man.
Pharmacol. Rev. 38: 21 - 4 3 .
Axen, R., Porath, J. & Ernback, S. (1967). Nature. 214: 1302 - 1312.
Bagnati, R., Oriundi, M.P., Russo, V., Danese, M., Berti, F. & Fanelli, R. (1991).
Determination of Zeronal and P-zeronal in Calf Urine by Immunoaffinity
Extraction and Gas Chromatography-Mass Spectrometry After Repeated
Administration of Zeronal. JChromatgr. 564:493-502.
Bandet, F., Theze, J. & Zovali, M. (1991). UV-treated Polystyrene Microtiter
Plates for use in an ELISA to Measure antibodies against Synthetic
Peptides. J. Immunol. Methods. 142, 73-82.
Baselt, R.C. (1982). Disposition of Toxic Drugs and Chemical in Man. 2nd Ed.
(pp 715 - 719). Biomedical Publications, Davis, CA.
Brennand, D.M., Danson, M.J. & Hough, D.W. (1986). A Comparison of ELISA
Screening Methods for Production of Monoclonal Antibodies against
Soluble Protein Antibodies. J. Immunol. Methods. 93, 9-16.
Burns, M. (2003). Medical-Legal Aspects of Drugs, (pp 235-251). Lawyers &Judges
Publishing Company, Inc., Tucson, AZ.
Catt, K. & Niall, H.D., (1967). Nature. 213: 825 - 827.
ChiChu, M.H. & Drummer, O.H. (2002). Determination of A-9-
Tetrahydrocannabinol in Whole Blood using Gas Chromatography Mass
Spectrometry. J. Anal. Toxicol. 26,575-581.

141
Cook, C.E., Seltzman, H.H., Schindler, Tallent, V.H., Chin, K.M. & Pitt, C.G. (1992).
Radioimmunoassays for Cannabinoids. (NIDA Research Monograph No. 42, 19-
32): Washington D.C.: U.S. Government Printing Office.
Crouch, D.J., Birky, M.M., Gust, S.W., Rollins, D.E., Walsh, J.M, Moulden, J.V.,
Quilan, K.E. & Beckel, R.W. (1993). The prevalence of drugs and alcohol in
fatally injured truck drivers. J. Forensic Sci. 38: 1342-1353.
D'Asaro, J.A. (2000). An automated and simultaneous solid-phase extraction of A-9-
tetrahydrocannabinol and 1 l-nor-9-carboxy-A-9-tetrahydrocannabinol in whole
blood using the Zymark Rapid Trace™ with confirmation and quantitation by
GC-EI-MS. J. Anal. Toxicol. 24: 289-295.
Drummer, O.H. & Gerostamoulos, J,. (2002). Postmortem Drug Analysis: Analytical
and Toxicological Aspects. Therap. DrugMonit. 24(2): 199-209.
Dufresne, C , Favette, P., Paradis, C. & Bonlieu, R. (2001). Comparative Study
of Liquid-Liquid Extraction and Solid-phase Extraction Methods for the
Separation of Sufentanil from Plasma Befoe Gas Chromatography Mass
Spectrometric Analysis. Clin. Chem. 47, 600-602.
Felgate, P.D. & Dinan, A.D. (2000). The determination of A-9-tetrahydrocannabinol and
1 l-nor-9-carboxy-A-9-tetrahydrocannabinol in whole blood using solvent
extraction combined with polar solid-phase extraction. J. Anal. Toxicol. 24: 127-
132.
Gardas, A. & Lewartowskey, A. (1988). Coating of Proteins to Polystyrene
ELISA Plates in the Presence of Detergents. J. Immunol. Methods. 106,
251-255.
Garriott, J.C, Di Maio, V.J. & Rodriquez, R.G. (1986). Detection of cannabinoids in
homicide and motor vehicle fatalities. J. Forensic Sci. 37(4): 969-983.
Gerber, C.E., Bruchelt, G., Gotze-Speer, B. & Speer, C.P. (2000). Detection
By ELISA of Low Transferrin Levels in Bronchioalveolar Secretions
of Preterm Infants. J. Immunol. Methods. 233, 42-45.
Graves, H.C.B. (1988). The Effect of Surface Charge on Non-specific Binding
of Rabbit Immunoglobulin G in Solid-Phase Immunoassay. J. Immunol.
Methods. 111,157-166.
Gude, T., Preiss, A., & Rubach, K. (1995). Determination of chloramphenicol in
muscle, liver, kidney and urine of pigs by means of immunoaffinity
chromatography and gas chromatography with electron capture detection. J.
Chromatogr. B 673(2): 197-204.
Gustafson, R.A, Moolchan, E.T., Barnes, A., Levine,B. & Huestis, M.A. (2003).
Validated method for the simultaneous determination of A-9-
tetrahydrocannabinol (THC), 11-hydroxy-THC and ll-nor-9-carboxy-THC in
human plasma using solid phase extraction and gas chromatography-mass
spectrometry with positive chemical ionization. J Chromtogr. B 798: 145-154.
Haagsma, N. & van de Water, C. (1992). Monoclonal Antibody Mediated clean-up
Procedure for the High Performance Liquid Chromatographic Analysis of
Chloramphenicol in Milk and Eggs. J. Chromatogr. 478: 205 - 216
Hage, D.S., (1998). Periodate Oxidation of Antibodies for Site-selective Immobilization
in Immunoaffinity Chromatography. J. Biochem. Biophys. Methods. 147: 69 —
82.

Hale, J. (1995). Irreversible, oriented immobilization of antibodies to cobalt-
iminodiacetate resin for use as immunoaffinity media. Anal. Biochem. 231: 46-
49.
Hawks, R.L. (1992). Analysis of Cannabinoids: Introduction and Review. (NIDA
Research Monograph No. 42, 1-6) Washington D.C.: U.S. Government Printing
Office.
Hollister, L.E. (1992). Drugs of Abuse: In B.G Katzung (Ed.). Basic and Clinical
Pharmacology (pp 445-448). Appleton and Lange, East Norwalk, CT.
Huang, W., Moody, D.E., Andrenyak, D.M., Smith, E.K., Foltz, R.L., Huestis,
M.A. & Newton, J.F. (2001). Determination of A-9-Tetrahydrocannabinol
and 1 l-Nor-9-Carboxy-A9-Tetrahydrocannabinol in Human Plasma by
Solid-Phase Extraction and Gas Chromatography-Negative Ion Chemical
Ionization Mass Spectrometry. J. Anal. Toxicol. 25, (531-537).
Heustis, M.A. (2003). Principles of Forensic Toxicology. 2nd Ed. B. Levine, Ed.
(pp 246 - 264). AACC, Washington, D.C.
Huestis, M.A., Mithcell, J.M., & Cone, E.J. (1995). Detection times of marijuana
metabolites in urine by immunoassay and GC-MS. J. Anal. Toxicol. 19: 443-449.
Johns, M.A., Rosengarten, M.J. & Regnier, F.E. (1996). Enzyme-linked immunosorbent
assays in a chromatographic format. J. Chromatogr. A 73(1): 195-206.
Josten, A., Haalck, L. Spener, F. & Meusel, M. (2000). Use of Microbial
Transglutmase for Biotinylation of Antibodies. J. Immunol. Methods, 240,
47-54.
Kelly, P., & Jones, R.T., (1993). Metabolism of Tetrahydrocannabinol in
Frequent and Infrequent Marijuana Users. J. Anal. Toxicol. 85: 51 - 56.

Kelly, T.H., Foltin, R.W., Emurian, C.S. & Fischman, M.W. (1993). Performance based
testing for drugs of abuse: dose and time profiles of marijuana, amphetamine,
alcohol and diazepam. J. Anal. Toxicol. 17: 264-272.
Kindt, T.J., Goldsby, R.A. & Osborne, B.A. (2007). Immunology 6th Ed. (pp 12 -
20). W.H. Freeman & Co., New York, NY.
Klasen, E.A., Rigutti, A., Bos, A. & Bernini, L.F. (1982). Development of a
Screening System for Detection of Somatic Mutations. I. Enzyme
Immunoassay for Detection of Antibodies against Specific Hemoglobin
Determinants. J. Immunol. Methods, 54, 241-250).
Klasen, E.A., Rigutti, A., Bos, A. & Bernini, L.F. (1983). Development of a
Screening System for Detection of Somatic Mutations. I. The use of
Peptides and Insoluble Protein Fragments in a Non-competitive Solid-
Phase Enzyme Immunoassay. J. Immunol. Methods, 59, 281-289.
Kim, H.O., Durance, T.D. & Li-Chan, E.C. (1999). Reusability of avidin-biotinylated
immunoglobulin Y columns in immunoaffmity chromatography. Anal. Biochem.
164: 383-397.
Levine, B.L., 2003. Principles of Forensic Toxicology. 2nd Ed. (pp 185-201). AACC
Press, Washington D.C.
Lin, D-L. & Lin, R-L. (2005). Distribution of 11-Nor-9-Carboxy-A-9-
Tetrahydrocannabinol in Traffic Fatality Cases. J. Anal. Toxicol. 29: 5 8 - 6 1 .
Love, R.A., Villafranca, J.E., Aust, R.M., Nakamura, K.K., Jue, R.A., Major, J.G., et al.
(1993). How the anti-(metal chelate) antibody CHA255 is specific for the metal
ion of its antigen: X-ray structures for two Fab'/Hapten complexes with different
metals in the chelate. Biochemistry 32: 10950-10959.

145
Manno, J.E., Manno, B.R., Kemp, P.M., Alford, D.D., Abukhalef, I. K.,
McWilliams, M.E., Hagaman, F.N. & Fitzgerald, M.J. (2001).
Temporal Indication of Marijuana Use Can be Estimated from Plasma
and Urine Concentrations of A-9-Tetrahydrocannabinol 11-Nor-A-
9-Tetrahydrocannabinol Carboxylic Acid. J. Anal. Toxicol, 25, 538-549.
Marnell, T., 2006. Drug Identification Bible. 5th Ed. (pp 289 - 304). Amera-
Chem, Inc., Grand Junction, CO.
Mason, A.P., Perez-Reyes, M., McBay, A.J. & Foltz, R.L. (1983). Cannabinoid
concentrations in plasma after inhalation of marijuana smoke. J. Anal. Toxicol. 7:
172-174.
Mason, A.P. & McBay, A.J. (1984). Ethanol, marijuana and other drug use in 600
drivers killed in single-vehicle crashes in North Carolina, 1978-1981. J. Forensic
Sci. 29: 987-1026.
McBay, A.J. (1988). Interpretation of blood and urine cannabinoid concentrations. J.
Forensic Sci. 33(4): 875-883.
Moeller, M.R., Doerr, G. & Warm, S. (1992). Simultaneous quantitation of delta-9-
tetrahydrocannabinol (THC) and ll-nor-carboxy-delta-9-tetrahydrocannabinol
(THC-COOH) in serum by GC/MS using deuterated internal standards and its
application to a smoking study and forensic cases. J. Forensic Sci. 37: 969-983.
Moody, D.E., Crouch, D.J., Smith, R.P., Cresalia, C.W., Francom, P., Wilkins, D.G. &
Rollins, D.E. (1991). Drug and alcohol involvement in railroad accidents. J.
Forensic Sci. 36:1474-1484.

Moody, D.E., Monti, K.M., & Crouch, D.J. (1992). Analysis of forensic specimens for
cannabinoids. II. Relationship between blood A-9-tetrahydrocannabinol and blood
and urine 1 l-nor-A-9-tetrahydrocannabinol-9-carboxylix acid concentrations. J.
Anal. Toxicol. 16: 302-306.
Neidbala, R.S., Kardas, K.W., Fritch, D.F., Kardo,S., Fries, T., Waga, J., Robb, J.,
& Cone, E.J. (2001). Detection of Marijuana Use by Oral Fluid and Urine
Analytes Following Single Dose Administration of Smoked and Oral
Marijuana. J. Anal. Toxicol. 25, (289-301).
Ordronneau, P., Abdullah, L.H. & Petrisz, P. (1991). An Efficient Enzyme
Immunoassay for Glutamate using Glutaraldehyde Coupling of the
Hapten to Microtiter Plates. J. Immunol. Methods. 93, 169-176.
Peat, M.A., Finkle, B.S. & Deyman, M.F. (1982). Laboratory Evaluation of
Immunoassay Kits for the Detection of Cannabinoids in Biological Fluids.
(NIDA Research Monograph No. 42, 85-92) Washington, D.C.: U. S.
Government Printing Office.
Rosenfeld, J., Bowins, B., Roberts, J., Perkins, J. & MacPherson, A.S. (1974).
Loss of Cannabinoids by Adhesion to Glass and Plastic Containers. Anal.
Chem. 46:2232-2238.
Rosenthal, D. & Brine, D. (1979). Quantitative Determination of A-9-Tetra-
Hydrocannabinol in Cadaver blood. J. Forensic Sci, 24, 282-290.
Rotmans, J.P. & Delwel, H.R. (1983). Cross-linking of Schistisoma mansoni
Antigens and their Covalent Bindng on the Surface of Polysyrene
Microtitration Trays for use in ELISA. J. Immunol. Methods, 59, 281-
287).

Rule, G. & Henion, J. (1992). Determination of Drugs from Urine On-Line
imrnunoaffinity chromatography-high-performance Liquid
Chromatography-Mass Spectrometry 582: 103 - 112.
Samyn, N., De Boeck, G., & Verstraete, A.G. (2002). The use of Oral Fluid and Sweat
Wipes for the Detection of Drugs of Abuse in Drivers. J. Forensic Sci. 47(6):
1380-1387.
Smith, M.L. (1999). Immunoassay: In B. Levin (Ed.), Principles of Forensic
Toxicology (pp 117-137). AACC Press, Washington D.C.
Sprinthall, R.C. (1994). Basic Statistical Analysis, 4th Ed. (pp372-389). Allynand
Bacon, Needham Heights, MA.
Stenberg, M. & Nygren, H. (1981). Kinetic of Antigen-Antibody Reactions at
Solid-Liquid Interfaces. J. Immunol. Methods. 113, 3-15.
Suresh, K., Ramanadham, M. & Nadimpalli, S.K. (2002). An ELISA Method to
Quantify the Mannose-6-Phophate receptors. J. Biochem, Biophys. 52,
(111-119).
Suter, M. (1982). A Modified ELISA Technique for Anti-hapten antibodies. J.
Immunol. Methods. 53, 103-110.
Thompson, L.K. & Cone, E.J. (1987). Determination of delta-9-tetrahydrocannabinol in
human blood and saliva by high-performance liquid chromatography with
amperometric detection. J. Chromatogr. 421:91-97.
Suter, M. (1982). A Modified ELISA Technique for Anti-hapten antibodies. J.
Immunol. Methods. 53, 103-110.

148
Wassell, J., Reed, P., Kane, J. & Weinkove, C. (1999). Freedom from Drug
Interferences in New Immunoassay for Urinary Catecholamines and
Metanephrines. Clin. Chem. 45, 2216-2233.
Webb, K.S., Baker, P.B., Cassells, N.P., Francis, J.M., Johnston, D.E., Lancaster,
S.L., Reed, G.D. & White, S.A. (1996). The Analysis of Lysergide
(LSD): The Development of a Novel Enzyme Immunoassay and
Immunoaffinity Affinity Extraction Procedures Together with a HPLC-
MS Confirmation Procedure. J. Forensic Sci 41: 938 - 946.
Wong, A.S., Orbanosky, M.W., Reeve, V.C. & Beede, J.D. (1992). Stability of Delta-9-
Tetrahydrocannabiol in Stored Blood and Serum. (NIDA Research Monograph
No. 42,119 - 124): Washington D. C: U.S. Government Printing Office.
Wylie, D.A., Lu, D., Carlson, R., Babacan, K.F., Schuster, S.M. & Wagher, F.W. (1992).
Monoclonal Antibodies Specific for Mercuric Ions. Proc Natl Acad Sci 89: 4101
-4108.

Thomas S. Pittman P.O.Box 15114
Hattiesburg, MS 39404 601.266.4176 (office) 601.297.1771 (cell)
[email protected] thomas.s.nittmanfflusm.edu
EDUCATIONAL BACKGROUND
2008 University of Southern Mississippi Hattiesburg, MS Major: Biology Degree: PhD Dissertation Topic: Use of A-9-Tetrahydrocannabinol Monoclonal Antibodies Chemically Bound to Polystyrene Using Glutaraldehyde for the Purpose of Extracting A-9-Tetrahydrocannabinol and A-9-Tetrahydrocannabinol Carboxylic Acid from Postmortem Whole Blood Samples for Analysis by Gas Chromatography Mass Spectrometry
1989 University of Southern Mississippi Hattiesburg, MS Major: Biology Degree: MS
1978 University of Southern Mississippi Hattiesburg, MS Drgree: BS Major: Biology Minor: Chemistry
1976 Jones County Junior College Ellisville, MS Degree: A A Major: Chemistry
EMPLOYMENT HSTORY
August 2005 to present University of Southern Mississippi Instructor for the Department of Administration of Justice Forensic Science Division. Responsibilities include class lectures and laboratory instruction to undergraduate students seeking degrees in Administration of Justice or Forensic Science. Establish class curriculum criteria, graduation criteria and advise students pursuing a Forensic Science degree. Pursuit of research in the field of Forensic Science especially relating to the specialty of Forensic Toxicology.

150
August 2000 - present Self- Employed Consultant: ToxConsulting, LLC Consultant for law firms dealing with interpretation of drug and alcohol impairment as they relate to probable cause of accidents and/or injury(s). Serve as consultant for major instrumentation manufacturer. Duties are instructor for operation and maintenance of gas chromatographic and mass spectroscopy instrumentation and Beta site tester of new products and software.
August 2000 - August 2005 Mississippi Crime Laboratory Section Chief-Toxicology Responsibilities include supervision and training of forensic scientists as well as day-to-day operations of the Toxicology Section. Method development, verification and equipment purchases and performance of analytical testing are part of my duties.
August 1998 -2000 Self-employed Consultant and President of Diversified Laboratory Services, LLC. Responsibilities included set up of all aspects of a Toxicology screening laboratory. Establish and validate esoteric testing methods and training of employees in client laboratories.
April 1984 - July 1998 Puckett Laboratory Assistant Laboratory Manager Duties included oversight of the day-to-day operations of the main clinical laboratory and three regional laboratories. Method development, procedure manuals, supervision of employees, accreditation and budgeting comprised the specific responsibilities.
Puckett Laboratory Director of Clinical Toxicology Responsible for supervision and training of toxicology employees, method development, CAP-FUDT accreditation and client resource for issues dealing with all aspects of drug and alcohol testing in the workplace.
Puckett Laboratory Positive Certifying Scientist Duties included training of employees in NID A laboratory and review of analytical data plus chain-of-custody for drug and alcohol results.
Puckett Laboratory Supervisor of Special Chemistry Duties included direct supervision of employees; maintain accreditation, procedure manuals and equipment maintenance.
Puckett Laboratory Research and Development Assistant Responsible for updating drug testing procedures and equipment to secure accreditation from CAP-FUDT and NID A.

151
TEACHING EXPERIENCE
William Carey College
Pharmacology for Nurses Chromatography Medical Genetics Comparative Anatomy Clinical Chemistry
University of Southern Mississippi
Physical Science Biology Medical Genetics Cellular Physiology Forensic Toxicology Arson and Explosives Drug Identification Introduction to Forensic Science Forensic Analysis
GRANTS
Concept Proposal Submitted to National Institute of Justice, November, 2005 Accepted February, 2006; Full Proposal submitted March, 2006. Not funded.
Forensic Science Initiative Department of Justice, September 2006. $2 M fully funded.
PRESENTATIONS
Coroner's 2001 Fall Meeting Topic: Proper Collection and Storage of Postmortem Samples
Coroner's 2002 Fall Meeting Topic: Instrumental Analyses of Drugs in Postmortem Samples
Coroner's 2003 Spring Meeting Topic: How the MCL Toxicology Section helps you.
Grand Rounds UMC Pathology Department: Forensic Toxicology (Sept. 2003)
Municipal Prosecutors Conference: June 2004 Topic: Basic Toxicology for Prosecutors

Prosecutor's 2004 Spring Meeting Topic: An Overview of Forensic Toxicology
Grand Rounds UMC Pathology Department: Postmortem Drug Testing (October 2004)
Prosecutor's Fall Meeting: October 2004 Topic: Forensic Toxicology - What it is and What it is not.
Perkin Elmer International Sales Meeting July 2005 Topic: Use of GC/MS SIFI Mode in Forensic Toxicology
2006 ASCLS-MS/LSCLS Annual Meeting April 2006 Topic: Forensic toxicology; "What it is and What it is not."
COURT/EXPERT WITNESS TESTIMONY
Gave expert testimony on cocaine metabolite result in vitreous fluid by Immunoassay. Testimony given via video tape at offices of Baker Donelson in Jackson, MS August 7, 2007. (Wanda Collins vs Ford Motor Co.)
Gave expert testimony by deposition concerning blood testing for Cannabinoids by immunoassay. Jerry Cooper Payne, Administrator vs Stephen R. Thomas, Does 1-10 and Doe 11. March 15,2007. (Case pending Panola County Circuit Court).
Testified as expert witness concerning a person's ability to drive a motor vehicle with a blood alcohol concentration of 0.22% and the approximate number of drinks required to obtain said blood alcohol concentration. (Adams County Circuit Court, February, 2007, Yancey vs Ford Motor Co.)
Testified as expert witness on interpretation of ethyl alcohol in combination with SOMA in motion to suppress drug evidence. (Circuit Court, Pearl River County, State of MS vs D. Bordelon, March, 2006)
Testified as expert witness on amphetamine drug toxicology. (Circuit Court, Warren County: State of MS vs R. Vaughn, December, 2005)
Testified as expert witness on the effects of ethyl alcohol on a person's ability to operate a motor vehicle. (Circuit Court, Harrison County, January, 2005)
Gave testimony in deposition concerning blood/serum alcohol assay using a VITROS 950 dry slide instrument.. (November, 2004 - Deposition taken at Baker Donelson, Jackson, MS - Case of Sandra Coleman vs. Ford Motor Co., et. al.#2002-0209-CV-l).

Testified as expert witness on effects of cocaine on victim in homicide case. (Circuit Court, George County, December, 2004)
Testified as expert witness on negative alcohol and drug test results of homicide victim. (Circuit Court, October, 2003)
Testified as expert witness on Etomidate and Laudanosine. (Circuit Court, Forrest County, State of MS vs Stephanie Stevens, September, 2003)
Testified as expert witness on urine marihuana confirmation. (Justice Court, June 2003)
Testified as expert witness on urine marihuana confirmation. (Justice Court, May, 2003)
Testified as expert witness on methods for analysis of "crack" cocaine. (Municipal Court, May 1996)
Testified as expert witness in arbitration case concerning methods used in screening and confirmation of marihuana in urine. (May, 1992)
Testified as expert witness on the validity of methods used for analysis of blood alcohol. (Circuit Court, January 1992)
Testified as expert witness in case concerning passive inhalation of "crack" cocaine as well as methods used for the detection of cocaine and cocaine metabolites in urine. (Federal Court, April 1991)
Testified as expert witness in DUI case concerning ingestion of ethyl alcohol over a 12 hour period and the effects on subsequent blood alcohol levels. (Circuit Court, April 1991)
Testified as expert witness on chain-of-custody procedures for receiving, testing, storage and return of marihuana exhibits for Metro Narcotics Force. (Youth Court, April 1991)
Testified as expert witness on methods used for the detection and quantificati ethyl alcohol, marihuana and cocaine metabolite in blood. (Circuit Court, November 1989)

154
PUBLICATIONS: Peer-reviewed journals, abstracts and presentations/posters
Broussard, L., Broussard, A., Pittman, T., & Lirette, D. (2000). Case Report: Death Due to inhalation of Ethyl Chloride. Journal Forensic Sciences, 45(1), 223-225.
Broussard, L., Broussard, A., Lirette, D., & Pittman, T. (1999, February). Death due to inhalation of ethyl chloride. Paper presentation at the American Academy of Forensic Sciences Annual Meeting, Orlando, FL.
Broussard, L., Broussard, A., Pittman, T., & Lierette, D. (1999). Death due to inhalation of ethyl chloride. Proceedings of the American Academy of Forensic Sciences, V, 269.
Broussard, L., Lafferty, D., Pittman, T., & Presley, L. (1998, February). Headspace Gas Chromatographic Method for the Measurement of Difluoroethane in Blood. Paper presented at the American Academy of Forensic Sciences Annual Meeting, San Francisco, CA.
Atkins, K. D., Broussard, L., Broussard, A., Brustowicz, T., Lafferty, D., Lierette, D., Pittman, T., & Presley, L. (1998, Mav l Inhalant Abuse in the New Orleans Area: 2 Case Studies. Paper presentation at the Southern Association of Forensic Scientists (SAPS) Spring Meeting; New Orleans, LA.
Broussard, L., Pittman, T., Lafferty, D. & Presley, L. (1998). Headspace Gas Chromatographic Method for Measurement of Difluoroethane in Blood. Proceedings of the American Academy of Forensic Sciences. IV, 248
Broussard, LA, Presley L, Pittman T, Clouette R, Wimbish GH. The Simultaneous Identification and Quantification of Codeine, Morphine, Hydrocodone and Hydromorphone in Urine as Trimethylsilyl and Oxime Derivatives. Clin Chem 1997:43 (6) 1029-32
Broussard LA, Brustowicz T, Pittman T, Atkins K, Presley, L. (1997). Case Report: Two Traffic Fatalities Related to the Use of Difluoroethane. Journal of Forensic Sciences, vol. 42(6); 1184-86
Broussard LA, Blakeney J. Pittman T, Presley L. (1997). False Negative Methadone Results in Diabetic Patient. AACC Southeast section and Clinical Chemists of Georgia Spring Meeting Program. Atlanta. GA March (abstract)
Broussard LA, Brustowicz T, Pittman T, Atkins K, Presley L. Measurement of Difluroethane in Blood by Gas Chromatography. (1997) AACC Southeast section and Clinical Chemists of Georgia Spring Meeting. Atlanta. GA (abstract)
Broussard LA, Blakeney J, Pittman T, Presley L. False Negative Results for Drugs of Abuse in Diabetic Ketoacidosis. Clinical Chemistry. 43(6) S207 (abstract)

155
Blakeney, J., Broussard, L., Pittman, T., & Presley, L. (1997, March). False Negative Methadone Results in a Diabetic Patient. Paper Presentation at the Annual Meeting of the AACC. Atlanta, GA.
Pittman, Thomas S. Characterization of dictytine granules and associated matrices in species of Cribrariacea: Myxomycetes. University of Southern Mississippi, Hattiesburg, MS Thesis, May 1989


![REVIEW Development in Voltammetric Analysis with Chemically … cyclodextrin/Nafion modified glassy carbon electrode was investigated [67]. The tetrachlorophthalate(III) was bound](https://img.pdfslide.net/doc/110x75/606b582dd7f4be62e9012efa/review-development-in-voltammetric-analysis-with-chemically-cyclodextrinnafion.jpg)