Embed Size (px)
Citation preview

CHEMINSTRUMENTS
LOOP TACK TESTER
MODEL LT-1000
OPERATING INSTRUCTIONS
PRODUCT DESCRIPTION ................................................................................................2 UNPACKING ......................................................................................................................3 ASSEMBLY ........................................................................................................................4
Key Components ......................................................................................................5 OPERATION .......................................................................................................................6
Theory of Operation .................................................................................................6 Power Up .................................................................................................................6 Menu Format ............................................................................................................7 Load Cell Calibration ...............................................................................................9 Calibration Procedure ..............................................................................................9 Scale .......................................................................................................................10 Audible Beep .........................................................................................................10 Running a Test .......................................................................................................11 Test Procedure .......................................................................................................11 Grip Operation .......................................................................................................12 File Management ...................................................................................................13 Reviewing Test Data ..............................................................................................13 Data Storage ...........................................................................................................14 Deleting Test Data .................................................................................................14
EZ-LAB-SYSTEM ............................................................................................................15 Installation..............................................................................................................16 Operation................................................................................................................16 Calibration..............................................................................................................17 Remote Test ...........................................................................................................17 Data Set Information ..............................................................................................18 Storing Data ...........................................................................................................20 Graph Screen ..........................................................................................................21 Review Data ...........................................................................................................26 Save to Excel ..........................................................................................................29 Tabulate..................................................................................................................29 Overlay ...................................................................................................................31
MAINTENANCE ..............................................................................................................38 Trouble Shooting ...................................................................................................38
WARRANTY ....................................................................................................................39
LT-1000 Created on 10/1/2009 10:09:00 AM

PRODUCT DESCRIPTION
Congratulations on the purchase of your new ChemInstruments LT-1000 Loop Tack
Tester. This versatile, user-friendly, carefully designed instrument allows you to determine
loop tack values of adhesive laminates.
The unit has the following features:
• Automated test sequence.
• Selectable units of measure; kilograms, grams, newtons, pounds, & ounces.
• Stores up to 20 test in memory.
• Collected test data can be exported via RS232 port.
• Stored test data is available for review.
• Compatible with optional EZ-Lab System.
2

UNPACKING
ChemInstruments has made every effort to ensure that the LT-1000 arrives at your
location without damage. Carefully unpack the instrument and check for any damage that
might have occurred during shipment. If any damage did occur during transit, notify the
carrier immediately.
The ChemInstruments LT-1000 consists of the following parts:
• The test frame, which includes the motor/drive mechanism and the data acquisition
system.
• An envelope with this manual.
• Grip and fastening pin.
Make sure all of these components are present before discarding packaging material.
3

ASSEMBLY
Carefully remove the test frame/data acquisition assembly from the packaging and set
it on a sturdy bench top. The space required for the unit is approximately 12" wide x 15"
deep x 16" high. As with any precision piece of test equipment, it is preferable to locate the
LT-1000 in an area where temperature and humidity are controlled to standard conditions (72
± 2°F, 50 ± 5% relative humidity).
Attach the Grip to the load cell mounting yoke using the small straight pin to hold it
in place. Make sure the sample grip is mounted with the flip lever toward the front. Connect
the power cord to its receptacle on the backside of the control cabinet. Complete the
connection by inserting the male end of the power cord into an appropriate AC outlet. Notice
that the on/off power switch is located directly beside the power cord receptacle on the
backside of the test frame. (See Photo 1 – LT-1000 Cabinet Back)
The ChemInstruments LT-1000 is now ready for calibration and use. Before proceeding
with calibrating the LT-1000, it is advisable to become familiar with the Key Components of the
LT-1000. These Key Components and a brief description of their function follow in the next
section.
RS-232 Connector
Power Switch
h bi
4

KEY COMPONENTS (See Photos 1 and 2) • POWER SWITCH is located on the back panel of the control cabinet directly beside the
power cord connection.
• TEST PANEL BRACKET provides a holder for a standard 1-inch wide test panel.
• LOAD CELL ASSEMBLY consists of the mounting bracket for the load cell with grip.
• GRIP secures the test sample loop to the load cell.
• MAST the track that the load cell assembly travels during the testing cycle.
• DIGITAL DATA DISPLAY provides test data results and system status information.
• PROGRAM STATUS INDICATOR these three LED lights identify the operating
status, either; Run, Print, or Setup Menus are active when LED light is on.
• UNITS INDICATOR there are five LED lights indicating the units of measure for the
data collected. They are, kilograms, grams, newtons, pounds, and ounces.
• CONTROL KEYS control the various features of the data acquisition and operating
system. There are 5 keys consisting of Select, Enter, Up↑, Down↓, and Units.
• RS232 CONNECTION data output port for downloading test data.
Test Panel Bracket
Grip
Mast
Control Keys
Program Status
Units Indicator
Display
5

OPERATION
THEORY OF OPERATION A pressure-sensitive adhesive laminate sample is formed into a standard loop. This loop,
with the adhesive on the outside, is brought into contact with a standard test panel and retracted
at a set speed. An electronic load cell measures the tack force, then feeds the information to a
data acquisition unit. The data acquisition unit collects the data from the load cell and stores
these data points in memory for use in calculating the maximum, minimum and average values.
The data acquisition unit assigns a file number and saves the results in memory. This data can be
downloaded through the RS232 connection port, to an appropriate receiving program on your
PC.
POWER UP
Turn on the master power switch, located on the back panel of the control cabinet directly next to the power line
receptacle. The onboard computer will go through a self-test and then display the high (peak) force for the last
test. The system is now ready for conducting the next loop tack test.
" Warning! Operating temperature for this equipment is 0 to 70 Celsius. The equipment needs to be completely free of condensation inside and
out, before applying power."
6

7
MENU FORMAT There are three distinct Menus for the LT-1000. They are the Run menu, Print menu,
and Setup menu. Each menu has an indicator light that will be on when that menu is active.
Within each menu there are a series of modes that display the data collected, calibration
sequence, and data storage/transfer.
Each of the three menus uses the Up ↑ and Down ↓ arrow keys to access the modes
within the menu. When the desired mode is displayed the Enter key is used to access the
parameter settings for that mode. Once a parameter selection is made the Enter key is used to
record the setting and return to the Run menu.
The following is an outline of the three menus and the modes contained within each
menu. Use this chart to quickly identify the location and proper path to access any of the
settings.
RUN MENU
Modes
I Instantaneous force
A Average of last test
H Maximum of last test
L Minimum of last test
PRINT MENU
Modes
P Data transfer to PC
St Data storage on/off
dL Data storage delete
SETUP MENU
Modes
F Force
LC Low calibration
HC High calibration
rS Remote
bE Beep on/off

There is also a Units key that allows you to change the unit of measure to any of the five
choices, kilograms, grams, newtons, pounds, & ounces. The green LED lights to the right of
the display indicate the current active unit of measure.
8

LOAD CELL CALIBRATION
It is important to calibrate the load cell to ensure that reliable data will be gathered. A
calibration procedure is built into the software of the LT-1000. This procedure should be
followed upon first use of the LT-1000 and whenever necessary thereafter. The following is
the step-by-step procedure for calibrating the load cell.
MAKE SURE THE LT-1000 HAS BEEN ON AND RUNNING FOR 20 MINUTES BEFORE PROCEEDING WITH CALIBRATION. TO AVOID THIS WARM-UP PERIOD, LEAVE THE LT-1000 POWER ON WHEN NOT IN USE.
CALIBRATION PROCEDURE
1. Move the Load cell assembly containing the load cell to the upper idle position. Make
sure the engaging pin is activated to lock the assembly in this position.
2. Confirm that the Grip is properly attached to the load cell mounting yoke and secured by
the mounting pin.
3. Simultaneously press the Select and Enter keys for 3 seconds to access the Setup menu.
4. When the “F” is visible on the Display, press the Enter key to access the calibration
sequence.
5. At the “LC” display, determine the Low Offset Value desired (Typically 0.00). Make
sure that you do not have a weight hanging from the Grip, and press the Enter key. The
display will change to, HC for high calibration value.
NOTE: the calibration sequence defaults to grams as the unit of measure. Make sure your calibration weights and entries are in grams.
6. At the “HC” display select a calibration weight close to the maximum expected test value
and hang that weight in the mouth of the Grip so that it hangs straight down.
7. Set the High Offset Value on the Display to correspond with the selected calibration
weight. You can change the displayed value by pressing the Up↑ and Down ↓ keys.
8. Make sure the calibration weight is completely at rest, and then press the Enter key.
The display will change to the “I” mode showing the current reading of force.
9
9. Verify the calibration by hanging a different calibration weight on the Grip. Confirm
that the instantaneous force reading is the same as the selected weight hanging from the
Grip.
10. Repeat the calibration procedure if necessary.
SCALE A current force reading is available by accessing the “I” mode in the Run menu. To
access this mode, simply press the Up↑ key until the display shows “I ####” where the # will be
the current force being measured. This reading should be used only as a quick reference.
NOTE: It is important to remember that the load cell is measuring forces at a rate of 400 times per second. The rate of display on the display screen cannot cycle at this speed. Therefore, the value in the “Scale” reading is only one of the many data points that the load cell is measuring and it is not necessarily representative of the total data reading.
AUDIBLE BEEP
The LT-1000 has an audible beep feature that sounds each time a Control Key is pressed.
This provides confirmation that electrical contact has been made by the key. This audible beep
feature may be turned off by following this procedure.
1. Simultaneously press the Select and Enter keys for 3 seconds to access the Setup menu.
2. From the Setup menu, press the Up ↑ key to select the Beep mode.
3. When the display shows “bE”, press the Enter key to access the settings.
4. Press the Up ↑ or Down ↓ keys to turn the beep feature off or on.
5. After selecting the appropriate setting press the Enter key to activate your choice and
return to the Run menu.
10
RUNNING A TEST
Loop tack tests are conducted according to written test methods, such as ASTM, PSTC,
TLMI and others. These tests are preformed to determine the tack adhesive values of the
selected PSA material as it is removed from a stainless steel test panel. The LT-1000 will
accommodate test panels with dimensions of 1” wide by any length.
Make sure the load cell has been calibrated before conducting a test.
TEST PROCEDURE
The ChemInstruments Loop Tack Tester is very simple to use. The following is the
correct procedure for running a Loop Tack Test:
1. Thoroughly clean a 1” x 6” test panels with a strong solvent such as methyl Alcohol or
Methyl Ethyl Ketone. The test panel should be made of 304 Bright Annealed Stainless
Steel with a surface height roughness of 2 micro inches ± 1 micro inch.
2. Insert a 1” x 6” test panel into the panel holder. Suitable test panels are available from
ChemInstruments.
3. Remove the Grip by removing the release pin. Carefully slide the Grip straight down
until it is clear of the mounting yoke.
4. Cut a test specimen 1” x 5” with the long dimension in the machine direction.
5. Completely remove the release liner from the specimen.
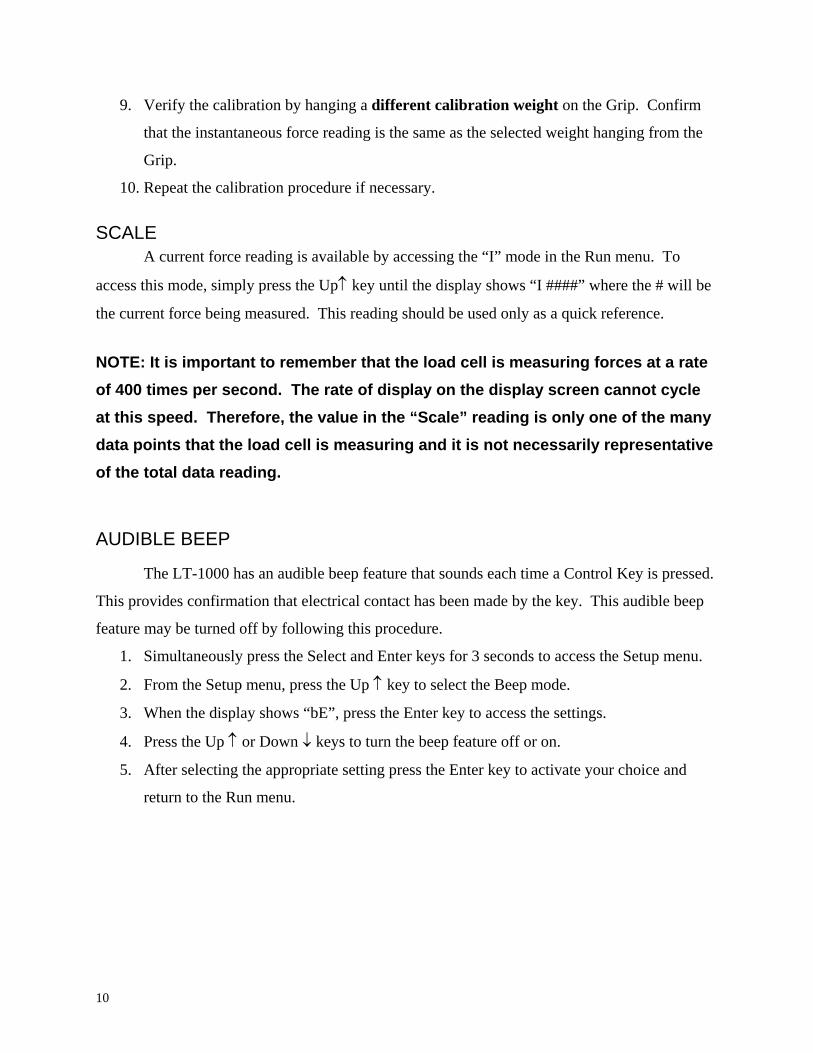
6. Bend the specimen back onto itself, being careful not to crease it, forming a teardrop
shaped loop with the adhesive surface towards the outside.
7. Fasten the ends together using a strip of 1/2” wide
masking tape. (See Figure 1 – Loop Tack Specimen) Masking Tape Adhesive Side Out 8. Insert the tape loop into the specimen Grip until it touches
the spring block near the center of the Grip to ensure
squareness of the sample.
9. Replace the Grip using the release pin to secure it in the
mounting yoke. Figure 1 – Loop Tack
10. Support the Load Cell Assembly to prevent the
11
assembly from falling while pulling on the Release Button to lower the Load Cell
Assembly to the test position
11. Turn the Power Switch to ON.
12. Press the Start Switch and hold it until the Load Cell Assembly starts to move. The
machine will complete one full test cycle and automatically stop when finished.
NOTE : Since the testing area is one square inch, a 1” x 6” test panel may be used several times. After completing a test, slide the test panel to one side in order to expose a clean spot on the panel. Ensure that the footprint of nylon screws from previous test do not interfere with current test.
GRIP OPERATION
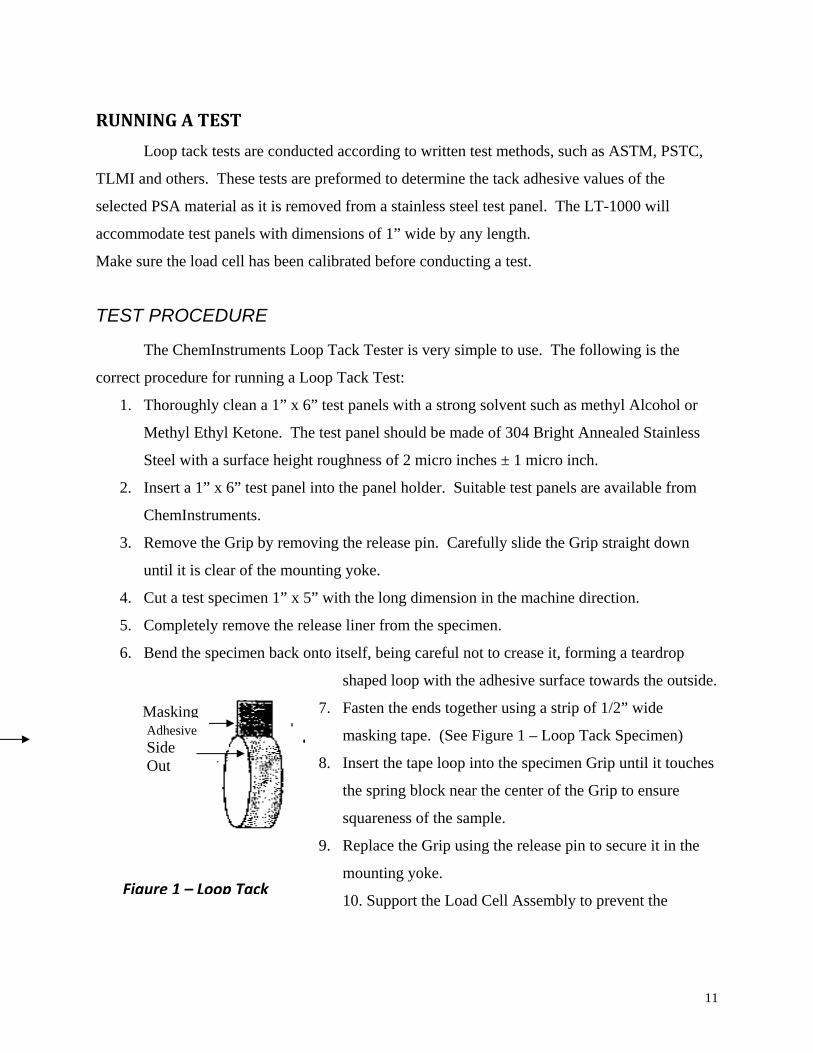
The grip opens by moving the lever to its down position (See Figure 2b – Grip Open).
Insert the free end of the sample into the open grip and close the grip by moving the lever to
its upright position (See Figure 2a – Grip Closed). The grip opening may be adjusted by
rotating the lever – clockwise for thinner samples, counterclockwise for thicker samples.
Figure 2 - Grip Operation
NOTE: The grip is attached directly to the load cell. Do not move the grip sideways or up and down. When opening and closing the grip, support it with one hand and operate the lever with the other hand to avoid damaging the load cell. For proper operation of the load cell it is necessary for the grip to be mounted with a space between the load cell housing and the grip.
WARNING: Rotating the Grip on the threaded mounting rod, causing the Grip to come in contact with the wall of the load cell housing will damage the load cell. There must be a physical gap maintained between the Grip and the load cell housing for the load cell to function correctly.
DO NOT TIGHTEN THE GRIP AGAINST THE LOAD CELL HOUSING
12

FILE MANAGEMENT There are four file management functions available in the LT-1000. They are Review,
Download, Store, and Delete. These four functions are available in three different modes within
the Print Menu. The following sections describe each of these modes and the procedure for
enacting each.
REVIEWING TEST DATA When the Data Storage is turned on, test data is maintained in the memory of the LT-
1000. This data is accessible for reviewing, downloading and deleting. The following
procedures will describe how to review data contained within each test file.
1. Press the Select key to access the Print menu. The Display will show the letter “P”
indicating Print mode.
2. Press the Enter key to access the Print mode.
3. The Display will show “P ####” where # represents the number of the test currently
stored in memory.
4. Pressing the Down ↓ and Up ↑ key will allow you to select any of the individually stored
test files, each one indicated by a different number.
5. After selecting the file number to be reviewed, press the Select key two (2) times to
access that particular file’s data. The Display will change to the “I” or current force
reading.
6. Pressing the Up ↑ key will change the display from “I” to “Average, High, and then
Low.” The numerical values displayed are the test results stored for the selected test file
in the Print mode.
7. A new test can be run while in the review mode. Simply set up your test material in the
Grip, make sure you have a clean test panel in place and push the Start button. The
Display will revert to the current test data at the conclusion of the test.
NOTE: The current test data, (Average, High, and Low values) are always accessible in the Run menu by
pressing the Up↑ key. Each push of the Up↑ key changes the display in the following sequence: I
current, A average, H high, and L low.
13

DATA STORAGE The LT-1000 can store test files in the memory or operate without storing test files. The
following procedure describes how to turn the memory storage function on and off.
1. Press the Select key to select the Print Menu. The Display will initially show the “P”
mode.
2. Press the Up ↑ to select the “St” storage mode.
3. Press the Enter key to access the Storage mode. The Display will show either, “St On”
or “St OFF”.
4. Pressing the Up ↑ or Down ↓ key will toggle the Display between “St On” and “St OFF”.
When the St On is selected the LT-1000 will store up to 20 individual tests in files.
DELETING TEST DATA
The storage limit of the LT-1000 memory is 20 tests. When this limit is reached, an error
message, “SE FULL” is displayed. It is then necessary to delete test data from the memory in
order to allow additional test data to be stored. Deleting test files before the memory is full is
also accomplished with this procedure.
1. Press the Select key to access the Print Menu. The Display will show the letter “P”
indicating Print mode.
2. Press the Up ↑ key until “dL”is displayed. Then press the Enter key to access the Delete
mode. The Display will show “dl 00##” where the ## indicates the number of test files
stored in memory.
3. Pressing the Select and Enter keys together for 3 seconds will delete the stored test files
and return the Display to the Run Menu and “I” mode.
14

EZ-LAB SYSTEM 3.0
OVERVIEW
EZ Lab System software Version 3.0 is designed to enhance your model 1000 or 1100
ChemInstruments test platforms. The following procedure describes how to use the EZ-Lab
System. Should you have any problems or questions after following this procedure, please call
ChemInstruments at 513-860-1598, or contact us by e-mail at, [email protected].
15

INSTALLATION
Insert the EZ Lab disk into the computer. EZ-Lab will self install.
1. If EZ-Lab does not self install, select RUN, (Drive):\Setup.exe
2. Follow the on screen instructions to complete the software installation.
3. Connect the test platform’s RS232 connection to the appropriate port on your computer
with the provided RS232 serial cable.
4. On the computer, open the EZ-Lab program. This file will be located in a folder titled
“EZ-Lab” on the C drive.
5. Double click on the file “EZLabv3.0”. This will open the EZ-Lab System program and
display the Main Screen.
6. Select the appropriate test platform button to activate the program. The operating screen
will appear on your display.
OPERATION
This operating system is designed to provide all the necessary instructions on your
computer screen. However, the following information will provide additional insight.
The Main Operating Screen is divided into 3 sections. The left and right sections are
titled “Setup”. Calibration of the
load cell and choosing the units
of measure are controlled in the
left and right “Load Setup”
section. The right section, title
“Run Test”, is for starting the
motor and setting the test sp
d
eed.
16

CALIBRATION
In order for the load cell to measure forces correctly it is
necessary to calibrate the system. The following procedure
describes the calibration process. The test platform uses Grams for
calibration.
1. Select the “Calibrate” button in the Setup section of the Main
Screen.
2. Follow the on screen instructions exactly, and make sure to
hang the appropriate weight on the load cell Grip when
entering the high calibration value.
3. Verify the calibration by hanging some other known weight on the load cell Grip and
checking the display in the Current Load field.
4. Click on appropriate bullet to select desired unit of measure.
UNITS Click the bullet next to the unit of measure to select the desired unit for data collection
and data analysis. All data will be displayed in the unit selected.
RUNNING REMOTE TEST
The “Start” button automatically starts a test. To
stop the test, move the cart past the “Stop” switch on
the AR-1000, or press the “Stop” button on EZ Lab.
17

DATA SET INFORMATION
Upon completion of every test, the “Data Set Information” will automatically appear.
This allows the operator to record information about the test performed. It will also allow you
select were test data is stored. All fields on the “Data Set Information” page are optional.
The only required field is “File Name”.
File Name – the only required field on the Data Set
Information page. You must enter a file name to save
the test data.
Test Method – optional field.
Data Set ID – optional field.
18
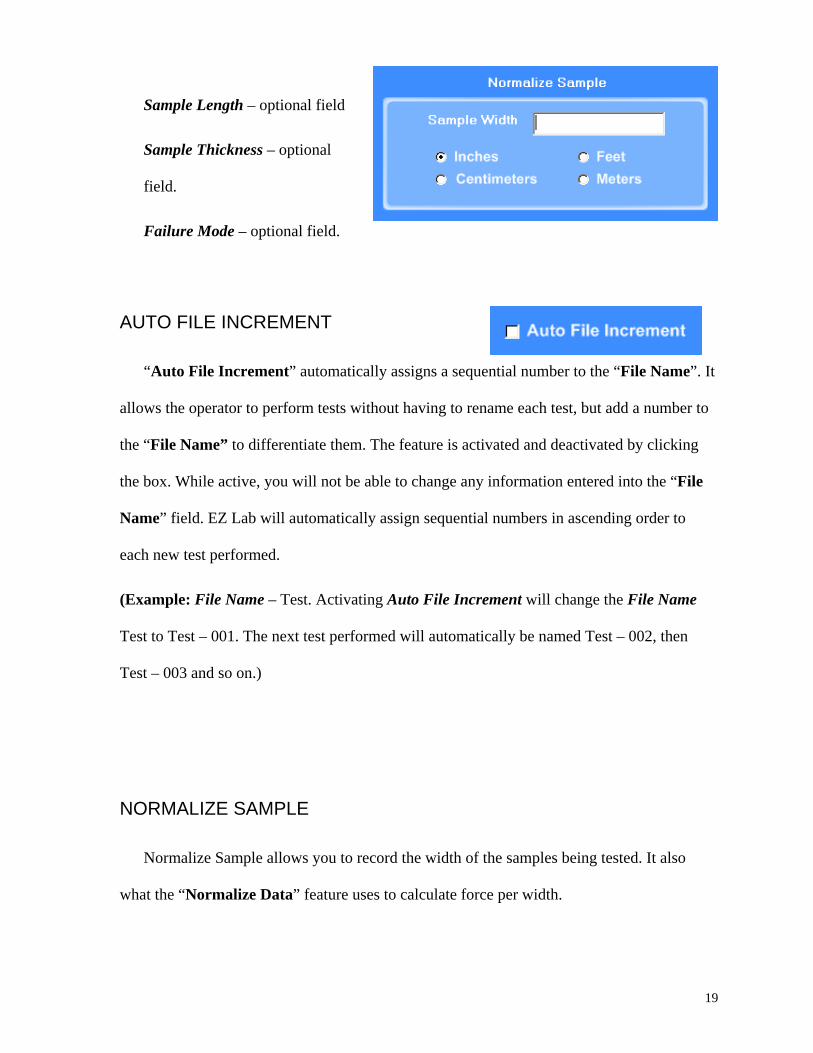
Sample Length – optional field
Sample Thickness – optional
field.
Failure Mode – optional field.
AUTO FILE INCREMENT
“Auto File Increment” automatically assigns a sequential number to the “File Name”. It
allows the operator to perform tests without having to rename each test, but add a number to
the “File Name” to differentiate them. The feature is activated and deactivated by clicking
the box. While active, you will not be able to change any information entered into the “File
Name” field. EZ Lab will automatically assign sequential numbers in ascending order to
each new test performed.
(Example: File Name – Test. Activating Auto File Increment will change the File Name
Test to Test – 001. The next test performed will automatically be named Test – 002, then
Test – 003 and so on.)
NORMALIZE SAMPLE
Normalize Sample allows you to record the width of the samples being tested. It also
what the “Normalize Data” feature uses to calculate force per width.
19

STORING DATA
All data is automatically stored in
a folder on the computers C: drive. EZ
Lab also has the option to store the
“Specify Path” button will allow you
to select an alternative location to store
your data. Once the selection is made it will appear in the box above the “Specify Path”
button. Click the box next to “Save File to Folder Specified Below” to activate the feature.
Click the box again to turn the feature off. The previous entered storage location will remain
in the box to show the last place data was saved.
FINISH AND ABORT
Once all the information has been correctly entered on the “Data Set Information”
screen, click the “Finish” button. This will save the data and EZ Lab will automatically go to
the “Graph Screen”. The “Abort” button discards the data from the previous test and EZ
Lab automatically goes back to the “Main Operating Screen”.
20

GRAPH SCREEN
EZ Lab will automatically display the “Graph Screen” after the data has been entered on the
“Data Set Information” screen. The Graph Screen will graph the profile of forces recorded
during the test and will display the Low, Average, and High values.
CROPPING GRAPHS
The “Graph Screen” provides a cropping feature. Notice the red
vertical lines (markers) located at the left and right sides of the graph.
These markers can be moved horizontally on the graph by using the
21
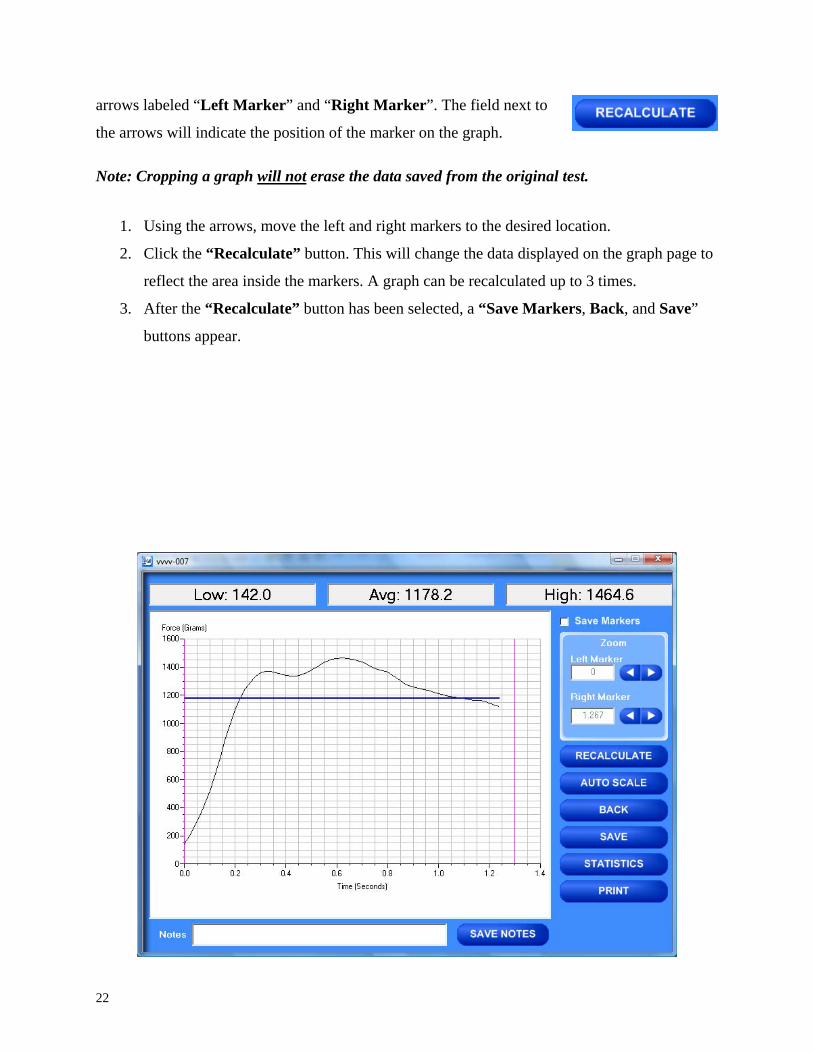
arrows labeled “Left Marker” and “Right Marker”. The field next to
the arrows will indicate the position of the marker on the graph.
Note: Cropping a graph will not erase the data saved from the original test.
1. Using the arrows, move the left and right markers to the desired location.
2. Click the “Recalculate” button. This will change the data displayed on the graph page to
reflect the area inside the markers. A graph can be recalculated up to 3 times.
3. After the “Recalculate” button has been selected, a “Save Markers, Back, and Save”
buttons appear.
22

SAVE MARKERS
EZ Lab automatically records the data from the entire test. The “Save Markers” feature
will hold the place of the left and right marker for future tests. This will automatically crop
all test performed while the feature is on. To turn this feature on, click the box located next to
“Save Markers”. A check mark will appear in the box. To turn it off, click the box again and
the check mark will disappear. Turning off this feature will reset the left and right marker to
the left and right sides of the graph. Future tests will not be cropped automatically.
Note: When the feature is turned on, EZ Lab will save two different files. One file will
include all of the data recorded from the test. The other file will be the data automatically
cropped by using the “Save Markers” feature. These files will be differentiated by the
suffix “-RevA”. The “-RevA” file will be the data automatically cropped by the “Save
Markers” feature. (Example: Test-001 and Test-001-RevA)
AUTO SCALE
The “Auto Scale” button changes the scale of the Y axis of the graph. This feature allows
for an enhanced view of the graph profile. Clicking the “Auto Scale”
button activates the feature. The button will change to “Full Scale”.
Clicking the “Full Scale” button will restore the graph back to the original scale of the Y axis.
23

BACK
The “Back” button is used to undo changes made when cropping the graph. It will appear
after the graph has been cropped by moving either of the markers and clicking the “Recalculate”
button. “Back” will only undo the last recalculation done to the graph.
SAVE
The “Save” button will save the cropped data as a new file with the same “File Name” as
the original file but add the suffix “-RevA”. (Example: Test-001 becomes Test-001-RevA) Only
one “-RevA” file per original test can be saved at a time. Anytime you click the “Save” button, a
“-RevA” file will be saved. If there is an existing file name with a “-RevA” file already, the
existing “-RevA” file will be replaced.
STATISTICS
The “Statistics” button will open a new window and display the Variance, Standard
Deviation, and Work (joules) of the data displayed on the graph. The data
displayed on this screen will change anytime a change is made to the graph. To
exit out of this screen, click either the “OK” button or the red “X” button. EZ
Lab will automatically go back to the graph page.
24

“Print” will allow you to use any printing feature available to your computer. Highlight
the desired printer and click the “Print” button. This will take you to your computers print menu.
You may exit this screen by clicking either “Cancel” or the red “X” buttons.
NOTES
The “Notes” field allows you to enter notes. Clicking the “Save Notes” button will save
the notes. The notes will be stored with the information entered on the “Data Set Information”
page.
HELP
The help button will open a “pdf” file of the machine manual. This manual contains operation
instructions for both the test platform and the EZ Lab software. You must have Adobe Acrobat
Reader on your computer to open “pdf” manual file. If the Adobe program is not already
installed on your computer, a copy of it is included on the EZ Lab disk.
25

REVIEW DATA
The “Review Data” button is located on the Main Operating Page. The “Review Data” feature
will allow access previously recorded test data. The “Review Data” button will take you to the
screen pictured below.
Every time the “Review Data” feature is accessed, the screen will automatically display the test
data located in the EZ Lab test data folder located on your computers C: drive. The individual
tests will be displayed in chronological order with the most recent test appearing on the top of
26

the list. This screen will display the test’s File Name, date and time the test was performed, Low,
Average, and High values for the test performed. To access the test data from a test file, click the
File Name. You will notice the File name is now highlighted. Once a file is highlighted, you may
now use the buttons on the screen to access the test data.
GRAPH
The “Graph” button will access the “Graph screen”. This is the same “Graph Screen”
displayed immediately following the “Data Set Information Screen”. For instructions on
operating the “Graph Screen”.
FILE DETAILS
“File Details” will display all the information
entered on the “Data Set Information screen”.
It will also display the Test Speed, Length of
Test, Average, High, Low, Stand Deviation,
Variance, Work, and Notes recorded for the
individual test. File Details will only display this
information for one test.
DELETE
“Delete” will permanently delete the test file.
27

DELETE ALL
“Delete All” will permanently delete all the test files located in the Test Data Folder located on
your computer’s C: drive.
HELP
The “Help” button will open a PDF file of the machine manual. This manual contains operation
instructions for both the test platform and the EZ Lab software. You must have Adobe Reader
on your computer to open PDF manual file. If the Adobe program is not already installed on
your computer, a copy of it is included on the EZ Lab disk.
The following instructions allow you compile test data from multiple files
28

In order to compile test data from multiple tests, you must first create a list of the test files you
would like to compile. To create a list, highlight a test file and click the “Add To List” button.
To delete a test file from the list, click the desired file on the list and then click the “Remove
From List” button. The “Clear List” button will clear all the files from the list. There is no need
to highlight the files first.
SAVE TO EXCEL
EZ Lab collects data throughout the entire test. This is done by collecting individual data points.
These individual data points are used to display the Low, Average, and High values displayed
from the test. The “Save To Excel” feature allows you to view a list of the individual data points
from every test on the created list. The values will be displayed in the unit of measure selected
on the “Main Operating Screen”. Click the “Save To Excel” button. Follow the instructions on
your screen to create a file name and save the file to the desired location on your computer.
TABULATE DATA
“Tabulate Data” will create a table of data from the files on the list created. Create a list of the
desired test files and click the “Tabulate Data” button. The screen below will appear. The units
of measure displayed will be the units selected on the “Main Operating Screen”.
29

SAVE LIST
“Save List” will save table as a file on the C: drive of your computer. This will allow you to
recall the table at a later time. Click the “Save List” button. Follow the on screen prompts to
select a location to save and name the table. The table should be saved in the Test Data folder
for the AR-1000 located on your computers C: drive. You may save the file in another location,
but it must be moved into this folder in order to be recalled.
SAVE TO EXCEL
“Save To Excel” will save the table to the Microsoft Excel program in the same format
displayed on this screen. The unit of measure the data is reported in will be saved and displayed
in the upper right hand corner of the table. This allows you to use any of Excels feature to further
30

analyze the test data. Click the “Save To Excel” button. Follow the on screen prompts to create a
file name and save the table.
“Print” will allow you to use any printing feature available to your computer. Highlight
the desired printer and click the “Print” button. This will take you to your computers print menu.
You may exit this screen by clicking either “Cancel” or the red “X” buttons.
OVERLAY DATA
“Overlay Data” allows you to overlay
graphs from up to five different tests.
Create a list (see page?). Click the
“Overlay Data” Button. The following
screen will appear. The file names of
the graphed tests will appear in the b
labeled Legend. The file names are
color coded to correspond with the colors of the gra
ox
ph.
31

CROPPING GRAPHS
The “Overlay Screen” provides a cropping
feature. Notice the red vertical lines (markers) located at
the left and right sides of the graph. These markers can be moved horizontally on the graph by
using the arrows labeled “Left Marker” and “Right Marker”. The field next to the arrows will
indicate the position of the marker on the graph.
Note: Cropping a graph will not erase the data saved from the original test.
1. Using the arrows, move the left and right markers to the desired location.
2. Click the “Recalculate” button. This will change the data
displayed on the graph page to reflect the area inside the
markers. A graph can be recalculated up to 3 times.
3. After the “Recalculate” button has been selected, a “Save Markers, Back, and
Save” buttons appear.
BACK
The “Back” button is used to undo changes made when cropping the graph. It will appear
after the graph has been cropped by moving either of the markers and clicking the “Recalculate”
button. “Back” will only undo the last recalculation done to the graph.
32
SAVE
The “Save” button will save the cropped data as a new file with the same “File Name” as
the original file but add the suffix “-RevA”. (Example: Test-001 becomes Test-001-RevA) Only
one “-RevA” file per original test can be saved at a time. Anytime you click the “Save” button, a
“-RevA” file will be saved. If there is an existing file name with a “-RevA” file already, the
existing “-RevA” file will be replaced.
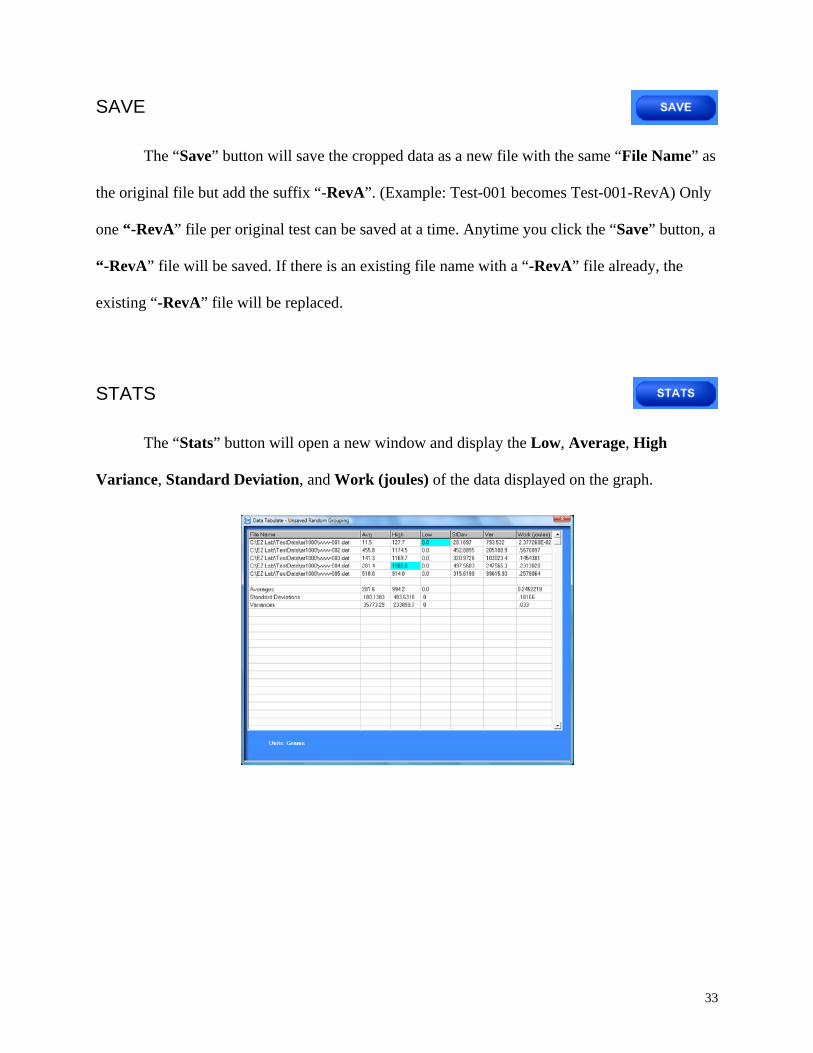
STATS
The “Stats” button will open a new window and display the Low, Average, High
Variance, Standard Deviation, and Work (joules) of the data displayed on the graph.
33

“Print” will allow you to use any printing feature available to your computer. Highlight
the desired printer and click the “Print” button. This will take you to your computers print menu.
You may exit this screen by clicking either “Cancel” or the red “X” buttons.
HELP
The help button will open a PDF file of the machine manual. This manual contains operation
instructions for both the test platform and the EZ Lab software. You must have Adobe Reader
on your computer to open PDF manual file. If the Adobe program is not already installed on
your computer, a copy of it is included on the EZ Lab disk.
CHANGING DIRECTORIES
EZ Lab allows you to store your test data in multiple locations. Files can be stored in any
location connected to your computer. This is accomplished on the “Data Set Information
screen”. To change directories, click the drop down menu bar located on the top of the “Review
Data screen”.
34

Click “Select files to export to excel, tabulate, or overlay graph” (above). This will bring you
to the following screen.
This screen will display all the test files located in the on your computer under the directory
C:\EZ Lab\TestData\ar1000\. To change directories, click the button located to the right of the
directory address bar. Scrolling over the button will pop up a window “Press this to change
directories”. Follow the on screen prompts to select files from a different directory.
This screen allows you all of the same features as the “Review Data screen”. It also allows you
the ability to display previously saved tabulate files and overlay graphs.
35

PREVIOUSLY SAVED TABULATE FILES
To recall previously saved tabulated files,
click the bullet next to “Display
previously saved tabulate files”. You will
notice all previously saved tabulate files
stored under this directory will appear in
the box. Highlight the desired file and
click “Add to List”. Click “Tabulate
Data” to display the previously saved
tabulate file. To remove an item from the list, highlight the item on the list and click the
“Remove From List” button. The “Clear List” button will automatically clear the list, there is
no need to highlight the file first. You can only display one previously saved Tabulate file at a
time.
PREVIOUSLY SAVED
OVERLAY GRAPHS
To recall previously saved overlay files,
click the bullet next to “Display
previously saved overlay files”. You will
notice all previously saved overlay files
stored under this directory will appear in
the box. Highlight the desired file and
36

click “Add to List”. Click “Overlay Data” to display the previously saved tabulate file. To
remove an item from the list, highlight the item on the list and click the “Remove From List”
button. The “Clear List” button will automatically clear the list, there is no need to highlight the
file first. You can only display one previously saved overlay file at a time.
The Display previously saved overlay files screen will bring up the “Overlay Graph” screen. To
operate this screen, see “Overlay Data”.
37
38
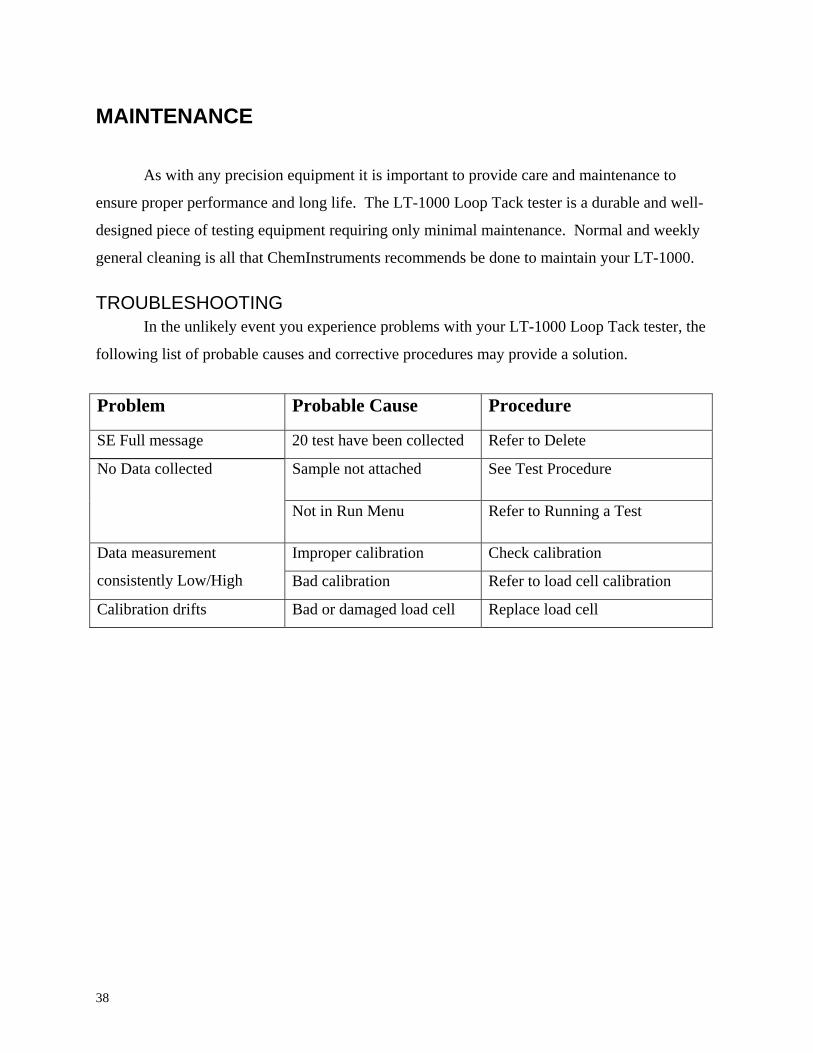
MAINTENANCE
As with any precision equipment it is important to provide care and maintenance to
ensure proper performance and long life. The LT-1000 Loop Tack tester is a durable and well-
designed piece of testing equipment requiring only minimal maintenance. Normal and weekly
general cleaning is all that ChemInstruments recommends be done to maintain your LT-1000.
TROUBLESHOOTING In the unlikely event you experience problems with your LT-1000 Loop Tack tester, the
following list of probable causes and corrective procedures may provide a solution.
Problem Probable Cause Procedure
SE Full message 20 test have been collected Refer to Delete
No Data collected Sample not attached See Test Procedure
Not in Run Menu Refer to Running a Test
Data measurement
consistently Low/High
Improper calibration Check calibration
Bad calibration Refer to load cell calibration
Calibration drifts Bad or damaged load cell Replace load cell