Embed Size (px)
Citation preview
CHEMISTRY 103-104
PRINCIPLES OF CHEMISTRY
Report Sheets for Laboratory Experiments
CARL P. FICTORIE
DORDT COLLEGE
SIOUX CENTER, IOWA
Copyright © 2009
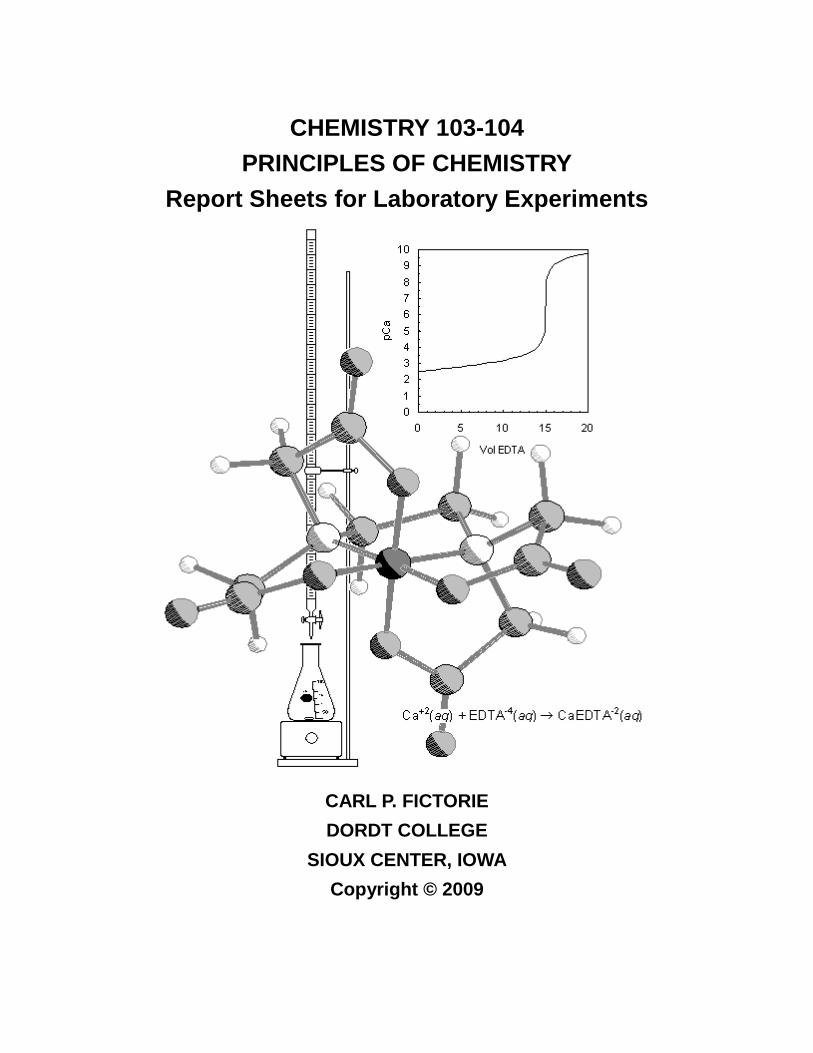
Laboratory Equipment
The following equipment will be necessary to carry out the experiments in this course and
should be in your lab drawer. You may be asked to provide a $5.00 deposit in order to obtain a
key to your assigned drawer. Lost keys will be replaced for a $5.00 fee. Use the list and pictures
in your text to identify your equipment and check that it is present in good condition during
check-in and check-out. You will not be charged for lost or broken equipment, but you must
properly check out and have your T.A. check your lab drawer in order to receive your key
refund.
You will also need a bound laboratory notebook, safety glasses, and a fine point permanent
marker. You would be wise to regularly bring your calculator and textbook to lab.
Fall 103 Spring 104 Equipment In Out In Out 3-250-mL Erlenmeyer flasks ____ ____ ____ ____
3-600-mL or 400-ml beakers ____ ____ ____ ____
1-250-mL beaker ____ ____ ____ ____
4-100-mL beakers ____ ____ ____ ____
1-plastic funnel ____ ____ ____ ____
1-200 mm (8") test tube ____ ____ ____ ____
4-large test tubes (150 mm/6") ____ ____ ____ ____
8-small test tubes (100 mm/4") ____ ____ ____ ____
3-glass stirrers/rubber policemen ____ ____ ____ ____
1-pair of tongs ____ ____ ____ ____
1-100-mL volumetric flask ____ ____ ____ ____
1-10-mL graduated cylinder ____ ____ ____ ____
1-25-mL graduated cylinder ____ ____ ____ ____
1-10 mL pipet ____ ____ ____ ____
1-10 mL graduated pipet ____ ____ ____ ____
1 thermometer ____ ____ ____ ____
1-evaporating dish ____ ____ ____ ____
1-wire screen (may be insulated) ____ ____ ____ ____
1-wash bottle ____ ____ ____ ____
3-watch glasses ____ ____ ____ ____
2-magnetic stir-bar ____ ____ ____ ____
2-spatulas (different styles) ____ ____ ____ ____
1-pair tweezers ____ ____ ____ ____
1-pipette bulb (light blue) ____ ____ ____ ____
1
NAME: _______________________________________ LAB SECTION: ______
PARTNER: _______________________________________
Experiment 1 Report Sheet Laboratory Safety And Chemical Hygiene
Laboratory Protocol Exercise
This exercise is intended to provide you with the reasons behind many of the laboratory
protocols. Pairs of lab partners (4 students) will work as a group on this activity.
For each of the protocols listed, provide reasons for their necessity. You should provide
multiple reasons for each. You should consider the negative impacts of not following the
protocol. For example, the protocol regarding not working alone in the laboratory is justified on
the grounds that: (1) students are new to the lab and need supervision (this reason diminishes
with experience), (2) if one person gets injured, the other person can administer first aid or obtain
help, (3) one person can catch an error or oversight on the part of the other person and call
attention to it before an accident happens or an experiment gets ruined, and (4) if the persons are
working on different projects (as might be the case in industry) the persons can act as witnesses
to each other's work for the purposes of patent protection or result verification. Note that not all
the reasons are based on safety principles.
1. Do not wear jewelry in the laboratory.
2. Wash your hands when you leave the laboratory.
3. Never perform unauthorized experiments.
4. Never bring food or drink into the laboratory.
2
5. Keep your bench space neat and organized.
6. Label all containers (bottles, beakers, flasks, etc.) with the contents.
7. Always confine long hair in the laboratory.
8. Students may bring visitors only with the instructor's consent.
9. Know beforehand the hazardous characteristics of the chemicals with which you will be
working.
10. Wear safety glasses at all times in the laboratory.
3
For each of the statements below, discuss whether it is true or false, including whether other
conditions might impact the veracity of the statement (that is, it might be partly true).
a) Doing things safely is not merely the right way to work—it is the only way.
b) You can get injured in the laboratory even if you have followed all necessary precautions.
c) Gloves will protect your hands from hazardous chemicals.
d) If you can smell a chemical, it is causing you harm.
e) Hazardous waste cannot be poured down a drain (into a sanitary sewer).
f) It is possible to reduce one's risk of injury to zero.
4
Safety Resources and Laboratory Equipment
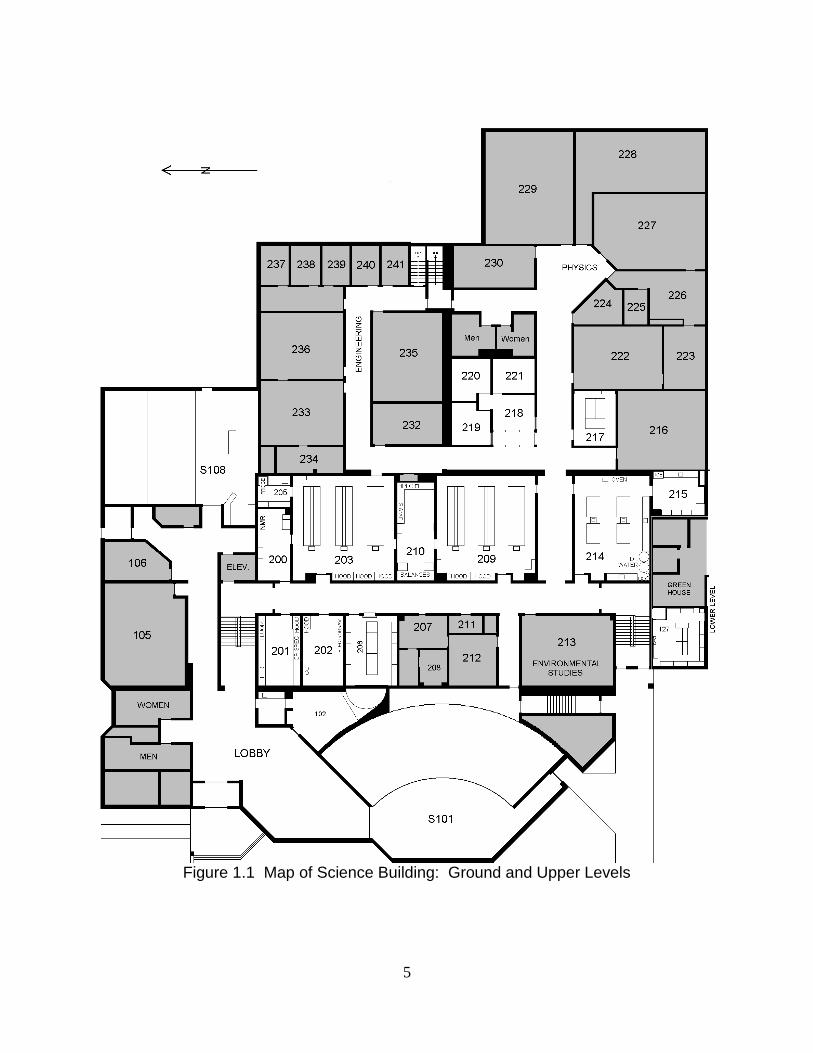
This exercise is intended to familiarize you with the layout of the laboratory, the fixed
equipment, and the safety equipment. Attached is a map of the building.
Evacuating the Laboratory
Knowing how to exit the building quickly can be a matter of life and death. This part of the
exercise is intended to teach you the locations of the three main building exits.
1. Each lab has three exits (one leads to the other lab via the balance room).
2. Each lab exit leads to one of the main building exits (the main lobby exit, the south west exit,
and the east exit).
3. Use the building maps to plot a course from the lab to each exit and draw a line on the map
showing the course.
4. Starting from the lab each time, go to the exit. Outside you will find a lab TA who will
initial this sheet after confirming that the course is acceptable and checking your name (be
prepared to show an ID as we haven't mastered names yet!).
Main Lobby Exit _____ SW Exit _____ East Exit _____
Equipment Scavenger Hunt
This part of the exercise will help you learn the location of various laboratory and safety
equipment. Below is a list of lab equipment. On the map of the chemistry labs, indicate the
location of the equipment using the abbreviation given. Many items are located in the lab, but
some are in SB210, the hall, or the lobby. Find the equipment in both labs as you might work or
need emergency equipment from the other lab. Identify below any items you could not find.
Equipment List Analytical Balances (AB) Instructor's Mailbox (MB)
Broken Glass Box (BG) MSDS Binder (MSDS)
Storage cubbies (ST) Normal Trash Can (NT)
DI Water Carboys (DI) Paper Towel Holder (PT)
Drinking Fountain (DR) Recycling Bin (RB)
Dust Pan and Brush (DP) Pencil Sharpener (PS)
Emergency Response Flip-book (ER) Reagent Balances (RB)
Eye Wash (EW) Safety Shower (SS)
Fire Alarm Pull Station-Hall (FA) Public Telephone (PH)
Fire Alarm Pull Station-Lab (FA)
Fire Blanket (FB)
Fire Extinguisher-Hall (FE) Emergency Phone Numbers
Fire Extinguisher-Lab (FE) Fire:
First Aid Kit (FK) Police:
Graded Homework Box (HW) College Security (daytime):
Graded Lab Report Box (LR) Hazardous Materials:
Instructor's Office (IO) Poison Control Center:
5
Figure 1.1 Map of Science Building: Ground and Upper Levels

6
7
NAME: _______________________________________ LAB SECTION: ______
PARTNER: _______________________________________
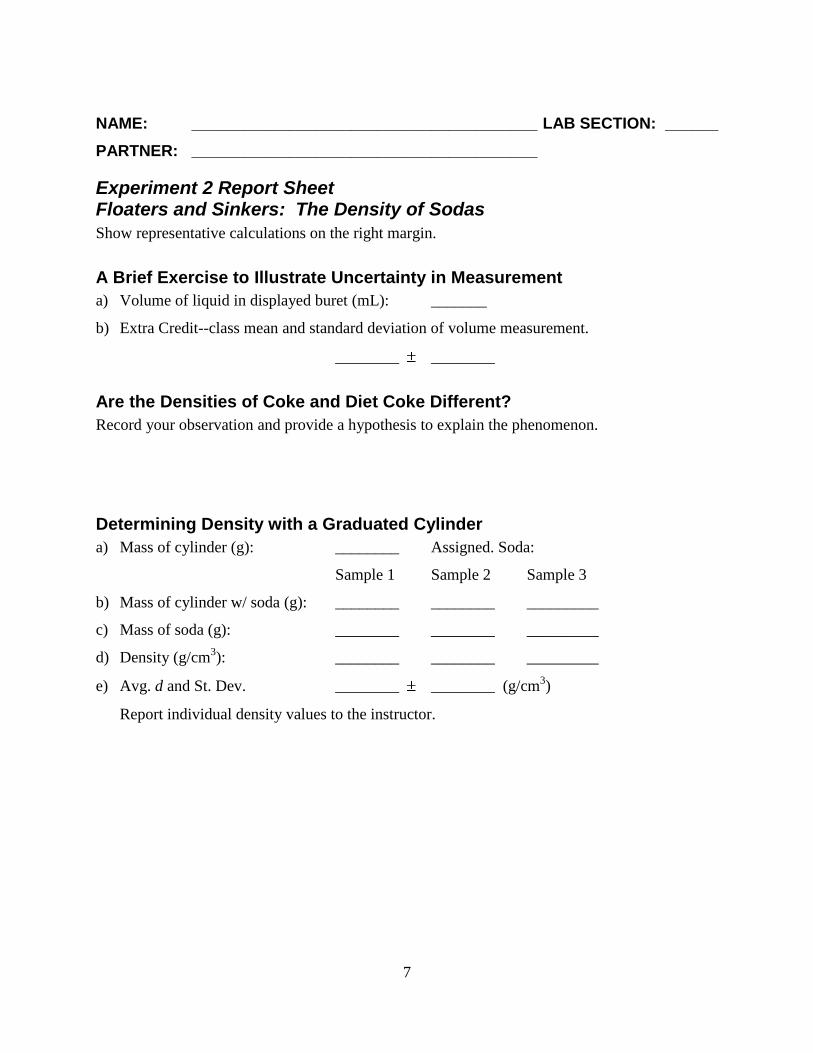
Experiment 2 Report Sheet Floaters and Sinkers: The Density of Sodas
Show representative calculations on the right margin.
A Brief Exercise to Illustrate Uncertainty in Measurement
a) Volume of liquid in displayed buret (mL): _______
b) Extra Credit--class mean and standard deviation of volume measurement.
________ ________
Are the Densities of Coke and Diet Coke Different?
Record your observation and provide a hypothesis to explain the phenomenon.
Determining Density with a Graduated Cylinder
a) Mass of cylinder (g): ________ Assigned. Soda:
Sample 1 Sample 2 Sample 3
b) Mass of cylinder w/ soda (g): ________ ________ _________
c) Mass of soda (g): ________ ________ _________
d) Density (g/cm3): ________ ________ _________
e) Avg. d and St. Dev. ________ ________ (g/cm3)
Report individual density values to the instructor.
8
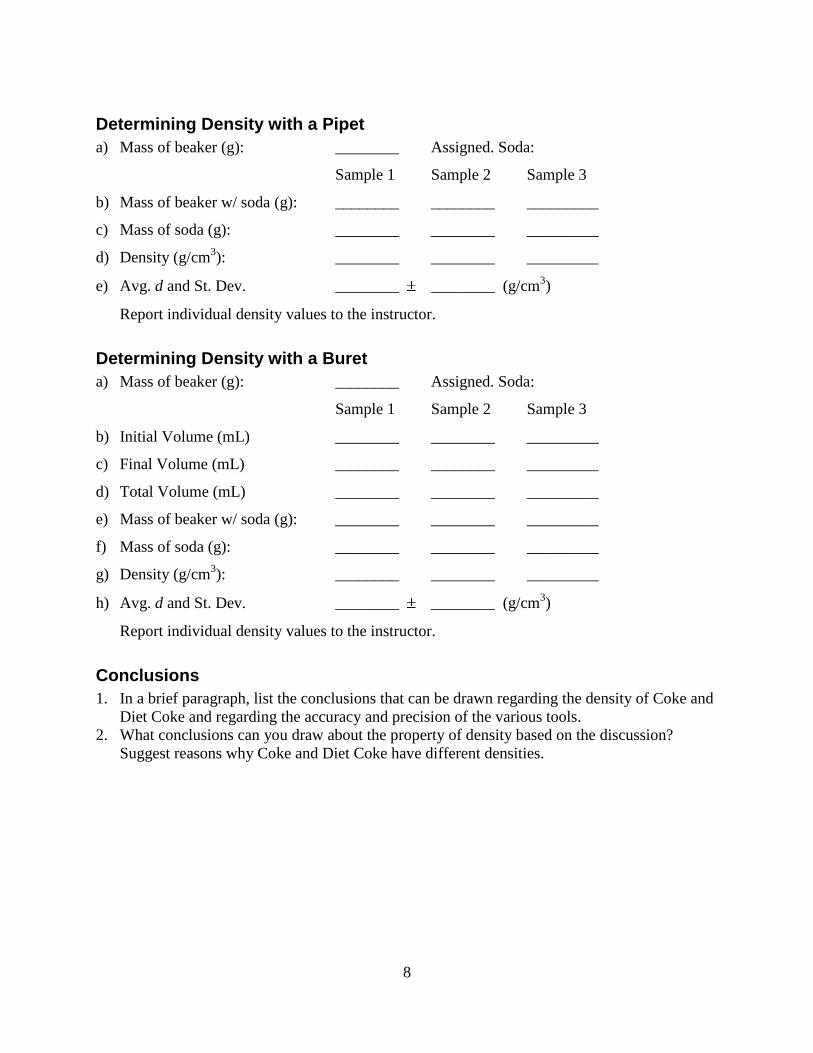
Determining Density with a Pipet
a) Mass of beaker (g): ________ Assigned. Soda:
Sample 1 Sample 2 Sample 3
b) Mass of beaker w/ soda (g): ________ ________ _________
c) Mass of soda (g): ________ ________ _________
d) Density (g/cm3): ________ ________ _________
e) Avg. d and St. Dev. ________ ________ (g/cm3)
Report individual density values to the instructor.
Determining Density with a Buret
a) Mass of beaker (g): ________ Assigned. Soda:
Sample 1 Sample 2 Sample 3
b) Initial Volume (mL) ________ ________ _________
c) Final Volume (mL) ________ ________ _________
d) Total Volume (mL) ________ ________ _________
e) Mass of beaker w/ soda (g): ________ ________ _________
f) Mass of soda (g): ________ ________ _________
g) Density (g/cm3): ________ ________ _________
h) Avg. d and St. Dev. ________ ________ (g/cm3)
Report individual density values to the instructor.
Conclusions
1. In a brief paragraph, list the conclusions that can be drawn regarding the density of Coke and
Diet Coke and regarding the accuracy and precision of the various tools.
2. What conclusions can you draw about the property of density based on the discussion?
Suggest reasons why Coke and Diet Coke have different densities.
9
NAME: _______________________________________ LAB SECTION: ______
PARTNER: _______________________________________
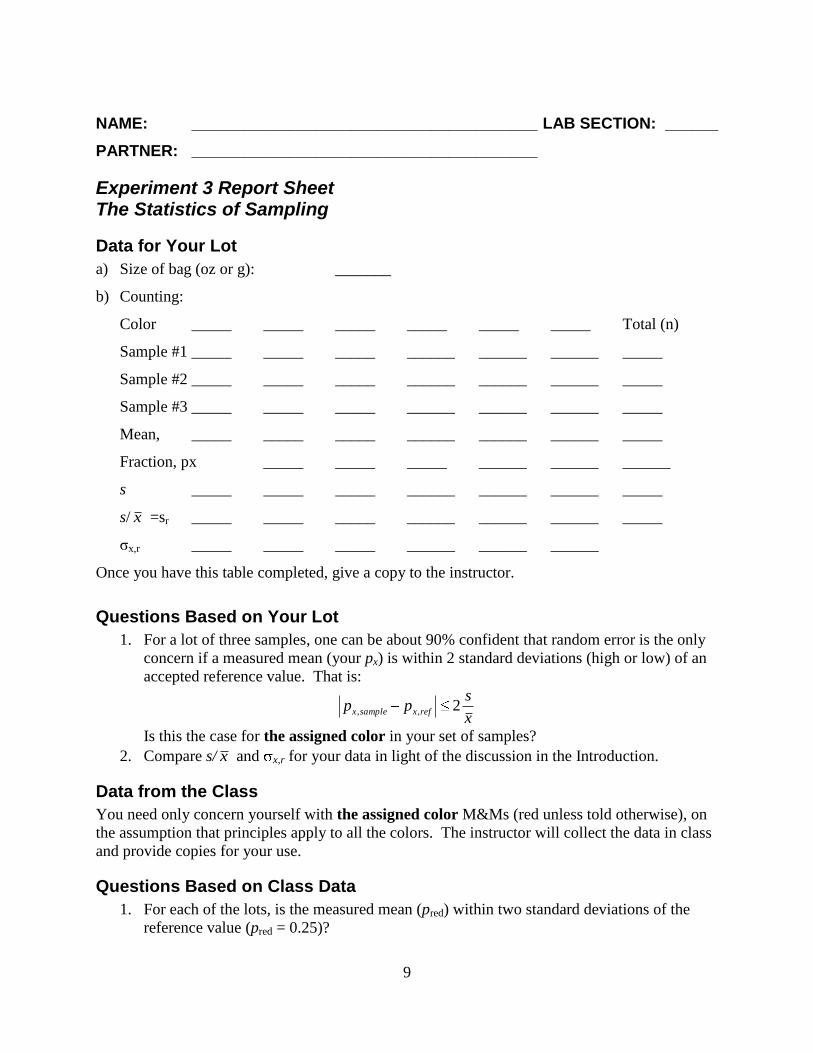
Experiment 3 Report Sheet The Statistics of Sampling
Data for Your Lot
a) Size of bag (oz or g): _______
b) Counting:
Color _____ _____ _____ _____ _____ _____ Total (n)
Sample #1 _____ _____ _____ ______ ______ ______ _____
Sample #2 _____ _____ _____ ______ ______ ______ _____
Sample #3 _____ _____ _____ ______ ______ ______ _____
Mean, _____ _____ _____ ______ ______ ______ _____
Fraction, px _____ _____ _____ ______ ______ ______
s _____ _____ _____ ______ ______ ______ _____
s/ x =sr _____ _____ _____ ______ ______ ______ _____
σx,r _____ _____ _____ ______ ______ ______
Once you have this table completed, give a copy to the instructor.
Questions Based on Your Lot
1. For a lot of three samples, one can be about 90% confident that random error is the only
concern if a measured mean (your px) is within 2 standard deviations (high or low) of an
accepted reference value. That is:
x
spp refxsamplex 2,,
Is this the case for the assigned color in your set of samples?
2. Compare s/ x and x,r for your data in light of the discussion in the Introduction.
Data from the Class
You need only concern yourself with the assigned color M&Ms (red unless told otherwise), on
the assumption that principles apply to all the colors. The instructor will collect the data in class
and provide copies for your use.
Questions Based on Class Data
1. For each of the lots, is the measured mean (pred) within two standard deviations of the
reference value (pred = 0.25)?
10
2. Does the value of the relative standard deviation, sr,red, vary with the size of the sample?
Does this indicate any preference for sample size?
3. How large (what value of n) is needed to ensure that x,r for the red M&Ms is less than
0.01pred (1% relative standard deviation)?
4. Consider the water hardness lab. The calcium content in the hard water is about 600
mg/L CaCO3. This corresponds to about 6.0 x 10⁻³
mol/L of calcium. Water has a
concentration of approximately 55.55 mol/L. If we assume the aqueous solution is a
mixture of relatively uniform particles (molecules, mostly water), and assume the density
of hard water is 1.0 g/mL, what is the predicted standard deviation x,r in the
concentration of the calcium in a 10.0 mL sample of hard water? What does this tell you
about the significance of sampling error in a well mixed liquid solution?
11
NAME: _______________________________________ LAB SECTION: ______
PARTNER: _______________________________________
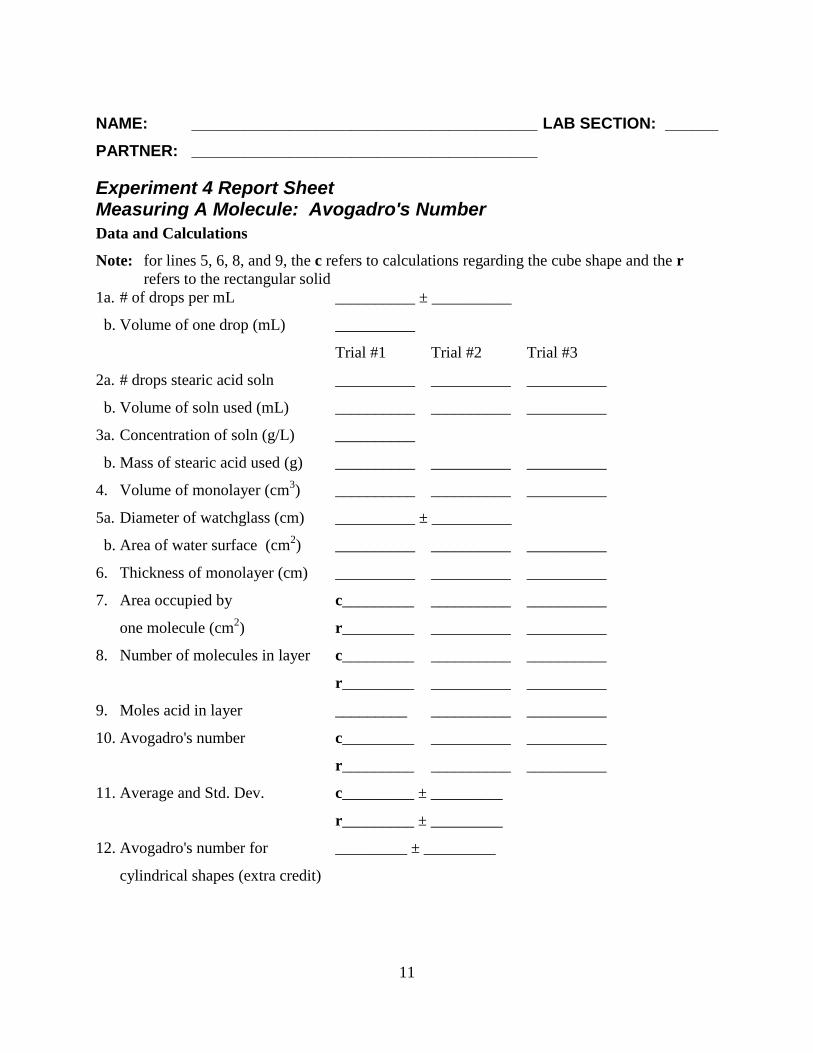
Experiment 4 Report Sheet Measuring A Molecule: Avogadro's Number
Data and Calculations
Note: for lines 5, 6, 8, and 9, the c refers to calculations regarding the cube shape and the r
refers to the rectangular solid
1a. # of drops per mL __________ ± __________
b. Volume of one drop (mL) __________
Trial #1 Trial #2 Trial #3
2a. # drops stearic acid soln __________ __________ __________
b. Volume of soln used (mL) __________ __________ __________
3a. Concentration of soln (g/L) __________
b. Mass of stearic acid used (g) __________ __________ __________
4. Volume of monolayer (cm3) __________ __________ __________
5a. Diameter of watchglass (cm) __________ ± __________
b. Area of water surface (cm2) __________ __________ __________
6. Thickness of monolayer (cm) __________ __________ __________
7. Area occupied by c_________ __________ __________
one molecule (cm2) r_________ __________ __________
8. Number of molecules in layer c_________ __________ __________
r_________ __________ __________
9. Moles acid in layer _________ __________ __________
10. Avogadro's number c_________ __________ __________
r_________ __________ __________
11. Average and Std. Dev. c_________ ± _________
r_________ ± _________
12. Avogadro's number for _________ ± _________
cylindrical shapes (extra credit)
12
Questions
Note: answer in your notebook and on the back of your report sheet.
1. Which of the shapes gives the best estimate of Avogadro's number?
2. List possible sources of error in the experimental method. How can each kind of error be
minimized?
3. List possible sources of errors in the assumptions made in the microscopic model.
4. Which of the measured data values limits the precision of this experiment?
5. The molar volume of any substance is the volume occupied by one mole of that substance.
a. Calculate the molar volume (cm3/mol) of stearic acid from its known molar mass and
density.
b. The molar volume divided by Avogadro's number will give the volume of one
molecule, if there is no empty space in the molecular packing. Calculate this
molecular volume using the accepted value of Avogadro's number. Compare it with
the molecular volumes that you calculate from your data and assumptions [7(a) and
7(b) on the preceding page]. Is your order of magnitude correct?
6. In a paragraph, discuss the results in light of the assumptions made in the model. The
discussion should include a statistical analysis also.
13
NAME: _______________________________________ LAB SECTION: ______
PARTNER: _______________________________________
Experiment 5 Report Sheet Determination of the Formula of a Hydrate – A Greener Approach
Initial Hydrate.
1. Crucible ID# _________
2. Mass of empty, dry crucible _________
3. Mass of crucible with hydrate _________
4. Initial mass of hydrate _________
Dehydrated Copper(II) Chloride
1. First mass of dehydrated CuCl2 in crucible _________
2. Second mass of dehydrated CuCl2 in crucible _________
3. Final mass of dehydrated CuCl2 _________
4. Moles of CuCl2 in the hydrate _________
5. Mass of water driven off the hydrate _________
6. Moles of water driven off the hydrate _________
7. Formula of the CuCl2 hydrate _________
8. Full name of hydrate: _________________________________
Rehydrated CuCl2
1. Mass of bottle recycled sample bottle before addition _________
2. Mass of bottle recycled sample bottle after addition _________
3. Mass rehydrated CuCl2 _________
4. % recovery of hydrate _________
"Hurry up and wait" Questions
1. Define ―hydrate‖ and discuss the bonding associated with a hydrate.
2. If a hydrated salt loses 0.3211 g of mass when heated strongly, how many moles of water
were driven off? Show your work.
14
3. Write the chemical formula for Magnesium sulfate heptahydrate.
4. Give the chemical name of the following salt: FeCl3 6H2O.
General Questions
5. Why must the crucible and lids be heated before the initial weighing?
6. How would your final result (value of ―?‖ in the formula) have been affected if the crucible
had been damp before the first weighing? Too high? Too low? Not affected? Explain.
7. Drying agents, or desiccants, are sometimes used to keep humidity low inside packaged
goods (like leather shoes and purses, or camera equipment). What type of substance
encountered in this experiment might serve well as a desiccant? Explain.
8. Unfortunately not all of your original sample will end up in the container for reuse. At what
points in the experiment do you ―lose‖ some of the sample? Give an example of one pro and
one con of the method you used to recycle the hydrate.
9. This experiment initially used a barium salt to demonstrate the dehydration of a salt. In
addition, the salt was thrown away. Propose a reason why you think this does not implement
the concepts of green chemistry. Refer to the world wide web for a listing of the 12
Principles of green chemistry
15
NAME: _______________________________________ LAB SECTION: ______
PARTNER: _______________________________________
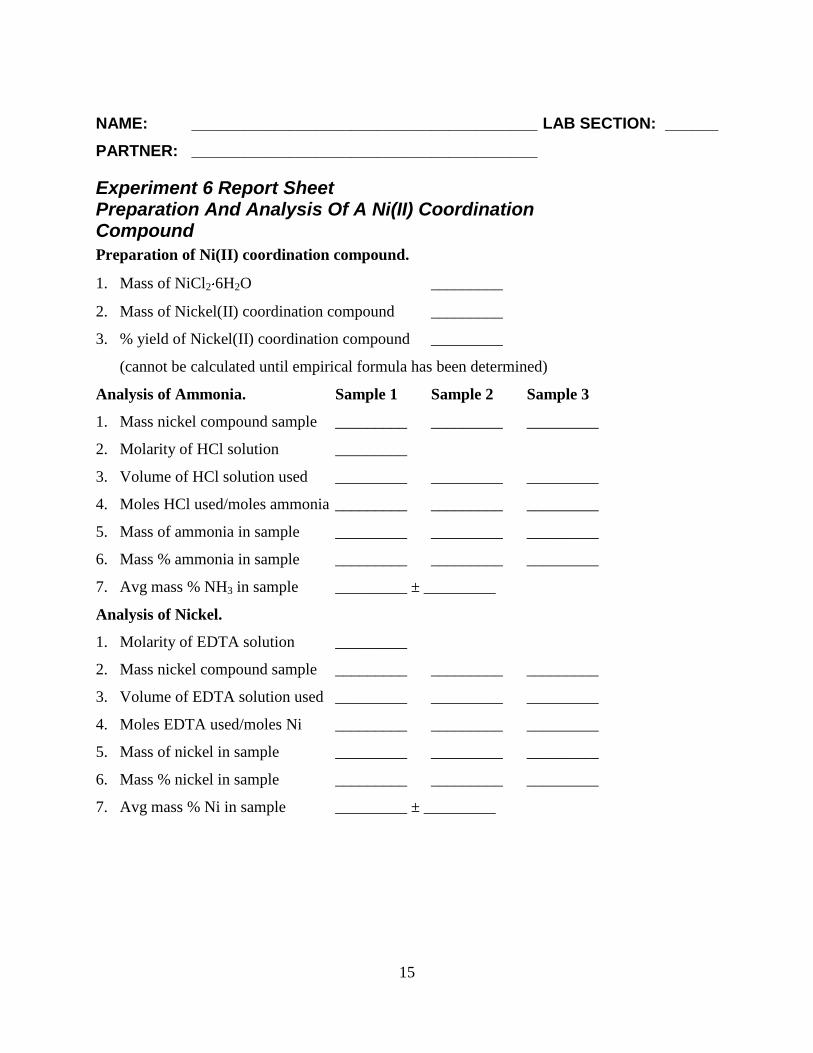
Experiment 6 Report Sheet Preparation And Analysis Of A Ni(II) Coordination Compound
Preparation of Ni(II) coordination compound.
1. Mass of NiCl2 6H2O _________
2. Mass of Nickel(II) coordination compound _________
3. % yield of Nickel(II) coordination compound _________
(cannot be calculated until empirical formula has been determined)
Analysis of Ammonia. Sample 1 Sample 2 Sample 3
1. Mass nickel compound sample _________ _________ _________
2. Molarity of HCl solution _________
3. Volume of HCl solution used _________ _________ _________
4. Moles HCl used/moles ammonia _________ _________ _________
5. Mass of ammonia in sample _________ _________ _________
6. Mass % ammonia in sample _________ _________ _________
7. Avg mass % NH3 in sample _________ ± _________
Analysis of Nickel.
1. Molarity of EDTA solution _________
2. Mass nickel compound sample _________ _________ _________
3. Volume of EDTA solution used _________ _________ _________
4. Moles EDTA used/moles Ni _________ _________ _________
5. Mass of nickel in sample _________ _________ _________
6. Mass % nickel in sample _________ _________ _________
7. Avg mass % Ni in sample _________ ± _________
16
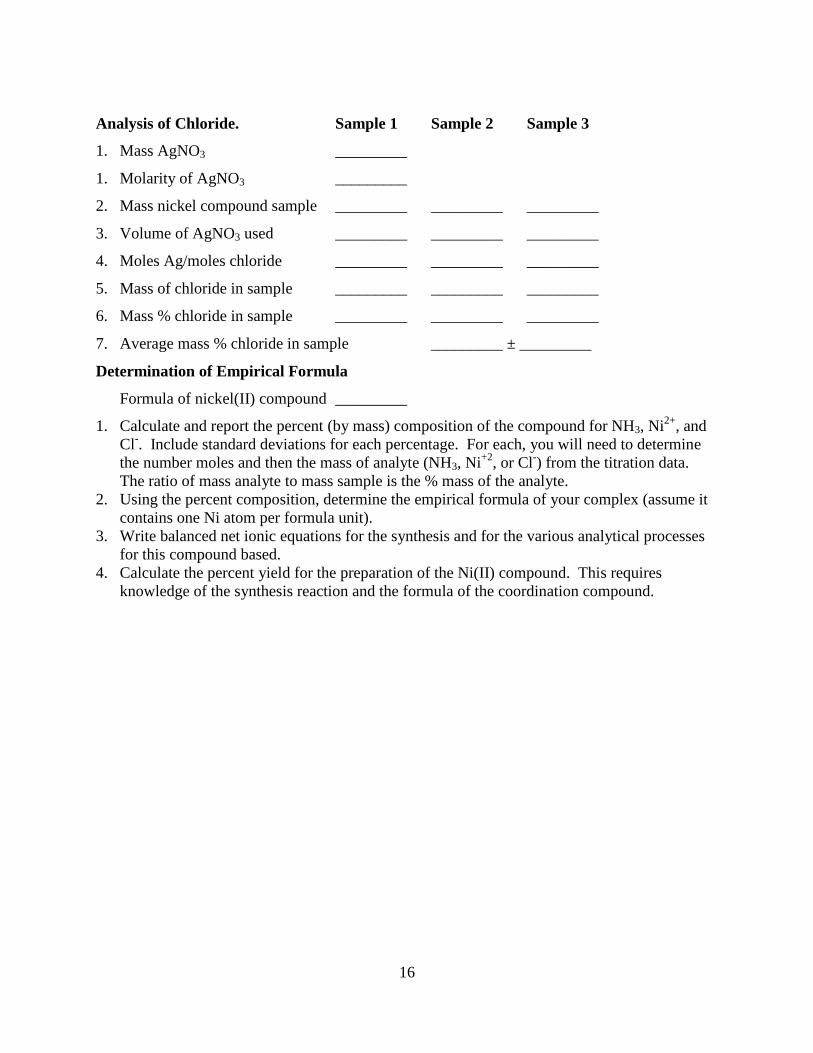
Analysis of Chloride. Sample 1 Sample 2 Sample 3
1. Mass AgNO3 _________
1. Molarity of AgNO3 _________
2. Mass nickel compound sample _________ _________ _________
3. Volume of AgNO3 used _________ _________ _________
4. Moles Ag/moles chloride _________ _________ _________
5. Mass of chloride in sample _________ _________ _________
6. Mass % chloride in sample _________ _________ _________
7. Average mass % chloride in sample _________ ± _________
Determination of Empirical Formula
Formula of nickel(II) compound _________
1. Calculate and report the percent (by mass) composition of the compound for NH3, Ni2+
, and
Cl-. Include standard deviations for each percentage. For each, you will need to determine
the number moles and then the mass of analyte (NH3, Ni+2
, or Cl-) from the titration data.
The ratio of mass analyte to mass sample is the % mass of the analyte.
2. Using the percent composition, determine the empirical formula of your complex (assume it
contains one Ni atom per formula unit).
3. Write balanced net ionic equations for the synthesis and for the various analytical processes
for this compound based.
4. Calculate the percent yield for the preparation of the Ni(II) compound. This requires
knowledge of the synthesis reaction and the formula of the coordination compound.
17
NAME: _______________________________________ LAB SECTION: ______
PARTNER: _______________________________________
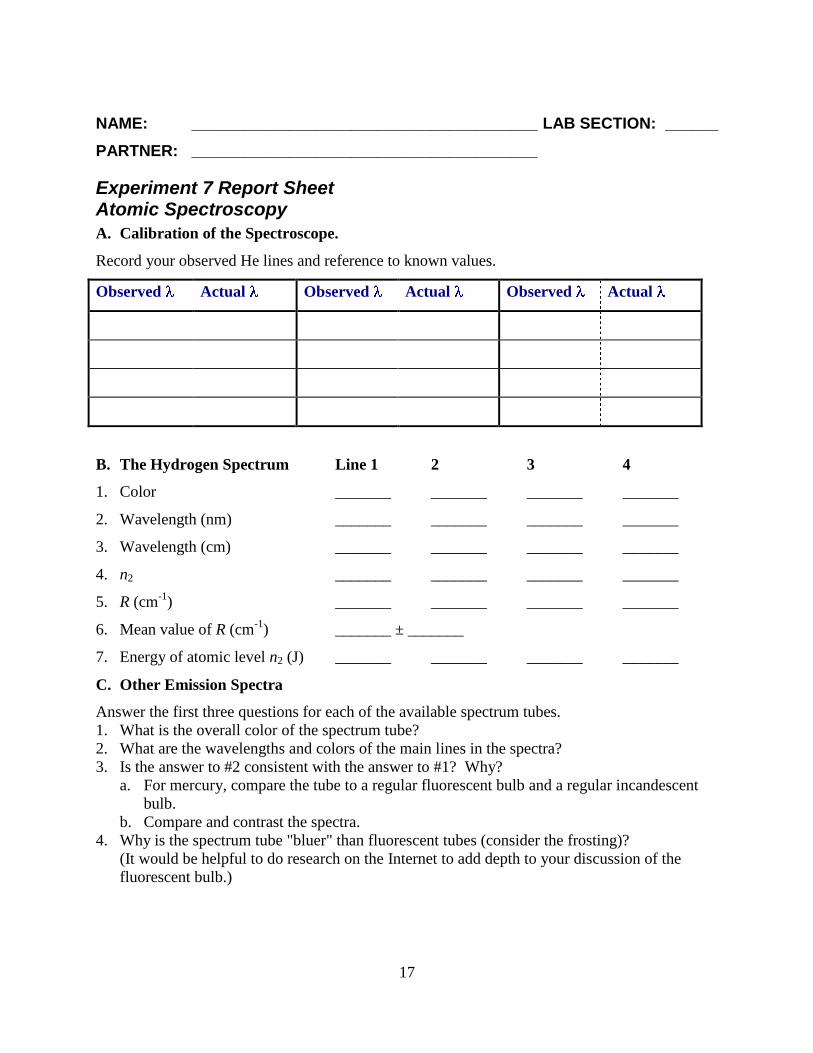
Experiment 7 Report Sheet Atomic Spectroscopy
A. Calibration of the Spectroscope.
Record your observed He lines and reference to known values.
Observed Actual Observed Actual Observed Actual
B. The Hydrogen Spectrum Line 1 2 3 4
1. Color _______ _______ _______ _______
2. Wavelength (nm) _______ _______ _______ _______
3. Wavelength (cm) _______ _______ _______ _______
4. n2 _______ _______ _______ _______
5. R (cm-1
) _______ _______ _______ _______
6. Mean value of R (cm-1
) _______ ± _______
7. Energy of atomic level n2 (J) _______ _______ _______ _______
C. Other Emission Spectra
Answer the first three questions for each of the available spectrum tubes.
1. What is the overall color of the spectrum tube?
2. What are the wavelengths and colors of the main lines in the spectra?
3. Is the answer to #2 consistent with the answer to #1? Why?
a. For mercury, compare the tube to a regular fluorescent bulb and a regular incandescent
bulb.
b. Compare and contrast the spectra.
4. Why is the spectrum tube "bluer" than fluorescent tubes (consider the frosting)?
(It would be helpful to do research on the Internet to add depth to your discussion of the
fluorescent bulb.)
18
Questions
1. Bohr showed that the Rydberg constant could be calculated from known fundamental
constants. The equation is:
ch
meR e
32
0
42
)4(
2 (7-1)
Using a resource that provides accurate values for each of these constants (such as the
Handbook of Chemistry and Physics or NIST Fundamental Constants database), calculate R
(in cm-1
, watch for units) and compare it to your value. Discuss any differences in the two
values. Also show that the units work. (Hint: during this calculation, intermediate values
can become very small, <10-100
, which can cause an error or a result of zero on some
calculators. One way around this is to alternate multiplying values in the numerator with
dividing values in the denominator so that intermediate values remain within the limits of the
calculator.)
2. How would the absorption spectrum of an atom differ from its emission spectrum? How
would one measure an absorption spectrum?
3. What is the longest possible wavelength for a line in the Balmer (n2 = 2) series? What is the
shortest possible wavelength? Does the whole series fall within the visible spectrum (400-
700 nm)?
19
NAME: _______________________________________ LAB SECTION: ______
PARTNER: _______________________________________
Experiment 8 Report Sheet Determination of Manganese in Steel
A. Beer's Law Plot
Include the Beer's Law plot.
Include copies of the spreadsheet outputs.
The value of the molar absorptivity, , is ______ ± ______
B. Percent Mn in Steel
1. Sample ID# ______
2. Mass of sample taken ______
3. Absorbance of sample ______ ______ ______
4. Average absorbance ______ ± ______ (from spreadsheet)
5. Concentration, mol/L ______ ± ______ (from spreadsheet)
6. Mass % Mn in sample ______ ± ______
(show the calculations used to obtain 6)
Questions
1. You will notice from Figure 8.1 that 525 nm corresponds to a maximum in the absorbance
spectrum. Why should we use a maximum in the absorbance rather than a minimum such as
425 nm?
2. Why is it important to use the maximum value, rather than an intermediate value such as 500
nm? (This answer is different than the answer to #1.)
3. Which colors of the spectrum are absorbed by permanganate? Which are transmitted? How
does this give rise to the observed color of permanganate?

20
21
NAME: _______________________________________ LAB SECTION: ______
PARTNER: _______________________________________
Experiment 9 Report Sheet Polymers
Questions
1. Your nylon string is pretty weak, but nylon is used to make strong ropes. Explain how your
string could be used to make a strong rope.
2. Why does the sebacoyl chloride solution float on top of the hexamethylenediamine solution?
3 Describe the physical changes that occur in the mixture while you make the slime.
4 Describe the physical changes that occur in the mixture while you make the silly putty.
5 Compare and contrast the properties of the three polymers you made. What’s the same?
What’s different?
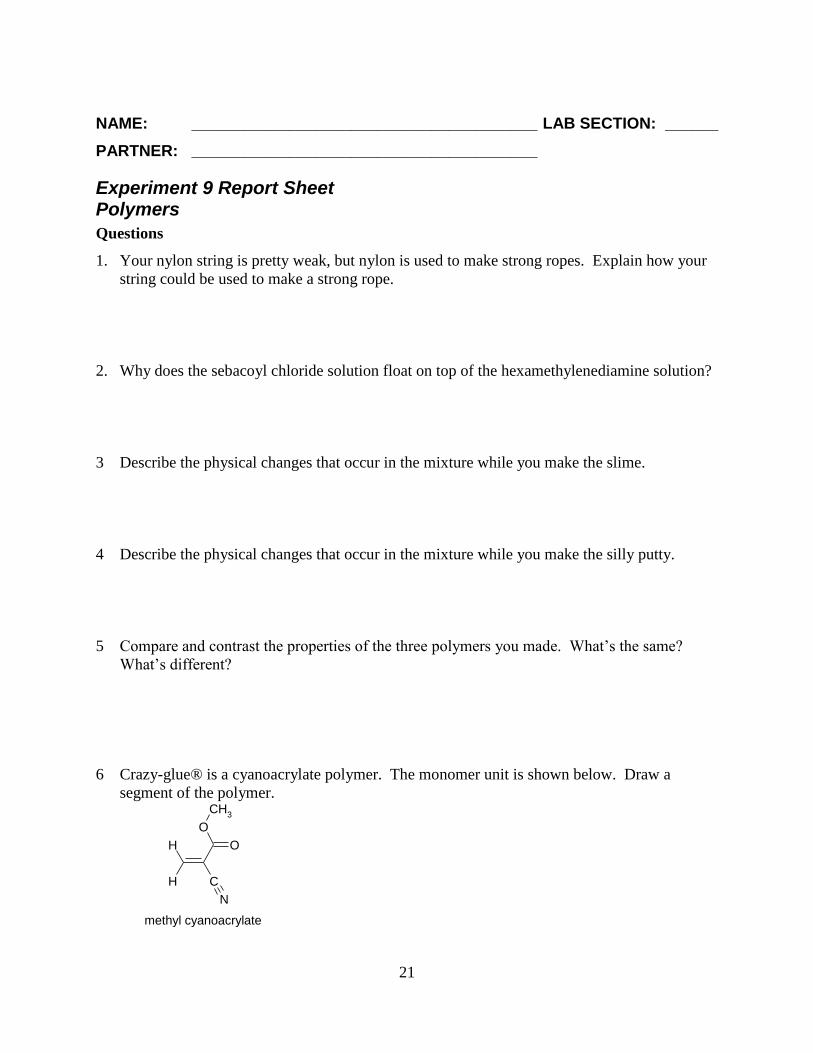
6 Crazy-glue® is a cyanoacrylate polymer. The monomer unit is shown below. Draw a
segment of the polymer.
H
H C
N
O
CH3
O
methyl cyanoacrylate

22
23
NAME: _______________________________________ LAB SECTION: ______
PARTNER: _______________________________________
Experiment 11 Report Sheet Soap Making
a) Formulation: _______
b) Mass of Reagents used (g):
Water _______
NaOH _______
Canola Oil _______
Lard _______
Olive Oil _______
Soy oil _______
Shortening _______
_________: _______
Total Mass: _______
c) Total mass of soap after curing (g): _______
d) Compare the total mass of cured soap with the mass of reagents used. Are the masses the
same or different? Explain your answer.
Analysis
a) Describe the color and scent of the soap. Are they what you expected?
b) Use your soap to wash your hands using tap water. Describe how it feels, how well it lathers,
bubble sizes, and how well it rinses away.
24
c) Use your soap to wash your hands using DI water. Describe how it feels, how well it lathers,
bubble sizes, and how well it rinses away.
pH Tests
color pH classify
a) pH of DI water: _____ ____ ______
b) pH of skin: _______ ____ ______
c) pH of soap: _______ ____ ______
d) Discuss the results, why would the acidity of soap be the same or different than the acidity of
skin?
Questions
1. Determine the molar mass of a triglyceride made with equal numbers of lauric, oleic, and
linoleic acids. What is the SAP value of this triglyceride?
2. For your formulation, what are the most abundant and second most abundant fatty acids?
This is done by taking the percentage of each fatty acid from Table 2, and multiplying by the
mass used in the formulations. Masses of the same fatty acid from different fats or oils are
then added. Are the properties of the end soap consistent with these fatty acids?
25
NAME: _______________________________________ LAB SECTION: ______
PARTNER: _______________________________________
Experiment 12 Report Sheet Volumetric Studies of Acid-Base Reactions
A. Standardization of NaOH
Sample 1 2 3
1. Mass of KHP _______ _______ _______
2. Volume NaOH used _______ _______ _______
3. Molarity of NaOH _______ _______ _______
4. Average molarity of NaOH _______ ± _______
B. Vinegar Analysis
Brand of vinegar used and cost _______ _______
1. Volume NaOH used _______ _______ _______
2. Molarity of dilute vinegar _______ _______ _______
3. Avg. molarity of diluted vinegar _______ ± _______
4. Molarity of original vinegar _______ ± _______
5. Mass % acetic acid _______ ± _______
C. Molar Mass of Unknown Acid Unknown: _________
1. Mass of unknown acid _______ _______ _______
2. Volume NaOH used _______ _______ _______
3. Molar mass of acid (monoprotic) _______ _______ _______
4. Average molar mass-monoprotic _______ ± _______
5. Molar mass of acid (diprotic) _______ _______ _______
6. Average molar mass-diprotic _______ ± _______
7. Identity of your unknown acid ________________
Explain your reasoning
Attach Answers to Questions
1. Does your analysis show that the vinegar has at least 5% acetic acid? Justify your answer.

26
27
NAME: _______________________________________ LAB SECTION: ______
PARTNER: None for this experiment
Experiment 15 Report Sheet Molecular Modeling
A. VSEPR Theory
There are ways to determine the shape of a molecule. Valance Shell Electron Pair Repulsion
Theory is one of the methods used to determine the shape of a compound. This exercise will
allow you to build and view a few compounds to verify this theory.
1. When you start PCModel, select Structure Name under the Edit menu. Enter your name,
which will allow you to identify printouts you are asked to make.
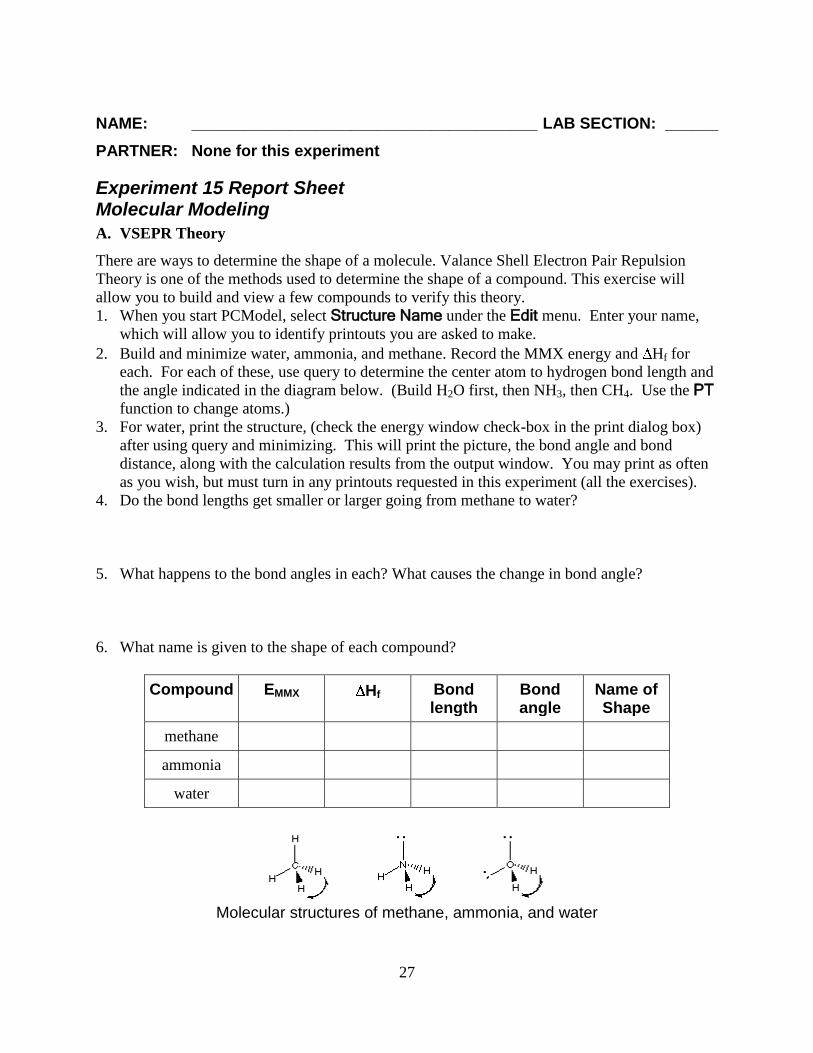
2. Build and minimize water, ammonia, and methane. Record the MMX energy and Hf for
each. For each of these, use query to determine the center atom to hydrogen bond length and
the angle indicated in the diagram below. (Build H2O first, then NH3, then CH4. Use the PT
function to change atoms.)
3. For water, print the structure, (check the energy window check-box in the print dialog box)
after using query and minimizing. This will print the picture, the bond angle and bond
distance, along with the calculation results from the output window. You may print as often
as you wish, but must turn in any printouts requested in this experiment (all the exercises).
4. Do the bond lengths get smaller or larger going from methane to water?
5. What happens to the bond angles in each? What causes the change in bond angle?
6. What name is given to the shape of each compound?
Compound EMMX Hf Bond length
Bond angle
Name of Shape
methane
ammonia
water
Molecular structures of methane, ammonia, and water
28
B. Bond Lengths - Single, Double, or Triple Bonds
Two factors determine the length of a bond. These are: 1) the type of bond between the two
atoms and 2) the types of atoms which make up the bond. The purpose of this exercise is to allow
you to look at how the type of bond affects the bond length.
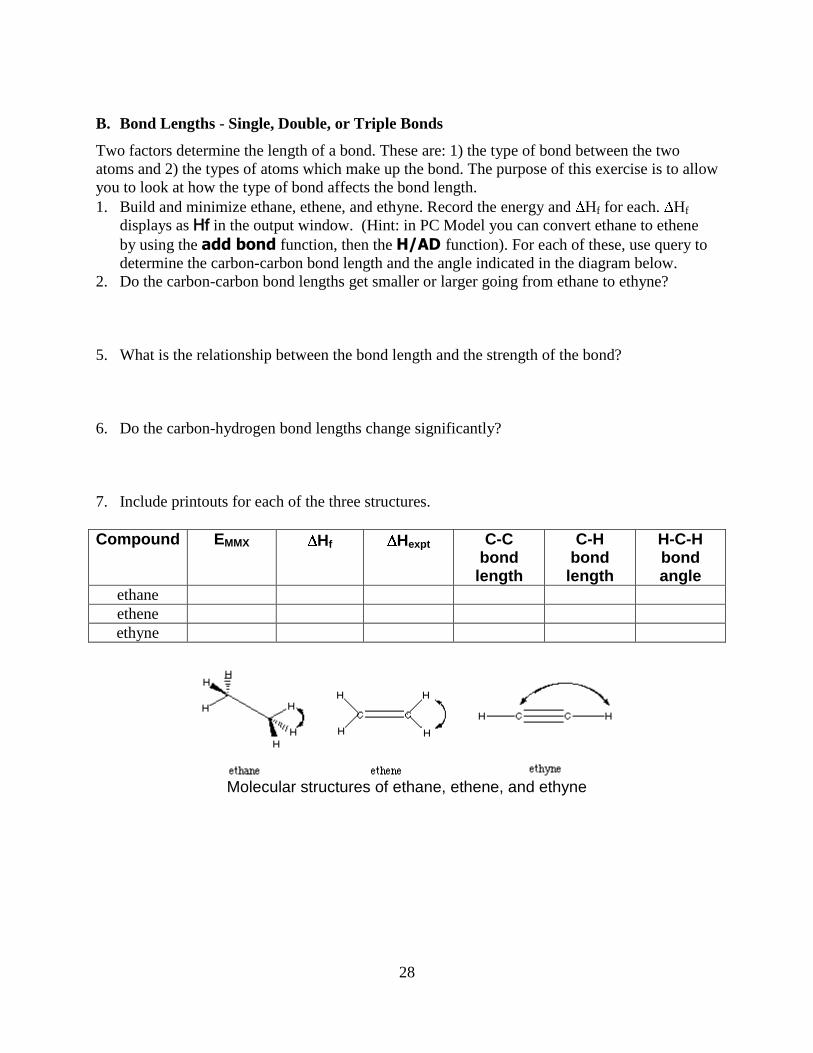
1. Build and minimize ethane, ethene, and ethyne. Record the energy and Hf for each. Hf
displays as Hf in the output window. (Hint: in PC Model you can convert ethane to ethene
by using the add bond function, then the H/AD function). For each of these, use query to
determine the carbon-carbon bond length and the angle indicated in the diagram below.
2. Do the carbon-carbon bond lengths get smaller or larger going from ethane to ethyne?
5. What is the relationship between the bond length and the strength of the bond?
6. Do the carbon-hydrogen bond lengths change significantly?
7. Include printouts for each of the three structures.
Compound EMMX Hf Hexpt C-C bond
length
C-H bond
length
H-C-H bond angle
ethane
ethene
ethyne
Molecular structures of ethane, ethene, and ethyne
29
C. Bond Lengths - Type of Atoms
Two factors determine the lenth of a bond. These are: 1)the type of bond between the two atoms
and 2) the types of atoms which make up the bond. The purpose of this exercise is to allow you
to look at how the type of atom affects the bond length.
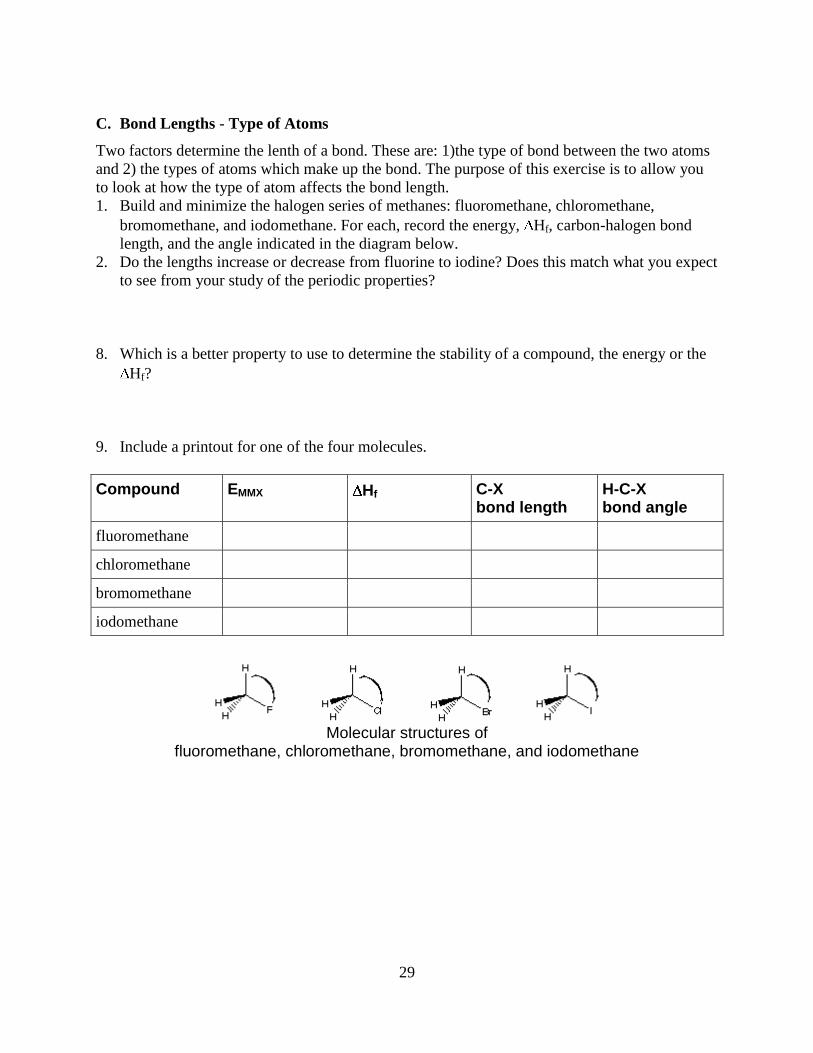
1. Build and minimize the halogen series of methanes: fluoromethane, chloromethane,
bromomethane, and iodomethane. For each, record the energy, Hf, carbon-halogen bond
length, and the angle indicated in the diagram below.
2. Do the lengths increase or decrease from fluorine to iodine? Does this match what you expect
to see from your study of the periodic properties?
8. Which is a better property to use to determine the stability of a compound, the energy or the
Hf?
9. Include a printout for one of the four molecules.
Compound EMMX Hf C-X bond length
H-C-X bond angle
fluoromethane
chloromethane
bromomethane
iodomethane
Molecular structures of
fluoromethane, chloromethane, bromomethane, and iodomethane
30
D. Bond Energy
Aliphatic carbon centered radicals are stabilized by alkyl groups. In a series of compounds, the
bond dissociation energy of a CH bond decreases as the resulting radical center becomes more
substituted.
This exercise uses the carbon radical. This is a molecule from which a hydrogen atom has
been removed, leaving behind a carbon with three substituents and a single, non-bonded electron,
R3C , which is a neutral molecule. The carbon radical is made by removing hydrogens using the
[H/AD] tool, converting the desired carbon to the radical using the [C ] button on the periodic
table, and adding the hydrogen atoms back to the molecule.
1. Build and minimize ethane, propane, tert - butane, and their corresponding free radicals. Also
build the isopropyl radical.
2. Are the energy differences in the table reflected in your calculations?
3. Include a printout for tert-butane and the tert-butyl radical.
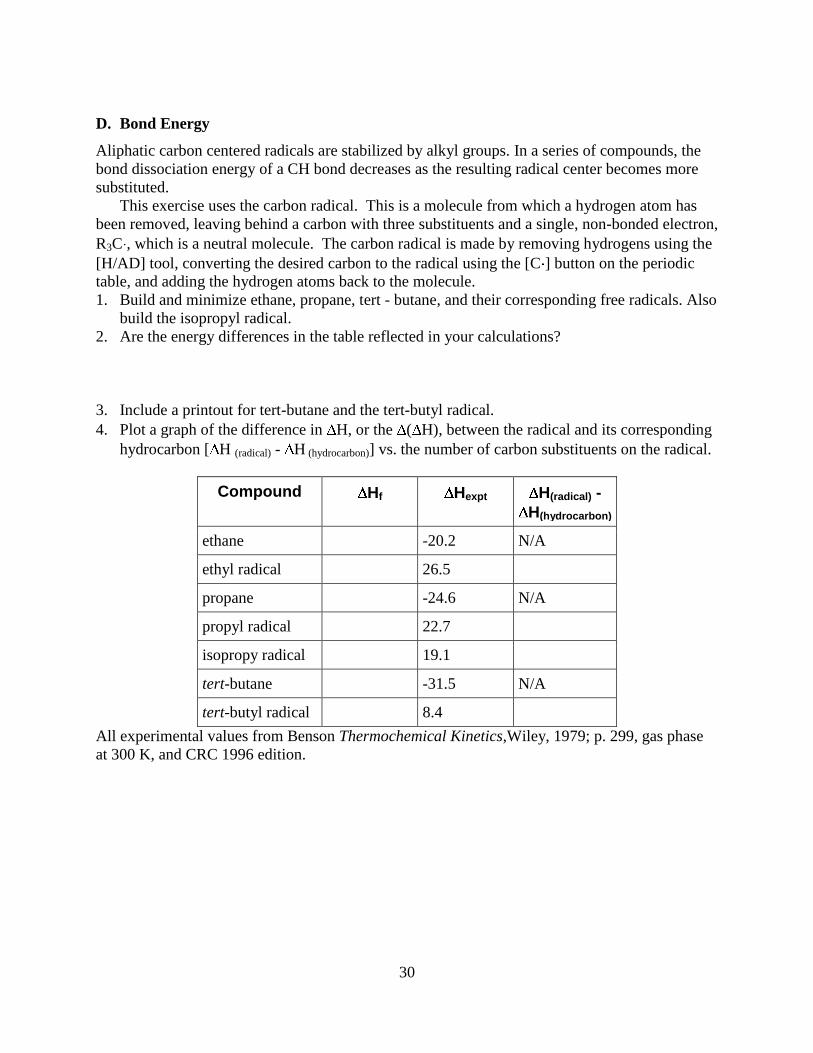
4. Plot a graph of the difference in H, or the ( H), between the radical and its corresponding
hydrocarbon [ H (radical) - H (hydrocarbon)] vs. the number of carbon substituents on the radical.
Compound Hf Hexpt H(radical) -
H(hydrocarbon)
ethane -20.2 N/A
ethyl radical 26.5
propane -24.6 N/A
propyl radical 22.7
isopropy radical 19.1
tert-butane -31.5 N/A
tert-butyl radical 8.4
All experimental values from Benson Thermochemical Kinetics,Wiley, 1979; p. 299, gas phase
at 300 K, and CRC 1996 edition.
31
E. Rotational Energy Barriers
In organic molecules, there is ordinarily free rotation around a carbon-carbon single bond.
However, as the substituents on the carbon atoms become larger, steric hinderance restricts the
rotation.
1. Draw an ethane molecule and minimize the structure. Use "Query" on the toolbar to measure
and record the C-C bond distance, the C-H bond distance, the C-C-H bond angle, and the H-
C-C-H dihedral angle. Build an ethane molecule with a model kit and arrange the structure to
match the minimized structure from PC Model. Use the [CPK Surface] function on the
[View] menu to look at a space filling model.
2. Select the two carbon atoms. Select the [Rot_E] function in the [Compute] menu. This
function will calculate and graph the MMX energy as the molecule is rotated about the
selected bond. Adjust the Step Size to 5° and the Total Rotation to 360° and click on [OK]. A
graph will appear. Print the graph (it automatically dumps to the default printer). The
horizontal axis is the dihedral angle, the angle of rotation. The vertical axis is the MMX
energy. Describe the features of the graph and associate them with the features of the
molecule as you rotate it about the C-C bond. Record the minimum and maximum MMX
energies from the graph. Exit the window.
3. Use the periodic table to change one hydrogen on each carbon to flourine. Flourine displays
with the same color as carbon. If you use [View]-[Labels] and display "Hydrogens and Lone
Pairs" the non-carbon atoms will be labelled. Minimize the structure and obtain the same
bond distance and bond angle information as above. Build a model of 1,2-difluoroethane and
match the structure to the minimized structure. Also view the CPK structure.
4. Use the [Rot_E] function to evaluate the rotational energy barriers and print print the plot.
Record the minimum and maximum energies. Compare and contrast the graph with that of
ethane.
5. Is your structure the lowest energy structure on the plot (your structure corresponding to the
leftmost point)? If not, what is the lowest energy structure?
6. On each graph, draw line structures to show the geometry of the molecule at the bottom of
each valley and at the top of each peak.
7. Use the periodic table to change the fluorines to iodines. Repeat the steps above for 1,2-
diiodoethane. Compare and contrast your results with ethane and difluoroethane.
32
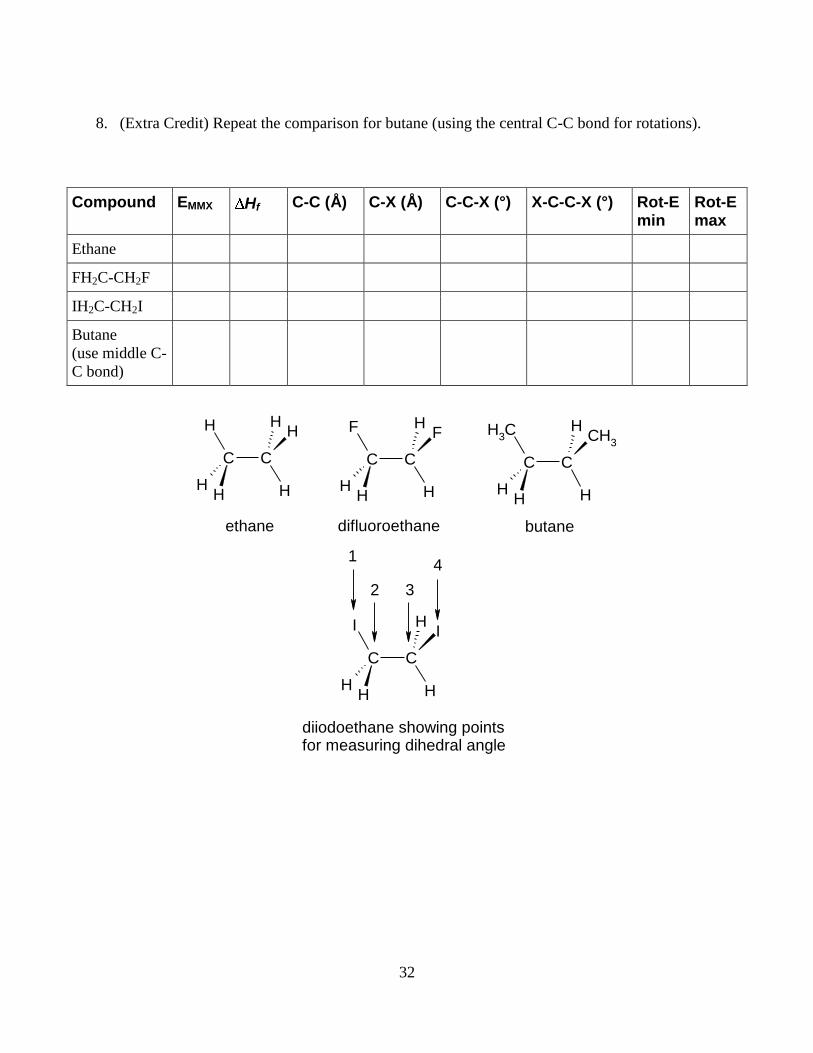
8. (Extra Credit) Repeat the comparison for butane (using the central C-C bond for rotations).
Compound EMMX Hf C-C (Å) C-X (Å) C-C-X (°) X-C-C-X (°) Rot-E min
Rot-E max
Ethane
FH2C-CH2F
IH2C-CH2I
Butane
(use middle C-
C bond)
C C
H
HH H
HH
ethane
C C
F
HH H
HF
difluoroethane
C C
CH3
HH H
HCH
3
butane
C C
I
HH H
HI
diiodoethane showing points for measuring dihedral angle
1
2 3
4
33
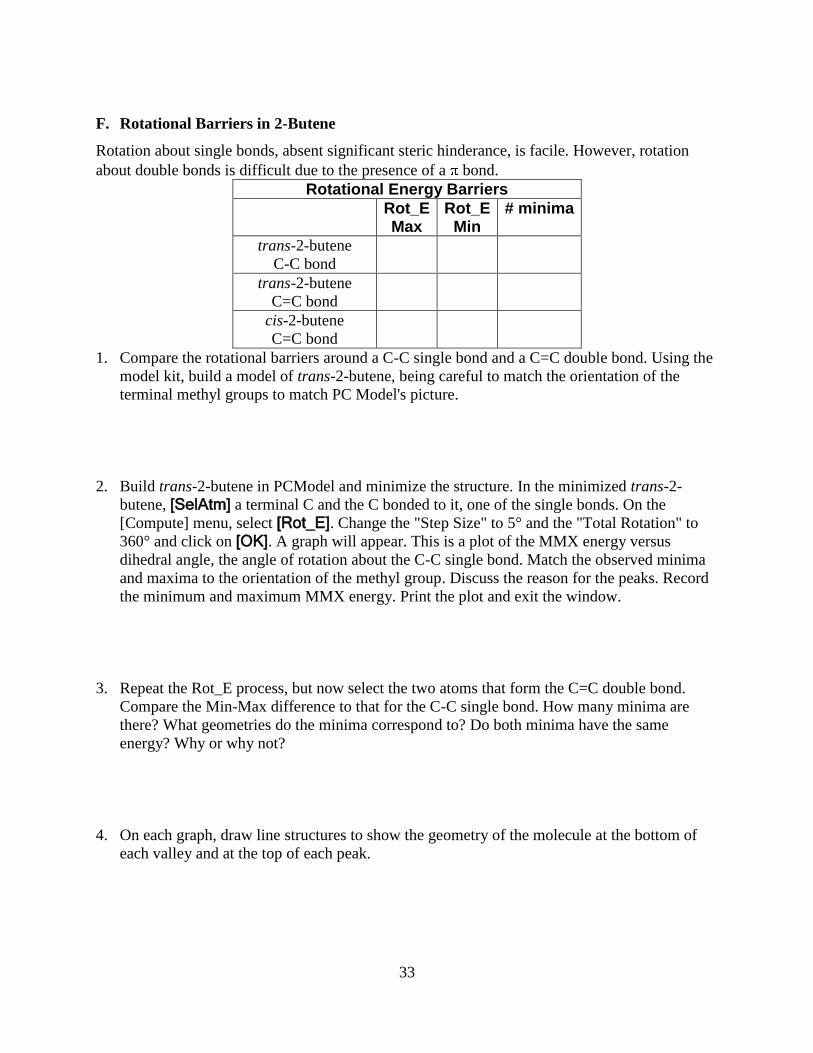
F. Rotational Barriers in 2-Butene
Rotation about single bonds, absent significant steric hinderance, is facile. However, rotation
about double bonds is difficult due to the presence of a bond.
Rotational Energy Barriers
Rot_E Max
Rot_E Min
# minima
trans-2-butene
C-C bond
trans-2-butene
C=C bond
cis-2-butene
C=C bond
1. Compare the rotational barriers around a C-C single bond and a C=C double bond. Using the
model kit, build a model of trans-2-butene, being careful to match the orientation of the
terminal methyl groups to match PC Model's picture.
2. Build trans-2-butene in PCModel and minimize the structure. In the minimized trans-2-
butene, [SelAtm] a terminal C and the C bonded to it, one of the single bonds. On the
[Compute] menu, select [Rot_E]. Change the "Step Size" to 5° and the "Total Rotation" to
360° and click on [OK]. A graph will appear. This is a plot of the MMX energy versus
dihedral angle, the angle of rotation about the C-C single bond. Match the observed minima
and maxima to the orientation of the methyl group. Discuss the reason for the peaks. Record
the minimum and maximum MMX energy. Print the plot and exit the window.
3. Repeat the Rot_E process, but now select the two atoms that form the C=C double bond.
Compare the Min-Max difference to that for the C-C single bond. How many minima are
there? What geometries do the minima correspond to? Do both minima have the same
energy? Why or why not?
4. On each graph, draw line structures to show the geometry of the molecule at the bottom of
each valley and at the top of each peak.
34
5. (Extra Credit) Repeat, but start with cis-2-butene. Do you get the same Min-Max MMX
energies as trans-2-butene? Should you get the same energies? Why or why not?
6. (Extra Credit) PC Model has a feature called "Dihedral Driver". It also calculates molecular
energy as one rotates a bond, but minimizes the structure at each step. To use this function,
you must select four atoms. For example, in butane, we can label the four atoms Ca-Cb=Cc-
Cd. To measure the molecular energy as you rotate about the double bond, you select all four
atoms Ca, Cb, Cc, and Cd in this order. In other words, you need to select one extra atom on
each of the atoms in the bond of interest. Use the dihedral driver to prepare graphs for both
trans- and cis-butene and compare the results. Do you get the same Min-Max MMX energies
as trans-2-butene? Should you get the same energies? Why or why not?
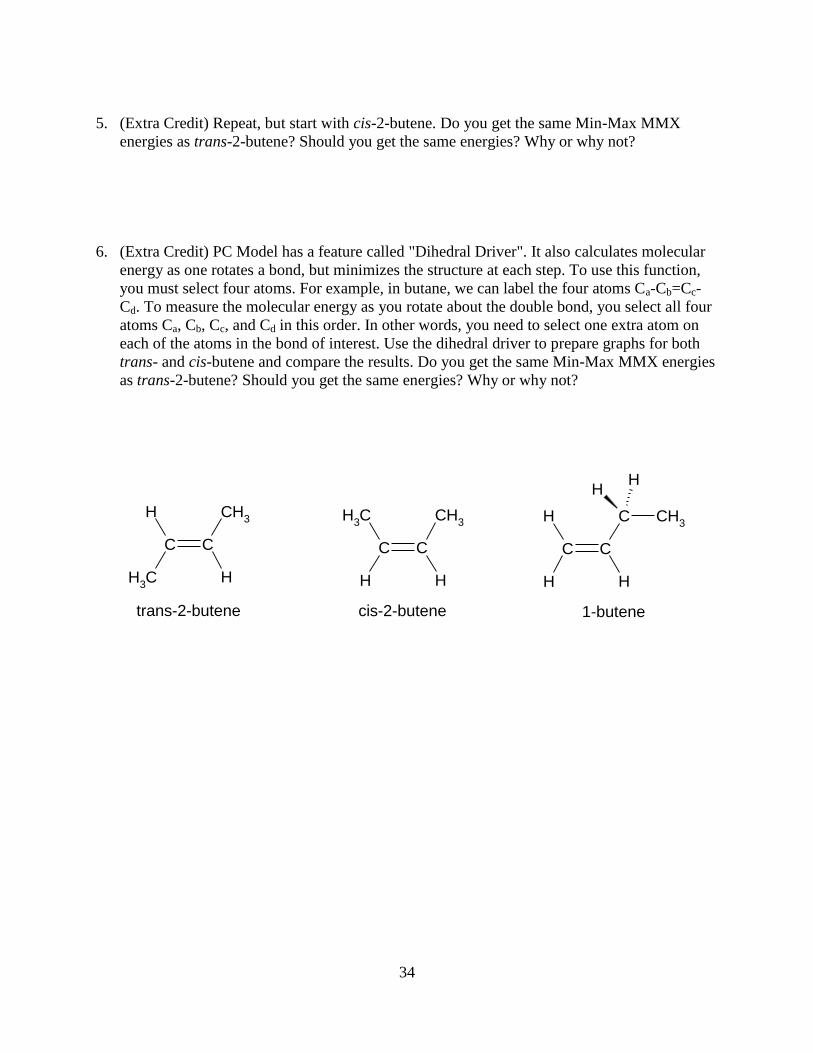
CH3
C C
CH3
H
H
H
C C
CH3
H
CH3
H
C C
C
H
H CH3
HH
trans-2-butene cis-2-butene 1-butene
35
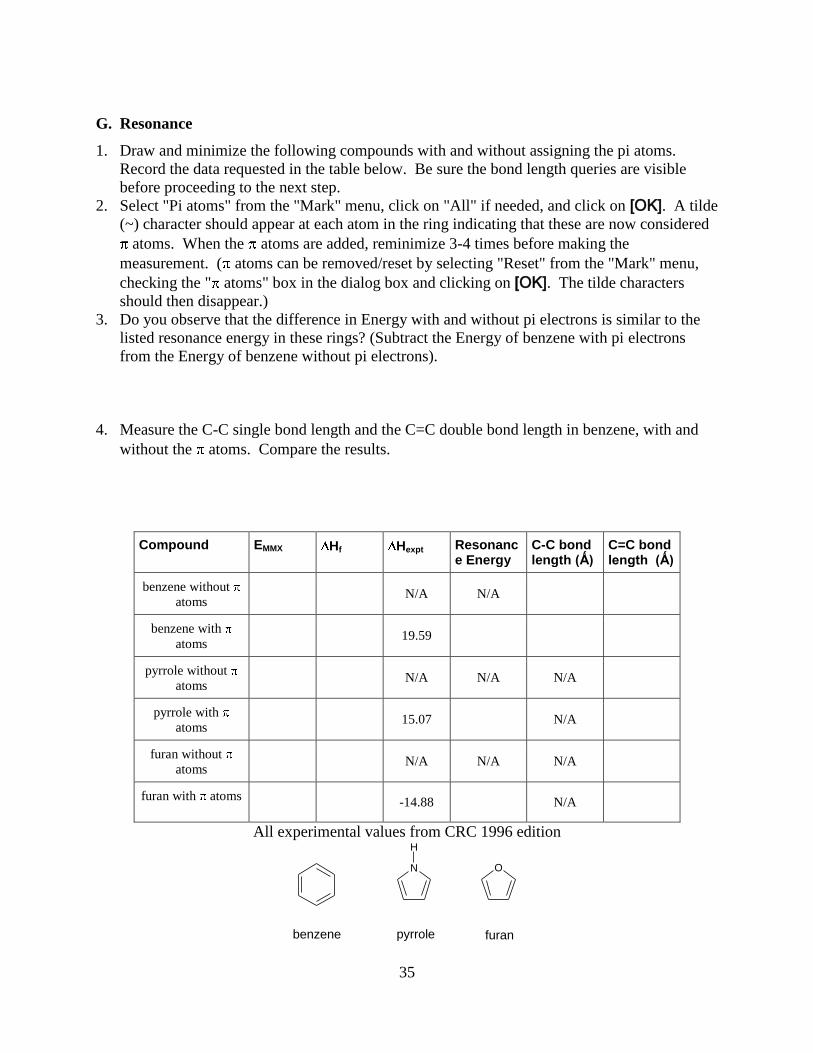
G. Resonance
1. Draw and minimize the following compounds with and without assigning the pi atoms.
Record the data requested in the table below. Be sure the bond length queries are visible
before proceeding to the next step.
2. Select "Pi atoms" from the "Mark" menu, click on "All" if needed, and click on [OK]. A tilde
(~) character should appear at each atom in the ring indicating that these are now considered
atoms. When the atoms are added, reminimize 3-4 times before making the
measurement. ( atoms can be removed/reset by selecting "Reset" from the "Mark" menu,
checking the " atoms" box in the dialog box and clicking on [OK]. The tilde characters
should then disappear.)
3. Do you observe that the difference in Energy with and without pi electrons is similar to the
listed resonance energy in these rings? (Subtract the Energy of benzene with pi electrons
from the Energy of benzene without pi electrons).
4. Measure the C-C single bond length and the C=C double bond length in benzene, with and
without the atoms. Compare the results.
Compound EMMX Hf Hexpt Resonance Energy
C-C bond length (Ǻ)
C=C bond length (Ǻ)
benzene without
atoms N/A N/A
benzene with
atoms 19.59
pyrrole without
atoms N/A N/A N/A
pyrrole with
atoms 15.07 N/A
furan without
atoms N/A N/A N/A
furan with atoms -14.88 N/A
All experimental values from CRC 1996 edition
N
H
O
benzene furanpyrrole
36
H. Extra Credit
The Journal of Chemical Education publishes a monthly feature called "Featured
Molecules". The feature is available online at
<http://jchemed.chem.wisc.edu/JCEWWW/Features/MonthlyMolecules/index.html>. Visit the
web site and choose no less than two molecules. The molecules must fit within the following
criteria:
Published within the past two years.
No less than 4 carbon atoms.
At least one molecule must contain at least one oxygen, nitrogen, or sulfur.
At least one molecule must contain a ring structure.
Should be unique compared to other students in the class.
Use PCModel to draw and minimize the molecules (separately) and print the output as above,
including the output window. Compare your structure to that from the feature. Are any
differences merely a result of a different point of view--can you rotate the molecule to get the
same view? If the differences are more significant, resulting from energy barriers or isomers?
Why did J. Chem. Ed. choose to feature this molecule? Cite the issue fully. The J. Chem. Ed.
website also posts the molecules in a Jmol format, which is an applet that most Java-enabled web
browsers (IE and Firefox, for example) can display. The Jmol figure can be manipulated on
screen; click and drag rotates; and right-click brings up a menu of options.
5 points will be awarded for meeting the minimum criteria noted above. Additional points
will be awarded for particularly challenging molecules to reproduce.
37
NAMES: _______________________________________ LAB SECTION: ______
PARTNER: _______________________________________
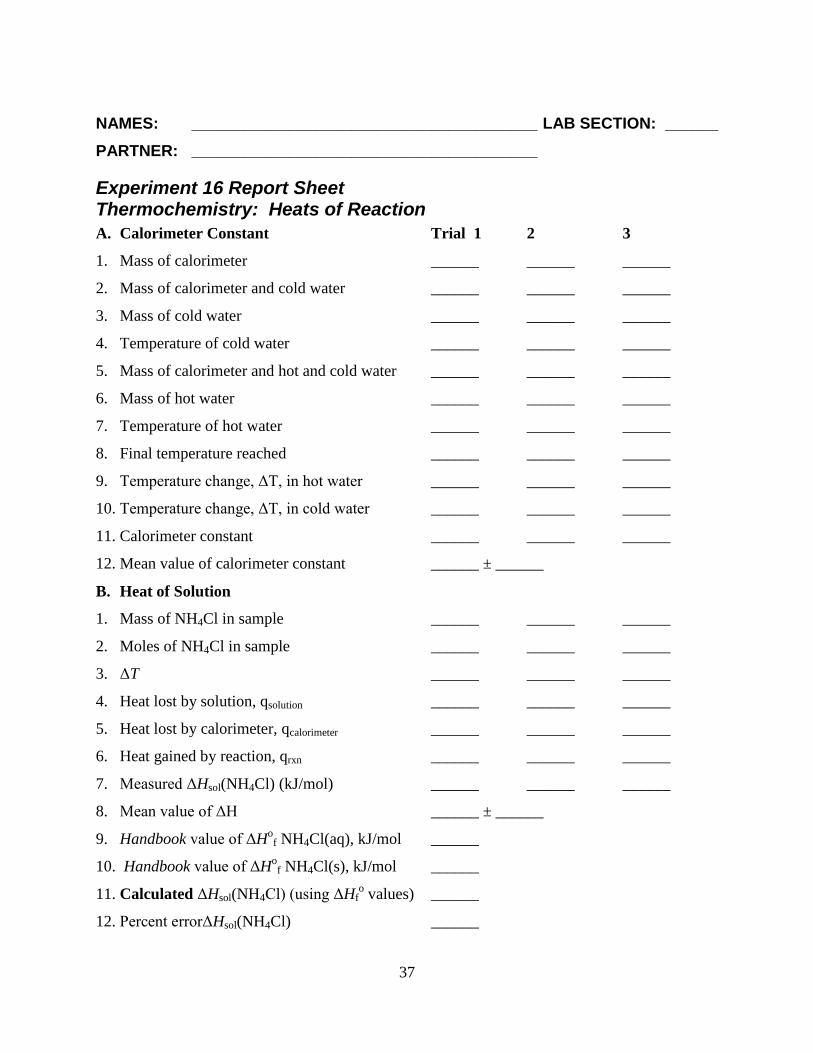
Experiment 16 Report Sheet Thermochemistry: Heats of Reaction
A. Calorimeter Constant Trial 1 2 3
1. Mass of calorimeter ______ ______ ______
2. Mass of calorimeter and cold water ______ ______ ______
3. Mass of cold water ______ ______ ______
4. Temperature of cold water ______ ______ ______
5. Mass of calorimeter and hot and cold water ______ ______ ______
6. Mass of hot water ______ ______ ______
7. Temperature of hot water ______ ______ ______
8. Final temperature reached ______ ______ ______
9. Temperature change, ΔT, in hot water ______ ______ ______
10. Temperature change, ΔT, in cold water ______ ______ ______
11. Calorimeter constant ______ ______ ______
12. Mean value of calorimeter constant ______ ± ______
B. Heat of Solution
1. Mass of NH4Cl in sample ______ ______ ______
2. Moles of NH4Cl in sample ______ ______ ______
3. ΔT ______ ______ ______
4. Heat lost by solution, qsolution ______ ______ ______
5. Heat lost by calorimeter, qcalorimeter ______ ______ ______
6. Heat gained by reaction, qrxn ______ ______ ______
7. Measured ΔHsol(NH4Cl) (kJ/mol) ______ ______ ______
8. Mean value of ΔH ______ ± ______
9. Handbook value of ΔHo
f NH4Cl(aq), kJ/mol ______
10. Handbook value of ΔHo
f NH4Cl(s), kJ/mol ______
11. Calculated ΔHsol(NH4Cl) (using ΔHfo values) ______
12. Percent errorΔHsol(NH4Cl) ______
38
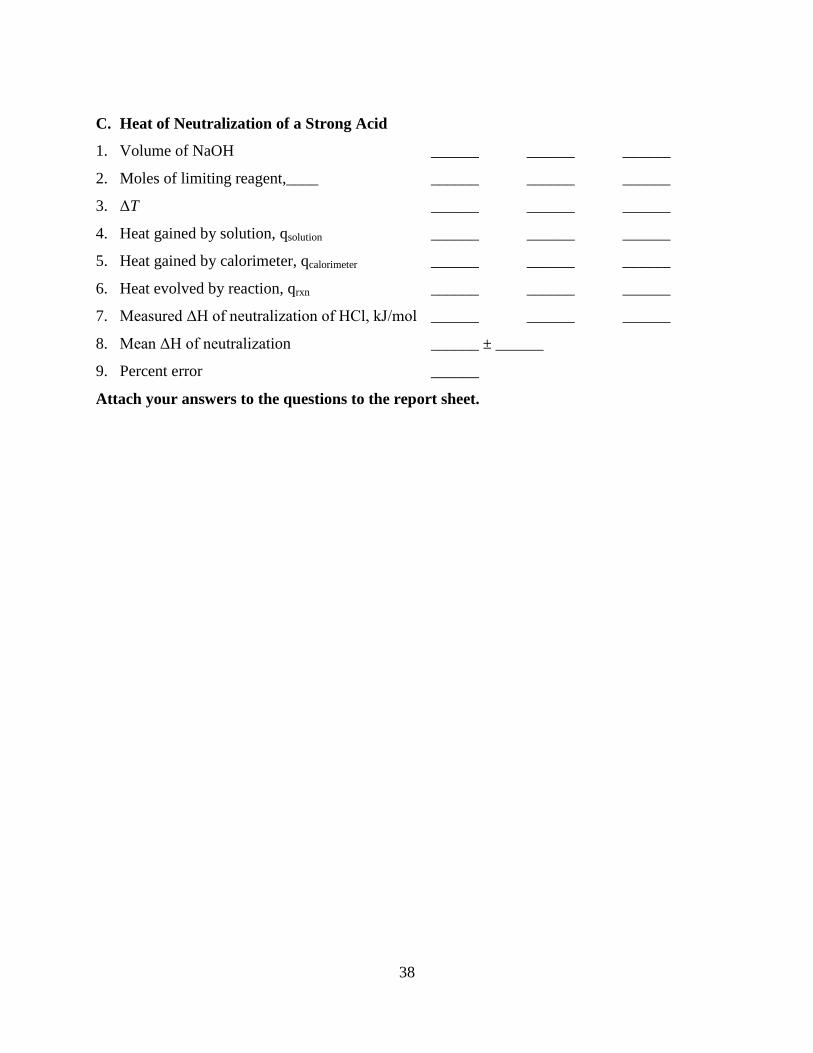
C. Heat of Neutralization of a Strong Acid
1. Volume of NaOH ______ ______ ______
2. Moles of limiting reagent,____ ______ ______ ______
3. ΔT ______ ______ ______
4. Heat gained by solution, qsolution ______ ______ ______
5. Heat gained by calorimeter, qcalorimeter ______ ______ ______
6. Heat evolved by reaction, qrxn ______ ______ ______
7. Measured ΔH of neutralization of HCl, kJ/mol ______ ______ ______
8. Mean ΔH of neutralization ______ ± ______
9. Percent error ______
Attach your answers to the questions to the report sheet.
39
NAMES: _______________________________________ LAB SECTION: ______
_______________________________________
_______________________________________
Submit only one report per group.
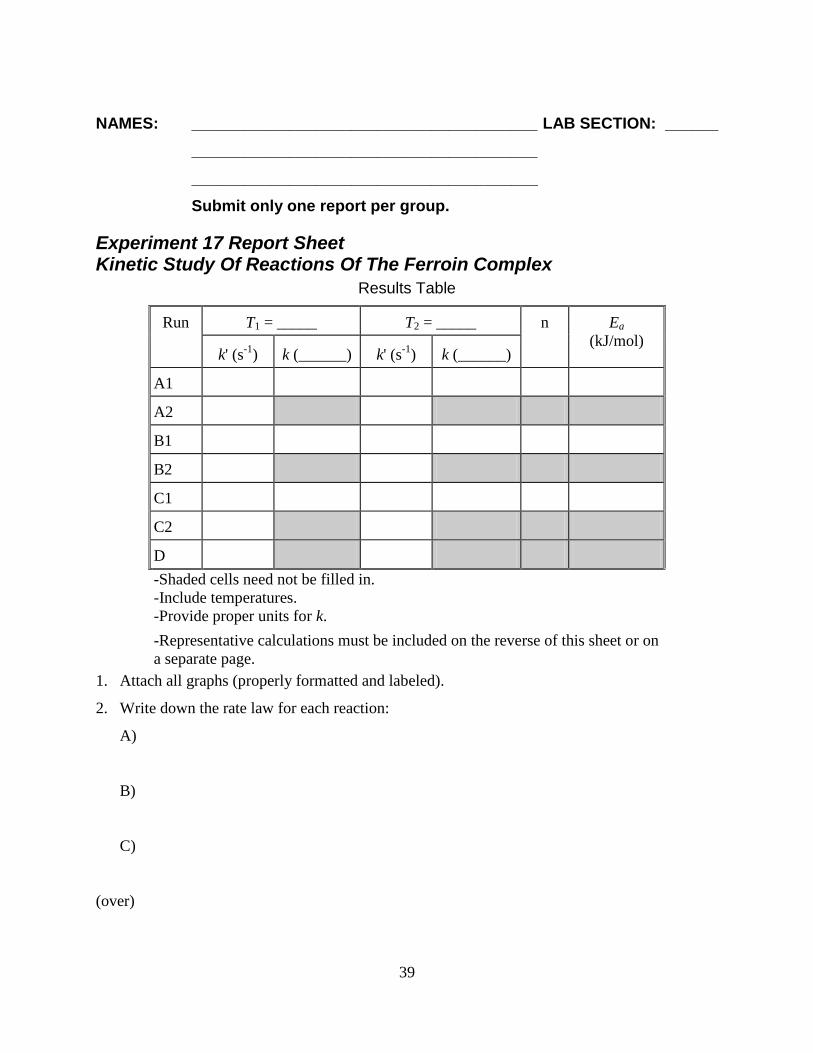
Experiment 17 Report Sheet Kinetic Study Of Reactions Of The Ferroin Complex
Results Table
Run T1 = _____ T2 = _____ n Ea
(kJ/mol) k' (s
-1) k (______) k' (s
-1) k (______)
A1
A2
B1
B2
C1
C2
D
-Shaded cells need not be filled in.
-Include temperatures.
-Provide proper units for k.
-Representative calculations must be included on the reverse of this sheet or on
a separate page.
1. Attach all graphs (properly formatted and labeled).
2. Write down the rate law for each reaction:
A)
B)
C)
(over)

40
3. Write down and explain the mechanisms for each of the reactions:
41
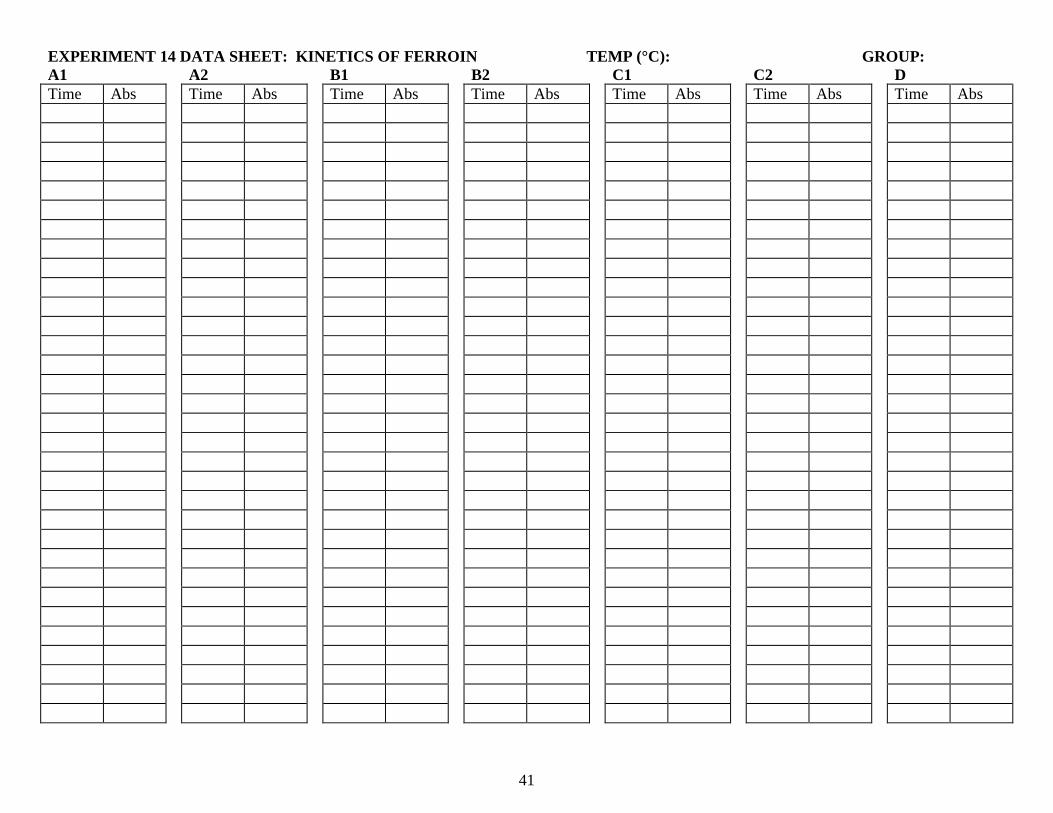
EXPERIMENT 14 DATA SHEET: KINETICS OF FERROIN TEMP (°C): GROUP:
A1 A2 B1 B2 C1 C2 D
Time Abs Time Abs Time Abs Time Abs Time Abs Time Abs Time Abs
42
EXPERIMENT 14 DATA SHEET: KINETICS OF FERROIN TEMP (°C): GROUP:
A1 A2 B1 B2 C1 C2 D
Time Abs Time Abs Time Abs Time Abs Time Abs Time Abs Time Abs
43
NAME: _______________________________________ LAB SECTION: ______
PARTNER: _______________________________________
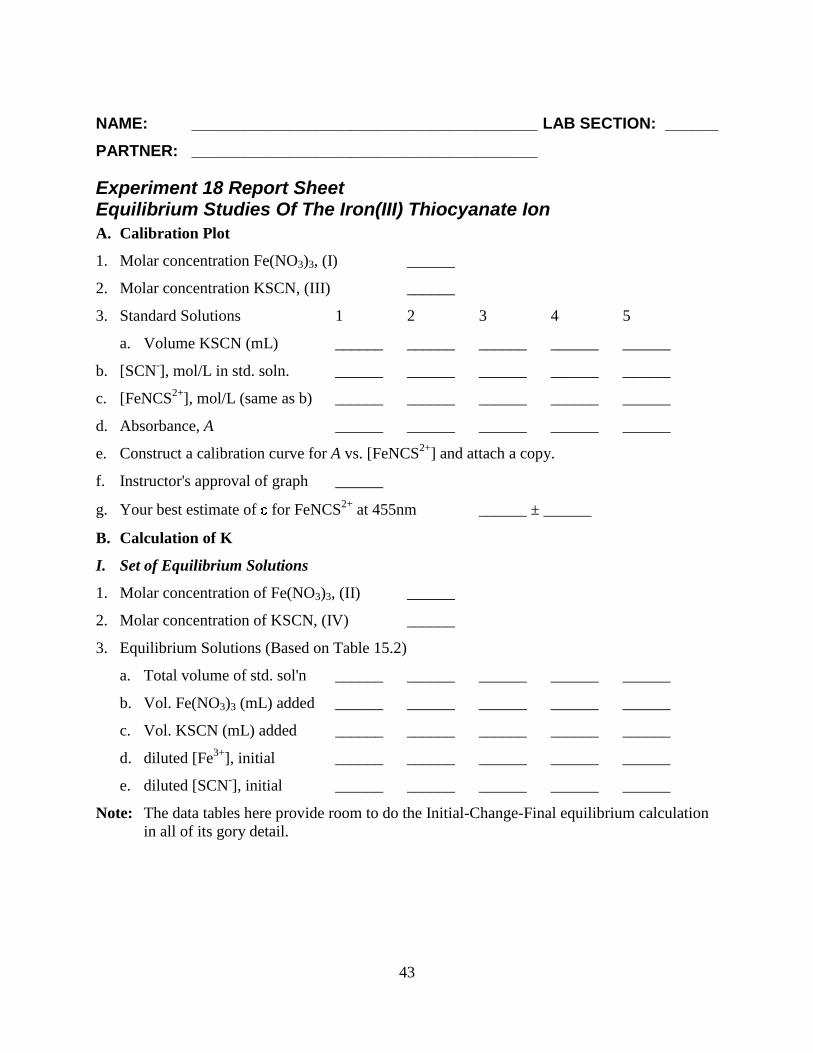
Experiment 18 Report Sheet Equilibrium Studies Of The Iron(III) Thiocyanate Ion
A. Calibration Plot
1. Molar concentration Fe(NO3)3, (I) ______
2. Molar concentration KSCN, (III) ______
3. Standard Solutions 1 2 3 4 5
a. Volume KSCN (mL) ______ ______ ______ ______ ______
b. [SCN-], mol/L in std. soln. ______ ______ ______ ______ ______
c. [FeNCS2+
], mol/L (same as b) ______ ______ ______ ______ ______
d. Absorbance, A ______ ______ ______ ______ ______
e. Construct a calibration curve for A vs. [FeNCS2+
] and attach a copy.
f. Instructor's approval of graph ______
g. Your best estimate of for FeNCS2+
at 455nm ______ ± ______
B. Calculation of K
I. Set of Equilibrium Solutions
1. Molar concentration of Fe(NO3)3, (II) ______
2. Molar concentration of KSCN, (IV) ______
3. Equilibrium Solutions (Based on Table 15.2)
a. Total volume of std. sol'n ______ ______ ______ ______ ______
b. Vol. Fe(NO3)3 (mL) added ______ ______ ______ ______ ______
c. Vol. KSCN (mL) added ______ ______ ______ ______ ______
d. diluted [Fe3+
], initial ______ ______ ______ ______ ______
e. diluted [SCN-], initial ______ ______ ______ ______ ______
Note: The data tables here provide room to do the Initial-Change-Final equilibrium calculation
in all of its gory detail.
44
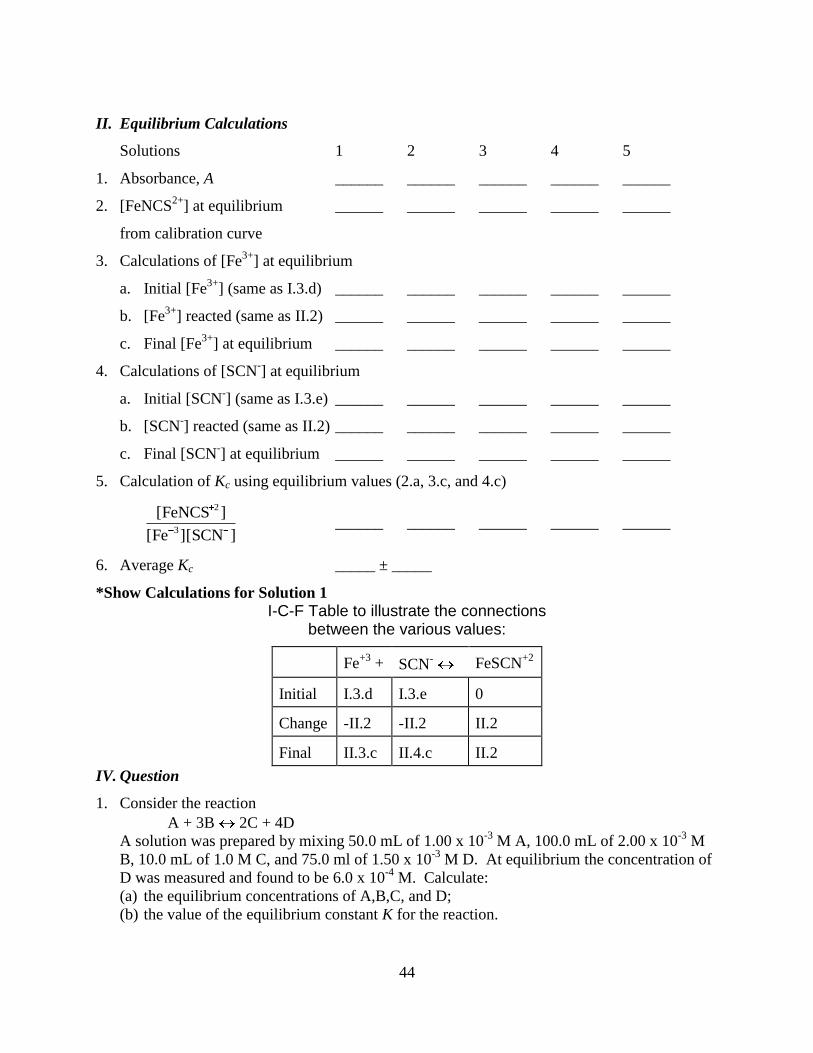
II. Equilibrium Calculations
Solutions 1 2 3 4 5
1. Absorbance, A ______ ______ ______ ______ ______
2. [FeNCS2+
] at equilibrium ______ ______ ______ ______ ______
from calibration curve
3. Calculations of [Fe3+
] at equilibrium
a. Initial [Fe3+
] (same as I.3.d) ______ ______ ______ ______ ______
b. [Fe3+
] reacted (same as II.2) ______ ______ ______ ______ ______
c. Final [Fe3+
] at equilibrium ______ ______ ______ ______ ______
4. Calculations of [SCN-] at equilibrium
a. Initial [SCN-] (same as I.3.e) ______ ______ ______ ______ ______
b. [SCN-] reacted (same as II.2) ______ ______ ______ ______ ______
c. Final [SCN-] at equilibrium ______ ______ ______ ______ ______
5. Calculation of Kc using equilibrium values (2.a, 3.c, and 4.c)
]][SCN[Fe
][FeNCS3
2
______ ______ ______ ______ ______
6. Average Kc _____ ± _____
*Show Calculations for Solution 1
I-C-F Table to illustrate the connections between the various values:
Fe+3
+ SCN- FeSCN
+2
Initial I.3.d I.3.e 0
Change -II.2 -II.2 II.2
Final II.3.c II.4.c II.2
IV. Question
1. Consider the reaction
A + 3B 2C + 4D
A solution was prepared by mixing 50.0 mL of 1.00 x 10⁻³
M A, 100.0 mL of 2.00 x 10⁻³
M
B, 10.0 mL of 1.0 M C, and 75.0 ml of 1.50 x 10⁻³
M D. At equilibrium the concentration of
D was measured and found to be 6.0 x 10⁻⁴
M. Calculate:
(a) the equilibrium concentrations of A,B,C, and D;
(b) the value of the equilibrium constant K for the reaction.
45
NAME: _______________________________________ LAB SECTION: ______
PARTNER: _______________________________________
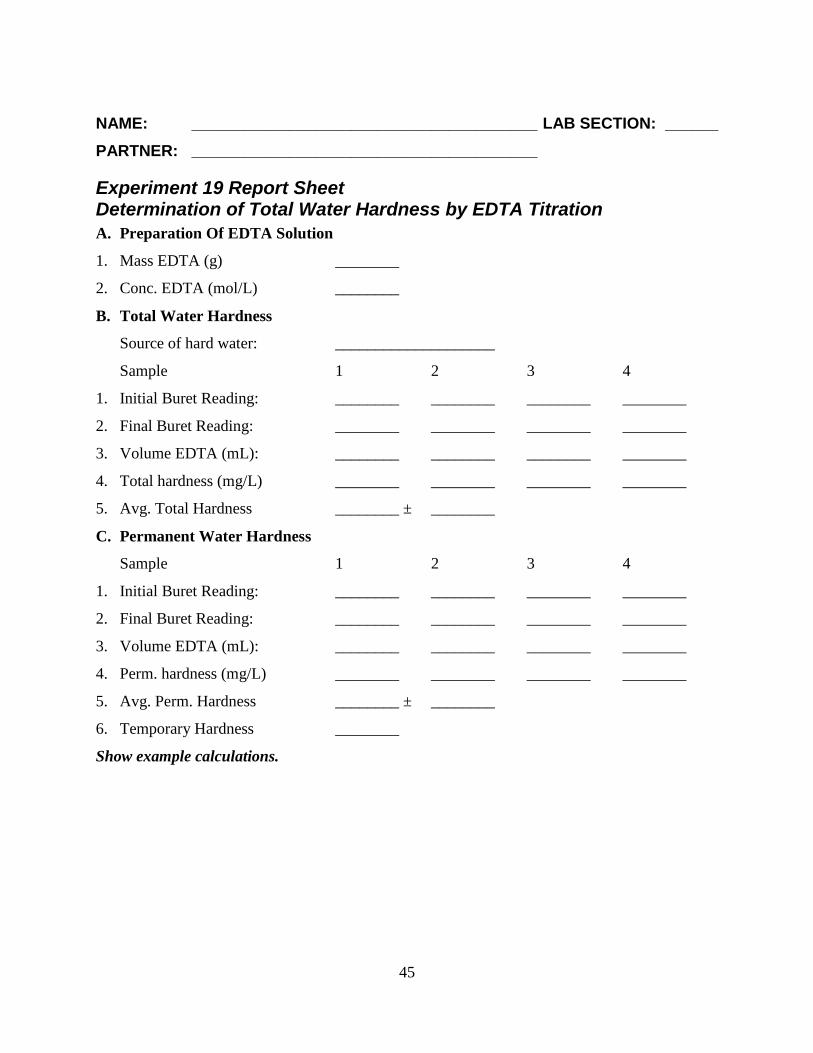
Experiment 19 Report Sheet Determination of Total Water Hardness by EDTA Titration
A. Preparation Of EDTA Solution
1. Mass EDTA (g) ________
2. Conc. EDTA (mol/L) ________
B. Total Water Hardness
Source of hard water: ____________________
Sample 1 2 3 4
1. Initial Buret Reading: ________ ________ ________ ________
2. Final Buret Reading: ________ ________ ________ ________
3. Volume EDTA (mL): ________ ________ ________ ________
4. Total hardness (mg/L) ________ ________ ________ ________
5. Avg. Total Hardness ________ ± ________
C. Permanent Water Hardness
Sample 1 2 3 4
1. Initial Buret Reading: ________ ________ ________ ________
2. Final Buret Reading: ________ ________ ________ ________
3. Volume EDTA (mL): ________ ________ ________ ________
4. Perm. hardness (mg/L) ________ ________ ________ ________
5. Avg. Perm. Hardness ________ ± ________
6. Temporary Hardness ________
Show example calculations.
46
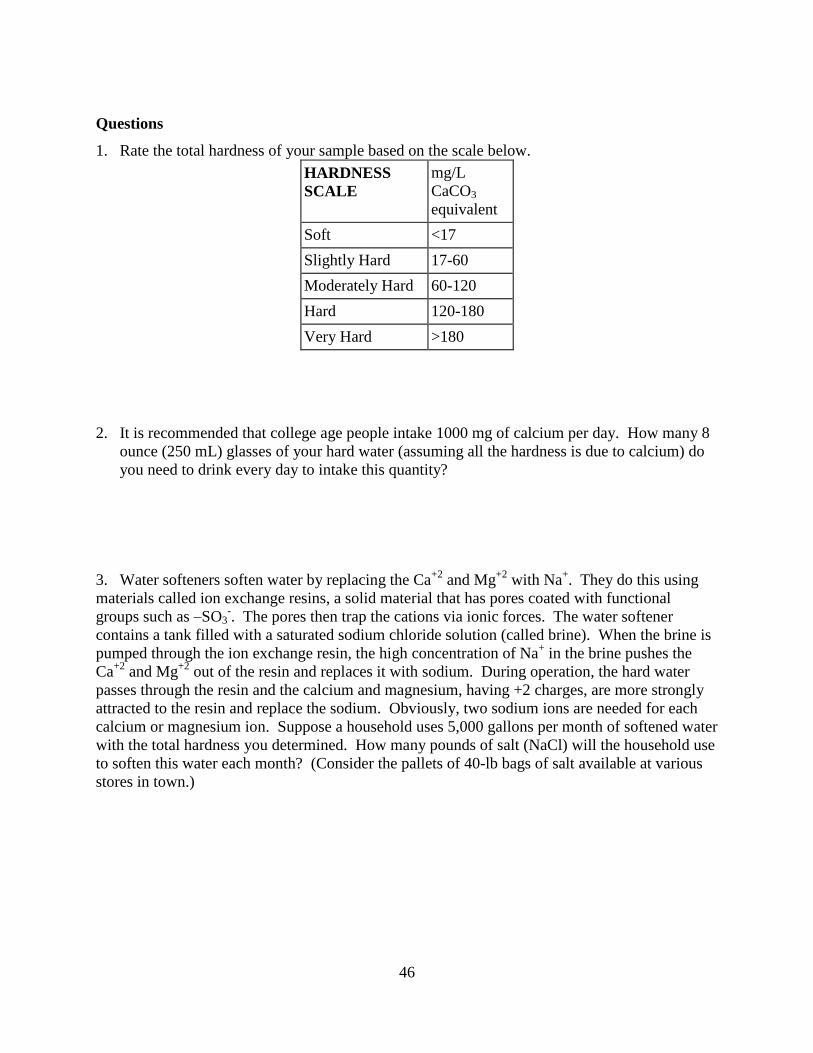
Questions
1. Rate the total hardness of your sample based on the scale below.
HARDNESS
SCALE
mg/L
CaCO3
equivalent
Soft <17
Slightly Hard 17-60
Moderately Hard 60-120
Hard 120-180
Very Hard >180
2. It is recommended that college age people intake 1000 mg of calcium per day. How many 8
ounce (250 mL) glasses of your hard water (assuming all the hardness is due to calcium) do
you need to drink every day to intake this quantity?
3. Water softeners soften water by replacing the Ca+2
and Mg+2
with Na+. They do this using
materials called ion exchange resins, a solid material that has pores coated with functional
groups such as –SO3-. The pores then trap the cations via ionic forces. The water softener
contains a tank filled with a saturated sodium chloride solution (called brine). When the brine is
pumped through the ion exchange resin, the high concentration of Na+ in the brine pushes the
Ca+2
and Mg+2
out of the resin and replaces it with sodium. During operation, the hard water
passes through the resin and the calcium and magnesium, having +2 charges, are more strongly
attracted to the resin and replace the sodium. Obviously, two sodium ions are needed for each
calcium or magnesium ion. Suppose a household uses 5,000 gallons per month of softened water
with the total hardness you determined. How many pounds of salt (NaCl) will the household use
to soften this water each month? (Consider the pallets of 40-lb bags of salt available at various
stores in town.)
47
NAME: _______________________________________ LAB SECTION: ______
PARTNER: _______________________________________
Experiment 20 Report Sheet Buffers And Titrations
Titration of monoprotic weak acid.
Prepare a pH titration curve for the unknown acid. Indicate which unknown acid you have on
your graph and label all axes and important points (e.g., equivalence point, etc.)
Attach answers to the questions posed in the experiment.

48
49
NAME: _______________________________________ LAB SECTION: ______
PARTNER: _______________________________________
Experiment 21 Report Sheet Voltaic Electrochemical Cells
Section D
Cell Cathode Anode Cell Potential
(Expt) (Theory)
I + II Cu Zn ______ ______
I + III ______ ______ ______ ______
I + IV ______ ______ ______ ______
II + III ______ ______ ______ ______
II + IV ______ ______ ______ ______
III + IV ______ ______ ______ ______
Section E
Cell Cathode Anode Cell Potential
(Expt) (Theory)
I + V ______ ______ ______ ______
I + VI ______ ______ ______ ______
I + VII ______ ______ ______ ______

50
51
NAME: _______________________________________ LAB SECTION: ______
PARTNER: _______________________________________
Experiment 22 Report Sheet Isolation of Copper from a 5-Cent Coin
Anode and Cathode
1. Initial mass of nickel anode ________
2. Initial mass of Cu cathode ________
3. Final mass of nickel anode ________
4. Change in mass of nickel anode ________
5. Final mass of Cu cathode ________ (wait till completely dry)
6. Change in mass of Cu cathode ________
7. % Yield of Cu on cathode ________
Observations
Record your observations during the electrolysis process.
Results
Prepare a graph of current vs. time in Excel and attach the chart to this report sheet.
Calculations
1. Total charge delivered through circuit (C) ________
2. Moles e- delivered through circuit ________
3. Mass of Ni lost from nickel coin ________
4. Moles of Ni lost from nickel coin ________
5. Moles e- needed to oxidize Ni ________
5. Mass of Cu lost from nickel coin ________
6. Moles of Cu lost from nickel coin ________
7. Moles e- needed to oxidize Cu ________
8. Total moles e- used to oxidize coin ________
Discuss your results.


![Analysis [4541/1] [4541/2] Chemistry [4541/3] · 104 SOALAN ULANGKAJI SPM 2011 JAWAPAN boleh didapati di laman web Chemistry Analysis [4541/1] [4541/2] [4541/3] Chapter Paper 1 Paper2](https://img.pdfslide.net/doc/110x75/5e487e4b8835e009494c6a70/analysis-45411-45412-chemistry-45413-104-soalan-ulangkaji-spm-2011-jawapan.jpg)