Embed Size (px)
Citation preview
Te
MAa
b
c
d
a
ARRAA
KSSPDXF
1
e(hpma
p2iicc
k
(((
0d
Chemistry and Physics of Lipids 160 (2009) 85–97
Contents lists available at ScienceDirect
Chemistry and Physics of Lipids
journa l homepage: www.e lsev ier .com/ locate /chemphys l ip
he solid–liquid phase diagrams of binary mixtures of consecutive,ven saturated fatty acids
ariana C. Costa a,b, Mariana Sardo b, Marlus P. Rolemberg c, João A.P. Coutinho b,ntonio J.A. Meirelles d, Paulo Ribeiro-Claro b, M.A. Krähenbühl a,∗
LPT, Department of Chemical Process, School of Chemical Engineering, University of Campinas, UNICAMP, P.O. Box 6066, 13083-970 Campinas, SP, BrazilCICECO, Departamento de Química da Universidade de Aveiro, 3810-193 Aveiro, PortugalDETQI, Department of Chemical Technology, Universidade Federal do Maranhão (UFMA), São Luís, Maranhão, BrazilEXTRAE, Department of Food Engineering, School of Food Engineering, University of Campinas, UNICAMP, P.O. Box 6121, 13083-862 Campinas, SP, Brazil
r t i c l e i n f o
rticle history:eceived 18 January 2008eceived in revised form 19 February 2009ccepted 19 May 2009vailable online 9 June 2009
a b s t r a c t
For the first time, the solid–liquid phase diagrams of five binary mixtures of saturated fatty acids are herepresented. These mixtures are formed of caprylic acid (C8:0) + capric acid (C10:0), capric acid (C10:0) + lauricacid (C12:0), lauric acid (C12:0) + myristic acid (C14:0), myristic acid (C14:0) + palmitic acid (C16:0) and palmiticacid (C16:0) + stearic acid (C18:0). The information used in these phase diagrams was obtained by differ-ential scanning calorimetry (DSC), X-ray diffraction (XRD), FT–Raman spectrometry and polarized light
eywords:olid–liquid equilibriumaturated fatty acidshase diagramSC
microscopy, aiming at a complete understanding of the phase diagrams of the fatty acid mixtures. All ofthe phase diagrams reported here presented the same global behavior and it was shown that this was farmore complex than previously imagined. They presented not only peritectic and eutectic reactions, butalso metatectic reactions, due to solid–solid phase transitions common in fatty acids and regions of solidsolution not previously reported. This work contributes to the elucidation of the phase behavior of these
olecu
RDT–Ramanimportant biochemical m
. Introduction
Fatty acids have aroused the interest of researchers since thearly 1900s because they are the major components of oils and fatsKarleskind, 1996). Lately, an accrued interest in these compoundsas resulted from their application in the production of coatings,lastics, cleaning products (Johnson and Fritz, 1989), phase changeaterials for energy storage (Zhang et al., 2001; Shilei et al., 2006)
nd biodiesel (Falk and Meyer-Pittroff, 2004; Meher et al., 2006).Due to the applications of fatty acids in the chemical, food and
harmaceutical industries (Carvalho et al., 2006; Kogan and Garti,006), knowledge about their properties and phase behavior could
nduce innovations in many branches of these industries, especiallyn the food industry, due to the influence of the phase behavior and
rystalline habit of the fatty acid mixtures on the characteristics ofonsumer products, such as confectionary fats.The polymorphism of triglycerides and fatty acids has beennown for a long time, but the study of the crystal forms of pure
∗ Corresponding author. Tel.: +55 19 3521 3964; fax: +55 19 3521 3965.E-mail addresses: [email protected] (M.C. Costa), [email protected]
M. Sardo), [email protected] (M.P. Rolemberg), [email protected]. Coutinho), [email protected] (A.J.A. Meirelles), [email protected]. Ribeiro-Claro), [email protected] (M.A. Krähenbühl).
009-3084/$ – see front matter © 2009 Elsevier Ireland Ltd. All rights reserved.oi:10.1016/j.chemphyslip.2009.05.004
les, with implications in various industrial applications.© 2009 Elsevier Ireland Ltd. All rights reserved.
fatty acids only began around 1950 and to this day is still a chal-lenging task (Vand et al., 1951; Holland and Nielsen, 1963; Lomer,1963; Goto and Asada, 1978a,b; Kaneko et al., 1990; Moreno et al.,2007). Researchers have been concerned about both the study ofthe properties and the behavior of fats and glycerides in the solidphase (Chapman, 1962; Timms, 1984; Garti and Sato, 1989; Sato etal., 1999; Sato, 2001), and the phase diagrams of fats (Bailey, 1950;Timms, 1984; Small, 1986; Sato et al., 1999; Sato, 2001) and fattyacids (Inoue et al., 2004a; Inoue et al., 2004b; Inoue et al., 2004c;Costa et al., 2007b).
The existence of invariant points, such as eutectic and peritec-tic points, in mixtures of saturated fatty acids has already beenreported (Bailey, 1950; Small, 1986), but in recent works by thepresent authors (Costa et al., 2007a,b), the presence of these invari-ant points was also observed in mixtures for which the differencein carbon atom number between the chains was inferior to 6. Thephase diagrams of binary mixtures of fatty acids were believedto be simply eutectic for systems with chain length differencesequal or larger to 6 carbon atoms, whilst for the others the pres-ence of an intermediate compound, unstable at the melting point,
originated a peritectic point (Small, 1986; Iwahashi et al., 2005).Recent results concerning the phase diagrams of binary systemsof dicarboxylic acids have shown the complexity of these sys-tems below the liquidus line (Ventola et al., 2006; Ventola etal., 2008). The phase diagrams reported the presence of eutec-
8 d Phys
tbtdsaapogl
esawFlbMm
2
2
c9mhw(paywu((
2
2
cmfoofwpupon2
stoa1p
6 M.C. Costa et al. / Chemistry an
ic, peritectic and metatectic and several monophasic regions, andiphasic solid–solid and solid–liquid domains. The complexity ofhe phase diagrams of dicarboxylic acids suggested that the phaseiagrams of fatty acids should also be very complex. As a con-equence the phase diagrams of the binary mixtures of the fattycids determined using the DSC technique, were reviewed, andnumber of indications that they were far more complex than
reviously admitted were found. To confirm these indicationsther techniques were used to elucidate the complete phase dia-rams of the binary mixtures of fatty acids, below the saturationine.
This is part of a series of studies concerning the solid–liquidquilibrium (SLE) of fatty acid binary mixtures. In the presenttudy the phase diagrams of binary mixtures of saturated fattycids with a difference of two carbon atoms between the chains,ere established using DSC measurements complemented by
T–Raman spectroscopy, X-ray diffraction studies and polarizedight microscopy. It will be shown that, as expected from what hadeen observed with similar systems (Ventola et al., 2006, 2008;oreno et al., 2007), the phase diagram of these mixtures was farore complex than previously admitted.
. Experimental
.1. Materials
The standards used to calibrate the DSC were indium (99.99%)ertified by TA instruments (United States); cyclohexane (min9.9%) and naphthalene (min 99%), both from Merck (Ger-any). The fatty acids used to prepare the samples were of
igh purity and were obtained from the following suppliersith no further purification: caprylic acid (min 99%), capric acid
min 99%), lauric acid (99–100%), myristic acid (99–100%) andalmitic acid (min 99%) – Sigma–Aldrich (United States); steariccid (min 97%) – Merck (Germany) was used in the DSC anal-sis and stearic acid (min 99%) – Sigma–Aldrich (United States)as used in the other analyses. Commercial nitrogen (99.99%,sed for preparing the binary samples) and high purity nitrogen99.9999%, used in the calorimeter) were supplied by Air LiquideBrazil).
.2. Methods
.2.1. Preparation of the fatty acid binary mixturesSamples of 1 g of the fatty acid mixtures were prepared for the
ompositions only studied by DSC. For the compositions studied byultiple techniques, 3–5 g samples were prepared according to the
ollowing methodology: an amount of each fatty acid was weighedn an analytical balance (Adam AAA/L) with ±0.2 mg accuracy, tobtain a desired molar fraction, generally an interval of 0.1 molarraction, with an uncertainty of ±0.0002. The compounds weighed
ere placed in vials and heated to 10 K above the highest meltingoint of the components. While heating, the samples were mixedsing a magnetic stirrer in an atmosphere of nitrogen. The tem-erature limit and the nitrogen atmosphere were adopted to avoidxidation of the fatty acids. The mixtures were then allowed to cool,aturally, to room temperature (298.15 K) and kept in a freezer at73 K until further analysis.
For the FT–Raman spectra recorded before melting (BM) theamples were just weighed and mixed in the solid state by crushing
he crystals in a mortar. The melting of these samples was carriedut in the spectrophotometer inside the capillary tube used for thenalysis after recording the BM spectra, at a temperature circa to0 K above the melting point of the heaviest compound. The sam-les were then cooled inside the spectrophotometer, naturally, toics of Lipids 160 (2009) 85–97
the temperature required to acquire the spectra after mixing thecompounds in the liquid phase and allowing for the formation ofnew mixed crystals.
2.2.2. Differential scanning calorimetry (DSC)The solid–liquid equilibrium of the pure fatty acids and their
mixtures were characterized by DSC using a MDSC 2920 TA Instru-ments calorimeter, equipped with a refrigerated cooling systemwhich, in this study, operated between 258 K and 423 K. Samples(2–5 mg) of each mixture were weighed in a microanalytical bal-ance (PerkinElmer AD6) with an accuracy of ±0.2 × 10⁻⁵ mg, andput in sealed aluminum pans. In order to erase previous thermalhistories, each sample was submitted to an initial heating run at5.0 K min−1, initiated at ambient temperature (298.15 K) and con-tinuing until a temperature 15 K above the highest melting point ofthe components was reached. After 20 min at this temperature, thesamples were cooled to 25 K below the lowest melting point of thecomponents, at a cooling rate of 1.0 K min−1, and allowed to stay atthis temperature for 30 min. After this pre-treatment each samplewas analyzed in a heating run at a heating rate of 1.0 K min−1. Peaktop temperatures were measured for pure fatty acids and for thefatty acid mixtures using a universal analysis program of TA instru-ments. Peak top temperatures were also considered to determinethe temperature of phase transitions associated with overlappedpeaks.
Eq. (1) was used to calculate the average of absolute deviations(AAD) between the measurements. The AAD were estimated to beinferior to 0.2 K (Costa et al., 2007b).
AAD = 1n
n∑
i=1
|Ti,lit − Ti,exp| (1)
Through the phase diagram constructed by DSC was possible tomake a choice of compositions and temperatures, bellow the liq-uidus line, that would be investigate by other techniques. So, thedesired temperature mentioned in the following sections is the tem-perature selected through the phase diagram, generally betweentwo transitions detected by DSC.
2.2.3. Polarized light microscopyA Leica (DM LM) light microscope was used to acquire the
images. The images at ambient temperature were obtained usinga polarized lens and transmitted light. The samples were preparedby melting the sample between two coverslips.
The images at controlled temperatures were obtained by puttingthe sample on a coverslip on a hot FP82H stage connected to thecentral processor unit of the Mettler Toledo FP 90 DSC. The centralprocessor unit was programmed to heat the sample at a heatingrate of 0.1 K min−1, initiating at the ambient temperature, 298.15 K,until the melting of the sample was reached. Images were acquiredwith a magnification of 50 times at each 0.5 K, or when the samplepresented modifications.
2.2.4. X-ray diffractionThe fatty acid diffractograms were obtained using a Philips
X’Pert equipment operating in the reflection mode with Cu K�(� = 1.5406 Å). The cool chamber was an Anton Paar TTK450, thetemperature controller a TCU100 and the chamber was cooled usingliquid nitrogen. Diffraction data were collected in the 2� range from4◦ to 50◦ in steps of 0.02 and a time per step of 2 s, with incidentand diffracted beams with anti-scatter slits of 1◦, receiving slit of
0.1 mm and a curved graphite diffracted beam monochromator. Thediffractograms acquired for these mixtures did not have sufficientresolution to allow for the crystal structures to be derived fromthem. They were only used to identify differences between the solidregions.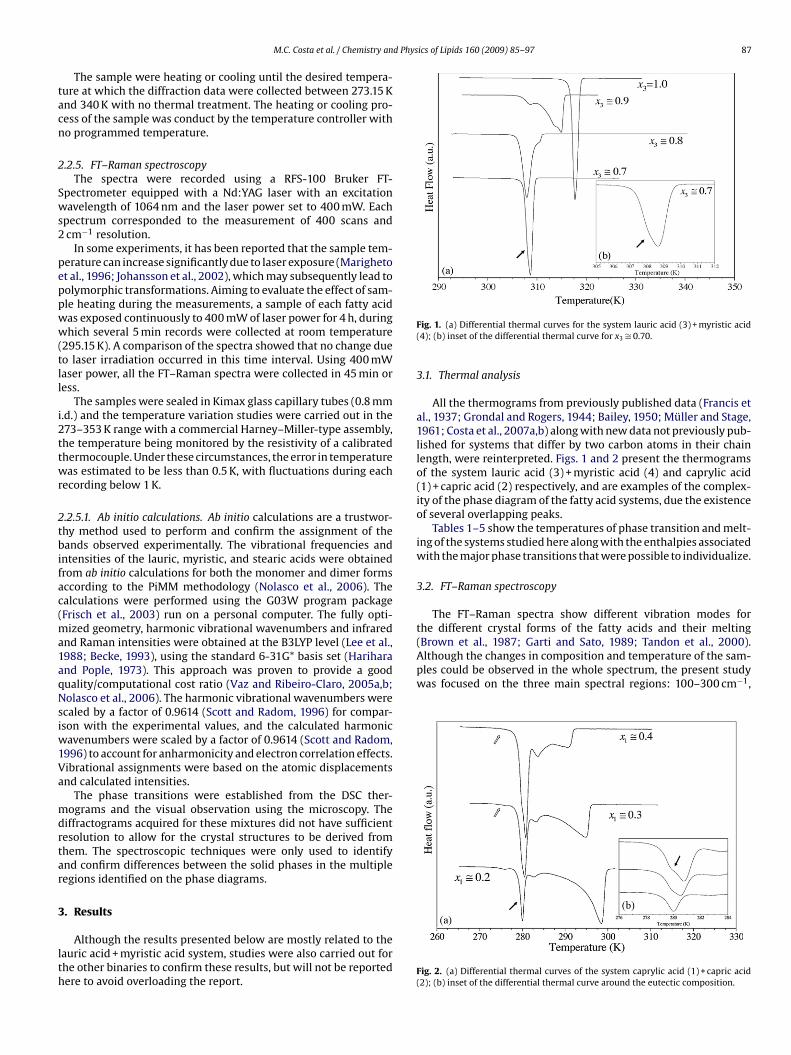
d Physics of Lipids 160 (2009) 85–97 87
tacn
2
Sws2
peppww(tll
i2ttwr
2tbifac(ma1aqNsiw1Va
mdrtar
3
lth
(Brown et al., 1987; Garti and Sato, 1989; Tandon et al., 2000).Although the changes in composition and temperature of the sam-ples could be observed in the whole spectrum, the present studywas focused on the three main spectral regions: 100–300 cm−1,
M.C. Costa et al. / Chemistry an
The sample were heating or cooling until the desired tempera-ure at which the diffraction data were collected between 273.15 Knd 340 K with no thermal treatment. The heating or cooling pro-ess of the sample was conduct by the temperature controller witho programmed temperature.
.2.5. FT–Raman spectroscopyThe spectra were recorded using a RFS-100 Bruker FT-
pectrometer equipped with a Nd:YAG laser with an excitationavelength of 1064 nm and the laser power set to 400 mW. Each
pectrum corresponded to the measurement of 400 scans andcm−1 resolution.
In some experiments, it has been reported that the sample tem-erature can increase significantly due to laser exposure (Marighetot al., 1996; Johansson et al., 2002), which may subsequently lead toolymorphic transformations. Aiming to evaluate the effect of sam-le heating during the measurements, a sample of each fatty acidas exposed continuously to 400 mW of laser power for 4 h, duringhich several 5 min records were collected at room temperature
295.15 K). A comparison of the spectra showed that no change dueo laser irradiation occurred in this time interval. Using 400 mWaser power, all the FT–Raman spectra were collected in 45 min oress.
The samples were sealed in Kimax glass capillary tubes (0.8 mm.d.) and the temperature variation studies were carried out in the73–353 K range with a commercial Harney–Miller-type assembly,he temperature being monitored by the resistivity of a calibratedhermocouple. Under these circumstances, the error in temperatureas estimated to be less than 0.5 K, with fluctuations during each
ecording below 1 K.
.2.5.1. Ab initio calculations. Ab initio calculations are a trustwor-hy method used to perform and confirm the assignment of theands observed experimentally. The vibrational frequencies and
ntensities of the lauric, myristic, and stearic acids were obtainedrom ab initio calculations for both the monomer and dimer formsccording to the PiMM methodology (Nolasco et al., 2006). Thealculations were performed using the G03W program packageFrisch et al., 2003) run on a personal computer. The fully opti-
ized geometry, harmonic vibrational wavenumbers and infrarednd Raman intensities were obtained at the B3LYP level (Lee et al.,988; Becke, 1993), using the standard 6-31G* basis set (Hariharand Pople, 1973). This approach was proven to provide a gooduality/computational cost ratio (Vaz and Ribeiro-Claro, 2005a,b;olasco et al., 2006). The harmonic vibrational wavenumbers were
caled by a factor of 0.9614 (Scott and Radom, 1996) for compar-son with the experimental values, and the calculated harmonic
avenumbers were scaled by a factor of 0.9614 (Scott and Radom,996) to account for anharmonicity and electron correlation effects.ibrational assignments were based on the atomic displacementsnd calculated intensities.
The phase transitions were established from the DSC ther-ograms and the visual observation using the microscopy. The
iffractograms acquired for these mixtures did not have sufficientesolution to allow for the crystal structures to be derived fromhem. The spectroscopic techniques were only used to identifynd confirm differences between the solid phases in the multipleegions identified on the phase diagrams.
. Results
Although the results presented below are mostly related to theauric acid + myristic acid system, studies were also carried out forhe other binaries to confirm these results, but will not be reportedere to avoid overloading the report.
Fig. 1. (a) Differential thermal curves for the system lauric acid (3) + myristic acid(4); (b) inset of the differential thermal curve for x3 ∼= 0.70.
3.1. Thermal analysis
All the thermograms from previously published data (Francis etal., 1937; Grondal and Rogers, 1944; Bailey, 1950; Müller and Stage,1961; Costa et al., 2007a,b) along with new data not previously pub-lished for systems that differ by two carbon atoms in their chainlength, were reinterpreted. Figs. 1 and 2 present the thermogramsof the system lauric acid (3) + myristic acid (4) and caprylic acid(1) + capric acid (2) respectively, and are examples of the complex-ity of the phase diagram of the fatty acid systems, due the existenceof several overlapping peaks.
Tables 1–5 show the temperatures of phase transition and melt-ing of the systems studied here along with the enthalpies associatedwith the major phase transitions that were possible to individualize.
3.2. FT–Raman spectroscopy
The FT–Raman spectra show different vibration modes forthe different crystal forms of the fatty acids and their melting
Fig. 2. (a) Differential thermal curves of the system caprylic acid (1) + capric acid(2); (b) inset of the differential thermal curve around the eutectic composition.
88 M.C. Costa et al. / Chemistry and Physics of Lipids 160 (2009) 85–97
Table 1Solid–liquid equilibrium data for caprylic acid (1) + capric acid (2) system.
x1 (molar fraction) Tmelting (K) �Hsample
(kJ mol mix−1)Tperitectic (K) �Hperitectic
(kJ mol mix−1)Tmetatectic (K) Teutectic (K) �Heutectic
(kJ mol mix−1)Ttrans1 (K) Ttrans2 (K) Ttrans3 (K) Ttrans.pure (K)
0.0000 304.42 28.200.1000 301.89 25.49 279.36 1.71 281.810.1999 298.54 17.05 280.02 3.81 282.80 275.750.3000 294.98 12.10 280.53 7.55 283.29 276.04 279.980.4001 291.21 4.35 280.86 11.99 283.64 279.79 289.400.5000 286.84 0.40 281.28 14.60 283.30 276.73 2.850.5994 280.63 11.89 277.41 8.880.6997 278.36 8.92 277.13 10.490.7998 281.91 1.70 276.88 17.74 278.790.8998 285.96 11.02 277.73 4.21 281.251.0000 289.63 22.34 287.72
Table 2Solid–liquid equilibrium data for capric acid (2) + lauric acid (3) system.
x2 (molar fraction) Tmelting (K) �Hsample
(kJ mol mix−1)Tperitectic (K) �Hperitectic
(kJ mol mix−1)Tmetatectic (K) Teutectic (K) �Heutectic
(kJ mol mix−1)Ttrans1 (K) Ttrans2 (K) Ttrans3 (K) Ttrans.pure (K)
0.0000 318.07 38.70 317.560.1010 314.86 32.11 296.30 1.22 299.520.1993 311.94 24.85 296.95 5.59 299.450.2999 309.12 15.86 297.29 11.10 299.54 295.56 306.370.4001 304.82 3.96 296.95 17.24 299.52 296.05 303.050.4457 302.8 0.88 297.16 10.13 299.38 292.76 0.160.5002 299.06 2.23 293.36 2.860.5530 296.77 9.16 293.02 4.530.5989 296.31 5.20 293.55 8.160.6529 295.33 3.64 293.95 9.730.7001 294.75 9.08 293.27 17.010001
1l
camssF((a
3
c
TS
x
000000000001
.7516 294.35
.7998 298.15 3.66
.9000 301.94 19.64
.0000 304.42 28.20
350–1550 cm−1 and 2800–3050 cm−1, as shown in Fig. 3 for theauric acid (3) + myristic acid (4) system.
To evaluate if the solid phase region of the phase diagrams wasomposed of the pure fatty acids plus an intermediate compound,s suggested by some authors (Bailey, 1950; Small, 1986), physicalixtures of the pure compounds were prepared and their Raman
pectra collected before melting the sample, and compared with thepectra collected after melting and recrystallization of the sample.ig. 4 shows the Raman spectra for the lauric acid (3) + myristic acid4) system at 305 K before (physical mixture, dashed line) and aftersolid line) sample melting, in the three spectral regions mentionedbove.
.3. X-ray diffraction
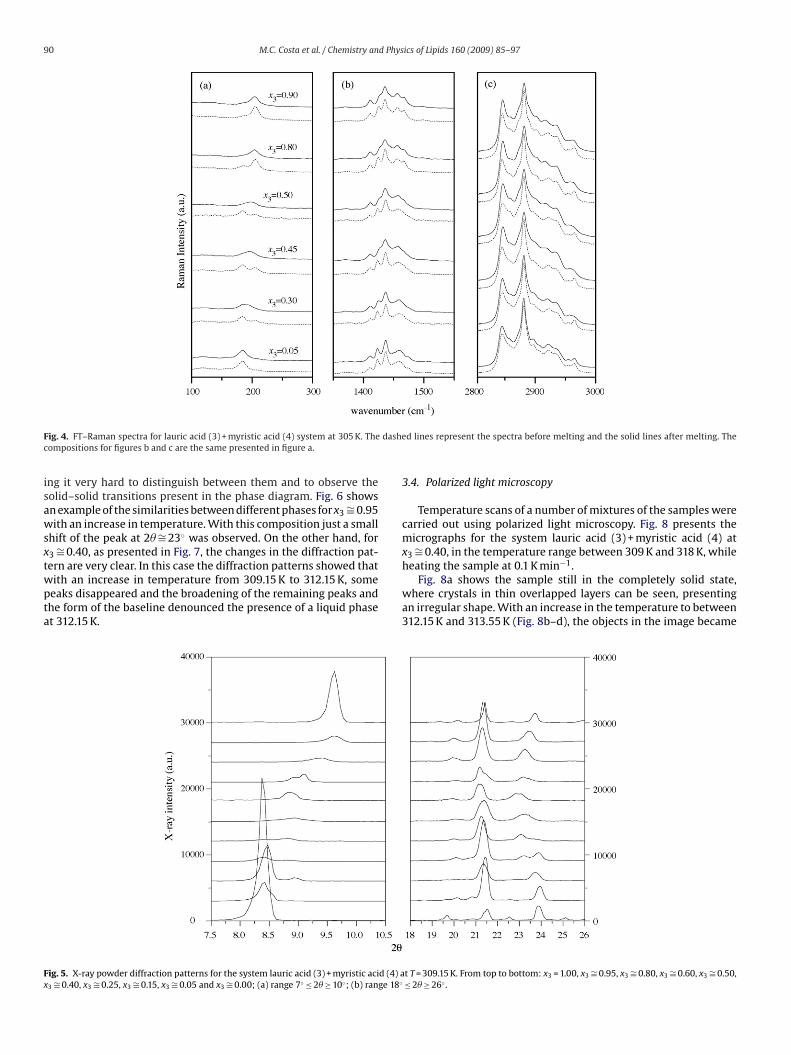
Fig. 5 shows the diffraction patterns at 298.15 K for differentompositions of the lauric acid (3) + myristic acid (4) system in
able 3olid–liquid equilibrium data for lauric acid (3) + myristic acid (4) system.
3 (molar fraction) Tmelting (K) �Hsample
(kJ mol mix−1)Tperitectic (K) �Hperitectic
(kJ mol mix−1)
.0000 328.88 48.35
.1004 325.72 41.23 310.04 0.83
.1997 323.24 32.50 310.55 7.00
.3002 319.08 14.29 310.88 14.66
.4001 314.79 8.24 310.9 21.72
.5002 310.96 34.92
.6002 310.42 24.39
.6400 309.7 31.02
.7001 308.66
.7996 310.61
.8996 314.93 28.44
.0000 318.07 48.35
293.37 12.65293.07 7.36 294.49
294.53 300.23
the ranges of 7.5◦ ≤ 2� ≥ 10◦ and 18◦ ≤ 2� ≥ 26◦. The first importantobservation was the similarities between the diffraction patternsof the pure fatty acids and those of the mixtures x3 ∼= 0.95 andx3 ∼= 0.05. Both mixtures presented almost the same diffraction pat-tern, except for the disappearance of some very small peaks presentin the pure fatty acid in which the mixture was richer.
Also, in Fig. 5, for x3 ∼= 0.15, it was possible to observe the appear-ance of new peaks at 2� ∼= 9◦ and 2� ∼= 23◦. These peaks could beattributed to a new phase that, with the increase in concentrationof the lauric acid, coexisted with other phases due to the coexis-tence of these new peaks with the previously referred to myristicphase, and after reaching a certain value for the lauric acid concen-
tration, the new peaks coexisted with the peaks related to the lauricacid phase.The effect of temperature on the diffractograms was evaluatedfor the same compositions mentioned above. Unfortunately mostsolid phases present very similar powder diffractograms, mak-
Tmetatectic (K) Teutectic (K) �Heutectic
(kJ mol mix−1)Ttrans1 (K) Ttrans.pure (K)
328.18312.19312.55312.69 318.22312.84
308.1 4.27308.34 10.68308.23 32.05308.05 34.38307.92 32.13308.5 5.06 313.47
317.56
M.C. Costa et al. / Chemistry and Physics of Lipids 160 (2009) 85–97 89
Table 4Solid–liquid equilibrium data for myristic acid (4) + palmitic acid (5) system.
x4 (molar fraction) Tmelting (K) �Hsample
(kJ mol mix−1)Tperitectic (K) �Hperitectic
(kJ mol mix−1)Tmetatectic (K) Teutectic (K) �Heutectic
(kJ mol mix−1)Ttrans (K) Ttrans.pure (K)
0.0000 335.44 55.850.0490 335.41 48.460.1010 334.06 36.69 320.05 0.99 322.290.1510 332.87 24.34 320.63 3.22 322.540.2020 331.87 20.18 320.85 5.54 322.710.2517 330.77 17.21 320.96 8.09 322.76 328.600.3027 329.63 12.62 321.21 11.64 323.02 326.940.3491 328.01 8.14 321.43 15.78 323.15 325.640.4002 326.00 2.50 321.17 20.58 322.960.4499 321.27 41.03 318.62 1.220.5023 321.75 36.71 319.06 4.040.5505 321.99 34.15 319.32 5.550.6044 321.18 15.98 319.30 7.550.6498 320.64 10.13 319.38 17.320.6984 320.42 8.91 319.59 27.380.7203 319.96 21.970.8499 324.04 4.57 319.74 17.75 322.020.9004 325.54 13.29 319.60 8.28 324.001.0000 328.88 44.01 1.22 328.18
Table 5Solid–liquid equilibrium data for palmitic acid (5) + stearic acid (6) system.
x5 (molar fraction) Tmelting (K) �Hsample
(kJ mol mix−1)Tperitectic (K) �Hperitectic
(kJ mol mix−1)Tmetatectic (K) Teutectic (K) �Heutectic
(kJ mol mix−1)Ttrans (K) Ttrans.pue (K)
0.0000 343.98 67.56 343.310.1004 341.61 60.64 329.77 3.55 331.550.2000 339.79 47.44 330.11 13.17 331.77 338.530.2999 337.49 33.07 330.31 25.27 332.00 334.830.4001 333.90 6.40 330.46 49.21 332.190.4997 330.76 46.79 328.47 5.770.5998 330.38 40.63 328.74 14.340.6996 329.06 54.270.7991 329.86 18.79 328.90 33.310.8815 333.64 38.39 329.01 13.40 332.121.0000 335.44 55.85
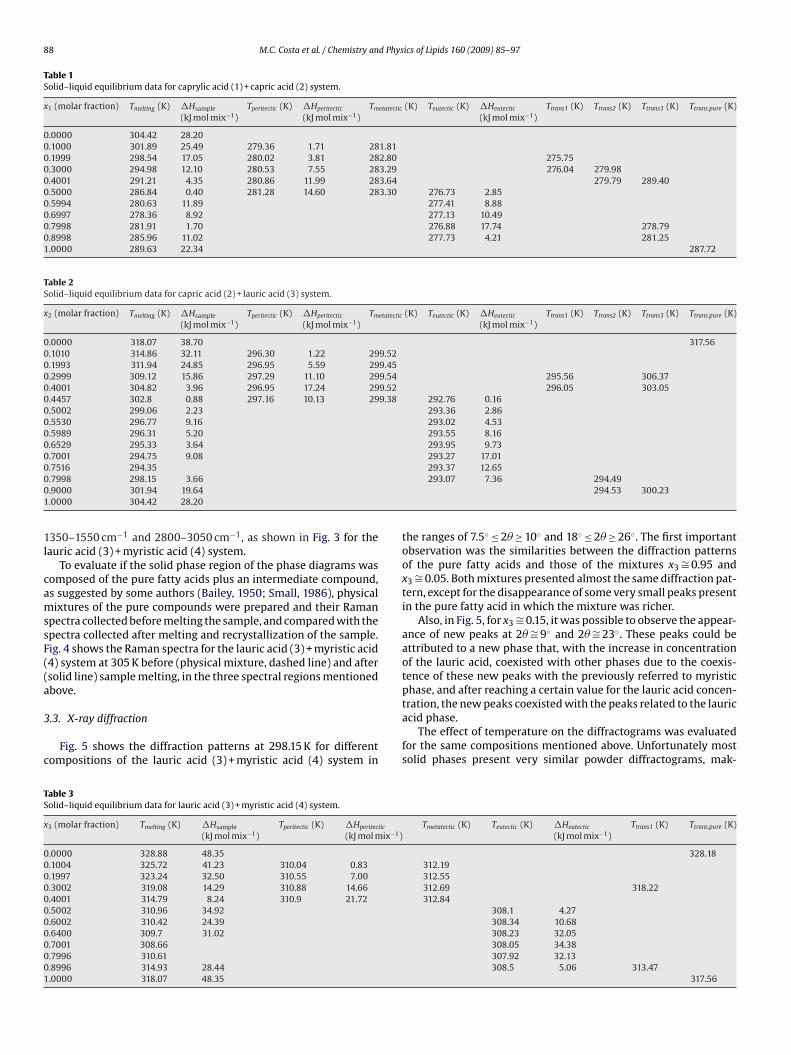
Fig. 3. Temperature dependence of the FT–Raman spectra for lauric acid (3) + myristic acid (4) system at x3 ∼= 0.30: (a) range 100–300 cm−1; (b) range 1350–1550 cm−1; (c)range 2800–3000 cm−1.
90 M.C. Costa et al. / Chemistry and Physics of Lipids 160 (2009) 85–97
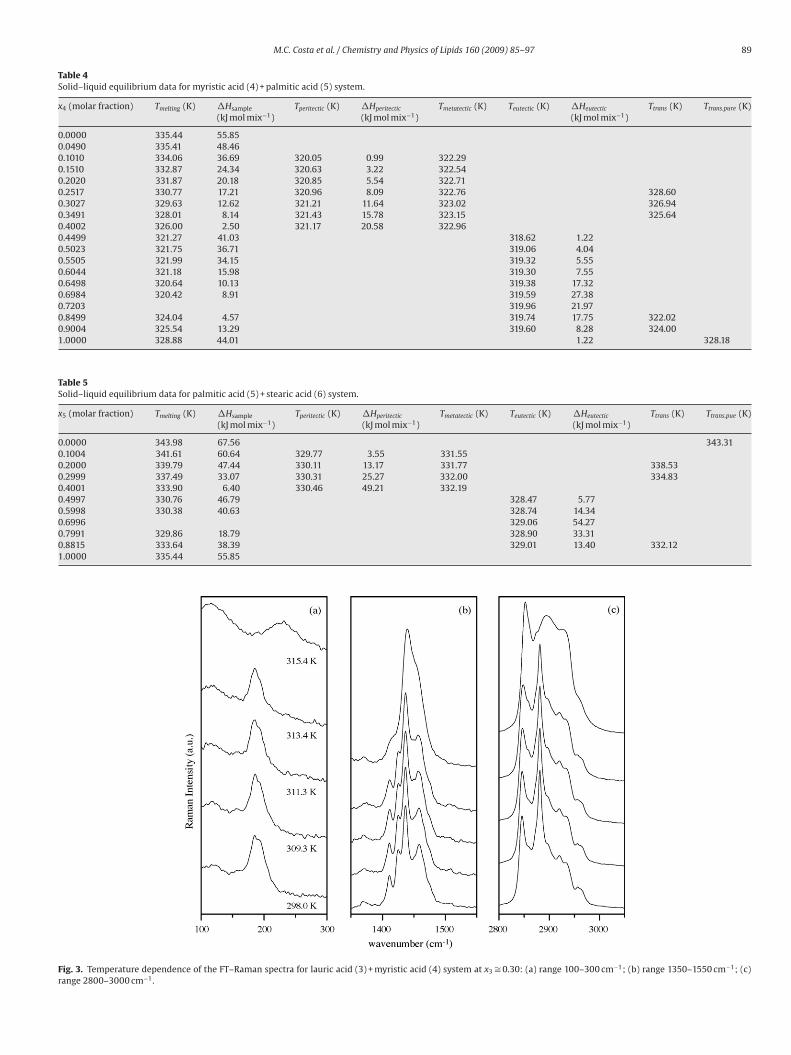
F dashec
isawsxtwpta
Fx
ig. 4. FT–Raman spectra for lauric acid (3) + myristic acid (4) system at 305 K. Theompositions for figures b and c are the same presented in figure a.
ng it very hard to distinguish between them and to observe theolid–solid transitions present in the phase diagram. Fig. 6 showsn example of the similarities between different phases for x3 ∼= 0.95ith an increase in temperature. With this composition just a small
hift of the peak at 2� ∼= 23◦ was observed. On the other hand, for3 ∼= 0.40, as presented in Fig. 7, the changes in the diffraction pat-
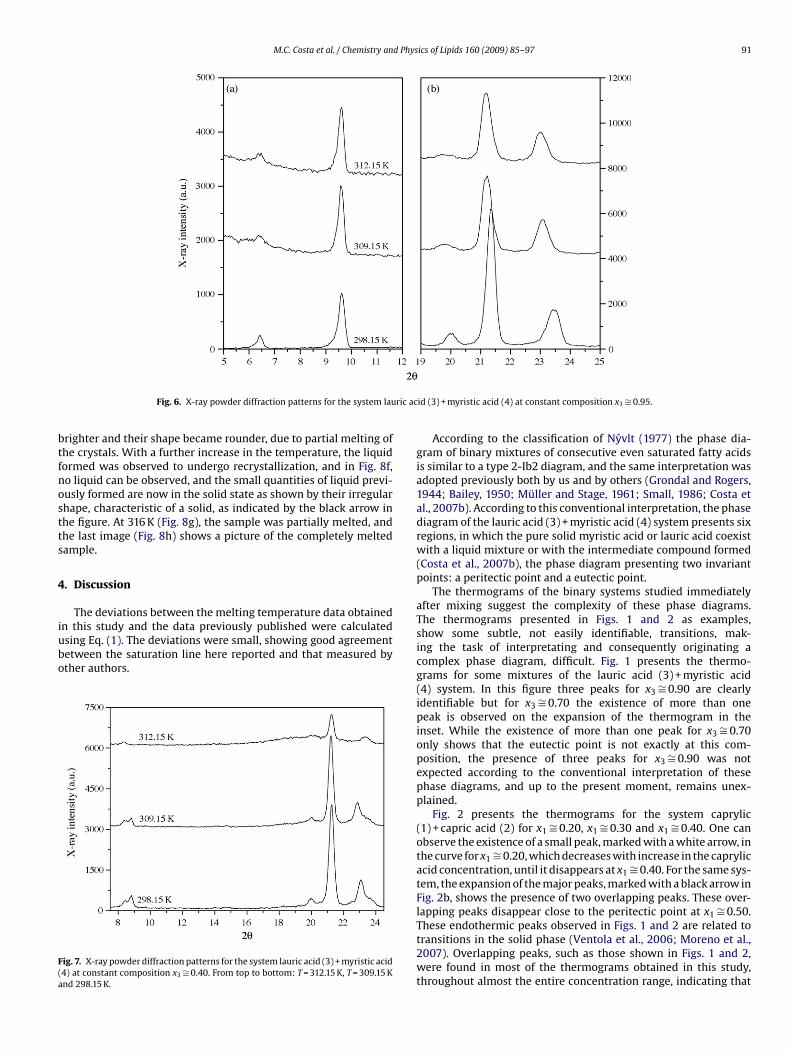
ern are very clear. In this case the diffraction patterns showed thatith an increase in temperature from 309.15 K to 312.15 K, someeaks disappeared and the broadening of the remaining peaks andhe form of the baseline denounced the presence of a liquid phaset 312.15 K.
ig. 5. X-ray powder diffraction patterns for the system lauric acid (3) + myristic acid (4) a3 ∼= 0.40, x3 ∼= 0.25, x3 ∼= 0.15, x3 ∼= 0.05 and x3 ∼= 0.00; (a) range 7◦ ≤ 2� ≥ 10◦; (b) range 18◦
d lines represent the spectra before melting and the solid lines after melting. The
3.4. Polarized light microscopy
Temperature scans of a number of mixtures of the samples werecarried out using polarized light microscopy. Fig. 8 presents themicrographs for the system lauric acid (3) + myristic acid (4) atx3 ∼= 0.40, in the temperature range between 309 K and 318 K, while
heating the sample at 0.1 K min−1.Fig. 8a shows the sample still in the completely solid state,where crystals in thin overlapped layers can be seen, presentingan irregular shape. With an increase in the temperature to between312.15 K and 313.55 K (Fig. 8b–d), the objects in the image became
t T = 309.15 K. From top to bottom: x3 = 1.00, x3 ∼= 0.95, x3 ∼= 0.80, x3 ∼= 0.60, x3 ∼= 0.50,≤ 2� ≥ 26◦ .
M.C. Costa et al. / Chemistry and Physics of Lipids 160 (2009) 85–97 91
ric ac
btfnostts
4
iubo
F(a
Fig. 6. X-ray powder diffraction patterns for the system lau
righter and their shape became rounder, due to partial melting ofhe crystals. With a further increase in the temperature, the liquidormed was observed to undergo recrystallization, and in Fig. 8f,o liquid can be observed, and the small quantities of liquid previ-usly formed are now in the solid state as shown by their irregularhape, characteristic of a solid, as indicated by the black arrow inhe figure. At 316 K (Fig. 8g), the sample was partially melted, andhe last image (Fig. 8h) shows a picture of the completely meltedample.
. Discussion
The deviations between the melting temperature data obtained
n this study and the data previously published were calculatedsing Eq. (1). The deviations were small, showing good agreementetween the saturation line here reported and that measured byther authors.ig. 7. X-ray powder diffraction patterns for the system lauric acid (3) + myristic acid4) at constant composition x3 ∼= 0.40. From top to bottom: T = 312.15 K, T = 309.15 Knd 298.15 K.
id (3) + myristic acid (4) at constant composition x3 ∼= 0.95.
According to the classification of Nyvlt (1977) the phase dia-gram of binary mixtures of consecutive even saturated fatty acidsis similar to a type 2-Ib2 diagram, and the same interpretation wasadopted previously both by us and by others (Grondal and Rogers,1944; Bailey, 1950; Müller and Stage, 1961; Small, 1986; Costa etal., 2007b). According to this conventional interpretation, the phasediagram of the lauric acid (3) + myristic acid (4) system presents sixregions, in which the pure solid myristic acid or lauric acid coexistwith a liquid mixture or with the intermediate compound formed(Costa et al., 2007b), the phase diagram presenting two invariantpoints: a peritectic point and a eutectic point.
The thermograms of the binary systems studied immediatelyafter mixing suggest the complexity of these phase diagrams.The thermograms presented in Figs. 1 and 2 as examples,show some subtle, not easily identifiable, transitions, mak-ing the task of interpretating and consequently originating acomplex phase diagram, difficult. Fig. 1 presents the thermo-grams for some mixtures of the lauric acid (3) + myristic acid(4) system. In this figure three peaks for x3 ∼= 0.90 are clearlyidentifiable but for x3 ∼= 0.70 the existence of more than onepeak is observed on the expansion of the thermogram in theinset. While the existence of more than one peak for x3 ∼= 0.70only shows that the eutectic point is not exactly at this com-position, the presence of three peaks for x3 ∼= 0.90 was notexpected according to the conventional interpretation of thesephase diagrams, and up to the present moment, remains unex-plained.
Fig. 2 presents the thermograms for the system caprylic(1) + capric acid (2) for x1 ∼= 0.20, x1 ∼= 0.30 and x1 ∼= 0.40. One canobserve the existence of a small peak, marked with a white arrow, inthe curve for x1 ∼= 0.20, which decreases with increase in the caprylicacid concentration, until it disappears at x1 ∼= 0.40. For the same sys-tem, the expansion of the major peaks, marked with a black arrow inFig. 2b, shows the presence of two overlapping peaks. These over-lapping peaks disappear close to the peritectic point at x1 ∼= 0.50.
These endothermic peaks observed in Figs. 1 and 2 are related totransitions in the solid phase (Ventola et al., 2006; Moreno et al.,2007). Overlapping peaks, such as those shown in Figs. 1 and 2,were found in most of the thermograms obtained in this study,throughout almost the entire concentration range, indicating that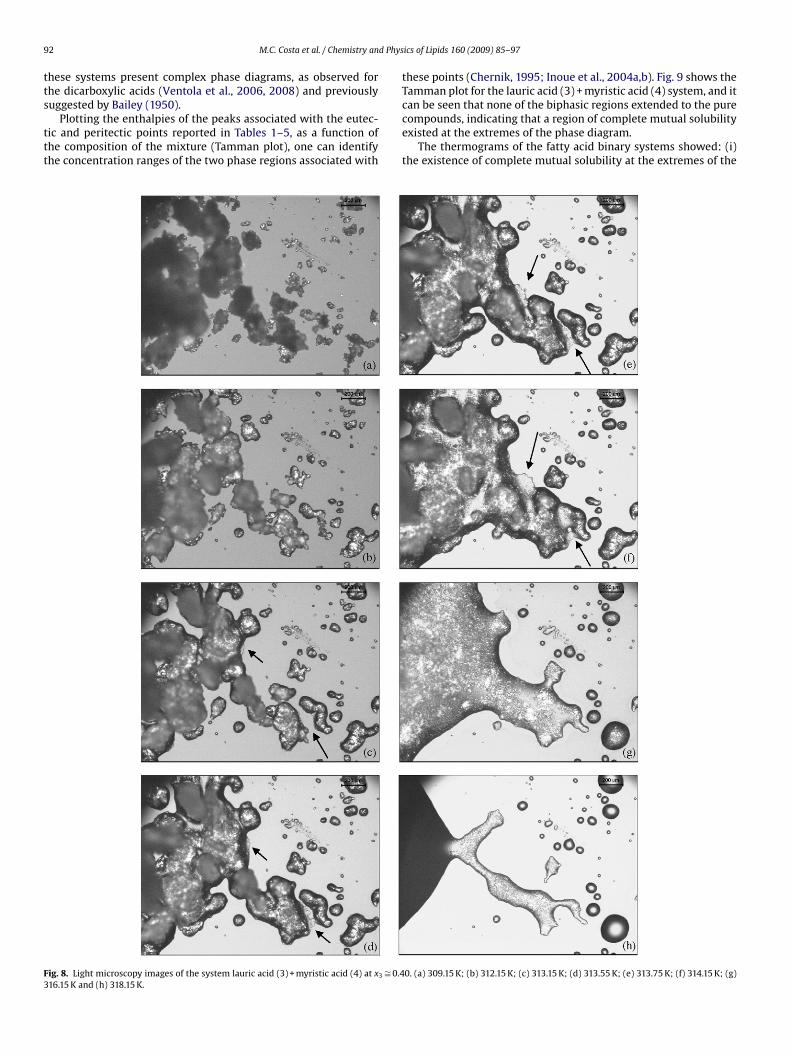
9 d Phys
tts
ttt
F3
2 M.C. Costa et al. / Chemistry an
hese systems present complex phase diagrams, as observed forhe dicarboxylic acids (Ventola et al., 2006, 2008) and previously
uggested by Bailey (1950).Plotting the enthalpies of the peaks associated with the eutec-ic and peritectic points reported in Tables 1–5, as a function ofhe composition of the mixture (Tamman plot), one can identifyhe concentration ranges of the two phase regions associated with
ig. 8. Light microscopy images of the system lauric acid (3) + myristic acid (4) at x3 ∼= 0.416.15 K and (h) 318.15 K.
ics of Lipids 160 (2009) 85–97
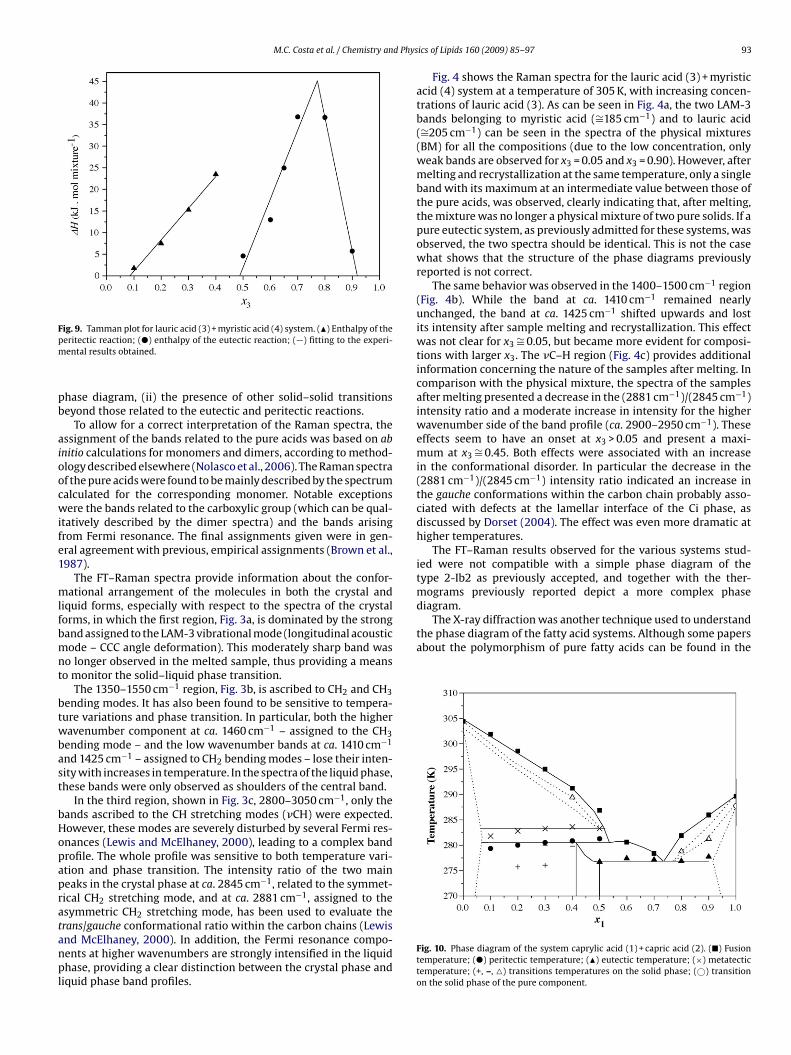
these points (Chernik, 1995; Inoue et al., 2004a,b). Fig. 9 shows theTamman plot for the lauric acid (3) + myristic acid (4) system, and it
can be seen that none of the biphasic regions extended to the purecompounds, indicating that a region of complete mutual solubilityexisted at the extremes of the phase diagram.The thermograms of the fatty acid binary systems showed: (i)the existence of complete mutual solubility at the extremes of the
0. (a) 309.15 K; (b) 312.15 K; (c) 313.15 K; (d) 313.55 K; (e) 313.75 K; (f) 314.15 K; (g)
M.C. Costa et al. / Chemistry and Phys
Fpm
pb
aioocwife1
mlfbmnt
btwbast
bHopapratanpl
diagram.The X-ray diffraction was another technique used to understand
the phase diagram of the fatty acid systems. Although some papersabout the polymorphism of pure fatty acids can be found in the
ig. 9. Tamman plot for lauric acid (3) + myristic acid (4) system. (�) Enthalpy of theeritectic reaction; (�) enthalpy of the eutectic reaction; (—) fitting to the experi-ental results obtained.
hase diagram, (ii) the presence of other solid–solid transitionseyond those related to the eutectic and peritectic reactions.
To allow for a correct interpretation of the Raman spectra, thessignment of the bands related to the pure acids was based on abnitio calculations for monomers and dimers, according to method-logy described elsewhere (Nolasco et al., 2006). The Raman spectraf the pure acids were found to be mainly described by the spectrumalculated for the corresponding monomer. Notable exceptionsere the bands related to the carboxylic group (which can be qual-
tatively described by the dimer spectra) and the bands arisingrom Fermi resonance. The final assignments given were in gen-ral agreement with previous, empirical assignments (Brown et al.,987).
The FT–Raman spectra provide information about the confor-ational arrangement of the molecules in both the crystal and
iquid forms, especially with respect to the spectra of the crystalorms, in which the first region, Fig. 3a, is dominated by the strongand assigned to the LAM-3 vibrational mode (longitudinal acousticode – CCC angle deformation). This moderately sharp band was
o longer observed in the melted sample, thus providing a meanso monitor the solid–liquid phase transition.
The 1350–1550 cm−1 region, Fig. 3b, is ascribed to CH2 and CH3ending modes. It has also been found to be sensitive to tempera-ure variations and phase transition. In particular, both the higheravenumber component at ca. 1460 cm−1 – assigned to the CH3ending mode – and the low wavenumber bands at ca. 1410 cm−1
nd 1425 cm−1 – assigned to CH2 bending modes – lose their inten-ity with increases in temperature. In the spectra of the liquid phase,hese bands were only observed as shoulders of the central band.
In the third region, shown in Fig. 3c, 2800–3050 cm−1, only theands ascribed to the CH stretching modes (�CH) were expected.owever, these modes are severely disturbed by several Fermi res-nances (Lewis and McElhaney, 2000), leading to a complex bandrofile. The whole profile was sensitive to both temperature vari-tion and phase transition. The intensity ratio of the two maineaks in the crystal phase at ca. 2845 cm−1, related to the symmet-ical CH2 stretching mode, and at ca. 2881 cm−1, assigned to thesymmetric CH2 stretching mode, has been used to evaluate therans/gauche conformational ratio within the carbon chains (Lewis
nd McElhaney, 2000). In addition, the Fermi resonance compo-ents at higher wavenumbers are strongly intensified in the liquidhase, providing a clear distinction between the crystal phase andiquid phase band profiles.
ics of Lipids 160 (2009) 85–97 93
Fig. 4 shows the Raman spectra for the lauric acid (3) + myristicacid (4) system at a temperature of 305 K, with increasing concen-trations of lauric acid (3). As can be seen in Fig. 4a, the two LAM-3bands belonging to myristic acid (∼=185 cm−1) and to lauric acid(∼=205 cm−1) can be seen in the spectra of the physical mixtures(BM) for all the compositions (due to the low concentration, onlyweak bands are observed for x3 = 0.05 and x3 = 0.90). However, aftermelting and recrystallization at the same temperature, only a singleband with its maximum at an intermediate value between those ofthe pure acids, was observed, clearly indicating that, after melting,the mixture was no longer a physical mixture of two pure solids. If apure eutectic system, as previously admitted for these systems, wasobserved, the two spectra should be identical. This is not the casewhat shows that the structure of the phase diagrams previouslyreported is not correct.
The same behavior was observed in the 1400–1500 cm−1 region(Fig. 4b). While the band at ca. 1410 cm−1 remained nearlyunchanged, the band at ca. 1425 cm−1 shifted upwards and lostits intensity after sample melting and recrystallization. This effectwas not clear for x3 ∼= 0.05, but became more evident for composi-tions with larger x3. The �C–H region (Fig. 4c) provides additionalinformation concerning the nature of the samples after melting. Incomparison with the physical mixture, the spectra of the samplesafter melting presented a decrease in the (2881 cm−1)/(2845 cm−1)intensity ratio and a moderate increase in intensity for the higherwavenumber side of the band profile (ca. 2900–2950 cm−1). Theseeffects seem to have an onset at x3 > 0.05 and present a maxi-mum at x3 ∼= 0.45. Both effects were associated with an increasein the conformational disorder. In particular the decrease in the(2881 cm−1)/(2845 cm−1) intensity ratio indicated an increase inthe gauche conformations within the carbon chain probably asso-ciated with defects at the lamellar interface of the Ci phase, asdiscussed by Dorset (2004). The effect was even more dramatic athigher temperatures.
The FT–Raman results observed for the various systems stud-ied were not compatible with a simple phase diagram of thetype 2-Ib2 as previously accepted, and together with the ther-mograms previously reported depict a more complex phase
Fig. 10. Phase diagram of the system caprylic acid (1) + capric acid (2). (�) Fusiontemperature; (�) peritectic temperature; (�) eutectic temperature; (×) metatectictemperature; (+, –, �) transitions temperatures on the solid phase; (©) transitionon the solid phase of the pure component.
94 M.C. Costa et al. / Chemistry and Physics of Lipids 160 (2009) 85–97
F scopyp , �) trp
l1alttppe
xmowass
icocrtbaclratt
iraCr
C; (ii) one monophasic region, Ci, at about 0.40 ≤ xa ≤ 0.50;(iii) two solid–solid regions separated by the Ci region; (iv)a solid–liquid equilibrium region, C + l, delimited by the peri-tectic temperature, eutectic temperature and the monophasicregion.
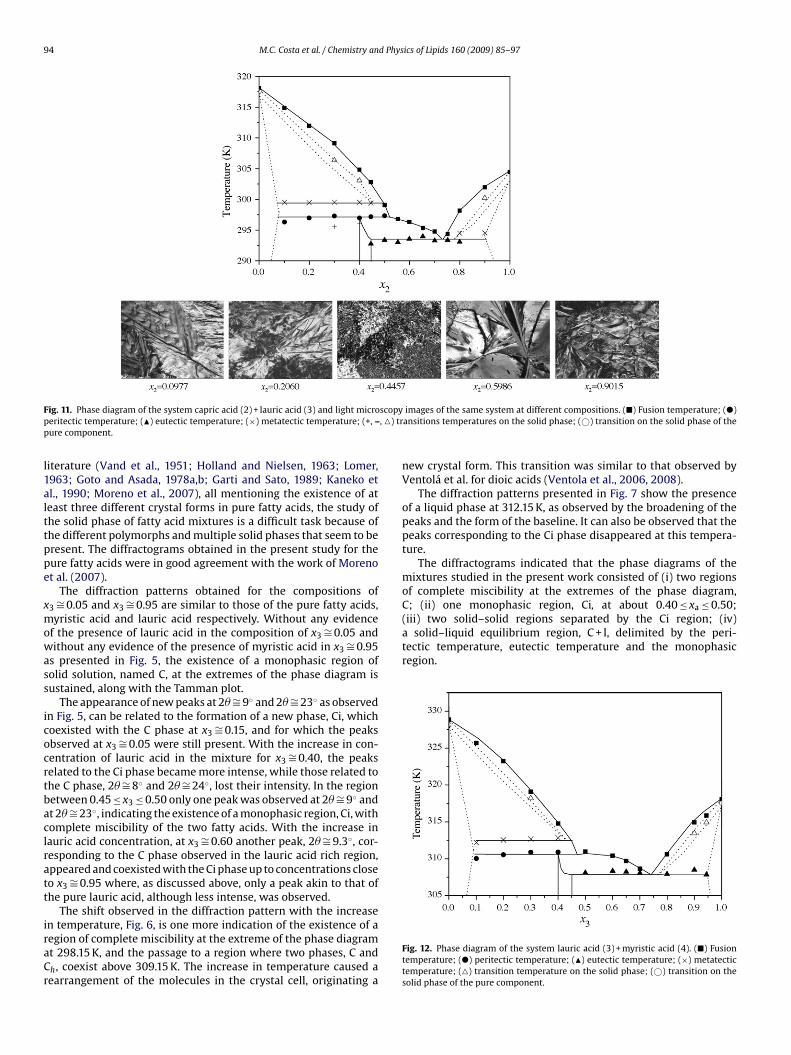
ig. 11. Phase diagram of the system capric acid (2) + lauric acid (3) and light microeritectic temperature; (�) eutectic temperature; (×) metatectic temperature; (+, –ure component.
iterature (Vand et al., 1951; Holland and Nielsen, 1963; Lomer,963; Goto and Asada, 1978a,b; Garti and Sato, 1989; Kaneko etl., 1990; Moreno et al., 2007), all mentioning the existence of ateast three different crystal forms in pure fatty acids, the study ofhe solid phase of fatty acid mixtures is a difficult task because ofhe different polymorphs and multiple solid phases that seem to beresent. The diffractograms obtained in the present study for theure fatty acids were in good agreement with the work of Morenot al. (2007).
The diffraction patterns obtained for the compositions of3 ∼= 0.05 and x3 ∼= 0.95 are similar to those of the pure fatty acids,yristic acid and lauric acid respectively. Without any evidence
f the presence of lauric acid in the composition of x3 ∼= 0.05 andithout any evidence of the presence of myristic acid in x3 ∼= 0.95
s presented in Fig. 5, the existence of a monophasic region ofolid solution, named C, at the extremes of the phase diagram isustained, along with the Tamman plot.
The appearance of new peaks at 2� ∼= 9◦ and 2� ∼= 23◦ as observedn Fig. 5, can be related to the formation of a new phase, Ci, whichoexisted with the C phase at x3 ∼= 0.15, and for which the peaksbserved at x3 ∼= 0.05 were still present. With the increase in con-entration of lauric acid in the mixture for x3 ∼= 0.40, the peakselated to the Ci phase became more intense, while those related tohe C phase, 2� ∼= 8◦ and 2� ∼= 24◦, lost their intensity. In the regionetween 0.45 ≤ x3 ≤ 0.50 only one peak was observed at 2� ∼= 9◦ andt 2� ∼= 23◦, indicating the existence of a monophasic region, Ci, withomplete miscibility of the two fatty acids. With the increase inauric acid concentration, at x3 ∼= 0.60 another peak, 2� ∼= 9.3◦, cor-esponding to the C phase observed in the lauric acid rich region,ppeared and coexisted with the Ci phase up to concentrations closeo x3 ∼= 0.95 where, as discussed above, only a peak akin to that ofhe pure lauric acid, although less intense, was observed.
The shift observed in the diffraction pattern with the increase
n temperature, Fig. 6, is one more indication of the existence of aegion of complete miscibility at the extreme of the phase diagramt 298.15 K, and the passage to a region where two phases, C andh, coexist above 309.15 K. The increase in temperature caused aearrangement of the molecules in the crystal cell, originating aimages of the same system at different compositions. (�) Fusion temperature; (�)ansitions temperatures on the solid phase; (©) transition on the solid phase of the
new crystal form. This transition was similar to that observed byVentolá et al. for dioic acids (Ventola et al., 2006, 2008).
The diffraction patterns presented in Fig. 7 show the presenceof a liquid phase at 312.15 K, as observed by the broadening of thepeaks and the form of the baseline. It can also be observed that thepeaks corresponding to the Ci phase disappeared at this tempera-ture.
The diffractograms indicated that the phase diagrams of themixtures studied in the present work consisted of (i) two regionsof complete miscibility at the extremes of the phase diagram,
Fig. 12. Phase diagram of the system lauric acid (3) + myristic acid (4). (�) Fusiontemperature; (�) peritectic temperature; (�) eutectic temperature; (×) metatectictemperature; (�) transition temperature on the solid phase; (©) transition on thesolid phase of the pure component.
M.C. Costa et al. / Chemistry and Physics of Lipids 160 (2009) 85–97 95
F icrosc( ) tranc
atTitootspdl
rct
itpCaahw
•
•
reported by Ventola et al. (2006), and are in good agreement withtwo recent works on the phase diagrams of binary mixtures of fattyacids that appeared during the revision process for this manuscript(Gbabode et al., 2008; Costa et al., 2009).
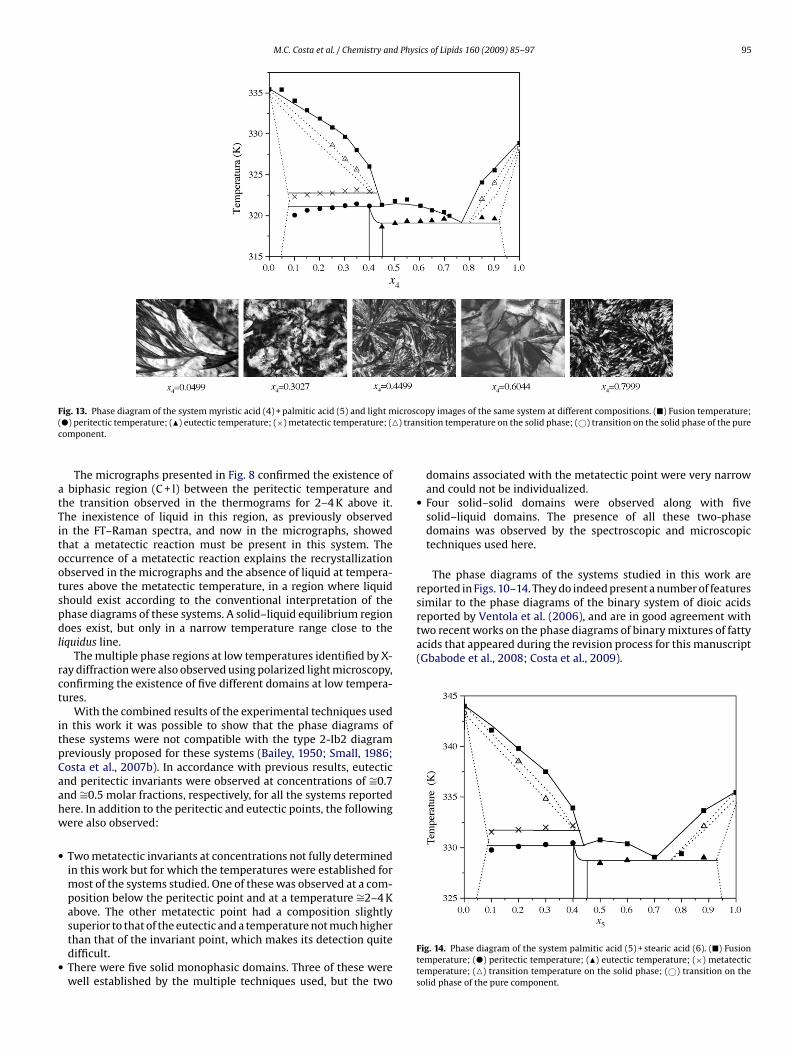
ig. 13. Phase diagram of the system myristic acid (4) + palmitic acid (5) and light m�) peritectic temperature; (�) eutectic temperature; (×) metatectic temperature; (�omponent.
The micrographs presented in Fig. 8 confirmed the existence ofbiphasic region (C + l) between the peritectic temperature and
he transition observed in the thermograms for 2–4 K above it.he inexistence of liquid in this region, as previously observed
n the FT–Raman spectra, and now in the micrographs, showedhat a metatectic reaction must be present in this system. Theccurrence of a metatectic reaction explains the recrystallizationbserved in the micrographs and the absence of liquid at tempera-ures above the metatectic temperature, in a region where liquidhould exist according to the conventional interpretation of thehase diagrams of these systems. A solid–liquid equilibrium regionoes exist, but only in a narrow temperature range close to the
iquidus line.The multiple phase regions at low temperatures identified by X-
ay diffraction were also observed using polarized light microscopy,onfirming the existence of five different domains at low tempera-ures.
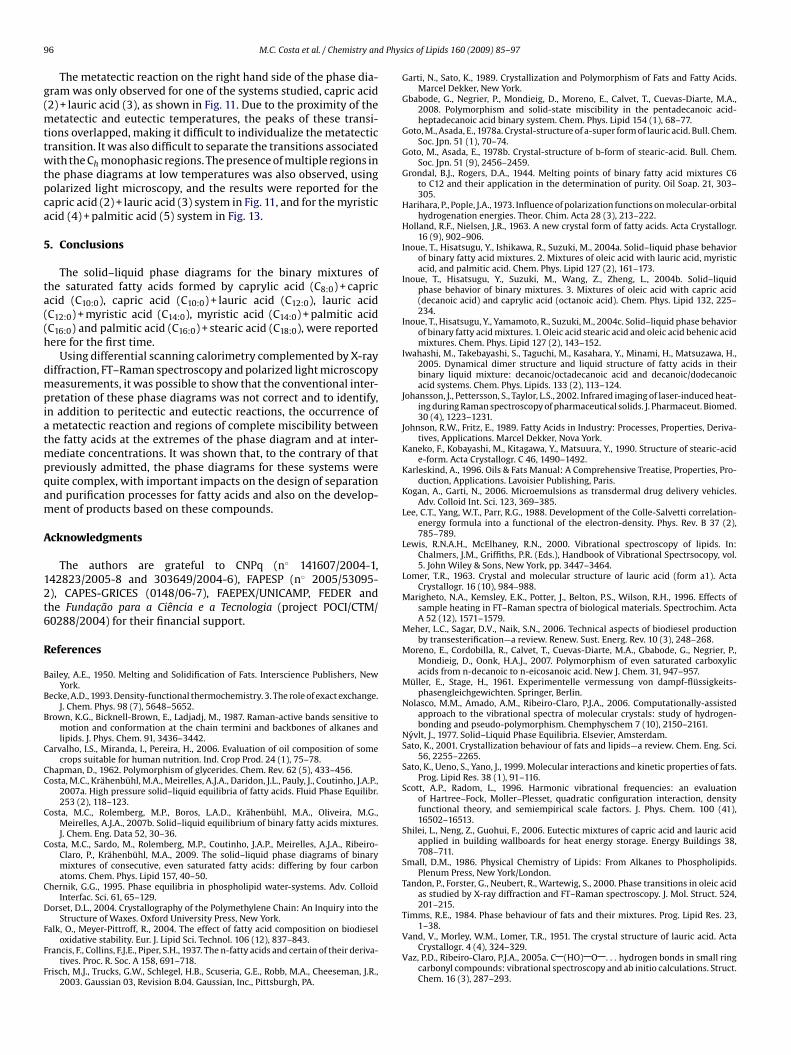
With the combined results of the experimental techniques usedn this work it was possible to show that the phase diagrams ofhese systems were not compatible with the type 2-Ib2 diagramreviously proposed for these systems (Bailey, 1950; Small, 1986;osta et al., 2007b). In accordance with previous results, eutecticnd peritectic invariants were observed at concentrations of ∼=0.7nd ∼=0.5 molar fractions, respectively, for all the systems reportedere. In addition to the peritectic and eutectic points, the followingere also observed:
Two metatectic invariants at concentrations not fully determinedin this work but for which the temperatures were established formost of the systems studied. One of these was observed at a com-position below the peritectic point and at a temperature ∼=2–4 Kabove. The other metatectic point had a composition slightly
superior to that of the eutectic and a temperature not much higherthan that of the invariant point, which makes its detection quitedifficult.There were five solid monophasic domains. Three of these werewell established by the multiple techniques used, but the twoopy images of the same system at different compositions. (�) Fusion temperature;sition temperature on the solid phase; (©) transition on the solid phase of the pure
domains associated with the metatectic point were very narrowand could not be individualized.
• Four solid–solid domains were observed along with fivesolid–liquid domains. The presence of all these two-phasedomains was observed by the spectroscopic and microscopictechniques used here.
The phase diagrams of the systems studied in this work arereported in Figs. 10–14. They do indeed present a number of featuressimilar to the phase diagrams of the binary system of dioic acids
Fig. 14. Phase diagram of the system palmitic acid (5) + stearic acid (6). (�) Fusiontemperature; (�) peritectic temperature; (�) eutectic temperature; (×) metatectictemperature; (�) transition temperature on the solid phase; (©) transition on thesolid phase of the pure component.
9 d Phys
g(mttwtpca
5
ta((h
dmpiatmpqam
A
12t6
R
B
B
B
C
CC
C
C
C
D
F
F
F
6 M.C. Costa et al. / Chemistry an
The metatectic reaction on the right hand side of the phase dia-ram was only observed for one of the systems studied, capric acid2) + lauric acid (3), as shown in Fig. 11. Due to the proximity of the
etatectic and eutectic temperatures, the peaks of these transi-ions overlapped, making it difficult to individualize the metatecticransition. It was also difficult to separate the transitions associatedith the Ch monophasic regions. The presence of multiple regions in
he phase diagrams at low temperatures was also observed, usingolarized light microscopy, and the results were reported for theapric acid (2) + lauric acid (3) system in Fig. 11, and for the myristiccid (4) + palmitic acid (5) system in Fig. 13.
. Conclusions
The solid–liquid phase diagrams for the binary mixtures ofhe saturated fatty acids formed by caprylic acid (C8:0) + capriccid (C10:0), capric acid (C10:0) + lauric acid (C12:0), lauric acidC12:0) + myristic acid (C14:0), myristic acid (C14:0) + palmitic acidC16:0) and palmitic acid (C16:0) + stearic acid (C18:0), were reportedere for the first time.
Using differential scanning calorimetry complemented by X-rayiffraction, FT–Raman spectroscopy and polarized light microscopyeasurements, it was possible to show that the conventional inter-
retation of these phase diagrams was not correct and to identify,n addition to peritectic and eutectic reactions, the occurrence ofmetatectic reaction and regions of complete miscibility between
he fatty acids at the extremes of the phase diagram and at inter-ediate concentrations. It was shown that, to the contrary of that
reviously admitted, the phase diagrams for these systems wereuite complex, with important impacts on the design of separationnd purification processes for fatty acids and also on the develop-ent of products based on these compounds.
cknowledgments
The authors are grateful to CNPq (n◦ 141607/2004-1,42823/2005-8 and 303649/2004-6), FAPESP (n◦ 2005/53095-), CAPES-GRICES (0148/06-7), FAEPEX/UNICAMP, FEDER andhe Fundacão para a Ciência e a Tecnologia (project POCI/CTM/0288/2004) for their financial support.
eferences
ailey, A.E., 1950. Melting and Solidification of Fats. Interscience Publishers, NewYork.
ecke, A.D., 1993. Density-functional thermochemistry. 3. The role of exact exchange.J. Chem. Phys. 98 (7), 5648–5652.
rown, K.G., Bicknell-Brown, E., Ladjadj, M., 1987. Raman-active bands sensitive tomotion and conformation at the chain termini and backbones of alkanes andlipids. J. Phys. Chem. 91, 3436–3442.
arvalho, I.S., Miranda, I., Pereira, H., 2006. Evaluation of oil composition of somecrops suitable for human nutrition. Ind. Crop Prod. 24 (1), 75–78.
hapman, D., 1962. Polymorphism of glycerides. Chem. Rev. 62 (5), 433–456.osta, M.C., Krähenbühl, M.A., Meirelles, A.J.A., Daridon, J.L., Pauly, J., Coutinho, J.A.P.,
2007a. High pressure solid–liquid equilibria of fatty acids. Fluid Phase Equilibr.253 (2), 118–123.
osta, M.C., Rolemberg, M.P., Boros, L.A.D., Krähenbühl, M.A., Oliveira, M.G.,Meirelles, A.J.A., 2007b. Solid–liquid equilibrium of binary fatty acids mixtures.J. Chem. Eng. Data 52, 30–36.
osta, M.C., Sardo, M., Rolemberg, M.P., Coutinho, J.A.P., Meirelles, A.J.A., Ribeiro-Claro, P., Krähenbühl, M.A., 2009. The solid–liquid phase diagrams of binarymixtures of consecutive, even saturated fatty acids: differing by four carbonatoms. Chem. Phys. Lipid 157, 40–50.
hernik, G.G., 1995. Phase equilibria in phospholipid water-systems. Adv. ColloidInterfac. Sci. 61, 65–129.
orset, D.L., 2004. Crystallography of the Polymethylene Chain: An Inquiry into theStructure of Waxes. Oxford University Press, New York.
alk, O., Meyer-Pittroff, R., 2004. The effect of fatty acid composition on biodieseloxidative stability. Eur. J. Lipid Sci. Technol. 106 (12), 837–843.
rancis, F., Collins, F.J.E., Piper, S.H., 1937. The n-fatty acids and certain of their deriva-tives. Proc. R. Soc. A 158, 691–718.
risch, M.J., Trucks, G.W., Schlegel, H.B., Scuseria, G.E., Robb, M.A., Cheeseman, J.R.,2003. Gaussian 03, Revision B.04. Gaussian, Inc., Pittsburgh, PA.
ics of Lipids 160 (2009) 85–97
Garti, N., Sato, K., 1989. Crystallization and Polymorphism of Fats and Fatty Acids.Marcel Dekker, New York.
Gbabode, G., Negrier, P., Mondieig, D., Moreno, E., Calvet, T., Cuevas-Diarte, M.A.,2008. Polymorphism and solid-state miscibility in the pentadecanoic acid-heptadecanoic acid binary system. Chem. Phys. Lipid 154 (1), 68–77.
Goto, M., Asada, E., 1978a. Crystal-structure of a-super form of lauric acid. Bull. Chem.Soc. Jpn. 51 (1), 70–74.
Goto, M., Asada, E., 1978b. Crystal-structure of b-form of stearic-acid. Bull. Chem.Soc. Jpn. 51 (9), 2456–2459.
Grondal, B.J., Rogers, D.A., 1944. Melting points of binary fatty acid mixtures C6to C12 and their application in the determination of purity. Oil Soap. 21, 303–305.
Harihara, P., Pople, J.A., 1973. Influence of polarization functions on molecular-orbitalhydrogenation energies. Theor. Chim. Acta 28 (3), 213–222.
Holland, R.F., Nielsen, J.R., 1963. A new crystal form of fatty acids. Acta Crystallogr.16 (9), 902–906.
Inoue, T., Hisatsugu, Y., Ishikawa, R., Suzuki, M., 2004a. Solid–liquid phase behaviorof binary fatty acid mixtures. 2. Mixtures of oleic acid with lauric acid, myristicacid, and palmitic acid. Chem. Phys. Lipid 127 (2), 161–173.
Inoue, T., Hisatsugu, Y., Suzuki, M., Wang, Z., Zheng, L., 2004b. Solid–liquidphase behavior of binary mixtures. 3. Mixtures of oleic acid with capric acid(decanoic acid) and caprylic acid (octanoic acid). Chem. Phys. Lipid 132, 225–234.
Inoue, T., Hisatsugu, Y., Yamamoto, R., Suzuki, M., 2004c. Solid–liquid phase behaviorof binary fatty acid mixtures. 1. Oleic acid stearic acid and oleic acid behenic acidmixtures. Chem. Phys. Lipid 127 (2), 143–152.
Iwahashi, M., Takebayashi, S., Taguchi, M., Kasahara, Y., Minami, H., Matsuzawa, H.,2005. Dynamical dimer structure and liquid structure of fatty acids in theirbinary liquid mixture: decanoic/octadecanoic acid and decanoic/dodecanoicacid systems. Chem. Phys. Lipids. 133 (2), 113–124.
Johansson, J., Pettersson, S., Taylor, L.S., 2002. Infrared imaging of laser-induced heat-ing during Raman spectroscopy of pharmaceutical solids. J. Pharmaceut. Biomed.30 (4), 1223–1231.
Johnson, R.W., Fritz, E., 1989. Fatty Acids in Industry: Processes, Properties, Deriva-tives, Applications. Marcel Dekker, Nova York.
Kaneko, F., Kobayashi, M., Kitagawa, Y., Matsuura, Y., 1990. Structure of stearic-acide-form. Acta Crystallogr. C 46, 1490–1492.
Karleskind, A., 1996. Oils & Fats Manual: A Comprehensive Treatise, Properties, Pro-duction, Applications. Lavoisier Publishing, Paris.
Kogan, A., Garti, N., 2006. Microemulsions as transdermal drug delivery vehicles.Adv. Colloid Int. Sci. 123, 369–385.
Lee, C.T., Yang, W.T., Parr, R.G., 1988. Development of the Colle-Salvetti correlation-energy formula into a functional of the electron-density. Phys. Rev. B 37 (2),785–789.
Lewis, R.N.A.H., McElhaney, R.N., 2000. Vibrational spectroscopy of lipids. In:Chalmers, J.M., Griffiths, P.R. (Eds.), Handbook of Vibrational Spectrsocopy, vol.5. John Wiley & Sons, New York, pp. 3447–3464.
Lomer, T.R., 1963. Crystal and molecular structure of lauric acid (form a1). ActaCrystallogr. 16 (10), 984–988.
Marigheto, N.A., Kemsley, E.K., Potter, J., Belton, P.S., Wilson, R.H., 1996. Effects ofsample heating in FT–Raman spectra of biological materials. Spectrochim. ActaA 52 (12), 1571–1579.
Meher, L.C., Sagar, D.V., Naik, S.N., 2006. Technical aspects of biodiesel productionby transesterification—a review. Renew. Sust. Energ. Rev. 10 (3), 248–268.
Moreno, E., Cordobilla, R., Calvet, T., Cuevas-Diarte, M.A., Gbabode, G., Negrier, P.,Mondieig, D., Oonk, H.A.J., 2007. Polymorphism of even saturated carboxylicacids from n-decanoic to n-eicosanoic acid. New J. Chem. 31, 947–957.
Müller, E., Stage, H., 1961. Experimentelle vermessung von dampf-flüssigkeits-phasengleichgewichten. Springer, Berlin.
Nolasco, M.M., Amado, A.M., Ribeiro-Claro, P.J.A., 2006. Computationally-assistedapproach to the vibrational spectra of molecular crystals: study of hydrogen-bonding and pseudo-polymorphism. Chemphyschem 7 (10), 2150–2161.
Nyvlt, J., 1977. Solid–Liquid Phase Equilibria. Elsevier, Amsterdam.Sato, K., 2001. Crystallization behaviour of fats and lipids—a review. Chem. Eng. Sci.
56, 2255–2265.Sato, K., Ueno, S., Yano, J., 1999. Molecular interactions and kinetic properties of fats.
Prog. Lipid Res. 38 (1), 91–116.Scott, A.P., Radom, L., 1996. Harmonic vibrational frequencies: an evaluation
of Hartree–Fock, Moller–Plesset, quadratic configuration interaction, densityfunctional theory, and semiempirical scale factors. J. Phys. Chem. 100 (41),16502–16513.
Shilei, L., Neng, Z., Guohui, F., 2006. Eutectic mixtures of capric acid and lauric acidapplied in building wallboards for heat energy storage. Energy Buildings 38,708–711.
Small, D.M., 1986. Physical Chemistry of Lipids: From Alkanes to Phospholipids.Plenum Press, New York/London.
Tandon, P., Forster, G., Neubert, R., Wartewig, S., 2000. Phase transitions in oleic acidas studied by X-ray diffraction and FT–Raman spectroscopy. J. Mol. Struct. 524,201–215.
Timms, R.E., 1984. Phase behaviour of fats and their mixtures. Prog. Lipid Res. 23,
1–38.Vand, V., Morley, W.M., Lomer, T.R., 1951. The crystal structure of lauric acid. ActaCrystallogr. 4 (4), 324–329.
Vaz, P.D., Ribeiro-Claro, P.J.A., 2005a. C (HO) O . . . hydrogen bonds in small ringcarbonyl compounds: vibrational spectroscopy and ab initio calculations. Struct.Chem. 16 (3), 287–293.
d Phys
V
V
M.C. Costa et al. / Chemistry an
az, P.D., Ribeiro-Claro, P.J.A., 2005b. The role of C–H center dot center dot center dot
O interactions in the solid and liquid-phase structures of methyltrioxo rhenium.Eur. J. Inorg. Chem. (10), 1836–1840.entola, L., Bayes, L., Benages, R., Novegil-Anleo, F.J., Cuevas-Diarte, M.A., Cal-vet, T., Mondieig, D., 2008. Decanedioic acid (C10H18O4)/dodecanedioic acid(C12H22O4) system: polymorphism of the components and experimental phasediagram. Helv. Chim. Acta 91, 1286–1298.
ics of Lipids 160 (2009) 85–97 97
Ventola, L., Metivaud, V., Bayes, L., Benages, R., Cuevas-Diarte, M.A., Calvet, T.,
Mondieig, D., 2006. The binary system tetradecanedioic acid-hexadecanedioicacid: polymorphism of the components and experimental phase diagram. Helv.Chim. Acta 89 (9), 2027–2039.Zhang, J.J., Zhang, J.L., He, S.M., Wu, K.Z., Liu, X.D., 2001. Thermal studies on thesolid–liquid phase transition in binary systems of fatty acids. Thermochim. Acta369 (1–2), 157–160.