Embed Size (px)
Citation preview
General Instructions
• Reading time – 5 minutes
• Working time – 3 hours
• Write using black or blue pen
• Draw diagrams using pencil
• Board-approved calculators maybe used
• A data sheet and a Periodic Tableare provided at the back of thispaper
• Write your Centre Number andStudent Number at the top ofpages 9, 11, 15, 17, 21 and 25
Total marks – 100
Pages 2–27
75 marks
This section has two parts, Part A and Part B
Part A – 15 marks
• Attempt Questions 1–15
• Allow about 30 minutes for this part
Part B – 60 marks
• Attempt Questions 16–28
• Allow about 1 hour and 45 minutes for this part
Pages 29–40
25 marks
• Attempt ONE question from Questions 29–33
• Allow about 45 minutes for this section
Section II
Section I
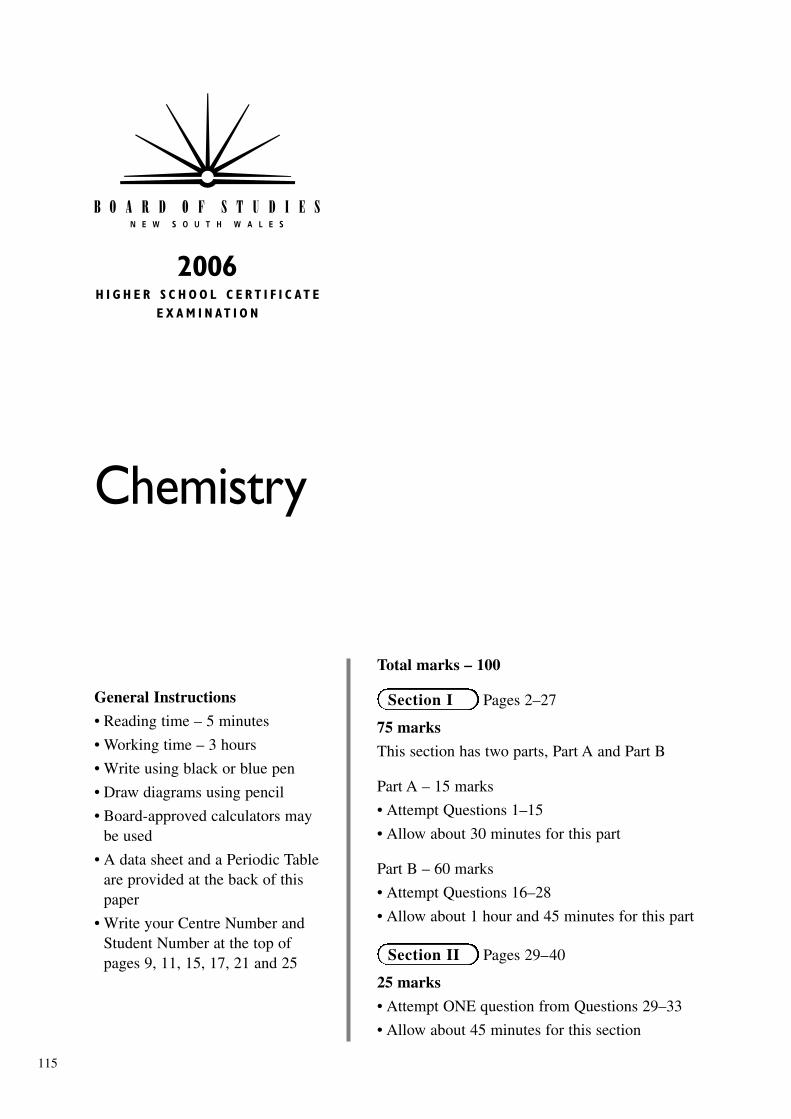
Chemistry
115
2006H I G H E R S C H O O L C E R T I F I C AT E
E X A M I N AT I O N
– 2 –
Section I75 marks
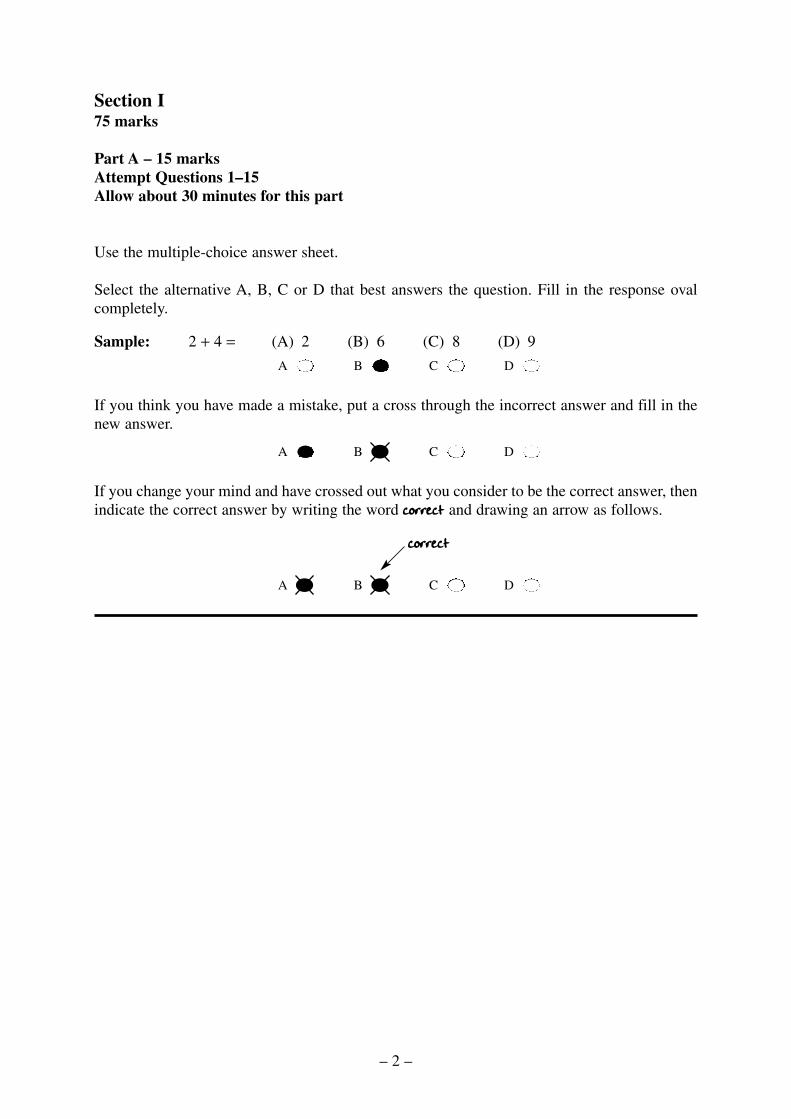
Part A – 15 marksAttempt Questions 1–15Allow about 30 minutes for this part
Use the multiple-choice answer sheet.
Select the alternative A, B, C or D that best answers the question. Fill in the response ovalcompletely.
Sample: 2 + 4 = (A) 2 (B) 6 (C) 8 (D) 9
A B C D
If you think you have made a mistake, put a cross through the incorrect answer and fill in thenew answer.
A B C D
If you change your mind and have crossed out what you consider to be the correct answer, thenindicate the correct answer by writing the word correct and drawing an arrow as follows.
correct
A B C D
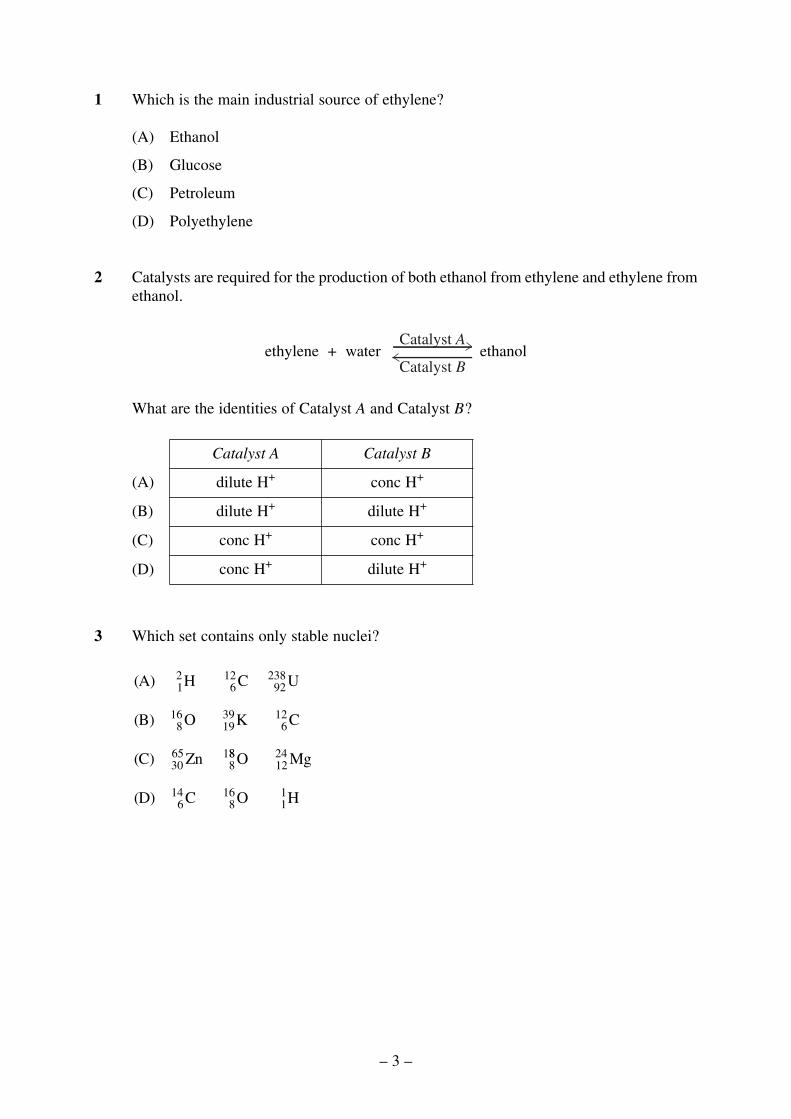
1 Which is the main industrial source of ethylene?
(A) Ethanol
(B) Glucose
(C) Petroleum
(D) Polyethylene
2 Catalysts are required for the production of both ethanol from ethylene and ethylene fromethanol.
ethylene + water ethanol
What are the identities of Catalyst A and Catalyst B?
3 Which set contains only stable nuclei?
(A) H C U
(B) O K C
(C) Zn
12
612
92238
816
1939
612
3065
8188
1224
614
816
11
O Mg
(D) C O H
Catalyst A Catalyst B
dilute H+ conc H+
dilute H+ dilute H+
conc H+ conc H+
conc H+ dilute H+
(A)
(B)
(C)
(D)
Catalyst A
Catalyst B
– 3 –
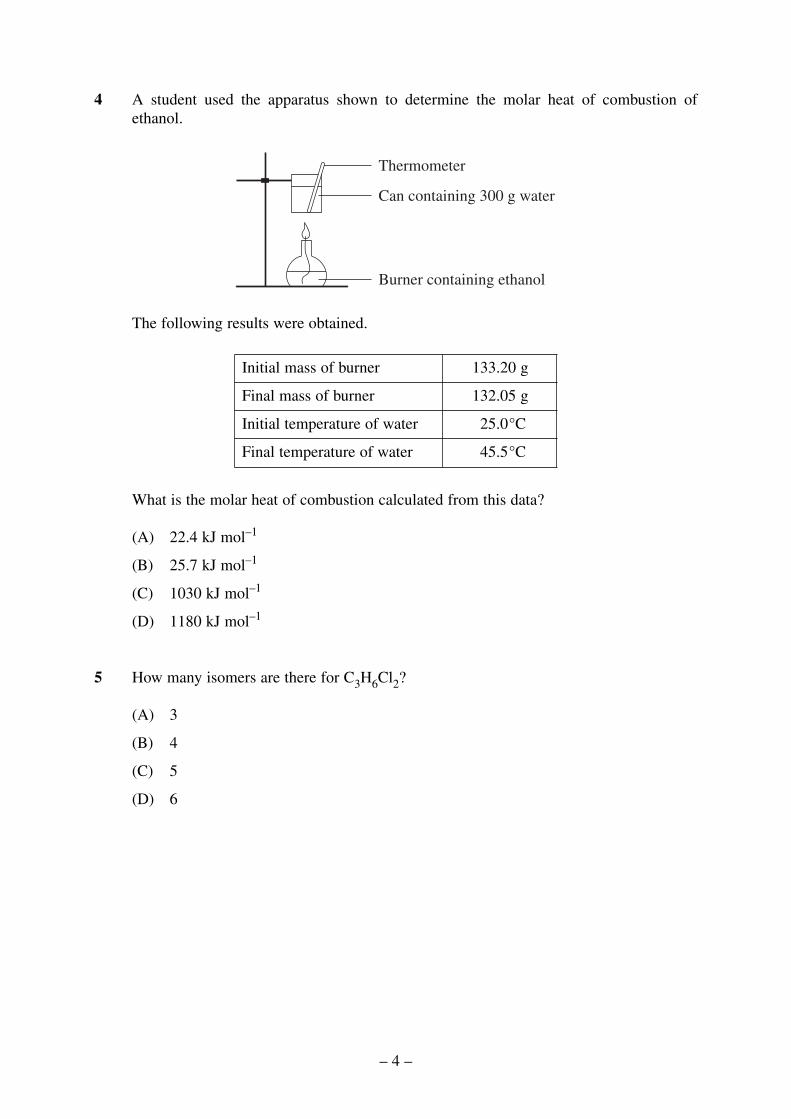
4 A student used the apparatus shown to determine the molar heat of combustion ofethanol.
The following results were obtained.
What is the molar heat of combustion calculated from this data?
(A) 22.4 kJ mol–1
(B) 25.7 kJ mol–1
(C) 1030 kJ mol–1
(D) 1180 kJ mol–1
5 How many isomers are there for C3H6Cl2?
(A) 3
(B) 4
(C) 5
(D) 6
Initial mass of burner 133.20 g
Final mass of burner 132.05 g
Initial temperature of water 25.0°C
Final temperature of water 45.5°C
Thermometer
Can containing 300 g water
Burner containing ethanol
– 4 –

6 Glucose (C6H12O6) is a monomer that can form naturally occurring polymers.
The approximate atomic weights for the elements which make up glucose are shown inthe table.
Using data from the table, what would be the approximate molecular weight of a polymermade from 5 glucose monomers?
(A) 810
(B) 828
(C) 882
(D) 900
7 Which class of compounds typically has a sweet smell?
(A) Esters
(B) Alkenes
(C) Haloalkanes
(D) Alkanoic acids
How does acid X compare with acid Y?
(A) X is weaker and more dilute than Y.
(B) X is stronger and more dilute than Y.
(C) X is weaker and more concentrated than Y.
(D) X is stronger and more concentrated than Y.
Acid X is 0.1 mol L–1 hydrochloric acid.
Acid Y is 1.0 mol L–1 acetic acid (ethanoic acid).
8
Element Approximate atomic weight
Carbon 12
Hydrogen 1
Oxygen 16
– 5 –
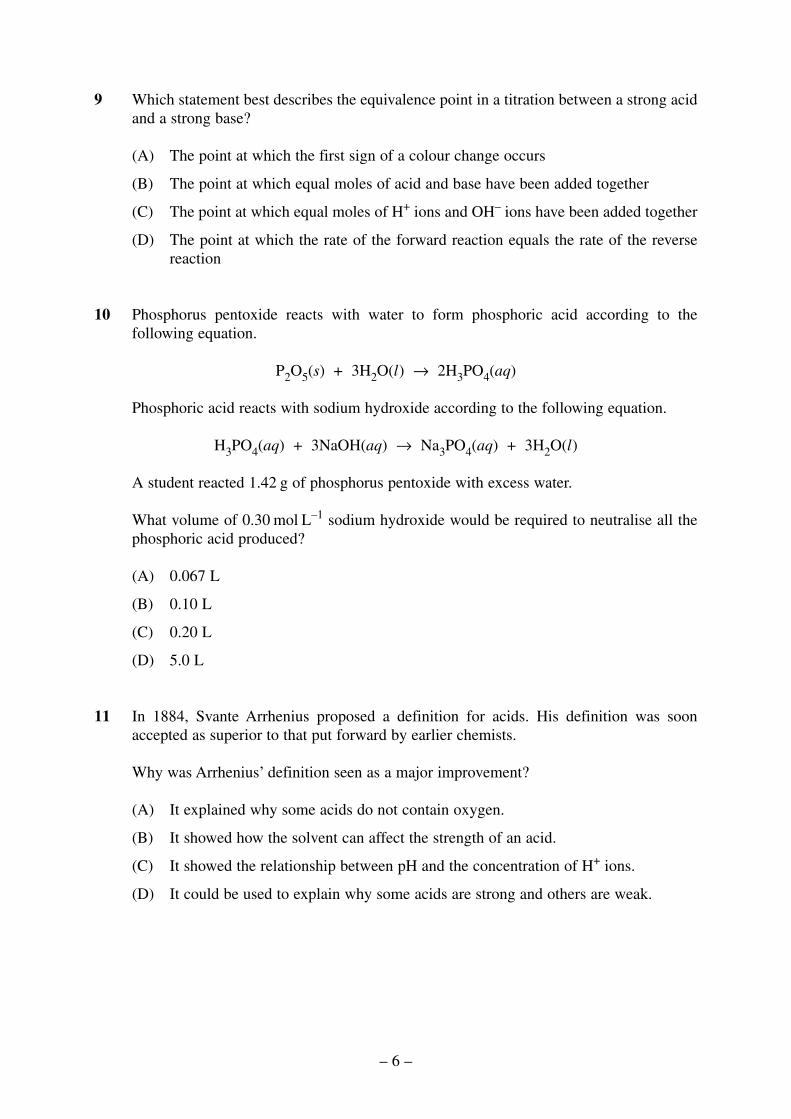
9 Which statement best describes the equivalence point in a titration between a strong acidand a strong base?
(A) The point at which the first sign of a colour change occurs
(B) The point at which equal moles of acid and base have been added together
(C) The point at which equal moles of H+ ions and OH– ions have been added together
(D) The point at which the rate of the forward reaction equals the rate of the reversereaction
10 Phosphorus pentoxide reacts with water to form phosphoric acid according to thefollowing equation.
P2O5(s) + 3H2O(l) → 2H3PO4(aq)
Phosphoric acid reacts with sodium hydroxide according to the following equation.
H3PO4(aq) + 3NaOH(aq) → Na3PO4(aq) + 3H2O(l)
A student reacted 1.42 g of phosphorus pentoxide with excess water.
What volume of 0.30 mol L–1 sodium hydroxide would be required to neutralise all thephosphoric acid produced?
(A) 0.067 L
(B) 0.10 L
(C) 0.20 L
(D) 5.0 L
11 In 1884, Svante Arrhenius proposed a definition for acids. His definition was soonaccepted as superior to that put forward by earlier chemists.
Why was Arrhenius’ definition seen as a major improvement?
(A) It explained why some acids do not contain oxygen.
(B) It showed how the solvent can affect the strength of an acid.
(C) It showed the relationship between pH and the concentration of H+ ions.
(D) It could be used to explain why some acids are strong and others are weak.
– 6 –
– 7 –
12 Which statement explains why catalysts are often used in chemical reactions?
(A) Catalysts increase the rate of reactions.
(B) Catalysts increase the yield of products of reactions.
(C) Catalysts increase the purity of products of reactions.
(D) Catalysts increase the activation energies of reactions.
13 Why are microscopic membrane filters useful for water purification?
(A) They can kill bacteria.
(B) They adjust the pH of water to 7.
(C) They are composed of biodegradable polymers.
(D) They can remove very small particles from water.
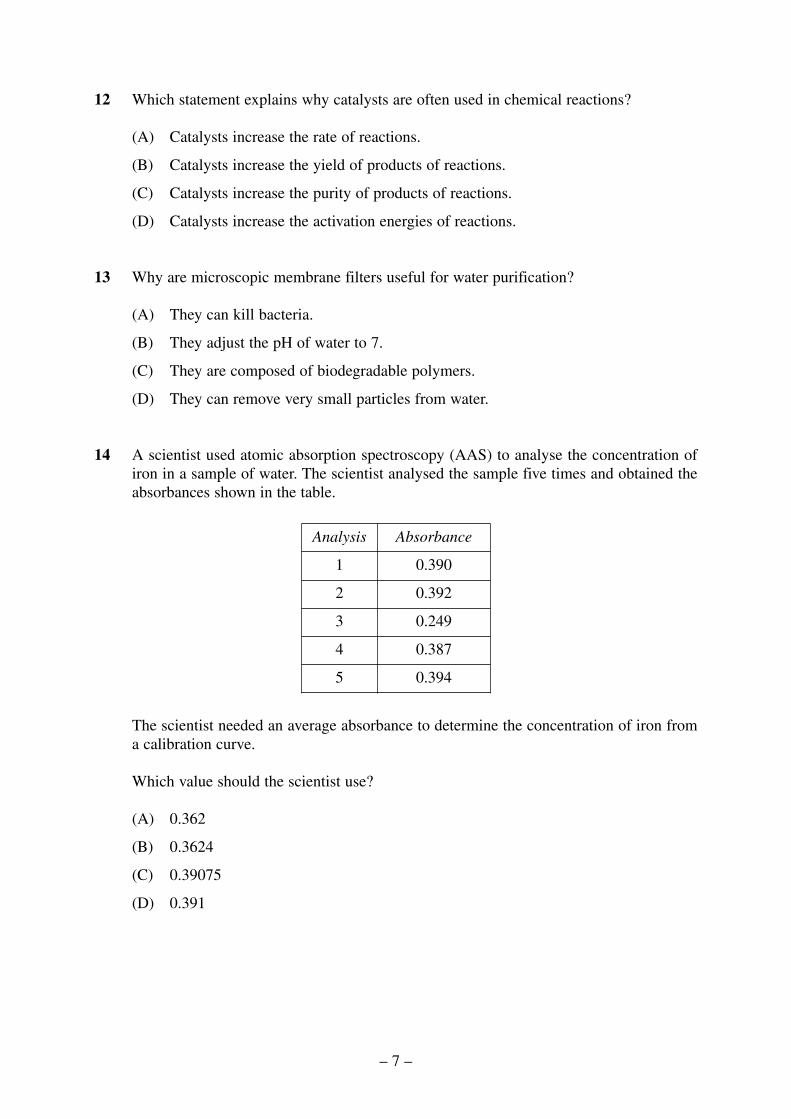
14 A scientist used atomic absorption spectroscopy (AAS) to analyse the concentration ofiron in a sample of water. The scientist analysed the sample five times and obtained theabsorbances shown in the table.
The scientist needed an average absorbance to determine the concentration of iron froma calibration curve.
Which value should the scientist use?
(A) 0.362
(B) 0.3624
(C) 0.39075
(D) 0.391
Analysis Absorbance
1 0.390
2 0.392
3 0.249
4 0.387
5 0.394
– 8 –
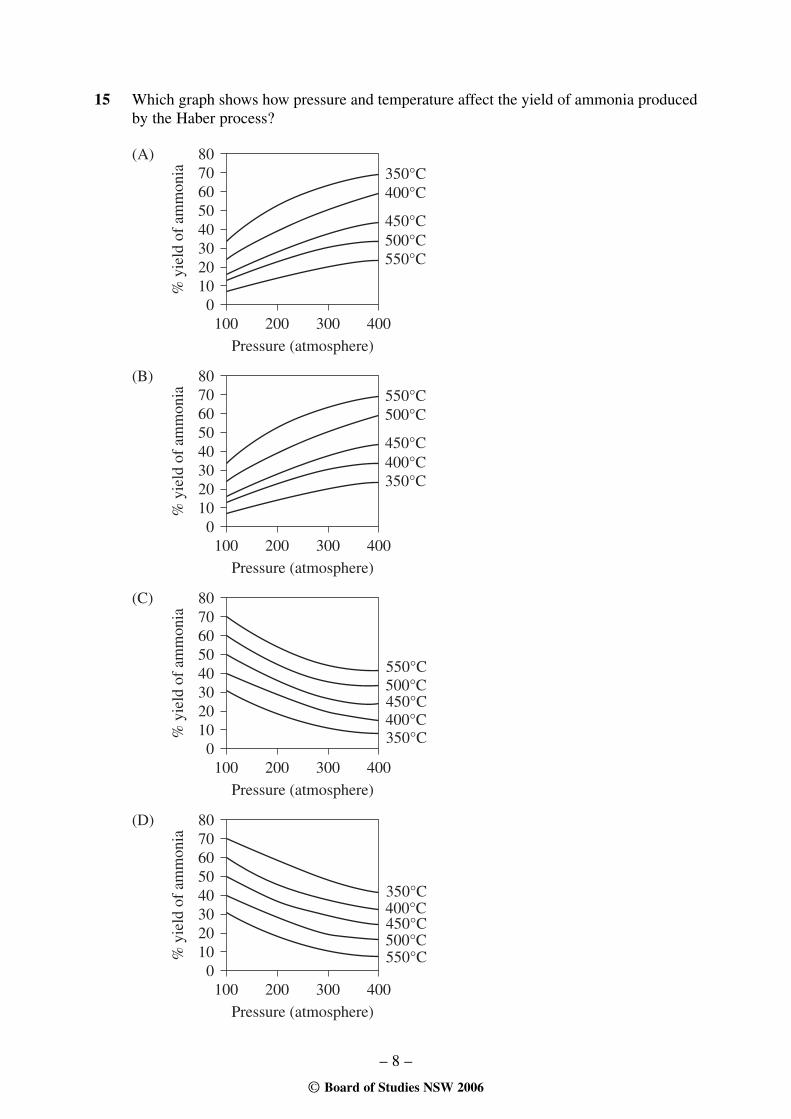
15 Which graph shows how pressure and temperature affect the yield of ammonia producedby the Haber process?
0100 200
Pressure (atmosphere)300 400
350°C400°C
450°C500°C550°C
1020304050607080
% y
ield
of
amm
onia
0100 200
Pressure (atmosphere)300 400
550°C500°C
450°C400°C350°C
1020304050607080
% y
ield
of
amm
onia
500°C
400°C
0100 200
Pressure (atmosphere)300 400
550°C
350°C
450°C
1020304050607080
% y
ield
of
amm
onia
0100 200
Pressure (atmosphere)300 400
1020304050607080
% y
ield
of
amm
onia
400°C
500°C
350°C
550°C
450°C
(A)
(B)
(C)
(D)
© Board of Studies NSW 2006
2006 HIGHER SCHOOL CERTIFICATE EXAMINATION
Chemistry
Section I (continued)
Part B – 60 marksAttempt Questions 16–28Allow about 1 hour and 45 minutes for this part
Answer the questions in the spaces provided.
Show all relevant working in questions involving calculations.
MarksQuestion 16 (3 marks)
Describe how technology has enabled the transuranic elements to be produced.
.........................................................................................................................................
.........................................................................................................................................
.........................................................................................................................................
.........................................................................................................................................
.........................................................................................................................................
.........................................................................................................................................
.........................................................................................................................................
.........................................................................................................................................
.........................................................................................................................................
3
– 9 –116
Centre Number
Student Number
Question 17 (4 marks)
(a) Calculate the pH of a 0.2 mol L–1 solution of hydrochloric acid.
...............................................................................................................................
...............................................................................................................................
(b) Calculate the pH after 20 mL of 0.01 mol L–1 sodium hydroxide is added to50 mL of 0.2 mol L–1 hydrochloric acid. Include a balanced chemical equationin your answer.
...............................................................................................................................
...............................................................................................................................
...............................................................................................................................
...............................................................................................................................
...............................................................................................................................
...............................................................................................................................
...............................................................................................................................
...............................................................................................................................
3
1
– 10 –
Marks
© Board of Studies NSW 2006
– 11 –117
Centre Number
Student Number
2006 HIGHER SCHOOL CERTIFICATE EXAMINATION
Chemistry
Section I – Part B (continued)
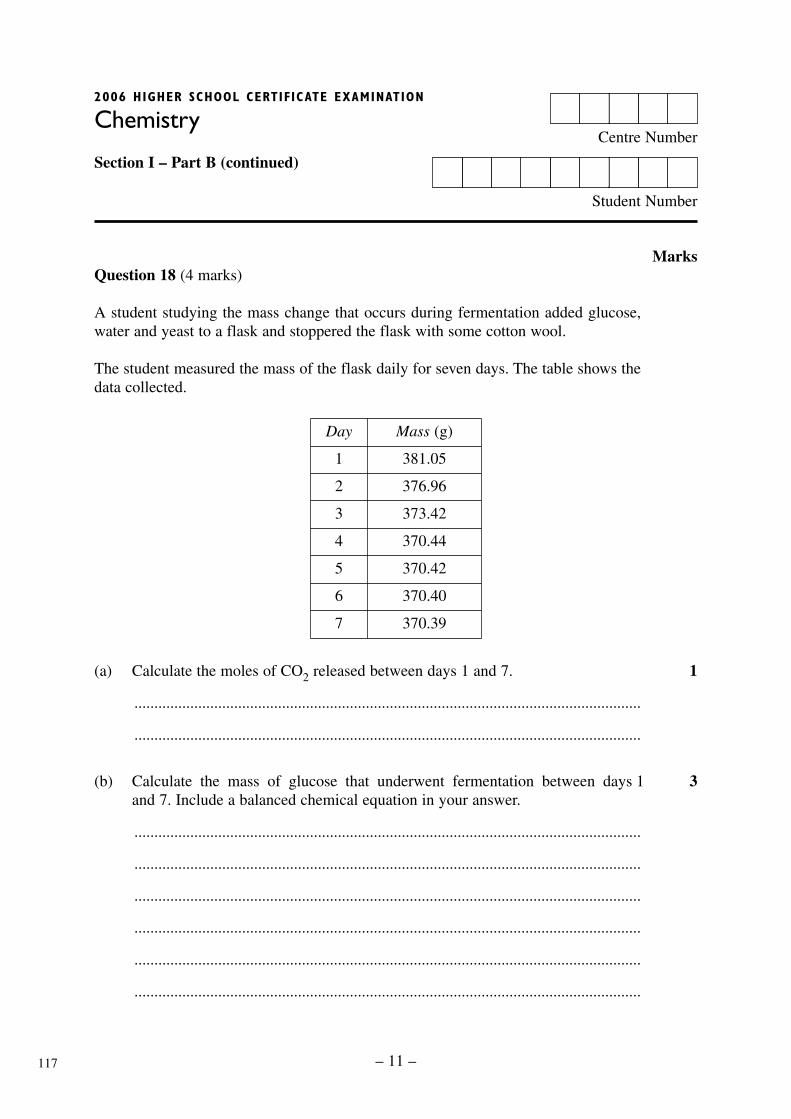
MarksQuestion 18 (4 marks)
A student studying the mass change that occurs during fermentation added glucose,water and yeast to a flask and stoppered the flask with some cotton wool.
The student measured the mass of the flask daily for seven days. The table shows thedata collected.
(a) Calculate the moles of CO2 released between days 1 and 7.
...............................................................................................................................
...............................................................................................................................
(b) Calculate the mass of glucose that underwent fermentation between days 1and 7. Include a balanced chemical equation in your answer.
...............................................................................................................................
...............................................................................................................................
...............................................................................................................................
...............................................................................................................................
...............................................................................................................................
...............................................................................................................................
3
1
Day Mass (g)
1 381.05
2 376.96
3 373.42
4 370.44
5 370.42
6 370.40
7 370.39
Question 19 (7 marks)
A student was asked to perform a first-hand investigation to measure the difference inpotential of various combinations of metals in an electrolyte solution. The student wasprovided with three metals: aluminium, zinc and silver; and three electrolyte solutions:aluminium nitrate, zinc nitrate and silver nitrate.
(a) Identify which combination of the metals supplied should give the highestpotential difference.
...............................................................................................................................
(b) Sketch and label a diagram of an experimental setup that the student coulduse with the combination of metals identified in part (a).
(c) Write a balanced chemical equation for the overall reaction for the metalsidentified in part (a), and calculate the expected potential difference.
...............................................................................................................................
...............................................................................................................................
...............................................................................................................................
...............................................................................................................................
...............................................................................................................................
...............................................................................................................................
Question 19 continues on page 13
2
2
1
– 12 –
Marks
Question 19 (continued)
(d) The measured potential difference obtained varied from the theoretical value.
Outline steps the student could have taken to minimise this variation.
...............................................................................................................................
...............................................................................................................................
...............................................................................................................................
...............................................................................................................................
...............................................................................................................................
...............................................................................................................................
End of Question 19
2
– 13 –
Marks

BLANK PAGE
© Board of Studies NSW 2006
– 14 –

– 15 –XXX
Centre Number
Student Number
2006 HIGHER SCHOOL CERTIFICATE EXAMINATION
Chemistry
Section I – Part B (continued)
MarksQuestion 20 (7 marks)
Analyse why ethylene is such an important starting material for the chemical industry.In your answer, include relevant chemical equations, and a description of newmaterials and fuels that can be prepared from ethylene.
.........................................................................................................................................
.........................................................................................................................................
.........................................................................................................................................
.........................................................................................................................................
.........................................................................................................................................
.........................................................................................................................................
.........................................................................................................................................
.........................................................................................................................................
.........................................................................................................................................
.........................................................................................................................................
.........................................................................................................................................
.........................................................................................................................................
.........................................................................................................................................
.........................................................................................................................................
.........................................................................................................................................
.........................................................................................................................................
.........................................................................................................................................
.........................................................................................................................................
.........................................................................................................................................
.........................................................................................................................................
7
118

Question 21 (3 marks)
You performed a first-hand investigation to identify the pH of a range of salt solutions.
(a) Identify an acidic salt you used.
...............................................................................................................................
(b) Explain the acidic nature of the salt you selected. Include a balanced chemicalequation in your answer.
...............................................................................................................................
...............................................................................................................................
...............................................................................................................................
...............................................................................................................................
2
1
– 16 –
Marks
© Board of Studies NSW 2006

– 17 –118a
Centre Number
Student Number
2006 HIGHER SCHOOL CERTIFICATE EXAMINATION
Chemistry
Section I – Part B (continued)
MarksQuestion 22 (4 marks)
The atmosphere contains acidic oxides of sulfur which have been increasing inconcentration since the Industrial Revolution.
Discuss the evidence for this statement, and include relevant balanced chemicalequations.
.........................................................................................................................................
.........................................................................................................................................
.........................................................................................................................................
.........................................................................................................................................
.........................................................................................................................................
.........................................................................................................................................
.........................................................................................................................................
.........................................................................................................................................
.........................................................................................................................................
.........................................................................................................................................
.........................................................................................................................................
.........................................................................................................................................
4
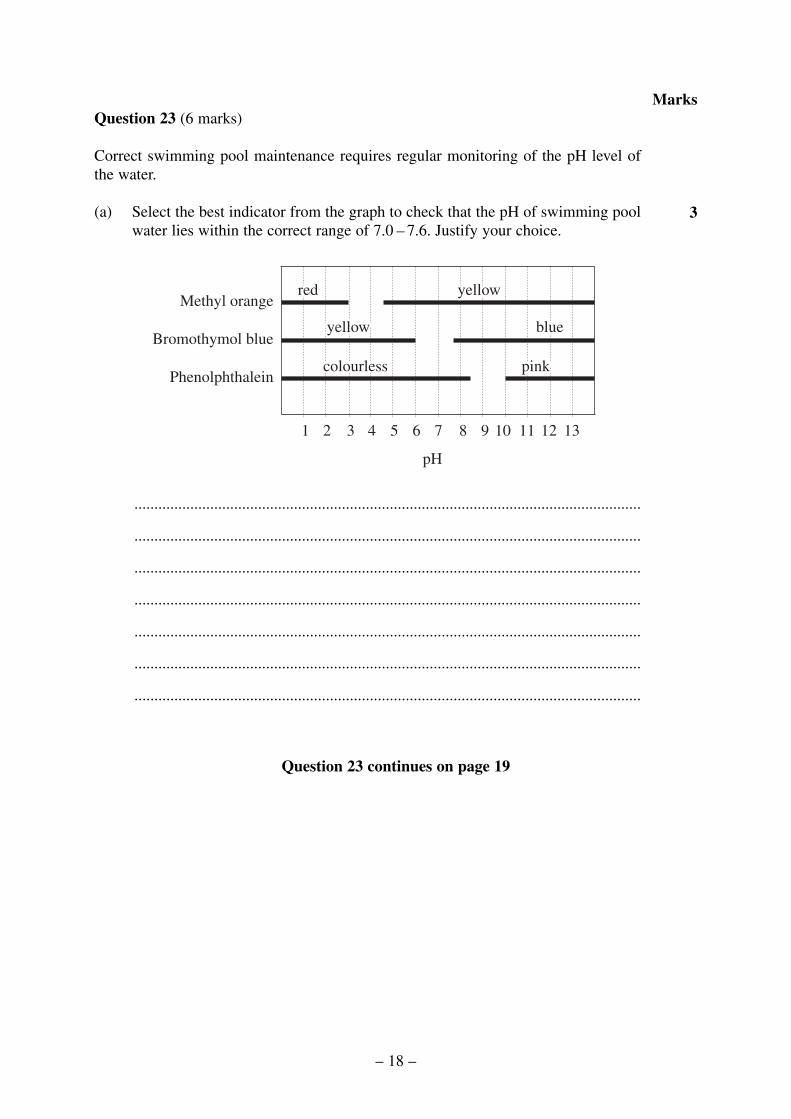
Question 23 (6 marks)
Correct swimming pool maintenance requires regular monitoring of the pH level ofthe water.
(a) Select the best indicator from the graph to check that the pH of swimming poolwater lies within the correct range of 7.0 – 7.6. Justify your choice.
...............................................................................................................................
...............................................................................................................................
...............................................................................................................................
...............................................................................................................................
...............................................................................................................................
...............................................................................................................................
...............................................................................................................................
Question 23 continues on page 19
1 2 3 4 5 6 7 8 9 10 11 12 13
redred
yellowyellow
yellowyellow
colourlesscolourless
blueblue
pinkpink
red
yellow
yellow
colourless
blue
pink
Methyl orange
Bromothymol blue
Phenolphthalein
pH
3
– 18 –
Marks
Question 23 (continued)
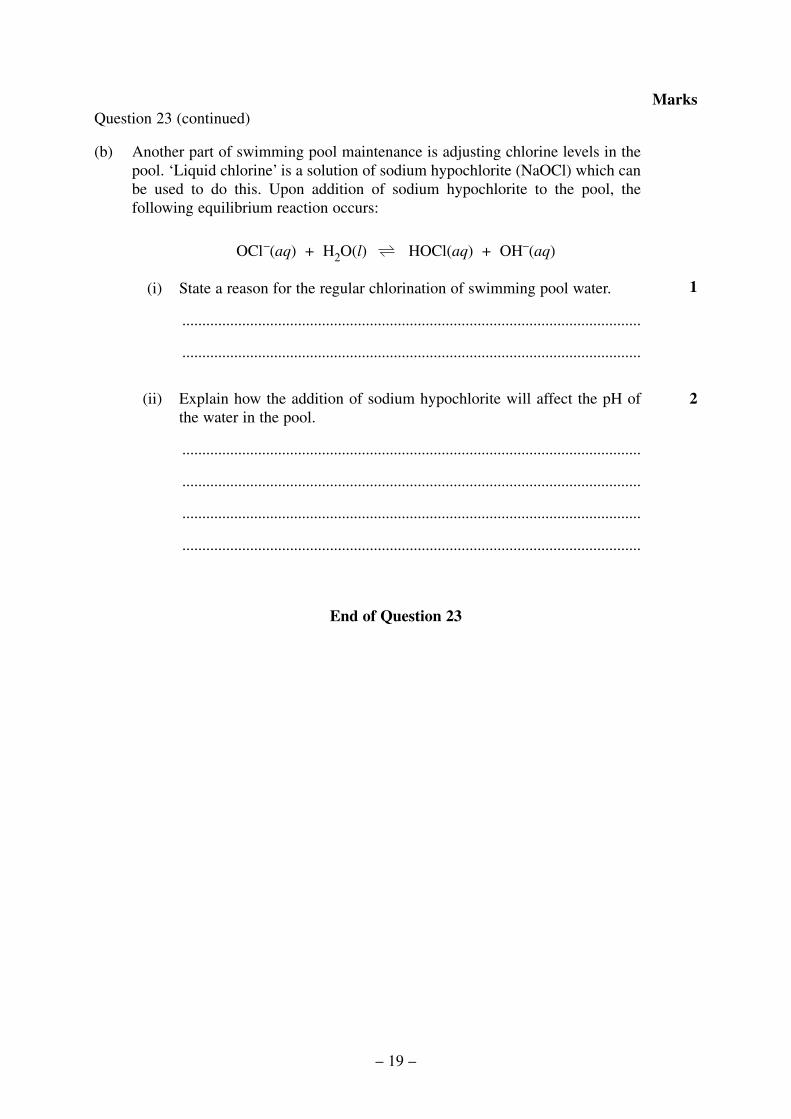
(b) Another part of swimming pool maintenance is adjusting chlorine levels in thepool. ‘Liquid chlorine’ is a solution of sodium hypochlorite (NaOCl) which canbe used to do this. Upon addition of sodium hypochlorite to the pool, thefollowing equilibrium reaction occurs:
OCl–(aq) + H2O(l) HOCl(aq) + OH–(aq)
(i) State a reason for the regular chlorination of swimming pool water.
...................................................................................................................
...................................................................................................................
(ii) Explain how the addition of sodium hypochlorite will affect the pH ofthe water in the pool.
...................................................................................................................
...................................................................................................................
...................................................................................................................
...................................................................................................................
End of Question 23
2
1
– 19 –
Marks

BLANK PAGE
© Board of Studies NSW 2006
– 20 –

2006 HIGHER SCHOOL CERTIFICATE EXAMINATION
Chemistry
Section I – Part B (continued)
MarksQuestion 24 (5 marks)
Early in the twentieth century, Fritz Haber developed a method for preparingammonia.
(a) Write a balanced chemical equation for the preparation of ammonia using theHaber process.
...............................................................................................................................
(b) Evaluate the significance of Haber’s discovery at that time in world history.
...............................................................................................................................
...............................................................................................................................
...............................................................................................................................
...............................................................................................................................
...............................................................................................................................
...............................................................................................................................
...............................................................................................................................
...............................................................................................................................
...............................................................................................................................
...............................................................................................................................
...............................................................................................................................
...............................................................................................................................
4
1
– 21 –119
Centre Number
Student Number
Question 25 (5 marks)
Atomic absorption spectroscopy was used to analyse a set of standard solutions ofcopper. The results are presented in the table.
(a) Draw an appropriate graph of the data.
Question 25 continues on page 23
00
0.20
0.40
0.60
0.80
1.00
5 10 15 20
Concentration of copper (ppm)
Abs
orba
nce
25 30 35
2
Concentration of copper(ppm)
Absorbance
0 0
5 0.20
10 0.39
15 0.52
20 0.64
25 0.77
– 22 –
Marks
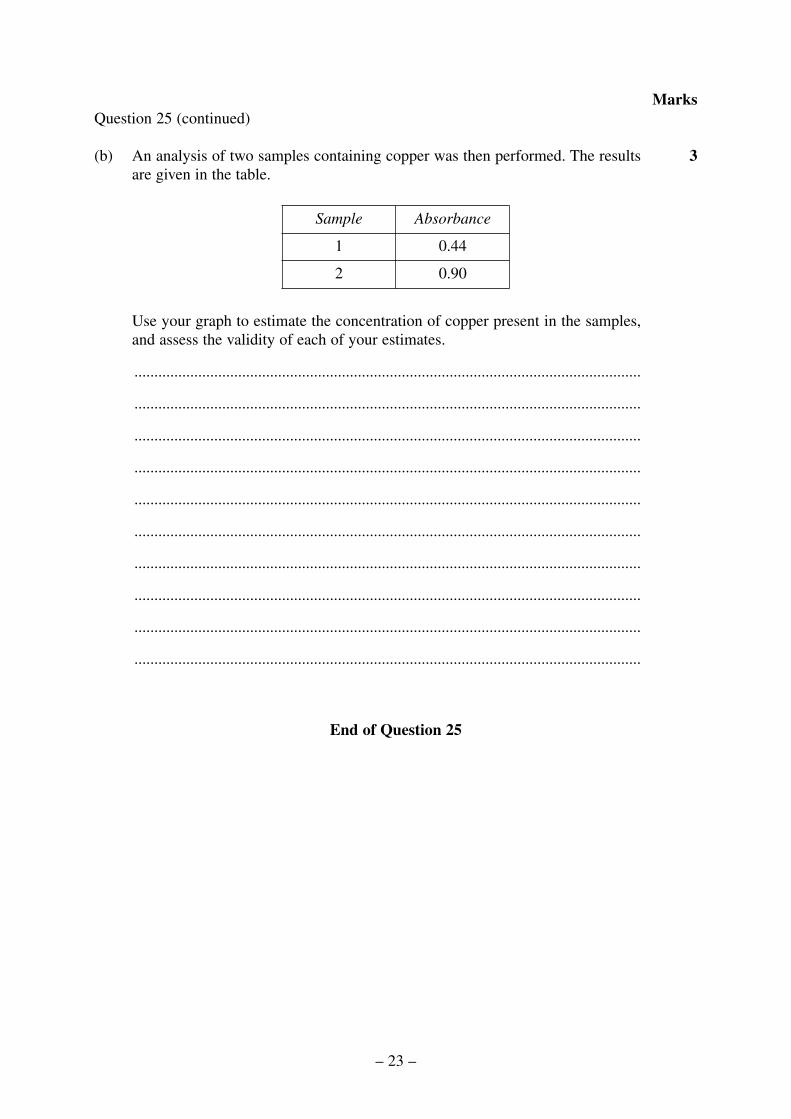
Question 25 (continued)
(b) An analysis of two samples containing copper was then performed. The resultsare given in the table.
Use your graph to estimate the concentration of copper present in the samples,and assess the validity of each of your estimates.
...............................................................................................................................
...............................................................................................................................
...............................................................................................................................
...............................................................................................................................
...............................................................................................................................
...............................................................................................................................
...............................................................................................................................
...............................................................................................................................
...............................................................................................................................
...............................................................................................................................
End of Question 25
Sample Absorbance
1 0.44
2 0.90
3
– 23 –
Marks

BLANK PAGE
– 24 –
© Board of Studies NSW 2006
– 25 –119a
Centre Number
Student Number
2006 HIGHER SCHOOL CERTIFICATE EXAMINATION
Chemistry
Section I – Part B (continued)
MarksQuestion 26 (4 marks)
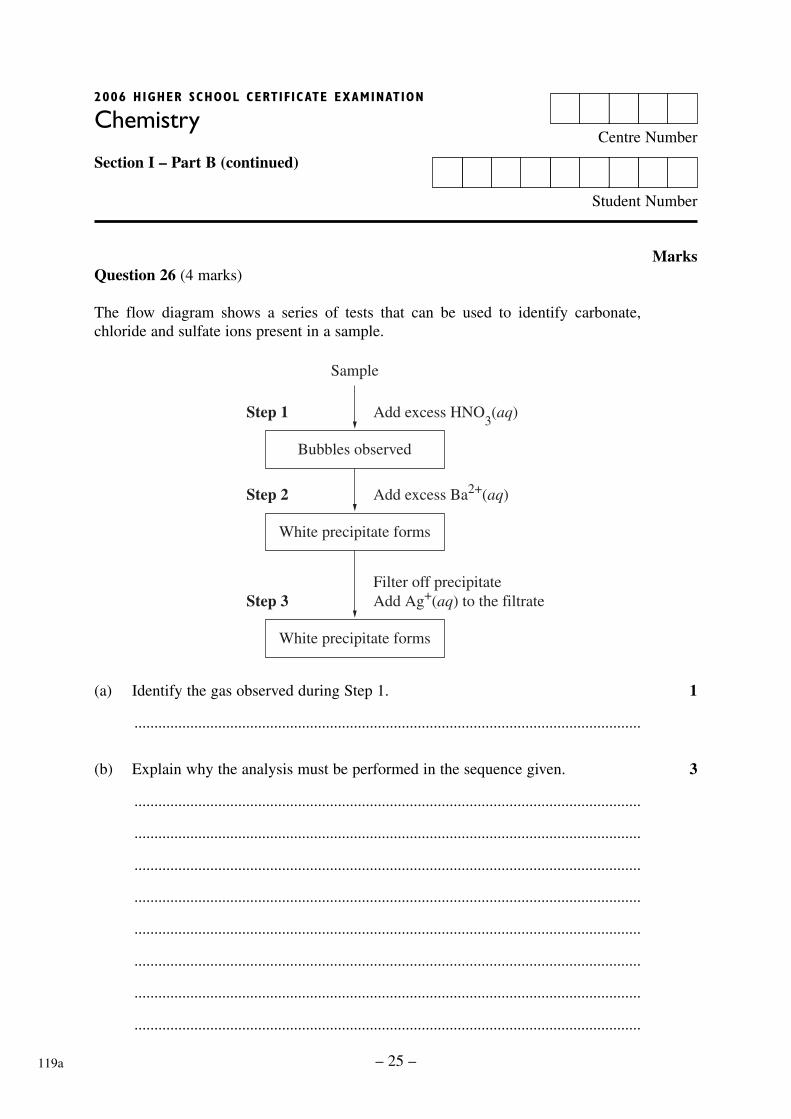
The flow diagram shows a series of tests that can be used to identify carbonate,chloride and sulfate ions present in a sample.
(a) Identify the gas observed during Step 1.
...............................................................................................................................
(b) Explain why the analysis must be performed in the sequence given.
...............................................................................................................................
...............................................................................................................................
...............................................................................................................................
...............................................................................................................................
...............................................................................................................................
...............................................................................................................................
...............................................................................................................................
...............................................................................................................................
3
1
Bubbles observed
Sample
White precipitate forms
White precipitate forms
Step 1 Add excess HNO3(aq)
Step 2 Add excess Ba2+(aq)
Step 3Filter off precipitateAdd Ag+(aq) to the filtrate
Question 27 (4 marks)
One of the most common methods for determining the concentration of metal ions inwater samples involves titration with a reagent called EDTA. In alkaline solutionEDTA is present as an anion with a 4 – charge. In this form it reacts with metal ionssuch as calcium and magnesium in a 1 : 1 ratio:
Ca2+ + EDTA4– → Ca(EDTA)2–
When the reaction between the metal ions and EDTA4– is complete, an indicator alsopresent in the solution changes colour.
A student used the following procedure to determine the concentration of calcium ina sample of water:
• 50.0 mL of water sample was pipetted into a conical flask
• 5.0 mL of ammonia/ammonium ion buffer and two drops of indicator were added
• Sample was titrated with 0.0200 mol L–1 EDTA4– until indicator changed colour
• The above procedure was repeated a further three times
• The average volume of EDTA4– used in the four titrations was 24.0 mL
(a) What is the average number of moles of EDTA4– added to reach the end point?
...............................................................................................................................
...............................................................................................................................
(b) The student used the answer to part (a) to calculate the concentration of Ca2+ inthe water sample in mg L–1.
What concentration was obtained?
...............................................................................................................................
...............................................................................................................................
...............................................................................................................................
...............................................................................................................................
(c) The concentration of Ca2+ in the water sample was also determined by atomicabsorption spectroscopy, and found to be 16% lower than the value obtained bytitration with EDTA4–.
Suggest a reason why the concentration of Ca2+ determined by EDTA titrationwas higher.
...............................................................................................................................
...............................................................................................................................
1
2
1
– 26 –
Marks
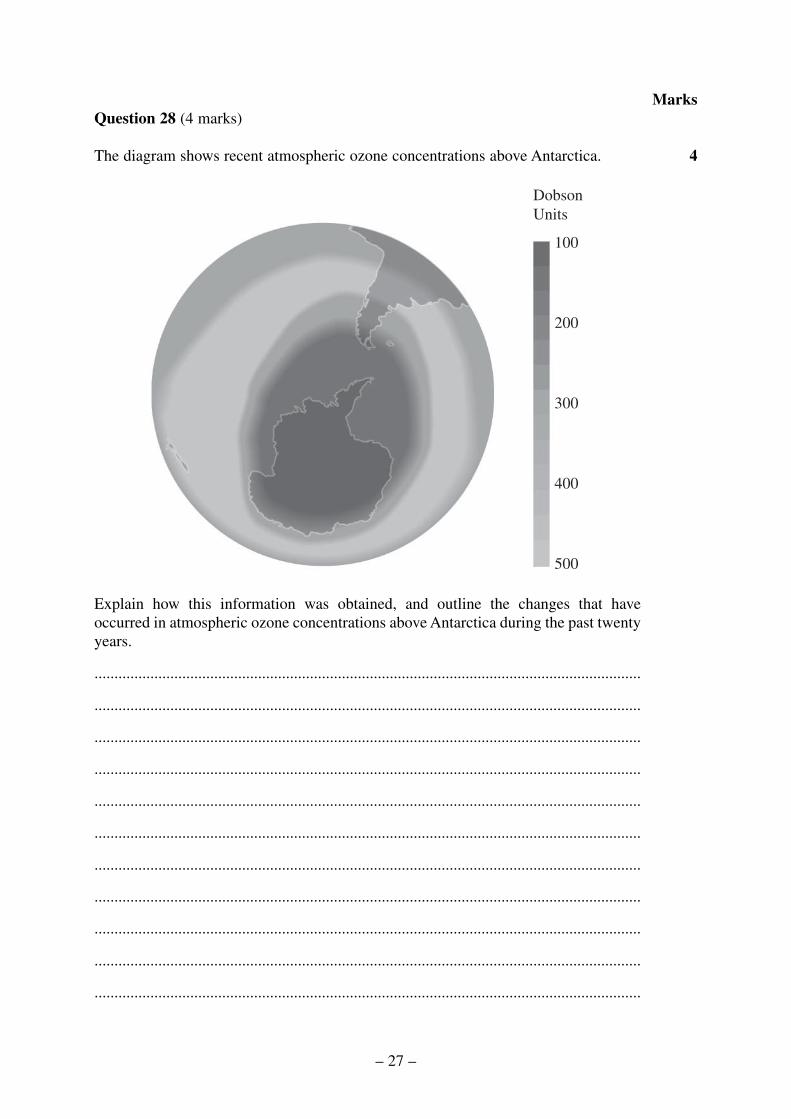
Question 28 (4 marks)
The diagram shows recent atmospheric ozone concentrations above Antarctica.
Explain how this information was obtained, and outline the changes that haveoccurred in atmospheric ozone concentrations above Antarctica during the past twentyyears.
.........................................................................................................................................
.........................................................................................................................................
.........................................................................................................................................
.........................................................................................................................................
.........................................................................................................................................
.........................................................................................................................................
.........................................................................................................................................
.........................................................................................................................................
.........................................................................................................................................
.........................................................................................................................................
.........................................................................................................................................
DobsonUnits
100
500
400
300
200
4
– 27 –
Marks

BLANK PAGE
© Board of Studies NSW 2006
– 28 –
2006 HIGHER SCHOOL CERTIFICATE EXAMINATION
Chemistry
Section II
25 marksAttempt ONE question from Questions 29–33Allow about 45 minutes for this section
Answer the question in a writing booklet. Extra writing booklets are available.
Show all relevant working in questions involving calculations.
Pages
Question 29 Industrial Chemistry ............................................................ 30–31
Question 30 Shipwrecks, Corrosion and Conservation ............................ 32–33
Question 31 The Biochemistry of Movement .......................................... 34–36
Question 32 The Chemistry of Art ........................................................... 37–38
Question 33 Forensic Chemistry .............................................................. 39–40
– 29 –120
Question 29 — Industrial Chemistry (25 marks)
(a) During your practical work you performed a first-hand investigation to identifythe products of electrolysis of sodium chloride.
(i) Outline a risk assessment for this investigation, and show how this wouldinfluence the experimental procedure.
(ii) Provide a conclusion based on one set of observations from yourfirst-hand investigation.
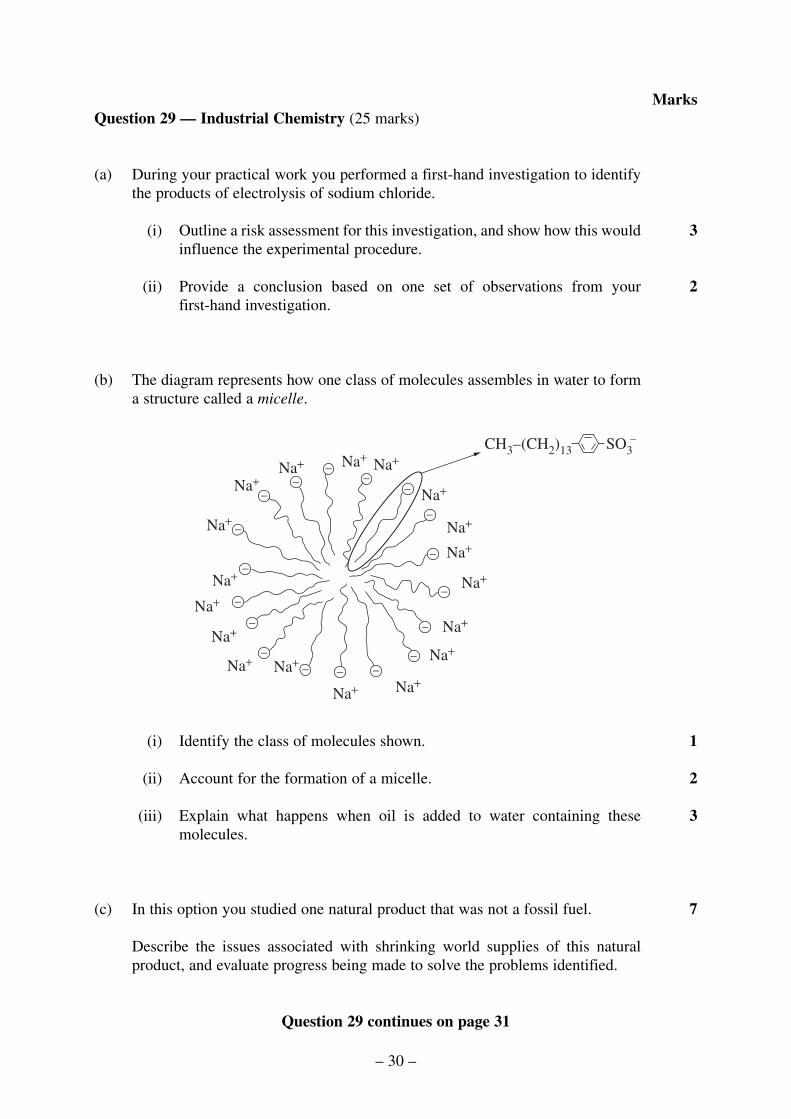
(b) The diagram represents how one class of molecules assembles in water to forma structure called a micelle.
(i) Identify the class of molecules shown.
(ii) Account for the formation of a micelle.
(iii) Explain what happens when oil is added to water containing thesemolecules.
(c) In this option you studied one natural product that was not a fossil fuel.
Describe the issues associated with shrinking world supplies of this naturalproduct, and evaluate progress being made to solve the problems identified.
Question 29 continues on page 31
7
3
2
1
Na+ Na+
Na+
Na+
Na+
Na+
Na+
Na+
Na+Na+
Na+
Na+
Na+
Na+
Na+
Na+Na+
Na+
−−
−−
−
−
−
−
−
−−−−
−
−
−
−
−
CH3–(CH2)13 SO3–
2
3
– 30 –
Marks

Question 29 (continued)
(d) The diagram summarises the steps in the Contact process.
(i) Identify the starting material, X, for the first step in the Contact process.
(ii) Outline the chemistry involved in the conversion of sulfur trioxide tosulfuric acid.
(iii) Justify the conditions you would use to maximise the rate and yield ofthe second step in the Contact process. Include a balanced chemicalequation in your answer.
End of Question 29
4
2
1
Oxygenfrom air
Oxygenfrom air
SulfurdioxideX
Sulfurtrioxide
SulfuricacidStep 1 Step 2 Step 3
– 31 –
Marks
Question 30 — Shipwrecks, Corrosion and Conservation (25 marks)
(a) During your practical work you performed a first-hand investigation to identifythe factors that affect the rate of an electrolysis reaction.
(i) Outline a risk assessment for this investigation, and show how this wouldinfluence the experimental procedure.
(ii) Provide a conclusion based on one set of observations from yourfirst-hand investigation.
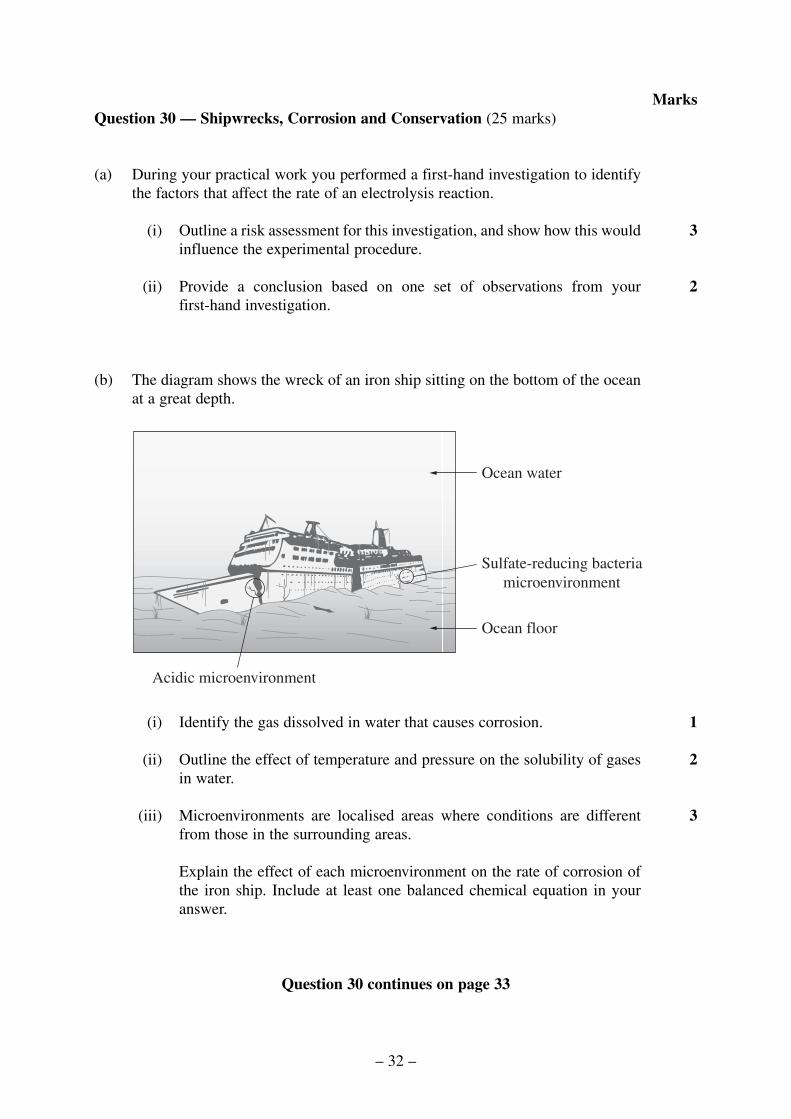
(b) The diagram shows the wreck of an iron ship sitting on the bottom of the oceanat a great depth.
(i) Identify the gas dissolved in water that causes corrosion.
(ii) Outline the effect of temperature and pressure on the solubility of gasesin water.
(iii) Microenvironments are localised areas where conditions are differentfrom those in the surrounding areas.
Explain the effect of each microenvironment on the rate of corrosion ofthe iron ship. Include at least one balanced chemical equation in youranswer.
Question 30 continues on page 33
3
2
1
Sulfate-reducing bacteriamicroenvironment
Ocean floor
Ocean water
Acidic microenvironment
2
3
– 32 –
Marks
Question 30 (continued)
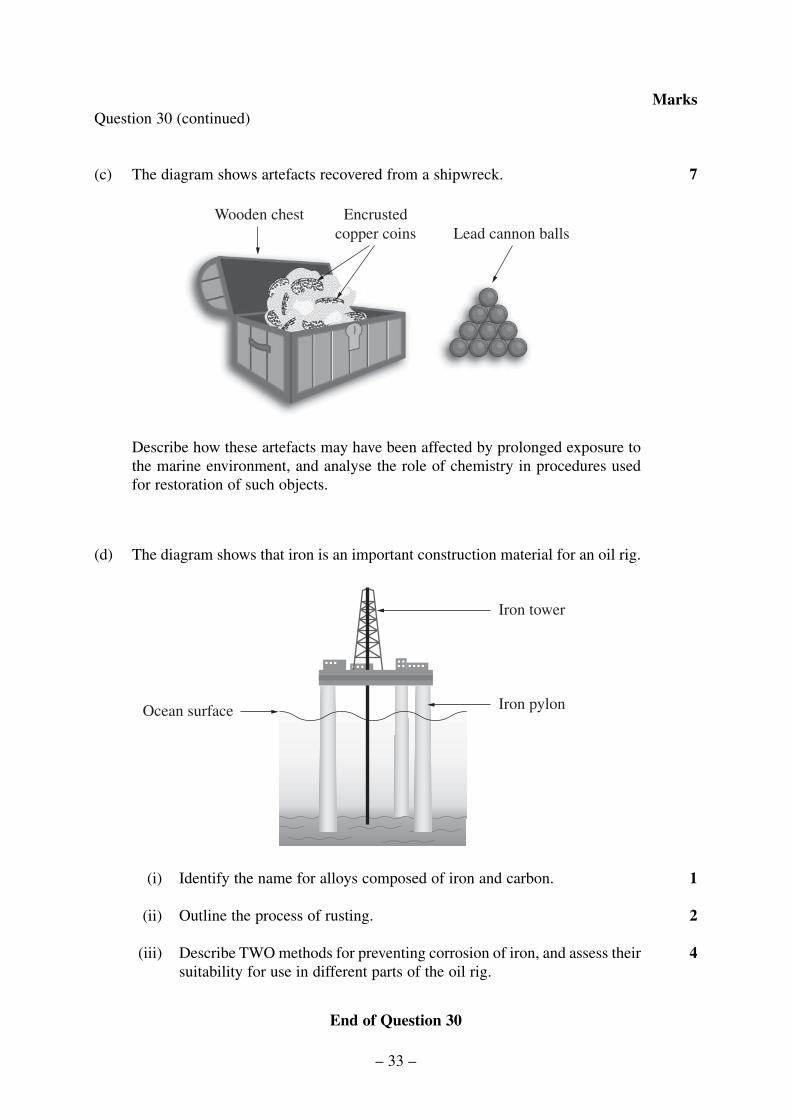
(c) The diagram shows artefacts recovered from a shipwreck.
Describe how these artefacts may have been affected by prolonged exposure tothe marine environment, and analyse the role of chemistry in procedures usedfor restoration of such objects.
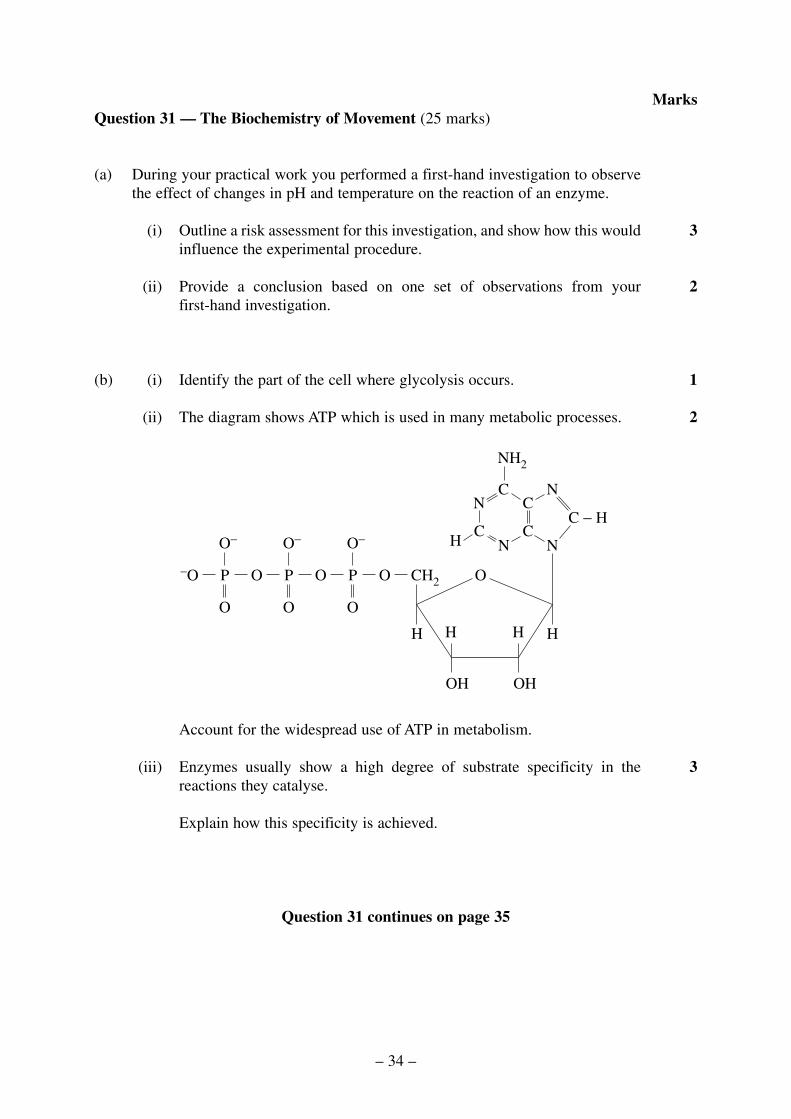
(d) The diagram shows that iron is an important construction material for an oil rig.
(i) Identify the name for alloys composed of iron and carbon.
(ii) Outline the process of rusting.
(iii) Describe TWO methods for preventing corrosion of iron, and assess theirsuitability for use in different parts of the oil rig.
End of Question 30
4
2
1
Iron pylonOcean surface
Iron tower
Wooden chest Encrustedcopper coins Lead cannon balls
7
– 33 –
Marks
Question 31 — The Biochemistry of Movement (25 marks)
(a) During your practical work you performed a first-hand investigation to observethe effect of changes in pH and temperature on the reaction of an enzyme.
(i) Outline a risk assessment for this investigation, and show how this wouldinfluence the experimental procedure.
(ii) Provide a conclusion based on one set of observations from yourfirst-hand investigation.
(b) (i) Identify the part of the cell where glycolysis occurs.
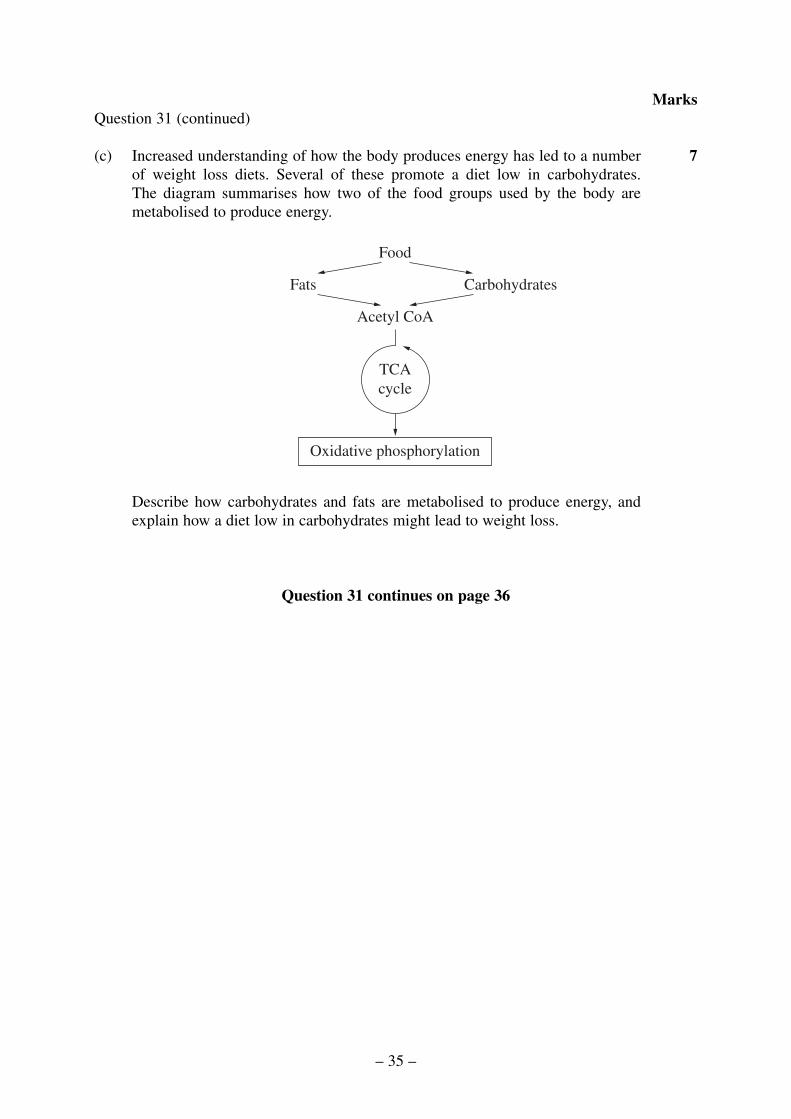
(ii) The diagram shows ATP which is used in many metabolic processes.
Account for the widespread use of ATP in metabolism.
(iii) Enzymes usually show a high degree of substrate specificity in thereactions they catalyse.
Explain how this specificity is achieved.
Question 31 continues on page 35
3
P
O
O−
−O O P
O
O−
O O O
N
N
N
N CC
CC − H
C
P CH2
H
H
HH
OH
H
OH
O
O−
NH2
2
1
2
3
– 34 –
Marks
Question 31 (continued)
(c) Increased understanding of how the body produces energy has led to a numberof weight loss diets. Several of these promote a diet low in carbohydrates.The diagram summarises how two of the food groups used by the body aremetabolised to produce energy.
Describe how carbohydrates and fats are metabolised to produce energy, andexplain how a diet low in carbohydrates might lead to weight loss.
Question 31 continues on page 36
Fats Carbohydrates
Food
Acetyl CoA
TCAcycle
Oxidative phosphorylation
7
– 35 –
Marks
Question 31 (continued)
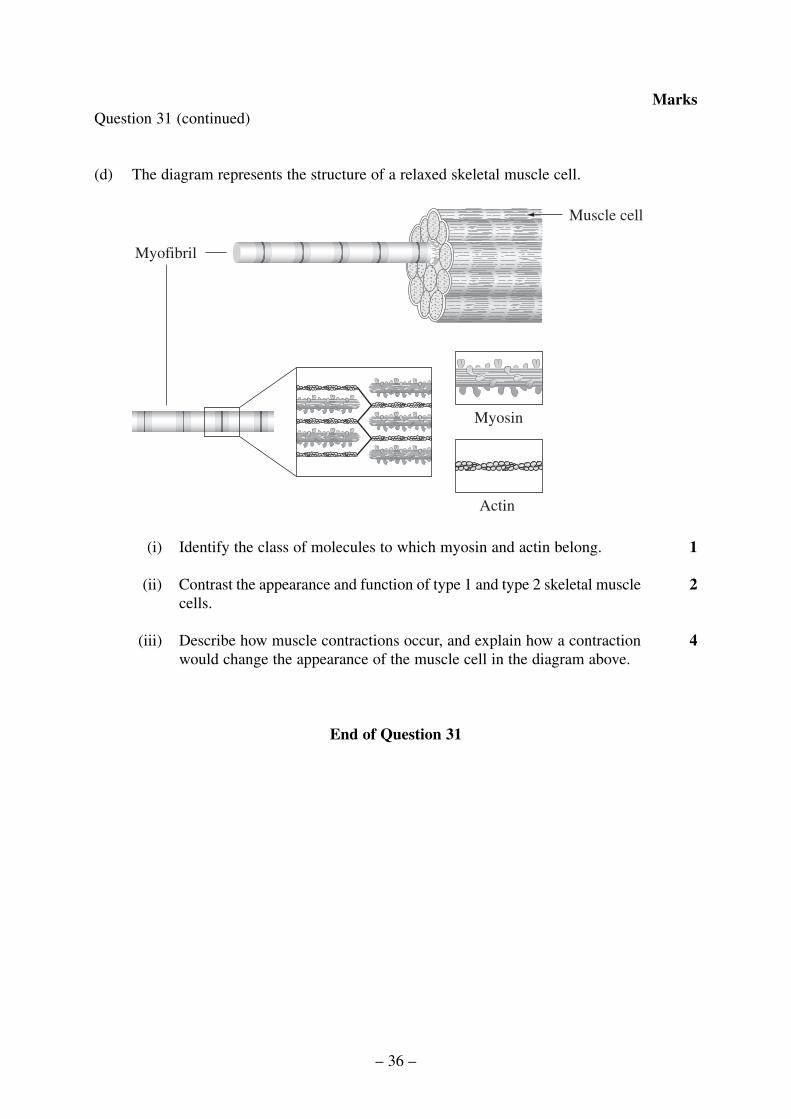
(d) The diagram represents the structure of a relaxed skeletal muscle cell.
(i) Identify the class of molecules to which myosin and actin belong.
(ii) Contrast the appearance and function of type 1 and type 2 skeletal musclecells.
(iii) Describe how muscle contractions occur, and explain how a contractionwould change the appearance of the muscle cell in the diagram above.
End of Question 31
4
2
1
Myosin
Actin
Myofibril
Muscle cell
– 36 –
Marks

Question 32 — The Chemistry of Art (25 marks)
(a) During your practical work you performed a first-hand investigation to gatherinformation about the oxidising strength of KMnO4.
(i) Outline a risk assessment for this investigation, and show how this wouldinfluence the experimental procedure.
(ii) Provide a conclusion based on one set of observations from yourfirst-hand investigation.
(b) (i) Identify a pigment commonly used in an ancient culture, such as earlyEgyptian or Roman.
(ii) The diagram shows the absorption spectrum of a pigment used in apainting found inside an ancient Egyptian tomb.
Use the spectrum to identify the colour of this pigment. Justify yourchoice.
(iii) Explain why many minerals containing transition metal ions have beenused as pigments.
(c) Evaluate the contributions of Bohr, Pauli and Hund in developing our currentunderstanding of the arrangement of electrons around the nuclei of atoms.
Question 32 continues on page 38
7
3
Abs
orba
nce
Violet Blue Green Orange Red
4000.0
1.0
500 600
Wavelength, nm
700 800
2
1
2
3
– 37 –
Marks
Question 32 (continued)
(d) (i) Name the block in the Periodic Table occupied by the transition metals.
(ii) Account for the observation that some transition metal complex ions canact as strong oxidising agents.
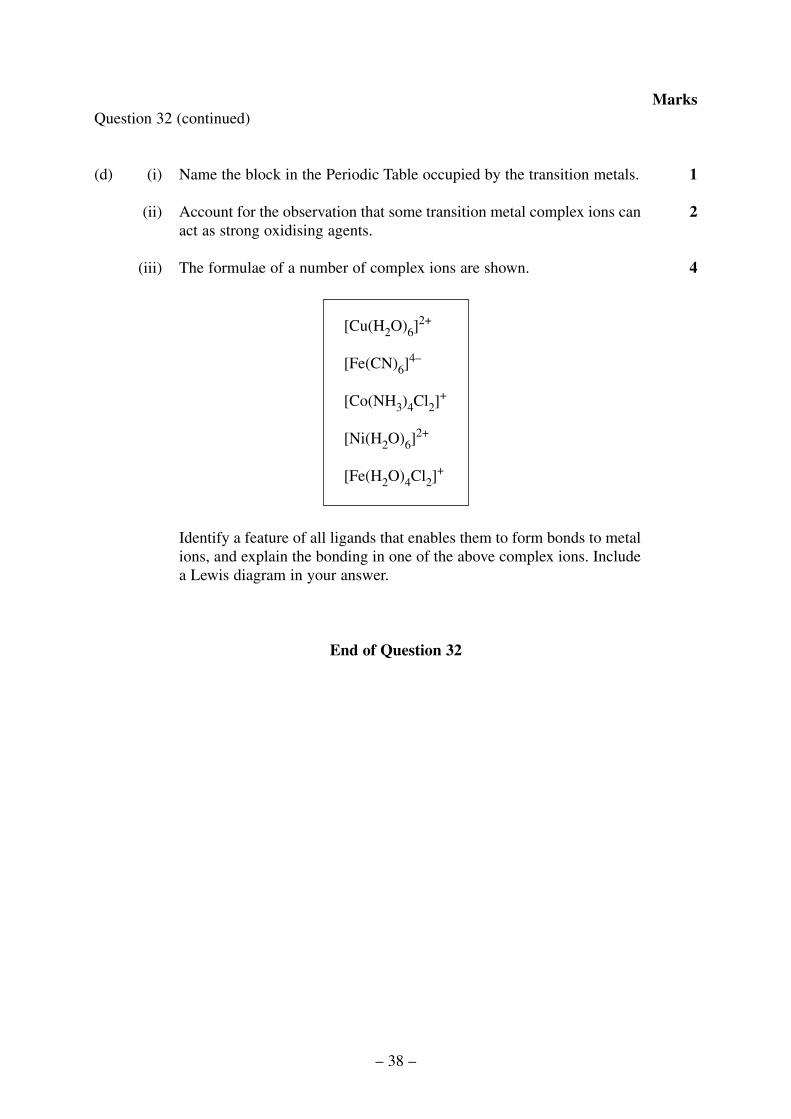
(iii) The formulae of a number of complex ions are shown.
Identify a feature of all ligands that enables them to form bonds to metalions, and explain the bonding in one of the above complex ions. Includea Lewis diagram in your answer.
End of Question 32
[Cu(H2O)6]2+
[Fe(CN)6]4–
[Co(NH3)4Cl2]+
[Ni(H2O)6]2+
[Fe(H2O)4Cl2]+
4
2
1
– 38 –
Marks
Question 33 — Forensic Chemistry (25 marks)
(a) During your practical work you performed a first-hand investigation using flametests and/or spectroscope analysis to identify and describe the emission spectraof elements including sodium and mercury.
(i) Outline a risk assessment for this investigation, and show how this wouldinfluence the experimental procedure.
(ii) Provide a conclusion based on one set of observations from yourfirst-hand investigation.
(b) Carbohydrates are a general class of compounds that includes monosaccharidessuch as glucose, and polysaccharides such as glycogen and cellulose.
(i) What is the general formula of carbohydrates?
(ii) Compare the composition of glycogen and cellulose, and where theyoccur in nature.
(iii) Explain the differences in structure between glycogen and cellulose.
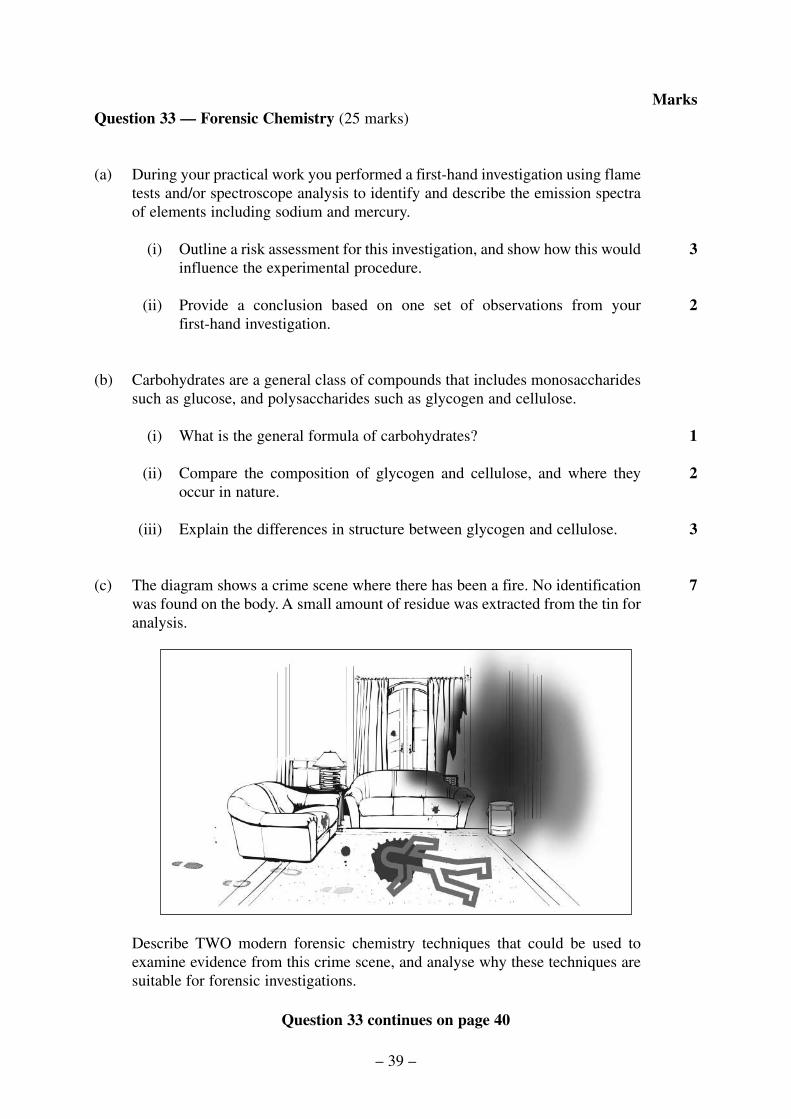
(c) The diagram shows a crime scene where there has been a fire. No identificationwas found on the body. A small amount of residue was extracted from the tin foranalysis.
Describe TWO modern forensic chemistry techniques that could be used toexamine evidence from this crime scene, and analyse why these techniques aresuitable for forensic investigations.
Question 33 continues on page 40
7
3
2
1
2
3
– 39 –
Marks
Question 33 (continued)
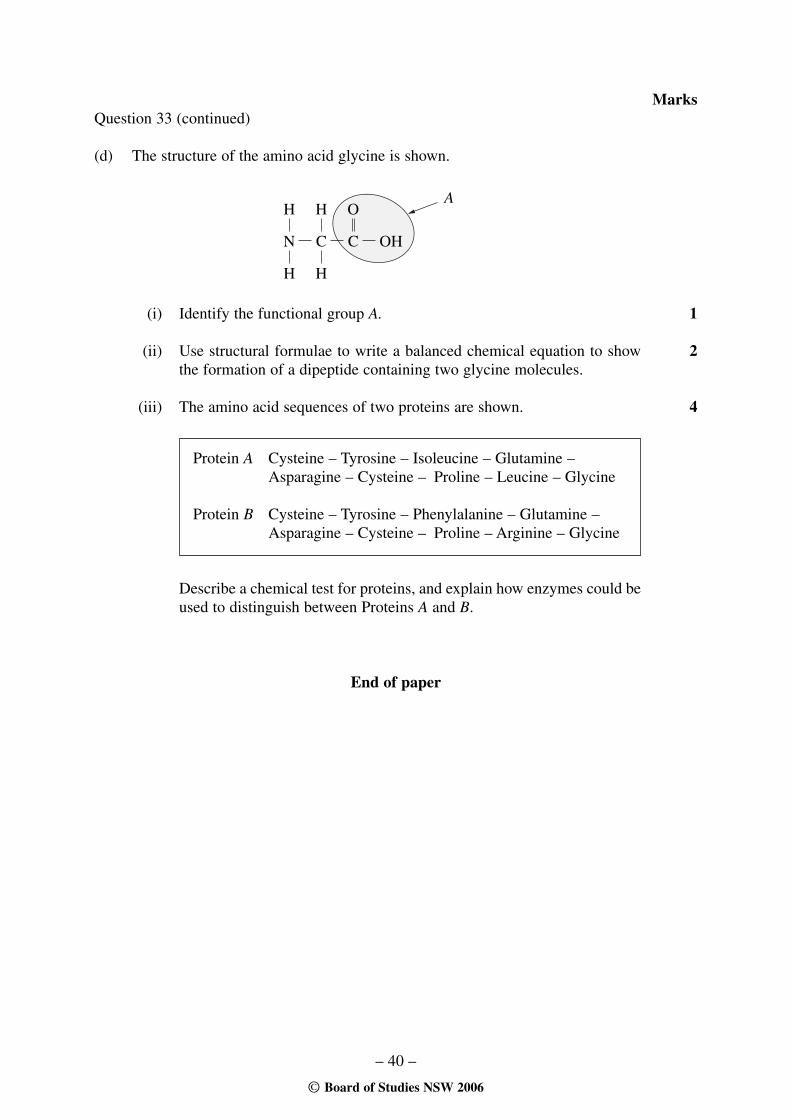
(d) The structure of the amino acid glycine is shown.
(i) Identify the functional group A.
(ii) Use structural formulae to write a balanced chemical equation to showthe formation of a dipeptide containing two glycine molecules.
(iii) The amino acid sequences of two proteins are shown.
Describe a chemical test for proteins, and explain how enzymes could beused to distinguish between Proteins A and B.
End of paper
Protein A Cysteine – Tyrosine – Isoleucine – Glutamine –Asparagine – Cysteine – Proline – Leucine – Glycine
Protein B Cysteine – Tyrosine – Phenylalanine – Glutamine –Asparagine – Cysteine – Proline – Arginine – Glycine
4
2
1
N
H
H
C
H
H
C
O
OH
A
– 40 –
Marks
© Board of Studies NSW 2006
– 41 –
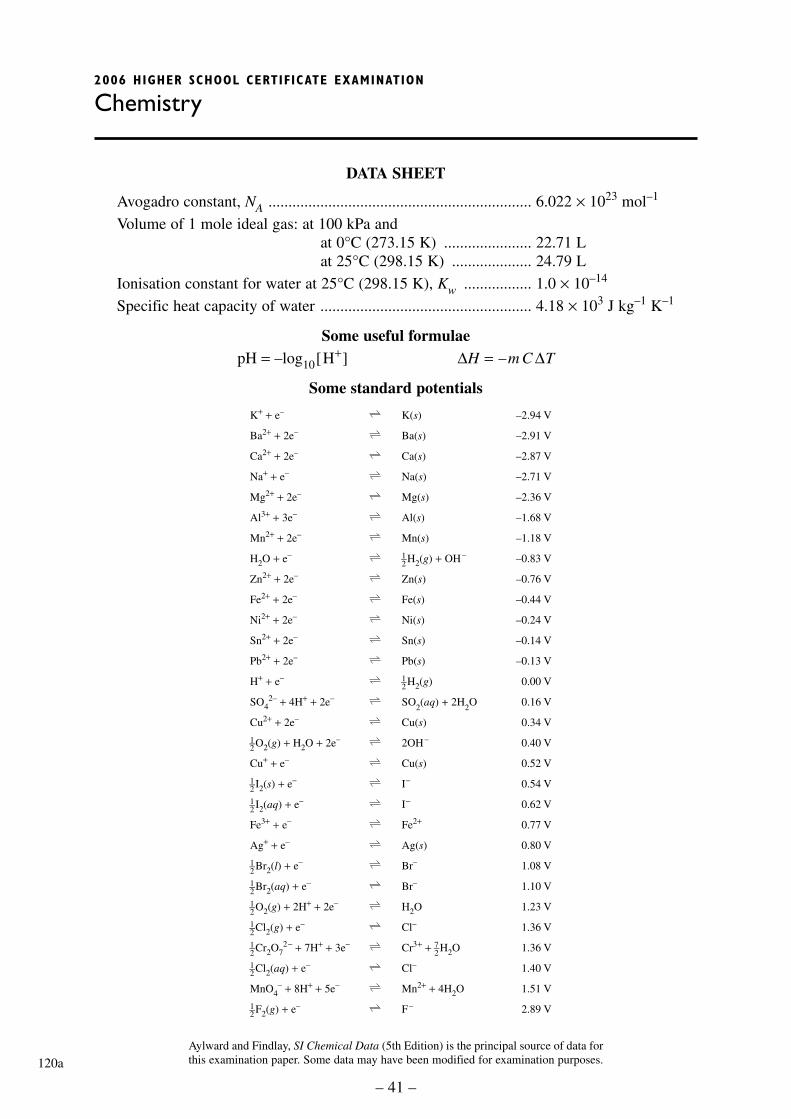
DATA SHEET
Avogadro constant, NA .................................................................. 6.022 × 10²³ mol–1
Volume of 1 mole ideal gas: at 100 kPa andat 0°C (273.15 K) ...................... 22.71 Lat 25°C (298.15 K) .................... 24.79 L
Ionisation constant for water at 25°C (298.15 K), Kw ................. 1.0 × 10⁻¹⁴
Specific heat capacity of water ..................................................... 4.18 × 10³ J kg–1 K–1
Some useful formulaepH = –log10[H+] ΔH = –m C ΔT
Some standard potentials
2006 HIGHER SCHOOL CERTIFICATE EXAMINATION
Chemistry
Aylward and Findlay, SI Chemical Data (5th Edition) is the principal source of data forthis examination paper. Some data may have been modified for examination purposes.120a
K+ + e– K(s) –2.94 V
Ba2+ + 2e– Ba(s) –2.91 V
Ca2+ + 2e– Ca(s) –2.87 V
Na+ + e– Na(s) –2.71 V
Mg2+ + 2e– Mg(s) –2.36 V
Al3+ + 3e– Al(s) –1.68 V
Mn2+ + 2e– Mn(s) –1.18 V
H2O + e– 1–2 H2(g) + OH– –0.83 V
Zn2+ + 2e– Zn(s) –0.76 V
Fe2+ + 2e– Fe(s) –0.44 V
Ni2+ + 2e– Ni(s) –0.24 V
Sn2+ + 2e– Sn(s) –0.14 V
Pb2+ + 2e– Pb(s) –0.13 V
H+ + e– 1–2 H2(g) 0.00 V
SO42– + 4H+ + 2e– SO2(aq) + 2H2O 0.16 V
Cu2+ + 2e– Cu(s) 0.34 V
1–2 O2(g) + H2O + 2e– 2OH– 0.40 V
Cu+ + e– Cu(s) 0.52 V
1–2 I2(s) + e– I– 0.54 V
1–2 I2(aq) + e– I– 0.62 V
Fe3+ + e– Fe2+ 0.77 V
Ag+ + e– Ag(s) 0.80 V
1–2 Br2(l) + e– Br– 1.08 V
1–2 Br2(aq) + e– Br– 1.10 V
1–2 O2(g) + 2H+ + 2e– H2O 1.23 V
1–2 Cl2(g) + e– Cl– 1.36 V
1–2 Cr2O72– + 7H+ + 3e– Cr3+ + 7–2 H2O 1.36 V
1–2 Cl2(aq) + e– Cl– 1.40 V
MnO4– + 8H+ + 5e– Mn2+ + 4H2O 1.51 V
1–2 F2(g) + e– F– 2.89 V

– 42 –
9 F19
.00
Fluo
rine
17 Cl
35.4
5C
hlor
ine
35 Br
79.9
0B
rom
ine
53 I12
6.9
Iodi
ne
85 At
[210
.0]
Ast
atin
e
7 N14
.01
Nitr
ogen
15 P30
.97
Phos
phor
us
33 As
74.9
2A
rsen
ic
51 Sb12
1.8
Ant
imon
y
83 Bi
209.
0B
ism
uth
5 B10
.81
Bor
on
13 Al
26.9
8A
lum
iniu
m
31 Ga
69.7
2G
alliu
m
49 In11
4.8
Indi
um
81 Tl
204.
4T
halli
um
107
Bh
[264
.1]
Boh
rium
108
Hs
[277
]H
assi
um
109
Mt
[268
]M
eitn
eriu
m
110
Ds
[271
]D
arm
stad
tium
111
Rg
[272
]R
oent
geni
um
87 Fr[2
23.0
]Fr
anci
um
88 Ra
[226
.0]
Rad
ium
89–1
03
Act
inid
es
104
Rf
[261
.1]
Rut
herf
ordi
um
105
Db
[262
.1]
Dub
nium
106
Sg[2
66.1
]Se
abor
gium
57 La
138.
9L
anth
anum
89 Ac
[227
.0]
Act
iniu
m
1 H1.
008
Hyd
roge
n
Sym
bol o
f el
emen
t
Nam
e of
ele
men
t
PE
RIO
DIC
TA
BL
E O
F T
HE
EL
EM
EN
TS
KE
Y
2 He
4.00
3H
eliu
m
3 Li
6.94
1L
ithiu
m
4 Be
9.01
2B
eryl
lium
Ato
mic
Num
ber
Ato
mic
Wei
ght
79 Au
197.
0G
old
6 C12
.01
Car
bon
8 O16
.00
Oxy
gen
10 Ne
20.1
8N
eon
11 Na
22.9
9So
dium
12 Mg
24.3
1M
agne
sium
14 Si28
.09
Silic
on
16 S32
.07
Sulf
ur
18 Ar
39.9
5A
rgon
19 K39
.10
Pota
ssiu
m
20 Ca
40.0
8C
alci
um
21 Sc44
.96
Scan
dium
22 Ti
47.8
7T
itani
um
23 V50
.94
Van
adiu
m
24 Cr
52.0
0C
hrom
ium
25 Mn
54.9
4M
anga
nese
26 Fe55
.85
Iron
27 Co
58.9
3C
obal
t
28 Ni
58.6
9N
icke
l
29 Cu
63.5
5C
oppe
r
30 Zn
65.4
1Z
inc
32 Ge
72.6
4G
erm
aniu
m
34 Se78
.96
Sele
nium
36 Kr
83.8
0K
rypt
on
37 Rb
85.4
7R
ubid
ium
38 Sr87
.62
Stro
ntiu
m
39 Y88
.91
Yttr
ium
40 Zr
91.2
2Z
irco
nium
41 Nb
92.9
1N
iobi
um
42 Mo
95.9
4M
olyb
denu
m
43 Tc
[97.
91]
Tech
netiu
m
44 Ru
101.
1R
uthe
nium
45 Rh
102.
9R
hodi
um
46 Pd10
6.4
Palla
dium
47 Ag
107.
9Si
lver
48 Cd
112.
4C
adm
ium
50 Sn11
8.7
Tin
52 Te12
7.6
Tellu
rium
54 Xe
131.
3X
enon
55 Cs
132.
9C
aesi
um
56 Ba
137.
3B
ariu
m
57–7
1
Lan
than
ides
72 Hf
178.
5H
afni
um
73 Ta18
0.9
Tant
alum
74 W18
3.8
Tun
gste
n
75 Re
186.
2R
heni
um
76 Os
190.
2O
smiu
m
77 Ir19
2.2
Irid
ium
78 Pt19
5.1
Plat
inum
79 Au
197.
0G
old
80 Hg
200.
6M
ercu
ry
82 Pb20
7.2
Lea
d
84 Po[2
09.0
]Po
loni
um
86 Rn
[222
.0]
Rad
on
58 Ce
140.
1C
eriu
m
59 Pr14
0.9
Pras
eody
miu
m
60 Nd
144.
2N
eody
miu
m
61 Pm[1
44.9
]Pr
omet
hium
62 Sm 150.
4Sa
mar
ium
63 Eu
152.
0E
urop
ium
64 Gd
157.
3G
adol
iniu
m
65 Tb
158.
9Te
rbiu
m
66 Dy
162.
5D
yspr
osiu
m
67 Ho
164.
9H
olm
ium
68 Er
167.
3E
rbiu
m
69 Tm
168.
9T
huliu
m
70 Yb
173.
0Y
tterb
ium
71 Lu
175.
0L
utet
ium
90 Th
232.
0T
hori
um
91 Pa23
1.0
Prot
actin
ium
92 U23
8.0
Ura
nium
93 Np
[237
.0]
Nep
tuni
um
94 Pu[2
44.1
]Pl
uton
ium
95 Am
[243
.1]
Am
eric
ium
96 Cm
[247
.1]
Cur
ium
97 Bk
[247
.1]
Ber
keliu
m
98 Cf
[251
.1]
Cal
ifor
nium
99 Es
[252
.1]
Ein
stei
nium
100
Fm[2
57.1
]Fe
rmiu
m
101
Md
[258
.1]
Men
dele
vium
102
No
[259
.1]
Nob
eliu
m
103
Lr
[262
.1]
Law
renc
ium
Act
inid
es
Lan
than
ides
Whe
re th
e at
omic
wei
ght i
s no
t kno
wn,
the
rela
tive
atom
ic m
ass
of th
e m
ost c
omm
on r
adio
activ
e is
otop
e is
sho
wn
in b
rack
ets.
The
ato
mic
wei
ghts
of
Np
and
Tc
are
give
n fo
r th
e is
otop
es 23
7 Np
and
99T
c.