Embed Size (px)
Citation preview

CHEMISTRY. INNOVATION. SOLUTIONS.
NDIC OGRE Grant PresentationDecember 16, 2020
2
Creedence Energy Services EOR
Biosurfactant Applications
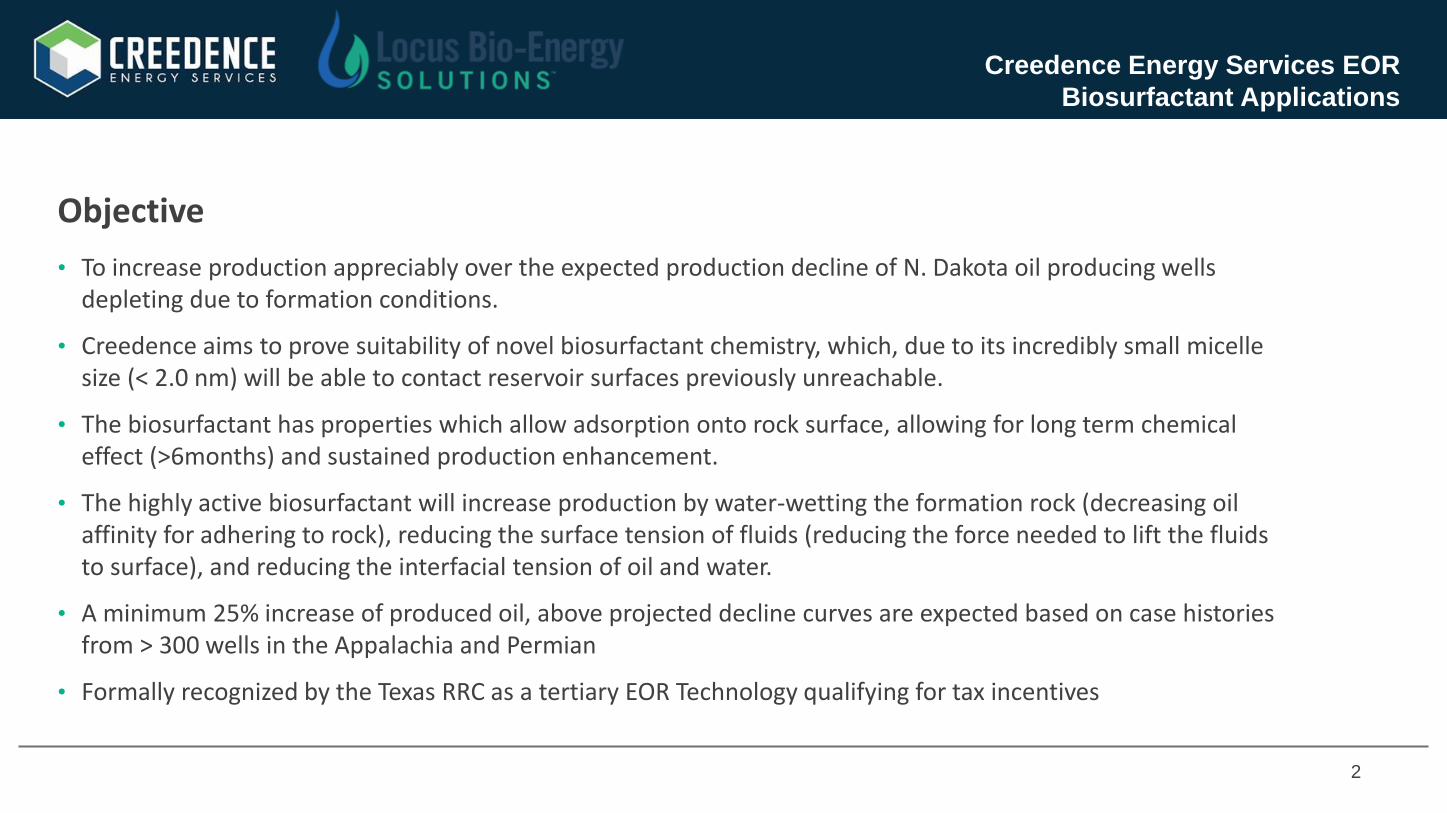
Objective
• To increase production appreciably over the expected production decline of N. Dakota oil producing wells depleting due to formation conditions.
• Creedence aims to prove suitability of novel biosurfactant chemistry, which, due to its incredibly small micelle size (< 2.0 nm) will be able to contact reservoir surfaces previously unreachable.
• The biosurfactant has properties which allow adsorption onto rock surface, allowing for long term chemical effect (>6months) and sustained production enhancement.
• The highly active biosurfactant will increase production by water-wetting the formation rock (decreasing oil affinity for adhering to rock), reducing the surface tension of fluids (reducing the force needed to lift the fluids to surface), and reducing the interfacial tension of oil and water.
• A minimum 25% increase of produced oil, above projected decline curves are expected based on case histories from > 300 wells in the Appalachia and Permian
• Formally recognized by the Texas RRC as a tertiary EOR Technology qualifying for tax incentives
3
Traditional vs. Biosurfactants
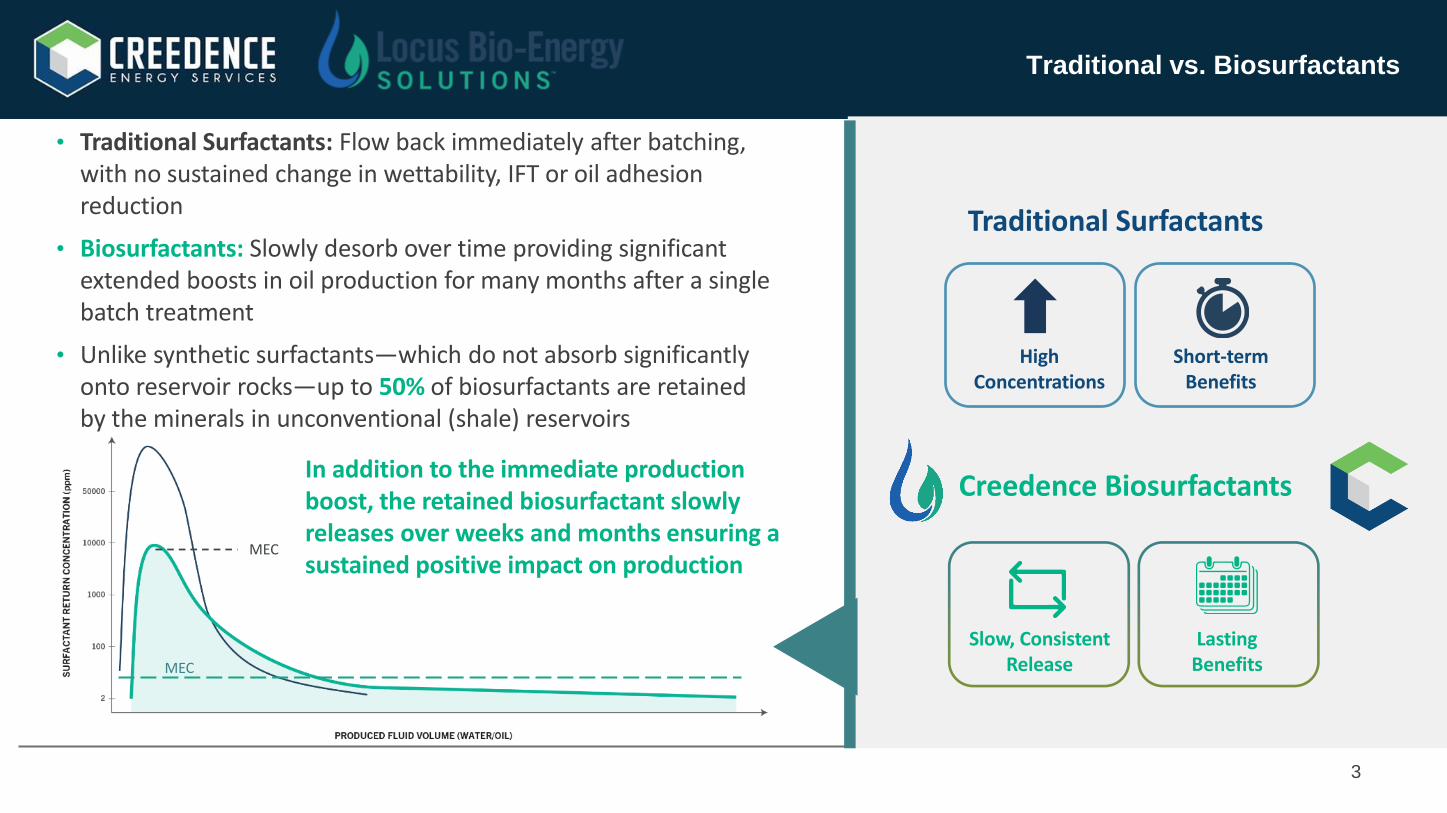
• Traditional Surfactants: Flow back immediately after batching, with no sustained change in wettability, IFT or oil adhesion reduction
• Biosurfactants: Slowly desorb over time providing significant extended boosts in oil production for many months after a single batch treatment
• Unlike synthetic surfactants—which do not absorb significantly onto reservoir rocks—up to 50% of biosurfactants are retained by the minerals in unconventional (shale) reservoirs
Traditional Surfactants
Creedence Biosurfactants
High Concentrations
Short-term Benefits
Slow, Consistent Release
Lasting Benefits
In addition to the immediate production boost, the retained biosurfactant slowly releases over weeks and months ensuring a sustained positive impact on production
MEC
MEC

41 Source: Advances in Colloid and Interface Science, 2018, 256, 1–22) 2 Source : Structure of Sophorolipid Micelles Characterized with SAXS, SANS, and MD Simulations”, J. Phys. Chem. B, 2015,119(41),13113-13133.
3 Source: Li et al., Journal of the Taiwan Institute of Chemical Engineers, 2017, 78, 317–328. http://dx.doi.org/10.1016/j.jtice.2017.06.024
Biosurfactants: Smaller Micelle Size for Better Penetration and Oil Mobilization
Biosurfactants can penetrate pores as small as 2 nm
Creedence Biosurfactants
1.2 nm
Creedence biosurfactants can penetrate into the smallest nanopores and mobilize oil that other treatments cannot.
Most Wolfcamp Pore Sizes3
Range From 3-40 nm
Smaller Micelle size and lower dosage requirements mean biosurfactants can penetrate and mobilize oil from even the tightest shale reservoirs
Competitor A (Nano Fluids)
15 - 20 nanometers (nm)
Typical Frac Surfactant
100 nanometers (nm)
Comparative Micelle Sizes
Biosurfactant Differentiation
5
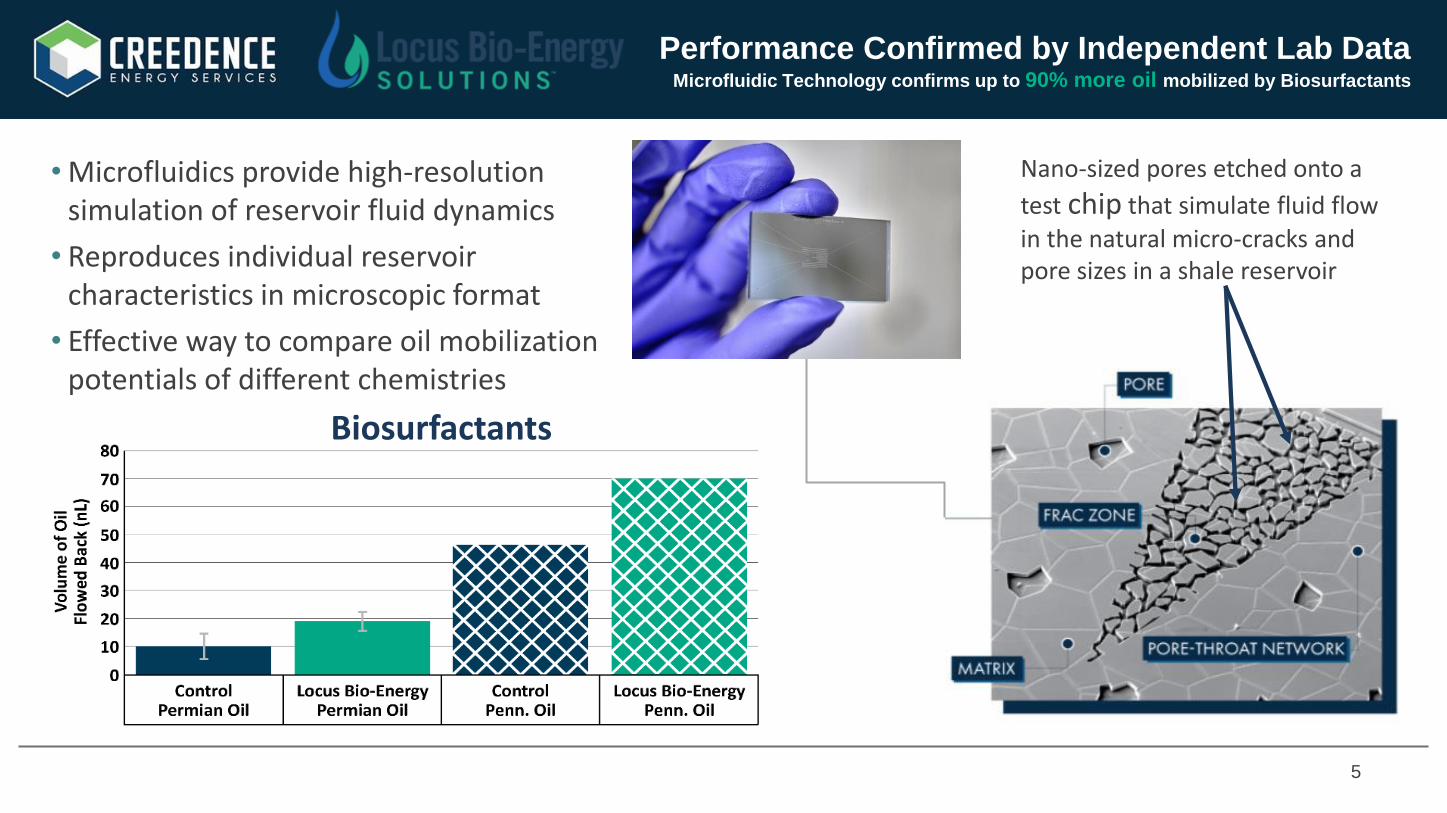
Performance Confirmed by Independent Lab DataMicrofluidic Technology confirms up to 90% more oil mobilized by Biosurfactants
•Microfluidics provide high-resolution simulation of reservoir fluid dynamics
• Reproduces individual reservoir characteristics in microscopic format
• Effective way to compare oil mobilization potentials of different chemistries
Nano-sized pores etched onto a
test chip that simulate fluid flow
in the natural micro-cracks and pore sizes in a shale reservoir
Biosurfactants

6
AssuEORTM: Solution to Declining Production in Conventional Wells
]
Well Production History Before & After Treatments• 70% increase in oil production rates from a
70-well Appalachian lease
• 45 month sustained rate with AssurEOR
treatments
• 45% decline rate pre-treatment
• 9% decline rate post-treatment
• 58,000 incremental bbls recovered using
AssurEOR
7
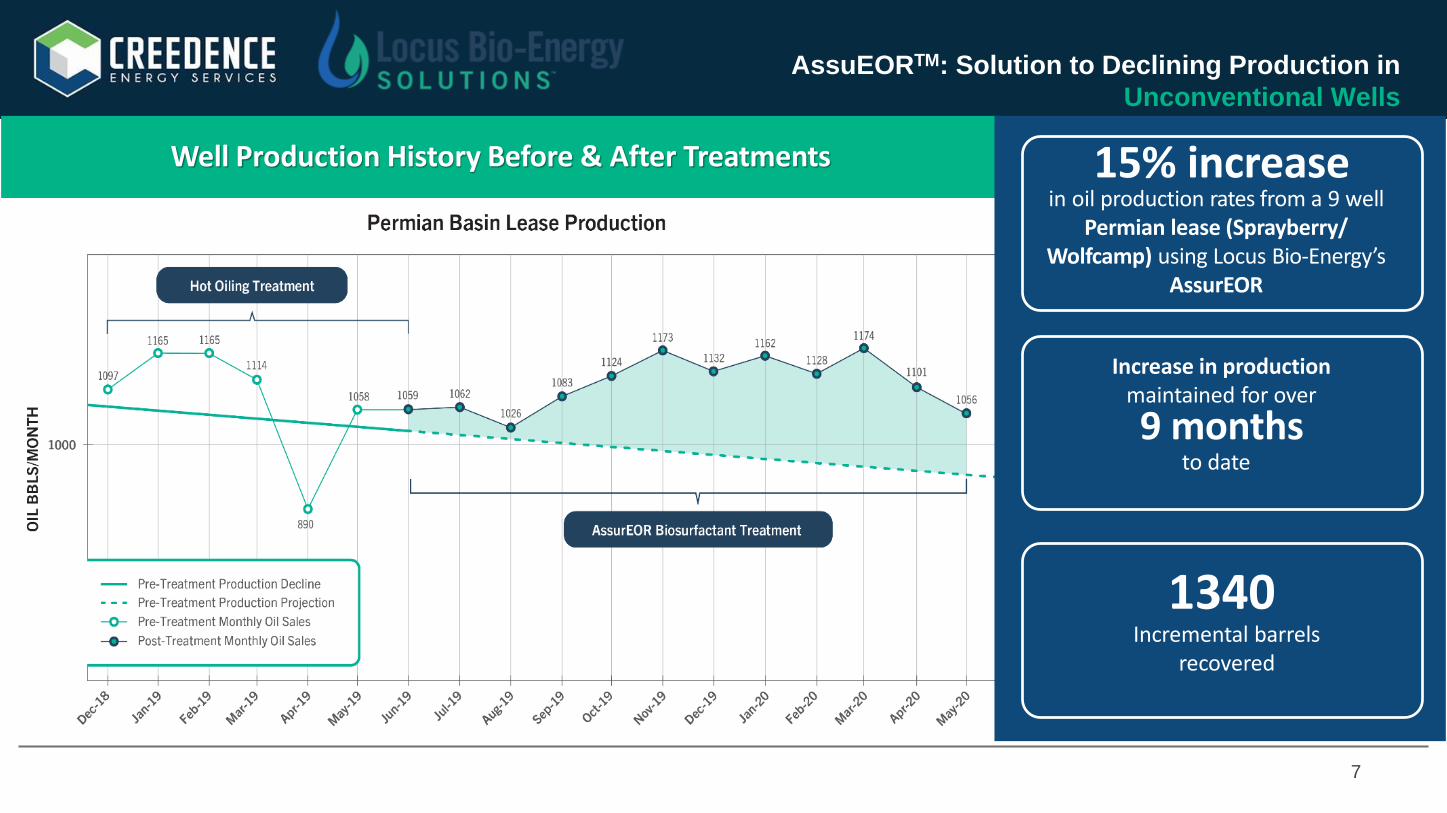
AssuEORTM: Solution to Declining Production in
Unconventional Wells
Well Production History Before & After Treatments 15% increasein oil production rates from a 9 well
Permian lease (Sprayberry/ Wolfcamp) using Locus Bio-Energy’s
AssurEOR
Increase in production maintained for over
9 monthsto date
1340Incremental barrels
recovered

100
1,000
10,000
Aug-14 Aug-15 Jul-16 Jul-17 Jul-18 Jul-19
OIL
(B
BLS
PER
MO
NTH
)
DATE
Forecast
8
Well Information
1-well lease
Glasscock County, TX
Wolfcamp/Sprayberry
Pre-treatment production rate: 21 bpd
Performance
12-month average production rate: 32 bpd
Incremental oil: 4,336 bbls (above forecast)
Payback period: 32 Days @ $35/bbl oil
Percent Increase: 69% (incremental/forecast)
ROI* (3-month period): 2.6
ROI* (12-month period): 8.60
200
400
600
800
1,000
1,200
1,400
1,600
1,800
Jan-17 Apr-17 Jul-17 Oct-17 Jan-18 Apr-18 Jul-18 Oct-18 Jan-19 Apr-19 Jul-19 Oct-19 Jan-20 Apr-20
OIL
(B
BLS
PER
MO
NTH
)
DATE
AssurEOR Case History (1 Well)
*ROI =Incremental revenue/Cost @ $35/bbl oil
Case History 2 – Wolfcamp/Sprayberry
AssuEORTM: Solution to Declining Production in
Shale Wells
9
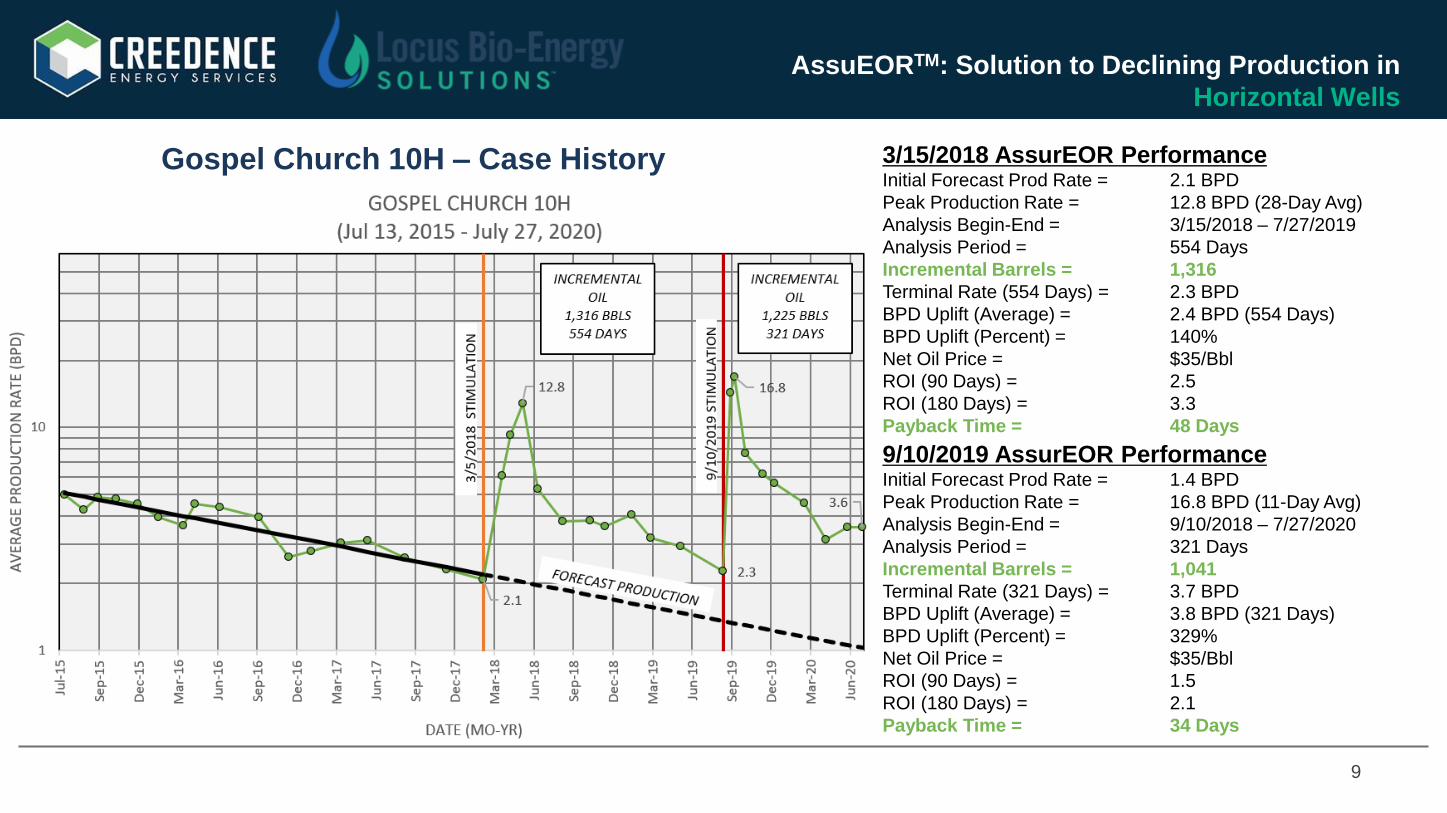
Gospel Church 10H – Case History 3/15/2018 AssurEOR PerformanceInitial Forecast Prod Rate = 2.1 BPD
Peak Production Rate = 12.8 BPD (28-Day Avg)
Analysis Begin-End = 3/15/2018 – 7/27/2019
Analysis Period = 554 Days
Incremental Barrels = 1,316
Terminal Rate (554 Days) = 2.3 BPD
BPD Uplift (Average) = 2.4 BPD (554 Days)
BPD Uplift (Percent) = 140%
Net Oil Price = $35/Bbl
ROI (90 Days) = 2.5
ROI (180 Days) = 3.3
Payback Time = 48 Days
9/10/2019 AssurEOR PerformanceInitial Forecast Prod Rate = 1.4 BPD
Peak Production Rate = 16.8 BPD (11-Day Avg)
Analysis Begin-End = 9/10/2018 – 7/27/2020
Analysis Period = 321 Days
Incremental Barrels = 1,041
Terminal Rate (321 Days) = 3.7 BPD
BPD Uplift (Average) = 3.8 BPD (321 Days)
BPD Uplift (Percent) = 329%
Net Oil Price = $35/Bbl
ROI (90 Days) = 1.5
ROI (180 Days) = 2.1
Payback Time = 34 Days
AssuEORTM: Solution to Declining Production in
Horizontal Wells
10
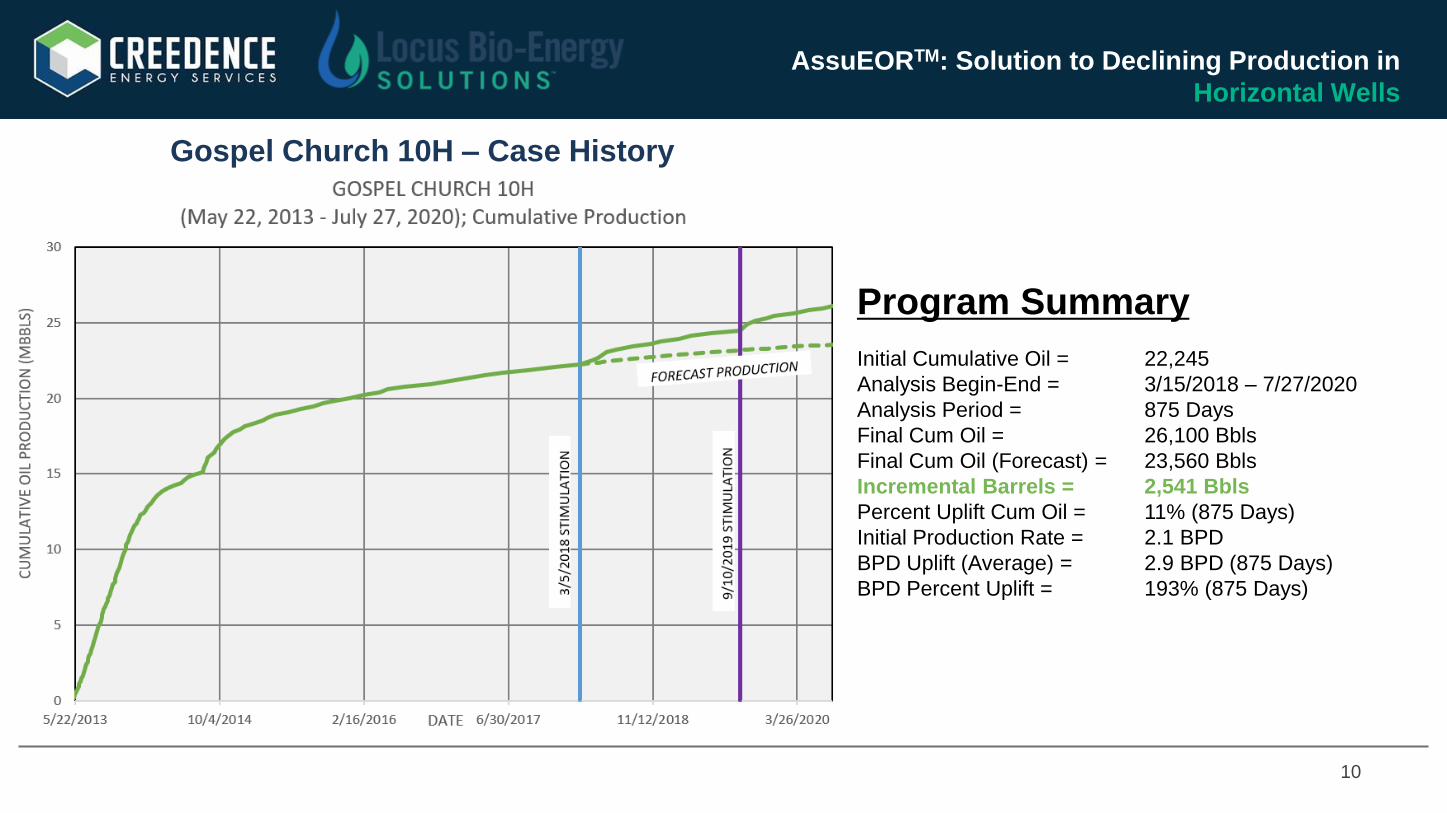
Gospel Church 10H – Case History
Program Summary
Initial Cumulative Oil = 22,245
Analysis Begin-End = 3/15/2018 – 7/27/2020
Analysis Period = 875 Days
Final Cum Oil = 26,100 Bbls
Final Cum Oil (Forecast) = 23,560 Bbls
Incremental Barrels = 2,541 Bbls
Percent Uplift Cum Oil = 11% (875 Days)
Initial Production Rate = 2.1 BPD
BPD Uplift (Average) = 2.9 BPD (875 Days)
BPD Percent Uplift = 193% (875 Days)
AssuEORTM: Solution to Declining Production in
Horizontal Wells

11
North Dakota Oil Production Projections

12
Grant Economics
Project Duration: 6 to 18 months
Total Project Cost: $205,750
• $32,000 for lab equipment
• $112,500 for 50% cost share of 3 proof of concept trials for 2-mile laterals
• $52,500 for 50 % cost share of 3 proof of concept trials for 1-mile laterals
• $8,750 for 50 % cost share of 5 proof of concept trials for 5 vertical wells
Participants: Creedence Energy Services and Locus Bio-Energy Solutions
13
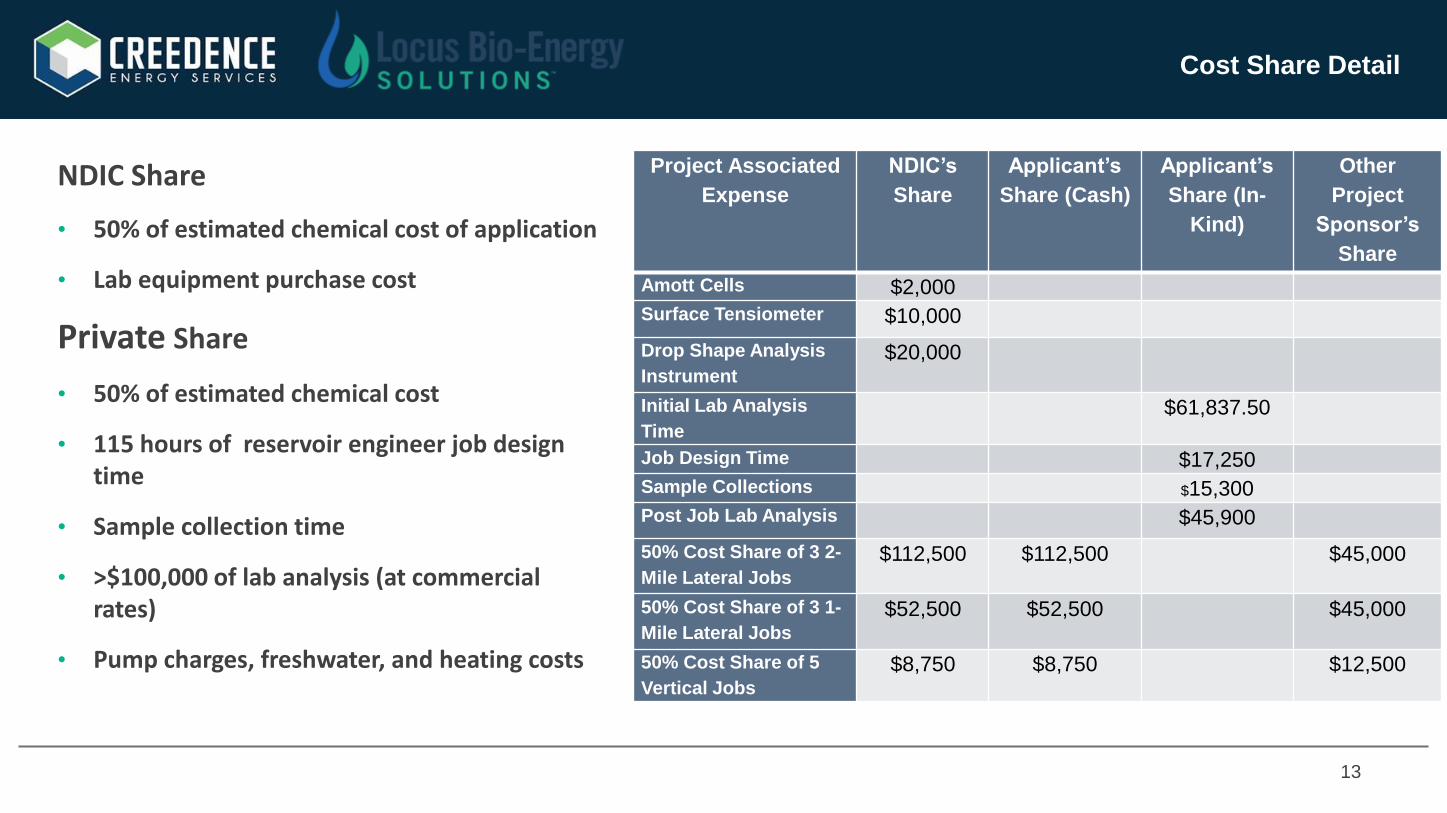
Cost Share Detail
Project Associated
Expense
NDIC’s
Share
Applicant’s
Share (Cash)
Applicant’s
Share (In-
Kind)
Other
Project
Sponsor’s
Share
Amott Cells $2,000
Surface Tensiometer $10,000
Drop Shape Analysis
Instrument
$20,000
Initial Lab Analysis
Time
$61,837.50
Job Design Time $17,250
Sample Collections $15,300
Post Job Lab Analysis $45,900
50% Cost Share of 3 2-
Mile Lateral Jobs
$112,500 $112,500 $45,000
50% Cost Share of 3 1-
Mile Lateral Jobs
$52,500 $52,500 $45,000
50% Cost Share of 5
Vertical Jobs
$8,750 $8,750 $12,500
NDIC Share
• 50% of estimated chemical cost of application
• Lab equipment purchase cost
Private Share
• 50% of estimated chemical cost
• 115 hours of reservoir engineer job design time
• Sample collection time
• >$100,000 of lab analysis (at commercial rates)
• Pump charges, freshwater, and heating costs
14
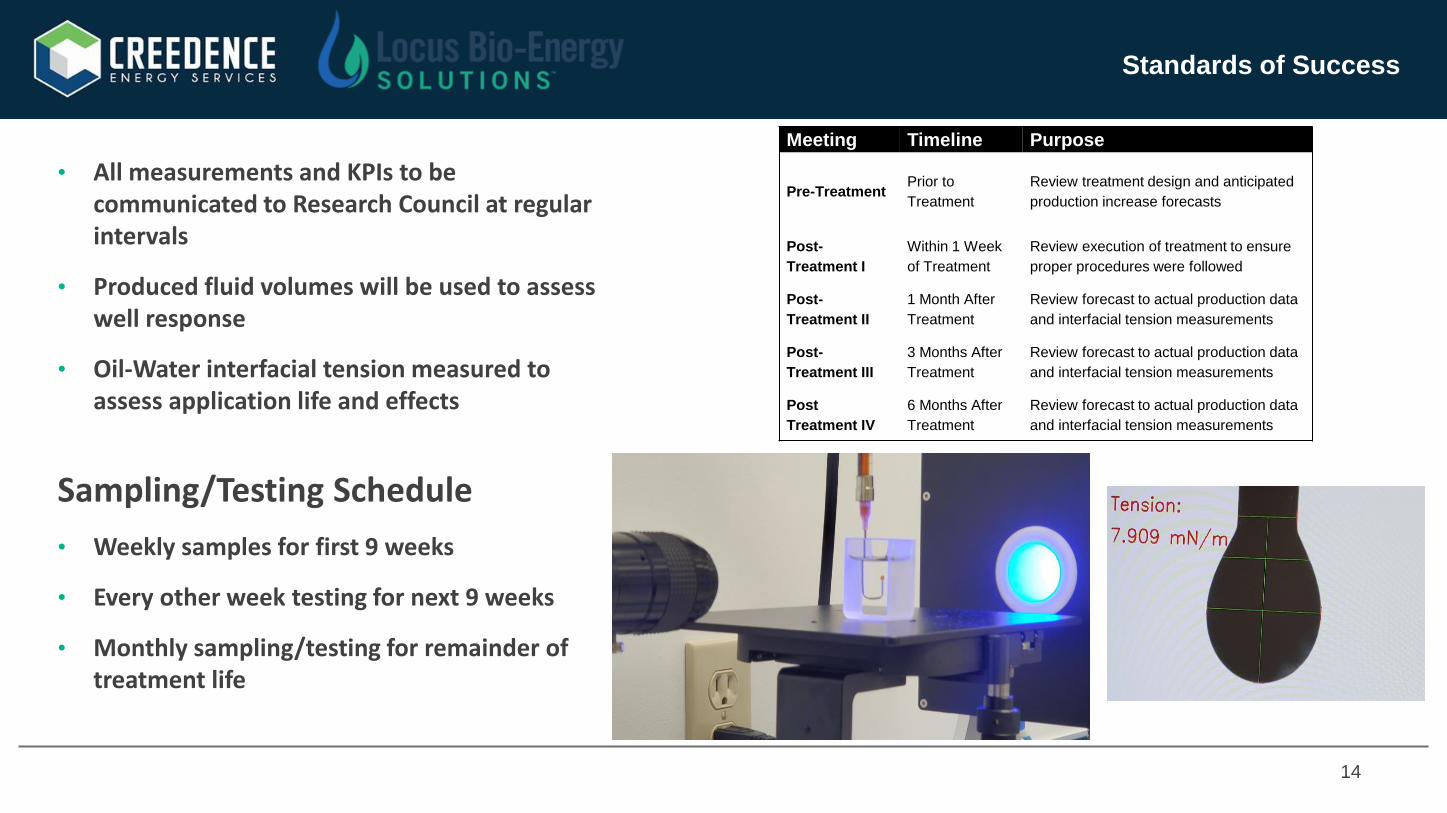
Standards of Success
• All measurements and KPIs to be communicated to Research Council at regular intervals
• Produced fluid volumes will be used to assess well response
• Oil-Water interfacial tension measured to assess application life and effects
Meeting Timeline Purpose
Pre-TreatmentPrior to
Treatment
Review treatment design and anticipated
production increase forecasts
Post-
Treatment I
Within 1 Week
of Treatment
Review execution of treatment to ensure
proper procedures were followed
Post-
Treatment II
1 Month After
Treatment
Review forecast to actual production data
and interfacial tension measurements
Post-
Treatment III
3 Months After
Treatment
Review forecast to actual production data
and interfacial tension measurements
Post
Treatment IV
6 Months After
Treatment
Review forecast to actual production data
and interfacial tension measurements
Sampling/Testing Schedule
• Weekly samples for first 9 weeks
• Every other week testing for next 9 weeks
• Monthly sampling/testing for remainder of treatment life
15
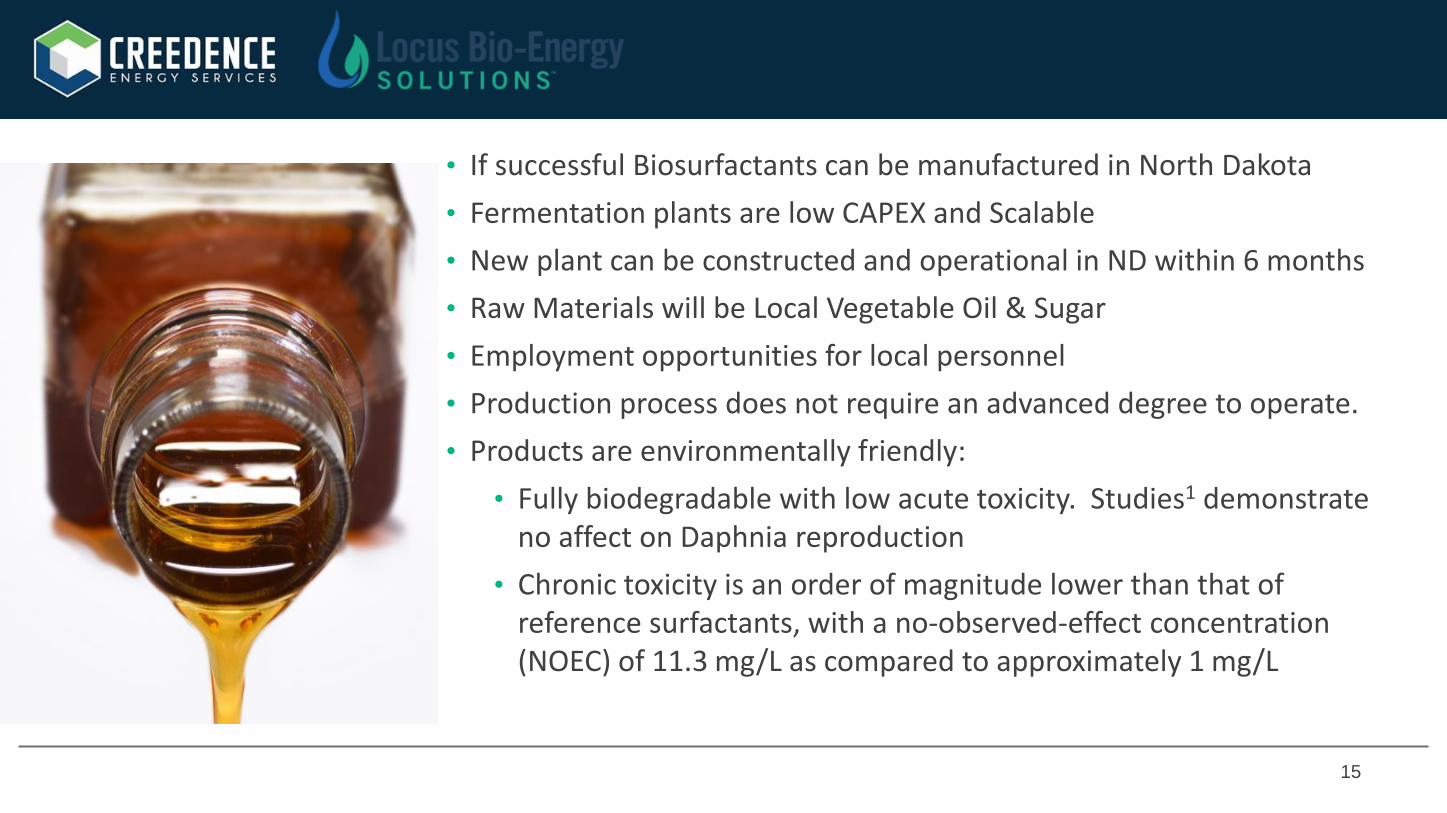
• If successful Biosurfactants can be manufactured in North Dakota
• Fermentation plants are low CAPEX and Scalable
• New plant can be constructed and operational in ND within 6 months
• Raw Materials will be Local Vegetable Oil & Sugar
• Employment opportunities for local personnel
• Production process does not require an advanced degree to operate.
• Products are environmentally friendly:
• Fully biodegradable with low acute toxicity. Studies1 demonstrate no affect on Daphnia reproduction
• Chronic toxicity is an order of magnitude lower than that of reference surfactants, with a no‐observed‐effect concentration (NOEC) of 11.3 mg/L as compared to approximately 1 mg/L
16
Data to Remain Confidential
• Manufacturing Process
• Job Design Parameters
• Chemical Concentration in Treatment Pills
• Chemical Formulations
Confidentiality