Embed Size (px)
Citation preview

Cookbook – Chem_GC 1
Chemistry Lab CookbookGC Notes, v210.0
Instrument:HP 6890 - GC3, NGA
ODP #: 05331, 5330Model #: HP6890
Website:http://www.agilent.com
Software:Chemstation v 9.10
Documentation Available:
Document Name/Title/Number Source Version AssociatedInstrument(s)
AssociatedMeasurement(s)
Down Hole Contaminants in-house n/a (Leg103)
Gaschromatographs
n/a
Electronic Pressure Control in GasChromatography
Hewlett-Packard
Thirdprinting,4/1995
Gaschromatographs
n/a
GC #3 5890/6890 Binder in-house n/a Gaschromatographs
hydrocarbons
GC Calibrations & Std Binder in-house n/a Gaschromatographs
n/a
GC Packed and Capillary Columns in-house n/a Gaschromatographs
hydrocarbons
GC2 Std/Analysis In-house,Hewlett-Packard
n/a Gaschromatographs
n/a
HP 35900B Dual Channel Interface OperatingManual
Hewlett-Packard
Sep-88 Gaschromatographs
n/a
HP 5890 Series II Gas Chromatograph ServiceManual
Hewlett-Packard
1st edition,3/1991
Gaschromatographs
n/a
HP 6890 Series Gas Chromatograph OperatingManual (Volume 1., General Information;Volume 2., Inlets; Volume 3., Detectors)
Hewlett-Packard
Volume 1.:2ndedition,12/97;Volume 2.:1st edition,10/96;Volume 3.:1st edition,10/96
Gaschromatographs
n/a
Cookbook – Chem_GC 2
10/96;Volume 3.:1st edition,10/96
HP 6890 Series Gas Chromatograph ServiceManual
Hewlett-Packard
2ndedition,5/1997
Gaschromatographs
n/a
HP 6890 Series Gas Chromatograph SitePreparation and Installation Manual
Hewlett-Packard
1st edition,4/98
Gaschromatographs
n/a
HP 6890 Troubleshooting and MaintenanceStudent Manual
Hewlett-Packard
Mar-97 Gaschromatographs
n/a
HP ChemStation Misc. Binder In-house,Hewlett-Packard
n/a Gaschromatographs
n/a
HP ChemStation Revision Upgrade Box Set:Installing Your Data Analysis ChemStation;Installing Your A/D Chemstation; Installingand Understading Your HP Chemstation;Understanding Your ChemStation
Hewlett-Packard
Rev.A.06.01;May, 1998
Gaschromatographs
n/a
Hydrocarbon Monitoring & Safety Binder in-house n/a Gaschromatographs
hydrocarbons
Installing Your A/D ChemStation Hewlett-Packard
2ndedition,11/1995
Gaschromatographs
n/a
Installing Your GC Chemstation Hewlett-Packard
May-98 Gaschromatographs
n/a
Installing Your HP Chemstation Hewlett-Packard
May-98 Gaschromatographs
n/a
Macro Programming Guide
Hewlett-Packard
2ndedition,11/1995
Gaschromatographs
n/a
Understanding Your ChemStation Hewlett-Packard
3rd edition,11/1995
Gaschromatographs
n/a
Using The HP-IB Interface and CommandLibrary with DOS
Hewlett-Packard
2ndedition,12/1991
Gaschromatographs
n/a
Valco Valves Binder in-house,Valco
n/a Gaschromatographs
n/a
HP Automatic Liquid Sampler OperatingManual
Hewlett-Packard
Oct-95 Gaschromatographs,GC/MSD
n/a

Cookbook – Chem_GC 3
Notes from HP G1200A Chemstation operation classSeptember, 1994
ANALYTICAL INSTRUMENT CONFIGURATION must identify HP-IB address (HPIB board/HP35900C) must name the instrumentPath creating new subdirectory in path before creating the same subdirectory in File Manager if deleting a subdirectory or method, make sure it was not the active file in the program beforeclosing the instrument session
INSTRUMENTAcquire Data - Execute a pre-run programAnalyze Data -Archive filesReport Result - Execute a post-run program
METHODCurrent Method method which is currently running in memory modified method is different from the method which is under the same name in the memory unless "SAVE" is execute for a modified method, the modification will be lost when loadinganother method when start a run, all aspect of the analysis are controlled by the current method
Default Method read-only file cannot be altered and saved when load default method, instrument parameter are not download to the devices connected tothe Chemstation
Stop - stop data acquisition, but run still continueAbort - stop data acquisition, abort the entire run
DATA ANALYSISSpecify Report In version 3.34, one has options to save an integrated chromatogram as an ASCII file with thesame name as a text file. It is saved with .WMF extension, and it can be exported to othergraphic program assign export destinationList File Infowhen enter comment under Sample/Info, it is printed out on the first generated report, but notsaved with all other information. When export the result file as a ASCII file in other wordprocess program, comment can be copied and pasted through clipboard to other word processprogramList Data collect every single data point generated by the analysis, all points were used by the program forcalculation. It is very useful for troubleshooting.WindowsThe display of the chromatogram

Cookbook – Chem_GC 4
default assignment is#1 lower half of the screen#2 upper half of the screen#3 full screen#4 upper quarter of the screen use Redefine Window to reassign window position, but this can not be saved. Once leave theMain Screen, program automatically reset all four windows to default.Registerstack the four most recent files, W, X, Y, Z one register can contain more than one objects (use MERGE command)Annotate after type in the text, click ADD and click at the desire position on the chromatogram to move it, go back in annotate, click EDIT, notice the text is now highlighted, select the newposition annotate will not be saved with the chromatogram under .WMF file.Integration determine the difference between real signal and noise
Qualitative ratio 3 x (S/N)Quantitative ratio 10 x (S/N)(S - signal and N - random noise)
this is comparison between max and min signal in a specific period of time, and it is under thecondition of ideal (no other interference) Three types of baseline:
chromatographic signalintegration signalelectronic or absolute (from GC)
only the integration baseline can we manipulate and edit Solvent ON/OFF (tangent ON/OFF) is mainly for over riding the default parameter for smallpeaks coming out on the tailing of a large peak. It has to be set before the beginning of the largepeak. Shoulder ON/OFF is for small peaks coming out in the front of a large peak. It has to beassigned before the start of the large peak. Baseline All Valley sets all baseline in valley, useful for baseline drift from oven program Baseline Back is to call baseline back to it initial parameter Peak Width, although it is a time event, it changes gradually instead of efficiently, example ofsetting pw of 0.4 at 30 minuteminute 1 2 5 10 20 30pw 0.04 0.06 0.08 0.1 0.2 0.4 If more than 5 timed integration events (excluding the 4 initial settings). It usually suggest thechromatogram is not optimized, unless it is specified necessary.
SEQUENCE updating the Sequence table and/or Sample table, it affects the Sample Log Table directly autonaming 001 F 01 01
vial position signal sequence line Inj/vial (repeats)(individual vial) (can be R) (injection #)
sequence line acts like a subsequence. It allows one to use the same method and run as manyvials (and as many times of each vial) as one wants. when using explicit re-calibration, the later run STD will replace the previous same STD run

Cookbook – Chem_GC 5
Seq. vial sample inj1 1 STD A 12 2 unk 1 12 3 unk 2 12 4 unk 3 11 1 STD A 1 when run a single sample manually, the Chemstation uses the "current method" whichever isrunning currently. But when run sequence, when "Run Sequence" is selected, the Chemstationwill (1) erase the current method, and (2) load the method from its memory according to theassigned method in the sequence table.
FILE.SMP - sample information.SEQ - sequence table.CAL - method, calibration.CHR - method, instrument parameters.DRN - method, data analysis parameters.EVT - method, integration setpoints.MTH - method, fundamental run information.RCL - method, recalibration information.RPT - method, chromatogram and report output definition informationInstConf.INI - instrument, internal configuration and connected device
LAB EXERCISE(1) If make changes in method in OffLine Copy on integration parameters and save, it willupdate the method. When upload the method or run a sequence into ONLine , the changes madewill be active(2) Oven equiblizing time, 3 minutes default for packed column and 1-1.5 minutes default forcapillary column.(3) Procedure to follow when optimizing integration: initial threshold-initial peakwidth - initialarea rejection - timed program - manual(4) when using manual integration, "MM" will listed as TYPE in the result report(5) Multilevel calibration curve, when linear combine with force origin, R2 is always =1. Ideally,don't force nor include origin but use it as interpretation of blank difference.(6) when run sequence recalibration, In the sequence table, the number entered under Recalibinterval tells the system to recalibrate each time the number of lines is run, the line listed in thetable regardless how many time of injections is entered in each line.(7) Sequence: When reprocess a sequence, the reprocessed files will be called out from thesubdirectory assigned in the sequence table and the new reprocessed files will over-write theoriginal files for the same autonaming system. To avoid this, copy the original files to anothersubdirectory before reprocess.(8) "Explicit recalibration" means irregular re-calibration, specific placing STD in between thesequence, cal line#. Method has to exist for this to be processed.
Cookbook – Chem_GC 6
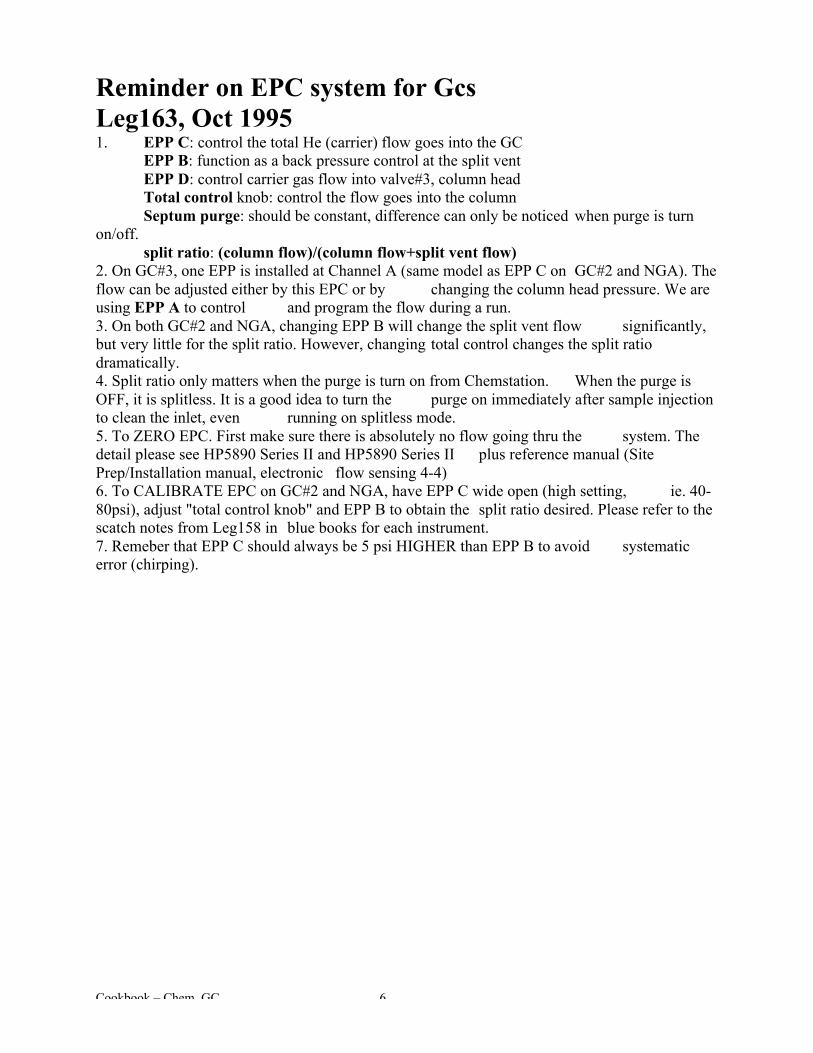
Reminder on EPC system for GcsLeg163, Oct 19951. EPP C: control the total He (carrier) flow goes into the GC
EPP B: function as a back pressure control at the split ventEPP D: control carrier gas flow into valve#3, column headTotal control knob: control the flow goes into the columnSeptum purge: should be constant, difference can only be noticed when purge is turn
on/off.split ratio: (column flow)/(column flow+split vent flow)
2. On GC#3, one EPP is installed at Channel A (same model as EPP C on GC#2 and NGA). Theflow can be adjusted either by this EPC or by changing the column head pressure. We areusing EPP A to control and program the flow during a run.3. On both GC#2 and NGA, changing EPP B will change the split vent flow significantly,but very little for the split ratio. However, changing total control changes the split ratiodramatically.4. Split ratio only matters when the purge is turn on from Chemstation. When the purge isOFF, it is splitless. It is a good idea to turn the purge on immediately after sample injectionto clean the inlet, even running on splitless mode.5. To ZERO EPC. First make sure there is absolutely no flow going thru the system. Thedetail please see HP5890 Series II and HP5890 Series II plus reference manual (SitePrep/Installation manual, electronic flow sensing 4-4)6. To CALIBRATE EPC on GC#2 and NGA, have EPP C wide open (high setting, ie. 40-80psi), adjust "total control knob" and EPP B to obtain the split ratio desired. Please refer to thescatch notes from Leg158 in blue books for each instrument.7. Remeber that EPP C should always be 5 psi HIGHER than EPP B to avoid systematicerror (chirping).

Cookbook – Chem_GC 7
Procedure for entering gas data into JANUS(both GC3 and NGA)
1. In HP Chemstation, enter sample ID in “Sample Info” under “Run Control”. In the CommentWindow, enter the sample ID (the format is very important, as this is parsed directly in JANUS).The fixed digit used for each infor is the number in the bracketLEG(3)SITE(4)HOLE(1)CORE(3)TYPE(1)SEC(2)WR(as whole round)TOP-BOT(no limit)HS.For example 1801108B010R01WR126-127HS
2. In HP Chemstation method “Runtime check list”, make sure both “Save GLP data” and “ Postrun command/Macro [GC3_CSV]” are checked.
3. To ensure the macro is loaded (or to activate the macro), in command line type “MACROGC3_CSV.MAC, GO” and press enter.
4. Both macros are in C:\Hpchem\Core folder.
5. The macro will generate a CSV file at the end of each GC run, and it looks like this:
1801108B010R01WR126-127HS
C:\HPCHEM\GC3\DATA\LEG180\1108\10R1.D18-Jun-98, 09:53:34GC3 FID1 B
901.6 , C10.0 , C2=0.0 , C20.0 , C3=0.0 , C3
6. The CSV file is automatically generated under the pathC:\HPCHEM\GC3\DATA\JANUS\gc300#.csv. The # is a counter. It can be set at any givennumber. To do this, open C:\HPCHEM\Core\Csv_gs3.dat in Notepad. Set the number to desirednumber (we normally reset it to zero in the beginning of the cruise or each site) and save the file.Repeated file number will create an error.
7.When finish a GC run, go to JANUS-Chemistry-Gas. Select “File Input” under Mode. Querythe desire CSV file under “Enter Input File”. Press “Read File”. The sample ID and data will beloaded, and a Status window will appear. If there is a verification problem, the error will appearin red instead of black. If everything is loaded properly, press “Save Input” to load the data intothe database. Again, message will appear in the Status Window.
8. And you are done.....

Cookbook – Chem_GC 8
Leg 185 GC2/ECD Set Up Summary
The HP 5890 Series II GC2 was brought from the Chemistry Lab to the Microbiology Lab to analyzeperfluorocarbons from contamination tests. It is now named GC2/ECD.
In the HP Configuration, GC2/ECD is configured as Instrument 1 with an HPIB address of 14. A newECD directory was set up with Methods, Data, and Sequence subdirectories while the old GC2 directorywas renamed GC2_OLD and archived both on the C:\ drive of PC124 and in the Chem Lab folder on theTECH Volume.
GC2/ECD was plumbed directly from the back of the instrument to a Nitrogen bottle with Alltech Oxy-trap and a molecular sieve S-trap in line.
During Leg 184, GC2 was fitted with an Electron Capture Detector (ECD), a flow manifold blockassembly and an ECD chemical filter, but it was never tested. Proper ratio of make up/anode purge gas forthe ECD took time to establish but the problem was solved once a leak was fixed at the o-ring connectingthe N2 carrier tubing to the ECD chemical trap.
At the beginning of this Leg, the GC was configured for alkenone separation with a 50m x 0.2mm x0.11mm film Ultra 1 cross-linked methyl silicone gum column. The Autosampler was connected to theinlet. It was decided quickly by scientists to do manual injections so the autosampler was removed. It isnow stored above the GC/MSD.
The HP Ultra 1 column was replaced by the Al2O3 HP PLOT column (used to be in NGA before Leg170) at the request of the scientists. The column dimensions are: 15m x 0.53mm (ID) x 15mm film.Nitrogen was chosen by the scientists as the carrier gas.
With the new column in place, the EPC which regulates the capillary inlet flow, could not keep uppressure. A leak was suspected at the injector. The injector was cleaned, a new liner and gold seal wereinstalled, but the EPC still could not keep up pressure. It was then noticed that the total flow knob hadbeen turned off completely (thank guys!). Opening the total flow and adjusting the EPPC and EPPB tolower settings, than those used with the Ulta 1 column, did the trick. The column was baked out severaltimes using PLOTBAKE.m. See GC2/ECD Book #1 for details.
Method development was long and tedious. As we had no standard procedures for PFTs separation onPLOT column, the approach was basically trial and error. Instrument parameters were mostly derivedfrom Colwell et al. (1992). Most of the testing was done by the two scientists.
The GC2/ECD method in use is called ECD_185.m. The run time is 4.5 min.Operating parameters are as follows:
- Nitrogen supply at bottle: 50 psi; EPPC: 10 psi; EPPB: 3psi.; Column flow : 6.7 ml/min Septum purge flow : 3 ml/min ECD make-up flow: 69.9 ml/min Anode purge flow: 6.9 ml/mn (anode flow automatically sets itself to 1/10 of the make up flow value) Injector temperature:180°C; Initial Oven Temperature: 120°C, no hold; Oven Temperature Ramping: 20°C/min to150°C, hold time of 3 min; Detector temperature: 250°C.
Cookbook – Chem_GC 9
The samples/standards were manually injected using either 500µl or 5 ml gas-tight syringes (Hamilton).The injection was splitless.
Quantification of the perfluorocarbon was done based on a set of standards prepared as indicated below.
Perfluoro(cyclomethyhexane) standards were prepared by diluting 100 µL of the PFT with 9.9 mL ofmethanol in a headspace vial (=10- 2 vol:vol). The vial was mixed on a vortex mixer for 1 minute. Serialdilutions using 100 µL of the previous solution diluted with 9.9 mL of methanol resulted in a series ofPFT solutions (10- 4, 10- 6, 10- 8, 10- 10, 10- 12 vol:vol). Each headspace vial was thoroughly mixedprior to transferring the 100µL to the next vial.
From these standards, 15 µL were added to 15 mL of distilled water in headspace vials and immediatelysealed. The vials were heated at 70°C in a oven and aliquots (50, 500 or 5,000 µL) of the headspace wereinjected into the GC using gas-tight syringes that were also heated in the oven. The total amount of PFTinjected into the GC was calculated based on the PFT dilution in the vial and the fraction of the headspacethat was injected.
The perfluorocarbon retention time on the column is around 2.7 min. Measured peak area is linear withPFT headspace abundance over four orders of magnitude. Based on duplicate analysis of standards, therelative measurement error is 20% and the detection limit approximately 10- 12 g PFT.
Sample Analysis was done on hard rock and sediment samples.
Whole rock samples and the crushed interior sections of the rocks were heated at 70°C and 5mL of theheadspace gas was removed and injected into the GC. After injecting, the vials were weighed todetermine the total amount of rock in each vial.
Sediment samples were collected with a toothpick from a whole round at the bottom of a core section onthe catwalk. From each whole round, a sample was taken between the core liner and the core, from thecenter of the core and/or midway between the interior and the exterior of the core. These samples wereimmediately were placed into headspace vials and sealed. Both the headspace vials containing the sampleand the gas tight syringes used to inject them were heated to 70°C in a oven. Five ml of headspace gaswas drawn and injected into the GC. After the analysis, the vials were weighed to determine the amountof sediment in each vial. The amount of PFT in each vial was normalized to the weight of the sample.The headspace volume was calculated by subtracting the volume of sediment from the total volume of thevial. The total PFT in each vial was calculated by dividing by the fraction of the total headspace that wasinjected.
For more details, refer to the GC2/ECD PFT Analyses binder, GC2/ECD blue book, Leg 185Microbiology Lab Tech Report and Leg 185 Microbiology Contamination Report

Cookbook – Chem_GC 10
Leg 185 GC3 Set Up Summary
GC3, a 5890 Series II Plus GC, was replaced this Leg by an new HP 6890 Series GC. The name of thenew instrument remains GC3 to accommodate for the post run macros that use the GC3 name in the datahandling and transfer to Janus.The new GC3 was plumbed with copper tubing directly from the back of the instrument to the alreadyexisting regulators on the back “wall”.
The regulators pressures are set up as follows: He supply at bottle: 105psi He supply at regulator: 90psi Air supply (Jun-Air) at regulator: 55psi H2 supply at regulator: 23psi.
There are no S-traps or chemical traps in line as in the case of the HP 5890 GC. The small 12" molecularsieve trap on top of the 6890 GC seems to replace the S traps.
GC3 is now configured with a 8’ 1/8” HaySep “R” packed column coated with 80/100 mesh. Theinjection is done via a 1/16” Valco union connected to a Valco-to-Luer lock syringe adaptor. This injectorconnects to a 10-port Valco valve which is switched pneumatically by a Digital Valve Interface (no moreHP actuator) hooked up to ship’s air (via clear plastic tubing connected to green one). Samples areintroduced via a 0.25cc sample loop connected to the Valco valve. The Valco valve (Valve 5) can beswitched to backflush the column (OFF position). GC3 is equipped with an EPC to control flow to thepurged packed inlet.. Hydrocarbon separation is detected by an FID (FID1A as Signal 1).
The HP ChemStation used to run the new GC3 is still Version 5.04. Version 6 was not installed becauseof potential licensing problems encountered at each new install. Version 6.0 also does not provide anyuseful feature that warranties us wasting our time learning again a new version of HP ChemStation. In theHP Configuration, GC3 is configured as Instrument 2 with an HPIB address of 10. A new GC3 directorywas set up with Methods, Data, and Sequence subdirectories while the old GC3 directory was renamedGC3_OLD and archived both on the C:\ drive of PC113 and in the Chem Lab folder on the new TECHVolume.
All post run macros necessary for Janus data transfer are located in the CORE subdirectory of theHPCHEM directory (those for NGA too).
The GC3 method in use is GC3_185.M with a run time of 13.65mn. Operating conditions are as follows:
Injector Temperature: 120˚C; Total Flow: 30.5ml/mn; Column Flow: 30 ml/mn, Constant Mode selected; Initial Oven Temperature: 120˚C, hold time of 3.60mn; Oven Ramping: 30˚C/mn to 140˚C (hold for 0.80mn), 30˚C/mn to 120˚C (hold for3.20mn), 28˚C/mn to 140 (hold for 4mn); Detector Temperature: 250˚C; FID signal reads around 7 to 8; Hydrogen Flow: 40ml/mn; Air Flow: 400ml/mn; No Make Up gas; Valve 5 turned ON at 0.01mn, OFF at 7mn
The GC3 calibration was performed at the beginning of the Leg for standards A, B, C, D, 30%, 50% and70%.

Cookbook – Chem_GC 11
How to run Headspace Samples:
After the headspace has been in the oven for 30 minutes, remove the vial and prepare to inject the samplein either the GC3 or NGA gas chromatographs.
Toggle between the different open programs; GC3 (online), NGA (online), ODP - Chemistry application(JANUS) at the command bar to acess these 3 programs.
The overall sequence for the operation would be to set up the correct sample number, run the headspacesample on either the GC3 or NGA, look at the the chromatographic trace and correct it if necessary, makea report file and place this file into the JANUS database..
GC3:
Make sure you are in the Method and Run Control window. In the upper menu, select Run Control.Select Sample Info.This will bring up the screen to enter the sample and file names
Two things to do: 1. Change the Filename (Signal 1) to the appropriate name;ie. “1H5HS.D” (use either H or X depending on coring technique)
2. Change the Comment to the same name as the sample ID;ie. “1751075A1H5W0.0-5.0HS”
Then hit OK
These numbers and letters represent the Leg (175), the Site and Hole (1075A), the Core and Section(1H5), the Working Half (W), the Sampled Interval (0.0 - 5.0 cm), and the type of sample (HS orVAC).
Iinject 5 ml of headspace while keeping the flow control between 30 and 40 units and hit the STARTbutton on the GC.
When the GC run is done the analysis must be checked for accuracy. First check your numbers on thescreen printout, then CLOSE the printout and go to the View menu and select Data Analysis to look atthe GC trace. The only buttons you should click on are: 1) the zoom in and out button to enlarge orreduce a chosen chromatogram, 2 ) the X button to delete a chosen peak area integration information, 3)to integral button to reintegrate a peak area use the mouse and draw a new baseline, when your relaese themouse, the peak is automatically integrated, and the 4) split peak button used to split double peak at thevalley.
After correcting the chromatogram hit Report and Print Report.
From the prepared report you will need to manually write down the values for C1 to C3 on the clipboard.At a later date you will need to add these values to the program on the Mac at the desk so that you willhave a file of headspace data to work with at your leisure.
The data is now ready to be sent to the JANUS Database, select Janus on the command bar. (see JANUSsection for directions).

Cookbook – Chem_GC 12
NGA:
Select RunControl (on top of screen), then select Sample Info.Two things to do: 1. Change the Filename (Signal 1) to the appropriate name;
ie. “5H4VAC.D”Note: The NGA uses vacutainer samples (VAC) instead of HS.2. Change the Comment to the same name as the filename;
ie. “1751075A5H4W57.0-58.0VAC”
These numbers and letters represent the Leg (175), the Site and Hole (1075A), the Core and Section(5H4), the Working Half (W), the Sampled Interval (57.0 - 58.0 cm), and the type of sample (VAC).
After the run is finished you need to check your numbers on the printout and the chromatograms. (In DataAnalysis window). If everything is ok, manually write down the values for C1 to C7 on the clipboard.You will need to add these values to the program on the Mac at the desk so that you will have a file ofvacutainer data to work with at your leisure. If you need to reintegrate a peak, use the buttons in theintegral mode to do so and reprint a report. If a peak of interest has not been integrated, it may be becauseits retention time has shifted. You will need to go in the calibration mode (accessed by clicking on theBalance button in the Data Analysis window) and change the retention time of the peak to the newappropriate retention time by typing its new value in the calibration table. DO NOT use any of thecalibration buttons!!!!
The data is now ready to be sent to the JANUS Database.
JANUS Database:
GC3 or NGA Data -
Go to the JANUS Database screen. Select Query (upper right hand of the screen). This next screen allowsyou to select the directory that the data generated from GC3 or NGA is stored. The Directory should looklike either:
“c:hpchem\gc3\data\janus” for the GC3, or“c:hpchem\nga\data\janus” for the NGA.
The data file will look like “nga0012.csv” or “gc30008.csv”. Always select the latest, or largest number,datafile; ie. nga0033.csv should be taken instead of nga0032.csv. The GC program automatically assignsits latest run with the next sequential number.
You can move between the GC3 and NGA directories by double-clicking on the directory name that youwant to change and selecting the new directory from the list, then double clicking it.
Makee sure the File Input Mode is selected. On the left side of the “Select File for Upload” screen scrolldown and select the .csv file that you want. Then select “OK” to enter this file..
Select the button “Read File”. After the file is read, select “Done” on the Chem File Load Status window(NEVER HIT “DONE” ON THE BOTTOM FIVE SELECTIONS). Look at the screen and confirm thatall the numbers and values are correct. Next, select “Save Input”. Once the input has been saved, hit theupper “Done”in the Chem File Load Status window (NEVER HIT “DONE” ON THE BOTTOM FIVESELECTIONS) and you are ready for the next run by toggling back with the ALT and TAB keys back toeither GC3 or NGA chromatographs.
Cookbook – Chem_GC 13
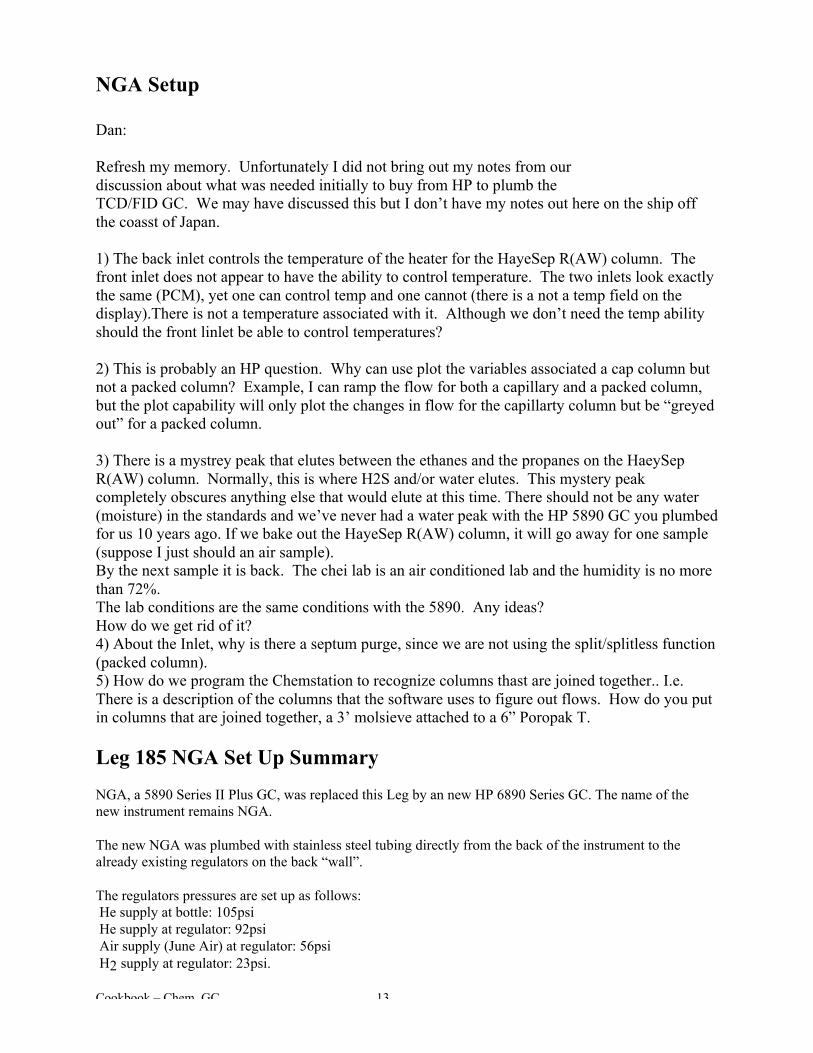
NGA Setup
Dan:
Refresh my memory. Unfortunately I did not bring out my notes from ourdiscussion about what was needed initially to buy from HP to plumb theTCD/FID GC. We may have discussed this but I don’t have my notes out here on the ship offthe coasst of Japan.
1) The back inlet controls the temperature of the heater for the HayeSep R(AW) column. Thefront inlet does not appear to have the ability to control temperature. The two inlets look exactlythe same (PCM), yet one can control temp and one cannot (there is a not a temp field on thedisplay).There is not a temperature associated with it. Although we don’t need the temp abilityshould the front linlet be able to control temperatures?
2) This is probably an HP question. Why can use plot the variables associated a cap column butnot a packed column? Example, I can ramp the flow for both a capillary and a packed column,but the plot capability will only plot the changes in flow for the capillarty column but be “greyedout” for a packed column.
3) There is a mystrey peak that elutes between the ethanes and the propanes on the HaeySepR(AW) column. Normally, this is where H2S and/or water elutes. This mystery peakcompletely obscures anything else that would elute at this time. There should not be any water(moisture) in the standards and we’ve never had a water peak with the HP 5890 GC you plumbedfor us 10 years ago. If we bake out the HayeSep R(AW) column, it will go away for one sample(suppose I just should an air sample).By the next sample it is back. The chei lab is an air conditioned lab and the humidity is no morethan 72%.The lab conditions are the same conditions with the 5890. Any ideas?How do we get rid of it?4) About the Inlet, why is there a septum purge, since we are not using the split/splitless function(packed column).5) How do we program the Chemstation to recognize columns thast are joined together.. I.e.There is a description of the columns that the software uses to figure out flows. How do you putin columns that are joined together, a 3’ molsieve attached to a 6” Poropak T.
Leg 185 NGA Set Up Summary
NGA, a 5890 Series II Plus GC, was replaced this Leg by an new HP 6890 Series GC. The name of thenew instrument remains NGA.
The new NGA was plumbed with stainless steel tubing directly from the back of the instrument to thealready existing regulators on the back “wall”.
The regulators pressures are set up as follows: He supply at bottle: 105psi He supply at regulator: 92psi Air supply (June Air) at regulator: 56psi H2 supply at regulator: 23psi.
Cookbook – Chem_GC 14
NGA is configured as a multi-valve and multi-column GC. It is equipped with both a TCD (TCD1B asSignal 1) and an FID (FID2A as Signal 2).
A multiple Valco valving system is used to direct flows to the different columns and sample loops. Valve1, 3, and 4 are on the top of the GC, valve 2 is on the left side of the GC. They are all actuated with DVIshooked up to ship’s air.
The little box on the right side of the NGA (BRIC 24 4C Hamlin) replaces the INTEG D3C 19405BEvent Controller.
The multi column system as described on the Booker diagram includes: a SGE 50QC3 BP-1 capillary column with dimensions of 60m x 0.32mm (ID) x 0.1 um (film thickness). a 6” stainless steel column packed with Poropak T (50/80 mesh) in line with a 3’ column packed withMolecular Sieve 13X (60/80 mesh); and - a 6’ stainless steel column packed with HaySep R (80/100 mesh);
The injection is done via a 1/16” Valco union connected to a Valco-to-Luer lock syringe adaptor. Thisinjector connects to the 6-port Valco valve (V1) switched pneumatically by the GSV DVI . When V1 is inthe Load (OFF) position, samples will be introduced onto the columns via three sample loops (0.25cc,1cc, and 0.5 cc). When V1 is in the Inject position (ON), the sample will be loaded onto the capillarycolumn for separation of C1 to C7. Valve 2 (V2) is a 4-port Valco valve that can be switched (using theCAP BF VLV DVI) to backflush the capillary column (OFF position). Valve 3 (V3) is an 8-port Valcovalve connected to a 1 cc sample loop and the Haysep R column which is used to separate air andmethane from CO2, ethylene, ethane, H2S, propylene and propane. After Propane has eluted, V3 isswitched OFF (using the 6FT HSI(RAW) DVI) to backflush the Haysep column. Valve 4 (V4) is a 10-port Vaco valve connected to a 0.5 cc sample loop and the Poropak T and Molecular Sieve columns thatare used to separate N2, O2, methane and CO. Valve 4 is switched OFF (using the Col T x13 DVI)immediately after V3 is opened to backflush the columns.
Thermal AUX 1 is the heated zone for Valve 1 and 4 with a recommend temperature of 110˚C (max175˚C). Thermal AUX 2 is the heated zone for Valve 3 with a recommend temperature of 110˚C (max175˚C). The Back Inlet heated zone, where the Haysep R column is located, has a recommendedmaximum temperature of 80˚C. AUX 3 functions as an EPC for flow into capillary column with arecommend setting of 15 psi. AUX 4 functions as an ON/OFF switch for the He purge (refer to Chieh’semail on NGA).
In the HP Configuration, NGA is configured as Instrument 1 with an HPIB address of 5. A new NGAdirectory was set up with Methods, Data, and Sequence subdirectories while the old NGA directory wasrenamed NGA_OLD and archived both on the C:\ drive of PC113 and in the Chem Lab folder on theTECH Volume.
The NGA method was not fully developed this Leg. 185_3.m is the method currently loaded in memory.Run time is 16mn. A lot of parameters were set based on Dan Aiken’s method 3 (March 23, 1999) storedin the GC (see GC1 Book #3 for copy of Dan’s parameters). The 185_3.m method parameters are set asfollows:
• Column 1 -- Capillary Column
- Front Inlet Pressure: 12.5 psi; Column Flow: 1.5 ml/mn, Constant Mode selected; Initial Oven Temperature: 40˚C, hold time of 10mn;- Oven Ramping: 10˚C/mn to 100˚C, no hold; Front Detector Temperature: 250˚C;

Cookbook – Chem_GC 15
FID signal reads around 7 to 8; Hydrogen Flow: 40ml/mn; Air Flow: 400ml/mn; Make Up gas: 50 ml/mn; AUX1 OFF; AUX 3 set at 13 psi; AUX 4 OFF.
Note: Dan Aiken’s methods recorded in the 6890 GC memory show capillary column dimension of 30mx 0.320mm ID. The column in place was not calibrated because we are not exactly sure of its truedimensions. AUX1 is set at 50˚C in Dan Aiken’s method but it has been turned off as the actual value is65˚C.
• Column 2 -- Packed Columns
- Back Inlet Temperature : 80˚C; Column Flow: 30 ml/mn, Constant Mode selected; Initial Oven Temperature: 40˚C, hold time of 10mn; Oven Ramping: 10˚C/mn to 100˚C, no hold; Back Detector Temperature: 150˚C; TCD signal reads around 30 to 40; Reference Flow: 30ml/mn; Make Up gas: 0 ml/mn;
• Run Time Table
- At 0.01 mn, valve 4 is turned ON; At 0.07 mn, valve 1 is turned ON; At 0.08 mn, valve 2 is turned ON; At 2.00 mn, valve 3 is turned ON; At 2.06 mn, valve 4 is turned OFF; At 11.00 mn, valve 3 is turned OFF; At 11.00 mn, valve 1 is turned OFF; At 11.01 mn, valve 2 is turned OFF.
Notes:
- HP ChemStation requires that the operator defines the column parameters (type and dimensions) atinstallation. Since the contraption of the three packed columns cannot be defined in the software, the inletis flow-controlled only, i.e. you can only select two modes for the column: constant flow and ramp flow.That is why the column flow was set to 30ml/mn and a constant flow mode selected.
The TCD signal is very high compared to the signal value of the TCD on the 5890 GC (1.5). We cannotfind a way, in the software or the hardware, to set low and high sensitivities for the TCD like we use to beable to on the 5890 GC. The HP on-line help of the 6890 GC seems to indicate that sensitivity is linked tofilament temperature. Between 150˚C to 200˚C, the filament is at low setting, above 200˚C, the filamentis at high setting, or whatever that means!
A few standards were injected using 185_3.m. Examples of FID and TCD chromatograms for both the185_3.m method used on the 6890 GC and the TCD184.m method used with the 5890 GC are stored forcomparison in the NGA three ring binder.
The chromatography for the TCD on the 6890 GC is not very good. Peaks in general are not wellseparated and are tailing. Because the sensitivities cannot be adjusted to high, C2=, C2, C3=, C3 are very

Cookbook – Chem_GC 16
small compared to the O2, N2, C1 and air peaks. Also C3= and C3 elute as one peak?
The chromatography for the FID on the 6890 is better but definitively can use some improvement.Separation between C1 and C2 is poor. There is no separation between C2= and C2, and between C3=and C3. If working on the chromatography does not improve the separation, we suggest to install thespare J&W DB-1 column stored above the GC/MSD.
Notes:
The FID flame goes OFF when valve V1 switches; For some annoying reason, HP ChemStation has assigned FID 2A to the FID signal and TCD 1B to theTCD for the 6890 GC. FID 2B and TCD 1A used to be the signal assignments for the 5890 GC. Thecalibration table does not adjust for these signal changes, therefore a new calibration table will have to bedesigned from scratch once you have the final methodology figured out.
Performing a Recalibration Using HP ChemStationv.179
At the beginning of each Leg and prior to arriving at the first site, GC3 and NGA have to be recalibrated.Calibration is done using the HP ChemStation (HP Chem) by injecting standards of increasingconcentrations into the GCs.
The first step to perform before actually starting the calibration is the set up the various GC3 and NGAdirectories (methods and data) that will be used for the specific Leg. To set up the HP ChemStationdirectories for the GC3 and NGA, proceed as follows:
- Double click on the “HPChem Directory” icon on the desktop, and select either the NGA or the GC3directory. In both their Data and Methods directories, create a Leg directory (Leg 179 for example). Copythe last method file (i.e., folder.m) used in the previous Leg in the Methods directories. Then double clickon the “HP Configuration Editor” icon on the desktop (all HP Chem sessions have to be closed for theEditor to open), and select Path under the Configure menu. To the usual Data and Method path, add theLeg directory. For example, the data directory path for the GC3 on Leg 179 will read:C:\hpchem\GC3\data\leg179, the method directory path for the GC3 will readC:\hpchem\GC3\methods\leg179. Make sure you save the new configuration under the File menu.
Start GC3 and NGA by double clicking on the “Online” icons for each instrument. Go to the MethodMenu (in Method and Run Control window) and load the last method used. In the case of GC3 forexample, load GC3_178.m (from the subdirectory Leg 179), save it as GC3_179.m. Use that new methodto recalibrate GC3. Before you start the recalibration create a standard subdirectory (CALIB) in theSample Info window (under the Run Control menu in the Method and Run Control window), where allthe standards runs will be stored. Also, for each site you can create a site (and then a calib) subdirectory inthe Sample Info window.
1. Calibrating GC3
The following standards are usually used to calibrate GC3: A, B, C, D, B3-3, 30%, 50%, 70% and 99%.The calibration can be done with a few or all standards, but in any case it should be performed with aminimum of two standards. The concentrations for these gases are listed on the “Multi Component Gas”table hooked to the shelf above the HP Chem computer.
To explain how to perform a (re)calibration, we will use the example of the Leg 179 calibration.

Cookbook – Chem_GC 17
Before starting the (re)calibration, print the old calibration in the method you have just renamed. To doso, select Print Method under the Method Menu and select Calibration Data in the Data Analysis box andclick on Print. Selecting the Check All button will print the entire method. Printout 1 shows the old 178calibration table. It gives additional information such as the last calibration modification date (whichdoes not imply last recalibration date), quantification mode (ESTD based on peak area), absolute andrelative values for reference and non-reference windows, curve fitting type (usually piecewise), and origintreatment (usually included in response curve), etc.
We will use the example of level 1 to illustrate the recalibration of a particular level. Note that each levelin the calibration table represents a specific standard. In printout 1, Level 1 represents standard A, level 2--standard B, level 3--standard C, level 4--standard D, level 5--standard 30%, level 6--standard 50%, andlevel 7--standard 70%. Also, HP Chem assigns a unique peak number to each peak (i.e., component) inthe calibration table in order of elution. Peak 1 measures Methane (C1), peak 2--Ethylene (C2=), peak 3--Ethane (C2), peak 4--Propylene (C3=), and peak 5--Propane (C3). The peak # are not displayed in theprintout for some reason.
To recalibrate any level, we inject three times the standard of interest.To recalibrate a level (level 1--standard A-- in this example), proceed as follows:
Under the Run Control menu (in Method and Run Control window), select Sample Info and specify thefilename for the run in the Signal 1 box (STDA1, STDA2 etc..). Do not change the Sample Parametersand do not enter a Comment. Inject the standard A three times. After each run, print the report. HP Chemwill automatically display the report on the screen at the end of each run. To print this report, select Printat the bottom right of the screen and then close the report;
Examine both the area counts and concentrations of the three run for a particular standard to check if theruns are reproducible and to see how close the concentrations obtained in the three runs are to thetheoretical concentrations listed on the “Multi Component Gas” table. If the area counts andconcentration values are not consistent from one run to the other, keep injecting the standard till you havegood reproducibility. A reproducibility and accuracy of 5% are acceptable but ideally the accuracy shouldbe 2%. If the accuracy and reproducibility are higher then 5%, the instrument needs to be recalibrated forthat particular standard. Printout 2 shows the reports of the three runs for standard A (level 1). TheReproducibility is acceptable but accuracy is way over 10%, GC3 needs to be recalibrated for level 1.Usually if one level is uncalibrated, there is a great likelihood that all levels need recalibration;
Load one of the three data files for level 1. To do so, go to the View menu and select Data Analysis. Thiswill change the Method and Run Control window to the Data Analysis window with an all new set ofmenus. Under the File menu, select Load Signal. From the scrolling table, select one data file for level 1,STDA2.D for example. From the Calibration menu, select Recalibrate. This option will be used to updatethe existing calibration table. In the message box that appears, select Replace. The existing calibrationdata is subsequently replaced by the new calibration data. Be sure to specify the level for which you wantto update the data in the existing calibration table. In this example, enter 1 and click OK. The softwarewill ask you whether to save the updated calibration table to the current method, select Yes. A calibrationreport is prompted on the screen, close it. Then print a report for the standard you just recalibrated. UnderReport, select Print Report to print on the screen. All the concentrations for that standard (STDA2) shouldnow be equal to the theoretical concentrations;
Load one of the other two standards you run for level 1 (STDA1.D for example). The run isautomatically integrated by HP Chem but you should always check the software’s integration and beprepared to manually reintegrate it. Selecting Print Report under Report will prompt the report of thereintegrated run on the screen. To actually print the report, select Print at the bottom right of the window.Printout 3 shows the report for STDA1 after replacing the calibration data in the calibration table using

Cookbook – Chem_GC 18
STDA2. If the concentration values are very close to the theoretical values (as shown on printout 3), goto the Calibration Menu and select Recalibrate. This time select Average in the Recalibrate box for level1, and click on OK. New calibration data is then averaged with the existing calibration data. Again print areport for STDA1 to see how close the new concentrations are to the theoretical values (see Printout 4);
Load the remaining standard run (STDA3.D) and proceed as described in the above paragraph;
Recalibrate all other levels if necessary in the same way you did level 1;
View the calibration curve of each peak (component) in the calibration table to make sure yourcalibration is good (in case of GC3, it should be linear). To do so, select Calibration Table from theCalibration menu (or click on the Calibration tool which looks like a balance) . The calibration table isdisplayed with the calibration plots located on the right window. You can view a particular peak'scalibration curve by highlighting that particular peak in the table. You can zoom/unzoom portion of thecurve using the cursor;
Save the method with the updated calibration table (GC3_179.m). Using View, go back to the Methodand Run Control window, and under Method, select Save Method, then Print Method to send it to theprinter (Printout 5).
2. Calibrating the NGA
The first step before starting the calibration of the NGA is to print the old calibration table included in theNGA method. One method is used to run the equipment with one calibration table but in fact the NGAcalibration will involve two calibrations: an FID calibration and a TCD calibration. Because the NGA hastwo detectors (TCD and FID), there are two signals acquiring data (Signal 1 and Signal 2). Signal 1 on theinstrument refers to the TCD and Signal 2 refers to the FID. In the calibration table screen of HP Chem,when a peak was provided by a particular signal, it will be labelled appropriately with either FID2 B orTCD1 A. However, when the calibration table is printed, #1 and #2 replace the signal denomination.CAREFUL!! On the printout Sig 1 will now refer to the FID2 B signal and Sig 2 to the TCD1 A signal.See printout 6.
The following standards are usually used to calibrate the NGA: B, C, D, B3-3, 30%, 50%, 70% and 99%.As with GC3, to recalibrate any level, we inject three times (minimum) the standard of interest. Makesure you specify a filename for each run in the Sample Info menu. There is only one file name for bothSignal 1 and Signal 2. We usually perform the FID calibration first.
2.1. FID Calibration
The DB1 capillary column in the NGA is used to separate small quantities of C1 through C3hydrocarbons and any quantity of C4 to C10 hydrocarbons. These hydrocarbons are detected by the FIDdetector whose signal is integrated by HP ChemStation.
For recalibrating a level, proceed as follows:
In the Data Analysis window, select Load Data File under the File Menu. In the Load Data window,select the option Full so you can see the file name and the signal information windows. Select the threefiles referring to the 3 runs for one particular level (STDD1R.D, STDD2R.D and STDD3R.D forexample) and each time you load a particular file, select also FID2 B in the signal window. Print thereports;
Examine both the area counts and concentrations of the three run for a particular standard to check forreproducibility and accuracy. If the accuracy and reproducibility are higher then 5%, the instrument needs

Cookbook – Chem_GC 19
to be recalibrated for that particular standard. Often, some calibrated peaks will not be found by thesoftware. This is a frequent occurrence when running samples with the NGA. The software hasdifficulties integrating two groups of peaks (C1-C2-C2= and C3-C3=) because these peaks have closeretention times. These peaks have to be reintegrated manually.
Let's take the example of the old 178 calibration to show how to perform a manual reintegration. Thepeaks C1, C2 and C2= have close retention times (3.026, 3.075 and 3.101 in printout 6) and often the C2,C2= components elute as a bimodal peak that has to be manually separated.
To reintegrate these three peaks manually, using the integration tool bar (obtained by clicking on theIntegration button that looks like a Integral sign) proceed as follows:
Click on the Zoom In (magnifying glass with a plus sign) button to magnify the portion of thechromatogram containing the three peaks. Then click on the Delete Peak button (button at the extremeright of the tool bar with a red X) to delete the peak from the integration results. You can delete individualpeaks by clicking on each independently or you can delete all three at a time by drawing a rectanglearound the three peaks to be deleted. When you click the mouse, the retention time and baseline will begone;
Click on the Manual Integration button (the first one to the right of the white arrow) and redraw thebaseline of the three peaks a you think they should be integrated. To redraw a baseline, press the leftmouse button at the beginning of the peak and then move the mouse to the endpoint of the peak. A rubberband line anchored at the first point will follow the cursor to graphically show the location of the baseline.Releasing the left mouse button will reintegrate the peak; For the bimodal peak that needs to be separated (C2-C2= peak), after you have redrawn the baseline forthat bimodal peak, click on the Split Peak button (the one directly to the left of the Delete Peak button).With the cursor, pick the spot (bottom of valley) where you want to split the pick. When you click the leftmouse button, a dropline will split the peak into two peaks which are then automatically integrated.
The HP Chemstation does not save your manual integration, that is why once you have manuallyreintegrated one of the standard run, you have to update the calibration table immediately with that run.Proceed from there on as described above for GC3.
2.2. TCD Calibration
The TCD will detect O2, N2, C1, CO2, C2, C2=, H2S, C3 and C3=. To calibrate the TCD, you proceed asdescribed in the FID calibration section.
In summary:
Load and print the three data files for the each standard while selecting the TCD1 A option; Manually reintegrate where necessary (the software will often have trouble integrating O2, N2 and C1); Replace or Average the standard run using Recalibration under the Calibration Menu to update the TCDcalibration table; and Review the calibration curves. Save and Print the updated method with the new calibration table.

Cookbook – Chem_GC 20
S1 S2T Y P E I I
Immature
Mature
Semi Mature

Cookbook – Chem_GC 21
S1 S2TYPE I
Immature
Mature
Semi Mature

Cookbook – Chem_GC 22
S1TYPE III S2
Immature
Semi Mature
Mature
Document Information:
Author, Original:Version Number, Original: N/ARevision History:
210:Chris Bennight
Signature (Department Supervisor)