Embed Size (px)
Citation preview

147
Chemostratigraphy of the Upper Carboniferous Schooner Formation, southern North Sea
T. J. Pearce,1 D. Wray,2 K. Ratcliffe,1 D. K. Wright,1 A. Moscariello3
1. Chemostrat Ltd, Units 3–4, Llanfyllin Enterprise Park, Llanfyllin, Powys, SY22 5DD ([email protected])2. Department of Earth Sciences, University of Greenwich, Chatham Maritime, Kent, ME4 4TB
3. Research & Technical Services, Shell International Exploration & Production, Volmerlaan 8, PO Box 60,2289 AB Rijswijk, The Netherlands
Traditionally, interwell correlation for most reservoir sequencesis achieved by using a combination of seismic, wireline log,biostratigraphical and sedimentological data. However, thesetechniques cannot always produce the required resolution fordetailed stratigraphical modelling, particularly when dealingwith barren fluvial sequences. Furthermore, the occurrence ofthick monotonous successions of sandstones and mudstones,with repetitive wireline log characteristics and no prominentseismic reflectors, often makes correlating such sequences diffi-cult. To refine the stratigraphy of such successions, palaeomag-netism (Hauger et al. 1994), heavy-mineral analysis (Morton1985, 1991, Morton & Hallsworth 1994, Mange-Rajetzky 1995,Morton & Hurst 1995) and isotopic techniques (Mearns 1988,1989) are often utilized, although their success is often ham-pered by poor sample quality, insufficient sample volume, ordependency upon a specific lithology. Consequently, a methodis needed that can generate independent stratigraphical frame-works for barren well sections (and fossiliferous successions)and is not restricted by sample type. Such a method is chemicalstratigraphy, or as it is more commonly known, chemostratigra-phy.
This paper presents the results of a chemostratigraphicalinvestigation on the virtually barren continental mudstones andsandstones that make up the Upper Carboniferous SchoonerFormation (or “Barren Red Measures”) from the Silver PitBasin, southern North Sea. These deposits form an ideal subjecton which to test chemostratigraphy, as the sandstones representsignificant gas plays, but their interwell correlation has provednotoriously difficult. Geochemical data are acquired from themudstones and sandstones, and those data related to detritalminerals are used to erect a correlative chemostratigraphicalzonation for the Schooner Formation. Furthermore, integrationof these data with sedimentological information shows how thedepositional environments, weathering styles and pedogenic
processes have affected sediment geochemistry. Pearce et al.(2005) incorporated the data presented herein into a multidiscipli-nary study utilizing palynology, clay-mineral data, heavy-mineraldata and Sm–Nd isotope data to produce a new stratigraphicalzonation and provenance model for the Schooner Formation.
1. Chemostratigraphy and correlation
For some time, bulk inorganic geochemical data have been usedin correlating sequences (Pettijohn 1975), although the rela-tively recent advent of more efficient analytical techniques hasresulted in more accurate data of this type being obtained. Thesetechniques are inductively coupled plasma-optical emissionspectrometry (ICP–OES) and inductively coupled plasma mass-spectrometry (ICP–MS): they enable data to be acquired for themajor elements and many trace elements. Chemostratigraphyhas been applied to barren continental sequences (Ehrenberg &Siring 1992, Racey et al. 1995, Preston et al. 1998, Pearce et al.1999, Ratcliffe et al. in press), although thick, rapidly depositeddeltaic and marine sequences with poor biostratigraphical reso-lution also prove to be good subjects for chemostratigraphicalstudies (Pearce 1991, Pearce & Jarvis 1992a,b, 1995). Andrew etal. (1996) used chemostratigraphy in the Surat and Bowen basinsin Australia to distinguish between Triassic Rewan and Show-ground formations for the purposes of petroleum exploration insequences where conventional techniques such as lithostra-tigraphical, wireline and biostratigraphical analysis failed.Chemostratigraphy has also been applied to the correlation oftuffs in the Permian Newcastle and Wollombi Coal Measures inNew South Wales in order to refine existing lithostratigraphicalcorrelations (Kramer et al. 2001).
Summary
The virtually barren, mainly redbed sequences of the Schooner Formation (Upper Carboniferous) of the southern North Sea arean important gas reservoir, although well placement and reservoir development are hampered by the lack of a reliable strati-graphical framework. Chemostratigraphy has enabled the Schooner Formation encountered in well 44/21-3 to be divided intothree chemostratigraphical units (S1, S2 and S3) and eleven sub-units (S1a–f, S2a–b and S3a–c), based on variations in mud-stone and sandstone geochemical data acquired from core samples and cuttings. The geochemical characteristics of the unitscan be related to variations in mineralogy, depositional environment, climate and provenance. The units are correlated sub-regionally and the correlation is used to corroborate seismic correlations. A high-resolution chemostratigraphical zonation andcorrelation based on sub-units redefines models of reservoir architecture and enhances reservoir development in the nearbySchooner field.
Pages 147–164 of Carboniferous hydrocarbon geology: the southern North Sea and surrounding onshore areas, edited by J. D. Collinson, D. J. Evans,D. W. Holliday, N. S. Jones. Published as volume 7 in the Occasional Publications series of the Yorkshire Geological Society, © Yorkshire Geological Society 2005.
10Pearce01.fm Page 147 Wednesday, February 23, 2005 3:37 PM

T . J . P E A R C E , D . W R A Y , K . R A T C L I F F E , D . K . W R I G H T , A . M O S C A R I E L L O
148
2. Study sequence
2.1 Geological setting and lithostratigraphyIn the southern North Sea, the successions lying beneath thePermian have been drilled in search of hydrocarbons with reser-voir targets mostly within the Upper Carboniferous ConeybeareGroup (Cameron 1993). The sandy coal-measure deposits of theLangsettian and early Duckmantian are restricted to the northernpart of the southern North Sea and are termed the Caister CoalFormation. They are overlain by argillaceous coal measures ofthe Westoe Coal Formation. At the end of Duckmantian timesand during the early Bolsovian, grey sandy coal measures wereagain deposited in the Silver Pit area, followed by red silty mud-stones and sandstones of later Bolsovian age. These deposits areall known as the Schooner Formation.
Significant erosion associated with the Saalian unconformityat the base of the Permian has, in places, removed part or all ofthe Schooner Formation, resulting in Permian successionsdirectly sitting on either the Caister or Westoe coal formations.However, relatively thick redbed sequences are preserved in theaxial regions of mainly northwest–southeast trending Variscansynclines in the Silver Pit area to the north of the Sole Pit inver-sion, although such sequences are either thin or absent over thecrests of the complementary anticlines (Leeder & Hardman1990, Cameron et al. 1992, Cameron 1993, Bailey et al. 1993).
2.2 Study wellsThe study centres on well 44/21-3 (Fig. 1), as it has encounteredone of the thickest Schooner Formation intervals and is a refer-ence section for the formation (Cameron 1993; see Fig. 2). To
test the correlation potential of chemostratigraphy, the SchoonerFormation penetrated by well 44/26c-6 is also included in thisstudy.
In well 44/21-3, the Schooner Formation is divided provi-sionally into the Lower Schooner Unit, which comprises greysandy coal measures, and the Ketch Member (Fig. 2). This mem-ber consists of the Lower Ketch Unit, which corresponds to arelatively sandy redbed section, and the Upper Ketch Unit, aninterbedded sequence of grey and red silty mudstones that alsocontains thin coals, caliches, limestones and sandstones (Fig. 2).Similar lithologies make up the Schooner Formation in well44/26c-6, with the Lower Schooner Unit, and the Upper andLower Ketch units, probably being present.
Above the formation are red mudstone beds of the SilverpitFormation (Fig. 2). A thin pebbly conglomerate marks the Saal-ian unconformity, which is put at 12 558 ft in well 44/21-3 (op.cit.). However, the base of the Schooner Formation is more dif-ficult to recognize, because criteria such as the change from redto grey measures, or the first downhole occurrence of a thick coalseam, are used. The base of this formation is put at c. 13884.3 ft
40
W 20W 0
02
0E 4
0E 6
0E 8
0E
40W 2
0W 0
02
0E 4
0E 6
0E
520N
540N
560N
580N
600N
520N
540N
560N
580N
600N
41 42 43
47
44
4948
44/21-3
44
U.K. sector
Dutch Sector
= Other studied wells
44/21-744/26c-6
Figure 1 Location of wells 44/21-3, 44/21-7 and 44/26c-6. The asterisk (*)indicates the location of other UK sector wells that have penetrated theSchooner Formation and which have been the subjects of proprietary chemos-tratigraphical studies.
Ge
och
em
ica
l
sa
mp
le
De
pth
(ft)
Gamma
API
0 200
12600
12700
12800
12900
13000
13100
13200
13300
13400
13500
13600
13700
13800
13900
14000
Ch
ron
ostr
atig
rap
hy
Lith
ostr
atig
rap
hy
Up
pe
r K
etc
h
Un
it
We
stp
ha
lian
C/D
Sch
oo
ne
r F
orm
atio
n
Lo
we
r K
etc
h U
nit
L.o
we
r
Sch
oo
ne
r
Un
it
We
stp
ha
lian
C
Sch
oo
ne
r F
orm
atio
n
Per. SilverPit Fm.
We
sto
e
Co
al F
m.
Co
nve
ntio
na
l co
re
Lith
olo
gy
Figure 2 Study interval of well 44/21-3. Lithostratigraphy from Cameron(1993).
10Pearce01.fm Page 148 Wednesday, February 23, 2005 3:37 PM

C H E M O S T R A T I G R A P H Y O F T H E U P P E R C A R B O N I F E R O U S S C H O O N E R F O R M A T I O N
149
in well 44/21-3 and corresponds to the base of the first thickclean sandstone encountered above the coal measures section.
3. Chemostratigraphy
3.1 Methods
3.1.1 Sampling rationaleAt the start of a study, one needs to consider the scale of theintended chemostratigraphical correlation, the facies presentover the study intervals and how closely spaced the samplesshould be.
If a detailed correlation of reservoir sections between closelyspaced wells is the aim, then samples should be collected at 1–6 ft intervals, an objective best achieved over core sections. If,however, a broader, less detailed correlation is needed, then cut-tings samples collected at 10–30 ft intervals should suffice. Thefluvial sandbodies of the Schooner Formation probably haveshoestring morphologies (Besly et al. 1993) and thus have verypoor correlation potential, whereas the overbank mudstoneshave a much wider extent and consequently have a far betterpotential for correlation. Therefore, mudstone samples were col-lected in preference to sandstone samples from the SchoonerFormation in well 44/21-3.
There is limited availability of core and sidewall core sam-ples over the Schooner Formation of wells 44/21-3 and 44/21-7,which restricts the stratigraphical techniques that can be suc-cessfully applied to these sections. However, chemostratigraphyis not hampered by sample type. Only very small sample vol-umes are required for ICP analyses, and geochemical data ofequally high quality and reliability can be acquired from cuttingsand core samples (Jarvis & Jarvis 1992a,b, Pearce et al. 1999).
The grain size of sedimentary rocks has a significant impacton their geochemistry. Quartz (and thus SiO2), becomes increas-ingly abundant in coarser-grained sandstones, with the concen-trations of the other elements subsequently decreasing, becauseof their dilution by quartz (Spears & Amin 1981, Shail & Floyd1988). Consequently, coarse-grained and very coarse-grainedsandstones are omitted from chemostratigraphical studies, as arebreccias and conglomerates, because homogeneous samplescannot be reliably obtained from them. Suitable sandstone sam-ples for ICP analysis can be difficult to acquire from cuttings, asduring drilling these lithologies sometimes become disaggre-gated and thus are represented just by monomineralic grains.This can lead to possible grain-size and mineral fractionation.
Chips of mudstones and claystones are better preserved in thecuttings and tend to have uniform grain sizes. Therefore, anymarked changes or trends recognized from the resultant geo-chemical datasets are likely to prove significant. Furthermore,these changes and trends probably will be fairly consistent overa wide area and so are very useful for correlation purposes (Cull-ers 1995). A relatively representative mudstone/claystone sam-ple is obtained by picking about 200 chips of these lithologiesfrom a cuttings sample. However, when only cuttings samplesare available, the final resolution of the chemostratigraphicalzonation and correlation will be controlled by the spacing of theanalyzed samples; so, the greater the spacing, the less detailedwill be the resolution. Moreover, only major long-term changesin sediment geochemistry can be recognized from datasets
derived just from cuttings (e.g. those related to changes in prov-enance or climate). Nevertheless, these changes probably willpersist over an individual field or even subregionally, and willform the basis for any correlations.
Sandstone samples collected from core and sidewall cores areperfectly adequate for ICP–OES and ICP–MS analyses, but shouldbe collected with reference to a sedimentological log if at allpossible. Ideally, samples should be collected from the samefacies and should be of similar grain size, thereby limiting anygeochemical variations linked to these parameters. In practice,however, samples are taken from several broadly similar facies(very fine-grained to medium-grained sandstone), althoughpoorly sorted sandstones are always excluded. Indurated sand-stone chips can be collected from cuttings fairly easily, althoughusually more than 200 chips are picked from any one sample.
3.1.2 Study materialThe study interval in well 44/21-3 ranges from 12 560 ft to14000ft, most of which covers the Schooner Formation and itssubdivisions (Fig. 2). 117 mudstone samples and 15 sandstonesamples have been analyzed by ICP–OES and ICP–MS techniques,with 44 samples coming from the core interval between 12 560 ftand 13 022 ft (= Upper Ketch Unit and the topmost part of theLower Ketch Unit – Fig. 2). Sizes for the core samples are c. 1–2cm3 for the mudstones and c. 3–5cm3 for the sandstones.The remaining analyzed samples are cuttings from 13 025 ft–14000ft; a few of these come from the Westoe Coal Formationand only one comes from the Silverpit Formation (Fig. 2).
The sandstone geochemical dataset is relatively small andrelates to a somewhat restricted stratigraphical interval. Con-sequently, geochemical data acquired from 49 SchoonerFormation sandstone samples from nearby well 44/21-7 areincorporated into this dataset, so as to extend the stratigraphicalrange of the data (Fig. 1).
The well 44/26c-6 study interval is between 13 090 ft and15350ft and extends from the base of the Silverpit Formation tocover the uppermost 600 ft of the Westoe Coal Formation. 56mudstone samples collected from cuttings have been analyzed.
3.1.3 Sample preparation and analysisTo avoid any contamination, all the samples are washed thor-oughly prior to preparation for geochemical analysis; they arethen ground in agate and dried. Subsamples weighing c. 0.25 gare prepared using a LiBO2 fusion (Jarvis & Jarvis 1992a,b). Theresultant solutions are analyzed by ICP–OES and ICP–MS, withdata being acquired for the major elements Si, Al, Ti, Fe, Mn,Mg, Ca, Na, K and P, the trace elements Ba, Co, Cr, Cs, Cu, Ga,Hf, Nb, Rb, Sc, Sr, Ta, U, V, Y, Zn and Zr, and the rare earthelements (REEs) La, Ce, Pr, Nd, Sm, Eu, Gd, Tb, Dy, Ho, Er, Yband Lu (light rare earth elements LREEs = La–Nd, middle rare-earth elements MREEs = Sm–Ho and heavy rare-earth elementsHREEs = Er–Lu). The analytical instruments are calibrated usingcertificated rock standards, with instrument drift being moni-tored after every five samples and, if necessary, corrected by theinstrument software. The variability of data from multiple analy-ses of the reference rocks, and the comparison of these data withcertified values, have enabled the precision and accuracy of thedata to be assessed. Precision error is below 2 per cent for themajor-element data and 3–6 per cent for the trace-element dataand REE data.
10Pearce01.fm Page 149 Wednesday, February 23, 2005 3:37 PM

T . J . P E A R C E , D . W R A Y , K . R A T C L I F F E , D . K . W R I G H T , A . M O S C A R I E L L O
150
3.2 Mudstone chemostratigraphyOne of the best ways to present the mudstone geochemical datais as geochemical profiles (Figs 3–5), which are constructed byplotting element concentrations against sample depth. In Figure3, the Al2O3 profile is based on absolute concentrations, whereasthe other profiles and those in Figure 4 relate to Al2O3-normal-ized ratios for selected elements. Normalizing the data in thisway nullifies any changes in geochemistry attributable to grain-size variations in the individual samples. The profile formatenables element enrichments, depletions and significant strati-graphical geochemical trends to be recognized quite easily, fromwhich a chemostratigraphical zonation can be developed. Inaddition, geochemical profiles based on other element ratios(e.g. Cr/Cs, Ta/U, etc.), are depicted in Figure 5 to highlight spe-cific mineralogical trends.
The chemostratigraphical zonation of the Schooner Forma-tion in well 44/21-3 is based on the data for the major elementsAl2O3, TiO2, Fe2O3, MgO, CaO, K2O and P2O5, the trace ele-ments Cr, Cs, Hf, Nb, Ni, Rb, Ta, Th, Y and Zr, and the REEs Laand Ce, these elements being referred to as chemostratigraphicalindex elements.
Interpretation of the geochemical profiles for the index ele-ments, most of which are illustrated in Figures 3–5, allows thewell 44/21-3 study interval to be divided into units W, S1, S2, S3and P. Their geochemical characteristics are described below.(Units and Sub-units may be referred to by their numbers alonehereinafter, e.g. Unit S1 as “S1” and Sub-unit S3a as “S3a”.)
Unit W• Low Fe2O3 ratio values and relatively high MgO and Na2O
ratio values. Lower Fe2O3/MgO, TiO2/K2O, Cr/Cs, Nb/Rb,Ta/U, but higher Cs/La ratios than S1 samples (Fig. 5).
Unit S1• Lower overall K2O, Rb, Mg and Th levels and higher Ti, Ta
and LREE levels than the other units.• Higher Ta/U values overall than units S2 and S3 (Fig. 5).• Higher Ta/U, Fe2O3/MgO, Cr/Cs and Nb/Rb values and
much lower Cs/Zr and Cs/La values than S3 (Fig. 5).• Na2O, Cr, Ni and Yb ratio values increase upwards over the
unit, whereas K2O, Rb and Cs ratio values decrease upwards.• The top of the unit is defined by abrupt upward decreases in
the TiO2, Ta, Nb, Zr and Hf ratio values.Unit S1 is divided into sub-units S1a to S1f, as follows:
• Sub-unit S1a has higher K2O, Rb, Cs and Cr ratio values andslightly lower TiO2 ratio values than S1b. The top of the sub-unit is defined by upward decreases in the K2O, Rb and Csratio values.
• Sub-unit S1b has lower K2O, Rb and Cs ratio values than sub-units S1a, S1c and S1d, with its top being marked by suddenupward increases in the K2O, Na2O, MgO, Rb and Cs ratiovalues. Sub-units S1a and S1b have higher Fe2O3/MgO,TiO2/K2O, Nb/Rb and Ta/U values, and lower Cs/La valuesthan S1c.
• Sub-unit S1c is geochemically the most distinctive of the sixsub-units, having high K2O, Rb and Cs ratio values and lowTiO2, Nb, Ta and Y ratio values, as well as lower Fe2O3/MgO,TiO2/K2O, Nb/Rb and Ta/U values, and much higher Cs/La
Geochem
ical
Unit
10 20 3040 50 60 700.5 1.0 1.5 0.0 0.1 0.2 0 1 2 3 4 0 2 4 6 0 1 2 1 2 3 4 5 6
Al2O3 SiO2 TiO2 Fe2O3 MnO MgO CaO K2ONa2O
W
S1a
S1b
S1c
S1d
S1e
S1f
S2a
S2b
S3a
S3b
S3c
De
pth
(ft
)
Gamma
API
0 200
12600
12700
12800
12900
13000
13100
13200
13300
13400
13500
13600
13700
13800
13900
14000
P2O5
0.1 0.4 0.7
P
Core samples
Cutttings samples
2 7 12
Figure 3 Major-element geochemical profiles: mudstone data. All values are weight per cent oxide.
10Pearce01.fm Page 150 Wednesday, February 23, 2005 3:37 PM

C H E M O S T R A T I G R A P H Y O F T H E U P P E R C A R B O N I F E R O U S S C H O O N E R F O R M A T I O N
151
Geochem
ical
Unit
W
S1a
S1b
S1c
S1d
S1e
S1f
S2a
S2b
S3a
S3b
S3c
De
pth
(ft
)
Gamma
API
0 200
12600
12700
12800
12900
13000
13100
13200
13300
13400
13500
13600
13700
13800
13900
14000
P
Core samples
Cutttings samples
0 100 200 300 0 5 10 15 20 2 4 6 8 10 10 35 60 50 150 250 0 1 2 3 4 100 250 400 20 40 60 80100
Cr Cs Hf Nb Rb Ta Zr CeLa50 100 150 200
Geochem
ical
Unit
W
S1a
S1b
S1c
S1d
S1e
S1f
S2a
S2b
S3a
S3b
S3c
De
pth
(ft
)
Gamma
API
0 200
12600
12700
12800
12900
13000
13100
13200
13300
13400
13500
13600
13700
13800
13900
14000
P
Core samples
Cutttings samples
Fe2O3/MgO TiO2/K2O Cr/Cs Nb/Rb Zr/La0 9 18 0.0 0.4 0.8 0 20 40 0.00 0.25 0.50 2 4 6 8 10
Cs/Zr0.00 0.05 0.10
Ta/U0.0 0.4 0.8
Cs/La0.0 0.1 0.2 0.3
Figure 4 Selected trace-element geochemical profiles: mudstone data. All values are parts per million (ppm).
Figure 5 Geochemical profiles for selected element ratios: mudstone data.
10Pearce01.fm Page 151 Wednesday, February 23, 2005 3:37 PM

T . J . P E A R C E , D . W R A Y , K . R A T C L I F F E , D . K . W R I G H T , A . M O S C A R I E L L O
152
values (Fig. 5). The corresponding interval also coincideswith changes in the gradients of the TiO2, Fe2O3, Nb and Taprofiles. The top of the sub-unit is marked by abrupt upwarddecreases in the K2O, Na2O, MgO, Rb and Cs ratio values,and sudden upward increases in the TiO2, Nb and Ta ratiovalues.
• TiO2, Nb, Ta, Zr and Hf ratio values steadily increaseupwards over the S1d–S1f interval, whereas K2O, Rb and Csratio values decrease upwards (Figs 3, 4). Sub-unit S1d haslower TiO2, Nb, Ta, Zr and Hf ratio values than the other twosub-units, as well as higher K2O, Rb and Cs ratio values, withits top being defined by stepped upward decreases in the latterthree ratio values (Figs 3, 4). The geochemical characteristicsof S1e are transitional between those of sub-units S1d andS1f, although its top is marked by a sudden upward increasein the Cr ratio values (Fig. 4). Sub-unit S1f has higher TiO2,Ta, Nb, Zr, Hf and Y ratio values than the other two sub-unitsand its Fe2O3/MgO, TiO2/K2O, Nb/Rb and Zr/La values arethe highest recorded from the study interval.
Unit S2• Transitional geochemical characteristics between those of
units S1 and S3, e.g. K2O, MgO, Rb, TiO2 and Nb ratio values(Figs 3 and 4).
• Higher Cr ratio values than the other units.• The unit top is defined by an abrupt upward increase in the Cs
ratio values, less well defined increases in the K2O and Rbratio values, and sudden decreases in the Nb and Cr ratiovalues.
• Much higher Fe2O3/MgO, TiO2/K2O, Nb/Rb and Ta/U val-ues, and lower Cs/Zr and Cs/La values than S3 (Fig. 5).
Unit S2 is divided into sub-units S2a and S2b, as follows:• Sub-unit S2a has lower Cr, Ni, Nb, Zr and Hf ratio values.• Sr ratio values increase upwards over S2a, but then decrease
upwards over S2b.• Sub-unit S2b has significantly higher Cr/Cs and Zr/La values.
Unit S3• The highest K2O, Rb and Cs ratio values and the lowest TiO2,
Nb and Cr ratio values (Figs 3, 4).• Localized very high CaO, MgO and MnO levels (Fig. 3).• The highest Cs/Zr and Cs/La values, as well as low
Fe2O3/MgO, TiO2/K2O, Nb/Rb and Ta/U values (Fig. 5).Unit S3 is divided into sub-units S3a, S3b and S3c, as follows:
• Sub-unit S3a has lower Fe2O3 and MgO ratio values thansub-units S3b and S3c. Its top is marked by a coaly intervalcharacterized by low Ta/U and Cs/La values.
• Sub-unit S3b has high MgO and Fe2O3 ratio values, alongwith localized very high CaO levels. It also has the highestCs/Zr and Cs/La values.
• TiO2 and Nb ratio values generally decrease upwards oversub-units S3a and S3b, with the top of S3b being defined bythe termination of these trends. These ratio values are higherin S3c.
Unit POnly one analyzed sample (12 552.5 ft) from the basal redmudstones of the Silverpit Formation is assigned to Unit P. Thegeochemical characteristics of the unit are similar to those of S3band S3c, although it has much higher Na2O and K2O ratio values
(Fig. 3).The above units and sub-units can be further characterized by
using ternary diagrams. The sample plots define clusters on theternary diagrams that can be related directly to the above unitsand sub-units (Fig. 6). For instance, units S1, S2 and S3 can bedifferentiated quite readily (Figs 6a–6c), as can most of the sub-units (Figs 6d–6i). However, although S1c and S1f can be differ-entiated, the only other distinction that can be made between theremaining four S1 sub-units is between S1a–S1b and S1d–S1e(Figs 6g–6i).
4. Mudstone geochemistry and mineralogy
Chemostratigraphy is based on the recognition of distinctivecharacteristics from the sedimentary geochemical datasets. Thepresence of these distinctive features, or “geochemical finger-prints”, allows sedimentary sequences to be divided into chemo-stratigraphical units, each unit having its unique fingerprint.However, a geochemical fingerprint usually comprises only thedata for a limited number of elements (chemostratigraphicalindex elements). Moreover, the elements used as index elementsmay vary between different areas and stratigraphical intervals,because of differences in:
• Detrital mineralogy and provenance composition: the miner-alogy and geochemical composition of different source areascan vary considerably, which therefore influences the geo-chemistry of the sediments derived from them.
• Depositional environment and facies: some elements maybecome concentrated in certain depositional environmentsand facies.
• Diagenesis: under different diagenetic regimes includingweathering and pedogenesis, many elements may becomeremobilized, resulting in the detrital geochemical signaturesof the sediments being either modified or obliterated.As the chemostratigraphical zonation of the well 44/21-3
study interval is based on mudstone geochemistry, the followingsection naturally focuses on the mineral affinities of the ele-ments found in the mudstones. Indeed, the determination of anyrelationships between element concentrations and mineral dis-tributions, combined with the results of descriptive statistics andprincipal component analysis, enables those factors controllingelement distributions over the study interval to be established.
4.1 Principal component analysisPrincipal component analysis (PCA) is used to recognize elementassociations and to infer element–mineral affinities. PCAinvolves redrawing the axis system of the mudstone dataset forn–dimensional data (using UNISTAT for Windows), such thatpoints lie as close as possible to the axes. The derived variables,termed principal components, can express a large proportion ofthe total variance of the dataset with a smaller number of varia-bles. In this study, PCA can determine which elements have simi-lar distributions and can then use these associations to highlightthe characteristics of the dataset (Fig. 7). The various associa-tions themselves can give some idea as to the factors controllingthe abundance and distribution of the elements (e.g. mineralogyor grain size).
The main element associations recognized from Figure 7 are:• K2O, Rb and Cs have affinities with illite/mica and chlorite.
10Pearce01.fm Page 152 Wednesday, February 23, 2005 3:37 PM

C H E M O S T R A T I G R A P H Y O F T H E U P P E R C A R B O N I F E R O U S S C H O O N E R F O R M A T I O N
153
• CaO, MgO and MnO have affinities with carbonate minerals.Al2O3, TiO2, Nb, Ta, Zr, Hf, Cr, the LREEs and the HREEs are
all associated. Al2O3 and the LREEs have affinities with theAl-oxyhydroxides and kaolinite, whereas Zr and Hf are linkedwith zircon. TiO2, Nb and Ta are connected with rutile andopaque minerals, although also have affinities with authigenicanatase and detrital clay. The HREEs are commonly concentratedin heavy minerals such as zircon, as well as clay minerals. Cr isassociated with chrome-spinel, but is also relatively common inclay minerals and degraded mafic minerals.
The distribution of U, Co and Cu is primarily controlled by
the distribution of organic matter, higher values occurring in thegrey mudstones. In contrast, these elements are depleted in theoxidized redbed intervals.
4.2 Binary diagramsThe binary diagrams depicted in Figures 8 and 9 also highlightthe element–mineral affinities, and Pearce et al. (2005) presentclay-mineral and heavy-mineral data that corroborate the pro-posed affinities. Figure 8a shows that most of the mudstoneshave a relatively high SiO2 content (about 60%), so silt-gradematerial (mostly as quartz grains) is probably fairly common.
TiO2/K2O
TiO2/K2O
MgO
Cr
Unit S1
Unit S2
C
D E F
Subunit S3c
Subunit S3b
Subunit S3a
Key to D, E & F
Subunit S1f
Subunits S1d-e
Subunit S1c
Key to G, H & I
Subunits S1a-b
Cs K2O
K2O
K2O
Fe2O3 Fe2O3
Fe2O3 Cs
TiO2
TiO2
Cs MgO
NbxTa RbxCs
TiO2/K2O
Units S1
& S2 Unit S3
A
HREE
Cr
Unit S2
Unit S3
Unit S1
B
G H I
Cr Zr CsNb CrSubunit S1c
Subunit S1f
Subunits
S1d-e
Subunits
S1a-b
Subunit S3c
Subunit S3a
Subunit S1c
Subunit S1f
Subunits
S1d-e
Subunits
S1a-b
Subunit S1c
Subunit S1f
Subunits
S1d-e
Subunits
S1a-b
Subunit S3b
Subunit S3cSubunit S3a
Subunit S3b
Subunit S3c
Subunit S3a
Subunit S3b
Unit S3
RbxCs
Unit S1
Unit S2
Unit S3
Key to A, B & C
Figure 6 Differentiation of mudstone samples using ternary diagrams. A–C plot data from S1, S2 and S3. D–F plot data for sub-units recognized in S3. G–I plotdata for sub-units recognized in S1.
10Pearce01.fm Page 153 Wednesday, February 23, 2005 3:37 PM

T . J . P E A R C E , D . W R A Y , K . R A T C L I F F E , D . K . W R I G H T , A . M O S C A R I E L L O
154
The abundances of K2O and illite/mica are linked, with K2Olevels being relatively high in S1c. Illite/mica and smectite arethe main clay minerals in S2 and S3a, although kaolinitic mud-stone samples assigned to sub-units S2a and S3a have a rela-tively low K2O content. Al2O3/K2O values give some indicationof the relative abundance of illite/mica and kaolinite, as K2O is
abundant in illite/mica and Al2O3 is abundant in kaolinite. Thus,increasing ratio values point to increasing kaolinite levels andvice versa, as exemplified by S1 and S3 (Fig. 8b), the latter unithaving less kaolinite and more illite/mica than S1 (confirmed byPearce et al. 2005). Furthermore, this demonstrates how K2Oand Al2O3 data can provide some information about the strati-graphical distribution of these clay minerals.
Figure 7 shows Rb, Cs and Na2O all have a close affinity withK2O. Correlation coefficients for Rb:K2O (0.77) and for Rb:Cs(0.67; Fig. 8c) indicate that Rb and Cs levels are governedchiefly by variations in clay-mineral abundance. Apart fromS3b, the plots of the S3 samples form a well defined linear trendon the Rb vs Cs binary diagram (Fig. 8d); the S3b samples do notplot on this trend, as they have high Cs levels. Cs levels increaseat the base of S3b and coincide with the first appearance ofchlorite (Pearce et al. 2005).
Na2O usually has affinities with clay minerals, feldspar andevaporite minerals. Halite and anhydrite cements occur locallyin the sandstones near the top of the Ketch Member (Cameron1993) and traces of anhydrite cement are recorded from the S3sandstones in well 44/21-3 (Pearce et al. 2005). Nevertheless,Na2O data from cuttings can be unreliable if drilling fluids havecontaminated the samples. Moreover, most of the geochemicaldata included in this study come from cuttings, and whether ornot drilling fluids have contaminated these samples is unknown,so the Na2O data are ignored.
CaO and MgO are usually associated with calcite, dolomiteand ferroan carbonates, with the relatively high CaO levels (5–6%) in S3 and S2b probably being related to dolomitized calichehorizons that formed during pedogenesis together with occa-sional freshwater limestones (Besly et al. 1993). High CaO and
EV2
EV1
-0.4 -0.3 -0.2 -0.1 0.0 0.1 0.2 0.3 0.4
-0.3
-0.2
-0.1
-0.0
0.1
0.2
0.3
Si
Al
Ti
Fe
Mn
Co
CaNa
K
Cr
Zr
Ni
Rb
Sr
Nb
Cs
LREE
MREE
HREE
Hf
Ta
Tl
ThU
Ba
Cu
Y
Mg
Carbonate
Kaolin +
heavy mins
Illite/mica
chloriteIllite/mica
Smectite
Chlorite
Kaolin
Metals + U
Figure 7 Plots of eigenvector 1 (EV1) values versus eigenvector 2 (EV2) val-ues. Four element associations are recognized: those associated with carbon-ate minerals, those linked with illite/mica and chlorite, those associated withkaolinite and heavy minerals, and those linked with metallic elements (see textfor detailed discussions).
0
10
20
30
40
50
60
70
80
0 10 20 30
A) Al2O3 vs SiO2
1
2
3
4
5
6
10 15 25 30
Al2O3(%) Al2O3(%)
K2O
(%)
K2O
(%)
K2O(%)
SiO
2(%
)
B) K2O vs Al2O3 C) K2O vs Rb
F) K2O vs MgO
0
50
100
150
200
250
0 2 4 6
Rb (
ppm
)
2
4
6
8
10
12
14
16
18
50 100 150 200 250
D) Rb v Cs
Cs (
pp
m)
Rb (ppm)
0.0
1.0
2.0
3.0
4.0
5.0
6.0
7.0
0.0 1.0 2.0 3.0 4.0 5.0
E) MgO vs CaO
MgO (%) MgO (%)
Ca
O (
%)
0.0
1.0
2.0
3.0
4.0
5.0
6.0
0.0 1.0 2.0 3.0 4.0 5.0
Trend 1S3 samples
Trend 1 all samples
Trend 1 all samples
Trend 2S1 samples
S3 Samples Carbonate-rich
S3 samples
Mg-rich
S3 samples
Trend 1 - S1 and S2
samples
Trend 1 - S1, S2
& S3a samples
S3 samples preferentially
enriched in MgO
20
Figure 8 Binary diagrams: mudstone data. The various illustrated diagrams allow S1, S2 and S3 to be differentiated.
10Pearce01.fm Page 154 Wednesday, February 23, 2005 3:37 PM

C H E M O S T R A T I G R A P H Y O F T H E U P P E R C A R B O N I F E R O U S S C H O O N E R F O R M A T I O N
155
MgO levels together reflect the presence of carbonate minerals,whereas low concentrations are linked to clay minerals. Theseconclusions are supported by the positive linear trend defined bythe S1 and S2 sample plots on Figure 8e. Only MgO levels arerelatively high in S3, with sub-unit 3b having the highest levelsof all (Fig. 8f); so here, MgO is probably associated with clayminerals, these high levels coinciding with an increase in chlo-rite (?corrensite)/smectite (Pearce et al. 2005).
Fe2O3 concentrations are relatively high throughout the studyinterval, and in the red mudstones are associated with abundantdisseminated haematite and other Fe-oxyhydroxides. In the redsandstones, haematite occurs as grain coats and pore fillingsafter siderite cements, as pseudomorphs after sphaerosideriteand as replacements of biotite, pyrite, clay matrix and sandstoneclasts (Besly et al. 1993). However, localized siderite andferroan dolomite cements are present in the mudstones, withcaliche occurring in S3, all of which contribute to overall Fe2O3levels.
P2O5 concentrations are relatively low in units S1 and S2,
although the higher P2O5 levels in S3 most probably reflect theabundance of clay and organic matter in this unit. However, asapatite (a calcium phosphate) is present in the S3 sandstones(Pearce et al. 2005), so silt-grade apatite grains may occur in themudstones, which thus may be the cause of the high P2O5 levelsin S3.
In sedimentary rocks, the REEs occur in feldspar, clay miner-als, mica and heavy minerals, although their levels are very lowin quartz. Consequently, REE concentrations are typically muchhigher in mudstones than sandstones. However, the mineralaffinities of these elements in the well 44/21-3 samples are diffi-cult to establish. LREE levels are highest in S1 and coincide withhigh Al2O3 contents, which themselves are linked to thedevelopment of kaolinitic Al-oxyhydroxide soils. This elementassociation is reflected by the overall positive relationship theLREE lanthanum (La) has with Al2O3 (Fig. 9a) and its inverserelationship with K2O (Fig. 9b), which indicate that LREE levelsare influenced by fractionation during pedogenesis and earlydiagenesis. LREE abundance may therefore be linked to clay
Unit S3
Unit S2
Unit S1
0
50
100
150
200
250
300
350
0.5 1.0 1.5 2.0
Al2O3(%)
A) La vs Al2O3
K2O(%) K2O(%)
C) TiO2 vs K2O
F) TiO2 vs Cr
G) TiO2 vs Zr
D) TiO2 vs Nb
TiO2 (%) TiO2 (%)
TiO2 (%)
B) La vs K2O
0
10
20
30
40
50
60
70
80
90
100
10 15 20 25 300
10
20
30
40
50
60
70
80
90
100
0.0 2.0 4.0
La (
ppm
)
La (
ppm
)
0.6
0.8
1.0
1.2
1.4
1.6
1.8
0.0 2.0 4.0 6.0
TiO
2 (
%)
0
10
20
30
40
50
60
70
0.5 1.0 1.5 2.00.0
0.5
1.0
1.5
2.0
2.5
3.0
3.5
4.0
0 20 40 60 80
E) Nb vs Ta
Nb (ppm)
Nb (
ppm
)
Ta (
ppm
)
Cr
(ppm
)
0
50
100
150
200
250
300
350
400
0 100 200 300
H) Zr vs Cr
0
50
100
150
200
250
300
350
400
0.0 0.5 1.0 1.5 2.0
KEY
Zr
(ppm
)
Zr
(ppm
)
Cr (ppm)
Trend 1 S3 and S2
samples
Trend 1 all samples Trend 1 all samples
S1 Samples
enriched in La
S3
samples S3
samples
Trend 1 all samples Trend 1 all samples
Trend 1 all samples
Trend 1 S1 and S3
samples
S2 samples
Nb enriched
S2 samples
Cr enriched
S3
samples
S2
samples
Figure 9 Binary diagrams: mudstone data. The various illustrated diagrams allow S1, S2 and S3 to be differentiated.
10Pearce01.fm Page 155 Wednesday, February 23, 2005 3:37 PM

T . J . P E A R C E , D . W R A Y , K . R A T C L I F F E , D . K . W R I G H T , A . M O S C A R I E L L O
156
minerals and environmental conditions, because those elementstend to be more common in the oxidized kaolinitic S1 mudstonesthan in the S3 mudstones, which were deposited when the cli-mate was more arid (Besly 2002).
TiO2 concentrations are usually influenced by the occurrenceof Ti oxides (rutile, ilmenite and anatase) and chlorite, illite/mica and biotite, although Figure 9c discounts any significantlink between this element and illite/mica abundance. Instead,TiO2 levels over the study interval are probably related to rutile(as silt- and sand-grade grains, as inclusions in detrital quartzgrains (Blatt et al. 1972: 276, Scholle 1979: 9) and in lithicclasts), other Ti oxides such as anatase. Heavy-mineral datapresented by Pearce et al. (2005) and Morton et al. (2005) con-firm that rutile is a common detrital heavy-mineral phase in theSchooner Formation.
Figure 9d shows that Nb has a positive relationship with TiO2(Nb:TiO2 correlation coefficient of 0.73), thus rutile abundancemay well govern Nb levels. Ta also has a positive relationshipwith Nb (Fig. 9e) and, like Nb, Ta is associated with the distribu-tion of rutile. Cr plots with a loose positive relationship (espe-cially in samples from S1 and S3) with TiO2 and with Zr (Fig.9f–h), indicating that Cr is associated with the distribution ofheavy minerals, particularly Cr-spinel, which is common in theKetch Member (Morton et al. 2005).
Zr is linked to zircon, which is more common in S1 than inS3. The positive relationship between Hf and Zr (Zr:Hf correla-tion coefficient of 0.97) implies that Hf levels are controlled byzircon distribution and abundance.
5. Sandstone chemostratigraphy and mineralogy
The sandstone dataset for well 44/21-3 relates to the uppermostpart of the Lower Ketch Unit and the Upper Ketch Unit. Addedto the dataset are sandstone data acquired from the Lower KetchUnit encountered in well 44/21-7. Although the well 44/21-3dataset is too small to establish a chemostratigraphical zonation,the main geochemical characteristics of the sandstones can besummarized, certain element–mineral affinities can be estab-lished, and comments can be made regarding provenance.
The sandstone samples are classified by plotting some oftheir data on the “SandClass System” diagram devised byHerron (1988; see Fig. 10). This scheme enables the sandstonesto be assigned to groups that are broadly equivalent to the cat-egories defined by various mineralogical classification schemes(e.g. that of McBride 1963).
Most of the S3 sandstones are classified as litharenites,although the argillaceous ones plot in the Fe-shale, Fe-sand andwacke fields. Of the S2 sandstones, one is classified as a sub-litharenite and the other two are Fe-sands. In contrast, the S1sandstones of well 44/21-7 have higher SiO2/Al2O3 values,which shows they are more quartzitic, and higher Fe2O3/K2Ovalues, as they contain relatively abundant Fe oxyhydroxides,plus ferroan dolomite and ankerite cements. Consequently, mostof them are classified as either quartz arenites or Fe-sands(Fig. 10) and are mineralogically more mature than the UpperKetch sandstones.
Figures 11a–d show that the S1 sandstones can be differenti-ated from the S2 and S3 sandstones. The latter have more Al2O3
and K2O, the higher Al2O3 levels reflecting their argillaceousnature, plus the presence of mica and, to a lesser extent, feldspar.Most of the sandstones have low CaO contents, although raisedCaO levels in the S1 sandstones are attributed to ferroan dolo-mite cements, as Ca-bearing detrital minerals such as plagi-oclase feldspar are virtually absent. In the S2 and S3 sandstones,any high CaO levels are linked to dolomitic cements and, insome cases, the occurrence of rip-up caliche clasts.
The S1 sandstones from well 44/21-7 plot separately from theS2 and S3 sandstones of well 44/21-3 on Figure 11e. Zr levelsare linked mainly with zircon, whereas Th can be associated withseveral minerals, including clay minerals and heavy minerals.Here, some of the Th is related to detrital clay, but most is linkedto the relative abundance of zircon and apatite, thus as the S2 andS3 sandstones have more apatite, they therefore also have higherTh levels. The same sandstones also have more P2O5 (Figs11c,g), which again is partly associated with apatite.
Rb levels are typically higher in the S2 and S3 sandstones(Fig. 11f) as they have more detrital clay (illite/mica) and, to alesser extent, more K feldspar. Detrital clay is virtually absentfrom the S1 sandstones, in which higher levels of La (an LREE)are associated with authigenic clay minerals, chiefly kaolinite.
The overall geochemical signature of the mudstones mimicsthat of the sandstones and demonstrates the mudstones aremineralogically mature, with relatively common silt-grade quartzand heavy-mineral grains.
6. Discussion
The following discussion presents a geological interpretation ofthe chemostratigraphical data. It also draws on the results of amineralogical study outlined by Pearce et al. (2005).
6.1 Sediment geochemistry, depositional environment and climate
When trying to recognize what impact, if any, climate changehas had on the geochemistry of the Schooner Formation, theremust first be some understanding of the regional climate duringthe time these sediments were deposited. The offshore Upper
Fe-shale
Fe-sand
Lith-
arenite
Sublith-
arenite
SubarkoseArkose
Shale
Wack
e
Quartz
arenite
0 0.5 1 1.5 2 2.5
-1
0
1
2
log (SiO2/Al2O3)
log (
Fe
2O
3/K
2O
)
-2
Unit S3
Unit S2
Unit S1
Figure 10 Geochemical classification of sandstones: wells 44/21-3 and44/21-7. The sandstones are classified using the scheme of Herron (1988).
10Pearce01.fm Page 156 Wednesday, February 23, 2005 3:37 PM

C H E M O S T R A T I G R A P H Y O F T H E U P P E R C A R B O N I F E R O U S S C H O O N E R F O R M A T I O N
157
0 2 4 6 8 10 1220
45
70
95
120
0 2 4 6 8 10 120.0
0.5
1.0
1.5
2.0
0.00 0.05 0.10 0.15 0.20 0.25 0.300.0
0.5
1.0
1.5
2.0
0 2 4 6 8 10 120.0
0.5
1.0
1.5
2.0
0.0 0.5 1.0 1.5 2.0 2.5 3.0 3.5 4.00
100
200
300
400
500
600
700
800
0 2 4 6 8 100
3
6
9
12
15
0.00 0.01 0.02 0.03 0.04 0.050
100
200
300
400
500
600
700
800
Unit S3
Unit S2
Unit S1
KEY
Al2O3(%)K
2O
(%)
SiO
2(%
)
CaO (%)
Al2O3(%)
K2O
(%)
P2O5 (%)
K2O
(%)
Zr/
Al
Th/Al2O3
La
/Al 2
O3
Rb/Al2O3
P/Al
Zr/
AlA
l 2O
3
A) Al2O3 vs SiO2 B) Al2O3 vs K2O
C) P2O5 vs K2O
G) Zr/Al2O3 vs P/Al2O3
F) La/Al2O3 vs Rb/AlE) Zr/Al2O3 vs Th/Al
D) CaO vs K2O
Figure 11 Binary diagrams: sandstone data from wells 44/21-3 and 44/21-7.
10Pearce01.fm Page 157 Wednesday, February 23, 2005 3:37 PM

T . J . P E A R C E , D . W R A Y , K . R A T C L I F F E , D . K . W R I G H T , A . M O S C A R I E L L O
158
Carboniferous sequences and their onshore equivalents in theEnglish Midlands were probably deposited in broadly similarenvironments and under the same overall climatic conditions.The Etruria Formation (Duckmantian–Bolsovian) contains fer-ruginous palaeosols and kaolinite is the predominant claymineral (Besly et al. 1993). However, caliches occur in the over-lying Halesowen and Salop formations of Westphalian to earlyStephanian age (Besly & Cleal 1997); illite/mica is the main claymineral, along with minor chlorite (Besly et al. 1993). Similarfeatures are recognized in the equivalent offshore sequences.The aforesaid mineralogical differences indicate climatechange, in that the Etruria Formation (= Lower Ketch Unit) wasdeposited under humid conditions, whereas the Halesowen andSalop formations (= Upper Ketch unit) accumulated in a drier,more arid environment (Besly 1987, Besly et al. 1993). Calichesalso occur in overbank sediments of Westphalian D and youngerages in the eastern Netherlands and northern Germany (Besly etal. 1993, Pagnier & van Tongeren 1996). This evidence allshows that climate changed during Westphalian D times. Com-parable climate-controlled changes in facies have also beenrecognized in early Westphalian D successions from the Appa-lachian Basin (Cecil et al. 1985).
In well 44/21-3, grey coaly intercalations from what is equiv-alent to the basal part of S3b have yielded a “. . . late Westphal-ian C palynoflora (upper part of SL zone)” (Besly et al. 1993:729). However, new palynological data (Pearce et al. 2005) nowassigns a Westphalian D age to this interval, which is broadlycomparable with the age of the base of the Halesowen Formation(Besly & Cleal 1997). The different clay mineral assemblages ofthe Lower and Upper Ketch units, as interpreted from their mud-stone geochemistry, and the presence of caliches in the UpperKetch unit, which indicates climate change, have been con-firmed by mineralogical data acquired for the well 44/21-3chemostratigraphical study (Pearce et al. 2005).
The sedimentology of the Schooner Formation also reflectsclimate change. The thick sandstone-rich intervals correspond-ing to S1d–f were deposited on an alluvial fan, with commonferruginous palaeosols and kaolinitic mudstones indicatingintense chemical weathering in a humid climate. Geochemicalpalaeopedology parameters (alumina/bases ratio – Al2O3/(CaO+MgO+Na2O+K2O) of Retallack 1997) confirm this andshow that the S1 mudstones have suffered relatively severehydrolytic weathering (Pearce et al. 2005). Rainfall rates thendropped during the deposition of units S2 and S3 (latest Bolso-vian to Westphalian D time). Lower-energy floodplain sedimen-tation prevailed, with sandstones being sporadically deposited influvial channels and minor lacustrine deltas, along with theestablishment of mature palaeosols and caliches. Furthermore,detrital clay minerals were preserved in the mudstones, althoughlocal fluctuations in the water table allowed occasional greymudstones and thin coals to be retained (Besly 2002, Pearce et al.2005). The highest values for the alumina/bases ratios arerecorded at the top of S1 and at the S2a/S2b boundary, so theymay signify breaks in deposition. The S1c mudstones haveslightly higher Al2O3/(CaO+MgO+Na2O+K2O) values than theS1b and S1d mudstones, reflecting increased pedogenic leach-ing caused by a probable change in basin topography or water-table conditions (Retallack 1997, Pearce et al. 2005).
6.2 Geochemistry and provenanceClear differences in geochemistry have been used to highlightvariations in mineralogical characteristics between the sandstonesfrom S1 and S2 and those from S3. These stratigraphical changesin sandstone mineralogy have a major impact on exploration.The S3 sandstones have poorer reservoir quality than the thicker,porous sandstones from the upper part of S1, so further success-ful exploration may depend on determining whether SchoonerFormation sandstones have either S3 or S1/S2 geochemicalsignatures.
The differences in sandstone composition can be recognizedfrom the point-count data, heavy-mineral data (Pearce et al.2005) and the geochemical data, with the two compositionaltypes being interbedded in S2. Besly (1995) attributed such dif-ferences to a change in provenance and believed that the EtruriaFormation is the onshore equivalent of the Lower Ketch Unit,noting that the composition of the Upper Ketch sandstones isidentical to those of the Halesowen Formation. The source forthe S1 sandstones is probably the high-grade metamorphic com-plexes of the Ringkøbing–Fyn High (Morton et al. 2005). More-over, isotopic data for the Lower Ketch Unit from well 44/21-3suggest a provenance age of c. 1148Ma–1268Ma (Pearce et al.2005), which is consistent with derivation from such northeast-erly sources as southern Norway and the Oslo Rift.
7. Chemostratigraphical correlation
An extensive geochemical dataset has been acquired from theUpper Carboniferous successions encountered in more than 40wells from UK Quadrants 44 and 49 (Fig. 1) and from Dutchquadrants D, E and F. Much of these data come from cuttings.Only major long-term changes in sediment geochemistry (i.e.those related to provenance or climate changes) can be recog-nized from cuttings data, although these changes can usually berecognized across an individual field and can even persist sub-regionally. Indeed, when considering stratigraphical trends insediment geochemistry over thick sequences such as the SchoonerFormation, even the distributions of potentially mobile elementssuch as K2O, Rb, Cs and the REEs can form the basis for broadsubregional chemostratigraphical correlations. Units S2 and S3can be recognized and correlated over a wide area, as can sub-units S1a,b and sub-units S1c–S1f, but the correlation of theindividual sub-units is usually possible only over an individualfield.
Changes in the clay-mineral assemblages of units S2 and S3,and certain of their sedimentological characteristics, reflect achange in climate, with those interpreted changes in mineralogyand depositional environment at the base of S2 being regarded asa subregional “marker”. Moreover, the different provenance ofthe Upper Ketch Unit provides an additional foundation for achemostratigraphical correlation. However, this provenancechange will probably be diachronous across the southern NorthSea, because of the northeastward progradation of the fluvialsystem that deposited S3.
The geochemistry and mineralogy of the Schooner For-mation in well 44/21-3 are broadly comparable to that of theonshore Upper Carboniferous sequences in the English Mid-lands (Pearce et al. 1999), whereas the lithic clast types found inthe Bolsovian–Westphalian D sandstones from Quadrants 52
10Pearce01.fm Page 158 Wednesday, February 23, 2005 3:37 PM

C H E M O S T R A T I G R A P H Y O F T H E U P P E R C A R B O N I F E R O U S S C H O O N E R F O R M A T I O N
159
and 53 and from Lincolnshire (Collinson et al. 1993) suggestcomparison with the Upper Ketch unit. Unit S1 broadly corre-lates with the Etruria Formation (Besly & Cleal 1997, Pearce etal. 1999). They both accumulated at the same time, in similardepositional environments and under similar climatic condi-tions, but the sandstones of each succession had different sourceareas being derived mainly from the west in the onshore WestMidlands and from the northeast in the southern North Sea(Besly 2002, Morton et al. 2005, Pearce et al. 2005). In geo-chemical terms, the Halesowen and Salop formations are equiv-alent to S3 and both were sourced from the Variscan front.Although they have similar “provenance signatures”, the Hale-sowen Formation and S3 were probably derived from differentparts of the front, as they have slightly different heavy-mineralassemblages and Sm–Nd isotopic signatures (Pearce et al.2005). The Halesowen Formation rests unconformably on theEtruria Formation, but sedimentation appears to have been con-tinuous in the southern North Sea.
Red laminated mudstone beds of the Permian Silverpit For-mation overlie the Schooner Formation in well 44/21-3, with thebase of the Permian (= Saalian unconformity) being at 12 558 ft(Cameron 1993). The Silverpit Formation is equivalent to unit P.Only one analyzed sample (12 552.5 ft) is assigned to this unit,which has similar geochemical characteristics to those of S3band S3c, apart from a much higher K2O level, because of abun-dant illite/mica. The sample also has a high Na2O level, becauseevaporite minerals are common in the Silverpit Formation. Thegeochemical similarity between units P and S3 is probablyattributable to some S3 material being reworked during a periodof erosion associated with the Saalian unconformity.
The base of S1 in well 44/21-3 is defined by a downhole
reduction in Fe2O3, Cr and Nb contents, along with lowerFe2O3/MgO, TiO2/K2O, Nb/Rb, Cr/Cs, and Ta/U ratio values(Figs 3–5). Unit W below has relatively higher MgO, Na2O andCs/La ratio values (Figs 3–5), but, even so, its overall geochem-istry is only very slightly different from that of the basal part ofS1. In wells to the north, however, the geochemical differencesbetween the Schooner Formation and the Westoe Coal Forma-tion are more marked, because sub-units S1c to S1f overlie thecoaly successions.
The base of the Schooner Formation can be recognized usingpalynology. Strata associated with S1a yield a diagnostic assem-blage of reworked late Dinantian to Namurian palynomorphs.Similar reworked assemblages occur at the base of the SchoonerFormation in many well sections in Quadrants 44 and 49(McLean et al. 2005). Furthermore, in well 44/21-3 palynologi-cal data indicate that S1a (= Biozone W6b of Late Bolsovianage) lies directly on Biozone W5b of early Bolsovian age(Pearce et al. 2005) confirming the present of an unconformity atthe base of the Schooner Formation (McLean et al. 2005). TheSchooner Formation overlies the Bolsovian Westoe Coal For-mation in well 44/21-3, whereas in wells to the northeast, theformation progressively onlaps Duckmantian, Langsettian andNamurian sequences, where the absence of several biozonesacross the unconformity makes the base of the formation veryobvious.
7.1 Chemostratigraphical correlation of wells 44/21-3 and 44/26c-6
Well 44/21-3 is in the Boulton field and lies about 30km north ofwell 44/26c-6 (see Fig. 1). Figure 12 presents the chemostrati-graphical correlation of the Schooner Formation between both
0 150
API
Str
atigra
phy
Perm
ian
Sil
ve
rpit
Fo
rma
tio
n
Upper
Ketc
h u
nit
44/26c-6
U/Th (Ni/Co)*Fe2O3
W
S1a
S1b
S1c
S1d
S1e
S1f
S2a
S2b
S3a
S3b
P
K2O/Al2O3 Ta/UCs/Al2O3
NE
SW
S2
P
S3a-c
44/21-3
0.2 0.3 0.4 0.5 0.2 0.5 0.80.2 0.3 0.4 0.5 0.6 1.0 1.5 2.0 2.5 3.0 0.10 0.15 0.20
U/Th (Ni/Co)*Fe2O3 K2O/Al2O3 Ta/UCs/Al2O3
0.2 0.5 0.80.15 0.25 0.35 0.45 0 50 100 150 0.05 0.15 0.250.2 0.6 1.0
S1b
S1c
S1d-f
Westo
e C
oal F
mLow
er
Ketc
h u
nit
0
500
ft
Westp
halia
n C
-DW
estp
halia
n B
-C
0 150Str
atigra
phy
API
Chem
ostr
at.
S3c
Silv
er. F
m.
P.
UK
UW
CF
Low
er
Ketc
h u
nit
Westp
halia
n C
-DB
-C
S.
S1a
W5
W3?
W4
Figure 12 Chemostratigraphical correlation of wells 44/21-3 and 44/26c-6.
10Pearce01.fm Page 159 Wednesday, February 23, 2005 3:37 PM
T . J . P E A R C E , D . W R A Y , K . R A T C L I F F E , D . K . W R I G H T , A . M O S C A R I E L L O
160
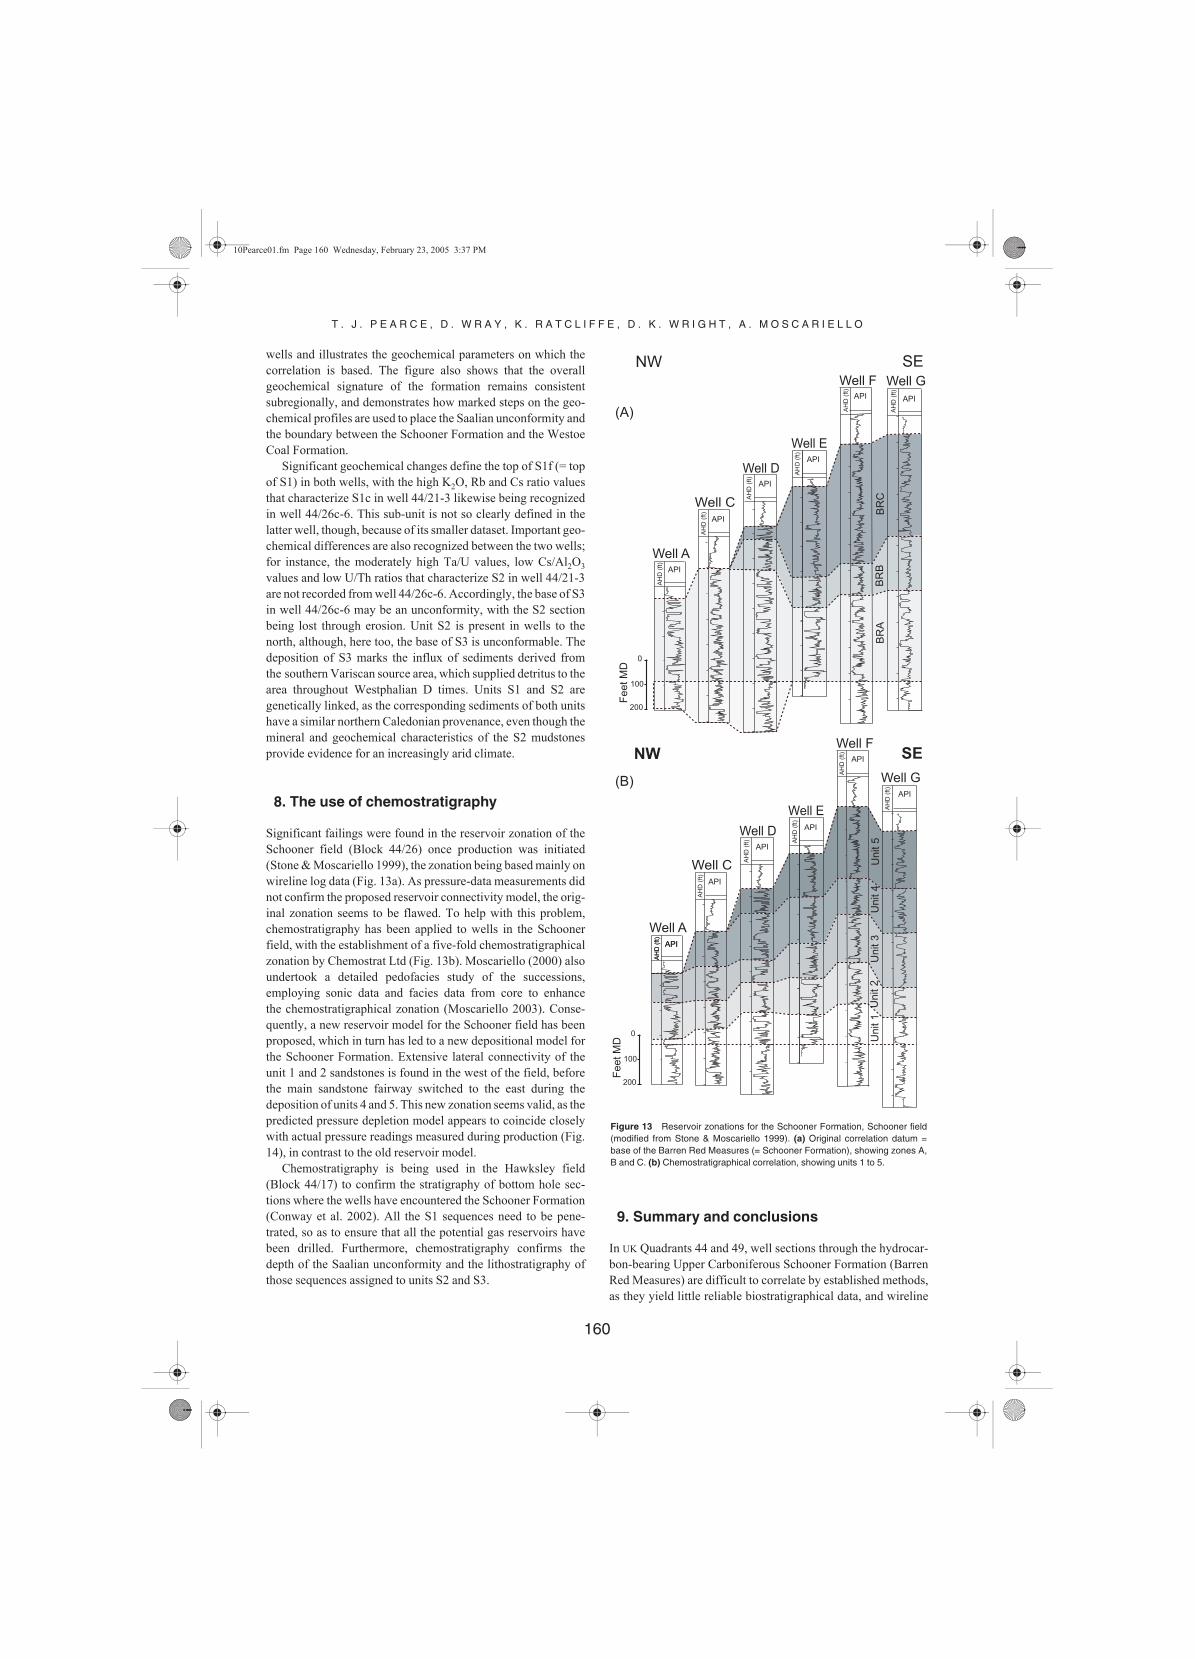
wells and illustrates the geochemical parameters on which thecorrelation is based. The figure also shows that the overallgeochemical signature of the formation remains consistentsubregionally, and demonstrates how marked steps on the geo-chemical profiles are used to place the Saalian unconformity andthe boundary between the Schooner Formation and the WestoeCoal Formation.
Significant geochemical changes define the top of S1f (= topof S1) in both wells, with the high K2O, Rb and Cs ratio valuesthat characterize S1c in well 44/21-3 likewise being recognizedin well 44/26c-6. This sub-unit is not so clearly defined in thelatter well, though, because of its smaller dataset. Important geo-chemical differences are also recognized between the two wells;for instance, the moderately high Ta/U values, low Cs/Al2O3values and low U/Th ratios that characterize S2 in well 44/21-3are not recorded from well 44/26c-6. Accordingly, the base of S3in well 44/26c-6 may be an unconformity, with the S2 sectionbeing lost through erosion. Unit S2 is present in wells to thenorth, although, here too, the base of S3 is unconformable. Thedeposition of S3 marks the influx of sediments derived fromthe southern Variscan source area, which supplied detritus to thearea throughout Westphalian D times. Units S1 and S2 aregenetically linked, as the corresponding sediments of both unitshave a similar northern Caledonian provenance, even though themineral and geochemical characteristics of the S2 mudstonesprovide evidence for an increasingly arid climate.
8. The use of chemostratigraphy
Significant failings were found in the reservoir zonation of theSchooner field (Block 44/26) once production was initiated(Stone & Moscariello 1999), the zonation being based mainly onwireline log data (Fig. 13a). As pressure-data measurements didnot confirm the proposed reservoir connectivity model, the orig-inal zonation seems to be flawed. To help with this problem,chemostratigraphy has been applied to wells in the Schoonerfield, with the establishment of a five-fold chemostratigraphicalzonation by Chemostrat Ltd (Fig. 13b). Moscariello (2000) alsoundertook a detailed pedofacies study of the successions,employing sonic data and facies data from core to enhancethe chemostratigraphical zonation (Moscariello 2003). Conse-quently, a new reservoir model for the Schooner field has beenproposed, which in turn has led to a new depositional model forthe Schooner Formation. Extensive lateral connectivity of theunit 1 and 2 sandstones is found in the west of the field, beforethe main sandstone fairway switched to the east during thedeposition of units 4 and 5. This new zonation seems valid, as thepredicted pressure depletion model appears to coincide closelywith actual pressure readings measured during production (Fig.14), in contrast to the old reservoir model.
Chemostratigraphy is being used in the Hawksley field(Block 44/17) to confirm the stratigraphy of bottom hole sec-tions where the wells have encountered the Schooner Formation(Conway et al. 2002). All the S1 sequences need to be pene-trated, so as to ensure that all the potential gas reservoirs havebeen drilled. Furthermore, chemostratigraphy confirms thedepth of the Saalian unconformity and the lithostratigraphy ofthose sequences assigned to units S2 and S3.
9. Summary and conclusions
In UK Quadrants 44 and 49, well sections through the hydrocar-bon-bearing Upper Carboniferous Schooner Formation (BarrenRed Measures) are difficult to correlate by established methods,as they yield little reliable biostratigraphical data, and wireline
Well E
Well G
Well D
Well C
Well A
NW SEWell F
BR
AB
RB
BR
C
Well E
Well G
Well D
Well C
Well AAPI
AH
D (
ft)
NW SEWell F
0
100
200
Feet M
D Unit 1
Unit 2
Unit 3
Unit 4
Unit 5
(B)
(A)
API
AH
D (
ft)
API
AH
D (
ft)
API
AH
D (
ft)
API
AH
D (
ft)
API
AH
D (
ft)
API
AH
D (
ft)
API
AH
D (
ft)
API
AH
D (
ft)
API
AH
D (
ft)
API
AH
D (
ft)
API
AH
D (
ft)
API
AH
D (
ft)
0
100
200
Feet M
D
Figure 13 Reservoir zonations for the Schooner Formation, Schooner field(modified from Stone & Moscariello 1999). (a) Original correlation datum =base of the Barren Red Measures (= Schooner Formation), showing zones A,B and C. (b) Chemostratigraphical correlation, showing units 1 to 5.
10Pearce01.fm Page 160 Wednesday, February 23, 2005 3:37 PM

C H E M O S T R A T I G R A P H Y O F T H E U P P E R C A R B O N I F E R O U S S C H O O N E R F O R M A T I O N
161
log traces are not particularly distinctive. Chemostratigraphy hasbeen applied to these sections to improve their interwell correla-tion.
Chemostratigraphy is based on the recognition of stratigraph-ical variations in the inorganic geochemistry of the sedimentarysequences, although the success of the technique depends onrelating geochemical variations to changes in mineralogy. Suchchanges are, in turn, controlled by provenance, depositionalprocesses and environments, weathering and diagenesis. Oneimportant advantage of chemostratigraphy is that ICP analysescan acquire reliable geochemical data from core samples andcuttings, only small sample volumes being required.
The study centres on well 44/21-3, which has penetrated oneof the most complete Schooner Formation successions in theSilverpit Basin. The formation is divided into S1 (= the LowerSchooner Unit and most of the Lower Ketch Unit), S2 (= upper-most part of the Lower Ketch Unit) and S3 (= Upper Ketch Unit),with these units themselves being divided into chemostrati-graphical sub-units on the basis of subtle geochemical varia-tions. The study also demonstrates the base of the SchoonerFormation corresponds to a subregional unconformity.
The chemostratigraphical units are defined by using the mud-stone data and sandstone data, and the differentiation of the unitsultimately can be related to changes in provenance and climate.The S1 mudstones have high levels of Al2O3, Fe2O3, LREEs andTiO2, which reflect the abundance of kaolinite, Fe- and Al-oxy-hydroxides and anatase. In contrast, the S3 mudstones have highlevels of K2O, Rb and Cs, because illite/mica is more abundant inthese mudstones. A few S3 mudstone samples also have highCaO, MgO and MnO contents, these samples coming from cali-ches and argillaceous lacustrine limestones. The S2 mudstoneshave intermediate K2O, Rb, Cs and Al2O3 contents. Similar
geochemical and mineralogical characteristics are found in theUpper Carboniferous mudstones of central England andelsewhere in the southern North Sea. Consequently, thesestratigraphical changes in mudstone geochemistry reflect a pro-gressive change from humid conditions to more arid climatesduring the deposition of the S2 and S3 sequences, rather than justlocalized facies changes.
An important provenance change recognized from the UpperCarboniferous sandstones in central England can also be identi-fied in well 44/21-3. Unit S1 sandstones have very high SiO2levels and relatively high TiO2, Nb, Ta and Zr levels, whichshow that they are quartzitic and have zircon–rutile–tourmalineheavy-mineral assemblages. These geochemical and mineral-ogical characteristics indicate that the sandstones have beenderived from a high-grade metamorphic terrain, probably situ-ated in southern Norway. In contrast, a few S2 sandstones and allthe S3 sandstones have higher K2O, CaO, Na2O, Rb and Cs lev-els, and higher Th/Zr and P2O5/Zr values, which show thesesandstones contain quartz, feldspar, mica and schistose andphyllitic clasts; their heavy-mineral assemblages consist ofabundant apatite, traces of garnet and less zircon than in the S1sandstones. The bulk mineralogy and geochemistry of S3 aresimilar to the onshore “Pennant facies”. Both are diachronousand prograded northwards as sediment was sourced from themountain ranges associated with the uplifted Variscan front(Besly 2002).
The important geochemical characteristics of the well 44/21-3 study interval are also recognized in other well sectionsthrough the Schooner Formation, thus enabling a subregionalinterwell chemostratigraphical correlation to be erected. Theviability of the correlation is corroborated by the new bio-stratigraphical data (McLean et al. 2005, Pearce et al. 2005). The
7000
6000
5000
4000
3000
2000
1000
0
1996.5 1997 1997.5 1998 1998.5 1999 1999.5 2000
BH
P [
psia
]
Time [years]
Well 2actual pressure survey data
matches closely the depletion
path predicted from from the
new reservoir zonation model
depletion path based on the old
reservoir zonation forced to match
the actual pressure survey data
pressure depletion model - new reservoir zonation
pressure depletion model - old reservoir zonation
pressure survey measurements
overall trend of depletion path
based on the old reservoir zonation
Figure 14 Pressure depletion of the entire reservoir for one well through the Schooner field (modified from Moscariello 2003). The graphs illustrate the depletionof the reservoir based on the original lithostratigraphical zonation and how it was forced to match the actual pressure measurements. Also illustrated is the predicteddepletion pathway for the reservoir based on the chemostratigraphical zonation, which closely matches the actual measurements.
10Pearce01.fm Page 161 Wednesday, February 23, 2005 3:37 PM

T . J . P E A R C E , D . W R A Y , K . R A T C L I F F E , D . K . W R I G H T , A . M O S C A R I E L L O
162
resolution of the interwell correlation is particularly good on thescale of an individual field, where the defining geochemicalfeatures of the correlation reflect subtle changes in detrital min-eralogy and facies. On the subregional scale, only the chemo-stratigraphical units can be correlated, this correlation beingbased on geochemical characteristics governed by changes inprovenance and climate.
Chemostratigraphy can produce the foundation for a reliablestratigraphical framework. Proprietary chemostratigraphicalstudies on the Schooner Formation and its equivalents in Quad-rants 44 and 49 and from Dutch sector Quadrants D, E and Fhave recognized similar chemostratigraphical units and sub-units to those in well 44/21-3, so allowing interwell chemostrati-graphical correlations to be erected for this formation acrossmuch of the southern North Sea. However, chemostratigraphyproduces the best results when it is part of a multidisciplinarystudy (Pearce et al. 2005).
Acknowledgements
The authors wish to thank Conoco UK Ltd and Shell UK Explora-tion and Production Ltd, plus their respective partners, for accessto samples and for permission to publish the paper. In addition,the work of Lorna Dyer from the Department of Earth Sciences,University of Greenwich, is greatly appreciated. Constructivereviews of this manuscript by two reviewers are gratefullyacknowledged, although the views expressed in this paper arethose of the authors alone.
References
Andrew, A. S., D. J. Whitford, P. J. Hamilton, S. Scarano, M. Buckley1996. Application of chemostratigraphy to petroleum explorationand field appraisal: an example from the Surat Basin. Paper (37008)presented at the SPE Asia Pacific Oil & Gas conference, Adelaide,October 1996, 421–9.
Bailey, J. B., P. Arbin, O. Daffinoti, P. Gibson, J. S. Ritchie 1993.Permo-Carboniferous plays of the Silver Pit Basin. In Petroleumgeology of northwest Europe: proceedings of the 4th conference,J. R. Parker (ed.), 707–715. London: Geological Society.
Besly, B. M. 1987. Sedimentological evidence for Carboniferous andEarly Permian palaeoclimates of Europe. Societe géologique duNord, Annales 106, 131–43.
1995. Stratigraphy of Late Carboniferous redbeds in the southernNorth Sea and adjoining land areas. Paper presented at “Strati-graphic advances in the offshore Devonian and Carboniferousrocks, UKCS and adjacent onshore areas” conference, GeologicalSociety, London, January 1995.
2002. Late Carboniferous redbeds of the UK southern North Seaviewed in a regional context [abstract: pp. 17–20]. This volume:225–226.
Besly, B. M. & C. J. Cleal 1997. Upper Carboniferous stratigraphy ofthe West Midlands (UK) revised in the light of borehole geophysicallogs and detrital compositional suites. Geological Journal 32, 85–118.
Besly, B. M., S. D. Burley, P. Turner 1993. The late Carboniferous“Barren Red Bed” play of the Silver Pit area, southern North Sea. InPetroleum geology of northwest Europe: proceedings of the 4thconference, J. R. Parker (ed.), 727–40. London: Geological Society.
Blatt, H., G. Middleton, R. Murray 1972. Origin of sedimentary rocks.Englewood Cliffs, New Jersey: Prentice-Hall.
Cameron, T. D. J. 1993. Carboniferous and Devonian of the southernNorth Sea. In Lithostratigraphic nomenclature of the UK North Sea(vol. 5), R. W. O’B. Knox & W. G. Cordey (eds), 1–93. Nottingham:
British Geological Survey.Cameron, T. D. J., A. Crosby, P. S. Balson, D. H. Jeffrey, G. K. Lott,
J. Bulat, D. J. Harrison 1992. The geology of the southern NorthSea. United Kingdom Offshore Regional Report, British GeologicalSurvey, Keyworth, Nottingham.
Cecil, C. B., R. W. Stanton, S. G. Neuzil, R. T. Dulong, L. F. Ruppert,B. S. Pierce 1985. Paleoclimate controls on Late Paleozoic sedi-mentation and peat formation in the Central Appalachian Basin.International Journal of Coal Geology 5, 195–230.
Collinson, J. D., C. M. Jones, G. A. Blackbourn, B. M. Besly, G. M.Archard, A. H. McMahon 1993. Carboniferous depositional systemsof the southern North Sea. In Petroleum geology of northwestEurope: proceedings of the 4th conference, J. R. Parker (ed.), 677–87. London: Geological Society.
Conway, A. M., I. M. Fozdar, R. Ings 2002. CMS III realizing a clusterdevelopment of Westphalian B and C/D reservoirs [abstract: p. 23].Paper presented at “Hydrocarbon resources of the Carboniferous,southern North Sea and surrounding areas” conference, YorkshireGeological Society, Sheffield, September 2002.
Cullers, R. L. 1995. The controls on the major- and trace-element evo-lution of shales, siltstones and sandstones of Ordovician to Tertiaryage in the West Mountains region, Colorado, USA. Chemical Geol-ogy 123, 107–131.
Ehrenberg, S. N. & E. Siring 1992. Use of bulk chemical analysis instratigraphic correlation of sandstones: an example from the Stat-fjord Nord field, Norwegian continental shelf. Journal of Sedimen-tary Petrology 62, 318–30.
Hauger, E., R. Lovlie, P. Van Veen 1994. Magnetostratigraphy of theMiddle Jurassic Brent Group in the Oseberg oil field, northern NorthSea. Marine and Petroleum Geology 11, 375–88.
Herron, M. M. 1988. Geochemical classification of terrigenous sedi-ments using log or core data. Journal of Sedimentary Petrology 58,820–29.
Jarvis, I. & K. E. Jarvis 1992a. Inductively coupled plasma-atomicemission spectrometry in exploration geochemistry. In Analyticalmethods in geochemical exploration, G. E. M. Hall & B. Vaughlin(eds), 139–200. Journal of Geochemical Exploration, special issue44.
1992b. Plasma spectrometry in earth sciences: techniques,applications and future trends. In Plasma spectrometry in Earth sci-ences, I. Jarvis & K. E. Jarvis (eds), 1–33. Chemical Geology 95,special issue.
Kramer, W., G. R. Weatherall, R. Offler 2001. Origin and correlation oftuffs in the Permian Newcastle and Wollombi Coal Measures, NSW,Australia, using chemical fingerprinting. International Journal ofCoal Geology 47, 115–35.
Leeder, M. R. & M. Hardman 1990. Carboniferous geology of theSouthern North Sea Basin and controls on hydrocarbon prospectiv-ity. In Tectonic events responsible for Britain’s oil and gas reserves,R. F. P. Hardman & J. Brooks (eds), 87–105. Special Publication 55,Geology Society, London.
Mange-Rajetzky, M. A. 1995. Subdivision and correlation of monoto-nous sandstone sequences using high-resolution heavy-mineralanalysis, a case study: the Triassic of the Central Graben. In Non-biostratigraphical methods of dating and correlation, R. E. Dunay &E. A. Hailwood (eds), 23–30. Special Publication 89, Geology Soci-ety, London.
McBride, E. F. 1963. A classification of common sandstones. Journalof Sedimentary Petrology 33, 664–9.
McLean, D., B. Owens, R. Neves 2005. Carboniferous miospore bios-tratigraphy of the North Sea. This volume: 13–24.
Mearns, E. W. 1988. A samarium–neodymium isotope survey of mod-ern river sediments from northern Britain. Chemical Geology 73, 1–13.
1989. Neodymium isotope stratigraphy of Gullfaks oil field. InCorrelation in hydrocarbon exploration, J. D. Collinson (ed), 201–15. London: Graham & Trotman.
Morton, A. C. 1985. Heavy minerals in provenance studies. In Prove-nance of arenites, G. G. Zuffa (ed.), 249–77. Dordrecht: Reidel.
1991. Geochemical studies of detrital heavy minerals and theirapplication to provenance studies. In Developments in sedimentaryprovenance studies, A. C. Morton, S. P. Todd, P. D. W. Haughton
10Pearce01.fm Page 162 Wednesday, February 23, 2005 3:37 PM

C H E M O S T R A T I G R A P H Y O F T H E U P P E R C A R B O N I F E R O U S S C H O O N E R F O R M A T I O N
163
(eds), 31–45. Special Publication 57, Geology Society, London.Morton, A. C. & C. Hallsworth 1994. Identifying provenance-specific
features of detrital heavy-mineral assemblages in sandstones.Sedimentary Geology 90, 241–56.
Morton, A. C. & A. Hurst 1995. Correlation of sandstones using heavyminerals: an example from the Statfjord Formation of the Snorrefield, northern North Sea. In Non-biostratigraphical methods ofdating and correlation, R. E. Dunay & E. A. Hailwood (eds), 3–22.Special Publication 89, Geology Society, London.
Morton, A. C., C. Hallsworth, A. Moscariello 2005. Interplay betweennorthern and southern sediment sources during Westphalian depo-sition in the Silverpit Basin, southern North Sea. This volume: 135–146.
Moscariello, A. 2000. Pedofacies in reservoir modelling of low net togross, barren fluvial sequences (Schooner Formation, Carbonifer-ous SNS). EAGE 62nd Conference and Technical Exhibition, 1–4.
2003. The Schooner field, blocks 44/26a and 43/30a, UK south-ern North Sea. In The United Kingdom oil and gas fields commem-orative millennium volume, J. Gluyas & H. Hichens (eds), 811–24.Memoir 20, Geological Society, London.
Pagnier, H. J. M. & P. C. H. van Tongeren 1996. Upper Carboniferousof borehole “De Lutte–6” and evaluation of the Tubbergen Forma-tion in the eastern and southeastern parts of the Netherlands. Med-edelingen Rijks Geologische Dienst 55, 3–30.
Pearce, T. J. 1991. The geology, geochemistry, sedimentology andprovenance of Late Quaternary turbidites, Madeira Abyssal PlainPhD thesis, Kingston Polytechnic.
Pearce, T. J. & I. Jarvis 1992a. The composition and provenance ofturbidite sands: Late Quaternary Madeira Abyssal Plain. MarineGeology 109, 21–51.
1992b. Applications of geochemical data to modelling sedimentdispersal patterns in distal turbidites: Late Quaternary of theMadeira Abyssal Plain. Journal of Sedimentary Petrology 62, 1112–29.
1995. High-resolution chemostratigraphy of Quaternary distalturbidites: a case study of new methods for the correlation of barrenstrata. In Dating and correlating biostratigraphically barren strata, R.E. Dunay & E. A. Hailwood (eds), 107–43. Special Publication 89,Geology Society, London.
Pearce, T. J., B. M. Besly, D. Wray, D. K. Wright 1999. Chemostratig-raphy: a method to improve interwell correlation in barren
sequences – a case study using Duckmantian/Stephaniansequences (West Midlands, UK). Sedimentary Geology 124, 197–220.
Pearce, T. J., D. McLean, D. K. Wright, C. J. Jeans, E. W. Mearns2005. Stratigraphy of the Upper Carboniferous Schooner Forma-tion, southern North Sea: chemostratigraphy, mineralogy, palynol-ogy and Sm–Nd isotope analysis. This volume: 165–182.
Pettijohn, F. J. 1975. Sedimentary rocks, 3rd edn. New York: HarperRow.
Preston, J., A. Hartley, M. Hole, S. Buck, J. Bond, M. Mange, J. Still1998. Integrated whole-rock trace-element geochemistry andheavy-mineral chemistry studies: aids to the correlation of continen-tal redbed reservoirs in the Beryl field, UK North Sea. PetroleumGeoscience 4, 7–16.
Racey, A., M. A. Love, R. M. Bobolecki, J. N. Walsh 1995. The use ofchemical element analysis in the study of biostratigraphically barrensequences: an example from the Triassic of the central North Sea(UKCS). In Non-biostratigraphical methods of dating and correla-tion, R. E. Dunay & E. A. Hailwood (eds), 69–105. Special Publica-tion 89, Geology Society, London.
Ratcliffe, K. T., T. J. Pearce, J. Martin, A. D. Hughes, in press.Enhanced reservoir characterization of the Triassic Argilo Greseux-Inferieur, Algeria using high resolution chemostratigraphy. Ameri-can Association of Petroleum Geologists, Bulletin 89.
Retallack, G. J. 1997. A colour guide to palaeosols. Chichester, Eng-land: John Wiley.
Scholle, P. A. 1979. A color illustrated guide to constituent textures,cements and porosities of sandstones and associated rocks. Mem-oir 28, American Association of Petroleum Geologists, Tulsa, Okla-homa.
Shail, R. D. & P. A. Floyd 1988. An evaluation of flysch provenance –example from the Gramscatho Group of southern Cornwall. UssherSociety, Proceedings7, 62–6.
Spears, D. A. & M. A. Amin 1981. A mineralogical and geochemicalstudy of turbidite sandstones and interbedded shales, Mam Tor,Derbyshire, UK. Clay Minerals 16, 333–45.
Stone, G. & A. Moscariello 1999. Integrated modelling of the southernNorth Sea Carboniferous Barren Red Measures using productiondata, geochemistry, and pedofacies cyclicity. Paper (56898) pre-sented at the SPE Offshore Europe 99 conference, Aberdeen, Sep-tember 1999, 1–8.
10Pearce01.fm Page 163 Wednesday, February 23, 2005 3:37 PM

EndOfPage
10Pearce01.fm Page 164 Wednesday, February 23, 2005 3:37 PM