Embed Size (px)
Citation preview

Claus-Henning Köhne
University Clinic Oncology and Haematology
North West German Cancer Center (NWTZ)
Chemotherapy and Targeted Agents in First Line mCRC
ESMO Preceptorship Barcelona 2017
ESMO Consensus 1st line approach

ESMO Consensus 1st line approach
Cytoreduction is
best disease
control !
I always treat a
patient to achieve
tumor shrinkage!Artificial differentiation of cytoreduction &
disease control
Modified ESMO Consensus 1st line approach
In any case
Check for secondary resectability!
Pending to be included:
MSI, Her2/neu

Cremolini et al. Lancet Oncol 2015
Survival according to molecular subgroups
RASw.38%
RAS mut38%
RAS mut MSI8%
BRAF mut8%
RAS wt MSI8%
Her2/neu
~5%

EGFR in RAS wt disease

Influence of KRAS and RAS mutational status on survival
Randomised trials of EGFR antibodies
1st line infusional 5-FU regimens
Trial Therapy OS (mo)
KRAS wt
OS (mo)
RAS wt
OS (mo)
RAS mut
CTx +EGFR CTx +EGFR CTX +EGFR
CRYSTAL
(n=666)
FOLFIRI
+/- Cetux*20.0 23.5 20.2 28.4 17.7 16.4
PRIME
(n=656)
FOLFOX
+/- Pani*19,4 23.8 20.2 26.0 19.2 15.6
OPUS
(n=197)
FOLFOX
+/- Cetux*18,5 (22.8) 17.8 19.8 17.8 13.5
Chinese
(138)
Chemo
+/- Cetux21.0 30.9 - - - -
TAILOR
(n=354)
FOLFOX
+/- cetux17.8 20.7
Van Cutsem E, et al. J Clin Oncol. 2011;29(15):2011-2019. Ye LC, et al. J Clin Oncol. 2013;31(16):1931-1938. Douillard
JY, et al. J Clin Oncol. 2010;28(31):4697-4705. Bokemeyer C, et al. Ann Oncol. 2011;22(7):1535-1546.

An EGFR antibody added to a doublet significantly
increases RR, and prolongs PFS and OS compared to
a doublet alone. This prolongation of OS is clinically
relevant
4 out of 5 trails showed a significant survival increase
EGFR antibodies for RASwt mCRC in 1st line
EGFR or VEGF in RAS wt disease
Head-to-Head comparison

Head to Head comparison Cetuximab vs Bevacizumab 1st line RASwt
1st Line mCRC RAS wt
Trial Doublet Biological OS HR P-value
FIRE 3
(n=400) FOLFIRI
Cetuximab 33.1
0.70 <0.006
Bevacizumab 25.0
PEAK
(n=170)FOLFOX
Panitumumab 36.9
0.76 0.15Bevacizumab 28.9
CALGB* 80405
(n=390)FOLFOX
Cetuxumab 32.5
0.86 0.2
Bevacizumab 29.0
3 different trials are displayed
Heinemann V, et al. Lancet Oncol. 2014;15(10):1065-1075.. Rivera F, et al. Eur J Cancer. 2015;51(Suppl 3): Abstract 2014.
Lenz H-J, et al. Eur J Cancer. 2014;50(Suppl): Abstract 501O. Venook JAMA 2017

FIRE 3 & CALGB Overall Survival in RASwt diesase
Heinemann et al. Lancet Oncol 2014
(HR 0·70, 95% CI 0·53–0·92;
p=0·011)
Venook et al. JAMA 2017

© 2017 American Medical Association. All rights reserved.
eFigure 4. Overall Survival (OS) by Treatment Biologic among patients on the mFOLFOX6 Chemotherapy Regimen (Oxaliplatin 85 mg/m2 over 120 minutes, leucovorin 400 mg/m2 over 2 hours followed by 5FU 400 mg/m2 bolus then 5FU 2400 mg/m2 by 46-48 hour infusion)*
*Tick marks denote the last known follow-up time for patients with no death date reported.
*HR and P-value are adjusted for prior adjuvant therapy, prior radiotherapy, protocol chemotherapy and randomization pre- or post-amendment restricting eligibility to KRAS wt.
Arm N
(Events)
OS Median
(Interquartile
Range)
Adjusted
HR
(95% CI)
Adjusted
P*
Chemotherapy +
Bevacizumab
409
(329)
27.7
(14.2-45.4) 0.83
(0.71-0.98) 0.03
Chemotherapy +
Cetuximab
426
(317)
30.1
(13.5-53.6)
Downloaded From: http://jamanetwork.com/ by a University Medical Center Hamburg - Eppendorf User on 07/16/2017
© 2017 American Medical Association. All rights reserved.
eFigure 2. Forest plots for comparisons of Overall Survival (OS) by Treatment Regimen Overall and within each level of Sex, Race and Chemotherapy. Hazard ratios and 95% Confidence Intervals are provided
Downloaded From: http://jamanetwork.com/ by a University Medical Center Hamburg - Eppendorf User on 07/16/2017
CALGB 80405 Survival
mFOLFOX only
Venook et al. JAMA 2017 Supplement 2

PRIME – OS – 1st line
HR, hazard ratio; OS, overall survival; Pmab, panitumumab
Overall survival (months)
100
80
60
40
20
0
Ka
pla
n-M
eie
r e
stim
ate
0 4 8 12 16 20 24 28 32 36 40 44 48 52 56 60 64 68
169 159 39
49
164 151 36
42
147 137 26
34
136 120 18
28
124 103 17
23
107 86 15
20
97 76 13
14
86 64 11
11
77 56 8
9
66 44 6
8
56 32 5
7
46 24 4
6
39 21 4
5
30 19 4
4
16 11 3
1
11 6 1
1
3 1 1
0
0 1 0
No. of subjects: 1: 2:
3: 4:
Censor indicated by vertical bar
48P
rob
abili
ty o
f O
S
Time (months)
1.0
0.9
0.8
0.7
0.6
0.5
0.4
0.3
0.2
0.1
0.0
0 362412
Median OS (95% CI), months
Pmab +
FOLFOX FOLFOX HR (95% CI)
Left 328 30.3 23.6 0.73 (0.57–0.93)
Righ
t 88 11.1 15.4 0.87 (0.55–1.37)
1: Pmab + FOLFOX left
2: FOLFOX left
3: Pmab + FOLFOX right
4: FOLFOX right
Median OS (95% CI), months
Cet+
FOLFIRIFOLFIRI HR (95% CI)
Left 280 28.7 21.70.65 (0.50-0.86)
P=0.002
Righ
t84 18.5 15.0
1.08( 0.65-1.81)
P=0.78
1: Cet + FOLFIRI left
2: FOLFIRI left
3: Cet + FOLFIRI right
4: FOLFIRI right
The role of sideness for a doublet +/- EGFR
PRIME: FOLFOX +/- Panitumumab CRYSTAL: FOLFIRI +/- Cetuxumab
Teijpar et al. Jama Oncol 2016Peeters et al. ESMO 2016
∆ 6.7 mo ∆ 10.2 mo


5 o
f 9
| JN
CI J N
atl C
an
cer Inst, 2
01
5, V
ol.1
07
, No.3
ARTICLE
Table 2. Unadjusted analyses of survi val outcom es by pr im ary tum or locat ion and stud y*
Cohort
OS events
No. (%)
Median OS, m onths (95% CI)
HR (95% CI) P PFS events No. (%)
Median PFS, m onths (95% CI)
HR (95% CI) PRight -sided tum ors Left -sided tum ors Right -sided tum ors Left -sided tum ors
PROVETTA
All el igible pat ien ts
(n = 200)
77 (38.5%) 24.8 (19.1 to 29.8) 42.0 (32.1 to 53.5) .44 (.28 to .70) <.001 147 (73.5%) 9.9 (8.3 to 11.7) 12.1 (11.1 to 15.8) .52 (.36 to .75) <.001
Nonm ucinous/BRAF
w i ld-type subgr oup
(n = 155)
54 (34.8%) 28.8 (20.1 to 33.0) 47.6 (32.1 to 53.5) .52 (.30 to .93) .02 112 (72.3%) 10.0 (8.8 to 13.1) 13.0 (11.5 to 15.9) .54 (.34 to .84) .01
AVF2107g
Evaluable pat ien ts
(n = 559)
264 (47.2) 14.6 (12.0 to 16.9) 20.4 (18.7 to 24.2) .55 (.43 to .70) <.001 363 (64.9) 7.1 (5.6 to 8.1) 8.5 (8.2 to 10.3) .68 (.55 to .83) <.001
CT arm (n = 282) 144 (51.1) 13.6 (10.6 to 16.7) 18.0 (15.7 to 21.7) .62 (.44 to .86) .01 206 (73.0) 5.4 (4.4 to 5.8) 8.0 (5.7 to 8.3) .72 (.55 to .96) .02
CT + bevacizum ab arm
(n = 277)
120 (43.3) 15.9 (12.7 to 19.6) 24.2 (19.5 to NE) .49 (.34 to .70) <.001 157 (56.7) 8.7 (8.1 to 10·.6) 11.1 (9.4 to 13.8) .62 (.45 to .85) .01
NO16966
Evaluable pat ien ts
(n = 1268)
994 (78.3) 18.0 (16.5 to 19.8) 23.0 (21.5 to 24.4) .71 (.62 to .82) <.001 1127 (88.9) 7.6 (7.0 to 8.3) 8.9 (8.5 to 9.3) .90 (.79 to 1.03) .12
CT arm s (n = 827) 664 (80.3) 17.0 (14.7 to 18.5) 22.0 (20.5 to 23.7) .67 (.57 to .80) <.001 751 (90.8) 7.0 (6.0 to 7.9) 8.3 (7.9 to 8.8) .87 (.74 to 1.03) .10
CT + bevacizum ab arm s
(n = 441)
330 (74.8) 20.6 (17.6 to 24.7) 24.7 (22.2 to 27.6) .78 (.61 to .99) .04 376 (85.3) 8.6 (7.6 to 10.2) 10.0 (9.2 to 10.8) .95 (.76 to 1.19) .64
* Cox proport ional hazards regression analyses. Al l stat ist ical tests w ere tw o-sided. CI = con f dence in terval; CT = chem otherapy; HR = hazard rat io; OS = overal l survival; PFS = progression-free survival.
by guest on October 9, 2016 http://jnci.oxfordjournals.org/ Downloaded from
Loupakis et al. JNCI J Natl Cancer Inst 2015
Prognostic value of primary tumor side : Doublet +/- VEGF
p-value ? p-value ?
Is Bevacizumab improving OS over FOLFOX/XELOX
in left or right sided tumors?
• This question has probably been addressed in this study, but has not been reported
• We don’t know whether Bev is working in left or right sided tumors
• It is unlikely that sideness plays a role for Bevacizumab
Left Right

0.0
0.2
0.4
0.6
0.8
1.0
Pro
ba
bil
ity o
f O
S
12 6024 36 48
Months
0 72
Median OS (95% CI), months
Cet + FOLFIRI Bev + FOLFIRI HR (95% CI)
Left 306 38.3 28.00.63
P=0.002
Right 88 18.3 23.01.31
P=0.28
Median OS (95% CI), months
Cet + FOLFIRI Bev + FOLFIRI HR (95% CI)
Left 325 39.3 32.70.77
P=0.04
Right 149 13.7 29.21.36
P=0.10
EGFR vs. VEGF all plus Doublet and influence of side of primary
FIRE-3 CALBG 80405
Teijpar et al. JAMA Oncol 2016 Venook et al. ESMO 2016


Right Left
DCTripplet?/ Doublet
+/-VEGF?
Doublet+EGFR
CyRDoublet+
EGFRDoublet+
EGFR
Right Left
DCDoublet+
VEGFDoublet+
EGFR
CyRTriplet+
VEGFDoublet+
EGFR
Right Left
DCDoublet+VEGF
Doublet+EGFR
CyR
Doublet+EGFR
Triplet+VEGF
Doublet+EGFR
Different perspective about Sidedness from EU and US
Key opinion leaders have changed their thought
DC: Disease Control CyR: Cytoreduction
Treatment of RAS wt mCRC

RAS mutant disease

Randomised trials of VEGF antibodies in 1st line mCRC
irrespectively of RAS mutational status
Trial N Pat Therapy ORR PFS (mo) OS (mo)
Bevacizumab plus less effective chemotherapy
AGITG 313 Capecitabine+/- Beva 31% vs. 38% 5.7 vs. 8.5 18.9 vs. 18.9
UK 280 Capecitabine+/- Beva (>70y) 48% vs. 57% 5.1 vs. 9.1 16.8 vs. 20.7
AVF2107g 813 IFL +/- Bev 35% vs. 45% 6.2 vs. 10.5 15.6 vs. 20.3
Bevacizumab plus effective chemotherapy
NO16966 700 FOLFOX+/- Beva 38% vs. 38% 8.6 vs. 9.4 20.3 vs. 21.2
700 CAPOX+/- Beva 38% vs. 38% 5.1 vs. 9.1 16.8 vs. 20.7
ITACA 376 Doublet+/- Beva 48% vs. 49% 8.4 vs. 9.6 20.6 vs. 20.6
0FOLFIRI +/- Bev
FOLFOXIRI / +/- Bev Such a studies were never done

NO16966 PFS CTx +/- Bevacizumab :
XELOX and FOLFOX subgroups
FOLFOX+placebo
FOX+bevacizumab
Cassidy et al. ASCO 2007; Saltz et al. JCO 2008, Table 1A appendix
9.37.4
1.0
0.8
0.6
0.4
0.2
0
0 5 10 15 20 25Months
PF
S e
sti
mate
XELOX+placebo
XELOX+bevacizumab
FOLFOX
FOLFOX+
Bev XELOX
XELOX
+Bev
N Pat 351 349 350 350
PFS mo 8.6 9.4 7.4 9.3
HR
97.5% CI
0.89
0.73 - 1.08
0.77
0.63 – 0.94
p-value 0.19 0.0026
OS (mo) 20.3 21.2 19.2 21.4
HR
97.5% CI
0.94
0.75 to 1.16
0.84
0.68 – 1.04
P-value n.s. n.s.

RASwt or mut: Doublet vs. Triplet
RASwt or mut disease
Regimen N RR PFS OS Author
FOLFIRI 122 41% 6.9 16.7 Falcone JCO 2007
+/- Oxaliplatin 122 66% 9.9 23.6
FOLFIRI / Bev 256 53% 9.7 25.8 Falcone NEJM 2015
+/- Oxaliplatin 252 65% 12.2 29.8
FOLFOX / Bev 39 62% Grünberger Ann Oncol 2015
+/- Irinotecan 41 81%
FOLFOX / Bev 121 60% 9.8 n.a. Schmoll ESMO 2016
+/- Irinotecan 121 79% 12 n.a.
• Unroven / unclear role of bevacizumab

Cremolini et al. Lancet Oncol 2015
Triplet is not better than doublet Group Events/No. OS (95% CI), months
RAS/BRAF WT (Arm
A)51/79 25.2 (20.8-29.8)
RAS/BRAF WT (Arm
B)40/79 32.2 (26.1-46.1)
RAS MT (Arm A) 68/97 21.3 (19.6-23.0)
RAS MT (Arm B) 65/97 23.2 (18.1-28.4)
BRAF MT (Arm A) 11/12 12.4 (10.2-20.2)
BRAF MT (Arm B) 8/10 7.8 (4.7-13.5)
Doublet is not better than FP+Bev
What is the best treatment for RAS mutant disease?
FOLFIRI/Bev +/- Oxaliplation FP/Bev +/- Irinotecan
Modest et al. ESMO 2017
Discussion Presented at ESMO 2017
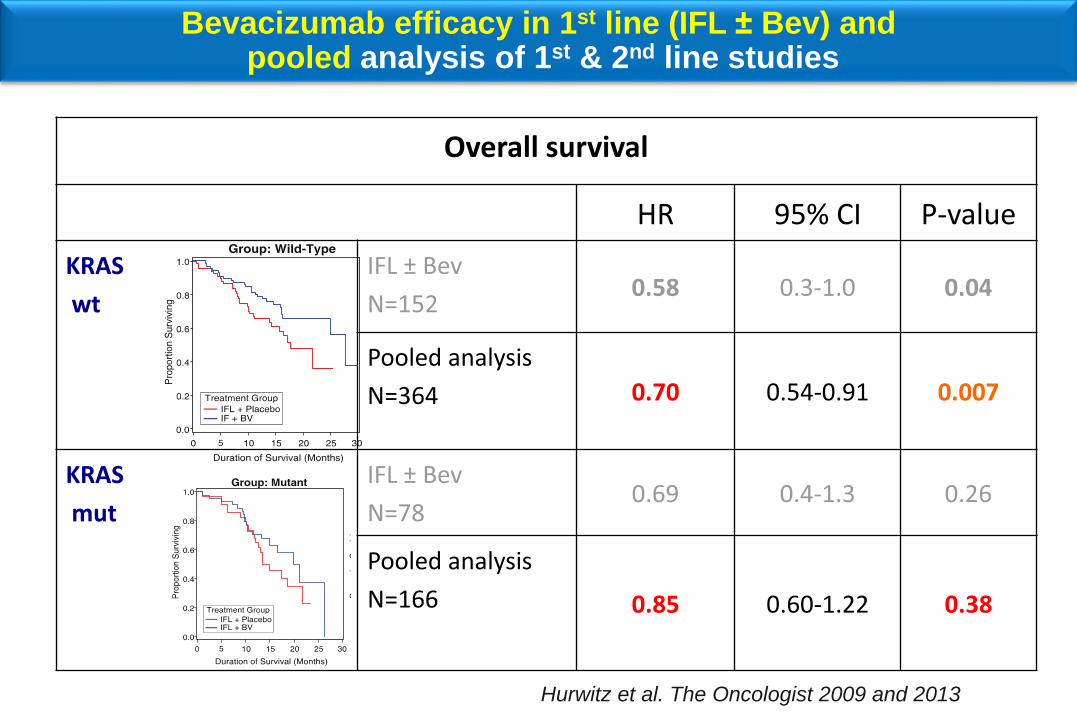
Bevacizumab efficacy in 1st line (IFL ± Bev) andpooled analysis of 1st & 2nd line studies
Overall survival
HR 95% CI P-value
KRAS
wt
Pooled analysis
N=364 0.70 0.54-0.91 0.007
KRAS
mut
Pooled analysis
N=166 0.85 0.60-1.22 0.38
Hurwitz et al. The Oncologist 2009 and 2013

TML study : Chemo ± bevacizumab continued in 2nd line
Survival difference mainly driven by KRASwt subgroup
Kubicka et al. Ann Oncol 2014
PFS CTx +Bev HR p-value
KRASwt 4.5 6.4 0.61 <.0001
KRASmut 4.1 5.5 0.70 0.0027
OS CTx +Bev HR p-value
KRASwt 11.1 15.4 0.69 0.0052
KRASmut 10.0 10.4 0.92 0.5
PFS
OS
RASwt RASmu

SAGLB.AFL.17.03.0196e (06/17)
ESMO Guidelines: No Guidance on KRAS Exon 2 WT/MUT Alone
Aflibercept Comparable to Other Anti-VEGF Agents in KRAS Exon 2 WT and MUT
WTMUT
Wirapati P, et al. J Clin Oncol. 2017;35 (suppl; abstr 3538); Ince WL et al. J Natl Cancer Inst. 2005;97:981-9; Kubicka S et al. Ann Oncol.
2013;24:2342‒2349; Obermannova et al. Ann Oncol. 2016;27:2082‒2090; Wirapati P, et al. J Clin Oncol. 2017;35 (suppl; abstr 3538).
Retrospective evaluation of a limited dataset can only be hypothesis generating
KRAS

RASmut disease
The best treatment for RASmut disease is unknown
A Doublet may still be the best
Developing new treatments is a medical need

BRAF mutant disease
Cremolini et al. Lancet Oncol 2015

N=28 N=70 N=30
1st line 1st line 2nd line
FOLFIRI/Bev +/- Oxaliplatin Doublet +/- Cetuximab Doublet+/- Afflibercept
Cremolini et al. Lancet Oncol 2015 Bokemeyer C..Köhne, et al. J Clin Oncol
2010;28(Suppl. 15):Abstract No. 3506
Tejpaer et. al. WVGIC 2017
Treatment BRAF mut tumors
1st line experience
N=70
SAGLB.AFL.17.03.0196e (06/17)
BRAFOS PFS
Retrospective evaluation of a limited dataset can only be hypothesis generating
BRAF/plcboBRAF/afli
Adapted from Wirapati P, et al. J Clin Oncol. 2017;35 (suppl; abstr 3538).
BRAF
/
/ / / / /
/
/ //
//
/ // //
/ //
// / / / / / /
/
/
/
/
/ / ///
////// /
/ / /// /
// /
// /
/ / // / / /
/// //
//
/
/
//// /
/ / / //
// / / / //
/
/// /
/
// /
////
/// // ///
/// // /
/ / / / /
0 5 10 15 20 25 30 35
0.0
0.2
0.4
0.6
0.8
1.0
events
1911
months
median surv
5.5 [ 3.5,10.6]10.3 [ 5.3, NA]
number at risk:
20 12 5 2 1
16 12 8 4
BRAF/afli vs BRAF/plcbo: HR = 0.416 [0.158, 1.09] p = 0.076
A)
three way/arm
BRAF/plcboBRAF/afli
OS
/
/
/
/
/
/
/ /
/
//
/
/
/
////
/
/
//
// /
////
/
// ///////
////
//
/
/
/
/
/
/ //
/
//
/
// / /
///
/
/
////
/ / ///
/////
//// /
/
/
//
/
0 5 10 15 20 25
0.0
0.2
0.4
0.6
0.8
1.0
PF
S
events:
1711
median surv:2.2 [ 1.4, 8.3]5.5 [ 2.7, NA]
number at risk:
20 4 2 116 8 2 1
BRAF/afli vs BRAF/plcbo: HR = 0.589 [0.22, 1.58] p = 0.29
B)
three way/arm
BRAF/plcboBRAF/afli
BRAF/plcboBRAF/afli
months

Summary BRAF mCRC
▪ Patients with BRAF mut disease have a poor prognosis
▪ Consider Intensive chemotherapy (FOLFOXIRI)
▪ EGFR inhibitors have a role
▪ VEGF inhibitors may have a role
▪ Combinations with EGFR, BRAF & MEK inhibitors are emerging
▪ Randomised trials are ongoing
▪ At the moment no drug or combination can be preferred or
excluded

Modified ESMO Consensus 1st line approach
In any case
Check for secondary resectability!
Options:
Triplet +/- Bev
Doublet +/- EGFR
BRAF / MEK / EGFR
BRAF / EGFR / Irinotecan
BRAFmt
Generally:
Doublet
No evidence for VEGF in
1st line
RASmut
Generally
Left: Doublet + EGFR
Right: Doublet / Tripplet
+/- VEGF?
CyR: Doublet+EGFR
RASwt


Trial name N Prevalence of MSI-H/dMMR
Overlapping
BRAF V600E
mutation
Pooled dataset1 3,063 5.0% 34.6%
AIO Colorectal Study Group2 104 4 % Not reported
Australia and United States3 NA Not reported 30%
Review Article4 NA 3% - 5% Not reported
GI-SCREEN-JAPAN5 853 1.9% 40%
NCCE6 277 1.9% 40%
1. Venderbosch S, et al. Clin Cancer Res. 2014;20(20):5322-5330. 2. Müller CI, et al. Int J Colorectal Dis. 2008;23(11):1033-1039. 3. Goldstein J, et al. Ann
Oncol. 2014;25(5):1032-1038. 4. Cohen R, et al. Curr Ocol Rep. 2016;18(3):18. 5. Kajiwara T, Yoshino T, et al. J Clin Oncol. 2016;34(suppl): Abstract 3591.
6. Kawazoe A, Yoshino T, et al. J Clin Oncol. 2016;34(suppl 4): Abstract 629.
Prevalence of MSI-H or dMMR mCRC:Cross-Trial Comparison
Note: GI-SCREEN-JAPAN is the Nationwide Cancer Genome Screening Project for Gastrointestinal Cancer in Japan
dMMR, mismatch repair-deficient
Retrospective IIR MSI-H

CALGB 80404: MSI Status Does Not Impact OS (29/418, 6.9%)
Months From Randomization
31.8 months (29.0-35.2)N = 38930.3 months (22.6-NE)N = 29
Median OS (95% CI)
MSSMSI-H
0 12 24 36 48 60 72
0.00
0.25
0.50
0.75
1.00
Pro
po
rtio
n W
ith
ou
tE
ve
nt
Innocenti F, et al. J Clin Oncol. 2017;35(suppl 4): Abstract 3504.
BRAF+ 52%
BRAF+ 11%
HRadj 0.84 (95% CI 0.51-1.39), P = .50

Le et al. NEJM 2015

Regimen N RR Disease Control PFS
Dabrafenib (BRAF)
+ Panitumumab (EGFR)20 10% 90%
Dabrafenib (BRAF)
+Panitumumab (EGFR)
+Trametinib (MEK)
35 26% 96%
Irinotecan
+Cetuximab (EGFR)47 4% 22% 2.0
Irinotecan
+Cetuximab (EGFR)
+Vemurafennib (BRAF)
44 16% 67% 4.3
BRAFmut disease results from Phase II trials
Chloe Atreya at 2015 ASCO
Kopetz et al. ASCO 2017
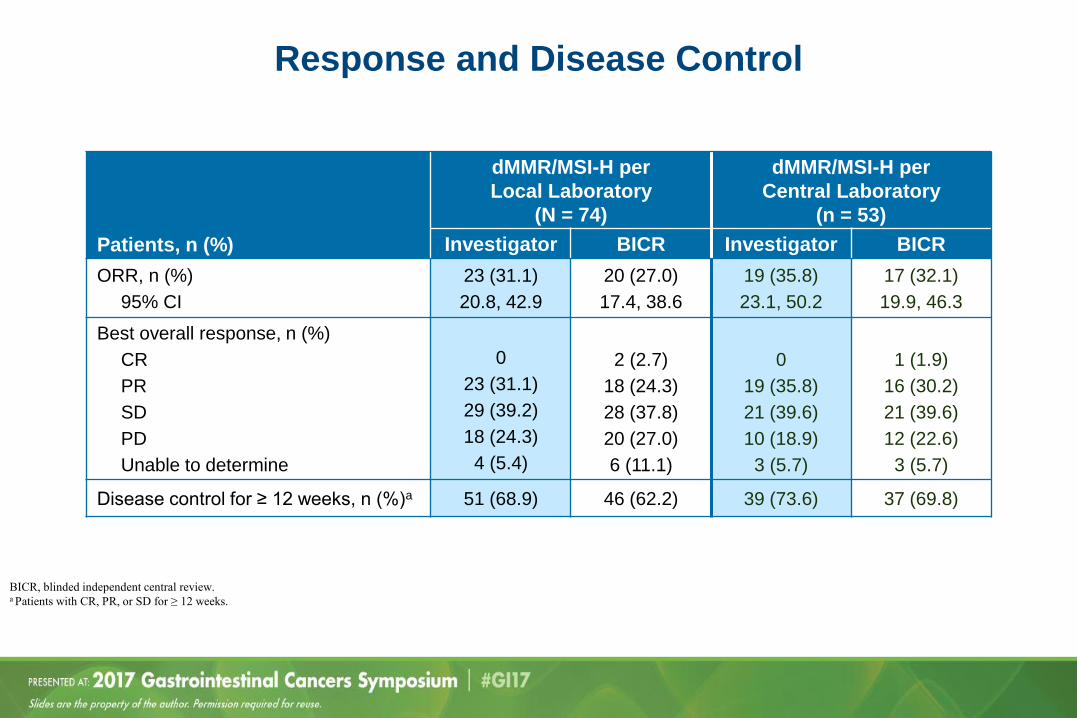
Response and Disease Control
Patients, n (%)
dMMR/MSI-H per
Local Laboratory
(N = 74)
dMMR/MSI-H per
Central Laboratory
(n = 53)
Investigator BICR Investigator BICR
ORR, n (%)
95% CI
23 (31.1)
20.8, 42.9
20 (27.0)
17.4, 38.6
19 (35.8)
23.1, 50.2
17 (32.1)
19.9, 46.3
Best overall response, n (%)
CR
PR
SD
PD
Unable to determine
0
23 (31.1)
29 (39.2)
18 (24.3)
4 (5.4)
2 (2.7)
18 (24.3)
28 (37.8)
20 (27.0)
6 (11.1)
0
19 (35.8)
21 (39.6)
10 (18.9)
3 (5.7)
1 (1.9)
16 (30.2)
21 (39.6)
12 (22.6)
3 (5.7)
Disease control for ≥ 12 weeks, n (%)a 51 (68.9) 46 (62.2) 39 (73.6) 37 (69.8)
BICR, blinded independent central review.a Patients with CR, PR, or SD for ≥ 12 weeks.
Presented by: Dr Michael J. Overman

Overall Survival
Presented by: Dr Michael J. Overman
NR, not reached. a dMMR/MSI-H assessed by local laboratory.
3 6 9 12 15 18 21 2724
74 64 54 24 21 21 14 10 3 0
0
10
20
30
40
50
60
70
80
90
100
Pro
bab
ilit
y o
f S
urv
ival
(%)a
Median OS [95% CI], months
12-month OS rate [95% CI], %
NR [17.1, NE]
73.8 [59.8, 83.5]
Months
No. at risk
0
Progression-Free Survival
Presented by: Dr Michael J. Overman
PFS per Investigator
Median [95% CI], months
12-month rate [95% CI], %
9.6 [4.3, NE]
48.4 [33.6, 61.7]
PFS per BICR
12-month rate [95% CI], % 45.6 [32.2, 58.1]
BICR, blinded independent central review; NE, not estimable. a Investigator assessed dMMR/MSI-H by local laboratory.
0 3 6 9 12 15 18 21 24
Months
74 48 22 14 12 10 7 3 0No. at risk
0
10
20
30
40
50
60
70
80
90
100
Pro
bab
ilit
y o
f P
FS
(%
)a
Nivolumab in pretreated MSI-H mCRC - Checkmate 142
Patients, n (%)
dMMR/MSI-H per
Local Laboratory
(N = 74)
dMMR/MSI-H per
Central Laboratory
(n = 53)
Investigator BICR Investigator BICR
ORR, n (%)
95% CI
23 (31.1)
20.8, 42.9
20 (27.0)
17.4, 38.6
19 (35.8)
23.1, 50.2
17 (32.1)
19.9, 46.3
Overman-M ASCO 2017

Overm
an M,
et al.
J Clin
Onco
l. 2017
;35(su
ppl 4S
): Abs
tract
519.
ORR 5
5%, D
CR 79
%
50 -50 -100075 25 -25 -75
(((
100 Best Reduction From Baseline inTarget Lesion
(
( ( (( ( (( (( (( (( ((( ((
( (( (( ( (( (( ((( (( (((((( ((( ( ( (
(Co
nfirme
d CR o
r PR p
er inv
estiga
tor
Tumor
Resp
onse
(Nivo
lumab
+ Ipil
imum
ab)
-100100(%
)
050 -50
Confir
med C
R/PR
Ref: N
IVOmo
nother
apy
ORR 3
1.1%,
DCR 6
8.9%

Time
00.0
213
1.0 0.4
69
1215
18
Probability of Progression-Free Survival
0.8 0.20.9 0.30.6 0.10.7 0.5
(mo
nths(
NE, no
t estim
able; N
R, not
reach
ed.
PFSr
ate(
95(CI)
, (
6-mont
h77(
66.5, 8
5.1(
9-mont
h77(
66.5, 8
5.1(
Media
n PFS(
95(CI)
, mont
hsNR
(11.
5, NE(
PFS (
Nivolu
mab +
Ipilim
umab
)
027
0100 Probability of PFS 2040608090 10305070(%)
36
912
1518
2124
PFSr
ate(
95(CI)
, (
12-mo
nth48.
4(33.
6, 61.7
(
Media
n PFS(
95(CI)
, mont
hs9.6
(4.3
, NE(
Ref: N
IVOmo
nother
apy
Overm
an M,
et al.
J Clin
Onco
l. 2017
;35(su
ppl 4S
): Abs
tract
519.

Time
00.0
213
1.0 0.4
69
1215
18
Probability of Overall Survival
0.8 0.20.9 0.30.6 0.10.7 0.5
(mo
nths(
NE, no
t estim
able; N
R, not
reach
ed.
OSrat
e(95(
CI(, (
6-mont
h89(
80.2, 9
4.2(
9-mont
h88(
78.1, 9
3.1(
Media
n OS(
95(CI)
, mont
hsNR
(NE
, NE(
OS (N
ivolum
ab + I
pilim
umab
)
OSrat
e(95(
CI(, (
12-mo
nth73.
8(59.
8, 83.5
(
Media
n OS(
95(CI)
, mont
hsNR
(17.
1, NE(
03
27
0100
69
1215
1821
Probability of survival
2040608090 10305070(%)
24
Ref: N
IVOmo
nother
apy
Overm
an M,
et al.
J Clin
Onco
l. 2017
;35(su
ppl 4S
): Abs
tract
519.

• Hold drug
• Steroids -> taper down
• Hospitalize if >= Grade 3
• If unresolved symptoms
• Consider infliximab
• Contact Organ specialist
Champiat et al. Ann Oncol 2016

Ch
ange
in t
arge
t le
sio
nfr
om
bas
elin
e (
%)
HER2 3+ HER2 2+ Patients on treatment PD NEW LESION
Waterfall plot
(best % tumor shrinkage)
Spaghetti plot
(tumor shrinkage trend)
Ch
ange
in t
arge
t le
sio
nfr
om
bas
elin
e (
%)
Trastuzumab/Lapatinib
Responses by HER2 IHC Score (46/849 5.4%)
RR 34%
Trastuzumab iv 4mg/kg load and then 2mg/kg/qwLapatinib po 1000 mg/qd
*3 patients are not shown: 122026 (IHC 2+,not yet assessed);
121011 (IHC 3+) and 121013 (IHC 3+) early clinical PDs.

Thank you for your attention