Embed Size (px)
Citation preview

CHENCHU LIVELIHOOD ENHANCEMENT PROJECT
(CHELE)
Monitoring, Evaluation and Learning Report
Prepared for
Centre for People’s Forestry (CPF)
By
Poverty Learning Foundation 12-5-149/6A, Vijayapuri,
Tarnaka, Secunderabad- 500 017
Andhra Pradesh
Phone & Fax: (040) 27017428
Web site: www.plf.org.in
Email: [email protected]
December 2009

ii
CONTENT
Executive Summary
CHAPTER 1: INTRODUCTION.................................................................................... 1
CHELE PROJECT.............................................................................................................. 2
IMPACT STUDY ............................................................................................................... 6
STRUCTURE OF THIS REPORT..................................................................................... 9
CHAPTER 2: SOCIO-ECONOMIC PROFILE.......................................................... 10
PROFILE OF SAMPLE HOUSEHOLDS........................................................................ 35
PROFILE OF SAMPLE TRAINEES ................................Error! Bookmark not defined.
CHAPTER 3: LIVELIHOODS ..........................................Error! Bookmark not defined.
EFFORTS TO TRANSFORM CHENCHUS ECONOMY.............................................. 10
LIVELIHOODS PORTFOLIO OF CHENCHUS ............................................................ 17
LAND RESOURCES ....................................................................................................... 19
LIVESTOCK POSSESSION............................................................................................ 22
TRENDS IN NTFP USE ...................................................Error! Bookmark not defined.
HONEY HARVESTING.................................................................................................. 11
CHAPTER 4: SUMMARY AND CONCLUSIONS .................................................... 31
ANNEX 1: SOCIO-ECONOMIC PROFILE OF SAMPLE HOUSEHOLDS.......... 35
ANNEX 1: FUNCTIONING OF STITCHING CENTRE ..........................................39

iii
ACKNOWLEDGEMENTS
Poverty Learning Foundation is grateful to the Centre for Peoples’ Forestry (CPF) and
SDTT for this assignment and continuous guidance throughout the study period.
Dr. Suryakumari (Director, CPF), Dr. Urmila Pingle (Managing Trustee, CPF), and Sri
C.Vasu (Senior Programme Officer-SL, CPF) provided timely insight into log-frame
outcome areas and indicators and rendered support during the initial phase of the study.
Comments on several methodological issues from Sri Bhaskar Mittra from SDTT have
been very useful.
Last, but not the least, the study team places on record its deep sense of gratitude to the
sample communities and households for all the valuable information. The team thanks
the field functionaries of CPF, CONARE and CHRD for help and support during the field
study.
The PLF Study Team
N. L. Narasimha Reddy
P. Sudhakar Reddy
M. Manohar
K. Kumarswamy Reddy
T. Jayachandra
N. Saidulu
P. Ramulu

1
CHAPTER 1: INTRODUCTION
NAGARJUNA SAGAR SRISILAM TIGER RESERVE AND LIVELIHOODS OF
CHENCHU COMMUNITY
Nagarjuna Sagar Srisailam Tiger Reserve (NSTR)1 was established in 1978. It spreads in
an area of 3570 square kilometres encompassing five districts viz., Mahaboobnagar,
Kurnool, Prakasam, Nalgonda and Guntur2. The area is predominantly inhabited by
Chenchus3, which is a primitive tribal group, followed by Lambada and Erukala. The
Forest Department has formed the Eco-Development Committees (EDCs) in NSTR by
organizing members primarily from tribal communities for involving them in protection
and conservation of bio-diversity.
The Chenchu tribe was recognized as one of the primitive tribal groups in 1975 (GOI
1985-90). The Chenchus are listed as Scheduled Tribe in Andhra Pradesh under
Scheduled Castes and 168 P. Scheduled Tribes Lists Modifications Order, 1956. They are
mostly found in the districts of Kurnool, Mahaboobnagar, Prakasam, Rangareddy,
Nalgonda and Guntur districts of Andhra Pradesh. The distribution of the Chenchu
population is presented in Table 1.1. The total population of Chenchus is 41787 (as per
2001 census). The baseline survey conducted by Centre for People’s Forestry (CPF) in
2007-08 indicates that 10834 members (3009 households) were living in five districts of
NSTR area. From this it may be construed that almost one-fourth of Chenchu population
is living in NSTR area.
Table 1.1: Distribution of Chenchu population in Andhra Pradesh (2001)
Name of the District Mandals Habitations Households Population
Prakasam 7 81 3136 13321
Kurnool 13 40 2036 7915
Guntur 6 48 1643 6376
Nalgonda 5 15 291 1069
Ranga Reddy 7 31 799 2700
Mahaboob Nagar 10 123 2766 10406
Totals 47 338 10671 41787
One of the important livelihood activities of Chenchus is collection of ‘wild honey’.
Some of the Chenchu families living in Srisailam Tiger Reserve Area earn a substantial
1 It is the only ‘Tiger Reserve’ in Andhra Pradesh.
2 These districts are part of four forest divisions - Mahabubnagar falls under Achampet division, Kurnool
in Atmakur division, Prakasam in Markapur divisionn and Nalgonda and Guntur in Nagarjuna Sagar
division. 3 The Chenchus are mentioned in Manusmrithi (Chapter X.48). An ecological meaning is sought to be
attributed to the word ‘Chenchu’ meaning “a person who lives under a chettu” (tree) (Ayyappan 1948). The
Chenchus are one of the aboriginal tribes of Andhra Pradesh.

2
portion of their income from honey harvesting. However, the traditional honey collection
methods being followed by the Chenchus are considered to be unsafe, adversely affect
the bees, forest and the general ecosystem. Even the consumer point of view, the honey
thus harvested is not hygienic. Owing to risks involved in honey collection, the youth
in particular are not very enthusiastic about getting involved in this activity.
Furthermore, there is a decline in the availability of colonies and yields from existing
colonies due to unsustainable practices in vogue. If the present state of affairs continues,
it would lead to, in the long run, a decline in the natural regeneration of forest in general
and forest ecosystem in particular. This is because the contribution of honey bees to
natural regeneration by serving as pollinators for cross-pollinating species would be
adversely affected.
There is not much support from the government in addressing livelihood concerns of the
Chenchus in general and honey harvesters in particular. It may be noted that institutions
like Integrated Tribal Development Agency (ITDA)4, Girijan Cooperative Corporation
(GCC) and Forest Department are implementing the programmes for the development of
the tribal communities. These programmes are not reaching to the Chenchus, more so
those living in the remote habitations, (1) as the interventions are mostly confined to the
fringe hamlets; (2) officials seldom make a visit to some of the remote tribal habitations
due to perceived threat from naxalites; and (3) shortage of staff in the Forest Department,
GCC and ITDA.
CHELE PROJECT
Keeping in view of the concerns of Chenchu community, especially honey harvesters,
and conservation of forest in NSTR, Centre for People’s Forestry (CPF) has initiated a
project in NSTR in collaboration with concerned government departments. While
designing this project, similar experiences in other parts of India were studied and
learnings were incorporated. These experiences have amply demonstrated that by
adopting sustainable honey harvesting practices, the yield of honey can be enhanced
to more than two times of the present level; and that this activity can be a most
potential avenue for employment generation among tribal youth.
The primary objective of the project is to improve livelihoods of Chenchus living in the
NSTR; and creating enabling conditions for greater participation of Chenchus in the
protection and conservation of bio-diversity of NSTR. The specific objectives of the
project are as follows:
4 ITDA was established for the development of Chenchus - a primitive tribal group.

3
• To organise Chenchu honey harvesters towards sustainable harvesting of wild
honey;
• To provide support services to honey harvesters in taking up scientific honey
harvesting methods and sustain the same;
• To encourage Chenchu families, especially women, to take up value addition to
Non-timber Forest Produce (NTFP) such as Adda leaf, Amla, Tamarind and soap
nut;
• To train and build Chenchu tribal youth as local level resource persons to address
various needs of Chenchu community (resource monitoring, extension, capacity
building, marketing, etc);
• To improve access to government programmes among Chenchu community
through effective coordination between concerned government departments and
NGOs; and
• To enhance understanding on existing gaps between policy/implementation
guidelines and field realities
Activities: The activities taken up by the project between 2006 and 2009 are discussed
in table 1.2. In the first year, it carried out the preliminary work i.e., baseline survey,
cluster formation,5 placement of community level resource persons and organising
Chenchu NTFP collectors through awareness campaigns in the NSTR area. In addition, a
ToT was conducted on sustainable honey harvesting practices in order to take up
trainings to honey harvesters in the project villages.
From the second year onwards, the project started organising trainings on sustainable
honey harvesting and value addition for selected NTFP such as tamarind, soap nut, adda
leaf and amla. The discussions with NGO partners revealed that 919 honey harvesters
under CHELE project and 324 NTFP collectors were trained as on December 2009. In
addition, CPF has provided training to 440 honey harvesters from Chittoor,
Mehaboonagar, Kurnool and Prakasham districts with the funding support of GCC-
TRIFED; of which 50 were Chenchu honey harvesters. Thus, CPF has achieved its
proposed target of providing training to 1000 honey harvesters.
Simultaneously, efforts were also made to strengthen relations between community and
different government departments (focusing on ground staff and officials). The process
was facilitated with involvement of NGO partners. In recognition of the need for support
services (i.e., training, resource material, tools kits and information) to honey harvesters,
5 Based on contiguity and operational convenience four to five villages were grouped into a cluster. Each
of the clusters was looked after by field organizer.

4
two support service centre were initiated, one each in Achampet and Dornala. The
project also organised series of trainings and exposure visits to the project staff and
community level functionaries in order to capacitate them on project implementation and
needs of the community.
Table 1.2: Broad interventions of the CHELE Project
Year Activities
2006-07 • 29 wild honey harvesters across the state (including 7 members from
Chenchu Community) were nurtured as Master Trainers on sustainable
honey harvesting through 20-day Trainers training
• Field Organisers were identified, trained and placed in 20 clusters (each
cluster comprising of 5 villages)
2007-08 • Trained 213 Chenchu honey harvesters (from 6 clusters) in sustainable
honey harvesting
• Trained Chenchu women in value addition to Tamarind (34), Amla (179)
and Addaleaf plate making (94)
• Formed 14 CEGs at cluster level by organising those trained in NTFP value
addition.
• Provided identity cards and insurance facility to all chenchu harvesters who
attended training in sustainable honey harvesting
• Started process for setting up support service centres at Achampet and
Dornala.
• Resource monitoring volunteers were trained, provided kits and involved in
resource monitoring in July 2007 with the technical support of ATREE
• Organized exposure visit and orientation program to the CHELE sales
facilitators.
• Organized meeting with honey harvesters to orient and motivate them on
formation of Chenchu honey harvester’s cooperative society.
2008-09 • Trained 357 honey collectors from 12 clusters in sustainable honey
harvesting practices
• Organized training to 8 Chenchu women from Mannanur and Billakalu
village in Adda leaf cup making (50-100 leaf cups were made by each
person during training).
• Supplied 2 leaf cup making machines with installed capacity of 150 cups
per hour - One unit each at Mannanur and Billakalu villages.
• Trained 67 women in value addition to tamarind with the involvement of
GCC staff
• Trained 92 women in value addition to Amla with the involvement of GCC
staff
• Carried out resources monitoring in 4 clusters by involving 96 volunteers.
• Initiated honey harvesters dress stitching unit at Achampet support service
center. 5 Chenchu women from Banala are trained and involved in the
stitching unit (these women are expected to sell and repair honey harvesters
dresses)
2009-10 • Trained 320 honey collectors in sustainable honey harvesting practices in
NSTR area
• Stitching units(Achampet and Dornala) at SSCs have produced and

5
marketed 130 dresses for honey harvesters
• Two CEGs (working on adda leaf) were strengthened by providing
revolving fund – to use it as a working capital for production and marketing
of adda leaf plates
• Documented honey colonies by using GPS in potential areas within NSTR
Institutional arrangements: CPF has been implementing this project since December
2006 with the support of SDTT (Sir Dorabji Tata Trust). The project is being
implemented in collaboration with APFD, ITDA and GCC. The field operations of the
project were facilitated by the partners NGOs namely CONARE6 and CHRD
7 under the
close guidance, supervision and technical support of CPF. The project has nurtured 20
field organizers, who work closely with communities at cluster level. Each NGO has two
field coordinators to oversee the project implementation and monitor the project
activities.
The project has organized the trained members (honey harvesters and NTFP collectors)
into Common Enterprise Groups (CEGs) at village level. CEGs function with support
and guidance of field organizers and the project team. The project has also promoted a
Master Trainer, a Sales Facilitator and a resource monitoring agent at the cluster level.
The master trainer provides practical orientation on techniques and practices related to
safe and sustainable honey harvesting in the field to trainees for four-days, besides
participating in classroom sessions for three days along with external resource persons.
The sales Facilitator works closely with NTFP collectors during their transaction with
GCC in procurement centres. The resource monitoring agent leads a team comprising of
five Chenchu NTFP collectors in each village to document the availability of forest
resources.
Technical Support: CPF has provided technical support to partner NGOs by using
support from Centre for Bee Development and ATREE foundation. The team of CPF for
the project included the Director, Senior Programme Officer and the Project Coordinator.
In addition, the project receives inputs from IEC desk, Sustainable forestry, Participatory
forest management, and finance and administration for effective implementation.
The project has worked closely with APFD, ITDA and GCC at the division/district level
at different stages of the project implementation. CPF has constituted a project steering
committee to guide the project. The committee members include Field Director, NSTR,
ACF-Bio-diversity NSTR, Project Officer (ITDA), Divisional Manager (GCC), the
Senior Programme Officer SDTT, the Director of CPF, and Chief Functionaries of
CHRD and CONARE. The Field Director of NSTR is the convener of the committee.
Project Villages: As stated above, the project has been implemented in all the Chenchu
habitations in core and buffer villages of NSTR. It covers about 92 villages in NSTR,
which includes 65 core villages and 27 buffer villages.
6 CONARE- Conservation of Nature and Rural Awakening
7 CHRD- Centre for Human Resource Development
6
IMPACT STUDY
CPF has commissioned Poverty Learning Foundation to carry out the impact study on the
interventions made by CHELE project between 2006 and 2009. The objectives of the
study are: (i) to assess the impact of the project on the socio-economic conditions and
livelihoods of Chenchu households in NSTR, with special emphasis on honey harvesters;
and (ii) to capture learnings emerging from the project interventions in the last three years
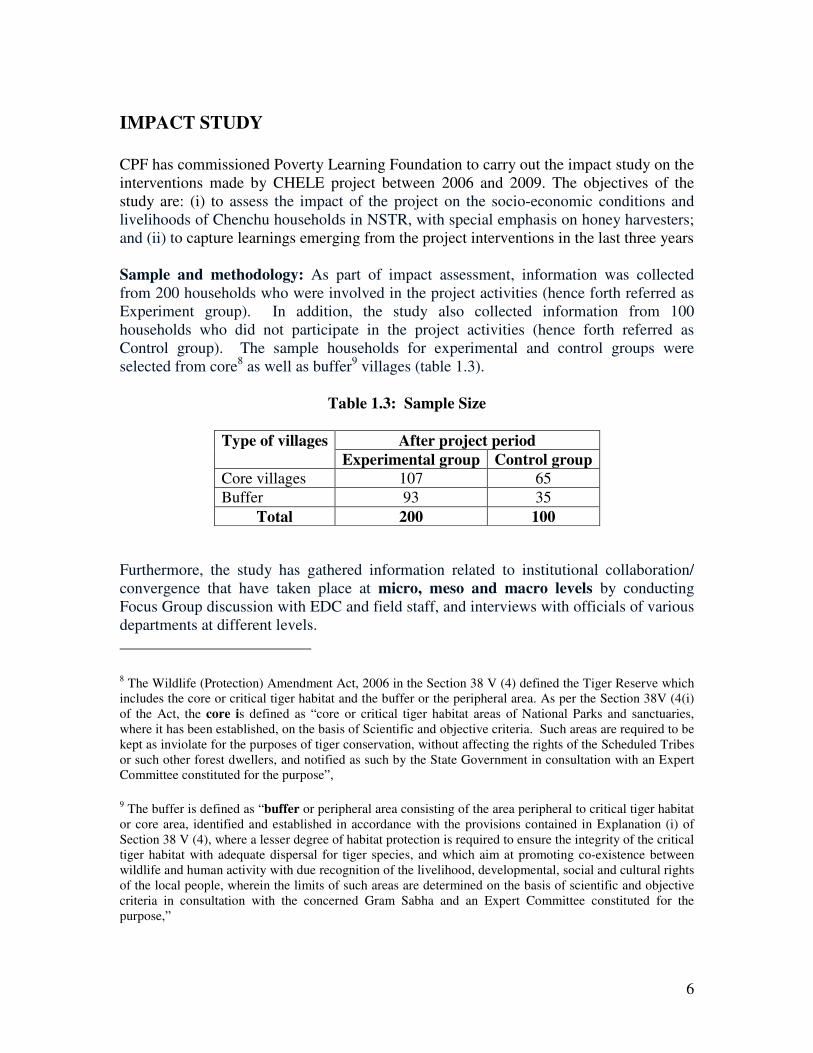
Sample and methodology: As part of impact assessment, information was collected
from 200 households who were involved in the project activities (hence forth referred as
Experiment group). In addition, the study also collected information from 100
households who did not participate in the project activities (hence forth referred as
Control group). The sample households for experimental and control groups were
selected from core8 as well as buffer
9 villages (table 1.3).
Table 1.3: Sample Size
After project period Type of villages
Experimental group Control group
Core villages 107 65
Buffer 93 35
Total 200 100
Furthermore, the study has gathered information related to institutional collaboration/
convergence that have taken place at micro, meso and macro levels by conducting
Focus Group discussion with EDC and field staff, and interviews with officials of various
departments at different levels.
8 The Wildlife (Protection) Amendment Act, 2006 in the Section 38 V (4) defined the Tiger Reserve which
includes the core or critical tiger habitat and the buffer or the peripheral area. As per the Section 38V (4(i)
of the Act, the core is defined as “core or critical tiger habitat areas of National Parks and sanctuaries,
where it has been established, on the basis of Scientific and objective criteria. Such areas are required to be
kept as inviolate for the purposes of tiger conservation, without affecting the rights of the Scheduled Tribes
or such other forest dwellers, and notified as such by the State Government in consultation with an Expert
Committee constituted for the purpose”,
9 The buffer is defined as “buffer or peripheral area consisting of the area peripheral to critical tiger habitat
or core area, identified and established in accordance with the provisions contained in Explanation (i) of
Section 38 V (4), where a lesser degree of habitat protection is required to ensure the integrity of the critical
tiger habitat with adequate dispersal for tiger species, and which aim at promoting co-existence between
wildlife and human activity with due recognition of the livelihood, developmental, social and cultural rights
of the local people, wherein the limits of such areas are determined on the basis of scientific and objective
criteria in consultation with the concerned Gram Sabha and an Expert Committee constituted for the
purpose,”

7
Time Period: The baseline period is 2006, before the project was initiated. The data
were also collected in 2009 after implementation of three-year project. In this report,
based on the data collected from these two time points, the outcomes of the project are
analyzed.
Action areas and outputs: The project worked out action areas based on detailed
situation analysis. These actions are expected to lead to specific outcomes and impacts
(table 1.4)
Table 1.4: Project outputs and impacts
Objectives Expected outcomes Indicators
1. To organise Chenchu honey
harvesters towards sustainable
harvesting of wild honey
1000 honey harvesters
would be organised into
Common Enterprise
Groups (CEGs) in 115
EDC/VSS areas
Number of honey harvesters
organised
No. of CEGs formed and
strengthened
2. To provide support services to
honey harvesters in taking up
scientific honey harvesting
methods and sustain the same
1000 honey harvesters
will have received
training, kit (protection
gears and tools and
equipments) and identity
cards
Service centres are
established by involving
women for providing
support services to honey
harvesters
Trained honey harvesters
are practicing scientific
honey harvesting methods
Type of services provided by
service centre
No. of women involved as
service provider in service
centre; and income earned
Type of trainings, meetings and
extension support received by
honey harvesters
No. of honey harvesters
received training
No. of honey harvesters
received kit and identity cards
No. of honey harvesters who
are using kit and practicing
scientific methods
Income earned per season by
trained honey harvesters
No. of trained people
encouraged other honey
harvesters on the importance of
scientific methods
No. of honey harvesters trained
and used as master trainers
No. of members got their tools
repaired in service centre and
service charge paid
3. To encourage chenchu families,
especially women, to take up
value addition of NTFP such as
Adda leaf, Amla,Tamarind and
soap nut
About 700 NTFP
collectors are organised
into CEGs
CEG members will have
received training on value
addition techniques and
tools
No. of NTFP collectors
organised into CEG
CEGs formed for each NTFP
No. of women trained on value
addition techniques and
received tools
No. of CEG members who are

8
CEG members will have
started producing value
added products
aware about sustainable
collection of NTFPs
No. of CEG members who
have taken up producing value
added products
No. of CEGs negotiated with
GCC for sale of products
Income of members involved in
NTFP collection and
production of value added
products
4. To train and build chenchu
tribal youth as local level resource
persons to address various needs
of chenchu community (resource
monitoring, extension, capacity
building, marketing, etc)
20 youth are trained and
placed as field organisers
to conduit between
community and
government departments,
20 youth are trained and
placed as sales
Facilitators at GCC
procurement centres to
reduce gap between GCC
and NTFP collectors ,
20 youth are trained and
placed as resource
monitoring agents to
periodically monitor
forest resources
20 youth are trained and
placed as Master trainers
to propagate scientific
honey harvesting methods
No. of tribal youth trained and
placed as Field Organisers,
Master trainers, resource
Monitoring agents and sales
facilitators
No. of resource persons
involved in their respective
roles
No. of chenchu families
received support from resource
persons in terms of field
guidance, information sharing
and linkages with government
5. To improve access to services
among Chenchu community
through effective coordination
between concerned government
departments and NGOs
Improved interface
between Chenchu
community and Forest
department/GGC, ITDA,
etc.
Improved interaction
between different
stakeholders
Improved income and
quality of life among
families targeted by the
project
No. of steering committee
meetings held
Type of issues identified and
acted upon by the government
officials
Government officials
participation in trainings,
awareness meetings and
resolving community level
issues
Type of activities taken up by
partner NGOs towards building
collaboration with government
and community
Support received from
government in implementation
of the project- infrastructure
and resource for support
service centre, and

9
trainings/meetings
No. of chenchu households got
EGS cards, FRA land titles,
government
programmes/resources etc.
No. of households participated
in forest development activities
No. of families have access to
education and health facilities
6. To enhance understanding on
existing gaps between
policy/implementation guidelines
and field realities
Issues for advocacy are
identified
Assessment of Needs and
priorities of community
through micro-studies (e.g.,
FRA status, honey harvesting,
etc)
Resource material prepared to
communicate people concerns
to other stakeholders
Key issues identified for policy
advocacy
STRUCTURE OF THIS REPORT
The report is presented in five chapters, including this chapter. In the chapter 2, the
changes brought about by CHELE in honey harvesting is discussed. The economy of
Chenchus is analysed in chapter 3 in order to capture other livelihood concerns and
priorities of Chenchus. There was discussion on community participation and
programme management aspects in chapter 4. And finally in Chapter 4, the lessons
emerged from the implementation of the project in the last three years were presented.

10
CHAPTER 2: CHANGES BROUGHT ABOUT BY THE PROJECT IN
HONEY HARVESTING
PROFILE OF SAMPLE HOUSEHOLDS
Chenchus, being traditionally food gatherers, have of late pursuing more than one economic
activity. The government have been trying to provide alternative employment
opportunities through the ITDA by distributing agriculture land to the landless people,
providing financial assistance for livestock rearing, income generation activities and
other items of developmental programmes. The interaction with officials as well as with
neighbouring villages, and development interventions led to a transition process, though slow,
from folk society to peasant society life practices.
• Sale of minor forest produce: The most important change in the economic
position of Chenchus is the transition from gathering roots, tubers and wild fruits
for consumption to the collection of minor forest produce on a large scale for sale.
The entry of Chenchus into a cash economy has come out mainly by the activities
of Girijan Cooperative Marketing Society
• Wage labour: Chenchus started engaged in wage labour as Forest Department
used them as forest labour.
• Cultivator: The first efforts to turn food gathering Chenchu into plough-cultivator
were made in 1930s. Attempts to develop permanent cultivation have yielded
only patchy results10. Nonetheless, this gave way to growing grain crops on small
plots near the huts, shifting cultivation and farm based agriculture.
• Livestock rearing: Traditionally, Chenchus were not involved in rearing of
livestock. Very few chenchus reported to have owned buffaloes in 1940s. Over a
period, cultivation and livestock rearing have gained importance in the livelihoods
of Chenchus.
The demographic profile of the sample households (from the experimental group) shows that
there are more males (52%) than females (48 %); and slightly lower percentage of women in
buffer villages. The average household size worked out to be 4.3. The age composition of the
sample household members indicates low life expectancy- only less than 10% of the household
members were above 40 years.
The proportion of illiterates was very high. Among the literates their education levels could be
termed low, as most of them did not cross high school. The study also reveals that the attainment
of literacy levels between the age group of 6-14 years is significant. (Of the 224 members in
10
Although large amounts of government funds have been spent for welfare of Chenchus, the number of
schemes aimed at transforming the economy is very small. In fact, well-intended innovations could not be
sustained because the Chenchus were mentally not adjusted to economic pursuits different from their
traditional way of gaining livelihood.

11
this group only 8 are illiterate or non-school going.) Further it is observed that Tribal
Ashram schools have contributed a lot to attaining literacy levels among Chenchus.
More than a third of households were residing in katcha or temporary houses. The housing status
in the buffer villages is better than core villages. Of the 200 households, 94% had accessed at
BPL cards which includes 88% of AAY cards. It is a matter of concern that 6% of the
households do not have access to PDS. About 10% of households have accessed the social
security programmes (i.e., old age pensions) from the government. The profile of the control
group presents similar pattern as the experimental group11
. A more detailed socio-economic
profile of the sample households is presented in appendix 1.
HONEY HARVESTING
As discussed earlier, CHELE project aims at improving the existing methods adopted
for honey collection so that apart from removing the risks in the activity, the
extraction of honey can be done in a hygienic way and at the same time the
yield rates can be improved up on. The project trained 919 members in improved honey
collection methods and 324 members in value addition to selected NTFPs. The implementation
process was time consuming, at least in the first year, as there was considerable hesitation on the
part of Chenchus to participate in the project activities.
Training to honey harvesters: The project has trained members on improved honey
collection methods. The trainees comprise of climbers (40%), helpers (35%), extractors
(12%) and those acting as guide in honey collection. The percentage of the female
trainees within the sample is 3%. It is encouraging to note that the project has mobilised
a few women despite the fact that their involvement is limited to a support role in honey
harvesting. More than half of the sample members (trainees) covered by the study were
illiterates; and three-fourths of the trainees were in the age group of 21-40 years. The
remaining members are either below 20 years (10%) or in the age group of 41-60 years.
Table 2.1: Characteristic features of trainees (%)
Experiment Particulars
Core Buffer Total
% of illiterates among trainees 52 56 54
% of female trainees 3.7 1 3
Age of trainees <=20 11 9 10
21-30 37 42 40
31-40 33 38 36
41-60 18 9 12
>61 1 2 2
11
The important condition in drawing the sample for control and experimental groups is that the sample
households for both the groups must represent similar socio-economic characteristics. Therefore, from the
data we can say that the study has satisfied this condition.

12
Formation of CEGs: The trained members were organised into Common Enterprise
Groups (CEGs) in each village. It may be noted that 98 CEGs were formed by organizing
trained honey harvesters. The CEGs were provided with honey collection kit. In addition,
10 CEGs were formed by organizing, women trained in NTFP value addition. Providing accidental insurance policy: The trained harvesters were enrolled in Janatha
insurance policy by the project. As per the design, the project pays insurance premium in the first
year; and in the subsequent years, the CEG members should renew the policy. The study shows
that 68% of the members have already insurance bonds, this percentage being higher in buffer
villages. The discussion with CPF revealed that all the trained members were enrolled into the
policy immediately after the completion of the training; and that as and when CPF receives
insurance bonds from the company, it hands over to the partner-NGOs for distribution. Most
probably, others will also receive insurance bonds shortly. When enquired the harvesters about
their willingness to renew the policy on their own, 60% of them gave affirmative responses.
Interestingly more members in core villages wanted to renew this policy when compared to buffer
villages.
Promoting sustainable honey harvesting practices: The honey harvesting practices
promoted by the project includes using sting protection dresses, removing only ripen
portion of comb and hence collection from the same comb at least two times in a season,
extracting honey by opening layer in a comb (and avoiding squeezing) and wearing hand
gloves (and washing them after use). After training, the project extended backup support
to trainees by deploying community level resource persons.
Participation in honey harvesting: In a sample of 200 households covered in the
study, some households did not participate in honey collection due to ill health etc.
As a result, only 191 households participated during the pre-intervention period
while in the post intervention period the figure has shrunken to 184. From 191
households, in all, 249 members participated (with single member each 138
households, with two members each 48 households and three members each 15
households). In the post intervention period, as many as 229 members participated
(the distribution being households with single member each 143, two members each
74 households and three members each 12 households).
Adoption of practices by harvesters: More honey harvesters learning the correct use of tool
kit and collection methods. Both in core and buffer villages, a majority of the honey collectors
were aware of the practices and prescribed norms to be followed under sustainable honey
harvesting method.
• According to trainees, CHELE project brought positive changes in honey
harvesting and hygienic practices. A majority of the members have adopted
suggested practices (table 2.2). It was also reported that trained members are not
only following safety measures and hygienic practices, but are also motivating
and guiding un-trained members to follow these practices.
13
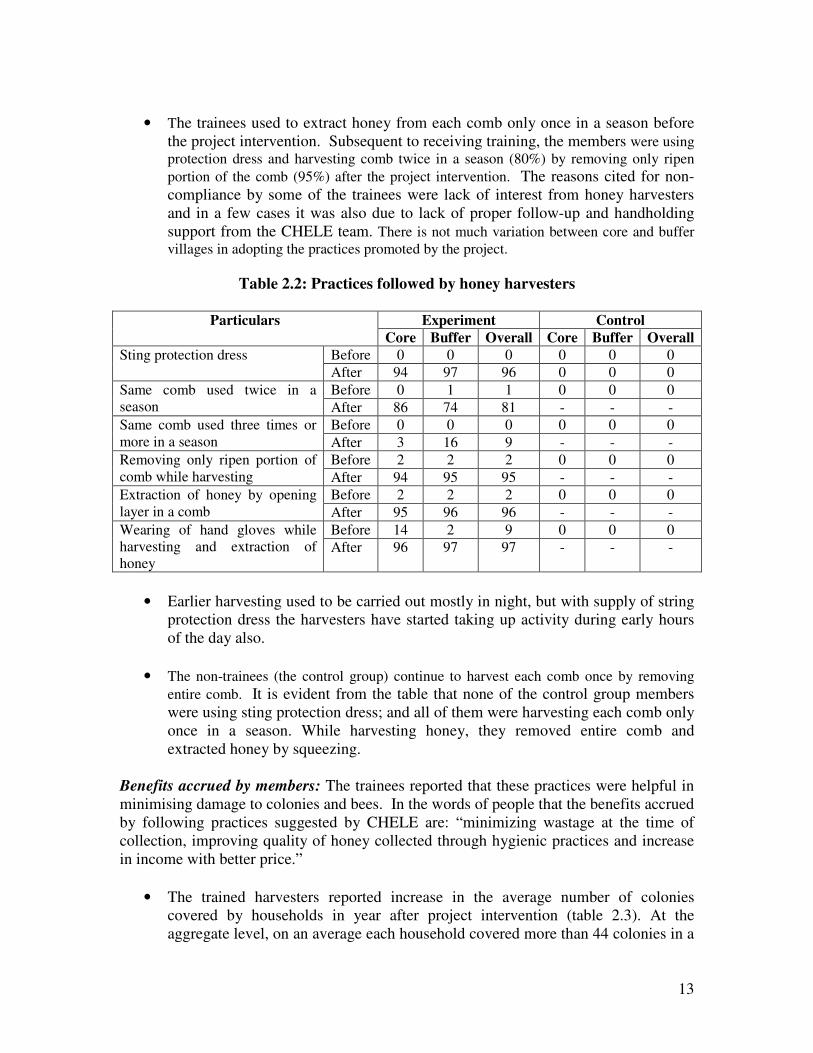
• The trainees used to extract honey from each comb only once in a season before
the project intervention. Subsequent to receiving training, the members were using
protection dress and harvesting comb twice in a season (80%) by removing only ripen
portion of the comb (95%) after the project intervention. The reasons cited for non-
compliance by some of the trainees were lack of interest from honey harvesters
and in a few cases it was also due to lack of proper follow-up and handholding
support from the CHELE team. There is not much variation between core and buffer
villages in adopting the practices promoted by the project.
Table 2.2: Practices followed by honey harvesters
Experiment Control Particulars
Core Buffer Overall Core Buffer Overall
Before 0 0 0 0 0 0 Sting protection dress
After 94 97 96 0 0 0
Before 0 1 1 0 0 0 Same comb used twice in a
season After 86 74 81 - - -
Before 0 0 0 0 0 0 Same comb used three times or
more in a season After 3 16 9 - - -
Before 2 2 2 0 0 0 Removing only ripen portion of
comb while harvesting After 94 95 95 - - -
Before 2 2 2 0 0 0 Extraction of honey by opening
layer in a comb After 95 96 96 - - -
Before 14 2 9 0 0 0 Wearing of hand gloves while
harvesting and extraction of
honey After 96 97 97 - - -
• Earlier harvesting used to be carried out mostly in night, but with supply of string
protection dress the harvesters have started taking up activity during early hours
of the day also.
• The non-trainees (the control group) continue to harvest each comb once by removing
entire comb. It is evident from the table that none of the control group members
were using sting protection dress; and all of them were harvesting each comb only
once in a season. While harvesting honey, they removed entire comb and
extracted honey by squeezing.
Benefits accrued by members: The trainees reported that these practices were helpful in
minimising damage to colonies and bees. In the words of people that the benefits accrued
by following practices suggested by CHELE are: “minimizing wastage at the time of
collection, improving quality of honey collected through hygienic practices and increase
in income with better price.”
• The trained harvesters reported increase in the average number of colonies
covered by households in year after project intervention (table 2.3). At the
aggregate level, on an average each household covered more than 44 colonies in a
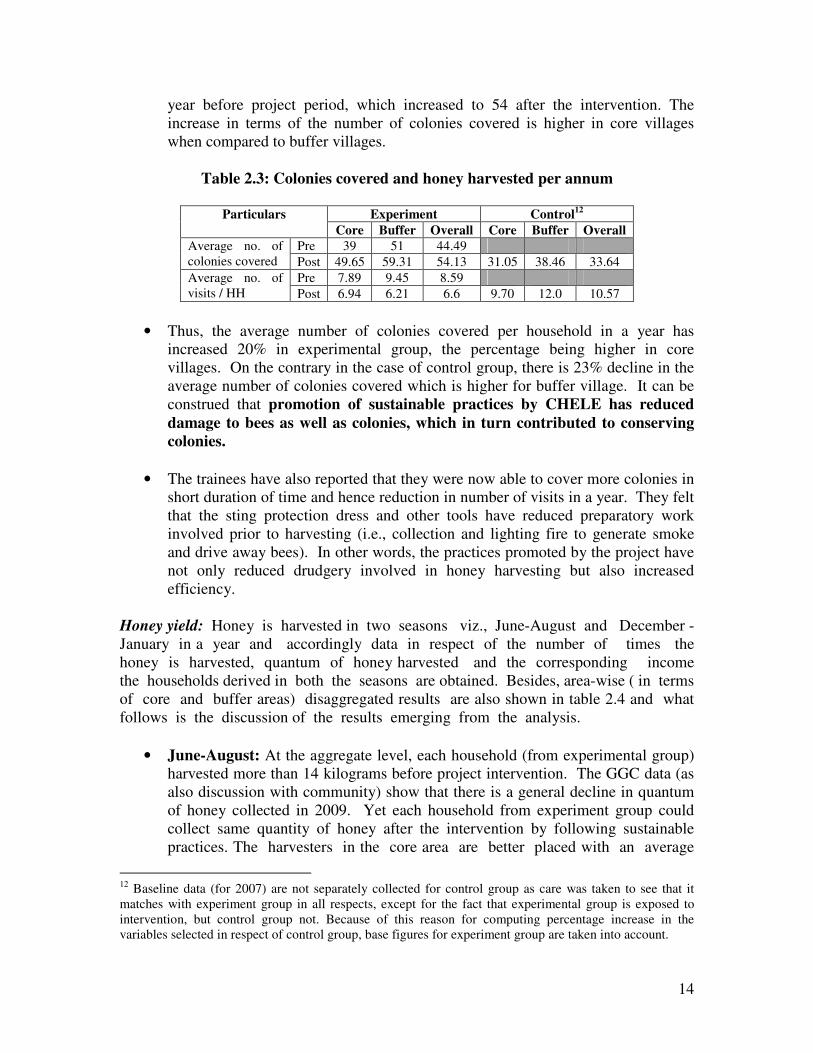
14
year before project period, which increased to 54 after the intervention. The
increase in terms of the number of colonies covered is higher in core villages
when compared to buffer villages.
Table 2.3: Colonies covered and honey harvested per annum
Experiment Control
12 Particulars
Core Buffer Overall Core Buffer Overall
Pre 39 51 44.49 Average no. of
colonies covered Post 49.65 59.31 54.13 31.05 38.46 33.64
Pre 7.89 9.45 8.59 Average no. of
visits / HH Post 6.94 6.21 6.6 9.70 12.0 10.57
• Thus, the average number of colonies covered per household in a year has
increased 20% in experimental group, the percentage being higher in core
villages. On the contrary in the case of control group, there is 23% decline in the
average number of colonies covered which is higher for buffer village. It can be
construed that promotion of sustainable practices by CHELE has reduced
damage to bees as well as colonies, which in turn contributed to conserving
colonies.
• The trainees have also reported that they were now able to cover more colonies in
short duration of time and hence reduction in number of visits in a year. They felt
that the sting protection dress and other tools have reduced preparatory work
involved prior to harvesting (i.e., collection and lighting fire to generate smoke
and drive away bees). In other words, the practices promoted by the project have
not only reduced drudgery involved in honey harvesting but also increased
efficiency.
Honey yield: Honey is harvested in two seasons viz., June-August and December -
January in a year and accordingly data in respect of the number of times the
honey is harvested, quantum of honey harvested and the corresponding income
the households derived in both the seasons are obtained. Besides, area-wise ( in terms
of core and buffer areas) disaggregated results are also shown in table 2.4 and what
follows is the discussion of the results emerging from the analysis.
• June-August: At the aggregate level, each household (from experimental group)
harvested more than 14 kilograms before project intervention. The GGC data (as
also discussion with community) show that there is a general decline in quantum
of honey collected in 2009. Yet each household from experiment group could
collect same quantity of honey after the intervention by following sustainable
practices. The harvesters in the core area are better placed with an average
12
Baseline data (for 2007) are not separately collected for control group as care was taken to see that it
matches with experiment group in all respects, except for the fact that experimental group is exposed to
intervention, but control group not. Because of this reason for computing percentage increase in the
variables selected in respect of control group, base figures for experiment group are taken into account.

15
collection of 15 kilograms as compared to the corresponding figure of
13.66 kilograms in the buffer area.
Table 2.4: Particulars of honey harvesting
Experiment Control Particulars
Core Buffer Total Core Buffer Total
June –August Before 14.33 14.58 14.45 Average quantity of honey
collected/HH(in Kgs) After 15.05 13.66 14.41 14.02 14.20 14.08
Before 108 97 103 Average rate /kg
After 160 138 150 129 107 121
December –January
Before 9.95 14.23 11.84 Average quantity of honey
collected/HH(in Kgs) After 13.08 13.13 13.11 12.08 12.73 12.33
Before 108 102 105 Average rate /kg
After 161 153 158 137 115 129
• The price for honey the harvesters get is a function of to whom they sell.
The rate at which they sell is reported to be varying considerably across
buyers- Rs.80 in the case of GCC while for traders or tourists, the price
varies between Rs.160 - 300 depending up on the time of selling.
Independent of the area, each harvester gets Rs.103 per kg before the
intervention and this figure swells to Rs.150 after the intervention. Similar
trends are also in evidence between areas. Further, regardless of the area, the
post intervention period registers higher prices when compared to those in the
pre-intervention period.
• December-January: In this season, at the aggregate level, the post intervention
period has an edge over the pre-intervention period. (Each harvester gets 1.27
kilograms of honey more in the post intervention period as compared to the
pre-intervention period- the actual values are 11.84 and 13.11 kilograms
respectively). Similarly, the core area registers significant increase. But in the
buffer area, the reverse is the case.
• As is to be expected, the price hike is quite conspicuous in the post
intervention period. Independent of the type of buyer, the harvester gets an
income of Rs.158 in the post intervention period, higher by Rs.48 than the
figure for the pre-intervention period. This trend is true of the areas too
and in relative terms, the core group appears to be benefiting more in terms
of the price differential (Rs.53 increase over the pre-intervention figure).
• The trainees have performed better than non-trainees in terms of the average
honey collected per household and average price they got per kilogram. There was slight decline in buffer villages during the June-August as a majority of
the households were involved agriculture activities and made only a fewer visits

16
during this period. In general, the impact was found to be higher in the core
villages (more so during December-January) than the buffer villages.
• At the same time, the average rate at which honey was sold recorded 45%
increase in the case of trainees and just 11% in the case of non-trainees,
implying that the project inputs towards improving hygiene and quality of honey
along with marketing support fetched them better price.
Income from honey harvesting: There is a significant increase in return from honey
harvesting from pre-intervention to during the project intervention. The income earned
per household averages Rs.1379 in the pre-intervention period at the aggregate level. The
analysis shows that there is 53% increase in income for trainees and 20% in the case of
non-trainees, owing to better prices during post-project period. The core area is better
placed in this regard in comparison to the buffer area (the percentage increases are
70 and 36 points respectively).
Table 2.5 Income from honey
Experiment Control Particulars
Core Buffer Total Core Buffer Total
Before
Average income /HHs 1334 1428 1379
After
Average income /HHs 2268 1937 2116 1739 1494 1651
Incremental impact of the project on
average income/HH
70 36 53 30 5 20
There were 29 % of the sample households with Rs.1001- Rs.2000 per annum, closely
followed by 28% with Rs.2001-Rs.5000 and 27% with less than Rs.1000 (table 2.5). The
rest of the sample households (16%) earned more than Rs.5000 per annum from honey
harvesting.
Table 2.6: Distribution of the sample households by income from honey (after the
project intervention)
Annual income (in Rs.) Core Buffer Overall Up to 1000 29 25 27
1001-2000 23 38 29
2001-5000 31 22 28
Above 5000 17 15 16 Total 100 100 100
N= 99 88 187
Average income 2268 1937 2116
Challenges faced by the project: The twin concerns that the project has set to address
was the decline in number of honey harvesters and also the decline of yield from honey
hives. It emerged from discussion with trainees that the training courses have brought
back youth into this activity. While it is possible to improve yield from honey hives with

17
introduction of sustainable practices, it is also necessary to encourage plantation,
cropping practices and ecological conditions for conservation and protection of bees.
The analysis shows that the project need to keep the following aspects in designing its
future interventions.
Decline in number of honey collectors: The number of honey collectors has reduced
from T0 to T1 in a majority of villages where FGD was conducted (Table 2.4). There is,
however, an increase in the number of harvesters in Appapur. It was reported that
CHELE has trained youth in this village; and the master trainer has motivated and
sustained the interest of the trained members in the activity. The number of harvesters
remained the same in Vadderayavaram. The reasons cited by the people for the decline in
honey harvesters are as follows:
� Reduction of members involved in honey collection in some of the households
after the project. It was reported that six members have discontinued due to
health problems, do not want to take risk and lack of interest.
� Experienced and well informed harvesters have either died or become old (not
capable to climb tress and harvest honey) in a majority of villages.
� There are also members who discontinued honey harvesting due to harassment
and problems created by the forest department and police.
� Some how youth are not interested to participate in honey harvesting due to
availability of other easier options; and discouragement from elders.
� The decline in honey harvesters is also due to reduction in availability of honey
because of climate variability (i.e., droughts, low rainfall).
� It was reported that Chenchus have of late been participating in AP-REGS
activities, which in turn has marginally reduced their time in collection of forest
produce.
Decline of honey yield: The decline in the average honey collected per member was due
to reduced yield from honey hives. It was reported that climate variability has negative
influence on flowering. In such circumstances, bees either migrate or travel to
agriculture fields in search of pollen. At times bees get killed by attempting to collect
honey from agriculture fields, where high quantity of chemical pesticides is used. And
there is every possibility for reduction in bee population and thereby reduction in yield
per comb. The average honey collected by a harvester depends not only on number of
combs covered, but also yield rate per comb13
. Therefore, the average honey collected by
a member has reduced despite increase in number of colonies covered from baseline
period to after the project period only because of low yield from hives.
13
It is possible that harvester will have to climb down without any honey in the case of some of the combs
covered by him/her.

18
Firming up the practices: It is not clear from the reflection of people that whether yield
rates per comb increases with change from one time collection to two times in a season.
This needs to be studied in detail by systematic data collection for selected honey hives.
19
CHAPTER 3: CHENCHUS’ ECONOMY
This section examines the livelihoods of Chenchus, taking into account the availability of
natural resources and productive assets. For this purpose, the data pertaining to the
experimental group was used, as there is no need to make comparative analysis between
the experiment and the control group.
Livelihoods portfolio of Chenchus: Chenchus economy is transforming in a slow pace
with efforts made by government over the last five decades. As a result, the livelihood
activities of the sample households includes NTFP collection, wage labour, agriculture,
livestock rearing and self-employment in non-agriculture activities.
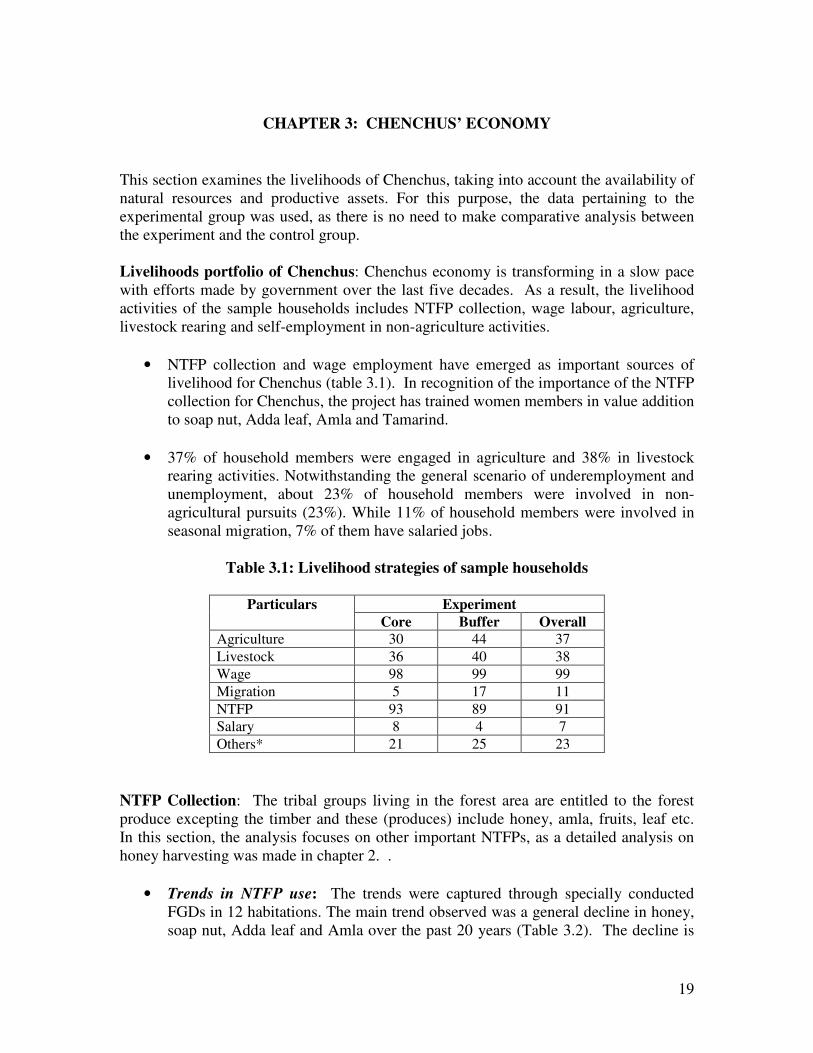
• NTFP collection and wage employment have emerged as important sources of
livelihood for Chenchus (table 3.1). In recognition of the importance of the NTFP
collection for Chenchus, the project has trained women members in value addition
to soap nut, Adda leaf, Amla and Tamarind.
• 37% of household members were engaged in agriculture and 38% in livestock
rearing activities. Notwithstanding the general scenario of underemployment and
unemployment, about 23% of household members were involved in non-
agricultural pursuits (23%). While 11% of household members were involved in
seasonal migration, 7% of them have salaried jobs.
Table 3.1: Livelihood strategies of sample households
Experiment Particulars
Core Buffer Overall
Agriculture 30 44 37
Livestock 36 40 38
Wage 98 99 99
Migration 5 17 11
NTFP 93 89 91
Salary 8 4 7
Others* 21 25 23
NTFP Collection: The tribal groups living in the forest area are entitled to the forest
produce excepting the timber and these (produces) include honey, amla, fruits, leaf etc.
In this section, the analysis focuses on other important NTFPs, as a detailed analysis on
honey harvesting was made in chapter 2. .
• Trends in NTFP use: The trends were captured through specially conducted
FGDs in 12 habitations. The main trend observed was a general decline in honey,
soap nut, Adda leaf and Amla over the past 20 years (Table 3.2). The decline is

20
mostly attributed to degradation of forest. People reported decline of NTFP due
to reduction in the number of plants and yield rate per plant. Therefore, collection
of NTFP now involves travelling long distances and staying more days in the
forest.
Table 3.2: Trends in resource use in surveyed villages
Note: 1- more than current level, 2-Much more than current level, 3- Same as current
level
• Training to women: The project, besides providing training on improved honey
collection practices, has also trained 324 women in value addition to NTFP
products. These trainings were focused more on NTFP collection methods,
mostly emphasizing aspects related to age at which fruit/leaf to be harvested, etc.
Further, a few members were trained in value addition. The trained women were
organised into 10 CEGs, at cluster level.
• Supply equipments: Selected Chenchu women from Mannanur and Billakalu
villages were trained in Adda leaf cup making. The project has supplied two leaf
cup making machines with installed capacity of 150 cups per hour - One unit each
in Mannanur and Billakalu villages. Though the members reported of involving in
production of leaf cups, a majority discontinued as there was no follow-up on
material supply and marketing support.
• Collection of other NTFP: Almost all the sample households were involved in
NTFP collection. As it happened in honey collection, there is also slight reduction
in the number of households involved even in the case of other NTFP products.
The trainings were mainly focused on re-orientation of women on regeneration-
friendly NTFP collection methods. While Chenchu women, in general, were
following collection methods suggested in the training, they find it not gainful in
the case of a few practices as the time taken is longer and that in the absence of
marketing support it is loosing proposition. And in the process they will also end
up collecting less (probably with improved quality), but have to sell for same
price.
10 years ago 20 years ago Product Average produce
collected per annum
(in quintals)/habitat 1* 2* 3* 1* 2* 3*
Core 19.25 4 1 2 Honey
Buffer 32.1 7 1 7 1
Core 0.30 1 1 1 1 Soap nut
Buffer 40.1 8 8
Core 1.85 2 2 Adda leaf
Buffer 8 2 2 2 1 1
Core 34.3 4 4 Amla
Buffer 69.9 7 1 7 1
Core 8.2 3 3 Tamarind
Buffer 49 7 1 6

21
• Income from NTFP: The average annual income earned from NTFP is Rs.7818
per household (including income from honey), which is being higher in buffer
villages. It could be seen that 29% of the sample households with an annual
income of Rs.2001-Rs.5000 per annum, followed by quarter each with less than
Rs.2000 and more than Rs.10000. The rest of the sample households (20%) in the
income class of Rs.5001-Rs.10000. It may be noted that one-third members in
buffer villages have reported of earning more than 10000 per annum as against 19
% in core villages.
Table 3.3: Income from other NTFP
Distribution of HH by Income Size Class
(Rs. Per annum)
Core Buffer Overall
<2000 27 24 26
2001-5000 33 24 29
5001-10000 20 19 20
>10001 19 33 25
N= 99 83 182
Average annual income/HH 7005 8786 7818
• Sale of produce: The NTFP products were sold to GGC, traders and tourist (table
3.4). Almost equal proportion of members were selling to GGC and traders. A
few are selling to tourists. The price offered by GCC is higher than trader for
different products. However, people are getting better price by selling to tourists.
Table 3.4: NTFP sold to different agencies by rate
Core Buffer Overall NTFP
Sold to
%
Avg price/
kg %
Avg price/
Kg %
Avg price/
Kg
GCC 47 8.53 65 9 56 8.8
Trader 47 7.82 33 8.4 41 8.7
Soapnut
Tourist 6 9.75 2 8.5 4 8.5
GCC 32 8.6 48 8 10 8.3
Trader 64 7.6 52 8 16 7.7
Adda leaf
Tourist 4 7.5 0 0 1 7.5
GCC 29 7.9 60 8.7 42 8.4
Trader 49 8.5 32 10 42 8.9
Amla
Tourist 22 10.9 8 10.8 16 10.9
GCC 24 21 42 26 30 23
Trader 69 17 58 14 65 16
Tamarind
Tourist 7 19 0 0 5 19
GCC 27 80 51 81 38 80
Trader 27 155 36 160 32 158
Honey
Tourist 46 174 13 173 31 174

22
LAND RESOURCES: About 40% of the sample households do not have any land and
this incidence is highest in core villages. At the aggregate level, the average landholding
works out to 3.92 acres. However, the analysis shows that core villages are better placed
in terms of average land landholding (table 3.5).
• Small and marginal farmers: A majority of those owning land are either
marginal farmers (24%) or small farmers (24%). The remaining households were
semi-medium farmers (11%) and medium farmers (<1%). While the percentage
of medium farmers and small farmers were higher in core villages, marginal
farmers were higher in buffer villages.
Table 3.5: Land owned by sample households across land holding groups (%)
Land holding size (in acres) Core Buffer Overall
No land 43.0 37.6 40.5
Up to 1 acre 3.7 8.6 6.0
1.01 -2.50 14.0 22.6 18.0
2.51-5.0 27.1 20.4 24.0
5.01-10.0 12.1 9.7 11.0
10.01 + 0.0 1.1 0.5
Total 53.5 46.5 100
Average landholding (in acres) 4.19 3.64 3.92
• Land kept fallow: About 39% of the farmers owning land have kept their lands
fallow and the incidence is highest in core villages. The reasons cited were lack
of bullocks, land not suitable for cultivation as it required development before put
to use, lack of capital, etc. At least 5 members have leased-out the land – 4 in core
villages and 1 buffer villages. The total extent of land leased-out is 21 acres (one
acre in buffer area and the remaining in core villages). None of the members have
leased-in land.
Table 3.6: Land kept fallow
Particulars Core Buffer Total
No. of farmers 29 17 46
Area (in acres) 118.75 89.2 207.95
Average area/farmer 4.09 5.25 4.52
• Gross income from agriculture: The average gross annual income from
agriculture is Rs.9690, which is higher in buffer villages. Over one-fourth of the
households get an annual income of less than Rs.2000, followed by 23% with
Rs.5001-Rs.10000 and 21% with RS.2001 –Rs.5000. The rest of the sample
households (14%) earned more than Rs.20000 per annum from agriculture.

23
Table 3.7: Annual Gross Income from Agriculture Distribution of HH by
Income Size Class
Core Buffer Overall
<2000 28 24 26
2001- 5000 16 24 21
5001-10000 28 20 23
10001-20000 15 17 17
>20000 13 15 14
N= 32 41 73
Average annual income/HH 9387 9927 9690
CPF has conducted a detailed enquiry for sub-sample of 10 households for different crops
to capture cultivation cost per acre (as the present study did not gather this information)
and found that on an average the farmer has been incurring Rs.4036 per acre towards
inputs (seed, pesticides and fertilizers), land preparation (plough labour), wages, etc.
From this data it can be concluded that on average the net income per acre is Rs.2410. It
may be noted that there is no paid out costs in the case of wage employment, livestock
and NTFP. Hence, the net income from agriculture is lower than all other activities.
LIVESTOCK POSSESSION: In a total group of 200 study households, 26% of the
households have small ruminants (mostly goats), followed by backyard poultry (18%),
cows (9.5 %) and buffaloes (6 %). The ownership of small ruminants by a large
proportion of households as compared to other kinds of livestock indicates its importance
of the sample households. Further, as compared to she-buffaloes, cows were owned by a
slightly higher number of households, which indicates that their priority was agriculture
rather than milk production. On the whole the households in buffer villages are better
placed in terms of the average number animals possessed for all the category of animals.
Table 3.8: Livestock possessed by the sample households
Particulars Core Buffer Total
No. of members having cows 6 13 19
No. of cows possessed by the sample HH 19 110 129
No. of members having Buffaloes 9 2 11
No. of buffaloes possessed by the sample
HH
16 4 20
No. of members having Goats 32 19 51
No. of goats possessed by the sample HH 215 395 610
No. of members having backyard poultry 14 21 35
No. of birds possessed by the sample HH 84 200 284
At the aggregate level, 38% of households had possessed some livestock or the other, this
percentage being marginally higher in buffer villages. The average annual income of
households from the livestock is Rs.4962 and it is higher in buffer villages (Rs.6730). It
could be seen from the table that there were 28 % of the sample households with an
income of Rs.1001- Rs.2000 per annum, followed by 22% each with an income of

24
Rs.2001-Rs.5000 and 5001-Rs.10000. There are 16% of households with an annual
income of above Rs.10000 - a majority of these households were from buffer villages.
The rest of the sample households (16%) were with an annual income of Rs.1001-2000.
Table 3.9: Annual Income from Livestock activity
Core Buffer Total
<1000 31 24 28
1001-2000 26 5 16
2001-5000 18 27 22
5001-10000 23 22 22
Above 10000 3 22 12
Total 100 100 100
N= 39 37 76
Average income/HH 3284 6730 4962
PARTICIPATION AS WAGE LABOUR: As is evident from the data on
household income sources, labour emerged as one of the important contributors to
the household income. Almost all the households were involved in wage employment.
The average income from this activity is Rs.3183 and it is higher in core villages. One
important scheme which provided direct benefit to Chenchus in accessing wage
employment is APREGS. There were 30% of the households with an annual income of
Rs.2001-Rs.3000, followed by a one-fourth with an income of Rs.3001-Rs.4000. About
22% households were with an income less than Rs.2000. There were 9% of households
with an income more than Rs.10000 per annum.
3.10: Annual income from wage employment Core Buffer Total
<2000 18 27 22
2001-3000 24 38 30
3001-4000 28 22 25
4001-5000 16 10 13
>5000 14 3 9
Total 100 100 100
N= 105 92 197
Average income 3548 2766 3183
Other livelihood activities: Other livelihood activities involved by the sample
households were migration and non-farm activities. The incidence of migration was
reported by 21 households out of 200 and that too mostly in buffer villages. A majority
of them reported to be going to places only within the Mandal or district during the
period June-December. The average earning on account of migration is Rs.7150. It is
found that on account of I.T.D.A. activities a small percentage of Chenchus were able to
get full-time employment in different services, and a few could depend on petty business
activities.
25
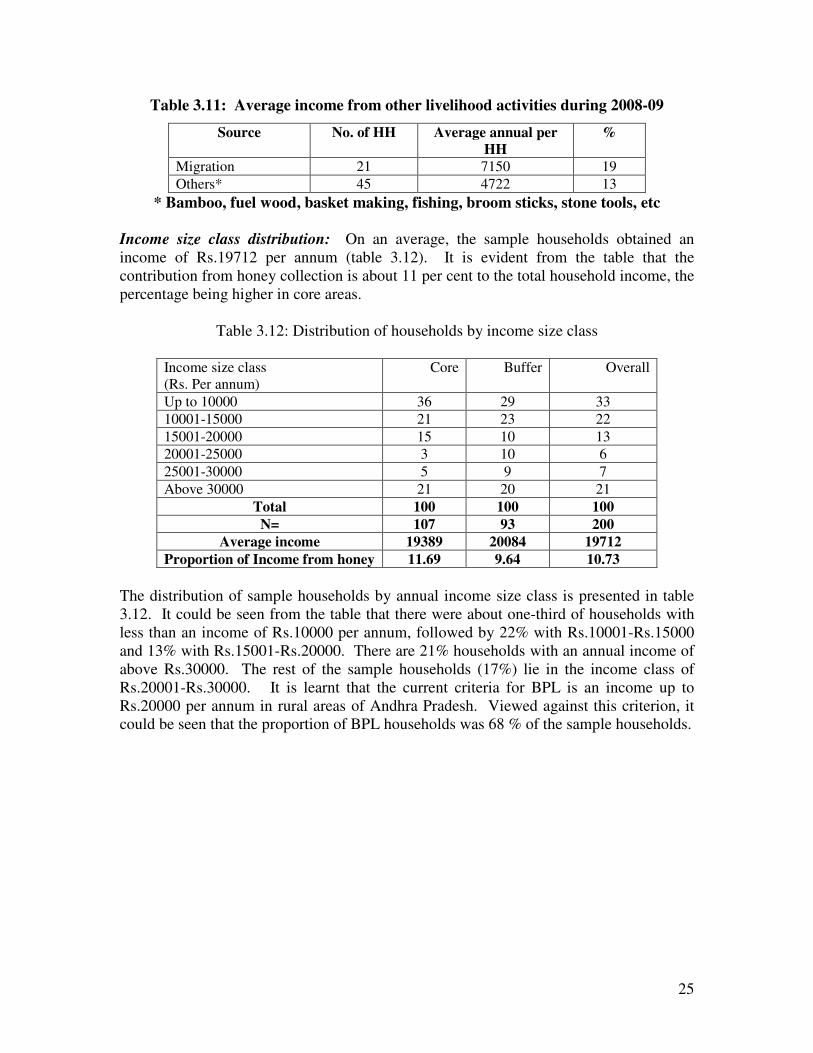
Table 3.11: Average income from other livelihood activities during 2008-09
Source No. of HH Average annual per
HH
%
Migration 21 7150 19
Others* 45 4722 13
* Bamboo, fuel wood, basket making, fishing, broom sticks, stone tools, etc
Income size class distribution: On an average, the sample households obtained an
income of Rs.19712 per annum (table 3.12). It is evident from the table that the
contribution from honey collection is about 11 per cent to the total household income, the
percentage being higher in core areas.
Table 3.12: Distribution of households by income size class
Income size class
(Rs. Per annum)
Core Buffer Overall
Up to 10000 36 29 33
10001-15000 21 23 22
15001-20000 15 10 13
20001-25000 3 10 6
25001-30000 5 9 7
Above 30000 21 20 21
Total 100 100 100
N= 107 93 200
Average income 19389 20084 19712
Proportion of Income from honey 11.69 9.64 10.73
The distribution of sample households by annual income size class is presented in table
3.12. It could be seen from the table that there were about one-third of households with
less than an income of Rs.10000 per annum, followed by 22% with Rs.10001-Rs.15000
and 13% with Rs.15001-Rs.20000. There are 21% households with an annual income of
above Rs.30000. The rest of the sample households (17%) lie in the income class of
Rs.20001-Rs.30000. It is learnt that the current criteria for BPL is an income up to
Rs.20000 per annum in rural areas of Andhra Pradesh. Viewed against this criterion, it
could be seen that the proportion of BPL households was 68 % of the sample households.

26
CHAPTER 4: COMMUNITY PARTICIPATION AND
PROGRAMME MANAGEMENT
Facilitation of community participation is an important aspect of the project management. At least in the first year, there was considerable hesitation on the part of Chenchus to participate
in the project activities. In spite of several years of ITDA work, the community organisation does
not reach a stage where community can take initiative to demand their rights and entitlements
from the government. This is evident from the following analysis:
Membership in Local Institutions: At the aggregate level, 65 per cent of the
households reported membership in GGC, the percentage being slightly lower in core
villages. However, only 14% of members had accessed GIRI card, which enable them
avail accidental insurance, loan facility and bonus from GCC. The analysis further shows
that the percentage of members who had accessed GIRI card is lower in buffer than core
villages. When enquired about the benefits of GIRI card only 27 % of the members gave
affirmative response (and half of them are not fully aware of its).
• Perhaps keeping this in view, CHELE project has promoted Janatha insurance
policy. It is encouraging to note that 68% of the members enrolled themselves in
this scheme; and this percentage is being higher in buffer villages. When
enquired about their willingness to renew the policy on their own, 60% gave
affirmative responses. Interestingly more members in core villages wanted to
renew this policy when compared with buffer villages.
Table 4.1: Institutional membership
Experiment Control Particulars
Core Buffer Total Core Buffer Total
% of households having membership in
GCC
63 67 65 57 51 55
% of members having GIRI card 18 8 14 15 9 13
% of members who were aware about
benefits of GIRI card
27 28 27 26 23 25
% of households having membership in
SHG
50 75 62 47 57 51
% of members covered by Janatha
insurance
66 70 68 NA NA NA
% of members willing to renew Janatha
Policy
65 54 60 NA NA NA
• Despite greater success of Self-help movement in Andhra Pradesh, only 62 % of
the households had membership in SHGs. There is a considerable variation on
aspect between core (75%) and buffer villages (50%). At least three reasons were
reported for the above scenario: (i) some members did not join groups as they

27
were not aware of it’s benefits (ii) newly married have not joined groups; and (iii)
some groups got disintegrated due to non-functioning, more so in buffer villages.
Support received from government: Further we obtained information on the support
received by the members from various government programs (table 3.22). About 74% of
the households had accessed APREGS card, while 54% each reported of getting land
rights under FRA and 67% admitted children in residential schools. It may be noted that
52% were reported receiving support in relation to NTFP; and least support was received
from the government in relation to honey collection. When enquired about receiving
identity card only 23% gave affirmative answer. It should be noted that the identity cards
were issued in the initial phase of project and hence about 76 % of the sample households
did not receive cards.
Table 4.2: Support received from government/other agencies (%)
Experiment Control Project impact Particulars
Core Buffer Overall Core Buffer Overall Core Buffer Overall
APREGS card 72 76 74 72 68 71 0 8 3
FRA land title 53 55 54 53 37 48 0 18 6
Honey
harvesting
9 8 9 7 3 6 2 5 3
Other NTFP
products
45 60 52 14 11 25 31 49 27
Identity card
by CHELE
30 14 23 0 0 0 30 14 23
Indebtedness: A majority reported that they rely on moneylender, relatives, traders,
SHGs and GCC for credit. Very few reported access to bank credit. About 50% of the
members borrowed loan and only 65% of those who have taken loan repaid some amount
or other (table 3.22). Importantly SHGs have extended loans to 42% households. The
money lenders and traders were second important source of borrowing. About 13% of
the households borrowed from institutional sources such as banks (6%), ITDA (4%) and
GCC (3%).
Table 4.3 indebtedness of the sample household
Particulars Core Buffer Total
No. of members 48 49 97
Average amount borrowed/HH 8767 8177 8469
Average amount repaid/HH 6496 (28) 5811(35) 6116 (63_
Average amount due/HH 6013 (39) 5276 (41) 5635 (80)
Source from which loans are borrowed (%) SHG 49 35 42
Bank 4 8 6
Money lender 28 21 24
Trader 4 12 8

28
ITDA 2 6 4
GCC 0 6 3
Relatives 13 12 13
Support service centre (SSC): To overcome the institutional exclusions as discussed
above and empower Chenchus to demand their due share from the development
programmes, the CHELE started two centres - one each at Dornala and Achampet. The
objectives of the centres are:
• To create resources and support systems for carrying out the community based
trainings, technology transfer and supply tool kits.
• To act as an information centre and create a platform towards organising the
Chenchus and improving their negotiation skills with government and other
stakeholders.
Activities: The Forest Department has provided premises on the request of CPF. The
primary activity of the centre is stitching and repair of sting protection dress for honey
harvesters. In addition, the centre premises are used for monthly review meetings of
CBOs, partner NGO and CPF, training of master trainers and dialogue meetings with
GCC, ITDA and FD.
Stitching centre: CEG was formed in each centre by organising five women members
from Chenchu community. The group members were trained on designing and stitching
of sting protection dress for 60 more than two months. Each centre was provided with
infrastructure and material related to stitching sting protection dress. Both the centres
have started stitching and supplying sting protection dresses to honey harvesters
(appendix 2).
Community level resource persons: The project has invested in the last three years into
developing local resource persons who can catalyze the development among Chenchus. The
local educated youth became the personnel of the programme. Except for the two
coordinators, all the field organisers were recruited from among local village youth.
• The field organizers were involved in sharing the information and organising
villagers. They need to be involved (by providing necessary capacity building
support) more in strengthening CEGs and facilitating linkages between CEGs and
government programmes. There is a need to strengthen role of field organisers
through capacity building and effective monitoring in order to play vital role in
various functions as indicted in table 4.4.

29
Table 4.4: Role played by the field organisers
Function Role of EDC Remarks
EDC
strengthening
None Invites EDC members to CHELE meetings
CEG
strengthening
None The organizers are involved in addressing issues
concerning CEGs in their own villages.
Field guidance None In a few villages, initially, guidance was given to
CEGs on grading of NTFP products Information Inform CEGs about
the project
meetings, visits, etc.
Information given on mobile to one member in a
village, who in turn will share pass on it to other
members. Use of kits Evolving norms for
use of kit
Repair of kit from
SSC
Norms are not clearly defined in a majority of
villages
A majority of CEGs are repairing kits on their own
Linkages with
other programmes
Pro-active role in
some villages
In some villages the organizers work closely with
EDC in mobilization of government programmes –
Housing and APREGS (Vatavarlapalli), ITDA loans
(Appapur).
Also mobilized community to participate in trainings
of kovel foundation and Banjara foundation
(Chilakacherla gudem).
(Source: FGD with EDC and CEG in selected villages)
• The sales facilitators supported NTFP collectors during transaction with GCC.
They participated in GGC on day to day basis, educate members and improve
functional relations between people and GGC. After initial enthusiasm, the sales
facilitators stopped participating as very few NTFP collectors were making
scheduled visits. However, GCC officials are interested to engage local youth for
collection of NTFP from villages on commission basis. The project needs to fine-
tune its strategy related to sales facilitators keeping this in view.
• The master trainers were primarily involved in trainings. However, a few master
trainers have also been playing a pro-active role in identification of new colonies,
providing time information to CEG members, encouraging harvesters on
sustainable practices and motivating non-trainers. And they are doing so only in
their own villages (They are not playing such role in adjoining villages).
Participation community based institutions: EDC is a focus of interventions by the
Forest Department. At present, the project invites the president and a few active
members of EDC to its meetings. The role played by EDC in the implementation of
CHELE is given in table 4.5. It was reported that EDC president participates in the
project meetings and in the selection of members for trainings. However, there is a need

30
to educate Chenchu members and enhance their participation in EDC14
functions and
decision making process. In the long run, it is also useful to involve EDC in the CHELE
project, which would help in mobilising local leadership role in strengthening SSC.
Table 4.5: Role of EDC in CHELE project
Function Role of EDC Remarks
EDC meetings Not organized regularly organizes meetings only when forest
officials come to village
Knowledge about CHELE EDC chairperson is
aware about CHELE
Participates in CHELE meetings
Selection of Community
level resource persons
Not played any role,
except in very few cases
Project informed EDC after selection in
some villages
Sharing information in
GB/EC meetings
None No discussion on CHELE in EDC
meetings
Utilization of kits None The kit is to be returned to EDC
president after use in Chintala
Acting on decisions taken
in steering committee
None
Promoting janatha
insurance
None No knowledge about the scheme
(except in case of EDC member is also
in CEG)
Delivery of other services EDC is involved, Extending support to Kovel foundation,
Banjara, Nandi foundation
(Source: FGD with EDC and CEG in selected villages)
14
EDC has members from all communities whereas CHELE project is only for chenchus. “Too much
involvement of other communities in activities related to chenchus is not desirable” was the opinion of
FD,ITDA and GCC and of chenchus.
31
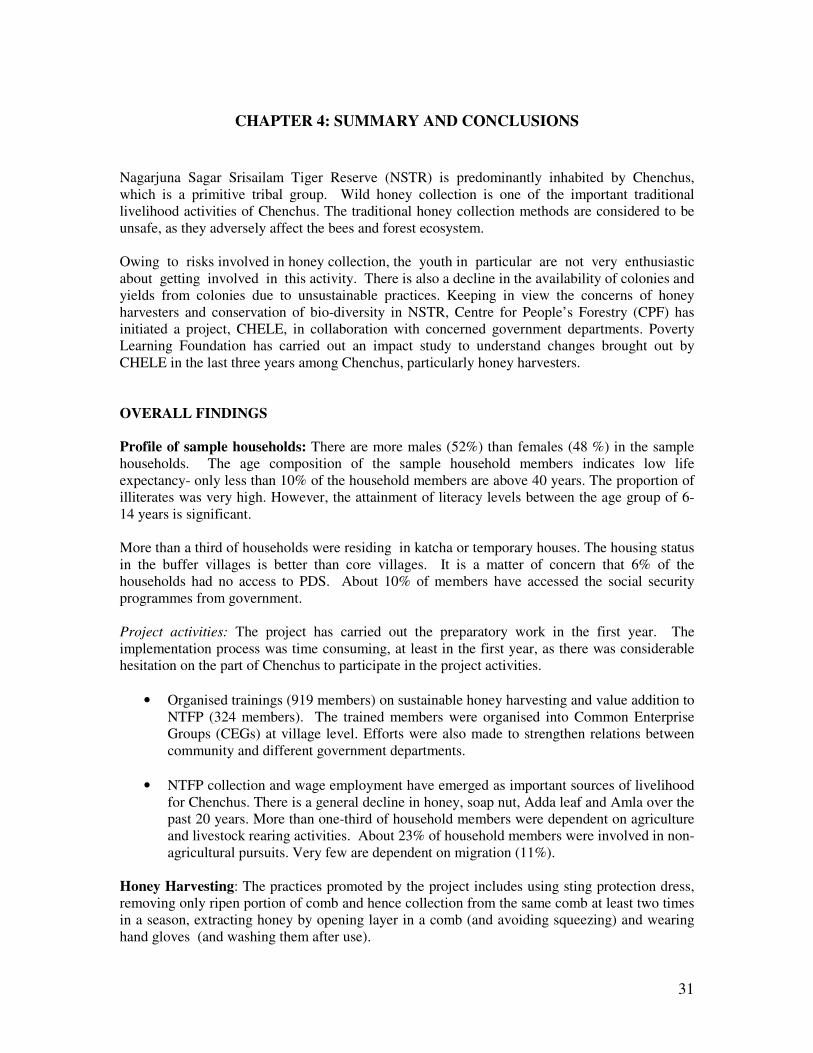
CHAPTER 4: SUMMARY AND CONCLUSIONS
Nagarjuna Sagar Srisailam Tiger Reserve (NSTR) is predominantly inhabited by Chenchus,
which is a primitive tribal group. Wild honey collection is one of the important traditional
livelihood activities of Chenchus. The traditional honey collection methods are considered to be
unsafe, as they adversely affect the bees and forest ecosystem.
Owing to risks involved in honey collection, the youth in particular are not very enthusiastic
about getting involved in this activity. There is also a decline in the availability of colonies and
yields from colonies due to unsustainable practices. Keeping in view the concerns of honey
harvesters and conservation of bio-diversity in NSTR, Centre for People’s Forestry (CPF) has
initiated a project, CHELE, in collaboration with concerned government departments. Poverty
Learning Foundation has carried out an impact study to understand changes brought out by
CHELE in the last three years among Chenchus, particularly honey harvesters.
OVERALL FINDINGS
Profile of sample households: There are more males (52%) than females (48 %) in the sample
households. The age composition of the sample household members indicates low life
expectancy- only less than 10% of the household members are above 40 years. The proportion of
illiterates was very high. However, the attainment of literacy levels between the age group of 6-
14 years is significant.
More than a third of households were residing in katcha or temporary houses. The housing status
in the buffer villages is better than core villages. It is a matter of concern that 6% of the
households had no access to PDS. About 10% of members have accessed the social security
programmes from government.
Project activities: The project has carried out the preparatory work in the first year. The
implementation process was time consuming, at least in the first year, as there was considerable
hesitation on the part of Chenchus to participate in the project activities.
• Organised trainings (919 members) on sustainable honey harvesting and value addition to
NTFP (324 members). The trained members were organised into Common Enterprise
Groups (CEGs) at village level. Efforts were also made to strengthen relations between
community and different government departments.
• NTFP collection and wage employment have emerged as important sources of livelihood
for Chenchus. There is a general decline in honey, soap nut, Adda leaf and Amla over the
past 20 years. More than one-third of household members were dependent on agriculture
and livestock rearing activities. About 23% of household members were involved in non-
agricultural pursuits. Very few are dependent on migration (11%).
Honey Harvesting: The practices promoted by the project includes using sting protection dress,
removing only ripen portion of comb and hence collection from the same comb at least two times
in a season, extracting honey by opening layer in a comb (and avoiding squeezing) and wearing
hand gloves (and washing them after use).

32
• The trained members were organised into Common Enterprise Groups (CEGs) in each
village. So far 98 CEGs were formed and supplied with tool kit for safe and sustainable
honey collection.
• About 23% trained members have also received identity cards to minimise harassment by
officials and police. The trained honey harvesters were enrolled in Janatha insurance
policy by the project. When enquired about their willingness to renew the policy on their
own, 60% gave affirmative responses.
• More honey harvesters learning the correct use of tool kit and collection methods. Both
in core and buffer villages, a majority of the members were aware of the practices and
prescribed norms to be followed under sustainable honey harvesting method.
• CHELE brought positive changes in honey harvesting and hygienic practices. The
trainees were using protection dress and harvesting comb twice in a season (80%) by
removing only ripen portion of the comb (100%) after the project intervention.
• The benefits accrued by following the practices were minimizing wastage at the time of
collection, improving quality of honey collected through hygienic practices and increase
in income with better price.
• The trained members are not only following safety measures and hygienic practices, but
are also motivating and guiding un-trained members to follow these practices.
• After training, the project extended backup support to trainees by deploying community
level resource persons. The trained harvesters reported increase in the average number of
colonies covered by households in year after project intervention. The increase in terms
of the number of colonies covered is higher in core villages.
• There is significant increase in return from honey harvesting from baseline period to after
project intervention. There is 53% increase in income for trainees and 20% in the case of
non-trainees, owing to better prices during post-project period. The core area is better
placed in this regard in comparison to the buffer area (the percentage increases are
70 and 36 points respectively).
• The number of honey collectors has reduced from before project to after project
intervention. Over a period this issue may be addressed, as the project is expected to
promote participation of youth to in honey harvesting. Further, it needs consolidate its
efforts by strengthening CEGs and involving them in the promotion of plantation and
ecological conditions for protecting honey bees.
Collection of other NTFP: People reported decline of NTFP availability due to forest
degradation. As a result, collection of NTFP now involves travelling long distances and staying
more days in the interior forest. During the same period NTFP prices have gone up due to factors
like inflation. Almost equal proportion of the members was selling to GGC and traders. A few
are selling to tourists. People are getting better price by selling to tourists and traders.

33
Other Livelihood Activities: As is evident from the data on household income sources,
labour emerged as one of the contributors to the household income. Almost all the
households are involved in wage employment. The average income from this activity is Rs.3183.
• The incidence of migration is low. A majority of them reported to be going to places
only within the Mandal or district.
• Analysis of source-wise average household incomes show that income from agriculture is
Rs.9690, livestock Rs.4962, wage employment Rs.3183 and NTFP Rs.6548. The income
from all these activities was found to be higher in buffer areas when compared to core
villages.
• On an average, the sample households obtained an income of Rs.19712 per annum. Share
of income from honey to total household income is about 11%, the percentage being
higher in core areas.
Support service centres: Facilitation of community participation is an important aspect
of the project management. The community organisation does not reach a stage where
community can take initiative to demand their rights and entitlements from the government.
• 65 per cent of the households reported membership in GGC, the percentage
being slightly lower in core villages. 62 % of the households had membership in
SHGs.
• 14% of members had accessed GIRI card, which enable them avail accidental
insurance. Perhaps keeping this in view, CHELE project has promoted Janatha
insurance policy.
• About 74% of the households had accessed APREGS card, while 54% each
reported of getting land rights under FRA and 67% admitted children in
residential schools. It may be noted that 52% were reported receiving support in
relation to NTFP; and least support was received from the government in relation
to honey collection.
• SHGs have extended loans to 42% households, while 13% of the households
borrowed from institutional sources such as banks (6%), ITDA (4%) and GCC
(3%).
To overcome the institutional exclusions as discussed above and empower Chenchus to
demand their due share from the development programmes, the CHELE started two
Support service centres. In order to strengthen the centre, the project needs strengthen
Stitching centre, Community level resource persons and promote greater participation of
community based institutions such as EDC.

34
CONCLUSIONS
• The social profile of the Chenchus clearly suggests (e.g., low-life expectancy) that
positive changes in their livelihoods are possible by simultaneously focusing socio-
cultural aspects such as building shared interest and collective actions, nutritional and
health education, and eradicating alcoholism.
• The study has clearly shown that Chenchus have started diversifying their livelihood
portfolio. As a strategy it is important to give equal importance to evolving livelihood
activities such as agriculture, besides focusing on honey harvesting. The project,
therefore, needs to expand its framework by making use of the following opportunities:
• About 40% of the sample households do not possess any land and this incidence is
highest in core villages. Further, about 39% of the farmers owning land have kept it
fallow and the incidence is highest in core villages. The project should explore
opportunities created by Forest Right Act (FRA) and AP-REGS in addressing these
issues. What is needed is that the project will have to initiate pilots on land development,
creation and use of water resources and improving agriculture in selected villages; and
thereby influence ITDA to scale up these activities.
• Although about 37 % of the households are involved in livestock activity, its productivity
found to be low. The potential of livestock activity needs to be utilised without unduly
worried about failures in the past.
• The project has improved access to government programs. EDC and community level
resource persons have worked together and mobilized government resources viz.,
strengthening SHGs, enrolling school dropouts, linkages with ITDA/APREGS, land patta
and insurance claims. The membership of households in local institutions and access to
government programmes has indicated the need for inclusive development. The project
work institutional process in order to provide inclusive membership in institutions,
programmes and community based institutions.
• The project has already established two Support Service Centres (SSCs). Work on this
aspect should get priority in the next stage of project. As part of this, the role of
community level resource persons will have to be strengthened through capacity building
and effective monitoring.
• As discussed earlier, there is reduction in NTFP availability. Therefore, the project needs
to encourage plantation by linking to APREGS. It is also necessary to work on next
generation issues related to honey harvesting such as processing, packing and marketing.
• People reported that GCC doesn’t purchase products like raw amla, wax without honey,
etc. Hence, the project needs to facilitate linkages with buyers for such products.
• An important learning that has emerged from the project is that any scheme aiming at
transforming economy of Chenchus would have to extend over a very long period during
which systemic guidance and handholding are required, as Chenchus being used to hand-
to-mouth existence of food gatherer and hunter

35
Appendix 1: SOCIO-ECONOMIC PROFILE OF SAMPLE HOUSEHOLDS
All the households covered by the study belong to Chenchu community, a primitive tribal
group in Andhra Pradesh. The basic unit of Chenchu society is the nuclear family,
consisting of a man, his wife and their children. Table 2.1 shows the distribution of
sample households across NSTR. As discussed in previous chapter, the study covered
200 households who were exposed to the project interventions (Experimental Group). In
addition, the study also covered 100 households who were not exposed to the project
interventions (Control Group). As can be seen from the table, in the case of experimental
group almost equal number of households is drawn from core and buffer villages. At the
same time, in the case of control group about two-thirds of households were drawn from
core villages due to non-availability of untrained honey harvesters in buffer villages.
Table 2.1: Distribution of sample households
Division Experimental Control
Core 14 8 Atmakur
Buffer 29 6
Core 41 27 Markapur
Buffer 13 1
Core 52 30 Achampet
Buffer 46 24
Core 0 0 Nagarjuna Sagar
Buffer 5 4
Core 107 65 Total
Buffer 93 35
The profile of sample households is analyzed here in terms of housing status, access to
PDS and composition of household members by genders, age educational status and
occupation status which will enable us to understand the socio economic background of
those benefiting from the CHELE project.
House type and possession of ration cards: Regarding the housing status of sample
households from experiment group, about 63% were residing in pakka houses and 5% in
semi-pakka houses. While 30 % were residing in katcha houses. The worst scenario was
observed in the case of 3% households who are residing temporary houses. The
percentage of households residing in katcha houses is higher in core villages (39%) when
compared with buffer villages (19%). As expected, the housing status in the buffer
villages is better than core villages (Table 2.2). The housing status of the control group
shows almost similar pattern. It may be, however, noted that the proportion of
households residing in temporary houses are marginally higher in the control group when
compared to experimental group.

36
Table 2.2: Access to housing and PDS (%)
Experiment Control Particulars
Core Buffer Total Core Buffer Total
Housing (%)
Katcha 39 19 30 35 23 31
Pucca 57 69 62 54 60 56
Semi-pucca 2 8 5 9 6 8
Temporary 2 4 3 2 11 5
Ration card (%)
Anthyodaya Anna Yojana 89 86 87 81 71 77
White card 7 6 7 8 12 9
No ration card 4 8 6 9 17 12
Pink card - - - 2 - 2
Pensions 10 10 20 4 2 6
With regard to access to ration card, it was found that 94 % of the sample members had
accessed at BPL card which includes AAY card (88%). It is a matter of concern that 6%
of the households had no access to PDS. The percentage of BPL card holders is lower in
control group than experimental group; and the percentage of households without ration
cards is higher for control group.
Gender and age group composition: The household composition indicates that there
were more males (52%) than females (48 %) in the sample households – and slightly
lower percentage of women in buffer villages. The average household size worked out to
be 4.3, being higher in buffer villages. However, the sex ratio is higher in the control
group compared to experiment group. In fact, there are more females than males in core
villages with the sample households. Contrary to this, in buffer villages the sex ratio was
found be least.
Table 2.3: Distribution of the sample households by sex (%)
Experiment Control Particulars
Core Buffer Total Core Buffer Total
Gender composition (number)
Male 228 207 435 130 80 210
Female 213 188 401 137 61 198
Average HH size 4.12 4.24 4.31 4.1 4.0 4.0
Sex ratio 934 908 921 1005 762 943
The age composition of the sample household members indicates that at the aggregate
level children (below five years) constituted about 15 % of the household members, while
the aged (above 60 years) accounted for just one percent, being slightly higher in buffer
villages when compared to the core villages. This clearly shows that life expectancy is
much lower than state average for tribal groups. Almost similar pattern is noticed in the
case of control group.

37
Table 2.4: Distribution of household members by age (%)
Experimental Control Age group Core Buffer Total Core Buffer Total
0- 5 14 16 15 13 10 13
6-10 15 17 16 17 18 17
11-20 22 19 20 20 18 19
21-30 21 23 22 26 28 27
31-40 17 16 16 15 16 15
41-50 8 6 7 7 10 8
51-60 3 2 3 1 1 1
60 + 1 2 1 0 1 0
100 100 100 100 100 100
Educational Level: The education level of the sample households indicates that the
proportion of illiterates was very high. Among the literate their education levels could
termed low, as most of them did not cross high school. The study also reveals that the
attainment of literacy levels between the age group of 6-14 years is significant. Of the
194 members in this group only 34 are illiterate and non-school going (14.91 per cent).
Further it is observed that Tribal Ashram schools have contributed a lot in attaining
literacy levels among Chenchus. Marriage: The Chenchus
Table 2.5: Distribution of household members by education level (%) Experiment Control Particulars
Core Buffer Total Core Buffer Total
Education Profile (%)
Illiterate 38 36 35 42 46 44
Primary 49 46 49 42 45 43
Upper primary 9 7 9 9 4 7
High school 4 8 6 6 4 5
Pre University 0 3 1 1 0 1
Degree 0 0 0 0 1 0
Education of 6-14 age group 93 99 96 83 88 85
Illiterate 7 1 8 11 5 16
Literate 92 124 216 55 38 93
Experimental Group

38
Occupation profile: Chenchus, being traditionally food gatherers, of late pursuing more
than one economic activity. The working status household members’ from experimental
group shows that NTFP collection is the single largest occupation in which 31.7 % of
members were engaged, the percentage being higher in core villages. The next important
occupation is agriculture, which accounted for 11.0 % of the members, followed by non-
agriculture labour (9%) and agriculture labour ((4.7%). There were a few salaried
employees in the sample households, but mostly in low-paid occupations. While 1% of
members cannot work, 0.5 % was engaged in household work. Students constituted 28.7
% of the members while 10.6 % were under aged to go to school.
Even in the case of control group NTFP collection emerges as a single largest occupation.
In this group, non-Agriculture labour occupied second position followed by agriculture
labour and agriculture. Thus the profile of the sample households indicates that buffer
villages appear to be better placed in terms of percentage households living in pakka
houses, etc.
Table 2.6: Distribution of household members by working status (%)
Experiment Control Particulars
Core Buffer Total Core Buffer Total
Occupation Profile (%)
Agriculture labour 4.1 5.3 4.7 6.8 14 10
Agriculture 7.7 14.7 11.0 6 12 8.1
Can not work 0.9 1.5 1.2 1.9 1.4 1.7
Children below 5 years 10.9 10.4 10.6 11.7 4.9 9.3
House wife 0.5 0.5 0.5 0.8 2.1 0.5
Non-agriculture labour 8.6 9.3 9.0 9 13.4 10.5
NTFP collection 37.9 24.7 31.7 33.5 31.8 29.4
Salaried 1.8 0.3 1.1 3.4 1.4 2.7
self employment 2.0 1.0 1.6 1 0 0.2
Studies 25.5 32.3 28.7 26.7 28.9 27.5 Social security programmes (%)
Pensions 10 10 20 4 2 6
Access to social security programmes: It may be noted that 10% of members in
experimental group and 6% in control group have accessed the social security
programmes from government. The reason for very less proportion of households
accessing pensions is that there are not many people in the age group above 65 years
(which is eligibility condition for accessing old age pensions).

39
APPENDIX 2: FUNCTIONING OF STITCHING CENTRE WITHIN SUPPORT
SERVICE CENTRE
Under CHELE project, Support Service Centres (SSCs) were established at Dornala (July
3, 2009) and Achampet (March 10, 2008) by CHRD and CONARE respectively. The
centres are located in one of residential quarters of Forest Divisional Office in Dornala
and Achampet. The Forest Department has provided space on free of cost at the request
of CPF. In both the places, the centre started stitching units. To this end, a group was
formed15
by organising five women members from Chenchu community. At least 50% of
the group members are literate – two in Dornala and three in Achampet. Thus groups in
both the places have opened a bank account. One member has dropped out from each
group. The member in Dornala has left the group as she got married and moved to her
in-laws village. Whereas, the member in Achampet (Ms. U. Anjali) left the group, after
undergoing 75 days of training, since she got employment as cook in AP Residential
School in her own village (Banala) - she says it is more remunerative and secure.
Table 1: Achievements of SSC
Particulars Dornala Achampet
No. of group
members
5 5
No. of members
who left the group
1 1
No. of days of
training
60 60
No. of additional
days of training
18 15
Infrastructure
provided
Two stitching machines
Other tools (plastic stool, scales,
tapes, drilling machine, etc)
Cloth material
Two stitching machines
Other tools (plastic stool, tapes,
drilling machine, etc)
Cloth material
Wok completed by
group
24 dresses fitted with helmet
50 gloves,
Repaired 5 dresses
9 dresses without helmet fitting.
30 dresses with helmet fitting
60 dresses without helmet fitting.
Income earned Rs.2250 per member for two
months – amount is not received
yet.
Rs.11875 for the period of 18 months
(July 2008-October 2009).
Of which each member received only
Rs.4375 so far
15
The group in Dornala was formed by mobilising SHG members from this location. On the other hand,
the groups in Achampet was formed by drawing SHG members from Banala, which is located 14 Kms
from the centre.

40
The group members are trained on designing and stitching of sting protection dress of
dress. For this purpose a tutor was arranged in both the places16
. Although it was
proposed to train members for 60 days, the number of days members trained was 90 days
in Dornala and 78 days in Achampet. The reason for extending training period in
Dornala was to provide skills on stitching of coats, dresses (Punjabi), blouses, etc. On the
other hand, the extension of training period became necessary due to change of tutor and
learning gap thereof.
Each centre was provided with infrastructure and material related to stitching sting
protection dress - two stitching machines, scissors, scales, tapes, registers, cloth material,
etc. However, the centre in Achampet did not receive scales; the members were reported
of facing problems in designing dress, as a result. The discussion with the members
revealed that there is no effort to link the centre with related government programmes.
The primary activity of the centre is stitching and repair of sting protection dress for
honey harvesters. In addition, the centre premises are used for monthly review meetings
of CBOs, partner NGO and CPF, training of master trainers and dialogue meetings with
GCC, ITDA and FD. The centre is also used for storing kits.
Current arrangement within the group is that two members stitch dresses, while other two
cut cloth material; and they exchange roles alternative day. The group members say that
they do not get repair work (dress and gloves) because the honey harvesters themselves
will repair their dresses. The material cost per dress is (including helmet) is roughly
Rs.1250. The project purchased dress from the group @1750/ per dress. The work done
by groups so far in both places is as follows:
� The group in Dornala had stitched 15 dresses during training period. After
training, the group stitched 20 sting protection dresses (helmet fitting is also part
of the dress stitching) and, have undertaken repair of 5 dresses and 50 gloves.
� The group in Achampet had stitched five dresses during training period. After
training, the group stitched and distributed 30 sting protection dresses with helmet
fitting (the work of helmet fitting is outsourced to outsiders @350 per dress). The
group has also stitched another 60 dresses and is about to outsource work related
to helmet fitting.
Income earned: The group members in Dornala received stipend @ Rs.80 per day
during the training period. (Each member received Rs.2400 as stipend per month.) They
contributed Rs.300 per month to group savings. In addition, each member will earn @
Rs.1125 per month for the work done since the completion of training (i.e., for two
months), if their payment is settled. (The groups are yet to receive payment for work
they have done.). It was found that the trainer and the group members were quite active.
16
The trainer was given honorarium of Rs.3000 per month.

41
On the other hand, the members in Achampet received stipend @ Rs.70 per day (and
Rs.2100 per month). And it was decided to pay Rs.500 per dress. In fact, the group
members received amount for stitching a dress even during training period. In addition,
each member is eligible to get Rs.11875 towards service rendered for 18 months (July
2008-October 2009). Thus, on an average each member has earned Rs. 660 per month.
So far each member received Rs.4375. The balance amount will be paid once the dresses
are distributed by the project.
Institutional arrangements: The centre was managed under the overall guidance of
partner NGO – CHRD and Conare. All the running costs of the centre are met by the
project. The partner organisations supplies dress material to group (by using the project
funds) and pays stitching charges to members (@Rs.500 per dress). It distributes the
dresses after fixing helmet (charges paid is Rs.200) to honey harvesters in the project
villages.
Sustainability: The group in Dornala wanted to improve their income by taking up
stitching and marketing items like petty coats and blouses, besides sting protection
dresses. They are exploring option of supplying school uniforms (of AP Residential).
They were of the view that they need two more machines (one machine for each member)
once they get above work. What is also required is to train and provide additional skills.
The earning of the members in Achampet is not encouraging. However, CPF is
extending similar methods of Sustainable practices to honey harvesters in Nabarangpur
district, hence it is likely that Stitching units at Dornala and Achampet get orders from
Orissa for stitching 300 dresses. This is likely to improve the group earning.
Constraints: The group members in Dornala have been facing problem as there is no
electric connection. There is pressure from husbands in the case of a couple members to
discontinue from the activity.
The members in Achampet reported the following problems: (i) members have stopped
coming to the centre in the last one and half months as there is no dress material; (ii) they
did not receive payment in the last four months for the dresses completely stitched as
well as partially stitched; and (iii) not able to meet travel cost from Banala to centre,
which is about 20 per day. As a result, the members have started participating in wage
labour including EGS. The members wanted payment to be made at least once a month.
Suggestions
The group in Dornala wanted support till it reaches a stage of sustainability. It was felt
that an exclusive staff member is required to oversee operations of stitching centre
including proper material supply and marketing. Other needs expressed by members
include training on blouses, other dress products and embroidery work, financial and
marketing support and payment of wages at least once in a month.