Embed Size (px)
Citation preview

CapeCharles
VirginiaBeachNorfolk
CapeCharles
Norfolk VirginiaBeach
ChesapeakeBay
ChesapeakeBay
A t l a n t i cO c e a n
James River
York River
U.S. Department of the InteriorU.S. Geological Survey
Professional Paper 1622
The Effects of the Chesapeake Bay Impact Crater on theGeologic Framework and the Correlation of Hydrogeologic Units of Southeastern Virginia, South of the James River

Availability of Publications of the U.S. Geological Survey
Order U.S. Geological Survey (USGS) publications by calling the toll-free telephone number 1-888-ASK-USGS or contact-ing the offices listed below. Detailed ordering instructions, along with prices of the last offerings, are given in the cur-rent-year issues of the catalog “New Publications of the U.S. Geological Survey.”
Books, Maps, and Other Publications
By Mail
Books, maps, and other publications are available by mail from—
USGS Information ServicesBox 25286, Federal CenterDenver, CO 80225
Publications include Professional Papers, Bulletins, Water- Supply Papers, Techniques of Water-Resources Investigations, Circulars, Fact Sheets, publications of general interest, single copies of permanent USGS catalogs, and topographic and thematic maps.
Over the Counter
Books, maps, and other publications of the U.S. Geological Survey are available over the counter at the following USGS Earth Science Information Centers (ESIC’s), all of which are authorized agents of the Superintendent of Documents:
• Anchorage, Alaska—Rm. 101, 4230 University Dr.• Denver, Colorado—Bldg. 810, Federal Center• Menlo Park, California—Rm. 3128, Bldg. 3,
345 Middlefield Rd.• Reston, Virginia—Rm. 1C402, USGS National Center,
12201 Sunrise Valley Dr.• Salt Lake City, Utah—2222 West, 2300 South• Spokane, Washington—Rm. 135, U.S. Post Office
Building, 904 West Riverside Ave.• Washington, D.C.—Rm. 2650, Main Interior Bldg.,
18th and C Sts., NW.
Maps only may be purchased over the counter at the following USGS office:
• Rolla, Missouri—1400 Independence Rd.
Electronically
Some USGS publications, including the catalog “New Publica-tions of the U.S. Geological Survey” are also available elec-tronically on the USGS’s World Wide Web home page athttp://www.usgs.gov
Preliminary Determination of Epicenters
Subscriptions to the periodical “Preliminary Determination of Epicenters” can be obtained only from the Superintendent of
Documents. Check or money order must be payable to the Superintendent of Documents. Order by mail from—
Superintendent of DocumentsGovernment Printing OfficeWashington, DC 20402
Information Periodicals
Many Information Periodicals products are available through the systems or formats listed below:
Printed Products
Printed copies of the Minerals Yearbook and the Mineral Com-modity Summaries can be ordered from the Superintendent of Documents, Government Printing Office (address above). Printed copies of Metal Industry Indicators and Mineral Indus-try Surveys can be ordered from the Center for Disease Control and Prevention, National Institute for Occupational Safety and Health, Pittsburgh Research Center, P.O. Box 18070, Pitts-burgh, PA 15236–0070.
Mines FaxBack: Return fax service
1. Use the touch-tone handset attached to your fax machine’s telephone jack. (ISDN [digital] telephones cannot be used with fax machines.)2. Dial (703) 648–4999.3. Listen to the menu options and punch in the number of your selection, using the touch-tone telephone.4. After completing your selection, press the start button on your fax machine.
CD-ROM
A disc containing chapters of the Minerals Yearbook (1993–95), the Mineral Commodity Summaries (1995–97), a statisti-cal compendium (1970–90), and other publications is updated three times a year and sold by the Superintendent of Docu-ments, Government Printing Office (address above).
World Wide Web
Minerals information is available electronically athttp://minerals.er.usgs.gov/minerals/
Subscription to the catalog “New Publications of the U.S. Geological Survey”
Those wishing to be placed on a free subscription list for the catalog “New Publications of the U.S. Geological Survey” should write to—
U.S. Geological Survey903 National CenterReston, VA 20192

U.S. GEOLOGICAL SURVEY PROFESSIONAL PAPER
UNITED STATES GOVERNMENT PRINTING OFFICE, WASHINGTON :
THE EFFECTS OF THE CHESAPEAKE BAY IMPACT CRATER ON THE GEOLOGIC FRAMEWORK AND THE CORRELATION OF HYDROGEOLOGIC UNITS OF SOUTHEASTERN VIRGINIA, SOUTH OF THE JAMES RIVER
1622
Prepared in cooperation with theHAMPTON ROADS PLANNING DISTRICT COMMISSION
2000
By David S. Powars

U.S. DEPARTMENT OF THE INTERIOR
BRUCE BABBITT, Secretary
U.S. GEOLOGICAL SURVEY
The use of firm, trade, and brand names in this report is for
endorsement by the U.S. Government.
For sale by U.S. Geological Survey, Information ServicesBox 25286, Federal Center
Denver, CO 80225
Library of Congress Cataloging in Publications Data:
identification purposes only and does not constitute
Charles G. Groat, Director
0-607-93693-2

CONTENTS
Abstract ................................................................................................................................................................................. 1Introduction ........................................................................................................................................................................... 2Purpose and Scope ...................................................................................................................................................... 4Description of Study Area........................................................................................................................................... 4Previous Investigations................................................................................................................................................ 5Acknowledgments ....................................................................................................................................................... 5
Methods of Investigation....................................................................................................................................................... 6Compilation of Lithologic Data from Cores and Well Cuttings ................................................................................. 6Analysis of Borehole Geophysical Logs ..................................................................................................................... 8
Structural Setting of Southeastern Virginia........................................................................................................................... 8Pre-impact Structural History...................................................................................................................................... 8Syn-impact Structural History..................................................................................................................................... 22Post-impact Structural History .................................................................................................................................... 25
Geologic Framework of Southeastern Virginia, South of the James River........................................................................... 26Basement Rocks .......................................................................................................................................................... 26Cretaceous Deposits .................................................................................................................................................... 27
Potomac Formation - Lower and Upper Cretaceous Deposits .......................................................................... 28Upper Cretaceous Deposits Younger Than Pollen Zone III .............................................................................. 29
Upper Cenomanian Beds (Pollen Zone IV) ............................................................................................ 29Glauconitic Sand Unit ............................................................................................................................. 31Upper Cretaceous Red Beds (Pollen Zone V) ........................................................................................ 31Upper Cretaceous and/or Paleocene Beds............................................................................................... 32
Tertiary Deposits ......................................................................................................................................................... 32Pre-impact Tertiary Deposits (Paleocene and lower and middle Eocene) ........................................................ 32Syn-impact Deposits (upper Eocene)................................................................................................................ 34Post-impact Deposits......................................................................................................................................... 35
Upper Eocene, Oligocene, and lower Miocene Post-impact Deposits.................................................... 36Middle and upper Miocene, Pliocene, and Quaternary Post-impact Deposits........................................ 36
Correlation of Geologic Units to Hydrogeologic Units ....................................................................................................... 38Summary and Conclusions.................................................................................................................................................... 43References Cited ................................................................................................................................................................... 45Appendixes............................................................................................................................................................................ 49
1. List of boreholes used in this report ........................................................................................................................ 502. Altitudes of the tops of stratigraphic units .............................................................................................................. 52
PLATE [in pocket at back of report]
1. Stratigraphic columns of three key boreholes
FIGURES
1. Map showing location of study areas (Phase I and Phase II), the Chesapeake Bay impact crater (CBIC), and significant regional physiographic and geologic features................................................................................... ........................ 3
2. Generalized geologic section of Chesapeake Bay impact crater. .............................................................. ............... 43. Map showing location of boreholes and stratigraphic cross sections. .......................................................... ............ 74. Map showing distribution of Cretaceous pollen zones across the Virginia Coastal Plain (A), and generalized
stratigraphic cross section of Virginia Coastal Plain (B). ..................................................................... .................... 125-8. Maps showing:
5. Structure contours of the top of the Upper Cretaceous deposits............................................................................... 14
Contents III

entress on
erived
ch means
6. Structure contours of the top of the pre-impact Lower Tertiary deposits. ................................................................ 157. Isopachs of the Upper Cretaceous deposits younger than pollen zone III showing abrupt truncation along
the northern part of the study area, irregular thickening and thinning in the northwestern part, and a southeast-thickening wedge. ..................................................................................................................................................... 16
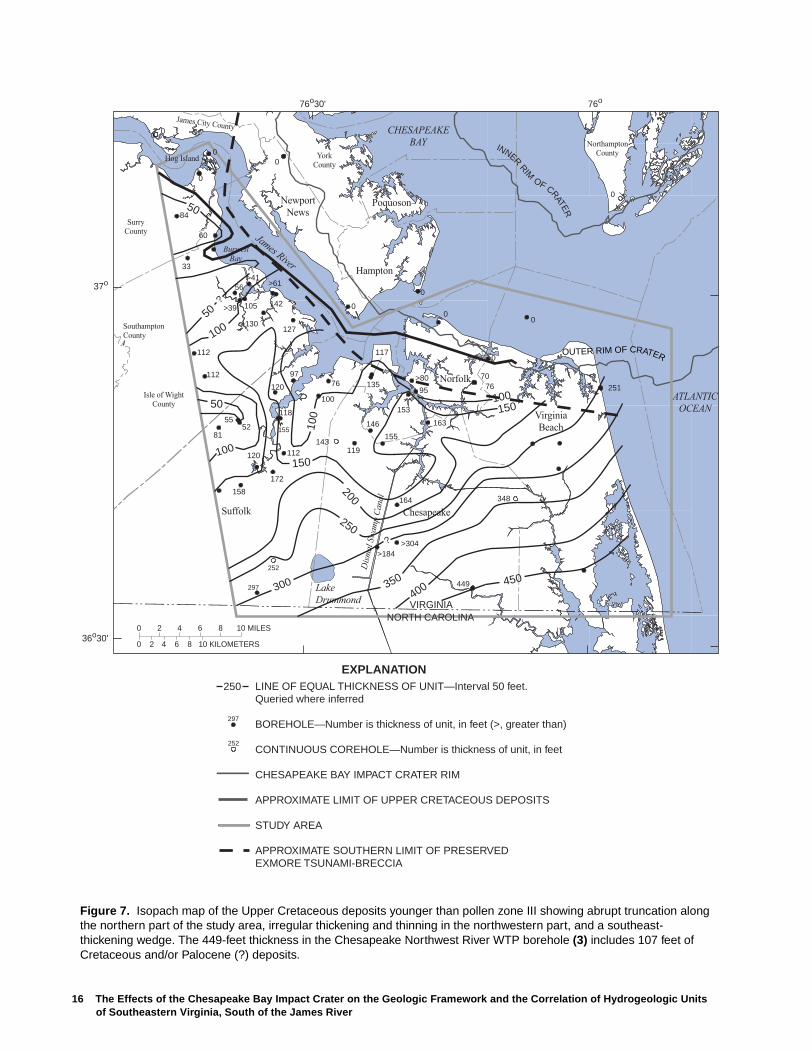
8. Isopachs of the pre-impact Lower Tertiary deposits showing a pattern of thickening and thinning. ....................... 179-11. Stratigraphic cross sections:
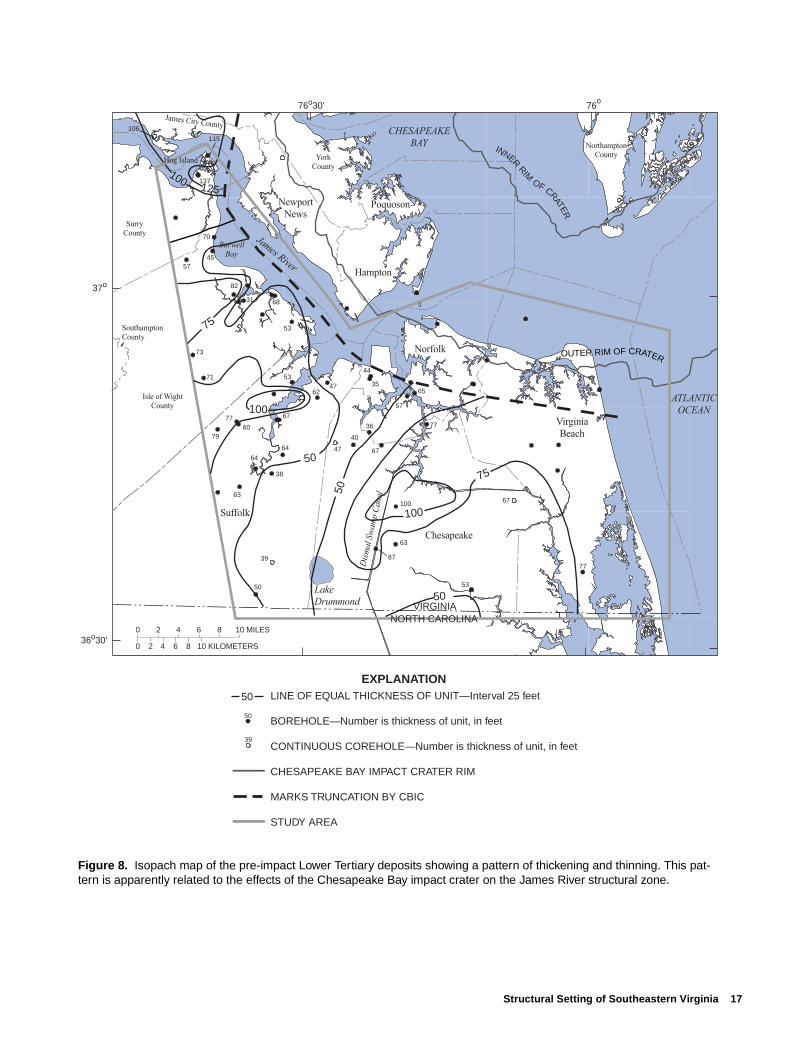
9. B-B ', Dismal Swamp to Newport News, showing the entire thickness of the Virginia Coastal Plain deposits and the top of the basement rocks (A), and details of the upper section of Coastal Plain deposits (B). ..................................... 18
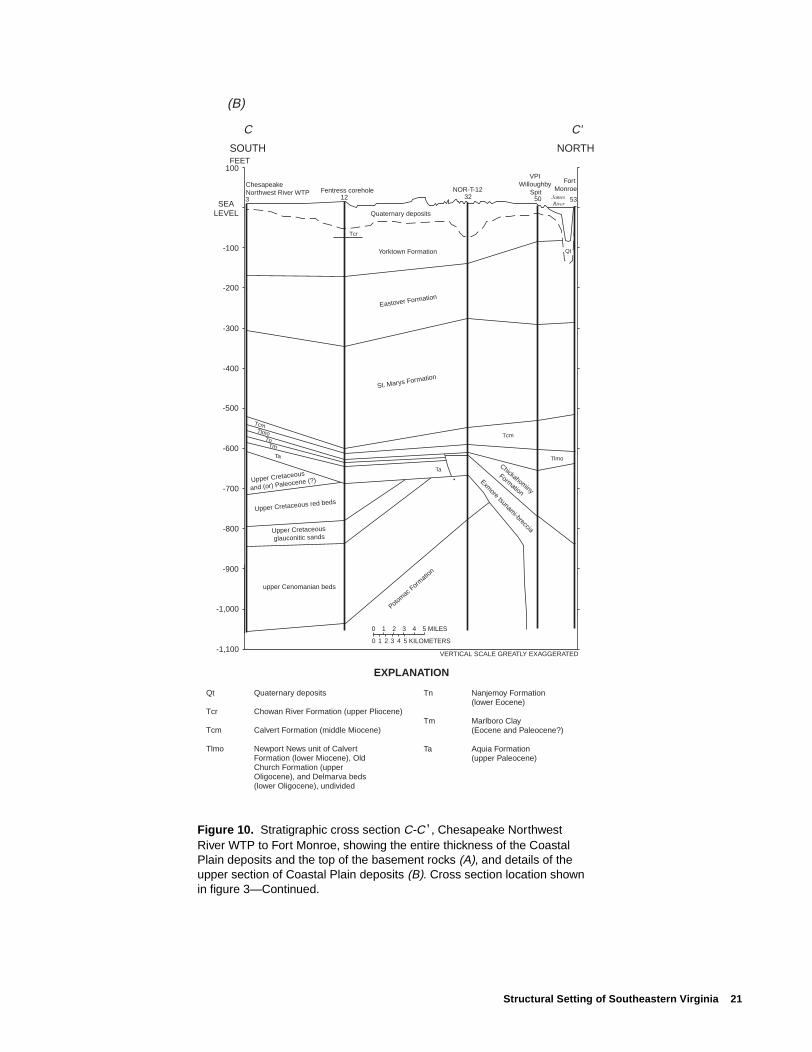
10. C-C ', Chesapeake Northwest River WTP to Fort Monroe, showing the entire thickness of the Coastal Plain deposits and the top of the basement rocks (A), and details of the upper section of Coastal Plain deposits (B). .................. 20
11. Fault interpretation of section B-B ', Dismal Swamp to Newport News, same section as figure 9A (A), and fault interpretation of same section as figure 9B (B) ........................................................................................................ 23
12. Map showing isopachs of upper Cenomian beds (pollen zone IV) showing thickening, thinning, and truncation apparently related to the pre-impact James River structural zone and the Chesapeake Bay impact crater. ............. 30
13. Correlation of geologic and hydrogeologic units in three key boreholes—the Dismal Swamp corehole (A), the Fcorehole (B), and the Chesapeake Northwest River WTP borehole (C)—showing the variability in unit correlatiacross the study area. ................................................................................................................................................ 41
14. Map showing relation of dissolved-solids concentrations in the middle Potomac aquifer to the location of the Chesapeake Bay impact crater. ................................................................................................................................. 44
TABLES
1. Correlation of stratigraphic units, including Cretaceous pollen zones of the Mid-Atlantic states. .................................. 92. Correlation of geologic units to hydrogeologic units....................................................................................................... 39
CONVERSION FACTORS, VERTICAL DATUM, AND ABBREVIATIONS
For readers who prefer to use metric units, conversion factors for terms used in this report are listed below:
Sea level: In this report, “sea level” refers to the National Geodetic Vertical Datum of 1929 (NGVD of 1929)—a geodetic datum dfrom a general adjustment of the first-order level nets of the United States and Canada, formerly called Sea Level Datum of 1929.
Altitude, as used in this report, refers to distance above or below sea level (bsl).
Concentrations of chemical constituents in water are reported in milligrams per liter (mg/L).
Age designations: The time of a geological event and the age of an epoch boundary are expressed as Ma (mega-annum), whi1,000,000 years, or years × 106.
Multiply By To obtain
inch (in.) 2.54 centimeters
foot (ft) 0.3048 meter
mile (mi) 1.609 kilometer
cubic inch (in3) 16.387 cubic centimeter (cm3)
pound per square inch (lb/in2) 6.895 kilopascal
IV Contents

Abstract 1
The Effects of the Chesapeake Bay Impact Crater on the Geologic Framework and the Correlation of Hydrogeologic Units of Southeastern Virginia, South of the James River
By D.S. Powars
Abstract
About 35 million years ago, a large comet or meteorslammed into the shallow shelf on the western marginof the Atlantic Ocean, creating the Chesapeake Bayimpact crater (CBIC). Virginia Coastal Plainsediments, the southern part of the Chesapeake Bay,and a small part of the Atlantic Ocean now cover thecrater. The impact apparently affected pre-impactstructures near the CBIC. Subsequent structuraladjustments of these structures likely were influencedby the crater and by the regional post-rift stress regimetypical of the passive margin scenario described for theAtlantic Coastal Plain. Structural adjustmentsdisrupted pre-impact sediments and basement rocks inthe southern Chesapeake Bay region and influencedsubsequent deposition, erosion, and preservation ofsediments. Correlations of litho- and biostratigraphicdata from borehole cores and cuttings and geophysicallogs were used to identify the location and geometry ofthe CBIC and possible pre-impact structures. Thisreport focuses on the Virginia Coastal Plain south of theJames River and complements a recent study of theCBIC’s effects on the geologic framework beneath thelower York-James Peninsula.
Pollen data indicate that only Lower Cretaceousdeposits are present in the subsurface north of theJames River, whereas on the south side of the river,both Lower Cretaceous (pollen zones I and II) andUpper Cretaceous (pollen zones III, IV, and V) depositsare present in the subsurface. Extreme variations inthickness of these deposits across the river, combinedwith an angular unconformity that separates thesedeposits from overlying, pre-impact lower Tertiarydeposits, provide evidence for a pre-impact JamesRiver structural zone. The distribution of sedimentsuggests that the region north of the river was relativelydepressed during pollen zone I, and relatively elevated
for the remainder of Cretaceous time. By contrast, theregion south of the James River was relativelydepressed during pollen zones II, III, IV, and V.
South of the James River, Upper Cretaceousdeposits younger than pollen zone III form asoutheastward-thickening wedge across the south-eastern half of the study area, but are thin andirregularly distributed across the northwestern half.The pre-impact lower Tertiary deposits dip eastward tonorthward and are structurally higher and thinner alongthe southern side of the study area, near the Virginia-North Carolina border, than along the northern side.
The complex distribution of post-impact units acrossthe James River provides evidence for post-impactadjustments of this James River structural zoneinitiated by the emplacement of the impact crater, andsubsequent burial. The truncation of many earlier post-impact (upper Eocene to middle Miocene) depositsindicates that the area south of the James Riverstructural zone was relatively elevated during that timeor at least prior to deposition of the upper Miocene St.Marys Formation. The presence of thicker post-middleMiocene deposits south of the James River, comparedto those north of the river, indicates downwarping ofthe area south of the river during this period and acomplex structural history of adjustments to the CBIC.
The structural and stratigraphic features created bythe impact, and the consequent structural adjustmentsof the James River structural zone, have influenced thehydrogeology, ground-water flow system, and waterquality of a large part of the Virginia Coastal Plain.Regional flow paths apparently were altered byemplacement of the possibly low permeability,lithologically heterogeneous Exmore tsunami-brecciadeposits, as well as by subsequent deposition ofprimarily very fine grained deposits in the CBIC’sstructural low. The buried CBIC created a large regionwhere differential flushing of seawater from the

andater-r
hsyion
fer-edalhedse-s-
inicttohehisd-plywas1).dy,uthesrk-
ntad-tly theic atal ofui-ofre-er,licheandndst
the
Coastal Plain sediments in and around the crater possiblyresulted in Virginia's "inland salt-water wedge." Theouter rim of the crater appears to act as a boundary and/ormixing zone separating ground water of high salinityinside the outer rim from lower salinity water outside theouter rim. The James River structural zone apparentlyabruptly offsets stratigraphic units that have beenpreserved differently north and south of the James River.
INTRODUCTION
The discovery of a large impact crater beneath Chesa-peake Bay has prompted a revision of the structural,stratigraphic, and hydrogeologic framework of a largepart of the Virginia Coastal Plain. The 56-mile-wideChesapeake Bay impact crater (CBIC) is located beneaththe lower Chesapeake Bay, its surrounding peninsulas,and a small part of the Atlantic Ocean east of the lowerpart of the Delmarva Peninsula (fig. 1); the approximatecenter of the crater is beneath the town of Cape Charles,Va. The CBIC was formed when a large comet or mete-orite crashed into shallow-shelf waters of the westernAtlantic Ocean approximately 35 million years ago (Ma).The impact produced an inverted, sombrero-shaped,complex crater that was immediately filled with chaoti-cally mixed sediments and rim-collapse material andeventually buried by younger sedimentary deposits. Adisruption boundary separates the impact rubble fromprimarily undisturbed sediments and rocks (fig. 2).Walled terraces, central peaks, and flat floors character-ize complex craters (Melosh, 1989), and the CBIC has allthese features.
The CBIC impactor slammed into part of an apparentstructural zone, herein referred to as the James Riverstructural zone, that traversed the Coastal Plain east towest beneath the eastern part of the present-day JamesRiver Basin. Deformational processes such as faulting,folding, and igneous intrusion created the unique struc-tural features of this area. The emplacement of the craterappears to have caused adjustments to this James Riverstructural zone, dramatically disrupted the pre-impactsediments and rocks in the southern Chesapeake Bayregion, and influenced subsequent sediment depositionand distribution patterns. Powars and Bruce (1999)described how the impact resulted in several regionalanomalies: (1) a large crater, partly filled by impact andcollapse debris; (2) an impact tsunami-breccia consistingof a mixture of sea water and sediments of Lower Creta-
ceous, Upper Cretaceous, Paleocene, and lower upper Eocene age; (3) a large area of anomalous wquality (Virginia’s "inland salt-water wedge"); (4) transformation of the depositional environment from inneneritic (shallow-shelf) to bathyal (deep-water) deptwithin the crater, in which fine-grained, low permeabilitsediments accumulated; and (5) a regional depressthat persisted because of post-impact loading and difential compaction. The existence of the CBIC, combinwith structural adjustments of a pre-impact structurzone, helps explain the distribution of saline water in tVirginia Coastal Plain aquifers. This information neeto be considered in revisions of the hydrogeologic framwork and ground-water-flow models of the aquifer sytem.
In July 1997, the U.S. Geological Survey (USGS), cooperation with the Hampton Roads Planning DistrCommission (HRPDC), initiated a multi-phase study refine the geologic and hydrogeologic frameworks of tCoastal Plain sediments in and near the CBIC. Tinformation will be the basis for revisions of the grounwater flow models that are used to guide water-supmanagement decisions. The York-James Peninsula the focus of Phase I (Powars and Bruce, 1999; fig. This report presents the results of Phase II of the stuwhich focused on an area in southeastern Virginia, soof the James River. Additionally, this report integratPhase II results with the Phase I evaluation of the YoJames Peninsula.
The discovery of the buried CBIC, and its appareeffect on a pre-impact structural zone, revealed the inequacy of the multi-aquifer conceptual model currenbeing used to represent the ground-water systems ofVirginia Coastal Plain. The existing hydrogeologframework and ground-water models were built upongeologic framework that described the Virginia CoasPlain as an eastward dipping and thickening wedgeunconsolidated sediments, readily subdivided into aqfers and confining units. Knowledge of the formation the crater and of the structural adjustments of a pimpact structural zone has disrupted this model, howevleading to the need for a re-appraisal of the hydrauproperties, ground-water flow, and geochemistry of taquifer system. First, the physical features created affected by the impact crater must be defined adescribed–in other words, the geologic framework mube established–in order to understand and refine hydrogeologic framework in this region.
2 The Effects of the Chesapeake Bay Impact Crater on the Geologic Framework and the Correlation of Hydrogeologic Units of Southeastern Virginia, South of the James River

Introduction 3
VIRGINIA
VIRGINIA
MARYLAND
WEST
VIRGINIA
VIRGINIA
CO
AS
TAL
PLA
IN
NORTH CAROLINA
DE
LAW
AR
EM
AR
YLA
ND
DELAW
ARE
NEW
JERSEY
VAMD
Washington, D.C.
FALL
LINE
FALL
LIN
E
CHESAPEAKE
Potomac
River
77o 76o 75o 74o 73o 72o
39o
38o
37o
BALT
IMO
RE
CAN
YON
TRO
UG
H
HAT
TER
AS B
ASIN
TOMSCANYON
SHEL
F ED
GE
BASE OF C
ONTINENTA
L SLO
PE
DE
LM
AR
VA
PE
NI N
SU
LA
SALISBURY
EMBAY
MENT
0 25 50 MILES
0 25 50 KILOMETERS
ATLANTICOCEAN
Richmond
James
River
LOCATION OFPHASE STUDY AREAII
VIRGINIA
NORTH CAROLINA
?
?
RappahannockRiver
YorkRiver
STUDY AREA(Phase )II
STUDY AREA(Phase )I
CBIC
EXPLANATION
IMPACT CRATER
ESTIMATED DISTRIBUTION OF PRESERVED EJECTA AND TSUNAMI-BRECCIA DEPOSITS óDarker shade used to emphasize crater
BURIED TRIASSIC (?)RIFT BASIN
APPROXIMATE NORTH END OF CAPE FEAR-NORFOLK STRUCTURAL BLOCK (EQUIVALENT TO THE JAMES RIVERSTRUCTURAL ZONE)
APPROXIMATE BOUNDARY BETWEEN BALTIMORE CANYON TROUGH AND HATTERAS BASIN
JURASSIC-
YORK-JAMES PENINSULA
BAY
SUFFOLK SCARP
Cape Charles
Base from U.S. Geological SurveyDigital Line Graph, 1:2,000,000, 1990
SusquehannaRiver
MAP AREA
Figure 1. Location of study areas (Phase I and Phase II), the Chesapeake Bay impact crater (CBIC), and significant regional physiographic and geologic features.

CRETACEOUS SEDIMENTS
CRETACEOUSSEDIMENTS
DISRUPTION BOUNDARYDISRUPTION BOUNDARY
KIPTOPEKECOREHOLE(2,000 FT)
NEWPORT NEWSCOREHOLE
(748 FT)
WEST EAST
UPPER MIOCENE TO QUATERNARY
MIDDLE MIOCENE
PEAK RING
CENTRAL PEAK
PEAK RING
PROTEROZOIC AND PALEOZOICCRYSTALLINE BASEMENT ROCKS
EXMORE TSUNAMI-BRECCIA
NORFOLKRIFT
BASIN
MEGABLOCKSMEGABLOCKS
LOWER MIOCENEAND OLIGOCENE
CHICKAHOMINY FM. (UPPER EOCENE)
CHESAPEAKE BAY IMPACT CRATERANNULAR TROUGH ANNULAR TROUGH
0 SEALEVEL
3,200
23,000-25,000
10,000-12,000
1
2
3
TW
O-W
AYT
RA
VE
LTIM
E,
IN S
EC
ON
DS
DE
PT
H E
QU
IVA
LEN
CE
,IN
FE
ET
(ES
TIM
ATE
D)
PALEOCENE ANDEOCENE
PALEOCENE, EOCENE
30 MILES
30 KILOMETERS0
0
EXPLANATION
POSSIBLE TRANSIENT CRATER SHAPE
FRACTURED AND FAULTED BASEMENT ROCKS
Figure 2. Generalized geologic section of Chesapeake Bay impact crater. (From Powars and Bruce, 1999.)
Purpose and Scope
This report refines the geologic framework of south-eastern Virginia, south of the James River, in and near theCBIC, and presents evidence for the existence of a pre-impact James River structural zone that was reactivatedby the impact. Lithologies of cores from exploratoryholes are correlated with borehole geophysical logs tocharacterize the physical properties of the stratigraphicunits and their geophysical signatures. The correlation ofcores, cuttings from wells, and borehole geophysical logsprovides the building blocks for compilation of strati-graphic cross sections. To further develop our under-standing of this structurally complex area, these crosssections are tied into the geologic framework of the lowerYork-James Peninsula as refined by Powars and Bruce(1999). The correlation of geologic units to hydrogeo-logic units is an important step towards the refinement ofthe hydrogeologic framework.
Description of Study Area
The study area encompasses the southeastern part ofthe Virginia Coastal Plain south of the Chesapeake Bay
and the James River and extends to just west of the Suf-folk scarp (fig. 1). Most of this area from the AtlanticOcean to the Suffolk scarp has low relief, generally lessthan 30 ft. The scarp marks where the relief jumps up to100 ft and is one of a succession of step-like terraces andintervening scarps that trend either parallel to the coast orto the major streams and were created by Pleistocene sea-level oscillations. These terraces become progressivelylower in altitude and younger in age toward the coast andrivers; the younger the terrace surface, the less dissectedit is. The buried outer rim of the crater is geomorphicallyexpressed by its alignment and concentric parallelismwith various Pleistocene wave-cut scarps.
The study area covers part of the north flank of theCape Fear-Norfolk block (a structural basement high).Figure 1 shows that part of the area is underlain by buriedrift basins that have been regionally dated as Jurassicand/or Triassic. Other major regional structural featuresof the basement include the Salisbury Embayment, theBaltimore Canyon Trough (a major structural low), theHatteras Basin, and buried Jurassic-Triassic rift basinsoutside the study area.
4 The Effects of the Chesapeake Bay Impact Crater on the Geologic Framework and the Correlation of Hydrogeologic Units of Southeastern Virginia, South of the James River

Vir-
e- ofnkshicrah-l-
l,ousJ.
m--C
ton,lk,esn,
),ofrre-heore E.ny
SndJays
thisng
Previous Investigations
In the late 1930’s and early 1940’s, the need todevelop ground-water resources in the southeastern Vir-ginia region was heightened by water demands for themilitary bases and by shortages caused by a severedrought. These pressures led to Cederstrom's (1945a, c)hydrogeologic studies of the southeastern Virginiaregion. Cederstrom’s studies provide lithologic logsfrom water-well cuttings, including those he logged him-self. His reports contain biostratigraphic data analyzedby J.A. Cushman (USGS), and water-quality data, includ-ing the initial delineation of Virginia’s inland salt-waterwedge and its associated Eocene basin north of the JamesRiver. Cederstrom first postulated the existence of aJames River fault zone to explain his interpretation of theerratic distribution and abrupt thickening of various stratanorth and south of the James River. Until the late 1980’s,the subsurface geology of this region was interpreted pri-marily on the basis of water-well cuttings and geophysi-cal logs (Brown and others, 1972; Meng and Harsh, 1988;Hamilton and Larson, 1988). Coch (Coch, 1968, 1971),Oaks (Oaks and Coch, 1973), and Johnson (Johnson,1969, 1976; Johnson and Peebles, 1985; Johnson andothers, 1985, 1987) provided detailed surficial mappingof southeastern Virginia south of the James River. Aregional compilation of the surficial units at 1:250,000scale was prepared by Mixon and others (1989).
The combined efforts of the USGS, the HRPDC, andthe Virginia Department of Environmental Quality(VDEQ) over the last 14 years have greatly changed ourunderstanding of the geologic framework of southeasternVirginia (Powars and others, 1987, 1990, 1991, 1992;Poag and others, 1992; Powars and Bruce, 1999). Theseinvestigations document the existence of the ChesapeakeBay impact crater (Powars and others, 1993; Poag,Powars, and Mixon, 1994; Poag, Powars, Poppe, andMixon, 1994); the crater's association with the inlandsalt-water wedge (Powars and others, 1994, 1998; Bruceand Powars, 1995); and the crater's structural and strati-graphic effects on post-impact sediment distribution andon the development of the present-day landscape (Powarsand others, 1993, 1998; Poag, Powars, and Mixon, 1994;Poag, Powars, Poppe, and Mixon, 1994; Poag, 1996,1997c; Johnson and Powars, 1996; Riddle and others,1996; Johnson, Kruse, and others, 1998; Johnson,Powars, and others, 1998). Most recently, Powars andBruce (1999) refined the geologic framework of theLower York-James Peninsula and described the effects
that the CBIC structure has had on the southeastern ginia Coastal Plain.
Acknowledgments
The stratigraphic and lithologic interpretations prsented in this report benefited from several yearsresearch by the author and his colleagues. Special thaare extended to USGS colleagues for the biostratigrapdata on dinoflagellates (Lucy E. Edwards), Foraminife(C. Wylie Poag; Thomas G. Gibson, now with the Smitsonian Institution; and Scott E. Ishman), Tertiary molusks (L.W. Ward, now with the Natural History Museumof Virginia), Cretaceous mollusks (Norman F. Sohdeceased), ostracodes (Thomas M. Cronin), calcarenannofossils (Laurel M. Bybell), and pollen (Ronald Litwin and Norman O. Frederiksen).
Thanks to the Hampton Roads Planning District Comission (HRPDC) and its Directors of Utilities Committee, which made this study possible. The HRPDrepresents the Cities of Chesapeake, Franklin, HampNewport News, Norfolk, Poquoson, Portsmouth, SuffoVirginia Beach, and Williamsburg, Va., and the Countiof Gloucester, Isle of Wight, James City, SouthamptoSurry, and York.
Much appreciation also to Gregory S. Gohn (USGST. Scott Bruce (VDEQ), Gerald H. Johnson (College William and Mary), and Scott R. Emry (HRPDC) fotheir helpful scientific reviews, and to Martha Erwin foeditorial review of this report. Special thanks to Thodore B. Samsel III and Brent Banks for their help in tdigitization of many figures, and to Wendy Danchuck fcartographic assistance. The assistance of GeorgHarlow, Jr., in the location and proper labeling of mawells is greatly appreciated.
Finally, special appreciation is extended to USGdrillers Donald Queen, Dennis Duty, Gene Cobbs, aGene Cobbs III, and VDEQ drillers John Creason and Owens for their determination in obtaining continuoucore samples that provide the ground truth needed for kind of investigation, discovery, and report. Appreciatiois given to Sydnor Hydrodynamics, Inc., for providingeophysical logs for this study.
Introduction 5

ofernf
tor-
ldt isorttor-mprtd
dheheI)ces,alsp-a-he as
lant
byre-m
os-ha-e-fndher--
nexi-s.s of
elp
inip-enater-
METHODS OF INVESTIGATION
The geologic framework of southeastern Virginia,south of the James River, was refined by analyzing strati-graphic and lithologic data from cores, well cuttings, andborehole geophysical logs. Selected core intervals weresampled for mineralogic and biostratigraphic analysis.The more recent data were combined with re-evaluationsof previously published data to provide new interpreta-tions that account for the effects of the CBIC, includingits apparent effects on the pre-impact James River struc-tural zone.
Compilation of Lithologic Data from Cores and Well Cuttings
The borehole-numbering system used in this studyrefers to a location number on figure 3—printed in boldin the text, for example, (12)—and in appendixes 1 and 2.To maintain continuity with Powars and Bruce (1999),appendix 1 includes the local reference number, such asthe USGS Ground-Water Site Inventory (GWSI) numberor the well number assigned in other reports (Cederstrom,1945a, b; Brown and others, 1972). The GWSI is basedon a system in which Virginia's 7-1/2-min quadranglesare numbered 1 through 69 from west to east, and letteredA through Z (omitting I and O) from south to north; wellsare identified and numbered serially within each 7-1/2-min quadrangle. As an example, well 58A76 is in quad-rangle 58A and is the 76th well in that quadrangle forwhich the location and other data were recorded by theUSGS. Appendix 2 lists the altitudes of the tops of strati-graphic units used in this report.
Litho- and biostratigraphic data derived from continu-ous coreholes with high recovery rates (fig. 3) providedthe stratigraphic control for this investigation. Nine coreswere obtained between 1986 and 1995 by the USGS andthe VDEQ as part of their cooperative research efforts(Powars and others, 1992; Powars and Bruce, 1999).These cores are stored at the USGS core-storage areas inReston and Herndon, Va., or at the VDEQ in Richmond,Va. Corehole names are derived from nearby geographicfeatures and include (listed in the order drilled) Exmore,Dismal Swamp (2), Jenkins Bridge, Fentress (12), Kipto-peke (64), Newport News Park 2 (63), Windmill Point,Airfield Pond, and Jamestown (61). (Only those core-holes assigned a borehole number are discussed in thisreport.) The Dismal Swamp (2) and Fentress (12) core-holes are located in the southern part of the study area,
and the Newport News Park 2 (63) and Kiptopeke (64)coreholes, which lie just outside the northern boundarythe study area, were used for control across the northpart. An additional corehole was drilled for the City oChesapeake as part of its Western Branch Aquifer Sage and Recovery Project and is labeled 21 on figure 3.This corehole is referred to as MW4-1 (the original fiedesignation) in Powars and Bruce’s 1999 report, buherein given the name Chesapeake-Portsmouth Airpcorehole. This core also is stored at the USGS core-sage area in Herndon, Va. In this study, the Dismal Swa(2), Fentress (12), and Chesapeake-Portsmouth Airpo(21) coreholes provided the key lithostratigraphic anbiostratigraphic data for borehole log correlation.
Lithologic and biostratigraphic data from selectecored intervals in test holes drilled in the 1970’s by tVDEQ and by the U.S. Department of Energy and tVirginia Polytechnic Institute and State University (VPprovided additional stratigraphic control. Subsurfadata consisting primarily of lithologic data from cuttingborehole geophysical logs, and selected cored intervbecame available from a Brackish Groundwater Develoment Project recently conducted by the City of Chespeake at the Northwest River Water Treatment Plant. Tdeepest borehole drilled at this site is herein referred tothe Chesapeake Northwest River Water Treatment P(WTP) borehole (3).
Descriptions of borehole cuttings were interpreted correlation to the coreholes, resulting in many reinterptations of stratigraphic units described by Cederstro(1945a, b) and by Brown and others (1972). The bitratigraphic data in these earlier reports were empsized, while noting the potential for down-holcontamination. The detailed Virginia Division of Mineral Resources (VDMR) lithologic descriptions owashed samples are from mud-rotary drilled wells aclearly reflect down-hole contamination. Therefore, tdescriptions were carefully scrutinized for the first occurences of stratigraphically significant lithologic components, for example, shells and glauconite for marideposits; and feldspar, gravel, lignitized wood, and odized, multicolored clays for deltaic and fluvial depositWhere available, decreasing or increasing percentagethe various lithic components were also used to hdefine stratigraphic horizons.
When conflicting data were encountered, either witha single borehole (for example, when lithologic descrtions did not agree with the geophysical log) or betwewells, priority was given to cuttings descriptions thwere made by an on-site geologist (primarily D.J. Ced
6 The Effects of the Chesapeake Bay Impact Crater on the Geologic Framework and the Correlation of Hydrogeologic Units of Southeastern Virginia, South of the James River

Methods of Investigation 7
Base from National Oceanic and Atmospheric Administration/National Ocean ServiceMedium Resolution Coastline, 1:70,000, 1994
3229
3031
51
Virginia
Beach
Chesapeake
Hampton
PoquosonNewport
News
James City County
Suffolk
Isle of Wight
County
Southampton
County
Surry
County
Bacons
Castle
Smithfield
Hog Island York
County
Northampton
County
Norfolk
1
1
12
29
10
11
37
38
57
56
76o30' 76o
37o
36o30'0 2 4 6 8 10 MILES
0 2 4 6 8 10 KILOMETERS
5554
ATLANTIC�
OCEAN
James River
A
A'
B
NORTH CAROLINAVIRGINIA
19
20
39
40
48
424149
62, 63
61
64
53
50
36
52
60
58, 59
46
44 4543
CHESAPEAKE�
BAY
B' C'
3
4
5 6
78
12
1314
15
17
18
22
23
2425
26
27
28
33
34 35
47
C
16
OUTER RIM OF CRATER
INNERRIM
OF CRATER
EXPLANATION
A A'
Lake
Drummond
DismalSwampCanal
Burwell
Bay
63 MILES
21
CROSS SECTION
CHESAPEAKE BAY IMPACT CRATER RIM
STUDY AREA
BOREHOLE AND NUMBER
CONTINUOUS COREHOLE AND NUMBER
Figure 3. Location of boreholes, continuous coreholes, and stratigraphic cross sections. See Appendixes 1 and 2 for data on boreholes.

rimp-
ea
e-re-mesne.ortshissi-
A in
ir-ousthe
talralecanftheort99)athsts aatearsrys-es
oic
ddnd
lytri-ithsa-
theothndna
strom, and T.S. Bruce, VDEQ). In some cases, emphasiswas placed on the interpretation of geophysical logs fromboreholes that were similar to and located near one of thethree key coreholes. Emphasis was also placed on anybiostratigraphic data that were included. Data from wellsthat were drilled by the cable tool method also were givenpriority over rotary-drilled wells because rotary methodstend to produce greater mixing than cable methods.
Analysis of Borehole Geophysical Logs
Borehole geophysical logs were interpreted by estab-lishing geophysical signatures for the various unitsdefined in several continuous coreholes. These geophys-ical signatures were then correlated to those of other logsgathered for this investigation. Interpretation for eachborehole was an iterative process because the detail of thelithic descriptions ranged from generalized drillers’ logsto microscopic descriptions of samples. Correlationsalso were made to other nearby borehole lithologic logspublished by Cederstrom (1945a, b), and by Brown andothers (1972), and to unpublished VDMR, VDEQ, andUSGS data. Powars and Bruce (1999) found that con-flicting data were encountered most often around theouter rim of the CBIC, especially for the uncored bore-holes located far from one of the continuous coreholes.
The number and type of geophysical logs variedgreatly from borehole to borehole. Single-point resis-tance and natural gamma logs were the most numerousand therefore were used for establishing the geophysicalsignatures. Correlation also was made with multipointresistivity, 6-foot lateral resistivity, and spontaneouspotential logs. The cross sections in this report are basedon interpretation of the lithic descriptions and geophysi-cal logs.
STRUCTURAL SETTING OF SOUTHEASTERN VIRGINIA
In contrast to the regional post-rift thermal- and load-driven subsidence typical of the “passive margin” sce-nario described for the Atlantic Coastal Plain (Grow andSheridan, 1988), the basement rocks and sediments of theCoastal Plain of Virginia record a complex geologicalhistory, including the effects of the catastrophic upperEocene comet or meteorite impact. This impact producedthe CBIC, the largest impact crater found so far in the
United States. The southwestern portion of the outer of the crater extends from the Newport News and Hamton area to the northern Norfolk and Virginia Beach ar(fig. 3).
This section subdivides the structural history into primpact, syn-impact, and post-impact sections and psents evidence for the existence of a pre-impact JaRiver structural zone and the CBIC’s effects on this zoTable 1 shows the geologic units described in this repand their correlation with geologic units of key previouinvestigations, as well as Cretaceous pollen data. Ttable provides the stratigraphic nomenclature and potion of the geologic units discussed in this section. more detailed description of the geologic units is giventhe Geologic Framework section.
Pre-impact Structural History
The basement rocks beneath the Coastal Plain of Vginia have been interpreted to be an assembly of varitectonostratigraphic terranes that were accreted to North American continent during Paleozoic continencollisions (Horton and others, 1991). Most of the centto outer Coastal Plain of Virginia is underlain by thChesapeake Block, which has been interpreted as AfriArchean to Lower Proterozoic rocks that were leaccreted on to the North American continent during tMesozoic opening of the present Atlantic Ocean (Lefand Max, 1991). Recently, Sheridan and others (19presented a rubidium/strontium date from rocks benethe southeastern New Jersey Coastal Plain that suggeMiddle Proterozoic age for the Chesapeake Block. LPaleozoic granitic plutons also are present. It appethat some major structural zones are present in the ctalline basement rocks, some of which likely were zonof weakness (faults) that became involved with Mesozrift basin formation.
The last breakup of North America, Eurasia, anAfrica began with Triassic rifting and was associatewith an extensional stress regime that pulls apart athins the crust. This rifting continued into the EarJurassic and produced crustal instability and asymmecal, down-dropped, sediment-filled basins (grabens) wwrench and transform faults, tilting, folding, igneouintrusion, and widespread volcanism (see fig.1 for loction of rift basins beneath the Coastal Plain). Part of study area is underlain by two of these rift basins, bhaving northern boundaries south of the CBIC aextending southward 10 to 20 miles into North Caroli
8 The Effects of the Chesapeake Bay Impact Crater on the Geologic Framework and the Correlation of Hydrogeologic Units of Southeastern Virginia, South of the James River

Stru
ctural S
etting
of S
ou
theastern
Virg
inia 9
SYSTEM SERIES Geologic unitsthis report
Cederstrom(1957)
Brown andothers (1972)
Mixon, Berquist,and others (1989)
QU
ATE
RN
AR
Y Holocene
Pleistocene
Alluvium, swamp, beach
Tabb FormationShirley Formation
Chuckatuck Formation
U
M
LWindsor Formation
Bacons Castle Formation
PlioceneU
L
Miocene
M
U
L
CH
ES
AP
EA
KE
GR
OU
P
Yor
ktow
n F
orm
atio
nE
asto
ver
For
mat
ion
St. Marys Formation
Cal
vert
For
mat
ion4
Calvert Beach Member
Plum Point Member
Fairhaven Member
Recent beach
ColumbiaGroup
(Quaternary)
YorktownFormation(Miocene)
St. MarysFormation(Miocene)
CalvertFormation(Miocene)
Moore House Member
Mogarts Beach Member
Rushmere Member
Sunken MeadowMember
Cobham BayMember
Claremont ManorMember
Unnamed beds3
Rocks ofpost Miocene
age
Rocks oflate Miocene
age
Rocks ofmiddle Miocene
age
Coastal barriers, lagoonsalluvial, swamp, eolian
Tabb FormationShirley Formation
Chuckatuck FormationCharles City FormationCharles City Formation
Windsor Formation
Bacons Castle FormationChowan River Formation
YorktownFormation
EastoverFormation
Plio
cene
san
d +
gra
vel
Mio
cene
san
d +
gra
vel
CalvertFormation
Choptank Formation
St. Marys Formation
CH
ES
AP
EA
KE
GR
OU
P
Choptank Formation(not present in study area)
(East of the Chesapeake Bay)Kent Island FormationWachapreague FormationNassawadox Formation
Omar Formation
U
M
Moorings unit
sand
Choptank Formationnot present east
and south ofChesapeake Bay
Old Church FormationOligocene
TE
RT
IAR
Y
??
??U Old Church Formation
?
2
Newport News unit
?
PollenZonation1
Notstudied
1Follows Brenner (1963) and Owens and Gohn (1985). 2Chowan River Formation.3Powars, D.S. and Cronin, T., U.S. Geological Survey, unpub. data, 1995.4Not present south of James River.
?
????
Table 1. Correlation of stratigraphic units, including Cretaceous pollen zones of the Mid-Atlantic states. Modified from Powars and Bruce, 1999
[Upper, upper; M, middle; L, lower; Fm, formation]

10 Th
e Effects o
f the C
hesap
eake Bay Im
pact C
rater on
the G
eolo
gic F
ramew
ork an
d th
e Co
rrelation
of H
ydro
geo
log
ic Un
its o
f So
uth
eastern V
irgin
ia, So
uth
of th
e James R
iver
Rocks ofMiddle Miocene age (?)L
Old Church Formation
Delmarva bedsOligocene
Eocene
ChickahominyFormation
Exmore tsunami-breccia
Piney PointFormation4
NanjemoyFormation
Marlboro ClayAquia
Formation
BrightseatFormation
Paleocene
ChickahominyFormation
NanjemoyFormation(Eocene)
(upper Eocene)
AquiaFormation P
amun
key
Gro
upMattaponiFormation
??U
U
U
L
L
L
M
?
Rocks ofJackson age
Rocks ofClaiborne
age
Rocks ofSabine
age
Old Church Formation
Delmarva beds5
ChickahominyFormation
PineyPoint
Formation
NanjemoyFormation
Marlboro Clay
AquiaFormation
BrightseatFormation
Rocks of Midway
age
Exmore beds5
UpperCenomanian
beds6
Unnamed6
PotomacFormation
Rocks of unit ARocks of unit BRocks of unit CRocks of unit D
Rocks of unit E
Rocks of unit F
Rocks of unit G
Rocks of unit H
PotomacFormation
Exmore megablock beds
Upper Cenomanian beds5
Glauconitic sand unit5Red beds5
Lower Mesozoic rift-basindeposits
Basement rocks
Woodstock Member5
Potapaco Member5
Pasapotansa Member5
Piscataway Member5(Eocene)
PotomacGroup
PotomacGroup(Upper
Cretaceous)
(LowerCretaceous)
(Paleocene +Upper
Cretaceous)
?
?
Upper
Lower
Newport News unit of Calvert FmMiocene Calvert Formation
SERIESSYSTEMT
ER
TIA
RY
CR
ETA
CE
OU
SGeologic units
this reportCederstrom
(1957)Brown and
others (1972)Mixon, Berquist,and others (1989)
Calvert Formation(Miocene)
JURASSIC-TRIASSIC
PALEOZOIC AND PROTEROZOIC
Red beds6 Glauconitic sand unit 6
PollenZonation1
7V
IV
III
II
I? ?
Notstudied
6Not present north of James River.
1Follows Brenner (1963) and Owens and Gohn (1985). 2Chowan River Formation.3Powars, D.S. and Cronin, T., U.S. Geological Survey, unpub. data, 1995.4Not present south of James River.5From Powars and others (1992).
7Glauconitic sand unit not studied.
??
?
??
??
??
Table 1. Correlation of stratigraphic units, including Cretaceous pollen zones of the Mid-Atlantic states. Modified from Powars and Bruce, 1999—Continued
[Upper, upper; M, middle; L, lower; Fm, formation]

(fig. 1). The major border faults of these rift basins gen-erally are parallel to old Appalachian lineaments.
Deposition of the Coastal Plain sediments began in theLate Jurassic with the opening of the Atlantic Ocean andthe beginning of sea floor spreading. The initial stages ofaccumulation of post-rift sediments in southeastern Vir-ginia occurred in the Early Cretaceous with deposition offluvial and deltaic deposits by streams and rivers. As theAtlantic Ocean widened, the environment of depositionwas influenced by regional-scale tectonism that involvedgentle subsidence of the entire Atlantic continental mar-gin and major alternating marine transgressive andregressive phases (the passive margin scenario), as wellas local independent structural movement that created atransverse arch-basin structural configuration. The axesof these arches and basins trend in an easterly or south-easterly direction transverse to the northeast- southweststrike of the Atlantic continental margin. This arch-basinconfiguration has been explained, using tectonic models,as block-like structures bounded by zones of weakness inthe crystalline basement rocks or resulting from the pos-sible movement of the landward parts of oceanic trans-form faults. The structural blocks would have moved upor down relative to each other in response to non-uniformloading or basement rock tectonics. Brown and others(1972) suggested that structural blocks were bounded bybasement faults that created recurrently reversing verticalmovement along wrench faults during deposition toexplain the stratigraphic thinning and thickening of Cre-taceous- and Tertiary-age formations associated withthese arches and basins.
The Norfolk arch trends eastward across southeasternVirginia just south of the James River and appears to rep-resent a basement and stratigraphic structural high that ispart of the north end of the Cape Fear-Norfolk block (seefig. 1). North of the arch is a major tectonic downwarpedbasin referred to as the Salisbury Embayment; south ofthe arch, in the outer Coastal Plain of North Carolinawithin the Cape Fear-Norfolk block, is a minor basinknown as the Albemarle Embayment. The AlbemarleEmbayment is located on the northern side of AlbemarleSound, just south of the study area. The Norfolk archappears to coincide with (1) the north end of shallow riftbasin deposits (indurated red beds) that overlie graniteand (2) the north end of the Cape Fear-Norfolk block,which also aligns with the onshore extension of the Nor-folk Fracture zone. These factors point to the existenceof a structural zone in the vicinity of the James RiverBasin. Cederstrom (1945a) originally suggested that abasin controlled by basement faulting occupied the area
immediately north of the present James River fromHampton Roads northwestward to at least Hog Island, inSurry County. Powars and Bruce (1999) interpretedmuch of this postulated James River fault zone as part ofthe outer rim of the crater, but also suggested some pre-impact structural involvement. The distribution of Creta-ceous pollen zones, which extends outside of the craterand its preserved ejecta, also supports the existence of apre-impact James River structural zone (fig. 4). ThisJames River structural zone coincides with the north sideof the Norfolk arch. A series of isopach maps by Hamil-ton and Larson (1988) show several confining units thatdramatically thin or pinch out northward across or inproximity to the postulated James River structural zone.
Structure contour maps of the top of the Upper Creta-ceous and the top of the pre-impact lower Tertiary depos-its show east to southeast deflections of the contours,possibly reflecting faulted zones (figs. 5 and 6); the maindeflection coincides with a previously postulated fracturezone (Johnson and others, 1998). Figure 5 also shows thetruncated distribution of the red beds, which may be faultcontrolled, and that in the Norfolk to Virginia Beach areaadjacent to the crater, Upper Cretaceous deposits aretruncated and overlain by the Exmore tsunami-breccia.An isopach map of the Upper Cretaceous, younger thanpollen zone III deposits (upper Cenomanian beds, glauc-onitic sand unit, red beds, and Upper Cretaceous and/orPaleocene) combined shows a southeastward-thickeningwedge that thickens from 30 to 500 ft across the studyarea (fig. 7). Some of this thickening occurs becausemore Upper Cretaceous units are preserved on the south-east side of the Norfolk arch. An isopach map of the pre-impact lower Tertiary deposits indicates that these depos-its thicken north of the James River and west of their trun-cation by the CBIC (fig. 8). These deposits thicken andthin across the rest of the study area with their erratic dis-tribution apparently caused primarily by syn- and post-impact erosional and structural influences of the CBIC onthe pre-impact James River structural zone. Part of thepattern also appears to reflect radial fault systems thatwere created by the CBIC.
Three north-south stratigraphic cross sections showthe complex stratigraphy encountered across this region(figs. 4, 9, and 10). Figure 9A shows the entire section ofCoastal Plain sediments and the top of the basementrocks in a cross section that extends from near the DismalSwamp corehole (2) to the City of Newport News CityHall Complex borehole (49). This section is within thedisruption boundary that separates pre-impact units fromimpact debris or syn-impact units. Figure 9B shows the
Structural Setting of Southeastern Virginia 11

12 The Effects of the Chesapeake Bay Impact Crater on the Geologic Framework and the Correlation of Hydrogeologic Units of Southeastern Virginia, South of the James River
Richmond
FALL
LINE
FALL
LIN
E
38o
37o
77o 76
POTOMAC
RIVER
JAMES
RIVER
YORK
RIVER
RIVER
RAPPAHANNOCK
VIRGINIA
NORTH CAROLINA
DELAWAREMARYLAND
MARYLAND
VIRGINIA
ATLANTIC
OCEAN
CHESAPEAKE
BAY
0 25 MILES
25 KILOMETERS0
OUTER RIM
OF
CR
ATE
R
X
XX X
NO DATA
NO DATA
NO DATA12F
2DS
65AP
61
66M
62NNP1
5740
43
15
DrewrysBluff
68H67
69OGA'
A
EXPLANATION
DS - Dismal Swamp 2
OG - Oak Grove 69
F
F - Fentress 12
AP - Airfield Pond 65
H - Haynesville 68
A A' STRATIGRAPHIC CROSS SECTION
Zone
Zone
Zone
Zone
Zone
V
IV
III
II
I
X
CONTINUOUS COREHOLE (AND NUMBER) WITH POLLEN ANALYSIS
(A)
62NNP1 - Newport News Park 1
66M - Mann Tract Monitor well #1
67 - Taylor #1, oil test well (includes Cretaceous deposits younger than pollen zone ) V
43 BOREHOLE AND NUMBER
OUTCROP AT DREWRYS BLUFF (Owens and Gohn, 1985)
Southampton County
Franklin
Isle o
f Wigh
t
County
SurryCounty
HanoverCounty
Cenomanian
Coniacian to Santonian
Low
er
Cre
tace
ous
Upp
er
Cre
tace
ous
BURIED JURASSIC- (?)RIFT BASIN
STUDY AREA
TRIASSIC
middle tolate Albian
Barremianto early Albian
Base from U.S. Geological Survey Geologic Map, 1:250,000, Mixon, Berquist, and others, 1989
APPROXIMATE EXTENT OF POLLEN ZONE
Figure 4. Distribution of Cretaceous pollen zones—these deposits were removed or disturbed inside the crater—across the Virginia Coastal Plain (modified from Owens and Gohn, 1985) (A) , and generalized strati-graphic cross section of Virginia Coastal Plain (B). See Appendix 2 for data on boreholes outside study area.

Structural Setting of Southeastern Virginia 13
POST-IMPACT TERTIARY NORTHWEST
James RiverSOUTHEAST
A
(B)
PRE-IMPACT TERTIARY
CRYSTALLINE BASEMENT
ROCKS"CHESAPEAKE BLOCK"(HORTON AND OTHERS, 1991)
JURASSIC-TRIASSIC (?)RIFT BASIN
II
I
II
OG615743 4015DS2SEA
LEVEL
-200
-400
-600
-800
-1,000
-1,200
-1,400
-1,600
-1,800
-2,000
CRYSTALLINE BASEMENT ROCKS
"CHESAPEAKE BLOCK"(HORTON AND OTHERS, 1991)
JURASSIC-TRIASSIC (?)RIFT BASIN
MANN TRACTMONITOR WELL #1
Granite
Position of contact uncertain ?
EXPLANATION
Inconclusive or no pollen data
JURASSIC-TRIASSIC (?) RIFT BASIN
Newport News Park 1 pollen data (I) projected into line of section+
III(?)
A'
I
V
0 25 MILES
25 KILOMETERS0
ALT
ITU
DE
, IN
FE
ET
Indurated red beds
NORFOLK ARCH
JAMES RIVER STRUCTURAL ZONE
+IV
III
VERTICAL SCALE GREATLY EXAGGERATED
?
?
?
Figure 4. Distribution of Cretaceous pollen zones—these deposits were removed or disturbed inside the crater—across the Virginia Coastal Plain (modified from Owens and Gohn, 1985) (A) , and generalized stratigraphic cross section of Virginia Coastal Plain (B). See Appendix 2 for data on boreholes outside study area. —Continued.

14 The Effects of the Chesapeake Bay Impact Crater on the Geologic Framework and the Correlation of Hydrogeologic Units of Southeastern Virginia, South of the James River
Chesapeake
Hampton
PoquosonNewport
News
Suffolk
Isle of Wight
County
Surry
County
York
County
Northampton
County
Norfolk
76o30' 76o
37o
36o30'0 2 4 6 8 10 MILES
0 2 4 6 8 10 KILOMETERS
ATLANTIC
OCEAN
James River
VIRGINIA
CHESAPEAKE
BAY
OUTER RIM OF CRATER
INNERRIM
OF CRATER
Lake
Drummond
DismalSwampCanal
EXPLANATION
Southampton
County
Virginia
Beach
-815
-608
-687-564
-308
-378
-346 -407
-397-334
-336
-415
-313-381
-371
-423
-433
-449
-338
-294
-313
-294
-324
-294-252
-251
-263
-300
-232
-295
-283
-247
-280 -276
-272
-250
-292
-495
-504
-572
-750
-515
-487
-524
-859
-350
-300
-400-4
50
-500
-550
-600 -650
-700-750
-800
-850-2
50
-250
-900
-300
-350
-705
-701
-294
-397
STUDY AREA
APPROXIMATE SOUTHERN LIMIT OF PRESERVED EXMORE TSUNAMI-BRECCIA
CHESAPEAKE BAY IMPACT CRATER RIM
APPROXIMATE LIMIT OF UPPERCRETACEOUS DEPOSITS
DISTRIBUTION OF RED BEDS
AREA WHERE UPPER CRETACEOUS DEPOSITS ARE ABSENT (OUTSIDE LIMIT OF PRESERVEDEXMORE TSUNAMI-BRECCIA)
STRUCTURE CONTOUR—Contour interval 50 feet. Datum is sea level
BOREHOLE—Number is altitude of top of unit, in feetbelow sea level
CONTINUOUS COREHOLE—Number is altitude oftop of unit, in feet below sea level
-100
NORTH CAROLINA
Hog Island
James City County-258
Burwell
Bay
Figure 5. Structure contour map of the top of the Upper Cretaceous deposits. East to southeast deflections of the con-tours and the truncated distribution of the red beds suggest possible faulting.

Structural Setting of Southeastern Virginia 15
Virginia
Beach
Chesapeake
Hampton
PoquosonNewport
News
James City County
Suffolk
Surry
County
York
County
Northampton
County
Norfolk
76o30' 76o
37o
36o30'0 2 4 6 8 10 MILES
0 2 4 6 8 10 KILOMETERS
ATLANTIC
OCEAN
James River
VIRGINIA
64
CHESAPEAKE
BAY
OUTER RIM OF CRATER
INNERRIM
OF CRATER
Lake
Drummond
DismalSwampCanal
Isle of Wight
County
Southampton
County
-242
-269
-620
-738
-555
-464
-430
-351
-441
-495
-408
-382
-379
-367
-344-316
-340
-282
-269
-260
-253
-215
-260
-231
-241
-180
-190
-208-230
-218
-175
-216
-245
-225
-218
-215
-152
-398
-302
-400
-350
-300
-200
-250
-650
-600
-700
-750
-500
-550
-450
NORTH CAROLINA
Hog Island
-300
EXPLANATION
STRUCTURE CONTOUR—Contour interval 50 feet. Datum is sea level
BOREHOLE—Number is altitude of top of unit, in feet below sea level
CONTINUOUS COREHOLE—Number is altitude of top of unit, in feet below sea level
CHESAPEAKE BAY IMPACT CRATER RIM
MARKS TRUNCATION BY CBIC (EQUIVALENT TO APPROXIMATE LIMIT OF PRESERVED EXMORE TSUNAMI-BRECCIA)
STUDY AREA
-441
-269
-300
Burwell
Bay
Figure 6. Structure contour map of the top of the pre-impact Lower Tertiary deposits (equals top of NanjemoyFormation except for northwest corner where equals top of the Piney Point Formation).
16 The Effects of the Chesapeake Bay Impact Crater on the Geologic Framework and the Correlation of Hydrogeologic Units of Southeastern Virginia, South of the James River
Virginia
Beach
Chesapeake
Hampton
PoquosonNewport
News
James City County
Suffolk
Surry
County
York
County
Northampton
County
Norfolk
76o30' 76o
37o
36o30'0 2 4 6 8 10 MILES
0 2 4 6 8 10 KILOMETERS
ATLANTIC
OCEAN
James River
VIRGINIA
CHESAPEAKE
BAY
OUTER RIM OF CRATER
INNERRIM
OF CRATER
Lake
Drummond
DismalSwampCanal
250
EXPLANATIONLINE OF EQUAL THICKNESS OF UNIT—Interval 50 feet. Queried where inferred
BOREHOLE—Number is thickness of unit, in feet (>, greater than)
CONTINUOUS COREHOLE—Number is thickness of unit, in feet
CHESAPEAKE BAY IMPACT CRATER RIM
APPROXIMATE LIMIT OF UPPER CRETACEOUS DEPOSITS
STUDY AREA
APPROXIMATE SOUTHERN LIMIT OF PRESERVEDEXMORE TSUNAMI-BRECCIA
Isle of Wight
County
Southampton
County
297
252
NORTH CAROLINA
Hog Island
135
117
76
100
143
153
163
95
>80
146
127
97
120
142
118
1555255
81
105
>130
>39
>61>41
56
112
112
33
60
84
0
00
0
158
172
112120
252
297
>184>304
119
155
164 348
251
449
0
0
0
0
0
0
7076
400 450350300
250
200150
100
50
100
50
100 150
100
50
?
Burwell
Bay
?
?
Figure 7. Isopach map of the Upper Cretaceous deposits younger than pollen zone III showing abrupt truncation along the northern part of the study area, irregular thickening and thinning in the northwestern part, and a southeast-thickening wedge. The 449-feet thickness in the Chesapeake Northwest River WTP borehole (3) includes 107 feet of Cretaceous and/or Palocene (?) deposits.
Structural Setting of Southeastern Virginia 17
36o30'
Virginia
Beach
Chesapeake
Hampton
PoquosonNewport
News
James City County
Suffolk
Surry
County
York
County
Northampton
County
Norfolk
76o30' 76o
37o
ATLANTIC
OCEAN
James River
VIRGINIA
CHESAPEAKE
BAY
OUTER RIM OF CRATER
INNERRIM
OF CRATER
Lake
Drummond
DismalSwampCanal
100
50
EXPLANATIONLINE OF EQUAL THICKNESS OF UNIT—Interval 25 feet
BOREHOLE—Number is thickness of unit, in feet
CONTINUOUS COREHOLE—Number is thickness of unit, in feet
CHESAPEAKE BAY IMPACT CRATER RIM
MARKS TRUNCATION BY CBIC
STUDY AREA
50
39
0 2 4 6 8 10 MILES
0 2 4 6 8 10 KILOMETERS
67
77
53
63
100
8739
50
38
63
64
6077
79
71
73
67
64 47
40
36
57
77
6247 35
44
53
31 68
53
57
82
45
70
115
137
106
65
67
75
50
75
50
100
125
50
100Isle of Wight
County
Southampton
County
Hog Island
NORTH CAROLINA
Burwell
Bay
Figure 8. Isopach map of the pre-impact Lower Tertiary deposits showing a pattern of thickening and thinning. This pat-tern is apparently related to the effects of the Chesapeake Bay impact crater on the James River structural zone.
18 The Effects of the Chesapeake Bay Impact Crater on the Geologic Framework and the Correlation of Hydrogeologic Units of Southeastern Virginia, South of the James River
-300
SEALEVEL
100FEET
-600
-900
-1,200
-1,500
-1,800
-2,100
SOUTH NORTHB B'
0 1 2 3 5 MILES4
0 1 2 3 5 KILOMETERS4
(A)
2
PRE-IMPACT TERTIARY DEPOSITS
Dismal Swampcorehole
21 24 25
Newport NewsCity Hall Complex
borehole
49
Chesapeake-Portsmouth Airport corehole
VPI geothermal testhole
NAN-P-13
mouth of
Nansemond
River
James River
?
??
?
?
LOWER CRETACEOUS DEPOSITS
UPPER CRETACEOUS DEPOSITSYOUNGER THAN POLLEN ZONE III IMPACT DEBRIS
POST-IMPACT DEPOSITS
CRYSTALLINEBASEMENT ROCKS
JURASSIC-TRIASSIC (?)
RIFT BASIN ROCKS granite
indurated red beds JURASSIC-TRIASSIC (?)
OR LOWER CRETACEOUS (?)
POST-IMPACT DEPOSITS
UPPER CRETACEOUS DEPOSITS (POLLEN ZONE III)
PotomacFormation
? ?
VERTICAL SCALE GREATLY EXAGGERATED
Figure 9. Stratigraphic cross section B-B ' , Dismal Swamp to Newport News, showing the entire thickness of the Virginia Coastal Plain deposits and the top of the basement rocks (A), and details of the upper section of Coastal Plain deposits (B). Cross section location shown in figure 3.

Structural Setting of Southeastern Virginia 19
EXPLANATION
Qt Quaternary deposits
Ty Yorktown Formation (upper and lower Pliocene)
Tcm Calvert Formation (middle Miocene)
Tlmo Newport News unit of Calvert Formation (lower Miocene), Old Church Formation (upper Oligocene), and Delmarva beds (lower Oligocene), undivided
Tn Nanjemoy Formation (lower Eocene)
Tm Marlboro Clay (Eocene and Paleocene?)
Ta Aquia Formation (upper Paleocene)
SEALEVEL
100
-100
-200
-300
-400
-500
-600
-700
0 1 432 5 MILES
0 1 432 5 KILOMETERS
St. Marys Formation
Eastover Formation
(B)
Yorktown FormationTy
Qt
Ta
Tm
upper Cenomanian beds
Tcm
Tlmo
TnTa
Tcm
Potomac Formation
Tlmo
Cretaceous red beds
Cretaceous
glauconitic sands
Exmore
tsunami-breccia
Chickahominy
Formation
Tm
Qt
Qt
BNORTH
B'SOUTH
FEET
James River
mouth of
Nansemond
River
492521 24
Chesapeake-PortsmouthAirport
corehole
VPIgeothermal
testhole
Dismal Swampcorehole
2 NAN-P-13
Newport NewsCity Hall Complexborehole
James Riverpaleochannel
VERTICAL SCALE GREATLY EXAGGERATED
Figure 9. Stratigraphic cross section B-B ' , Dismal Swamp to Newport News, showing the entire thickness of the Virginia Coastal Plain deposits and the top of the basement rocks (A), and details of the upper section of Coastal Plain deposits (B). Cross section location shown in figure 3—Continued.

20 The Effects of the Chesapeake Bay Impact Crater on the Geologic Framework and the Correlation of Hydrogeologic Units of Southeastern Virginia, South of the James River
-2,700
-2,400
-2,100
-3,000
-1,800
-1,500
-1,200
-900
SEALEVEL
-600
-300
300
0 1 432 5 MILES
0 1 432 5 KILOMETERS
EX
MO
RE
TS
UN
AM
I-B
RE
CC
IA
LOWER CRETACEOUS DEPOSITS
CB
ICM
EG
AB
LOC
KB
ED
S
UPPER CRETACEOUS DEPOSITSYOUNGER THAN POLLEN ZONE III
PRE-IMPACT TERTIARY DEPOSITS
POST-IMPACT DEPOSITS
CRYSTALLINE BASEMENT ROCKS
UPPER CRETACEOUS DEPOSITS POLLEN ZONE III
PotomacFormation
NOR-T-12
VPIWilloughby Spit
FortMonroe
5032Fentress corehole 5312
ChesapeakeNorthwest River WTP3
James River
FEETSOUTH NORTH
C'C
(A)
??
VERTICAL SCALE GREATLY EXAGGERATED
Figure 10. Stratigraphic cross section C-C ' , Chesapeake Northwest River WTP to Fort Monroe, showing the entire thickness of the Coastal Plain deposits and the top of the basement rocks (A), and details of the upper section of Coastal Plain deposits (B). Cross section location shown infigure 3.
Structural Setting of Southeastern Virginia 21
Yorktown Formation
Eastover Formation
St. Marys Formation
Exmore tsunam
i-breccia
Chickahominy
Formation
Tcm
Upper Cretaceous red beds
Upper Cretaceous
glauconitic sands
upper Cenomanian beds
Potomac Form
ation
Qt
Ta
Ta
Tlmo
Tm
Tcm
Tcr
Upper Cretaceous
and (or) Paleocene (?)
Quaternary deposits
100
SEALEVEL
-100
-200
-300
-400
-500
-600
-700
-800
-900
Tlmo
Tn
-1,000
-1,100
0 1 432 5 MILES
0 1 432 5 KILOMETERS
SOUTH
3
ChesapeakeNorthwest River WTP
12 32Fentress corehole NOR-T-12
VPIWilloughby Spit
FortMonroe
NORTH
50 53
C'C
FEET
James
River
(B)
VERTICAL SCALE GREATLY EXAGGERATED
EXPLANATION
Qt Quaternary deposits
Tcr Chowan River Formation (upper Pliocene)
Tcm Calvert Formation (middle Miocene)
Tlmo Newport News unit of Calvert Formation (lower Miocene), Old Church Formation (upper Oligocene), and Delmarva beds (lower Oligocene), undivided
Tn Nanjemoy Formation (lower Eocene)
Tm Marlboro Clay (Eocene and Paleocene?)
Ta Aquia Formation (upper Paleocene)
Figure 10. Stratigraphic cross section C-C ' , Chesapeake Northwest River WTP to Fort Monroe, showing the entire thickness of the Coastal Plain deposits and the top of the basement rocks (A), and details of the upper section of Coastal Plain deposits (B). Cross section location shown in figure 3—Continued.

upper part of this line of section and shows the angularunconformity between the Upper Cretaceous depositsyounger than pollen zone III and pre-impact Tertiarydeposits and some possible upwarping of pre-impactdeposits that are close to the outer rim of the impact cra-ter. Figure 10 is similar to figure 9, except that the line ofsection shown is farther to the east and the northwesternend steps into the crater across the outer rim escarpment.
As suggested by Powars and Bruce (1999) and showngraphically in figure 4, only Lower Cretaceous depositsare present in the subsurface of the Virginia Coastal Plainnorth of the James River. In contrast, both Lower Creta-ceous and Upper Cretaceous deposits are present on thesouth side of the James River. The available pollen dataindicate that a very thick section of Lower Cretaceousdeposits assigned to pollen zone I is present in the subsur-face north of the James River, west of the impact crater,and south of the northern part of Hanover County to themouth of the Rappahannock River. In contrast, on thesouth side of the river, both Lower Cretaceous deposits(pollen zones I and II) and Upper Cretaceous deposits(pollen zones III, IV and V) are present in the subsurface.The Upper Cretaceous deposits younger than pollen zoneIII are absent in the Hog Island area and locally in theBurwell Bay area (figs. 4 and 5). These deposits do notappear to thin or feather out, but end abruptly, supportingthe existence of a pre-impact James River structural zone.These Upper Cretaceous deposits are truncated to thenorth of the James River and west of the preserved limitof impact debris by an apparent structural upwarpingprior to the impact; farther east, they are truncated by theimpact crater across the lower Chesapeake Bay region( f i g s . 4 a n d 5 ) .
The extreme variations in thickness in the various Cre-taceous units across the James River, combined with theangular unconformity with the overlying pre-impactlower Tertiary deposits and coincidence with a highlyprobable basement structural zone, provide evidence forthe existence of a pre-impact James River structural zone.
In figure 11, an alternative interpretation to that shownin figure 9, faults are shown cutting across the basementand Coastal Plain sediments. The interpretationsdepicted in both figures 9 and 11 indicate that this regionhas experienced a combination of structural eventsinvolving pre-impact movements of the James Riverstructural zone, syn-impact faulting and fracturing of theregion, and post-impact adjustments to the recoveryphase of the CBIC.
Given that sediment deposition and preservation aregreater on the down-dropped side of a structural zone, it
would appear that the region north of the James River wasrelatively depressed in pollen zone I time and relativelyelevated for the remainder of Cretaceous time. By con-trast, the region south of the James River was relativelydepressed during pollen zones II, III, IV, and V time. Partof this distribution has been attributed to a southwardshift in the depositional basin during Late Cretaceoustime along with a reduction in the rate of subsidenceacross the region (Johnson, 1976).
During Late Cretaceous and Early Tertiary time,oscillations of sea level up to 400 ft produced majortransgressions and regressions across the study area.North and south of the James River, the Paleocene to mid-dle Eocene pre-impact deposits vary in their distributionand thickness. The middle Eocene Piney Point Forma-tion is found outside the disruption boundary, primarilynorth of the James River, where it is underlain by sectionsof the upper Paleocene Aquia and lower Eocene Nan-jemoy Formations that are thicker here than south of theJames River. The limited extent of Piney Point stratasouth of the James River is probably caused by a combi-nation of syn-impact erosional processes and post-impactuplift and removal by post-impact transgressions (Powarsand Bruce, 1999). The distribution of the basementrocks and the pre-impact Cretaceous and Tertiary depos-its indicates the existence of a generally east-to-west-trending pre-impact James River structural zone beneaththe lower James River Basin and appears to correspond tothe north side of the Cape Fear-Norfolk block.
Syn-impact Structural History
The CBIC impactor sliced through the water column,penetrated the full thickness of the existing Coastal Plainsediments, slammed into the basement rock, and vapor-ized, creating a catastrophic explosion that generated aseries of gigantic tsunamis and sent tremendous amountsof steam and ejecta into the atmosphere. The debris wasspread over most of the U.S. Atlantic shelf and coastalareas (the coastline was then west of the present-day FallLine; Poag, Powars, Poppe, and Mixon, 1994, Powarsand Bruce, 1999). The high-velocity impact left animmense crater that is almost 1.2 mi deep and is partlyfilled with debris and tsunami deposits. The CoastalPlain sediments and basement rocks lining the crater cav-ity were melted, and the basement rocks in a regionbeneath and around the crater were faulted and fractured(fig. 2).
22 The Effects of the Chesapeake Bay Impact Crater on the Geologic Framework and the Correlation of Hydrogeologic Units of Southeastern Virginia, South of the James River
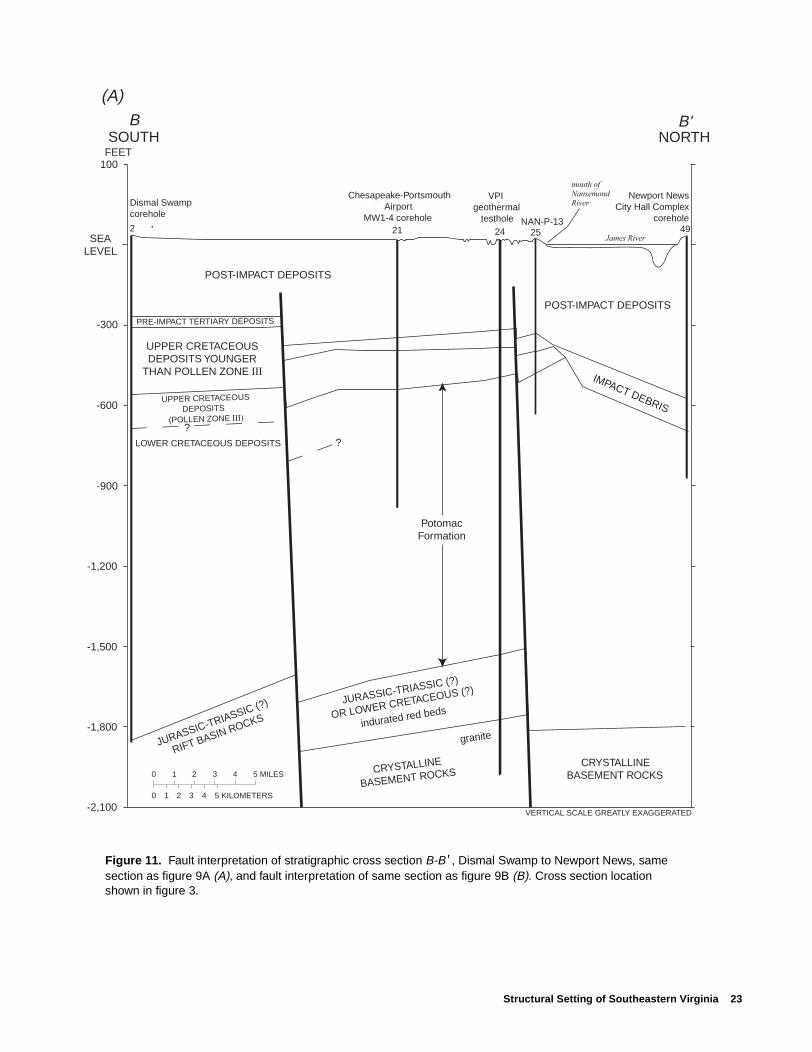
Structural Setting of Southeastern Virginia 23
-300
SEALEVEL
100FEET
-600
-900
-1,200
-1,500
-1,800
-2,100
SOUTH NORTHB B'
2
PRE-IMPACT TERTIARY DEPOSITS
(A)
Dismal Swampcorehole
21 24 25
Newport NewsCity Hall Complex
corehole49
Chesapeake-Portsmouth Airport MW1-4 corehole
VPI geothermal testhole NAN-P-13
mouth of
Nansemond
River
James River
LOWER CRETACEOUS DEPOSITS
UPPER CRETACEOUSDEPOSITS YOUNGER
THAN POLLEN ZONE III IMPACT DEBRIS
POST-IMPACT DEPOSITS
CRYSTALLINEBASEMENT ROCKS
JURASSIC-TRIASSIC (?)
RIFT BASIN ROCKS
granite
CRYSTALLINE
BASEMENT ROCKS
indurated red bedsJURASSIC-TRIASSIC (?)
OR LOWER CRETACEOUS (?)
POST-IMPACT DEPOSITS
UPPER CRETACEOUSDEPOSITS
(POLLEN ZONE III)
??
PotomacFormation
VERTICAL SCALE GREATLY EXAGGERATED
0 1 2 3 5 MILES4
0 1 2 3 5 KILOMETERS4
Figure 11. Fault interpretation of stratigraphic cross section B-B ' , Dismal Swamp to Newport News, samesection as figure 9A (A), and fault interpretation of same section as figure 9B (B). Cross section location shown in figure 3.

24 The Effects of the Chesapeake Bay Impact Crater on the Geologic Framework and the Correlation of Hydrogeologic Units of Southeastern Virginia, South of the James River
SEALEVEL
100
-100
-200
-300
-400
-500
-600
-700
Qt
TaTm
upper Cenomanian beds
Qt
Tcm
Tlmo
Tn
Tn
TmTa
Tcm
Tm
Potomac Formation
Tlmo
Cretaceous red beds
Cretaceous
glauconitic sands
Qt
Ty
Chickahominy
Formation
Exmore
tsunami-breccia
Potomac Formation
upper Cenomanian
beds
Ta
Potomac Formation
Tn
Eastover Formation
St. Marys Formation
Eastover Formation
Eastover Formation
St. Marys Formation
St. Marys Formation
Yorktown Formation
BNORTH
B'SOUTH
FEET
James River
mouth of
Nansemond
River
492521 24
Chesapeake-PortsmouthAirport corehole
VPI geothermal testhole
Dismal Swampcorehole
2 NAN-P-13
Newport NewsCity Hall Complexcorehole
(B)
VERTICAL SCALE GREATLY EXAGGERATEDEXPLANATION
Qt Quaternary deposits
Ty Yorktown Formation (upper and lower Pliocene)
Tcm Calvert Formation (middle Miocene)
Tlmo Newport News unit of Calvert Formation (lower Miocene), Old Church Formation (upper Oligocene), and Delmarva beds (lower Oligocene), undivided
Tn Nanjemoy Formation (lower Eocene)
Tm Marlboro Clay (Eocene and Paleocene?)
Ta Aquia Formation (upper Paleocene)
0 1 2 3 5 MILES4
0 1 2 3 5 KILOMETERS4
Figure 11. Fault interpretation of stratigraphic cross section B-B ' , Dismal Swamp to Newport News, same section as figure 9A (A), and fault interpretation of same section as figure 9B (B). Cross section location shown in figure 3—Continued.

s-in
ofost-ed-ostpe-ce,
heom-verisst-resaser-er (2)ousmic thesec-c-ctactal
s-esnt torn
thethelesutma-ral
ongur-
t.e-s an
The formation of the CBIC truncated and excavatedlarge quantities of Eocene to Cretaceous Coastal Plainsediments and the underlying Proterozoic, Paleozoiccrystalline, and possibly Jurassic- Triassic rift-basinbasement rocks, creating the CBIC megablock beds andthe Exmore tsunami-breccia deposits. The CBIC is acomplex peak-ring crater with an inner and outer rim, aslumped terrace zone, and a relatively flat-floored annu-lar trough that encircles a deep central depression into thebasement (fig. 2). The central depression is also referredto as the inner basin and contains a series of concentricvalleys and ridges that surround a central uplift (Powarsand Bruce, 1999).
The seismically defined syn-impact CBIC megablockbeds are a product of large-scale slumping into the craterthat occurs during an early stage of crater filling; thesedeposits covered the basement surface of the annulartrough (Poag, 1996, 1997; Powars and Bruce, 1999).
A narrow band of preserved Exmore tsunami-brecciadeposits surrounds the crater’s outer rim; these depositsalso are probably offset by the bounding outer rim faultzone and other faults apparently produced or adjusted bythe impact. The location of the preserved limit of theExmore tsunami-breccia beneath the river, however, isuncertain.
A zone of normal-faulted slump blocks characterizesthe highly irregular outer rim of the CBIC (fig. 2). Thesefeatures encircle and are downthrown into the annulartrough, forming a buried escarpment. On seismic reflec-tion data, this escarpment is easily distinguished from thenearly flat-lying Coastal Plain deposits outside the dis-ruption boundary. The relief of the escarpment rangesfrom 1,000 to nearly 4,000 ft and its width varies fromabout 0.5 to 2 mi (Poag, 1996; Powars and Bruce, 1999).Its geometry is characterized as a steep wall in places;elsewhere, the escarpment stair-steps down into the annu-lar trough. This variation is expected because the escarp-ment was produced by a combination of complexcatastrophic events, including the collapse of the crater’souter wall interacting with subsequent gigantic tsunamis.This variation also is related to the unconsolidated natureof the sediments involved. Section C-C ' shows the tre-mendous relief at the escarpment of the outer rim andhow the post-impact deposits drape over the outer rimand thicken into the crater (fig. 10).
Post-impact Structural History
Post-impact deposits from numerous marine trangressions across the lower mid-Atlantic Coastal Plahave now buried the crater with about 1,300 to 1,600 ftsediment. In the study area, south of the crater, the pimpact deposits form an eastward-dipping wedge of siments 225 to 750 ft thick. Seismic data show that mof these deposits dip concentrically into the crater, escially across the outer and inner rims (Powars and Bru1999).
The post-impact upper Tertiary deposits outside tcrater and south of the James River are thicker than cparable units north of the river. The area south of the riapparently was downwarped during this period. Thdownwarping appears to be related to structural adjuments of the James River structural zone. Two featuindicate that structural instabilities persisted in the areadjacent to the crater’s outer rim, at least through late Ttiary time: (1) the stratigraphic anomalies found in uppTertiary deposits outside the disruption boundary, andfaults that displace basement rocks and Cretacethrough upper Tertiary sediments observed in the seisdata north of the crater where the faults extend outsidedisruption boundary (Powars and Bruce, 1999). Thestructural instabilities likely are produced by several fators: (1) faulting caused by the initial impact and strutural adjustments to older faults; (2) post-impastructural readjustment of the basement; (3) post-impdifferential compaction; and (4) post-impact differentimovement of fault blocks.
The Oligocene to middle Miocene post-impact depoits exhibit a patchy distribution pattern south of the JamRiver. These deposits appear to be preserved adjacethe outer rim and inside the crater along the northeboundary of the study area, as well as downdip alongAtlantic coastline. The thinness and local absence of Oligocene and lower Miocene strata in the borehomake it very difficult to correlate these deposits withodata from a corehole. The absence of the Calvert Fortion south of the river suggests that large-scale structureadjustments to the impact, such as movement alfaults in the James River structural zone, were still occring in the middle Miocene.
The very clayey, upper Miocene, post-impact SMarys Formation was the first unit distributed and prserved across the entire region and therefore serves aeasily recognized marker unit.
Structural Setting of Southeastern Virginia 25

id- thenticuntsa-
-ch
are
rendbyys-ticenes-re
heaxes-e
teor
theght
ofen-tedaletherus
lso
The juxtaposition of the pre-impact deposits with thesyn-impact deposits marks the disruption boundary and,except for the narrow, relatively thin band of ejecta, coin-cides with the outer rim of the crater. Relatively thinpost-impact deposits outside the crater abruptly thickenacross the outer rim of the crater and are up to ten timesthicker inside the crater. The absence of many early post-impact deposits (upper Eocene to middle Miocene) southof the James River and the presence of relatively thickupper Miocene and Pliocene shallow-marine depositssuggest that the impact crater is responsible for structuraladjustments to the pre-impact James River structuralzone. The distribution of strata suggests that these struc-tural adjustments have caused the area south of the riverto be uplifted or downwarped at various times. In thistransgressive-regressive depositional setting, the upliftcauses erosion of strata or little deposition whereas thedownwarp allows deposition and preservation if sedi-ment is available.
Borehole data indicate that most of these post-impactdeposits are overall coarser grained (including Mioceneand Pliocene marine bioclastic sands) along the outer rimand become finer grained toward the interior of the craterand farther outside and away from the outer rim (Powarsand Bruce, 1999).
Pliocene to Quaternary deposits show complex litho-facies distribution and thickness patterns that include thinto thick and fine to coarse beds within 12.5 miles of thecrater’s outer rim (Johnson, Powars, and others, 1998;Powars and others, 1998). Pliocene deposits, which dipradially away from the center of the impact structure overareas several miles in width, exhibit dips that are discor-dant from the typical eastward regional dip of Tertiarystrata. These dip reversals are generally less than onedegree and commonly include fan-like inter- and intrafor-mational angular unconformities, indicating that defor-mation and deposition were synchronous and a productof post-impact deformation related to slump-blockmotion near the outer rim of the crater (Johnson, Kruse,and others, 1998; Johnson, Powars, and others, 1998;Powars and others, 1998; Powars and Bruce, 1999).
The CBIC has also had a major effect on thedevelopment of the regional drainage to the sea of themid-Atlantic rivers (from the Susquehanna River to theJames River) that converge on the crater. The location ofthe outer rim of the crater and its relation to the course ofthe lower James River is apparent, as the river turnssharply northeastward as it crosses the outer rim and intothe crater.
The Holocene transgression, along with higher subsence rates over the crater, has produced generallyhighest measured rates of subsidence in the mid-Atlaregion (Nerem and others, 1998), which possibly accofor the abundant swamps that border the lower Chepeake Bay.
GEOLOGIC FRAMEWORK OF SOUTHEASTERN VIRGINIA, SOUTH OF THE JAMES RIVER
The following sections describe the lithology, distribution, and borehole geophysical signatures for eaCoastal Plain stratigraphic unit. The basement rocksalso discussed briefly.
Basement Rocks
Within the study area, Coastal Plain deposits aunderlain by igneous and metamorphic Paleozoic aUpper Proterozoic crystalline basement rocks and Jurassic-Triassic rift basin sedimentary rocks. The crtalline basement rocks beneath much of the mid-AtlanCoastal Plain, including the study area, have bemapped by Horton and others (1991) as part of the Chapeake Block (a tectonostratigraphic unit) and wedefined as rocks of undetermined affinity east of tAlleghanian “Chesapeake Bay suture” of Lefort and M(1991). Lefort and Max (1991) suggested that the Chapeake Block includes African rocks left behind in thMesozoic breakup of Africa and North America. LaPaleozoic granitic plutons are included in this block (fdetails, see Horton and others, 1991).
Four boreholes penetrated basement rocks within study area. Two geothermal test holes, #26 Isle of Wi(38) (top of granite at –1308 ft) and #25 Suffolk (24) (topof granite at –1772 ft), encountered 210 to 250 ft mostly indurated sediments overlying granite and grestone basement rocks. The cuttings from these indurasediments consist of a mixture of reddish siltstone, shand feldspathic and quartz sand and represent eiJurassic-Triassic rift basin deposits or Lower Cretaceodeposits. Jurassic-Triassic rift basin rocks were aencountered in the Dismal Swamp corehole (2) (top ofrock at –1817 ft) and at the VDEQ borehole (1) (top ofrock at –1822 ft).
26 The Effects of the Chesapeake Bay Impact Crater on the Geologic Framework and the Correlation of Hydrogeologic Units of Southeastern Virginia, South of the James River
le
ernte.ft)
ofy,, at
rundl-
uiv-the
atndassitsfouth
ersa-ernn-ngd
ossra-itse ofrsh oft-hen.
nitbylly
sitsiandnicia
Structure contours of the top of the basement surfaceshow an overall eastward dip and stepping beneath Vir-ginia Beach (Brown and others, 1972; Meng and Harsh,1988; Powars and others, 1992). A basement high (anarch or ridge) trends east to west from Norfolk to thenortheastern corner of Southampton County and appearsto be coincident with the north end of the two Jurassic-Triassic rift basins within the study area (figs. 1 and 4).The #26 Isle of Wight (38) and #25 Suffolk (24) bore-holes provide the main evidence for this arching. Thearching is reflected even if the indurated sediments areinterpreted as Lower Cretaceous. It is likely that thebasement high is a product of faulting, possibly a part ofJurassic-Triassic rift basin faulting, which is connected toPaleozoic fault systems.
Two boreholes north of the study area on the lowerYork-James Peninsula, just inside the outer rim of theimpact crater, penetrated a few feet of white granite.These are the NASA-Langley Air Force Base borehole(top of rock at –2084 ft; for location and details seePowars and Bruce, 1999), and the Fort Monroe borehole(53) (top of rock at –2251 ft).
Cretaceous Deposits
Within the study area, the Cretaceous sediments con-sist of Lower and Upper Cretaceous deposits that range inage from about 120 to 85 Ma. An interval in the Chesa-peake Northwest River WTP borehole (3), however, pos-sibly represents some younger Upper Cretaceoussediments (85 to 65 Ma). Updip (westward), the LowerCretaceous deposits (Potomac Formation) consist of acomplex array of fluvial-deltaic deposits that intertonguedowndip (eastward) with thin glauconitic sands typical ofshallow-shelf deposits. The Lower Cretaceous depositsextend across the study area, except where disturbed bythe impact, forming an east- to-southeast-dipping wedgethat ranges from around 725 ft thick over an apparentbasement high on the western side of the study area toaround 2,400 ft thick along the coastline at VirginiaBeach. If the indurated sediments are interpreted asLower Cretaceous deposits, then the deposits are 935 ftthick on the western side of the study area.
Regionally, the Cretaceous section includes UpperCretaceous deposits that are relatively thick south andsouthwest of the crater. The Upper Cretaceous depositsform a wedge that thickens from 377 ft in the DismalSwamp corehole to 628 ft in the Fentress corehole. TheUpper Cretaceous deposits younger than pollen zone III
thicken from 252 ft thick in the Dismal Swamp coreho(2) (pl. 1) to 350 ft thick in the Fentress corehole (12)(pl. 1) to 449 ft thick in the Chesapeake Northwest RivWTP borehole (3) (pl. 1). These deposits are absenorth of the pre-impact James River structural zonLower Cretaceous core samples (at -455 ft and -648from the Newport News Park 1 borehole (62) docu-mented that pollen zone I is present nearly to the topthe Cretaceous section (L.A. Sirkin, Adelphi Universitwritten commun. to A. Meng, formerly with the USGS1983). This implies that the entire Cretaceous sectionthe Newport News Park 1 borehole (62) is represented bya 1300-ft-thick interval of pollen zone I; however, LoweCretaceous deposits that are older than zone I were foin the downdip Taylor #1 oil testhole, located on the Demarva Peninsula (Robbins and others, 1975), and eqalent deposits may be present in the lower part of Newport News Park 1 borehole (62). Brenner (1963)reported that an outcrop of the Potomac FormationDrewrys Bluff on the James River southeast of Richmocontained pollen indicative of zone I. The author hfound no documentation of Upper Cretaceous depocontaining pollen zones III, IV, or V in Virginia west othe Chesapeake Bay, north of the James River, and sof the Potomac River. The apparent absence of LowCretaceous pollen zone II deposits west of the Chepeake Bay, north of the James, and south of the northpart of Hanover County to the mouth of the Rappahanock River (fig. 4), suggests the need to re-evaluate Meand Harsh’s (1988) hydrogeologic subdivision anregional correlation of Lower Cretaceous deposits acrthe entire Coastal Plain, outside the outer rim of the cter. Correlation of the geologic to hydrogeologic unoutside the study area, however, is beyond the scopthis report. The reader is referred to Meng and Ha(1988) for a detailed and comprehensive discussionlog correlations and identification of depositional paterns and settings that guided the delineation of tregional hydrogeologic units of the Potomac Formatio
Powars and Bruce (1999) concluded that the umapped in the southeastern Virginia Coastal Plain Cederstrom (1945b) as the Mattaponi Formation actuarepresents Lower Cretaceous to lower Miocene depooutside the preserved limit of Exmore tsunami-breccdeposits. Furthermore, inside this preserved limit ainside the outer rim of the crater, the MattapoFormation is equivalent to the Exmore tsunami-brecdeposits.
Geologic Framework of Southeastern Virginia, South of the James River 27
i-),dols
ter-ant
aser-ereheIC anerengu-nd
ay,l-el-
ndre
ti-c, then.to-otta
hee-luestheofm- isa-
dn,sitsdveasalrge-k)w- of
Potomac Formation - Lower and Upper Cretaceous Deposits
Within the study area, the Potomac Formation consistsof fluvial-deltaic deposits of Early Cretaceous (Barre-mian (?) to Albian) and Late Cretaceous (early Cenoma-nian) age. These deposits extend across the study area,forming an eastward-thickening wedge that ranges fromabout 1,000 ft thick beneath the Hog Island to BaconsCastle area to about 1,700 ft thick at Fentress to 2,400 ftat Virginia Beach. The Potomac Formation variouslyoverlies metamorphic and igneous rocks of the crystal-line basement and red siltstones, shales, and sandstonesof Jurassic-Triassic rift basins.
These deltaic deposits are highly variable in theirlithology and thickness and probably represent stackeddeposits of meandering streams, braided streams, andriver- and wave-dominated delta-plain and delta-frontfacies (Glaser, 1969; Reinhardt and others, 1980; Owensand Gohn, 1985; Meng and Harsh, 1988). These depositsare difficult to correlate and subdivide because of theirlateral and vertical heterogeneity, lithic similarities, andthe paucity of biostratigraphic data; pollen is the onlybiostratigraphic indicator that is found consistently inthese deposits. Recent development and refinement of apollen zonation for these deposits (Brenner, 1963; Rob-bins and others, 1975) has provided a basis for subdivid-ing the sequences into units of temporal and possiblygenetic significance (Reinhardt and others, 1980; Mengand Harsh, 1988; Powars and others, 1992). Some inves-tigators (Glaser, 1969; Hansen, 1969; Brown and others,1972) suggest that a correlation exists among the litho-logic and depositional patterns, the five major pollenzones (labeled I, II, III, IV, V), and their corresponding“formations” (table 1). Meng and Harsh (1988) basedtheir hydrogeologic subdivision of the Potomac Forma-tion primarily on geophysical log interpretations of litho-logic characteristics, mode of deposition, availablepalynostratigraphic zonation data, and hydrologic data.
The fining-upward fluvial-deltaic deposits consist pri-marily of light-gray to pinkish to greenish-gray to green,in part mottled red, brown, and yellow, poorly sorted, fineto coarse, quartzose and feldspathic sand and gravel,which grade up into silt and clay. The sands vary frombeing thick-bedded and trough crossbedded to interbed-ded with thin- to thick-bedded clay-silts to thick-beddedclays. Locally, the sands also contain clay-clast con-glomerates and lignitic material (finely disseminated towood chunks to logs). The finer grained beds range fromgray to dark-gray, finely laminated, carbonaceous clays
interbedded with thin, sandy clay beds to highly oxdized, multicolored (reds, browns, purples, and yellowlaminated to thick-bedded clays. The highly oxidizeclays include intervals that represent stacked paleostypical of channel-overbank deposits that have characistic pedotubules (cracks and fractures) and abundiron-rich glaebules (nodules and concretions).
Within the crater, all deposits traditionally mapped Lower Cretaceous (Potomac Formation) are now intpreted as sediments disturbed by the impact and winformally named by Powars and Bruce (1999) as t“Chesapeake Bay impact crater megablock beds” (CBmegablock beds). These deposits are consideredEocene stratigraphic unit because the slump blocks wtransported and rapidly emplaced by impact crateriprocesses that most likely mixed them with Exmore tsnami-breccia and possible basement fragments amelted rocks from the initial blast.
South of the James River and the Chesapeake Brelatively thick Upper Cretaceous marine and fluviadeltaic deposits overlie fluvial-deltaic deposits of thPotomac Formation. The Upper Cretaceous fluviadeltaic facies exhibit a sporadic, patchy distribution aintertongue with the marine facies, which have a moconsistent distribution.
The resistivity and gamma logs reflect the litho-stragraphic differences of the thin-bedded, glauconitishelly, marine Upper Cretaceous deposits that overliethicker bedded, fluvial-deltaic Potomac FormatioWhere Upper Cretaceous deltaic deposits overlie Pomac fluvial-deltaic sediments, however, the logs do nreflect these differences; therefore, lithic log and dafrom nearby wells must be analyzed. Generally, tmarine lower Tertiary (Aquia Formation) and Upper Crtaceous deposits have consistently higher gamma va(deflection to the right) and are thinner bedded than Potomac fluvial-deltaic deposits. The fact that both these units underlie the consistently clayey Chickahoiny and Nanjemoy-Marlboro units throughout the areaalso helpful. Overall, the deposits of the Potomac Formtion have a blockier, thicker stratified resistivity angamma log signature. Within this overall blocky patterthe resistivity and gamma logs of the Potomac depoalso show numerous gradational fining-upwarsequences (about 5- to 100-ft-thick) that typically hasharp contacts between the tops of the clays and the bsands of the overlying sequence. These logs reflect lascale, fining-upward cycles (about 100- to 200-ft-thicthat are typical for the Potomac deposits. The satoothed appearance of the resistivity and gamma logs
28 The Effects of the Chesapeake Bay Impact Crater on the Geologic Framework and the Correlation of Hydrogeologic Units of Southeastern Virginia, South of the James River

os-ckna,erd in
ssneta-
rd-
ofod-ndestanortseper
of.,9).exr-
he
m-of88).
g-st ahed byan,ieson-es
Atre-
on-e,
the Potomac deposits reflects their highly stratified, com-monly relatively thin-bedded nature. The quartzo-felds-pathic sands and tough, multicolored clays of thePotomac deposits contrast lithologically with the glauco-nitic, shelly Aquia Formation and Exmore tsunami-brec-cia deposits.
Because of the paucity of borehole and geophysicallog data from inside the crater and because of the lithicsimilarities between undisturbed Potomac deposits andthe CBIC megablock beds, these units were differentiatedprimarily on the basis of seismic reflection data byPowars and Bruce (1999). A subtle dampening of theresistivity and gamma-log signatures for the depositsinterpreted as CBIC megablock beds distinguish themfrom undisturbed Potomac deposits.
Upper Cretaceous Deposits Younger Than Pollen Zone III
Upper Cretaceous deposits (upper Cenomanian toSantonian) south of the James River younger than pollenzone III are present in the subsurface south and southwestof the outer rim of the crater (Powars and others, 1992;Powars and Bruce, 1999). As shown in figure 4A, thesedeposits extend eastward from central SouthamptonCounty and eastern Surry County to Virginia Beach; theyform a wedge that thickens from 200 to 500 ft across thesoutheastern half of the study area but are thinner, from30 to 150 ft, have a irregular distribution across the north-western half, and are abruptly truncated on the northern-most part of the study area.
Powars and others (1992) subdivided the Upper Creta-ceous deposits into three lithic units on the basis of datafrom the Dismal Swamp (2), Fentress (12), and Chesa-peake-Portsmouth Airport (21) coreholes. In ascendingorder, they are (1) upper Cenomanian beds consisting ofmarine and deltaic deposits, (2) a glauconitic sand unit,and (3) oxidized red-bed fluvial-deltaic deposits thatinclude multiple paleosols. Evidence for the presence ofUpper Cretaceous pollen zone III was only recentlyobtained from the Fentress corehole (12) (N. Frederiksen,USGS, written commun., 1999) and was therefore notincluded in Powars and others’ (1992) subdivision.Lithic and geophysical log data obtained from the Ches-apeake Northwest River WTP borehole (3) (pl. 1) indi-cate the presence of 107 ft of Upper Cretaceous and(or)lower Paleocene deltaic sands and clays overlying thered-bed unit. These deposits are interpreted to be over-lain by the upper Paleocene Aquia Formation and under-lain by the red bed unit, which is Coniacian-Santonian in
age (pollen zone V) in the Fentress corehole (12) (N. Fre-deriksen, USGS, written commun., 1999). These depits may be partially or completely equivalent to the BlaCreek Formation or Peedee Formation of North Caroliand they also may be partially equivalent to the lowPaleocene Brightseat Formation that was documentethe Dismal Swamp corehole (2) (Powars and others,1992). Throughout the study area, relatively thin (lethan 75 ft thick) pre-impact Paleocene and lower Eocemarine strata locally overlie these various Upper Creceous deposits south of the James River.
Upper Cenomanian Beds (Pollen Zone IV)
The upper Cenomanian beds form a southeastwadipping wedge that ranges from 33 ft (54) to 212 ft (3) inthickness. An isopach map of this unit shows zonesthinning and thickening that are interpreted to be a pruct of pre-impact faulting (fig. 12). These beds are fouthroughout the study area where they form the oldlithic unit of the Upper Cretaceous units younger thpollen zone III. In the Chesapeake-Portsmouth Airpcorehole (21), only the upper Cenomanian part of theyounger Upper Cretaceous units is preserved. The upCenomanian beds in the Dismal Swamp (2) and Fentress(12) coreholes contain a pollen assemblage indicativepollen zone IV (R.J. Litwin, USGS, written commun1988; N. Frederiksen, USGS, written commun., 199The upper Cenomanian deposits also contain indmacro- and microfossils that allow local and regional corelation of this unit. For example, the presence of tmollusks Inoceramus arvanus and Exogyra woolmaniindicates a late Cenomanian age (N.F. Sohl, oral comun., 1988) and suggests correlation with unit E Brown and others (1972) and sequence 2 of Gohn (19
In the Fentress corehole (12) (pl. 1), the basal 50 ft ofthe upper Cenomanian beds consists of two fininupward sequences. Abundant wood fragments suggenearshore-shelf to deltaic depositional environment. Tbase of the upper Cenomanian deposits here is markea sharp lithic contact at -1,035 ft elevation where olive-gray to light-gray, micaceous, lignitic, loosemedium to very coarse, glauconitic quartz sand overlthe Potomac Formation. The Potomac Formation csists of greenish-gray, silty and sandy clay that graddownward into medium to coarse, crossbedded sand.Fentress (12) these nearshore and deltaic deposits aoverlain by 115 ft of laminated to thick-bedded, olivegray to dark-gray silt, clay, and fine to coarse sand ctaining variable amounts of glauconite, mica, pyrit
Geologic Framework of Southeastern Virginia, South of the James River 29

30 The Effects of the Chesapeake Bay Impact Crater on the Geologic Framework and the Correlation of Hydrogeologic Units of Southeastern Virginia, South of the James River
Virginia
Beach
Chesapeake
Hampton
PoquosonNewport
News
James City County
Suffolk
Isle of Wight
County
Surry
County
York
County
Northampton
County
Norfolk
76o30' 76o
37o
36o30'
James River
VIRGINIA
CHESAPEAKE
BAY
OUTER RIM OF CRATER
INNERRIM
OF CRATER
Lake
Drummond
DismalSwampCanal
0 2 4 6 8 10 MILES
0 2 4 6 8 10 KILOMETERS
50
NORTH CAROLINA
ATLANTIC
OCEAN
EXPLANATIONLINE OF EQUAL THICKNESS OF UNIT–Dashed whereapproximately located. Interval 50 feet. Queried whereinferred
BOREHOLE—Number is thickness of unit, in feet
CONTINUOUS COREHOLE—Number is thickness of unit, in feet
CHESAPEAKE BAY IMPACT CRATER RIM
APPROXIMATE LIMIT OF UPPER CENOMANIAN BEDS
STUDY AREA
151
142
102
164
199
212
161
51
70
76
155119
89
153
135
117
163
95
>80
143
100
76
52
81
118
155
118
158
172
112
120
97
112
33
56
105
127
113
84
151
142
150100
200
?
150
100150
150
100
50
100
100
50
?
Burwell
Bay
Hog Island
Figure 12. Isopach map of upper Cenomian beds (pollen zone IV) showing thickening, thinning, and truncation apparently related to the pre-impact James River structural zone and the Chesapeake Bay impact crater.

shells, microfossils, wood, and burrows that indicate amarine origin. This section contains numerous fining-upward sequences. The sandier, coarser grained beds atthe bases of sequences are generally more glauconitic andshelly than the overlying sediments. Many of the sandiershell beds and shell hashes (representing storm deposits)are cemented by calcium carbonate. These indurated bedsare generally reflected on resistivity logs by thin, sharp,high-resistivity spikes.
In the Dismal Swamp (2) corehole (pl. 1), the lowestupper Cenomanian beds consist of glauconitic sands,which grade upward into shelly, glauconitic silt, clay, andsand of marine origin. The base of the upper Cenomanianis an erosional unconformity; dark-gray to black, clayey,glauconitic, phosphatic, pyritic, carbonaceous, pebblyquartz sand overlies and is burrowed down into the Poto-mac Formation, consisting of white to light-gray clayshowing some yellow mottling. Within a few feet, theseLower Cretaceous beds grade downward into multicol-ored sands and clays, which are oxidized red, purple,brown, and yellow. At Dismal Swamp, 128 ft of cyclicCenomanian marine beds were penetrated. Abundantfinely disseminated lignitic material indicates nearshoredeposition. This marine unit is overlain by a section ofdark gray, very fine grained, thinly laminated, very mica-ceous clayey silt to muddy sand containing abundantwood fragments that indicate a deltaic-lagoonal deposi-tional environment. This section is 21.5 ft thick in theDismal Swamp corehole (2) and 33.9 ft thick in the Fen-tress corehole (12). The very abundant mica imparts agreasy feel to the sediments and enhances recognition ofthe unit in well cuttings.
The resistivity and gamma logs generally reflectnumerous fining-upwards sequences, which are repre-sented in the cores as glauconitic shelly sands that gradeupwards into clayey silts to silty clays. Differentiation ofthese sequences from overlying similar marine Paleoceneor Eocene deposits is very difficult. By contrast, it is rel-atively easy to distinguish the Upper Cretaceous marinesequences from the underlying thicker bedded, fluvial-deltaic Potomac deposits using resistivity and gamma-logresponses. In general, the resistivity logs of the upperCenomanian beds indicate an overall thick, fine-grainedsection with numerous thin, indurated or slightly sandierlayers. The upper Cenomanian log signature contrastswell with the blocky, more distinct sand and clay logs ofthe Potomac fluvial-deltaic deposits. The gamma logsalso show consistently higher values (deflection more tothe right) for the upper Cenomanian beds as compared tothe Potomac deposits.
Glauconitic Sand Unit
The Upper Cretaceous glauconitic sand unit is loosesand that is found only across the southern part of thestudy area. The Dismal Swamp and Fentress coreholespenetrated 54.5 ft and 59 ft of this unit respectively, withalmost no recovery. The lack of clay or silt and the appar-ent well-sorted nature of the sands appear to be responsi-ble for the poor core recovery. The small amount ofrecovered core, the drill cuttings, and the geophysicallogs indicate that most of the unit is fine to very coarseglauconitic quartz, marine sand. In the Dismal Swampcorehole, the basal 0.7 ft of this unit was recovered alongwith contact with the underlying deltaic-lagoonal upperCenomanian unit. This contact is an erosional unconfor-mity where light-green to olive-gray, poorly sorted, peb-bly, muddy sand sharply overlies dark-gray, finelylaminated, very micaceous, lignitic clayey silt. The basalbed of the glauconitic sand unit contains rip-up clastsfrom the underlying micaceous silt.
Upper Cretaceous Red Beds (Pollen Zone V)
The distribution of the Upper Cretaceous red beds issimilar to that of the glauconitic sand unit and is shown infigure 5. The red beds are found throughout the southernhalf of the study area but have a patchy distribution acrossthe northern half. The red beds were not encountered inthe Chesapeake-Portsmouth Airport corehole (21). Thethickness of the red beds is 53.4 ft in the Dismal Swampcorehole, 91.3 ft in the Fentress corehole (12), and 80 ftin the Chesapeake Northwest River WTP borehole (3).The unit has a heterogeneous lithology including uniformgray and green and bright red, mottled purple, yellow,orange, and brown sequences of interbedded oxidizedclay, silty clay, silty fine sand, and pebbly coarse sand.Some beds contain scattered mica, carbonaceousmaterial, wood chunks, mud cracks, and rootlets. Severalpaleosols occur at the top of fining-upward sequences.The bases of the fining-upward sequences typicallyconsist of muddy pebbly sand that overlies the clay tosilty clay or sandy clay of an underlying paleosol. At thebase of the red beds in the Dismal Swamp corehole (2) isa gray to multicolored, interbedded, micaceous clayeysand to sandy clay, which sharply overlies the glauconiticsand unit. This lower unit consists of dark-green to gray-green, fairly well sorted, fine to coarse quartz sandcontaining small amounts of glauconite and phosphate.The extensive development of these red beds indicates afluvial to upper-delta-plain depositional environment.
Geologic Framework of Southeastern Virginia, South of the James River 31

Recent pollen analysis (N. Frederiksen, USGS, writtencommun., 1999) of samples from the red bed unit in theFentress corehole (12) indicates assignment to Conia-cian-Santonian pollen zone V, which is equivalent to theAmboy Stoneware Clay Member of the Magothy Forma-tion in New Jersey and the Black Creek or Peedee Forma-tions in North Carolina. This analysis provides, for thefirst time, a definitive age for the red-bed unit, and for thefirst time, deposits of this age have been documented inVirginia. The glauconitic sand unit is still not definitivelydated; however, it is positioned between the Coniacian-Santonian age red-bed unit above and late Cenomanianstrata below, and therefore may be Cenomanian to Santo-nian in age. This investigation found that both the glauc-onitic sand unit and red beds correlate with unit D ofBrown and others (1972) and sequence 3 of Gohn (1988).
Upper Cretaceous and/or Paleocene Beds
In the southeastern corner of the study area, the Ches-apeake Northwest River WTP borehole (3) (pl. 1)encountered a 107-ft-thick section of deltaic sands andclays that are interpreted to be underlain by the Conia-cian-Santonian age red-bed unit and overlain by theupper Paleocene Aquia Formation. These deposits canbe subdivided into three units: 51-ft-thick lower glauco-nitic sand overlain by 15-ft-thick organic-rich clay that iscapped by 41-ft-thick clayey-silty quartz sand. Theirposition between the red bed unit and the Aquia Forma-tion indicates that the deposits are either Upper Creta-ceous (pollen zone V or younger) and/or Paleocenedeposits.
Tertiary Deposits
Interpretations of Tertiary deposits are based on corre-lations between corehole and borehole data, with empha-sis placed on correlations between the Dismal Swamp(2), Chesapeake-Portsmouth Airport (21), and Fentress(12) coreholes. Powars and Bruce (1999) provided thegeologic framework adjacent to and including the north-western to central part of the present study area(figs. 1 and 2). The Jamestown (61) and Newport NewsPark 2 (63) coreholes provide lithostratigraphic interpre-tations for the northwestern part of the study area; on thenortheastern side of the study area, the Kiptopeke core-hole (64) gives stratigraphic control inside the crater.Chronostratigraphic control is based on fauna and floraanalyses of core samples. Biostratigraphic information is
included on the Dismal Swamp (2) and Fentress (12)corehole stratigraphic columns (pl. 1).
Following Powars and Bruce (1999), the Tertiarydeposits beneath southeastern Virginia are grouped intopre-impact, syn-impact, and post-impact deposits. Thepre-impact deposits consist of shallow-shelf to marginal-marine facies that are characteristically thinly stratified,partly shelly, glauconitic, clayey sands and silts. Thesedeposits include the Brightseat Formation (lower Pale-ocene), Aquia Formation (upper Paleocene), MarlboroClay (which straddles the Paleocene-Eocene boundary),Nanjemoy Formation (lower Eocene), and Piney PointFormation (middle Eocene). The syn-impact deposits arerepresented by the instantaneously deposited Exmoretsunami-breccia that has a highly variable mixture ofautochthonous sedimentary intraclasts (from Early Cre-taceous to late Eocene age) and by the CBIC megablockbeds, defined by Powars and Bruce (1999) on seismicdata. The upper Eocene to Middle Miocene post-impactdeposits consist of bathyal, shallow shelf and marginal-marine sediments that have progressively filled much ofthe upper part of the crater. The upper Miocene toPliocene shallow shelf, and marginal-marine depositsfilled the upper part of the crater and blanketed the entireregion, thereby burying the crater. Post-impact depositsinclude, in ascending order: the very clayey Chickahom-iny Formation (upper Eocene); the glauconitic, phos-phatic, and partly shelly Delmarva beds (lowerOligocene) and Old Church Formation (upper Oli-gocene); the shelly and sandy beds of the Calvert Forma-tion (lower Miocene); the primarily siliciclastic, fine-grained, Calvert (middle Miocene), St. Marys (upperMiocene), and lower Eastover (upper Miocene) Forma-tions; the siliciclastic, locally glauconitic, fine- to coarse-grained fossiliferous upper Eastover (upper Miocene),Yorktown (lower and upper Pliocene), and Chowan River(upper Pliocene) Formations; and fluvial to estuarineQuaternary units.
Pre-impact Tertiary Deposits (Paleocene and lower and middle Eocene)
Within the study area, the pre-impact Tertiary depositsconsist of shallow-shelf to marginal-marine facies thatare characteristically thinly stratified, shelly, glauconitic,clayey sands and silts, and include the Brightseat, Aquia,Nanjemoy, and Piney Point Formations and the MarlboroClay. The pre-impact lower Tertiary deposits dip east-ward to northward and are higher and thinner near theVirginia-North Carolina border.
32 The Effects of the Chesapeake Bay Impact Crater on the Geologic Framework and the Correlation of Hydrogeologic Units of Southeastern Virginia, South of the James River

e-rtheareheer-thethe
e ofeif-
ho-99)ngutresy
latka-ngstsfiabyws
stke-
re--yndnlys.
ngtactn-eng
y-
asits
The Brightseat Formation is a muddy, glauconitic sandonly a few feet thick (Powars and others, 1992). It is bio-stratigraphically documented only in the Dismal Swampcorehole (2) (pl. 1) on the basis of Foraminifera (T.G.Gibson, formerly USGS, written commun., 1988), cal-careous nannofossils (L.N. Bybell, USGS, oral commun.,1988), and dinoflagellates (L.E. Edwards, USGS, writtencommun., 1988).
The Aquia Formation (upper Paleocene) consists ofmassive to thinly stratified, black to greenish-black tolight-greenish-gray clayey and silty, fine to coarse glauc-onitic quartz sands, with variable amounts of shells,microfossils, mica, pyrite, lignitic material, and calcium-carbonate cemented layers and concretions. The glauco-nitic sand typically is found floating in a clay-silt matrix,and some intervals have abundant burrows. Quartz andphosphatic pebbles and very coarse glauconitic quartzsand mark the base of the unit. South of the James River,a few hard streaks of shells or thin “rock” layers are fairlyabundant and show up as sharp peaks on the resistivitylogs. Drillers’ logs use a variety of lithic descriptions forthis unit such as a “black sand” or “black pepper sand” or“marl” or “clay and shell” or “shell rock.”
South of the James River, the Aquia Formation rangesin thickness from 30 to 60 ft at Hog Island (60, 58) to21 ft in the town of Rescue (45), 13 ft in the Chesapeake-Portsmouth Airport corehole (21), 19 ft in the DismalSwamp corehole (2), 42 ft in the Fentress corehole (12),and 24 ft in the Chesapeake Northwest River WTP bore-hole (3). The regional distribution of the Aquia Forma-tion is similar to that of the overlying Marlboro Clay andNanjemoy Formations (Powars and Bruce, 1999).
A distinctive suite of micro- and macrofossils (forexample, the brachiopod Oleneothyris harlani) found inthe lower part of the Aquia in the Fentress corehole indi-cates a late Paleocene age and equivalence to the Piscat-away Member (Powars and others, 1992). Dinocyst data(analyzed by L.E. Edwards) also establish that the entireunit in the Dismal Swamp corehole and the upper part ofthe Aquia in the Fentress corehole (12) are equivalent tothe updip outcrop Paspotansa Member of the Aquia(Powars and others, 1992). A summary of the chrono-stratigraphic data is included on the stratigraphic col-umns of the Dismal Swamp (2) and Fentress (12) core-holes (pl. 1) and on the stratigraphic column of theChesapeake-Portsmouth Airport corehole (21) (Powarsand Bruce, 1999, MW4-1 corehole, pl. 5). These Aquiamicro- and macrofossil assemblages are also found asintraclasts in the Exmore tsunami-breccia deposits.
The resistivity log signatures from the three key corholes (2, 12, and 21) within the study area are typical fothe Aquia Formation and reflect the sandy nature of section. Thin calcium-carbonate-cemented layers reflected on the resistivity log by sharp peaks. Tgamma readings reflect the variable amount (20-75 pcent) of glauconite (and some phosphate) found in Aquia strata, which generally causes deflections to right, indicating increasing radiation.
It is difficult to differentiate the Aquia strata from thunderlying Upper Cretaceous marine deposits souththe James River. Differentiating the Aquia from thExmore tsunami-breccia outside the outer rim also is dficult because these units are thin and have similar litlogic and borehole signatures. Powars and Bruce (19suggested that differentiation might be aided by notithe vertical stacking order of the units. They pointed othat the Marlboro Clay and Nanjemoy Formation amost likely underlain by the Aquia Formation whereathe Chickahominy Formation is most likely underlain bthe Exmore tsunami-breccia. The distinctive, nearly fresistivity signature of the homogeneous, clayey Chichominy Formation has thus far only been found overlyithe Exmore tsunami-breccia. This signature contrawell with the more irregular, curvy resistivity signature othe Nanjemoy and Marlboro Clay logs above the AquFormation; this irregular, curvy signature is caused variations in the sand content and the sand-filled burroin the Marlboro Clay.
The Marlboro Clay (upper Paleocene and lowermoEocene) ranges in thickness from 8 ft in the ChesapeaPortsmouth Airport corehole (21), to 16 ft in the DismalSwamp corehole (2), 10 ft in the Fentress corehole (12),and 14 ft in the Chesapeake Northwest River WTP bohole (3). It consists of light-gray to pinkish-gray and reddish-brown kaolinitic clay and is found consistentloutside the crater between the glauconitic Aquia aNanjemoy Formations. The clays are massive to thilaminated with silt and very fine, micaceous-rich sandThe contact between the Marlboro Clay and underlyiAquia is gradational, whereas a sharp, burrowed conexists between the Marlboro Clay and the overlying Najemoy beds. The contrast in lithology and color betwethe Marlboro Clay and the underlying and overlyinglauconitic units facilitates identification. Resistivitlogs reflect the very clayey nature of the Marlboro; however, the lowest Nanjemoy beds are often describedgray clay, making differentiation between these two undifficult.
Geologic Framework of Southeastern Virginia, South of the James River 33

y's 70
es, of
lylyhatte-ardgitere-enttheely
neyheomhecu- these
heor- ato-
weror-rre-
i-heer
thelit-itsri--stsc-
nta-to-
and
The Nanjemoy Formation (lower Eocene) ranges inthickness from about 3 to 40 ft south of the James River.Powars and Bruce (1999) described its regional distribu-tion pattern as similar to those of the Aquia and MarlboroClay Formations. The Nanjemoy Formation consists ofmassive to thin-bedded, dark-olive-gray, greenish-gray,and olive-black, variably clayey, silty, fine to coarse glau-conitic-quartz sand, with varying amounts of shells,microfossils, mica, lignitic material, pyrite, and goethite.The unit is characteristically intensely burrowed (includ-ing clay-filled, clay-lined, and sand-filled types) and con-tains several fining-upwards sequences that are usuallycapped with a sandy clay-silt. South of the James River,the Nanjemoy section contains thin deposits of both theWoodstock and Potapaco members (Powars and others,1992). The Nanjemoy has a sharp, burrowed contact withthe underlying Marlboro Clay.
The Nanjemoy Formation contains a distinctive suiteof early Eocene micro- and macrofossils (Powars andothers, 1992). Dinocyst data (analyzed by L.E. Edwards,USGS) from the Dismal Swamp corehole (2) indicatethat the Nanjemoy Formation includes Beds A and B ofthe Potapaco Member (Powars and others, 1992).Dinocyst data (also analyzed by L.E. Edwards) from theFentress corehole (12) indicate that the Nanjemoy For-mation consists of 8 ft of the Woodstock Member, whichconsists of poorly sorted, black, fine to coarse, rounded,glauconitic sand in a muddy matrix.
At Hog Island in the northwestern corner of the studyarea, the Nanjemoy Formation appears to be overlain bythe shelly, glauconitic Piney Point Formation. A high-resistivity signature is characteristic of the Piney Pointand distinguishes it from the underlying Nanjemoy.Along the northern side of the study area (adjacent to andstepping into the CBIC), the Nanjemoy is overlain by apatchy distribution of shelly, sandy, Oligocene and/orlower Miocene deposits that have distinctively high-resistivity and high gamma-log signatures.
In the Fentress corehole (12) (pl. 1), the Nanjemoy isoverlain by 15 ft of coarser glauconitic sand containingmiddle or late Eocene or early Oligocene dinocysts (L.E.Edwards, written commun., 1989). The middle and lateEocene dinocysts are probably reworked into lower Oli-gocene deposits (Powars and others, 1992). The veryclayey upper Miocene St. Marys Formation overlies theNanjemoy farther west, in the Dismal Swamp corehole(2). The clayey nature of these upper Miocene depositsexhibits a fairly uniform low resistivity signature; there-fore, they are readily distinguishable from the Nanjemoy.The thin sandy basal beds of the Calvert and St. Marys
Formations often contain phosphate, which causes ahigh-radiation peak on the gamma log. The Nanjemovariable percentage of glauconite and phosphate (20 topercent) creates high-radiation gamma-log signatursimilar to the Aquia Formation and the thin basal bedsthe Oligocene to middle Miocene deposits.
The Piney Point Formation (middle Eocene) is a richfossiliferous, olive-gray to grayish-olive-green, poorsorted, medium to coarse, glauconitic quartz sand tcommonly contains interbedded calcium-carbonacemented sand to shelly sand and moldic limestone (h"shell rock" with voids). The sand contains varyinamounts of clay, silt, shells, microfossils and glaucon(25 to 50 percent). The Piney Point Formation is pserved mainly north of the James River, and its presdistribution is due to the immense erosional power of impact blast and subsequent train of tsunamis that largshaped the upper surface of the Piney Point. The PiPoint is present only in the northwestern corner of tstudy area, beneath Hog Island. Its thickness varies fr7 to 17 ft in wells on Hog Island. On the north side of tJames River, 6.6 ft of the Piney Point strata were domented in the Jamestown corehole, which representsonly biostratigraphically dated section of this unit cloto the study area (Powars and Bruce, 1999).
High resistivity-log signatures are characteristic of tinterbedded sand and limestone of the Piney Point Fmation (Powars and Bruce, 1999). Piney Point strataHog Island appear to be overlain by Oligocene glaucnitic sands and shelly sands and are underlain by loEocene glauconitic clayey sands of the Nanjemoy Fmation. These interpretations are based largely on colation with the Jamestown corehole.
Syn-impact Deposits (upper Eocene)
The syn-impact deposits are divisible into two princpal depositional units: the Exmore tsunami-breccia (tupper deposit) and the CBIC megablock beds (the lowdeposit). The Exmore tsunami-breccia overlies either CBIC megablock beds or the relatively undisturbed or tle disturbed Upper and Lower Cretaceous depos(fig. 2). The Exmore tsunami-breccia has a highly vaable lithology, which consists of an overall finingupwards sequence of pebble- to boulder-size intraclain a gray, shelly, clayey and silty, fine to granular, glauonitic sand matrix (partially sublithified). The abundaintraclasts contain fauna and flora from Lower Cretceous (Albian), Upper Cretaceous (Cenomanian, Sannian, Campanian, and Maestrichtian), Paleocene,
34 The Effects of the Chesapeake Bay Impact Crater on the Geologic Framework and the Correlation of Hydrogeologic Units of Southeastern Virginia, South of the James River

theouthet,ier,esfied
Cnd
alllaroveck
ta-terheag,
lysits. 2;ua-t- touc-
er- to
the);
vanal--se)oerdus
lower, lower middle, and upper Eocene deposits (Powarsand others, 1992; Powars and Bruce, 1999). The clastsconsist of a wide variety of lithologies and sizes and arerounded to angular, mostly deformed fragments up to6.5 ft in diameter. They occur isolated to amalgamated,and are composed of soft, friable, marine to fluvial-del-taic sands and clays, hard silty clays, and indurated sandsand bioclastic limestones. As expected, these clasts dis-play a wide variety of colors, from black to various graysand greens to oxidation colors (red, purple, yellow, andbrown).
Core samples of the Exmore tsunami-breccia containtrace amounts of shocked quartz, a high-pressure mineralproduced only by the high pressures created by impactevents (Powars and Bruce, 1999). Koeberl and others(1996) also found abundant, centimeter-sized fragmentsof melt rock and scattered clasts of crystalline basementthat contain many quartz and feldspar deformation fea-tures in core samples.
The syn-impact Exmore tsunami-breccia ranges inthickness from 30 to 110 ft outside the outer rim of thecrater to about 125 to 664 ft a short distance inside theouter rim (50, 51, 53). Farther into the crater, seismicdata (recorded in two-way traveltime) indicate that theunit is 1,200 to 1,300 ft thick and up to approximately2,300 ft thick inside the crater’s inner basin (Powars andBruce, 1999). It abruptly thickens across the faultedouter rim of the crater and across the faulted peak ring ofthe inner basin but generally thins above the variablyuplifted peak ring (fig. 2)
The Exmore tsunami-breccia is overlain by the clayeypost-impact Chickahominy Formation, which also isfound only inside the disruption boundary that separatespre-impact units from syn-impact units. Core data indi-cate that this stratigraphic contact is gradational and thatthe Exmore tsunami-breccia deposits are capped by a thin(2 to 20 ft), olive-gray to brownish-purple, very clayeyunit that contains abundant, coarse-grained to fine peb-ble-size intraclasts and mixed fauna similar in lithologyto the Chickahominy Formation. Except for this thin claycap, the characteristic flat resistivity signature of theChickahominy strata is easily differentiated from theirregular resistivity signature typical of the rest of theExmore tsunami-breccia (Powars and Bruce, 1999).
Within the study area, the Exmore tsunami-brecciadeposits are underlain by pre-impact Upper and LowerCretaceous deposits outside the outer rim of the craterand by the CBIC megablock beds inside the outer rim.The location of the disruption boundary beneath theirregular, near-surface outer rim is uncertain, and undis-
turbed Lower Cretaceous deposits may extend far intoannular trough. Powars and Bruce (1999) pointed that differentiating the Exmore tsunami-breccia from tLower Cretaceous fluvial-deltaic deposits is difficult, buin general, the Lower Cretaceous deposits have blockthicker stratified, resistivity and gamma log signaturthan the more subdued signatures of the thinner stratiExmore tsunami-breccia deposits.
Powars and Bruce (1999) defined the CBImegablock beds as a seismic-stratigraphic unit fouinside the disruption boundary. This unit representsthe deposits (700 to 2,500 ft thick) found in the annutrough beneath the Exmore tsunami-breccia and abthe basement rocks. The syn-impact CBIC megablobeds are interpreted to consist primarily of Lower Creceous fluvial-deltaic deposits that slumped into the craduring an early stage of crater filling and covered tfloor (basement surface) of the annular trough (Po1996, 1997; Powars, and Bruce, 1999).
Post-impact Deposits
The post-impact deposits consist of approximate1,300 to 1,600 ft of upper Eocene to Holocene depothat buried the crater and the syn-impact deposits (figPowars and Bruce, 1999, pl. 7a). Except for some Qternary fluvial-estuarine deposits, most of the posimpact deposits are marine clays, silts, and very finevery coarse sands that may include diatomaceous, glaonitic, shelly, and thin calcium carbonate indurated intvals. Microfauna and macrofauna indicate a marinerestricted marine origin.
Post-impact deposits include, in ascending order: very clayey Chickahominy Formation (upper Eocenethe glauconitic, phosphatic, and partly shelly Delmarbeds (lower Oligocene) and Old Church Formatio(upper Oligocene); the shelly and sandy beds of the Cvert Formation (lower Miocene); the primarily siliciclastic, fine-grained Calvert (middle Miocene), the St. Mary(upper Miocene) and lower Eastover (upper MiocenFormations; the siliciclastic, locally glauconitic, fine- tcoarse-grained fossiliferous upper Eastover (uppMiocene), Yorktown (lower and upper Pliocene), anChowan River (upper Pliocene) Formations; and variofluvial to estuarine Quaternary and Holocene units.
Geologic Framework of Southeastern Virginia, South of the James River 35

incesneate-ity thehichheionvees
m
ri-e-,thearsebleen-st-
Upper Eocene, Oligocene, and lower Miocene Post-impact Deposits
The upper Eocene Chickahominy Formation is thefirst post-impact deposit and conformably overlies theExmore tsunami-breccia. Within the study area, this unitranges in thickness from 55 ft (32) to 227 ft (51). TheChickahominy Formation consists of massive to thin-bedded, olive-gray, very compact, dry, micaceous, clayeysilt to silty clay (Powars and Bruce, 1999). It containsvariable amounts of fine-sand to silt-sized, primarilyblack to dark green glauconite, shells including solitarycorals, abundant iron sulfides, and pyrite. The abundantmicrofauna impart a white-speckled appearance to someintervals. The entire unit contains a wide variety oflocally scattered to extensive burrows. The lower part ofthe section coarsens downward to very fine-to-fine sandand contains pebbles and reworked microfauna fromUpper Cretaceous through middle Eocene deposits(Powars and others, 1992).
The Oligocene to middle Miocene post-impact depos-its exhibit a patchy, very thin distribution pattern south ofthe James River. These deposits appear to be preservedadjacent to the outer rim and to thicken inside the crateralong the northern boundary of the study area (Powarsand Bruce, 1999). In the Fentress corehole (12) (pl. 1),dinocyst data (L.E. Edwards, USGS, written commun.,1989) indicate the presence of 15 ft of lower OligoceneDelmarva beds consisting of black, very fine, glauconiticand phosphatic sand in an olive-brown clay-silt matrix(Powars and others, 1992). Therefore, the unit is mostlikely locally present along the Virginia Beach coastalarea.
The upper Oligocene deposits are found in theJamestown corehole (61) and probably are also present inthe northwest corner of the study area. However, theywere not encountered in the Dismal Swamp (2) or Fen-tress coreholes (12) and, therefore, probably are absentover most of the study area outside the crater.
Powars and Bruce (1999) presented biostratigraphicand strontium-isotope data that document the presence oflower Miocene marine bioclastic sand deposits in the Vir-ginia Coastal Plain, which they informally named theNewport News unit of the Calvert Formation. Strontium-isotope analysis of shells from these deposits indicatesthat they range in age from about 20.1 to 17.1 Ma.
Within the study area, the thinness and local absenceof the Oligocene and lower Miocene strata, combinedwith their general lithologic similarity, make it difficult tocorrelate these deposits between cores. Therefore, in this
report the thin lower Oligocene Delmarva beds are com-bined with the overlying upper Oligocene Old ChurchFormation and lower Miocene Newport News unit of theCalvert Formation into a single stratigraphic unit. Theshelly, sandy, Oligocene and/or lower Miocene depositscharacteristically have high-resistivity and high gamma-log signatures, which contrast with the characteristiclow-resistivity signatures (deflection to the left) of theunderlying fine-grained Nanjemoy or ChickahominyFormations and overlying finer grained Calvert or St.Marys Formations.
Middle and upper Miocene, Pliocene, and Quaternary Post-impact Deposits
Post-impact deposits from numerous marine trans-gressions and regressions across the lower mid-AtlanticCoastal Plain have covered the study area with a gener-ally eastward-dipping wedge of sediments that rangesfrom 225 to 750-ft-thick outside the crater. These depos-its thicken and dip into the crater, becoming up to 1,300to 1,600 ft thick. Miocene and Pliocene shallow-shelf tonearshore marine deposits account for most of the sectionand are overlain by relatively thin Quaternary fluvial-estuarine deposits.
Most of the post-impact middle and upper Miocenedeposits cored in Virginia’s central to outer Coastal Plahave been found to consist of fining-upward sequenthat have thin basal sands overlain by thick, very figrained clays, silts, and sands with scattered shell mrial. These deposits consistently display a low-resistivsignature except along and adjacent to the outer rim ofcrater, where the deposits become coarser grained, wresults in higher resistivity signatures. In general, tuppermost part of the upper Miocene Eastover Formatand parts of the Pliocene Yorktown Formation hashelly sands that produce high-resistivity signaturthroughout the study area.
The middle Miocene Calvert Formation is absent frothe Dismal Swamp corehole (2) and consists of 12 ft ofshelly sand in the Fentress corehole (12); northeast of thestudy area (within the crater) it thickens to 458 ft of pmarily very fine grained sediments in the Kiptopeke corhole (64). A thin section of Calvert Formation istherefore, locally present along the eastern side of study area. The thicker beds in the crater contain spto abundant diagnostic diatoms that are easily visiusing a 10X hand lens, and were not visible in the Ftress core. Similar to the other thin pre-impact and po
36 The Effects of the Chesapeake Bay Impact Crater on the Geologic Framework and the Correlation of Hydrogeologic Units of Southeastern Virginia, South of the James River

impact units, differentiation of thin units is very difficultbetween cores.
The St. Marys Formation is the oldest post-impact unitthat extends across the entire study area and progressivelyonlaps and truncates older units west to southwest of thecrater. The St. Marys appears to be thickest in the south-ern part of the crater and south of the crater in the Norfolkto Virginia Beach area (Powars and Bruce, 1999). In theDismal Swamp corehole (2), Foraminifera (T. Gibson,written commun., 1987) from a thin, benthic-foramin-ifera-rich, brownish gray, sandy clay indicates that theupper Miocene St. Marys Formation overlies the Nan-jemoy Formation. The St. Marys consists of up to 330 ft(51) of mostly muddy, very fine sand and sandy clay andsilt containing scattered shells, abundant iron sulfide, andfinely disseminated organic material.
Ostracode (T. Cronin, USGS, written commun., 1995)and Foraminifera (S. Ishman, formerly with the USGS,written commun., 1995) data from the upper part of theEastover Formation in the Dismal Swamp (2) and Fen-tress (12) coreholes indicate the presence of a thickyounger section that has no correlative units in outcrop(Powars and Bruce, 1999). Powars and Bruce (1999)reported strontium-isotope ages for the St. Marys stratathat range from about 6.7 to 5.5 Ma, which extrapolatesto foraminiferal zone N17.
The Eastover Formation (upper Miocene) also extendsacross the entire study area and ranges in thickness from140 ft in the Dismal Swamp corehole (2) to 174 ft in theFentress corehole (12). The Eastover consists of dark-gray to bluish-gray to greenish-gray, muddy fine sandinterbedded with finer and coarser grained beds. TheEastover is sparsely to abundantly shelly, contains shellhashes and indurated beds, and is locally glauconitic andmicaceous. Macrofauna and microfauna indicate a shal-low-water, marine to restricted-marine depositional envi-ronment. The pearly luster, tabular mollusk Isognomonmaxillata is a common species in the upper part of theEastover Formation, but not present in the overlyingYorktown Formation. Throughout the study area, thelower part of the Eastover Formation consists of a clayey,fine-grained facies and the upper part is a shelly, coarsergrained, sandy facies. Powars and Bruce (1999) pointedout that regionally the lower, finer grained facies hascharacteristically low resistivity-log signatures (deflec-tion to the left) that show an upward-coarsening trendinto the upper shelly, coarse-grained facies that has char-acteristically high resistivity-log signatures (deflection tothe right).
The Yorktown Formation (lower and lower upperPliocene) extends across the entire study area exceptwhere it has been cut out by Quaternary James Riverpaleochannels (see Powars and Bruce, 1999). The York-town deposits overlie the Eastover strata throughout thestudy area and locally are overlain by shallow-marinedeposits of the Chowan River Formation (late Pliocene).The Yorktown consists of bluish-gray, greenish-gray, anddark greenish-gray, very fine to coarse sand, in part glau-conitic and phosphatic, commonly very shelly and inter-bedded with gray and blue-gray sandy and silty clay. TheYorktown also contains abundant microfauna and locallyincludes cross-bedded biofragmental lenticular sand bod-ies.
Subdivision of the Yorktown Formation into its fourmembers (from oldest to youngest: Sunken Meadow,Rushmere, Mogarts Beach, and Moore House) is beyondthe scope of this report. Within the study area, however,outcrops of the Yorktown Formation found along muchof the James River shoreline in Isle of Wight Countyexpose the upper part of the Rushmere Member and theMogarts Beach and Moore House Members. The York-town has been documented to range in thickness from42 ft in the Dismal Swamp corehole (2) to 107 ft in theFentress corehole (12). Ostracode data (T. Cronin, writ-ten commun., 1995) from these two coreholes indicatethat the Yorktown consists of the Sunken Meadows,Rushmere, and Mogarts Beach Members. The youngestMoore House Member may be present at the Fentresscorehole (12) site but was not resolved because of poorcore recovery from the upper section of the Yorktown.
The Chowan River Formation (upper Pliocene) has avery limited, irregular distribution across the southeast-ern part of the study area. It consists of interbedded, silty,fine sand, clayey silt, and bioclastic sand. The ChowanRiver Formation (upper Pliocene) was reported (Gibson,1983) in the Moores Bridge well (31) at depths from 90to 115 ft and consists of blue-green fossiliferous clayeyfine sand. It is also reported (Johnson and others, 1987)1ocally only in a few borrow pits (the Gomez and Yadkinpits) and in the subsurface of southeastern Virginia.Exposure of the Chowan River Formation in relativelyshallow borrow pits less than 5 miles south of the NOR-T-12 well (32) suggests that either a steep gradient existsbetween these sites (possibly caused by structural effects)or that identification was incorrect. A bioclastic, silty,fine to medium sand found in the Fentress corehole from-51 to -65 ft elevation is assigned to the Chowan RiverFormation. Where present, this unit unconformablyoverlies the Yorktown Formation and is truncated by
Geologic Framework of Southeastern Virginia, South of the James River 37

e,
thed-gicd
nd
e-hisheshis-act)
St.e
ac- isake
dfig-re- thethe (?)ta
ofn
nd
sau-tster
oforet-d
h-itsd
Quaternary fluvial to estuarine and marginal-marinedeposits. The lithology of the Chowan River is so similarto the underlying Yorktown Formation that biostrati-graphic differentiation is required. No attempt was madeto differentiate the Chowan River from the Yorktown,however, because of the lack of biostratigraphic data, theChowan River’s patchy distribution, and their similarhydrogeologic characteristics.
Quaternary strata in the study area include fluvial,estuarine, marginal-marine, and nearshore-shelf sedi-ments deposited during the Pleistocene epoch. The early,middle, and late Pleistocene deposits form a step-likesuccession of terraces and intervening scarps that parallelthe coast (or the buried outer rim of the crater) and majorstreams, thereby dominating the topography of theCoastal Plain (Johnson and Ramsey, 1987). These ter-races decrease in elevation and age towards the coast andmajor streams. The Pleistocene and Holocene depositsconsist of light- to dark-gray, blue-gray, to oxidized var-iegated (brown, yellow, orange, red), interbedded sand,gravel, silt, clay, and locally include shells and peat. Theestuarine and coast- facing deposits east of the Suffolkscarp commonly include scattered to dense shell accumu-lations. The Holocene deposits include estuarine, marsh,swamp, dune, alluvial and colluvial sediments.
Across the study area, Pleistocene scarps and paleo-channels cut into the older units (Johnson, 1969; Johnsonand Ramsey, 1987; Powars and Bruce, 1999). Near themouth of the James River, a paleochannel cuts down tonearly -160 ft beneath the modern James River (fig. 9B).Paleochannel fills of the Atlantic Coastal Plain generallyare transgressive sequences consisting, from bottom totop, of coarse fluvial gravel and sand, estuarine muds,and fossiliferous lower estuarine to open-bay sand andsandy mud. The channel fills are overlain by nearshoreshelf and barrier-spit deposits representing depositionduring interglacial highstands (when the sea level is highdue to melting of continental glaciers and partial meltingof the polar ice caps).
The Pleistocene scarps were formed by fluvial andestuarine erosion (valley-facing scarps) and shorelineerosion (coast-facing scarps) caused by changes in sealevel that occurred during the glacial-interglacial period.The proximity and parallelism of the coast-facing scarpsto the outer rim of the crater, and the stacked nature ofsome of the scarps near the outer rim, indicate an influ-ence by episodic differential movement around the buriedouter rim and continued higher subsidence rates insidethe crater. In addition, late Pleistocene and Holocenedeposits appear to be the only surficial units found inside
the buried outer rim of the crater (Powars and Bruc1999).
Subdivision of the Quaternary deposits is beyond scope of this report. For more information about indiviual Quaternary units, the reader is referred to the geolomap of the Virginia Coastal Plain (Mixon, Berquist, anothers, 1989), which shows the surficial distribution abriefly describes the lithology of the Quaternary units.
CORRELATION OF GEOLOGIC UNITS TO HYDROGEOLOGIC UNITS
On the basis of lithology, biostratigraphy, and borhole geophysical logs, the geologic units described in treport are correlated with the hydrogeologic units of tVirginia Coastal Plain described by Meng and Har(1988) as part of the Regional Aquifer-System Analys(RASA) program (table 2). The 56-mi-wide CBIC truncated the aquifers and confining units (Lower Potomthrough the lower part of the Chickahominy-Piney Pointhat were identified by Meng and Harsh (1988). The Marys-Choptank aquifer, an important aquifer in thMaryland Coastal Plain, is not present in this area (Lzniak and Meng, 1988), and the Virginia Beach aquiferpresent only south of the James River and ChesapeBay (Hamilton and Larson, 1988).
The variability of correlation of the geologic anhydrogeologic units across the study area is shown in ure 13. For example, the Virginia Beach aquifer is corlated to (1) the top of the upper Cenomanian beds, (2)glauconitic sands unit, (3) the red beds unit, and (4) lower part of the Upper Cretaceous and/or Paleoceneunit. In some places, very clayey or fine-grained stracorrelate with intervals assigned to aquifers insteadconfining units. These correlations call for the revisioof the hydrogeologic units of Meng and Harsh (1988) aHamilton and Larson (1988).
Various structural and stratigraphic complexitierelated to the CBIC and its burial have altered the hydrlic characteristics of the aquifers and confining uniinside and adjacent to the crater. Regional ground-waflow paths apparently were altered by emplacementthe lithically heterogeneous, seawater-saturated Exmtsunami-breccia and its burial by fine-grained posimpact deposits in the structural low. The combineeffect apparently resulted in differential flushing of freswater over and around the primarily fine-grained deposinside the crater. The distribution of Virginia's inlan
38 The Effects of the Chesapeake Bay Impact Crater on the Geologic Framework and the Correlation of Hydrogeologic Units of Southeastern Virginia, South of the James River

Co
rrelation
of G
eolo
gic U
nits to
Hyd
rog
eolo
gic U
nits 39
SERIESSYSTEM
QU
ATE
RN
AR
YT
ER
TIA
RY
Geologic unitsthis report
Holocene
Pleistocene
Alluvium, swamp, + beach
Tabb FormationShirley Formation
Chuckatuck Formation
UM
LWindsor Formation
Bacons Castle Formation
PlioceneU
L
Miocene
M
U
L
CH
ES
AP
EA
KE
GR
OU
P
York
tow
n Fo
rmat
ion
Eas
tove
r For
mat
ion
St. Marys Formation
Cal
vert
Form
atio
n
Calvert Beach Member
Plum Point Member
Fairhaven Member
Moore House Member
Mogarts BeachMember
Rushmere Member
Sunken MeadowMember
Cobham BayMember
Claremont ManorMember
Unnamed beds2
Charles City Formation
Choptank Formation(not present in study area)
Old Church FormationOligocene
U
Hydrogeologic units
Meng and Harsh(1988)
Hamilton and Larson(1988)
Columbiaaquifer
VirginiaRASA
model unit1
Yorktown confining unit
Yorktown-Eastoveraquifer
St. Marysconfining unit
St. Marys-Choptankaquifer
Calvertconfining unit
AQ10
CU9
AQ9
CU8
AQ8
CU7
Columbiaaquifer
Yorktown confining unit
Yorktown-Eastoveraquifer
St. Marysconfining unit
Calvertconfining unit
Newport News unit
?
Chickahominy-Piney Point
aquiferAQ7
Chickahominy-Piney Point
aquifer
1Meng and Harsh (1988).2Powars, D.S. and Cronin, T., U.S. Geological Survey, unpub. data, 1995.
L Delmarva beds
Table 2. Correlation of geologic units to hydrogeologic units. Modified from Powars and Bruce, 1999
[U, upper; M, middle; L, lower; RASA, Regional Aquifer-System Analysis; Fm, formation; AQ, aquifer; CU, confining unit]

40 Th
e Effects o
f the C
hesap
eake Bay Im
pact C
rater on
the G
eolo
gic F
ramew
ork an
d th
e Co
rrelation
of H
ydro
geo
log
ic Un
its o
f So
uth
eastern V
irgin
ia, So
uth
of th
e James R
iver
LFairhaven Member of the Calvert Fm
Old Church Formation
Delmarva bedsOligocene
Eocene
ChickahominyFormation
Exmore tsunami-breccia
Piney PointFormation
NanjemoyFormation
Marlboro Clay
AquiaFormation
BrightseatFormation
Paleocene
U
U
U
L
L
L
M
upperCenomanian
beds
PotomacFormation
Exmore megablock beds
Rift-basin deposits
Chickahominy-Piney Point
aquifer
Nanjemoy-Marlboro Clayconfining unit
Aquia aquifer
Brightseatconfining unit
Brightseat aquifer
Upper Potomacconfining unit
Upper Potomacaquifer
Mid-Potomac confining unit
Mid-Potomac aquifer
Lower Potomac confining unit
Lower Potomac aquifer
AQ7
CU6
AQ6
CU3
AQ3
CU3
AQ3
CU2
AQ2
CU1AQ1
Chickahominy-Piney Point
aquifer
Nanjemoy-Marlboro Clayconfining unit
Aquia aquifer
Not presentin study area
Virginia Beach
CU4Virginia Beachconfining unit
AQ4
Upper Potomac confining unit
Upper Potomac aquifer
Mid-Potomac confining unit
Mid-Potomac aquifer
Lower Potomac confining unitLower Potomac aquifer
aquifer
1Meng and Harsh (1988).2Powars, D.S. and Cronin, T., U.S. Geological Survey, unpub. data, 1995.
Upper
Lower
Basement rocks
Newport News unit of the Calvert Fm
MMiocene
SERIESSYSTEM
TE
RT
IAR
YC
RE
TAC
EO
US
Geologic unitsthis report
Meng and Harsh(1988)
Hamilton and Larson(1988)
VirginiaRASA
model unit1
Calvertconfining unit
CU7 Calvertconfining unit
Hydrogeologic units
Plum Point Member of the Calvert Fm
JURASSIC-TRIASSIC
PALEOZOIC AND PROTEROZOIC
Glauconitic sand unit
Red beds
Unnamed
Table 2. Correlation of geologic units to hydrogeologic units. Modified from Powars and Bruce, 1999—Continued

Correlation of Geologic Units to Hydrogeologic Units 41
(A)DISMAL SWAMP COREHOLE
ALTITUDE(IN FEET)
Sealevel
33
-418
upperCenomanian beds
Glauconitic sands
Red beds
PotomacFormation
-560
-361
Aqiua Formation
Marlboro Clay
-308-289-273-269
-167
St. MarysFormation
EastoverFormation
Yorktown confining unit
-13
-50
Yorktown Formation
Shirley Formation
-222
-167
Nanjemoy Formation
Yorktown-Eastover aquifer
Calvertconfining unit
Chickahominy- Piney Point aquifer
Tn-Tm conf. unit-288
-308
upper Potomac aquifer
upper Potomac confining unit
-684
-600
-422
-381
-366
Aquiaaquifer
Virginia Beach aquifer
VA Beach conf. unit
Geologic units this report
Hydrogeologic unitsHamilton and Larson, 1988
-27
15
-900
-500
-100
-200
-800
Columbia aquifer
Figure 13. Correlation of geologic and hydrogeologic units in three key boreholes—the Dismal Swamp corehole (A), the Fentress corehole (B), and the Chesapeake Northwest River WTP borehole (C)—showing the variability in unit correlation across the study area. Hydrogeologic unit contacts include estimates from structure contour and isopach maps of units by Hamilton and Larson (1988).

42 The Effects of the Chesapeake Bay Impact Crater on the Geologic Framework and the Correlation of Hydrogeologic Units of Southeastern Virginia, South of the James River
-600
Tabb Formation
Chowan River Formation(?)
YorktownFormation
EastoverFormation
St. MarysFormation
Calvert FormationDelmarva beds
Nanjemoy FormationMarlboro Clay
Aquia Formation
Red beds
Glauconitic sands
upper Cenomanian beds
ALTITUDE(IN FEET)Sea
level
-172
-346
-65-52
?
-600-612-620-635-645
-687
-778
-836
-1,035
15
FENTRESS COREHOLEGeologic units this report
Hydrogeologic unitsHamilton and Larson, 1988
Yorktown-Eastover aquifer
Yorktown conf. unit
VA Beach conf. unit
PotomacFormation
upperPotomac aquifer
upper Potomac confining unit
Virginia Beach aquifer
-1,012
-820
-720
-710
-603
Chickahominy- Piney Point aquifer
-353
Calvertconfining unit
-54
-79
CHESAPEAKE NORTHWEST RIVER WTP BOREHOLE
Yorktown Formation
Eastover Formation
St. Marys Formation
Calvert Formation
Delmarva bedsNanjemoy Formation
ALTITUDE(IN FEET)
10SealevelChowan River Formation
Upper Cretaceousand (or)
Paleocene (?)
Tabb Formation
Aquia Formation
Marlboro Clay
Potomac Formation
upperCenomanian
beds
Red beds
Glauconitic sands
-1,057
-845
-795
-715
-608
-584-570-555
-540
-521
-306
-170
-30
-70 Yorktownconfining unit
-100
-356
Yorktown-Eastover aquifer
Calvertconfining unit
-536
-650
Chickahominy- Piney Point aquifer
-678VA Beach conf. unit
-875
-1,100
upper Potomacconfining unit
VirginiaBeach aquifer
upper Potomac aquifer
Hydrogeologic unitsHamilton and Larson, 1988
Geologic units this report
-900
-500
-100
-1000
-800
-400
-200 -200
-400
-600
-800
-1000
Columbia aquifer Columbia aquifer
(B) (C)
Tn-Tm Nanjemoy-Marlboro
conf. confining
EXPLANATION
Figure 13. Correlation of geologic and hydrogeologic units in three key boreholes—the Dismal Swamp corehole (A), the Fentress corehole (B), and the Chesapeake Northwest River WTP borehole (C)—showing the variability in unit correlation across the study area. Hydrogeologic unit contacts include estimates from structure contour and isopach maps of units by Hamilton and Larson (1988)—Continued.

ruc-ns
lliledth-onsralofernwas touc-eo-
hetheitsr.heusular-actosi-ed
ioning ofthee Ire-
.lenmn-ger
hethin-ssheongternrod-ralwasre-sitsuptse is a
salt-water wedge coincides with the location of the CBIC.Prior to the discovery of the CBIC, Focazio and others(1993) compiled contour maps depicting the quality ofground water across the Virginia Coastal Plain. Figure 14shows that an increase in the concentration of total dis-solved solids in the middle Potomac aquifer coincideswith the outer rim of the crater. The Brightseat-upperPotomac and Chickahominy-Piney Point aquifers havesimilar contour patterns (Focazio and others, 1993).
The location of the CBIC with respect to the transversearch-basin configuration apparently provides a relativelyeasy downslope flow pathway around the northeastwardside of the crater toward the axis of the Salisbury Embay-ment. In contrast, the Norfolk arch, which is close to thecrater on the south side, possibly inhibits flow southeast-ward around the crater. The abrupt juxtaposition of dis-similar stratigraphic sections north and south of the riverproduced by the James River structural zone, and theindurated red beds associated with the Norfolk arch, prob-ably also inhibits flow southeastward around the crater byadding barriers to flow paths or by creating more verticalflow paths. In addition, if the CBIC partially truncated aportion of the pre-existing structural zone, as Powars andBruce (1999) have suggested, then the area along andadjacent to that truncation would be more faulted andfractured than other areas and therefore would possiblyprovide more barriers or vertical flow paths.
Increasing our knowledge of the complex geologicframework in this area is important for water-resourcemanagement. Alternate water supplies are lacking, andwater utilities in this region have begun to developprojects that withdraw brackish ground water from justoutside the outer rim of the crater. The results of this studyindicate that the area south of the lower James River isstructurally more complex than other areas adjacent to thecrater because of the CBIC’s effects on the James Riverstructural zone. These structural complexities apparentlyhave disrupted the pre-impact aquifers and confiningunits; as a result, the physical properties of the ground-water flow system have been altered significantly.
SUMMARY AND CONCLUSIONS
The influence of the Chesapeake Bay impact crater(CBIC) on the structural, stratigraphic, and hydrogeologicframework of southeastern Virginia’s Coastal Plain iscomplicated by the presence of a pre-impact James Riverstructural zone. The emplacement of the CBIC and sub-
sequent structural adjustments to this James River sttural zone help explain the complex distribution patterof post-impact deposits found across the region.
Litho- and biostratigraphic data from cores and wecuttings and borehole geophysical log data were compand analyzed to refine the geologic framework of soueastern Virginia south of the James River. Cross sectiwere constructed to show the stratigraphic and structuconfiguration west of the crater and the configuration the south to southwest side of the crater. The westcross section, which traverses a region that apparently little affected by the impact crater, was constructedshow the existence of the pre-impact James River strtural zone. The other two cross sections connect the glogic framework south of the James River to that of tlower York-James Peninsula; these sections illustrate structural and stratigraphic relations of geologic uninside and adjacent to the outer rim of the impact crate
The abrupt truncation and variations in thickness of tvarious fluvial, deltaic, and marginal marine Cretaceounits across the James River, combined with the angunconformity with the overlying pre-impact lower Tertiary marine deposits, provide evidence of a pre-impJames River structural zone. Given that sediment deption and preservation are greater on the down-droppside of structural zones, it would appear that the regnorth of the James River was relatively depressed durpollen zone I and relatively elevated for the remainderCretaceous time. In contrast, the region south of James River was relatively elevated during pollen zonand relatively depressed during the time periods repsen ted by po l len zones I I , I I I , IV, and V
The Upper Cretaceous deposits consisting of polzones III, IV, and V form a wedge that thickens fro377 ft in the Dismal Swamp corehole to 628 ft in the Fetress corehole. The Upper Cretaceous deposits younthan pollen zone III thicken from 200 to 500 ft across tsoutheastern part of the study area. The deposits are ner, 30 to 150 ft, and have an irregular distribution acromuch of the northwestern part of the study area. TUpper Cretaceous deposits are abruptly truncated althe northernmost part of the study area. On the wesside of the study area, the truncation appears to be a puct of pre-impact movements of the James River structuzone; on the eastern side of the study area, the CBIC responsible for the truncation. An isopach map of the pimpact lower Tertiary deposits shows that these depothicken north of the James River and west of their abrtruncation by the CBIC. The variable thickness of thedeposits across the rest of the study area apparently
Summary and Conclusions 43

38o30'
76o77o30'77o
37o
0 25 MILES
25 KILOMETERS0
James
York
River
River
Franklin
Williamsburg
HAMPTON
NORFOLK
PORTSM
OUTH
CHESAPEAKE
BAY
ATLANTIC
OCEAN
VIRGINIANORTH CAROLINA
1,00
0
2,50
0 5,00
01,
000
2,50
0
5,00
0
INNER R
IM
OUTER RIM
Base from U.S. Geological SurveyGeologic Map, 1:250,000,Mixon, Berquist, and others, 1989
EXPLANATION
1,000 LINE OF EQUAL DISSOLVED-SOLIDSCONCENTRATION—Dashed whereapproximately located. Interval, inmilligrams per liter, is variable
CRATER RIM
Figure 14. Relation of dissolved-solids concentrations in the middle Potomac aquifer to the location of the Chesa-peake Bay impact crater. (Modified from Smith, 1999.)
result of syn- and post-impact structural influences of theCBIC that caused erosion of uplifted areas. Part of thepattern also appears to reflect radial fault systems thatwere created by the Chesapeake Bay impact crater.Within the study area, the pre-impact lower Tertiarydeposits dip eastward to northward and are higher andthinner near the Virginia-North Carolina border. East tosoutheast deflections of structure contours on top of theUpper Cretaceous and pre-impact Tertiary deposits showpossible structural effects; the southernmost deflectionscoincide with a previously postulated fracture zone.
Complex distributions and truncations of post-impactunits across the James River suggest post-impact struc-tural influences of the CBIC on the James River struc-tural zone. The truncation of many of the earlier post-impact units, such as the upper Eocene to middleMiocene deposits, indicates that the area south of theJames River structural zone was relatively up during that
time or at least prior to deposition of the upper MioceneSt. Marys Formation.
The pre-impact Tertiary deposits south of the JamesRiver consist of shallow-shelf to marginal-marine depos-its, including the Brightseat Formation (lower Pale-ocene), Aquia Formation (upper Paleocene), MarlboroClay (straddles the Paleocene-Eocene boundary), Nan-jemoy Formation (lower Eocene), and Piney Point For-mation (middle Eocene). These pre-impact units arecharacteristically thin, partly shelly, glauconitic, clayeysands and silts that are bounded by unconformities.
The syn-impact deposits consist of the upper EoceneExmore tsunami-breccia and the seismically definedCBIC megablock beds. The Exmore tsunami-brecciafills much of the relatively flat-floored annular troughand central basin. The CBIC megablock beds appear toform a concentric wedge that thins toward the center of
44 The Effects of the Chesapeake Bay Impact Crater on the Geologic Framework and the Correlation of Hydrogeologic Units of Southeastern Virginia, South of the James River

es,nic
a-ataon,ndtedn-
anderasor-val-ter-
d asra-e-
the crater and covers nearly all the rest of the flat-flooredannular trough.
Post-impact upper Eocene to Holocene deposition bur-ied the crater and the syn-impact deposits with approxi-mately 1,300 to 1,600 ft of sediment, which explains theabrupt thickening of these stratigraphic units into the cra-ter across the northeastern part of the study area.
The Pliocene and Quaternary deposits have a complexdistribution of lithofacies within 12.5 miles of the crater’souter rim, indicating synchronous deposition and defor-mation. This deformation is attributed to episodic differ-ential movement of the bounding faults associated withthe buried outer rim of the crater and the rotation of slumpblocks near the crater’s perimeter.
The structural and stratigraphic features created by theimpact and adjustments to the James River structuralzone also have influenced our understanding of thehydrogeologic framework, ground-water flow system,and regional water quality of the Virginia Coastal Plain.Pre-impact aquifers and confining units were truncatedand disrupted in and adjacent to the crater.
Regional flow paths possibly were altered by emplace-ment of the lithically heterogeneous, seawater-saturatedExmore tsunami-breccia and its burial by fine-grainedpost-impact deposits in the structural low. The result wasdifferential flushing of fresh water over and around theprimarily fine-grained deposits inside the crater. Thelocation of the CBIC with respect to the pre-existingtransverse arch-basin configuration also apparently hasprovided a relatively easy downslope flow pathwayaround the northeastward side of the crater toward theaxis of the Salisbury Embayment. The proximity of theNorfolk arch to the south side of the crater possibly inhib-its flow southeastward around the crater. The distributionof Virginia's anomalous inland salt-water wedge coin-cides with the CBIC's location. An increase in concentra-tions of total dissolved-solids in the middle Potomac,Brightseat-upper Potomac, and Chickahominy-PineyPoint aquifers coincides with the outer rim of the crater.In the absence of alternate water supplies, water utilitiesin this region have begun to develop projects that with-draw brackish ground water along the edge of the CBIC.
The location and geometry of the outer rim of theCBIC beneath the lower York-James Peninsula and theNorfolk to Virginia Beach area are poorly understood,and additional data are needed to enhance that under-standing. The outer rim coincides with an increase inconcentrations of total dissolved solids and chloride;therefore, the outer rim separates ground water of highsalinity inside the outer rim from fresher water outside
the outer rim. To locate this boundary accurately, wneed additional land-based seismic reflection profilecores, and borehole geophysical logs, especially a sovelocity log that would allow for accurate depth correltion between borehole and seismic data. Hydrologic dfor the western side of the crater, such as flow directiwater quality, and permeability, are non-existent, ainformation about the depositional processes associawith such a large impactor into water-saturated, uncosolidated sediments is sparse. Obtaining cores installing observation wells in and around the cratwould help us understand how this impact crater haffected the regional ground-water resources. This infmation also is needed to more accurately model and euate the ground-water flow and the potential for saltwaintrusion in the vicinity of the impact crater. As groundwater use increases in the Hampton Roads region anpublic water utilities increasingly rely on brackish-wateaquifers as sources of drinking water, additional informtion about the CBIC will be needed for future managment of these ground-water resources.
REFERENCES CITED
Brenner, G.J., 1963, The spores and pollen of the Potomac Group of Maryland: Maryland Department of Geology, Mines, and Water Resources Bulletin 27, 215 p.
Brown, P.M., Miller, J.A., and Swain, F.M., 1972, Structural and stratigraphic framework and spatial distribution of permeability of the Atlantic Coastal Plain, North Carolina to New York: U.S. Geological Survey Professional Paper 796, 79 p., 59 pl.
Bruce, S., and Powars, D.S., 1995, Inland salt water wedge in the coastal plain aquifers of Virginia [abs.]: Virginia Water Resources Conference, Richmond, Virginia.
Cederstrom, D.J., 1945a, Geology and ground-water resources of the coastal plain in southeastern Virginia: Virginia Geological Survey Bulletin 63, 384 p.
Cederstrom, D.J., 1945b, Selected well logs in the Virginia Coastal Plain north of the James River: Virginia Geologi-cal Survey Circular 3, 81 p.
Cederstrom, D.J., 1945c, Structural geology of southeastern Virginia: American Association Petroleum Geological Bulletin 29, p. 71-95.
Cederstrom, D.J., 1957, Geology and ground-water resources of the York-James Peninsula: U.S. Geological Survey Water-Supply Paper 1361, 237 p.
Coch, N. K., 1968, Geology of the Benns Church, Smithfield, Windsor, and Chuckatuck quadrangles, Virginia: Virginia
References Cited 45

late
ia o--
ake
.]: s,
ey,
t-
r- ol-
gra-os-
.
nd
.
ew
-
Division of Mineral Resources Report of Investigations 17, 40 p.
Coch, N. K., 1971, Geology of the Newport News South and Bowers Hill quadrangles, Virginia: Virginia Division of Mineral Resources Report of Investigations 28, 26 p.
Focazio, M.J., Speiran, G.K., and Rowan, M.E., 1993, Quality of ground water in the Coastal Plain physiographic prov-ince of Virginia: U.S. Geological Survey Water-Resources Investigations Report 92-4175, 20 p., 5 pls.
Gibson, T.G., 1983, Stratigraphy of Miocene through lower Pleistocene strata of the United States central Atlantic Coastal Plain, in Ray, C.E., ed., Geology and paleontol-ogy of the Lee Creek mine, North Carolina, I; Smithso-nian Contributions to Paleobiology, no. 53, p. 35-80.
Glaser, J.D., 1969, Petrology and origin of Potomac and Mag-othy (Cretaceous) sediments, Middle Atlantic Coastal Plain: Maryland Geological Survey Report of Investiga-tions no. 11, 102 p.
Gohn, G.S., 1988, Late Mesozoic and early Cenozoic geology of the Atlantic Coastal Plain—North Carolina to Florida, in Sheridan, R.E., and Grow, J. A., eds., The Atlantic con-tinental margin—U.S., The Geology of North America v. 1-2: Boulder, Colo., Geological Society of America, p. 107-130.
Grow, J.A., and Sheridan, R.E., 1988, U.S. Atlantic Continen-tal Margin; A typical Atlantic-type or passive continental margin, in Sheridan, R.E., and Grow, J.A., eds., The Atlantic continental margin—U.S., The Geology of North America v. 1-2: Boulder, Colo., Geological Society of America, p. 1-7.
Hamilton, P.A., and Larson, J.D., 1988, Hydrogeology and analysis of the ground-water-flow system in the Coastal Plain of southeastern Virginia: U.S. Geological Survey Water Resources Investigations Report 87-4240, 175 p.
Hansen, H.J., 1969, Depositional environments of subsurface Potomac Group in southern Maryland: American Associ-ation of Petroleum Geologists Bulletin, v. 53, no. 9, p. 1923-1937.
Horton, J.W., Jr, Drake, A.A., Rankin, W.R., and Dallmeyer, R.D., 1991, Preliminary tectonostratigraphic terrane map of the central and southern Appalachians: U.S. Geologi-cal Survey Miscellaneous Investigation Series Map I-2163.
Johnson, G.H., 1969, Geology of the lower York-James Penin-sula and south bank of the James River: Williamsburg, Va., College of William and Mary, Department of Geol-ogy Guidebook 2, 33 p.
Johnson, G.H., 1976, Geology of the Mulberry Island, New-port News North, and Hampton quadrangles, Virginia: Virginia Division of Mineral Resources Report of Investi-gation 41, 72 p.
Johnson, G.H., Kruse, S.E., Vaughn, A.W., Lucey, J.K., Hobbs, III, C.H., and Powars, D.S., 1998, Post-impact deformation associated with the late Eocene Chesapeake
Bay impact structure in southeastern Virginia: Geology,vol. 26, no. 6, p. 507-510.
Johnson, G.H., and Peebles, P.C., 1985, Guidebook to the Cenozoic geology of southeastern Virginia: National Marine Educators Conference, 48 p.
Johnson, G.H., Peebles, P.C., Otte, L.E., and Smith, B.J., 1985, The late Cenozoic geology of southeastern Virginand the Dismal Swamp: Eastern section American Assciation of Petroleum Geologist meeting, Field trip guidebook 1, 66 p.
Johnson, G.H., and Powars, D.S., 1996, Effects of ChesapeBay impact structure on late Cenozoic stratigraphic sequences and landscapes, southeastern Virginia [absGeological Society of America, Abstracts with Programv. 28, no. 7, p. A-119.
Johnson, G.H., Powars, D.S., Bruce, S., Vaughn, A.W., LucJ.K., and Kruse, S.E., 1998, Relationship of Yorktown Formation lithofacies to post-impact deformation on theterrace zone, southeastern Virginia [abs.]: Geological Society of America, Abstracts with Program, Southeasern Section meeting, March 30-31, 1998.
Johnson, G.H., and Ramsey, K., 1987, Geology and geomophology of the York-James Peninsula, Virginia: AtlanticCoastal Plain Geological Association, 1987 meeting, Clege of William and Mary, Williamsburg, Virginia, Guide-book, 69 p.
Johnson, G.H., Ward, L.W., and Peebles, P.C., 1987, Stratiphy and paleontology of Pliocene and Pleistocene depits of southeastern Virginia, in Whittecar, G.R., ed., Geological Excursions in Virginia and North Carolina: Geological Society of America, Southeastern Section, 36th Annual Meeting, 1987, Guidebook, Field Trips nos1-7, p. 189-218.
Koeberl, C., Poag, W.C., Reimold, W.U., and Brandt, D., 1996, Impact origin of the Chesapeake Bay structure athe source of the North American tektites: Science, v. 271, p. 1263-1266.
Laczniak, R.J., and Meng, A.A., III, 1988, Ground-water resources of the York-James Peninsula of Virginia: U.SGeological Survey Water-Resources Investigations Report 88-4059, 178 p.
Lefort, J.P., and Max, M. D., 1991, Is there Archean crust beneath Chesapeake Bay? Tectonics 10, p. 213-226.
Melosh, H.J., 1989, Impact cratering–a geologic process: NYork, Oxford University Press, 245 p.
Meng, A.A., III, and Harsh, J.F., 1988, Hydrogeologic framework of the Virginia Coastal Plain: U.S. Geological Sur-vey Professional Paper 1404-C, 82 p.
Mixon, R.B., Berquist, C.R., Newell, W.L., Johnson, G.H., Powars, D.S., Schindler, J.S., and Rader, E.K., 1989, Geological map and generalized cross sections of the Coastal Plain and adjacent parts of the Piedmont, Vir-ginia: U.S. Geological Survey Miscellaneous Investiga-tions Series Map I-2033, 2 sheets, scale 1:250,000.
46 The Effects of the Chesapeake Bay Impact Crater on the Geologic Framework and the Correlation of Hydrogeologic Units of Southeastern Virginia, South of the James River

:
er ,
o-al
t i-
sa-i-
n,
ake -
-
n: p..,
ks t r-
e :
s
Nerem, R.S., van Dam, T.M., and Schenewerk, M.S., 1998, Chesapeake Bay subsidence monitored as wetlands loss continues: EOS, American Geophysical Union Transac-tions, v. 79, no. 12, p. 149, 156–157.
Oaks, R.Q., and Coch, N.K., 1973, Post-Miocene stratigraphy and morphology, southeastern Virginia: Virginia Division of Mineral; Resources Bulletin 82, 135 p.
Owens, J.P., and Gohn, G.S., 1985, Depositional history of the Cretaceous Series in the U.S. Atlantic Coastal Plain–stratigraphy, paleoenvironments, and tectonic con-trols of sedimentation, in Poag, C.W., ed., Geologic evo-lution of the United States Atlantic Margin: New York, Van Nostrand Reinhold, p. 25-86.
Poag, C.W., 1996, Structural outer rim of Chesapeake Bay impact crater–seismic and borehole evidence: Meteoritics and Planetary Science, v. 31, p. 218-226.
Poag, C.W., 1997, The Chesapeake Bay bolide impact-a con-vulsive event in Atlantic Coastal Plain evolution, in Seagall, M.P., Colquhoun, D.J., and Siron, D., eds., Evo-lution of the Atlantic Coastal Plain-sedimentology, stratigraphy, and hydrogeology: Sedimentary Geology, v. 108, p. 45-90.
Poag, C.W., Powars, D.S., and Mixon, R.B., 1994, Convulsive events in Atlantic Coastal Plain evolution–effects of the Chesapeake Bay bolide impact [abs.]: Geological Society of America, Abstracts with Programs, v. 26, p. A-152.
Poag, W.C., Powars, D.S., Poppe, L.J., and Mixon, R.B., 1994, Meteoroid mayhem in Ole Virginny–source of the North American tektite strewn field: Geology, v. 22, p. 691-694.
Poag, C.W., Powars, D.S., Poppe, L.J., Mixon, R.B., Edwards, L.E., Folger, D.W., and Bruce, S., 1992, Deep Sea Drill-ing Project Site 612 bolide event—new evidence of a late Eocene impact-wave deposit and a possible impact site, U.S. East Coast: Geology, v. 20, p. 771-774.
Powars, D.S., and Bruce, T.S., 1999, The effects of the Chesa-peake Bay impact crater on the geological framework and correlation of hydrogeologic units of the lower York-James Peninsula, Virginia: U.S. Geological Survey Pro-fessional Paper 1612, 82 p., 7 pl.
Powars, D.S., Bruce, S., Poag, C.W., and Mixon, R.B., 1994, Virginia's coastal plain inland salt water wedge-a geohy-drological response to the Chesapeake Bay bolide impact [abs.]: Geological Society of America, Abstracts with Programs, v. 26, p. 410.
Powars, D.S., Johnson, G.H., and Bruce, T.S., 1998, Strati-graphic, structural, and hydrogeological complexities related to the outer rim of the Chesapeake Bay impact crater [abs.]: Geological Society of America, Abstracts with Programs, v. 30, No. 7.
Powars, D.S., Mixon, R.B., and Bruce, S., 1992, Uppermost Mesozoic and Cenozoic geologic cross section, outer coastal plain of Virginia, in Gohn, G.S., ed., Proceedings of the 1988 U.S. Geological Survey Workshop on the
Geology and Geohydrology of the Atlantic Coastal PlainU.S. Geological Survey Circular 1059, p. 85-101.
Powars, D.S., Mixon, R.B., Edwards, L.E., Andrews, G.W., and Ward, L.W., 1987, Evidence for Paleocene and lowEocene pinch-outs on the north flank of the Norfolk ArchEastern Shore of Virginia [abs.]: Geological Society of America, Abstracts with Programs, v. 26, p. 410.
Powars, D.S., Mixon, R.B., Edwards, L.E., Poag, W.C., andBruce, S., 1990, Cross section of Cretaceous and Cenzoic strata, Norfolk Arch to Salisbury Basin, outer coastplain of Virginia [abs.]: Geological Society of America, Abstracts with Programs, v. 22, p. 57.
Powars, D.S., Poag, C.W., and Bruce, S., 1991, UppermosMesozoic and Cenozoic stratigraphic framework of thecentral and outer coastal plain of Virginia [abs.]: Geologcal Society of America, Abstracts with Programs, v. 23,p. 117.
Powars, D.S., Poag, W.C., and Mixon, R.B., 1993, The Chepeake Bay "impact crater"–stratigraphic and seismic evdence [abs.]: Geological Society of America, Abstractswith Programs, v. 25, A-378.
Reinhardt, J., Christopher, R.A., Owens, J.P., 1980, Lower Cretaceous stratigraphy of the core, in Geology of the Oak Grove core: Virginia Division of Mineral ResourcesPublication 20, part 3, p. 31-52.
Riddle, P.C., Vaughn, A.W., Lucey, J.K., Kruse, S.E., JohnsoG.H., and Hobbs, C.H., 1996, Geophysical studies of near-surface deformation associated with the ChesapeBay impact structure, southeastern Virginia [abs.]: Geological Society of America, Abstracts with Programs, v.28, no. 7, A-119.
Robbins, E.I., Perry, W.J., Jr., and Doyle, J.A., 1975, Palynological and stratigraphic investigation of four deep wellsin the Salisbury embayment of the Atlantic Coastal PlaiU.S. Geological Survey Open-File Report 75-307, 120
Sheridan, R.E., Maguire, T.J., Feigenson, M.D., Patino, L.Cand Volkert, R.A., 1999, Grenville age of basement rocin Cape May NJ well: new evidence for Laurentian crusin U.S. Atlantic Coastal Plain basement Chesapeake terane: Journal of Geodynamics 27, p. 623-633.
Smith, B.S., 1999, The potential for saltwater intrusion in thPotomac aquifers of the York-James Peninsula, VirginiaU.S. Geological Survey Water-Resources InvestigationReport 98-4187, 24 p.
References Cited 47


APPENDIXES

79
2
6
6
0
0
Appendix 1. List of boreholes used in this report
[Altitudes are in feet; latitude and longitude are in degrees, minutes, and seconds; VDEQ, Virginia Department of Environmental Quality; VPI, Virginia Polytechnic Institute; VEPCO, Virginia Electric Power Company; --, local number not assigned]
Bore-hole loca-tion
number on
figure 3
Local number
Identifying name, owner, ororganization, and some references
Latitude LongitudeSurface altitude
Bottom altitude
1 58A2 VDEQ 36 34 08 76 35 00 58 –1,959
2 58A76 Dismal Swamp corehole (Powars and others,1992;unpub. data, D.S. Powars, USGS, and T.S. Bruce, VDEQ)
36 36 55 76 33 20 33 –1,827
3 61A15 City of Chesapeake-Northwest River Water Treatment Plant
36 34 50 76 12 10 10 –1,769
4 62A4 VPI geothermal well # C32 36 36 25 76 00 26 7 –1,014
5 57B6 City of Suffolk 36 42 48 76 39 13 55 –662
6 58B270 VDEQ, Kilby 36 43 20 76 36 55 26 –674
7 58B115 City of Suffolk, City farm 1 36 44 52 76 35 14 30 –986
8 58B11 NAN-P-8 (Brown and others, 1972) 36 44 28 76 33 32 20 –654
9 60B1 Clay Bank Motorlodge (Cederstrom, 1945a) 36 38 11 76 22 22 17 –6
10 60B3 VDEQ 36 38 40 76 20 20 16 –984
11 60B2 CHE-P-5 (Brown and others, 1972) 36 41 49 76 20 19 14 –806
12 61B11 Fentress corehole (Powars and others, 1992; unpub. data, D.S. Powars, USGS and T.S. Bruce, VDEQ)
36 42 27 76 07 47 15 –2,005
13 57C17 City of Norfolk, Lake Prince 4 (Cederstrom) 36 48 10 76 39 21 30 –88
14 58C7 City of Norolk, Lake Prince 1 (Cederstrom) 36 48 38 76 37 09 43 –90
15 58C48 City of Norfolk, Well #80 (Cederstrom, 1945a) 36 48 52 76 37 30 54 –92
16 58C10 City of Suffolk, Well #1 36 46 05 76 32 24 24 –611
17 58C5 Well #37 (Cederstrom, 1945a) Drivers-Monogram Farm 36 49 04 76 32 50 20 –520
18 58C51 City of Norfolk, DR Well #1 36 49 00 76 33 10 20 –1,040
19 58C6 Well #8 (Cederstrom, 1945a) Chuckatuck-Cedarbrook Farm
36 51 16 76 33 26 15 –535
20 58C8 Nimmo Well, Chuckatuck, Va. 36 52 18 76 31 30 22 –563
21 59C39 MW4-1 corehole (Powars and others, 1992); Chesapeake-Portsmouth Airport (this report)
36 47 10 76 26 52 17 –983
22 59C28 City of Chesapeake-Bowers Hill-production well #1 36 47 02 76 24 55 21 –979
23 59C2 Virginia Division of Forestry 36 48 08 76 23 15 20 –633
24 59C40 VPI geothermal well #25 36 51 01 76 28 49 22 –1,978
25 59C13 Tidewater Water Co., NAN-P-13 (Brown and others, 1972)
36 52 18 76 27 47 16 –639
26 60C40 City of Chesapeake IW1 36 47 00 76 22 00 20 –95
27 60C6 Lone Star Cement Corp. 36 48 53 76 17 09 5 –790
28 60C7 City of Portsmouth 36 51 15 76 19 17 10 –1,144
29 60C25 Campbell Soup Co., Well #1 36 51 30 76 18 30 5 –90
30 -- Well #9 (Cederstrom, 1945a) Lamberts Point-Norfolk & Western Railway Co.
36 52 26 76 18 56 10 –606
31 -- Well #20 (Cederstrom, 1945a) Moores Bridge 36 52 21 76 12 13 10 –1,730
32 61C1 NOR-T-12 (Brown and others, 1972) 36 52 23 76 12 21 15 –2,563
33 62C5 VDEQ 36 47 15 76 03 15 14 –386
34 62C4 VDEQ 36 47 11 76 06 01 13 –387
35 62C2 VDEQ 36 47 15 76 03 08 14 –386
36 63C1 VB-P-3 (Brown and others, 1972) 36 52 00 75 58 51 5 –1,583
50 The Effects of the Chesapeake Bay Impact Crater on the Geologic Framework and the Correlation of Hydrogeologic Units of Southeastern Virginia, South of the James River
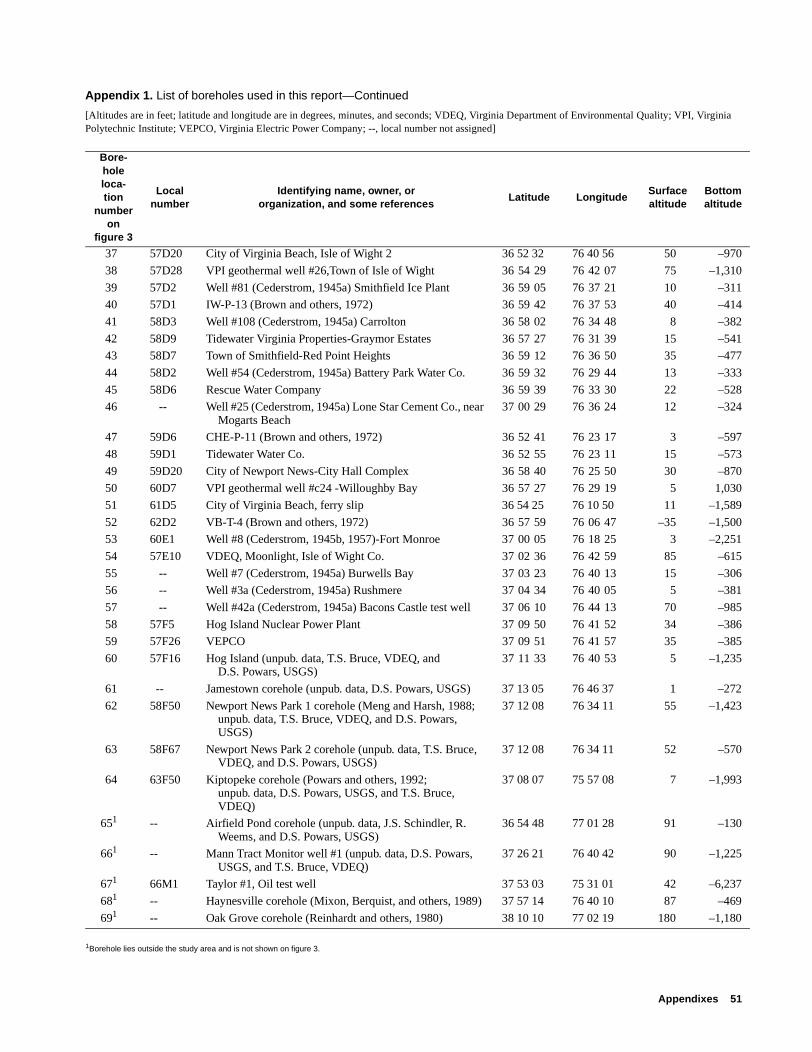
2
37 57D20 City of Virginia Beach, Isle of Wight 2 36 52 32 76 40 56 50 –970
38 57D28 VPI geothermal well #26,Town of Isle of Wight 36 54 29 76 42 07 75 –1,310
39 57D2 Well #81 (Cederstrom, 1945a) Smithfield Ice Plant 36 59 05 76 37 21 10 –311
40 57D1 IW-P-13 (Brown and others, 1972) 36 59 42 76 37 53 40 –414
41 58D3 Well #108 (Cederstrom, 1945a) Carrolton 36 58 02 76 34 48 8 –382
42 58D9 Tidewater Virginia Properties-Graymor Estates 36 57 27 76 31 39 15 –541
43 58D7 Town of Smithfield-Red Point Heights 36 59 12 76 36 50 35 –477
44 58D2 Well #54 (Cederstrom, 1945a) Battery Park Water Co. 36 59 32 76 29 44 13 –333
45 58D6 Rescue Water Company 36 59 39 76 33 30 22 –528
46 -- Well #25 (Cederstrom, 1945a) Lone Star Cement Co., near Mogarts Beach
37 00 29 76 36 24 12 –324
47 59D6 CHE-P-11 (Brown and others, 1972) 36 52 41 76 23 17 3 –597
48 59D1 Tidewater Water Co. 36 52 55 76 23 11 15 –573
49 59D20 City of Newport News-City Hall Complex 36 58 40 76 25 50 30 –870
50 60D7 VPI geothermal well #c24 -Willoughby Bay 36 57 27 76 29 19 5 1,030
51 61D5 City of Virginia Beach, ferry slip 36 54 25 76 10 50 11 –1,589
52 62D2 VB-T-4 (Brown and others, 1972) 36 57 59 76 06 47 –35 –1,500
53 60E1 Well #8 (Cederstrom, 1945b, 1957)-Fort Monroe 37 00 05 76 18 25 3 –2,251
54 57E10 VDEQ, Moonlight, Isle of Wight Co. 37 02 36 76 42 59 85 –615
55 -- Well #7 (Cederstrom, 1945a) Burwells Bay 37 03 23 76 40 13 15 –306
56 -- Well #3a (Cederstrom, 1945a) Rushmere 37 04 34 76 40 05 5 –381
57 -- Well #42a (Cederstrom, 1945a) Bacons Castle test well 37 06 10 76 44 13 70 –985
58 57F5 Hog Island Nuclear Power Plant 37 09 50 76 41 52 34 –386
59 57F26 VEPCO 37 09 51 76 41 57 35 –385
60 57F16 Hog Island (unpub. data, T.S. Bruce, VDEQ, and D.S. Powars, USGS)
37 11 33 76 40 53 5 –1,235
61 -- Jamestown corehole (unpub. data, D.S. Powars, USGS) 37 13 05 76 46 37 1 –27
62 58F50 Newport News Park 1 corehole (Meng and Harsh, 1988; unpub. data, T.S. Bruce, VDEQ, and D.S. Powars, USGS)
37 12 08 76 34 11 55 –1,423
63 58F67 Newport News Park 2 corehole (unpub. data, T.S. Bruce, VDEQ, and D.S. Powars, USGS)
37 12 08 76 34 11 52 –570
64 63F50 Kiptopeke corehole (Powars and others, 1992;unpub. data, D.S. Powars, USGS, and T.S. Bruce,VDEQ)
37 08 07 75 57 08 7 –1,993
651 -- Airfield Pond corehole (unpub. data, J.S. Schindler, R. Weems, and D.S. Powars, USGS)
36 54 48 77 01 28 91 –130
661 -- Mann Tract Monitor well #1 (unpub. data, D.S. Powars, USGS, and T.S. Bruce, VDEQ)
37 26 21 76 40 42 90 –1,225
671 66M1 Taylor #1, Oil test well 37 53 03 75 31 01 42 –6,237
681 -- Haynesville corehole (Mixon, Berquist, and others, 1989) 37 57 14 76 40 10 87 –469
691 -- Oak Grove corehole (Reinhardt and others, 1980) 38 10 10 77 02 19 180 –1,180
Appendix 1. List of boreholes used in this report—Continued
[Altitudes are in feet; latitude and longitude are in degrees, minutes, and seconds; VDEQ, Virginia Department of Environmental Quality; VPI, Virginia Polytechnic Institute; VEPCO, Virginia Electric Power Company; --, local number not assigned]
Bore-hole loca-tion
number on
figure 3
Local number
Identifying name, owner, ororganization, and some references
Latitude LongitudeSurface altitude
Bottom altitude
1Borehole lies outside the study area and is not shown on figure 3.
Appendixes 51

52 Teaste
mpilation of cross section B–B' ;
St. arys Fm.
East-overFm.
York-townFm.
Pleisto-cene beds
122 –22 8 60
167 –27 15 33
306 –170 –30 10
318 ?–183 ?–60 7
118 ?–24 6 26
127 ?–20 8 30
202 ?–50 –2 20
205 ? ?–39 17
222 ? ?–44 16
198 ? ?–43 14
346 –172 –65 15
110 ?–8 18 30
143 ?–21 ?21 43
140 ?–10 ?–28 54
156 ?–57 ?–6 24
? ? ?–25 8
120 ? ?–30 20
nd nd nd 15
152 ?–60 ?2 22
186 –43 –24 17
186 –45 6 21
227 ?–77 ? 20
166 ?–28 *–5 22
194 ? –7 16
242 ? ? 20
275 ?–143 ?–30 5
254 ?–96 ?–25 10
255 ?–103 ? –15
254 ? –7 10
250 ? ?–75 10
275 ?–140 ?–72 15
nd ?–171 ?–39 14
nd ?–172 ?–27 13
nd ?–174 ?–45 14
435 ?–190 ? 5
he E
ffects of th
e Ch
esapeake B
ay Imp
act Crater o
n th
e Geo
log
ic Fram
ewo
rk and
the C
orrelatio
n o
f Hyd
rog
eolo
gic U
nits o
f So
uth
-rn
Virg
inia, S
ou
th o
f the Jam
es River
Appendix 2. Altitudes of the tops of stratigraphic units
[Altitudes are in feet; ?, unit present, contact uncertain; --, unit not present; nd, no data available; ??, insufficient data; *, contact extrapolated from coFm., Formation]
Bore-hole loca-tion
number on
figure 3
Potomac Fm.
Upper Cenom-
anianbeds
Glauc-oniticsandunit
Redbeds
Aquia Fm.
Marlboro Clay
Nan-jemoy Fm.
Piney PointFm.
Exmore tsunami-breccia deposit
Chicka-hominy
Fm.
Del-marva beds
Old Church
Fm.
Calvert Fm.
Newport News unit
Calvert Fm. M
1 –589 –438 –339 –292 –262 –252 –242 -- -- -- -- -- -- -- –2 –560 –418 –361 –308 –289 –273 –269 -- -- -- -- -- -- -- –
3 –1,057 –845 ?–795 ?–715 ?–584 ?–570 ?–555 -- -- -- ?–540 ?? ?? ?–521 ?–
4 nd –985 –922 –815 ?–771 ?–754 ?–738 -- -- -- ?–721 ?? ?? ?? ?–
5
6 –452 –294 -- -- ?–279 ?–268 ?–231 -- -- -- -- ?? ?? -- ?–
7 –448 –324 -- -- –306 –290 –260 -- -- -- -- -- ?–233 -- ?–
8 –550 ?–378 -- -- ?–365 ?–352 ?–340 -- -- -- -- -- ?? ?? ?–
9 nd ?–599 –543 –495 –432 –420 –408 -- -- -- -- -- ?? ?–346 –
10 –808 –644 –602 –504 –471 –452 –441 -- -- -- ?? -- ?? ?–390 –
11 –728 –626 -- –564 –508 –500 –464 -- -- -- ?? -- ?? ?–416 –
12 –1,035 –836 –778 –687 –645 –635 –620 -- -- -- –612 -- -- –600 –
13 –375 –294 -- -- –254 –242 ?–215 -- -- -- -- -- -- -- ?–
14 ?–365 ?–313 -- -- ?–287 ?–267 ?–253 -- -- -- -- -- -- -- ?–
15 –373 ?–318 -- -- ?–286 –269 –241 -- -- -- -- -- -- ?? ?–
16 –458 ?–346 -- -- ?–326 ?–300 ?–282 -- -- -- -- -- ?? ?? ?–
17 –489 –334 -- -- ?? ?–295 ?–285 -- -- -- ? ? –271 --
18 –454 –336 -- -- –320 ?–297 ?–269 -- -- -- -- -- ?? ?? ?–
19 –535 –415 -- -- ?–365 ? ? -- -- -- nd nd nd nd
20 ?–410 ?–313 -- -- ?–278 ?–268 ?–260 -- ?? ?? ?? ?? ?? ?? ?–
21 –540 –397 -- -- –384 –372 –350 -- -- -- -- ?? –339 –325 –
22 –526 –407 –386 –378 –367 -- -- -- ? ? –349 –330 –
23 –534 ?–446 ?–423 ?–388 –366 ?–352 ?? -- -- -- ?? ?? ?? ?? ?–
24 *–486 –378 -- -- –342 –333 –316 -- -- -- ?? ?? ?? ?–281 ?–
25 –467 ?–391 -- -- ?–360 ?–347 ?–344 -- ?? ?? ?? ?? ?–334 ?–304 ?–
26 –604 –449 -- -- –433 –415 –382 -- -- -- ?? ?? ?? ?? ?–
27 ?–735 ?–572 -- -- ?–525 ?–511 ?–495 -- 27 17 ?? ?? ?? ?–459 –
28 ?–640 –487 -- -- –453 –448 –430 -- ?? ?? ?? ?? ?–418 ?–403 ?–
29 ?–610 –515 -- -- –475 –462 –450 -- ?? ?? ?? ?? ?–439 ?–409 ?–
30 nd ?–524 -- -- ?? ?? ?? -- ?–397 ?–387 ?? ?? ?? ?? ?–
31 ?–775 –705 -- -- -- -- -- -- ?–655 ?–625 ?–615 ?? ? ? ?–
32 ?–777 ?–701 -- -- -- -- -- -- ?–650 ?–610 ?–606 ?? ?–595 ?–540 ?–
33 nd nd nd nd nd nd nd nd nd nd nd nd nd nd
34 nd nd nd nd nd nd nd nd nd nd nd nd nd nd
35 nd nd nd nd nd nd nd nd nd nd nd nd nd nd
36 –1,110 ?–949 -- ?–859 -- -- -- -- ?? ?? ?? ?? ?? ?–700 –

Ap
pen
dixes 53
–100 ? ?40 50
?–97 ?–27 ?45 75
nd nd nd nd
0 ?–124 ?–36 ?18 ?40
nd nd nd nd
–182 –43 15 --
–144 –40 –4 35
nd nd nd nd
–149 –34 22 --
nd nd nd nd
3 –227 ? ? 3
4 –210 ? ? 15
–228 –35 12 30
–240 –85 –15 5
?–317 ?–177 ?–51 11
? –290 ? –160 ? –35
–292 –95 –47 ?3
–172 ?–3 ?27 85
nd nd nd nd
nd nd nd nd
–105 ?–18 49 70
–92 –66 -- 34
?–106 ? ? 35
–125 ?? -- –15
–55 –24 -- –14
–127 –19 25 52
–455 –189 –74 7
pilation of cross section B–B' ;
t. rys m.
East-overFm.
York-townFm.
Pleisto-cene beds
37 ?–363 ?–251 -- -- –226 –212 ?–180 -- -- -- -- -- -- --
38 –375 –263 -- -- –231 –220 –190 -- -- -- -- -- ?? ?–172
39 ?? –280 -- -- ? ? ?–230 -- -- -- nd nd nd nd
40 –356 ?–300 -- -- ?–258 ?–238 ?–218 ?? ?? ?? ?? ?? ?? ?–21
41 ?? ?–325 -- ?–252 ? ? ? nd nd nd nd nd nd nd
42 ?–425 ?–298 -- -- –280 –262 –245 -- ?? ?? ?? ?–241 ?–235 ?
43 ?–352 ?–247 -- -- –227 –219 ?–216 -- ?? ?? ?? ?? ?? ?
44 ?? ?–297 -- –272 –247 ? ? nd nd nd nd nd nd nd
45 ?–418 ?–305 -- –276 –255 –246 –208 -- -- -- nd ? ?–191 ?
46 ?? ?–283 -- -- –253 ? ? nd nd nd nd nd nd nd
47 ?–568 ?–433 -- -- ?–413 ?–405 ?–398 -- ?? ?? ?? ?? ?? ?–37
48 ?–540 ?–423 -- -- ?–390 ?–385 ?–379 -- ?? ?? ?? ?? ?–367 ?–34
49 –700 -- -- -- -- -- -- -- –574 –410 –392 –378 –368 –323
50 nd -- -- -- -- -- -- -- –769 –654 –623 –613 –603 –540
51 -- -- -- -- -- -- -- -- –925 –739 ? ?–709 ?–698 –647
52 -- -- -- -- -- -- -- -- ?–910 –830 ? ? –810 ?–508
53 ?? -- -- -- -- -- -- -- –837 –637 ?–628 ?–618 –607 ?–400
54 ?–265 ?–232 -- -- ?–215 ?–204 ?–175 -- -- -- -- -- -- --
55 –290 -- -- -- ? ? –245 nd nd nd nd nd nd nd
56 ?–355 ?–295 -- -- ? ? –225 -- -- -- ? ? ?–214 nd
57 –334 –250 -- -- –231 ? ? ? -- -- ? –169 –167 --
58 –333 -- -- -- –270 –254 –212 –205 -- -- –196 –187 –168 ? –162
59 ?–355 -- -- -- ?–293 ?–277 –223 ?–218 -- -- ?? ?? ?? ??
60 –330 -- -- -- –300 –286 –232 –215 -- -- ? –200 –185 –166
61 –258 -- -- -- –217 –203 –159 –152 -- -- -- –139 –120 ?–115
63 –411 -- -- -- -- -- -- -- –357 –323 –308 –293 –279 –216
64 -- -- -- -- -- -- -- -- –1,279 –1.077 –1,063 -- ?–1,028 –613
Appendix 2. Altitudes of the tops of stratigraphic units—Continued
[Altitudes are in feet; ?, unit present, contact uncertain; --, unit not present; nd, no data available; ??, insufficient data; *, contact extrapolated from comFm., Formation]
Bore-hole loca-tion
number on
figure 3
Potomac Fm.
Upper Cenom-anianbeds
Glauc-oniticsandunit
Redbeds
Aquia Fm.
Marlboro Clay
Nan-jemoy Fm.
Piney PointFm.
Exmore tsunami-breccia deposit
Chicka-hominy
Fm.
Del-marva beds
Old Church
Fm.
Calvert Fm.
Newport News unit
Calvert Fm.
SMaF

Selected Series of U.S. Geological Survey Publications
Books and Other Publications
Professional Papers report scientific data and interpretations of lasting scientific interest that cover all facets of USGS inves-tigations and research.
Bulletins contain significant data and interpretations that are of lasting scientific interest but are generally more limited in scope or geographic coverage than Professional Papers.
Water-Supply Papers are comprehensive reports that present significant interpretive results of hydrologic investigations of wide interest to professional geologists, hydrologists, and engi-neers. The series covers investigations in all phases of hydrol-ogy, including hydrogeology, availability of water, quality of water, and use of water.
Circulars are reports of programmatic or scientific information of an ephemeral nature; many present important scientific information of wide popular interest. Circulars are distributed at no cost to the public.
Fact Sheets communicate a wide variety of timely information on USGS programs, projects, and research. They commonly address issues of public interest. Fact Sheets generally are two or four pages long and are distributed at no cost to the public.
Reports in the Digital Data Series (DDS) distribute large amounts of data through digital media, including compact disc-read-only memory (CD-ROM). They are high-quality, interpre-tive publications designed as self-contained packages for view-ing and interpreting data and typically contain data sets, software to view the data, and explanatory text.
Water-Resources Investigations Reports are papers of an interpretive nature made available to the public outside the for-mal USGS publications series. Copies are produced on request (unlike formal USGS publications) and are also available for public inspection at depositories indicated in USGS catalogs.
Open-File Reports can consist of basic data, preliminary reports, and a wide range of scientific documents on USGS investigations. Open-File Reports are designed for fast release and are available for public consultation at depositories.
Maps
Geologic Quadrangle Maps (GQ’s) are multicolor geologic maps on topographic bases in 7.5- or 15-minute quadrangle formats (scales mainly 1:24,000 or 1:62,500) showing bedrock, surficial, or engineering geology. Maps generally include brief texts; some maps include structure and columnar sections only.
Geophysical Investigations Maps (GP’s) are on topographic or planimetric bases at various scales. They show results of geophysical investigations using gravity, magnetic, seismic, or radioactivity surveys, which provide data on subsurface struc-tures that are of economic or geologic significance.
Miscellaneous Investigations Series Maps or Geologic Investigations Series (I’s) are on planimetric or topographic bases at various scales; they present a wide variety of format and subject matter. The series also incudes 7.5-minute quadran-gle photogeologic maps on planimetric bases and planetary maps.
Information Periodicals
Metal Industry Indicators (MII’s) is a free monthly newslet-ter that analyzes and forecasts the economic health of five metal industries with composite leading and coincident indexes: primary metals, steel, copper, primary and secondary aluminum, and aluminum mill products.
Mineral Industry Surveys (MIS’s) are free periodic statistical and economic reports designed to provide timely statistical data on production, distribution, stocks, and consumption of significant mineral commodities. The surveys are issued monthly, quarterly, annually, or at other regular intervals, depending on the need for current data. The MIS’s are pub-lished by commodity as well as by State. A series of interna-tional MIS’s is also available.
Published on an annual basis, Mineral Commodity Summa-ries is the earliest Government publication to furnish estimates covering nonfuel mineral industry data. Data sheets contain information on the domestic industry structure, Government programs, tariffs, and 5-year salient statistics for more than 90 individual minerals and materials.
The Minerals Yearbook discusses the performance of the worldwide minerals and materials industry during a calendar year, and it provides background information to assist in inter-preting that performance. The Minerals Yearbook consists of three volumes. Volume I, Metals and Minerals, contains chap-ters about virtually all metallic and industrial mineral commod-ities important to the U.S. economy. Volume II, Area Reports: Domestic, contains a chapter on the minerals industry of each of the 50 States and Puerto Rico and the Administered Islands. Volume III, Area Reports: International, is published as four separate reports. These reports collectively contain the latest available mineral data on more than 190 foreign countries and discuss the importance of minerals to the economies of these nations and the United States.
Permanent Catalogs
“Publications of the U.S. Geological Survey, 1879–1961” and “Publications of the U.S. Geological Survey, 1962–1970” are available in paperback book form and as a set of microfiche.
“Publications of the U.S. Geological Survey, 1971–1981” is available in paperback book form (two volumes, publications listing and index) and as a set of microfiche.
Annual supplements for 1982, 1983, 1984, 1985, 1986, and subsequent years are available in paperback book form.

St. Marys
Upperand
lowerYorktown
TE
RT
IAR
Y
SYSTEMAND SERIES
FORMATION OREQUIVALENT
DISMAL SWAMP COREHOLE (2)
QUATERNARY Pleist.
Pliocene
Shirley
Eastover
Upper
Mio
cen
e
Nanjemoy7
Marlboro ClayAquia8
Brightseat
LowerEocene
LowerUpperPaleocene
Upper
Red beds
Glauconitic sand unit
Upper Cenomanian beds
CR
ET
AC
EO
US
Lower Potomac
Upper
Jurassic-Triassic (?) rift basin rocks
Total depth = -1,827 feet
x
x
x
x
SP 64"16"
-1,700
-1,800
LITHOLOGY1 Altitude, in feet
GAMMA-RAY LOG
N18–N209
FORAM.2
ZONE
N239
N17–N189
N16
P6bP6a?P5P1c
Not
zon
ed-100
-200
-400
-300
-500
-600
-700
-800
-900
-1,000
-1,100
-1,200
-1,300
-1,400
Sealevel
33
-1,500
-1,600
DINOCYSTS5
POLLEN3
ZONE
zone IV
zone V
?
zone III?
zone II
zone I?
SPONTANEOUS POTENTIAL AND
RESISTIVITY LOGS
Not
zon
ed
OSTRA-6
CODES
Orionina vaughani AZ
Pterygocythererisinexpectata AZ
DIATOMS4
AND
YorktownFormation
(?)YorktownFormation
Barren ofdiatoms
Barren ofdiatoms
PaleoceneEarly
Paleocene-Eoceneboundary
EoceneEarly
Miocene
SYSTEMAND SERIES FORMATION OR EQUIVALENT LITHOLOGY1 GAMMA-RAY LOG
FENTRESS COREHOLE (12)
QU
ATE
RN
AR
Y
Ple
isto
cene
Upper Tabb
Chowan River (?)Upper
Upperand
lowerPlio
cene
Yorktown
Eastover
TE
RT
IAR
Y
Mio
cene
St. Marys C
RE
TA
CE
OU
S
Middle Calvert Delmarva beds
Nanjemoy Marlboro Clay
Aquia ?
LowerLower
OligoceneEocene
Paleocene Upper
?
Red beds
Glauconitic sand unit
Upper Cenomanian beds
Upper
Lower
Potomac
N178
N17–N188
N18–N208
N218
N238
N13–N14P20P9
P6a
P5
?
Not
zon
ed
P4
Upp
er
-900
-200
-400
-300
-500
-600
-700
-800
-1,000
-1,100
-1,200
-1,300
-1,400
Altitude,in feet
-100
Sealevel
FORAM.2
ZONEDINO-4
CYSTSPOLLEN3
ZONE
-1,500
-1,600
-1,700
-1,800
-1,900
early Oligocene
early Eocene
barrenlate Paleocene
near Eocene-Paleoceneboundary
barrenzone V
zone IV
zone IV
zone III
zone III
barren
barren
barren
barren
barren
15
16"64"SP
SPONTANEOUS POTENTIAL AND
RESISTIVITY LOGS
Not
zon
ed
16"
?
Total depth = -2,005 feet
7
6
OSTRA-5
CODES
-No diagnosticostracodes
X
Orionina vaughani AZ
? Pteerygocythereis inexpectata AZ
CHESAPEAKE NORTHWEST RIVER WTP BOREHOLE (3)
EastoverFormation
Not sampled
Not sampled
Not sampled
<<
<<
<
<
<
<<
<
<
<<
<<
MPR
MPR
SYSTEMAND SERIES
FORMATION OR EQUIVALENT LITHOLOGY
10GAMMA-RAY LOG
QU
AT
ER
-
NA
RY
Pleistocene and(or) Upper Pliocene
Upperand
lowerPlio
cene
Yorktown
Eastover
TE
RT
IAR
Y
Mio
cene
St. Marys
CR
ET
AC
EO
US
Middle Calvert
Delmarva bedsNanjemoy
Marlboro Clay
Aquia
Clayey silty quartz sand unit
Lower
Lower
Oligocene
Eocene
Paleocene Upper
Red beds
Glauconitic sand unit
Upper Cenomanian beds
Upper
Lower
Potomac
Upp
er
-900
-200
-400
-300
-500
-600
-700
-800
-1,000
-1,100
-1,200
-1,300
-1,400
Altitude, in feet
-100
Sealevel
-1,500
-1,600
-1,700
Glauconitic quartz sand unit
Organic-rich clay unit?
Chowan River (?)
SPONTANEOUS POTENTIAL AND
RESISTIVITY LOGS
Upper Cretaceousand (or)
Paleocene (?)
Total depth = -1,769 feet
SP64"
16"
MPRTabb 10
SPR
6 Cronin, T., USGS, writtencommun., 1995
7 Potopaco Member
8 Paspotansa Member
9 Extrapolated from regionalcorrelation including strontiumisotope data.
10 Lithology shown is a generalized summary based on a combination of lithic and geophysical data from several boreholes at the Northwest River Water Treatment Plant (WTP) site. Multipoint (16- and 64-inch) and spontaneous potential (SP) logs come from borehole 3 (61A15). The gamma log comes from borehole 61A18. Cuttings descriptions from borehole 61A15 and 61A18 were used from the surface down to - 990 ft. Core descriptions from borehole 61A16 were used from -990 to-1,524 ft. Drillers logs from borehole 61A2 were also used, especially for the interpretation shown for the base of the Tertiary. The geophysical logs guided a very generalized interpretation from -1,524 to -1,769 ft.
EXPLANATION
x
AZ
SPONTANEOUS POTENTIAL LOG—Negative to the left, positive to the right
SINGLE-POINT RESISTANCE LOG—Resistance increases to the right
MULTIPOINT RESISTIVITY LOG—16- and 64-inch multipoint resistivity log
FORAMINIFERA NEOGENE ZONE
FORAMINIFERA PALEOGENE ZONE
ASSEMBLAGE ZONE
DIATOM SAMPLE
DINOCYST SAMPLE
POLLEN SAMPLE
SP
MPR
+
SPR
<
P
N
CLAY
CLAYEY SILT
SANDY SILTY CLAY TOSANDY CLAYEY SILT
CLAYEY SILTY SAND
VERY FINEFINEMEDIUMCOARSE SAND
VERY COARSEGRANULES
PEBBLES
SHELLS
TURRITELLA
LIGNITIC MATERIAL
INDURATED LAYER (GENERALLY CALCITE CEMENTED)
BURROWED CONTACT
PALEOSOLS
SHARK TOOTH
LITHOLOGY
U.S. DEPARTMENT OF THE INTERIORU.S. GEOLOGICAL SURVEY
PREPARED IN COOPERATION WITH THEHAMPTON ROADS PLANNING DISTRICT COMMISSION
PROFESSIONAL PAPER 1622Stratigraphic columns of three key boreholes—PLATE 1
Powars, D.S., 2000, The effects of the Chesapeake Bay impact crater on the geologic frameworkand the correlation of hydrogeologic units of southeastern Virginia, south of the James River
STRATIGRAPHIC COLUMNS OF THREE KEY BOREHOLESBy
David S. Powars2000
1 Lithology shown is a generalized summarybased on cored intervals. Dismal Swampcontinuously cored down to -950 ft, andcored from -1,040 to -1,080 ft. Fentresscontinuously cored down to -1,109 ft, andcored from -1,275 to -1,375 ft and from -1,682 to -1,852 ft.
2 Gibson, T., formerly USGS, now withSmithsonian Institution, writtencommun., 1990
3 Frederiksen, N., USGS, writtencommun., 1999
4 Andrews, G., USGS, writtencommun., 1989
5 Edwards, L., USGS, writtencommun., 1989
Printed on recycled paper
VirginiaBeach
ChesapeakeSuffolk
Norfolk
0 2 4 6 8 10 MILES
0 2 4 6 8 10 KILOMETERS
James River
Lake
Drummond
Dis
mal
Sw
amp
Can
al
2
3
12
Study area
VIRGINIA
CHESAPEAKE BAY
NORTH CAROLINA
ATL
AN
TIC
OC
EA
N
OU
TER
RIM
OF CRATER
INNER
RIM
OFCRATER
76o30' 76o
37o
36o30'
Location map of coreholes and borehole
2EXPLANATION
Continuous corehole and numberBorehole and number3