Embed Size (px)
Citation preview
Chesapeake Business Plan Progress Report
National Fish and Wildlife Foundation
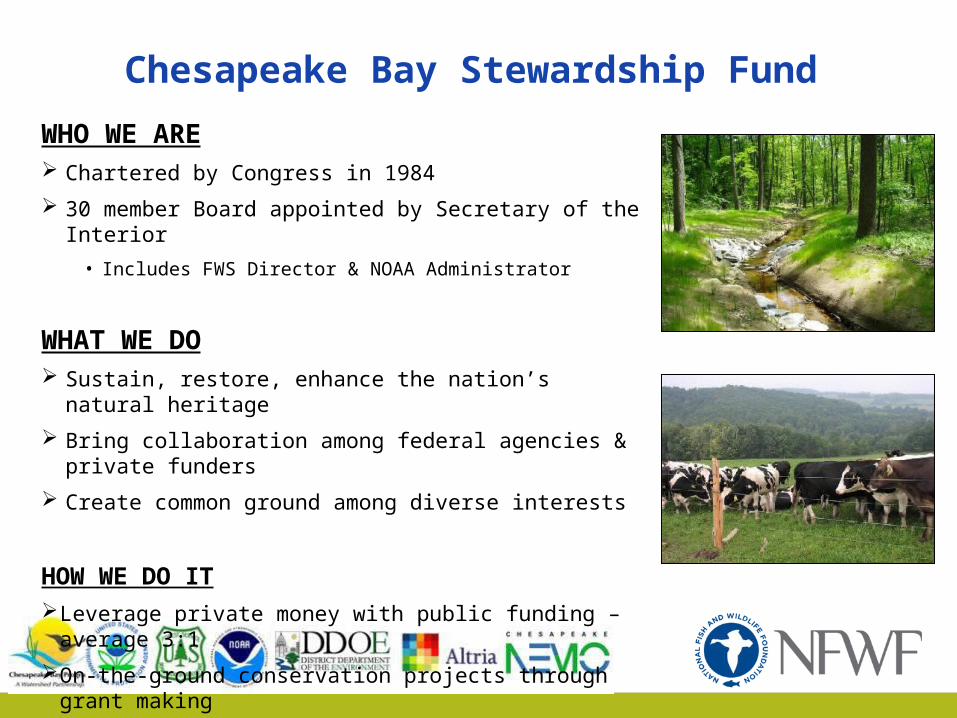
Chesapeake Bay Stewardship Fund
WHO WE ARE Chartered by Congress in 1984
30 member Board appointed by Secretary of the Interior
• Includes FWS Director & NOAA Administrator
WHAT WE DO Sustain, restore, enhance the nation’s natural
heritage
Bring collaboration among federal agencies & private funders
Create common ground among diverse interests
HOW WE DO ITLeverage private money with public funding –
average 3:1
On-the-ground conservation projects through grant making
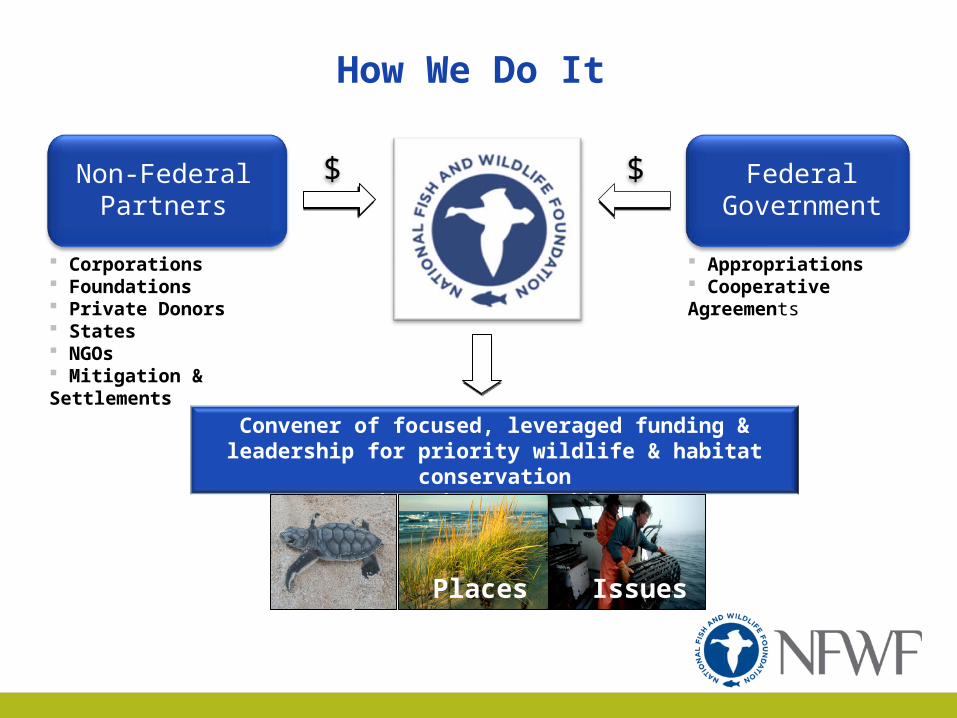
$ $
Convener of focused, leveraged funding & leadership for priority wildlife & habitat
conservationthrough grant making
Corporations Foundations Private Donors States NGOs Mitigation & Settlements
Appropriations Cooperative Agreements
Species Issues
Non-Federal Partners
Federal Governmen
t
Places
How We Do It
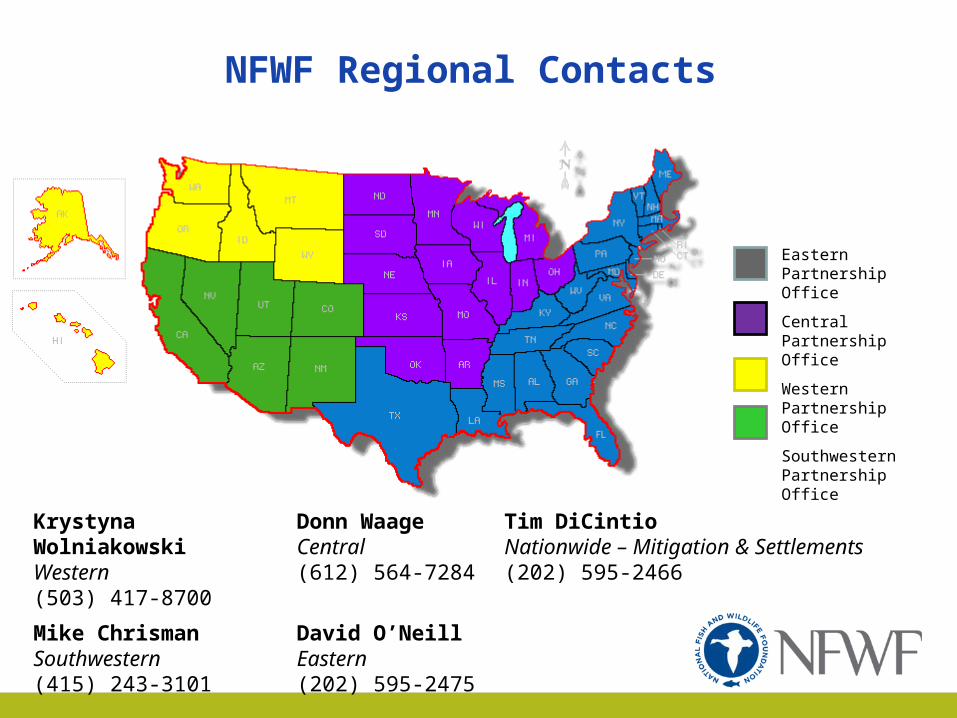
Krystyna WolniakowskiWestern(503) 417-8700
Donn WaageCentral(612) 564-7284
Tim DiCintioNationwide – Mitigation & Settlements(202) 595-2466
Mike ChrismanSouthwestern(415) 243-3101
David O’NeillEastern(202) 595-2475
Eastern Partnership Office
Central Partnership Office
Western Partnership Office
Southwestern Partnership Office
NFWF Regional Contacts

NFWF Grant Leverage FY 1984-2011
Trend
Overview of NFWF Funds Invested
FY2010 FY2011 FY 1984-2011Federal $40.4 million $45.9 million $575.9 millionNon-Federal $20.6 million $16.5 million $228.4 millionGrantee Match $118.2 million $67.7 million $1.2 billionTotal Funds Invested $179.2 million $130 million $1.95 billion
# of Grants Awarded 417 569 11,603
Our Results
Current Federal Partners

Corporate and Foundation Partners
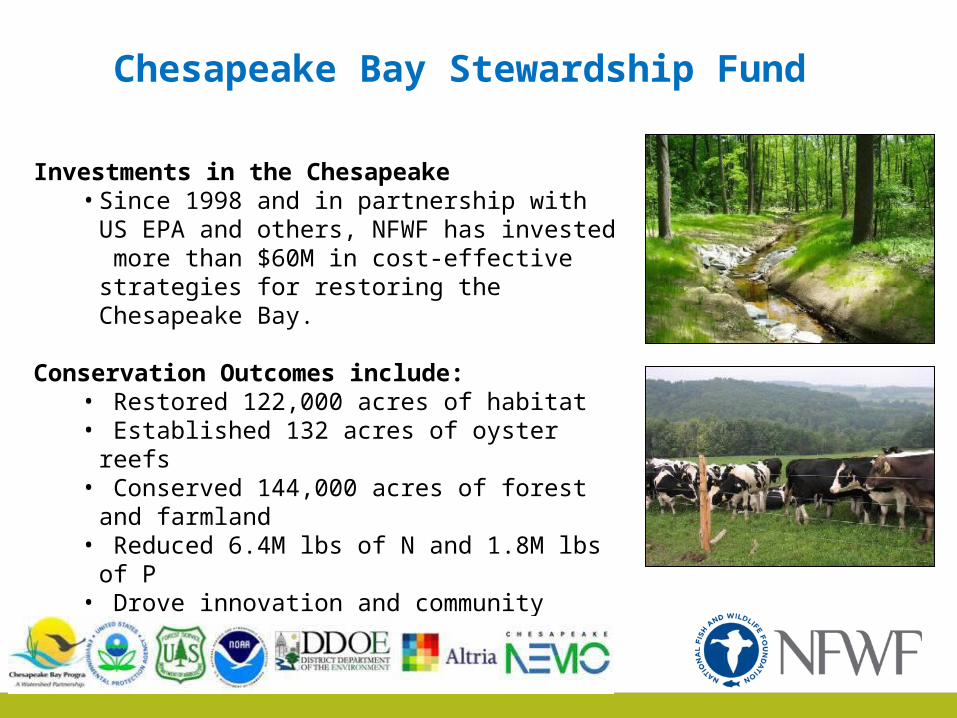
Chesapeake Bay Stewardship Fund
Investments in the Chesapeake• Since 1998 and in partnership with US
EPA and others, NFWF has invested more than $60M in cost-effective strategies for restoring the Chesapeake Bay.
Conservation Outcomes include: • Restored 122,000 acres of habitat • Established 132 acres of oyster reefs • Conserved 144,000 acres of forest and
farmland • Reduced 6.4M lbs of N and 1.8M lbs of P • Drove innovation and community
involvement
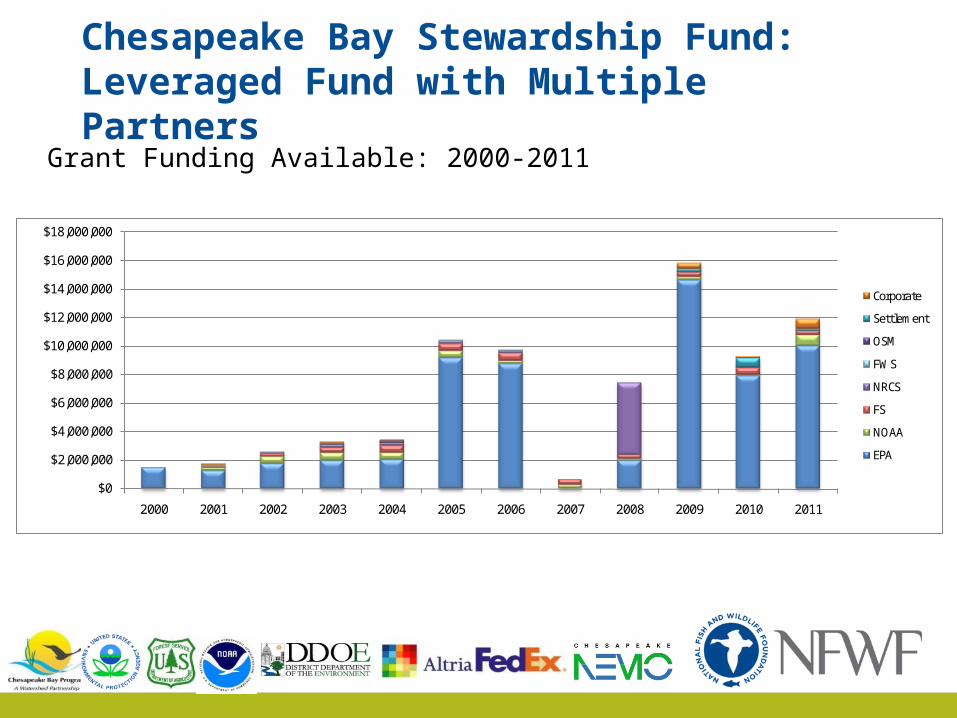
Grant Funding Available: 2000-2011
Chesapeake Bay Stewardship Fund:Leveraged Fund with Multiple Partners
$0
$2,000,000
$4,000,000
$6,000,000
$8,000,000
$10,000,000
$12,000,000
$14,000,000
$16,000,000
$18,000,000
2000 2001 2002 2003 2004 2005 2006 2007 2008 2009 2010 2011
Corporate
Settlement
OSM
FWS
NRCS
FS
NOAA
EPA
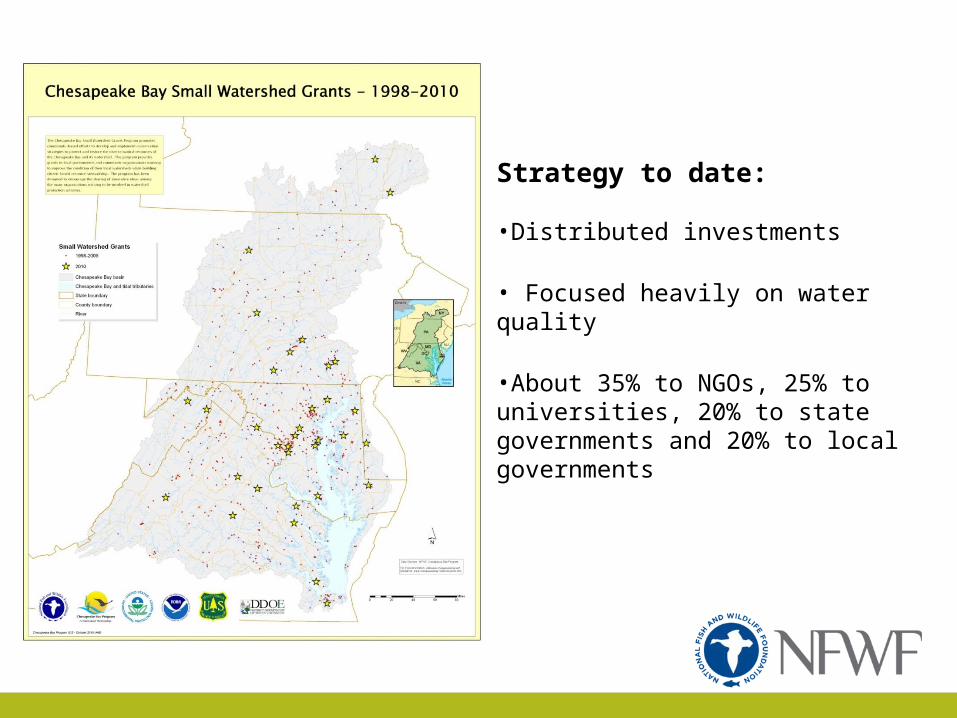
Strategy to date:
•Distributed investments
• Focused heavily on water quality
•About 35% to NGOs, 25% to universities, 20% to state governments and 20% to local governments
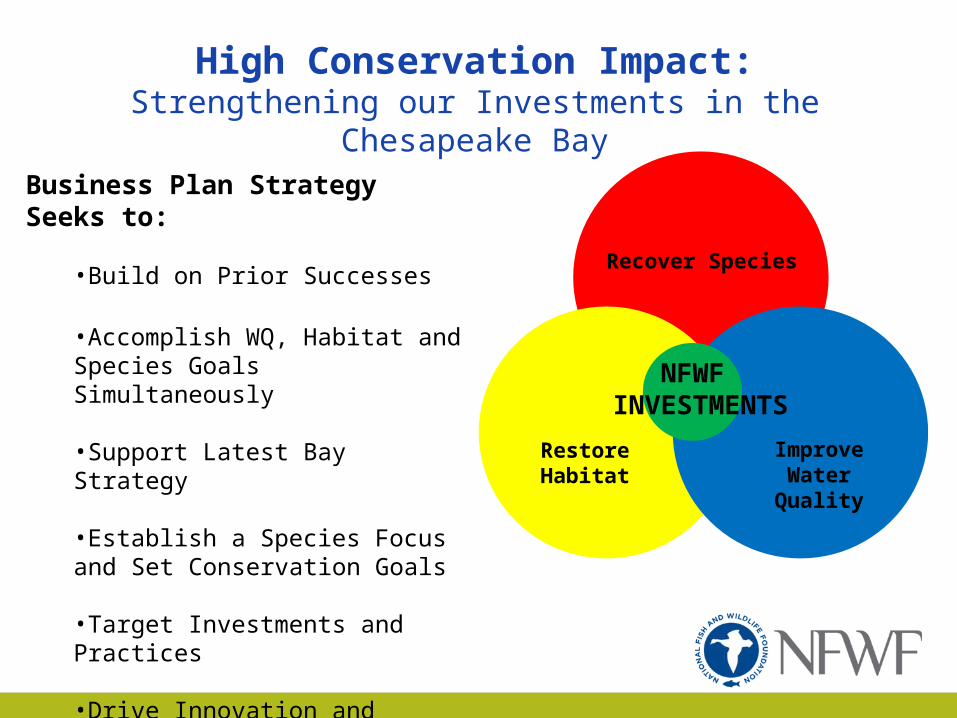
High Conservation Impact:Strengthening our Investments in the
Chesapeake BayBusiness Plan Strategy Seeks to:
•Build on Prior Successes
•Accomplish WQ, Habitat and Species Goals Simultaneously
•Support Latest Bay Strategy
•Establish a Species Focus and Set Conservation Goals
•Target Investments and Practices
•Drive Innovation and Policy
Recover Species
Restore Habitat
Improve Water Quality
NFWF INVESTMENTS
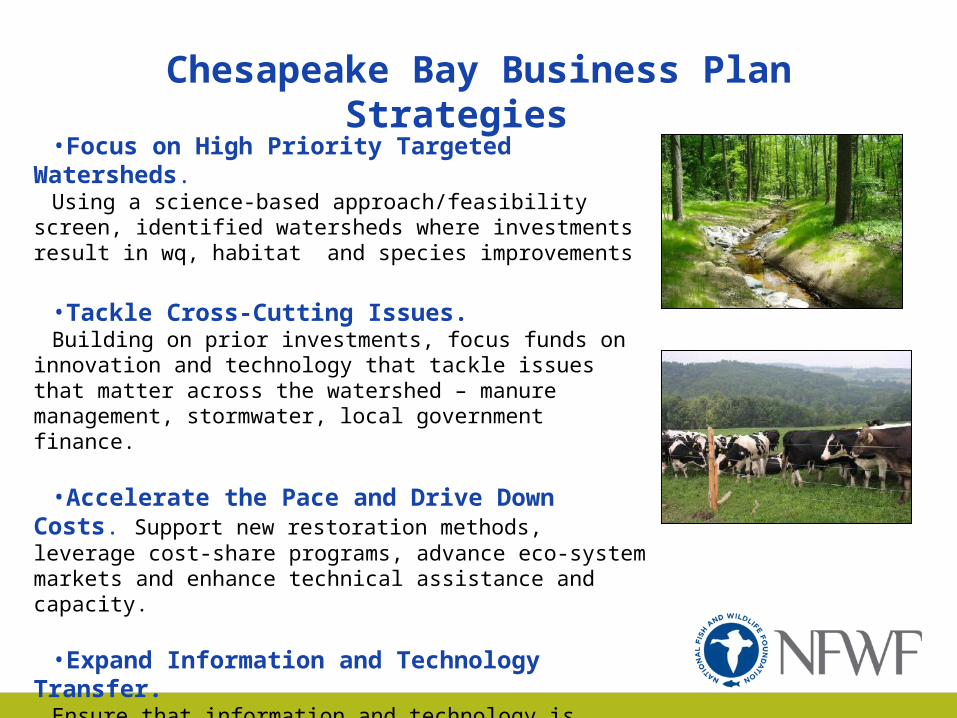
Chesapeake Bay Business Plan Strategies
•Focus on High Priority Targeted Watersheds.
Using a science-based approach/feasibility screen, identified watersheds where investments result in wq, habitat and species improvements
•Tackle Cross-Cutting Issues. Building on prior investments, focus funds on
innovation and technology that tackle issues that matter across the watershed – manure management, stormwater, local government finance.
•Accelerate the Pace and Drive Down Costs. Support new restoration methods, leverage cost-share programs, advance eco-system markets and enhance technical assistance and capacity.
•Expand Information and Technology Transfer.
Ensure that information and technology is shared across key stakeholder groups to encourage adoption of best practices.
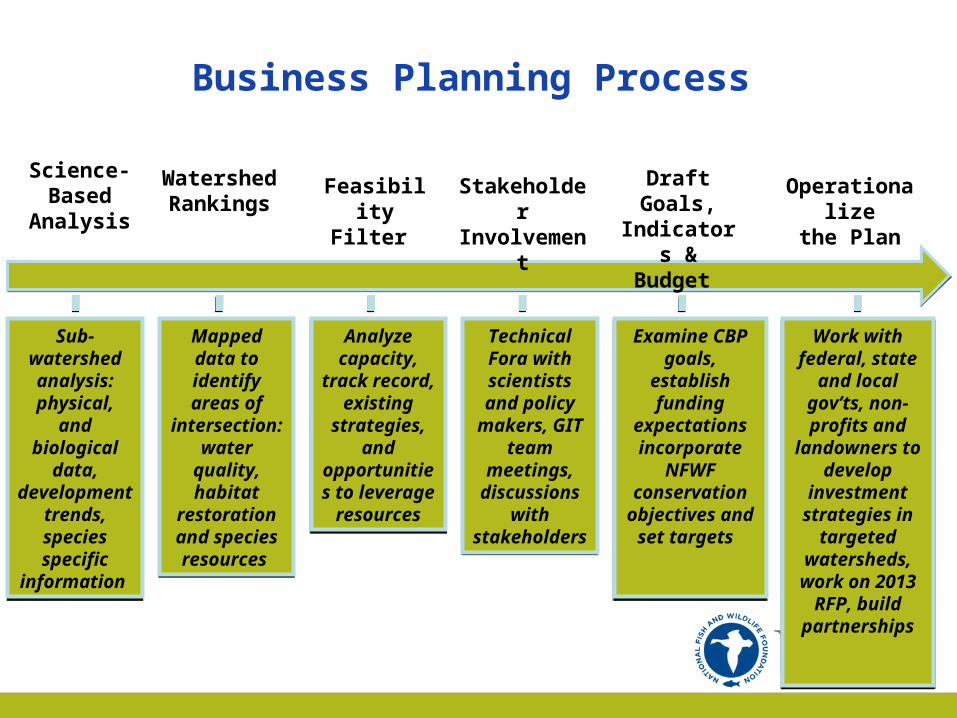
Science- Based
Analysis
Draft Goals, Indicators &
Budget
Feasibility Filter
Stakeholder Involvement
Examine CBP goals, establish
funding expectations incorporate
NFWF conservation
objectives and set targets
Examine CBP goals, establish
funding expectations incorporate
NFWF conservation
objectives and set targets
Watershed Rankings
Technical Fora with scientists
and policy makers, GIT
team meetings,
discussions with
stakeholders
Technical Fora with scientists
and policy makers, GIT
team meetings,
discussions with
stakeholders
Analyze capacity, track
record, existing
strategies, and
opportunities to leverage resources
Analyze capacity, track
record, existing
strategies, and
opportunities to leverage resources
Mapped data to identify
areas of intersection:
water quality, habitat
restoration and species resources
Mapped data to identify
areas of intersection:
water quality, habitat
restoration and species resources
Sub-watershed analysis:
physical, and biological
data, development
trends, species specific
information
Sub-watershed analysis:
physical, and biological
data, development
trends, species specific
information
Work with federal, state
and local gov’ts, non-profits and landowners to
develop investment
strategies in targeted
watersheds, work on 2013
RFP, build partnerships
Work with federal, state
and local gov’ts, non-profits and landowners to
develop investment
strategies in targeted
watersheds, work on 2013
RFP, build partnerships
Operationalizethe Plan
Business Planning Process
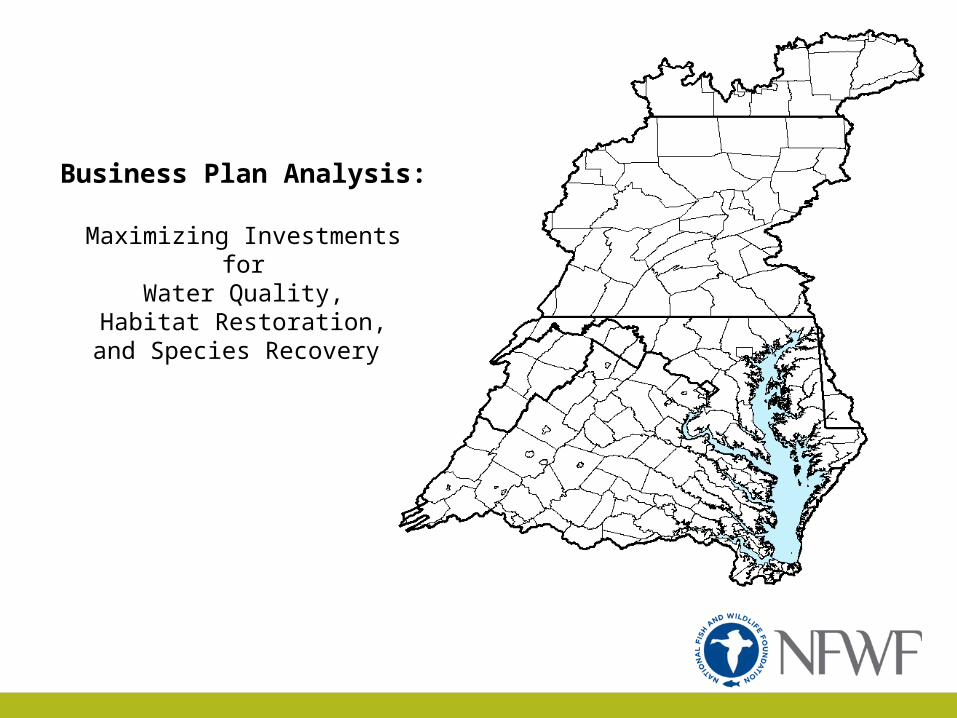
Business Plan Analysis:
Maximizing Investments forWater Quality,
Habitat Restoration,and Species Recovery
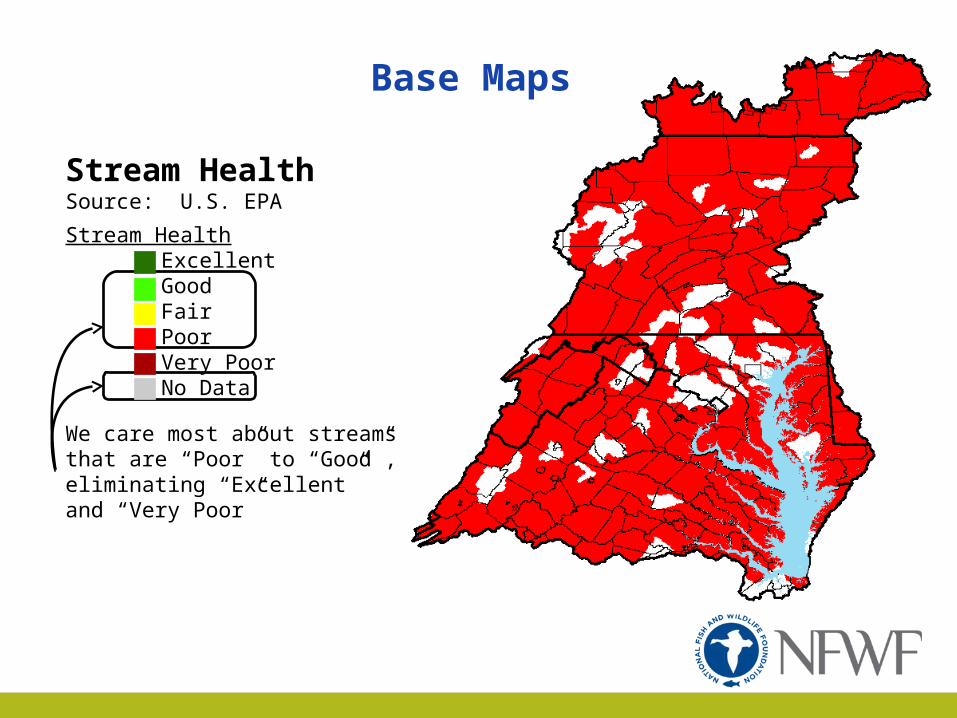
Stream HealthSource: U.S. EPA
Stream HealthExcellentGoodFairPoorVery PoorNo Data
We care most about streams that are “Poor” to “Good”, eliminating “Excellent” and “Very Poor”
Base Maps
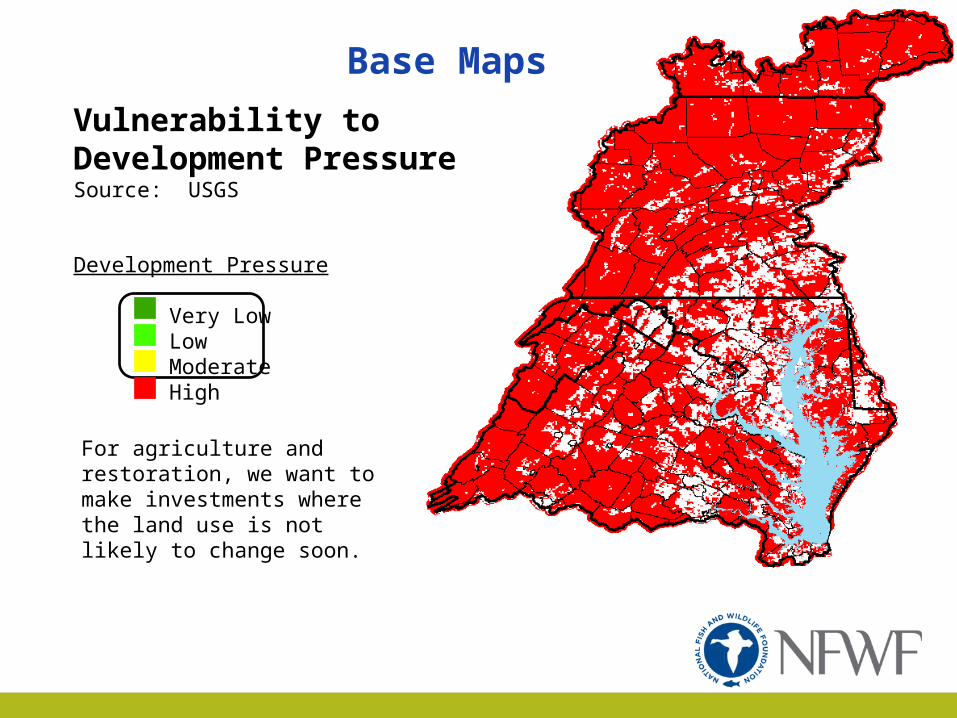
Vulnerability to Development PressureSource: USGS
Development Pressure
Very LowLowModerateHigh
For agriculture and restoration, we want to make investments where the land use is not likely to change soon.
Base Maps

Base Maps
Priority Areas for Nitrogen & PhosphorusSource: U.S. EPA Chesapeake Bay Program Office
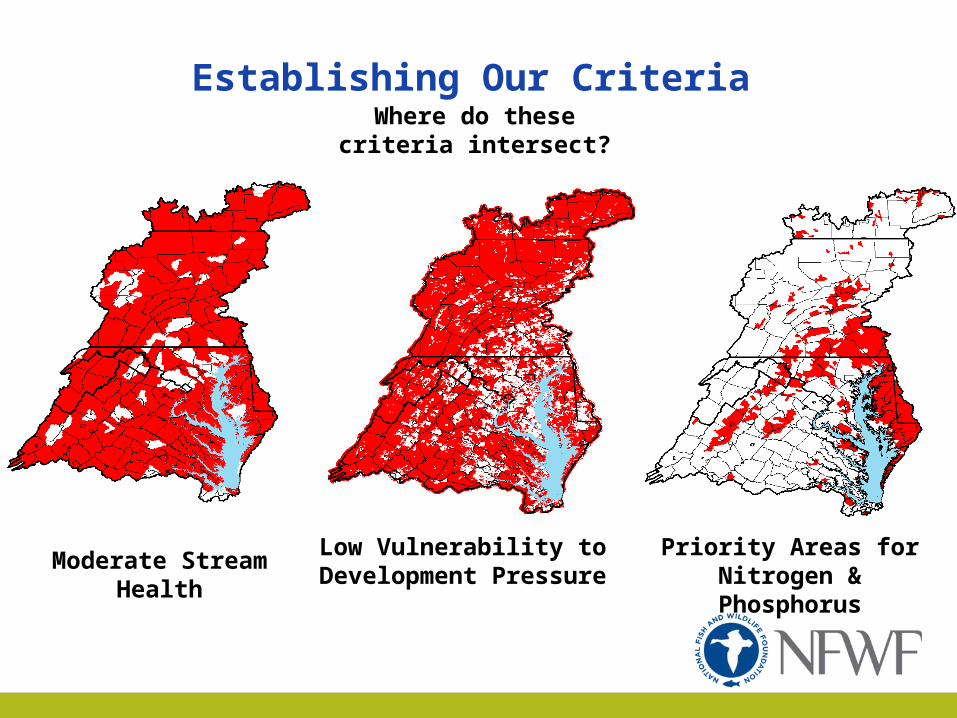
Priority Areas for Nitrogen & Phosphorus
Low Vulnerability to Development
Pressure
Where do these criteria intersect?
Moderate Stream Health
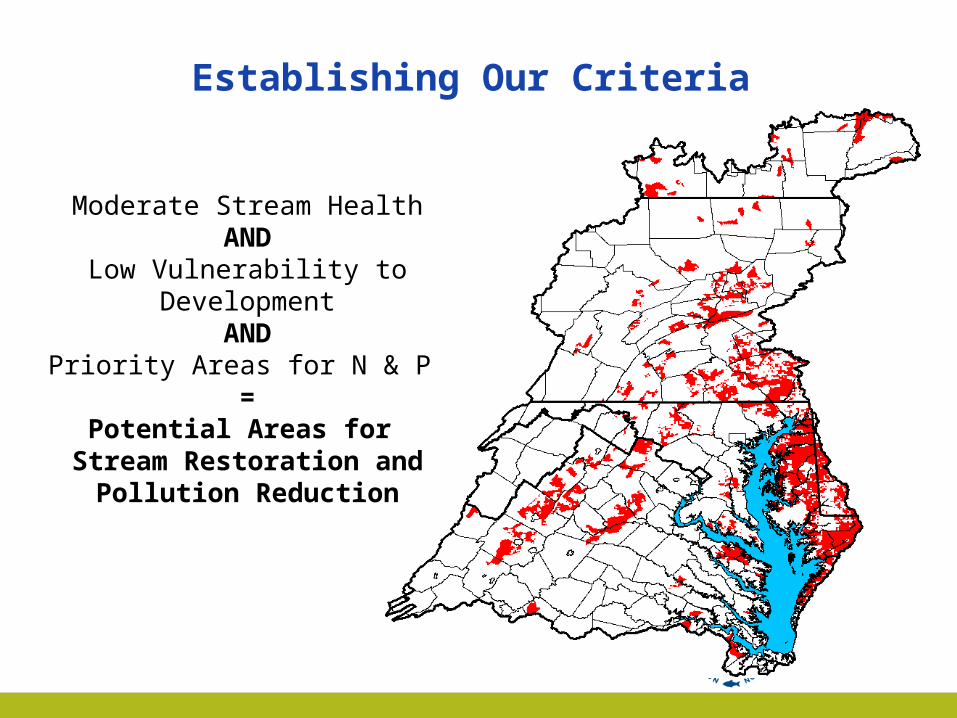
Establishing Our Criteria
Establishing Our Criteria
Moderate Stream HealthAND
Low Vulnerability to Development
ANDPriority Areas for N & P
=Potential Areas for
Stream Restoration and Pollution Reduction
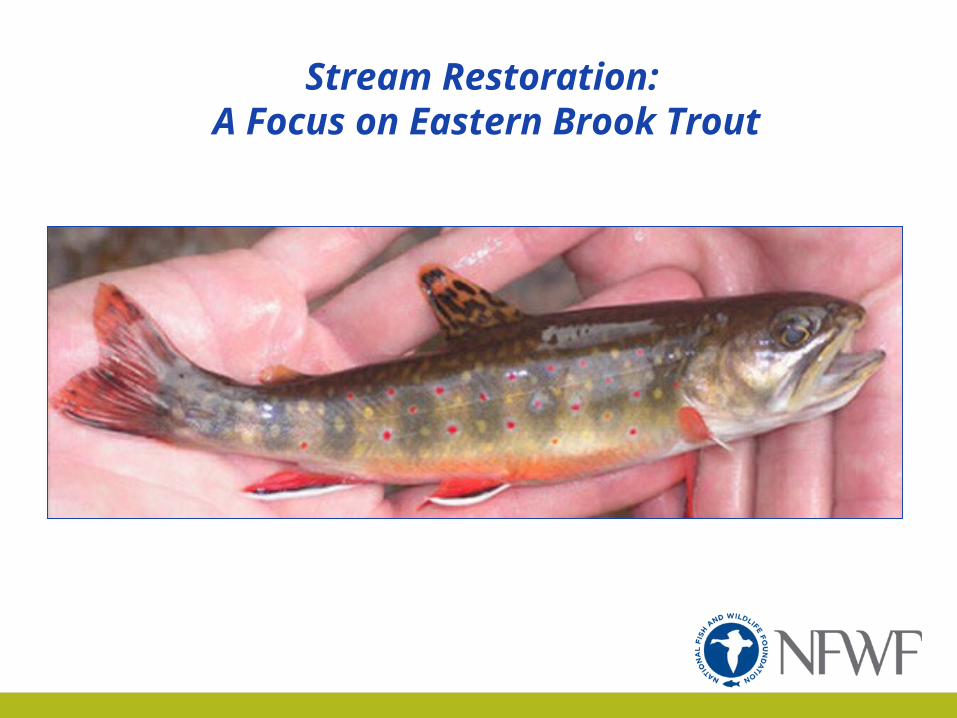
Stream Restoration: A Focus on Eastern Brook Trout
Eastern Brook Trout
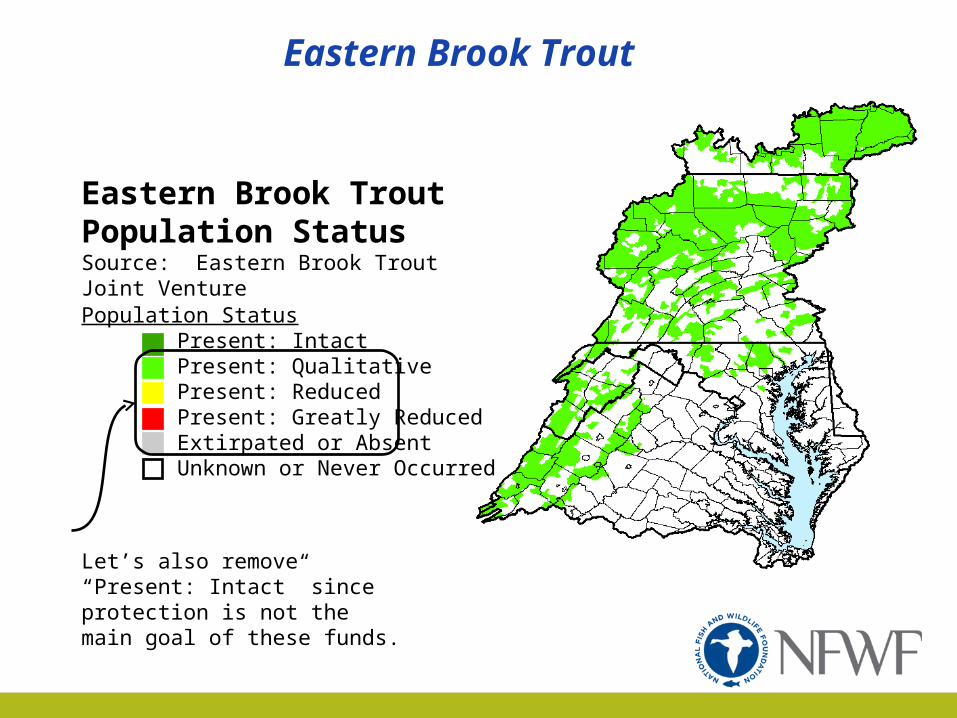
Population StatusPresent: IntactPresent: QualitativePresent: ReducedPresent: Greatly ReducedExtirpated or AbsentUnknown or Never Occurred
Eastern Brook Trout Population StatusSource: Eastern Brook Trout Joint Venture
Let’s also remove “Present: Intact” since protection is not the main goal of these funds.
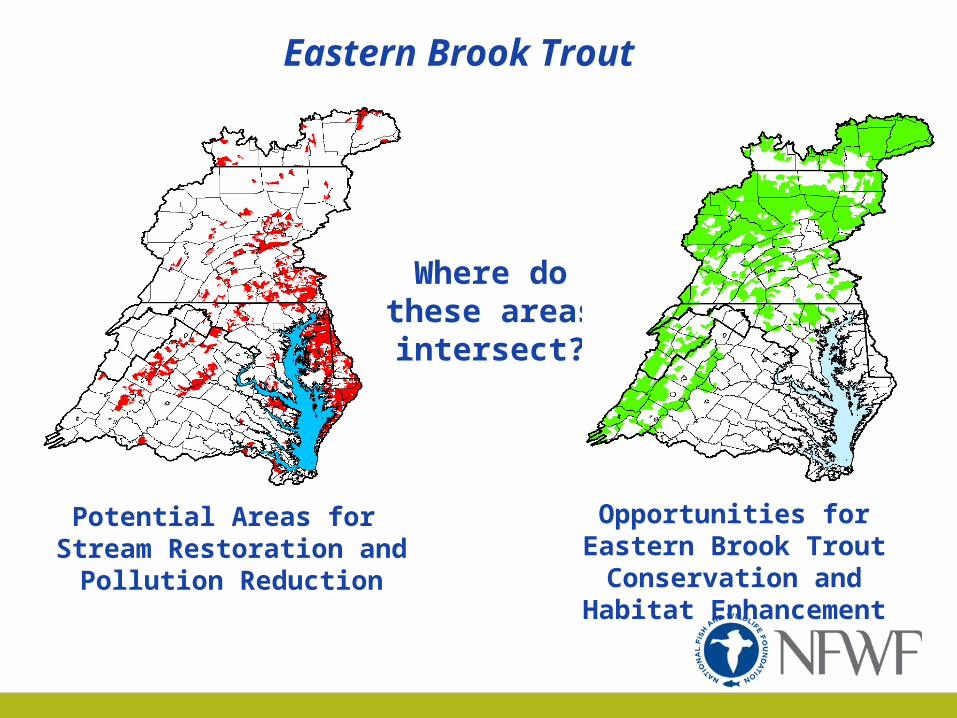
Potential Areas for Stream Restoration and
Pollution Reduction
Opportunities for Eastern Brook Trout
Conservation and Habitat Enhancement
Eastern Brook Trout
Where do these areas intersect?
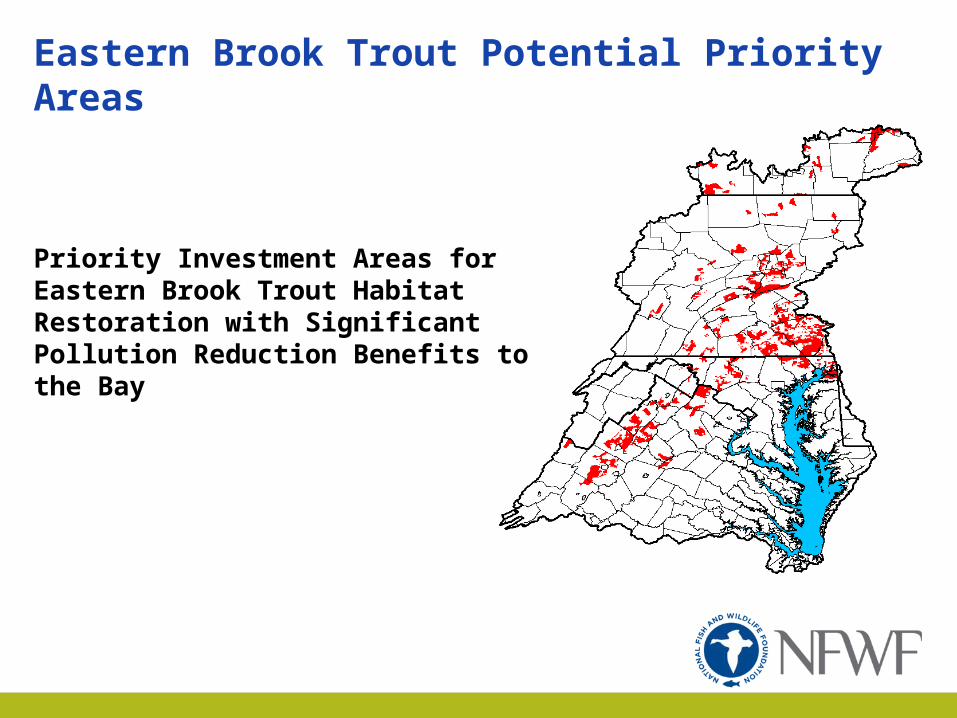
Eastern Brook Trout Potential Priority Areas
Priority Investment Areas for Eastern Brook Trout Habitat Restoration with Significant Pollution Reduction Benefits to the Bay
Marine and Coastal: Focus on Oysters and River
Herring
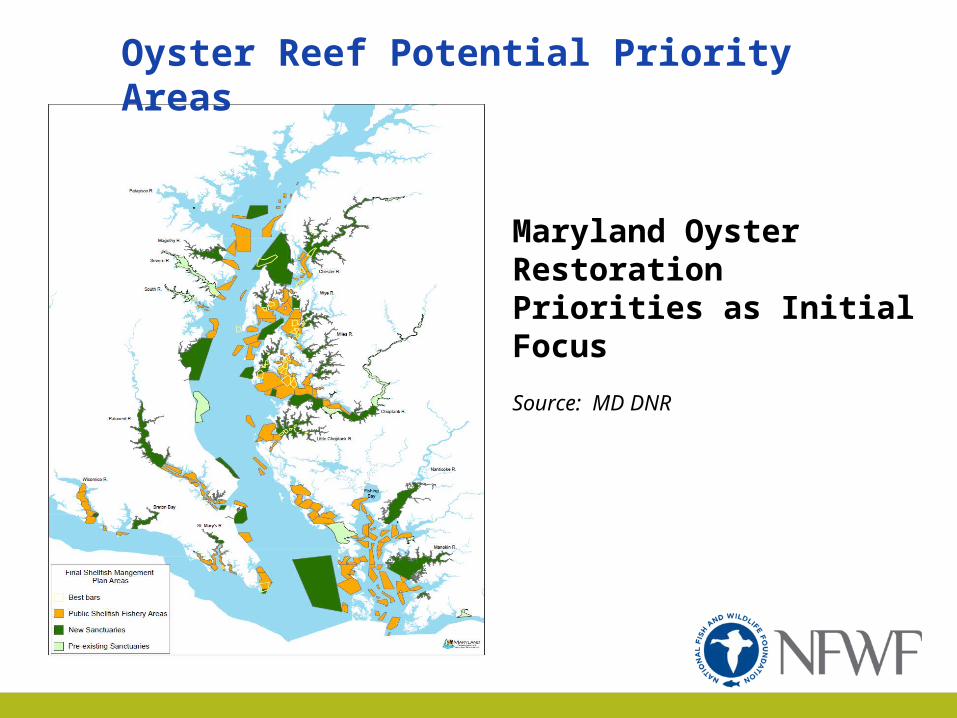
Oyster Reef Potential Priority Areas
Maryland Oyster Restoration Priorities as Initial Focus
Source: MD DNR
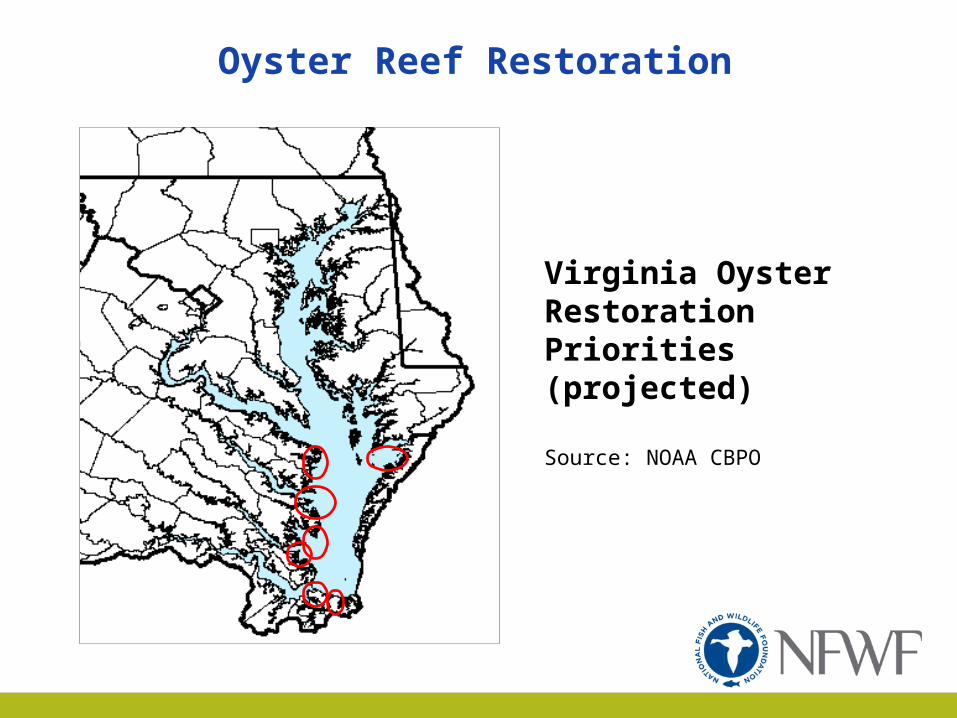
Oyster Reef Restoration
Virginia Oyster Restoration Priorities (projected)
Source: NOAA CBPO
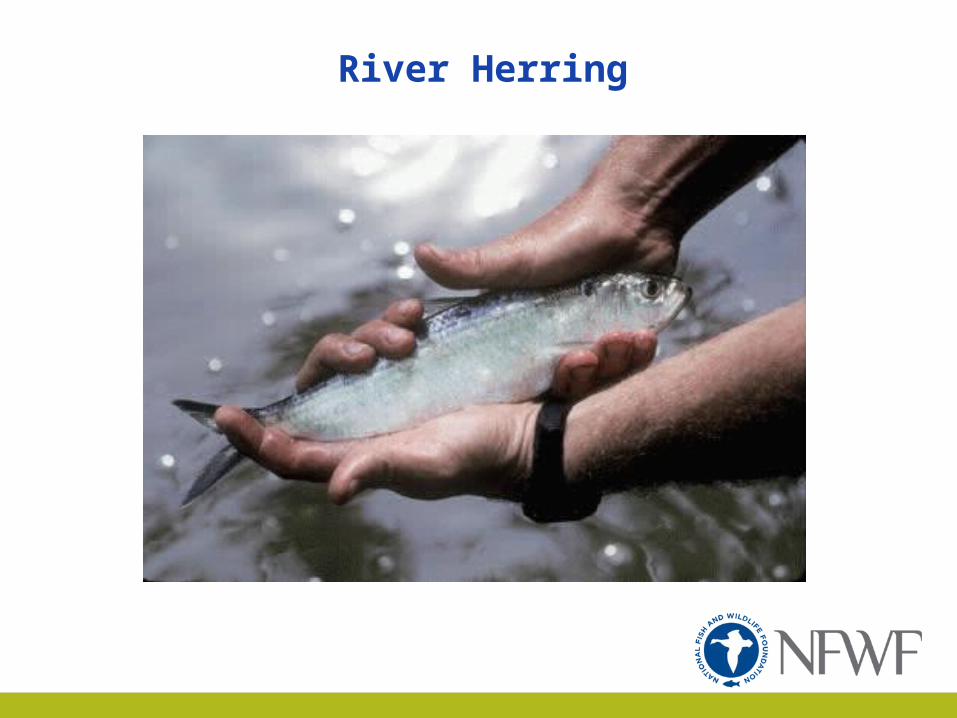
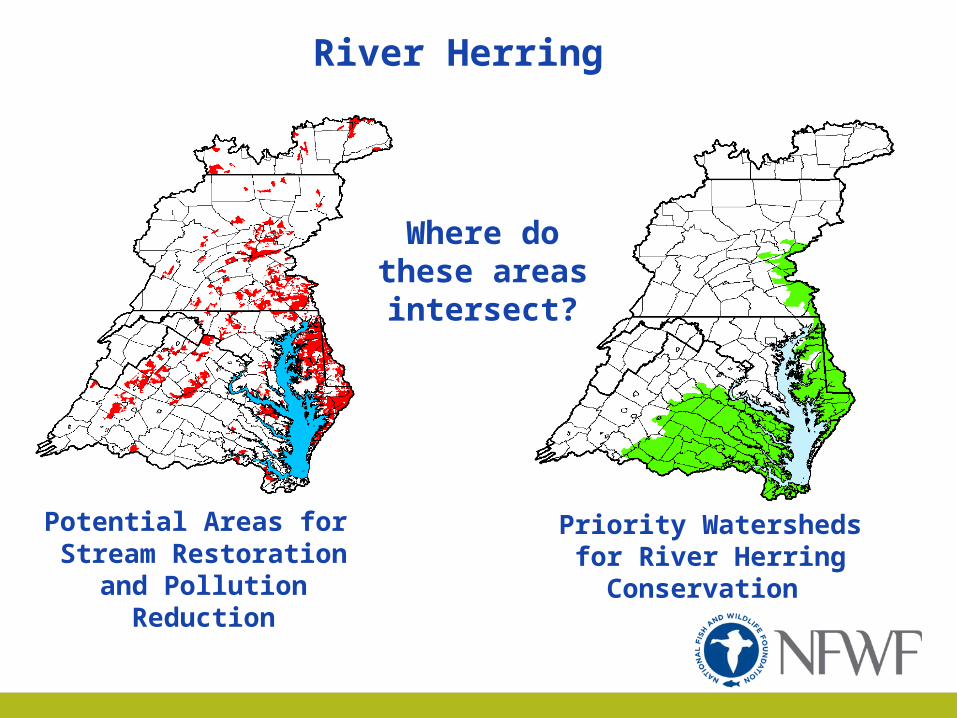
River Herring
River Herring
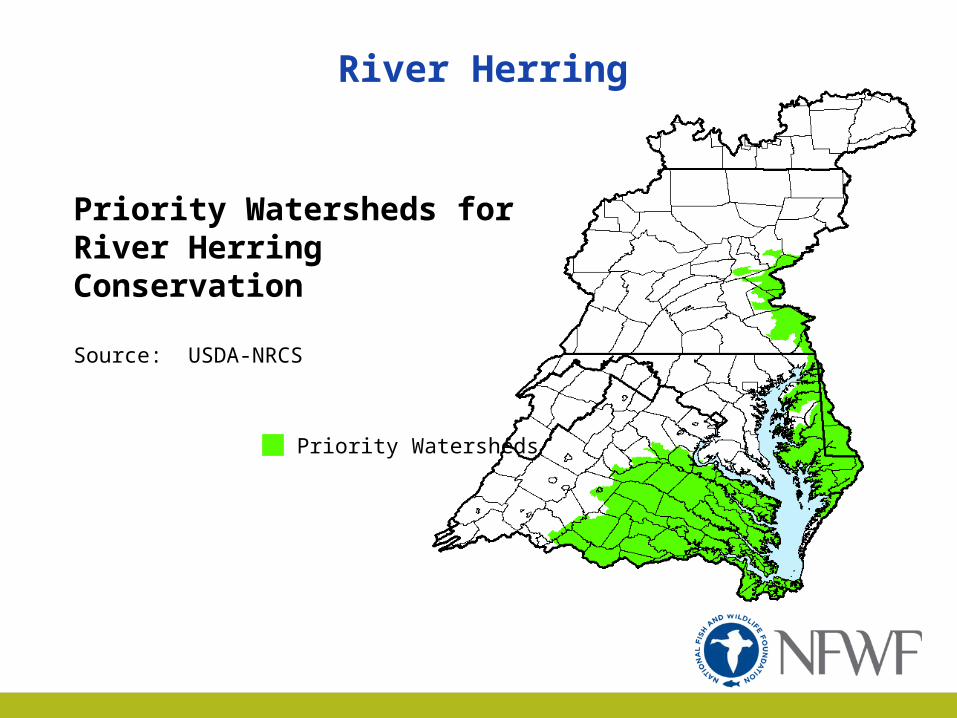
Priority Watersheds
Priority Watersheds for River Herring Conservation
Source: USDA-NRCS
Priority Watersheds for River Herring
Conservation
River Herring
Where do these areas intersect?
Potential Areas for Stream Restoration
and Pollution Reduction

River Herring Potential Priority Areas
Priority Investment Areas for River Herring Habitat Restoration with Pollution Reduction Benefits
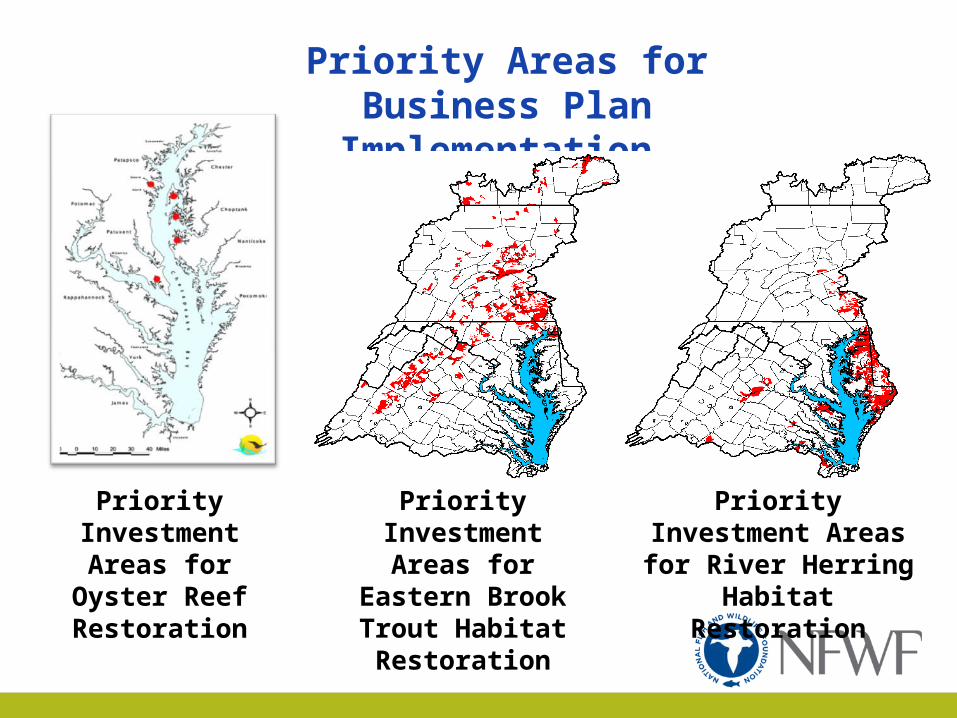
Priority Areas for Business Plan
Implementation
Priority Investment Areas for
Eastern Brook Trout Habitat Restoration
Priority Investment Areas for River Herring Habitat
Restoration
Priority Investment
Areas for Oyster Reef Restoration

Chesapeake Bay Stewardship Fund Targeted Watersheds
Lower Susquehanna and Conestoga River Watersheds
Middle Susquehanna Watersheds
Upper Potomac River Watersheds
Shenandoah Valley
Rappahannock and Rapidan Headwaters
Upper Eastern Shore
Lower Eastern Shore
Virginia’s Upper Neck
Lower James River
Juniata River Watersheds
West Branch Susquehanna River Watersheds
Conodoguinet Creek Headwaters
Middle Eastern Shore
Unadilla Headwaters
Tioughnioga HeadwatersChemung
Headwaters
Eastern Brook Trout Habitat
River Herring Habitat
Both EBT and RH Habitat
Oyster Priority Areas
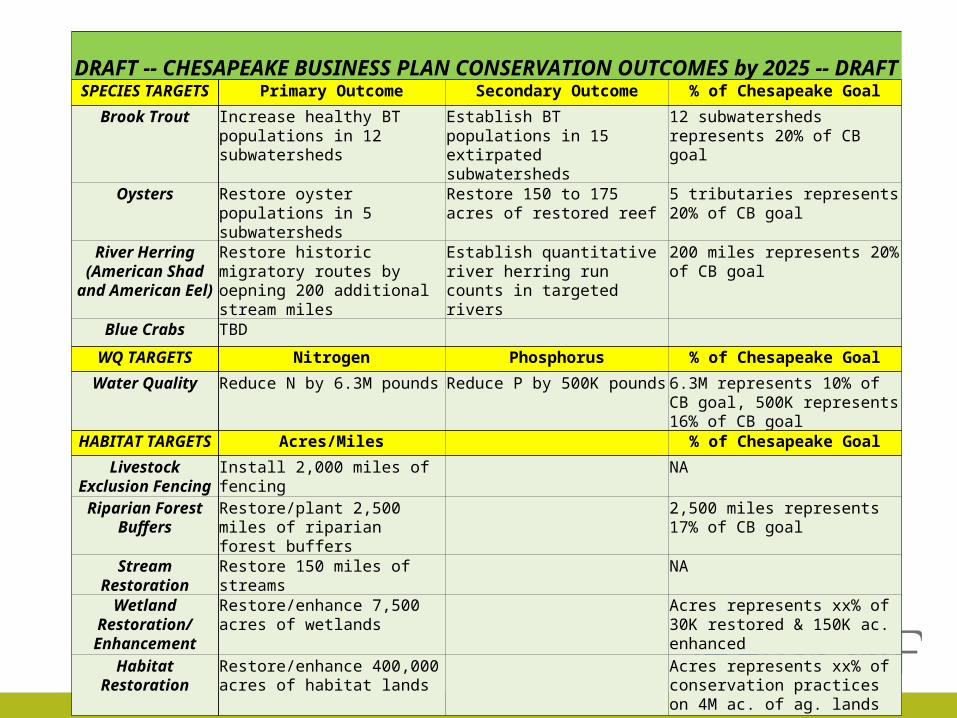
DRAFT -- CHESAPEAKE BUSINESS PLAN CONSERVATION OUTCOMES by 2025 -- DRAFTSPECIES TARGETS Primary Outcome Secondary Outcome % of Chesapeake Goal
Brook Trout Increase healthy BT populations in 12 subwatersheds
Establish BT populations in 15 extirpated subwatersheds
12 subwatersheds represents 20% of CB goal
Oysters Restore oyster populations in 5 subwatersheds
Restore 150 to 175 acres of restored reef
5 tributaries represents 20% of CB goal
River Herring (American Shad and
American Eel)
Restore historic migratory routes by oepning 200 additional stream miles
Establish quantitative river herring run counts in targeted rivers
200 miles represents 20% of CB goal
Blue Crabs TBD
WQ TARGETS Nitrogen Phosphorus % of Chesapeake Goal
Water Quality Reduce N by 6.3M pounds Reduce P by 500K pounds 6.3M represents 10% of CB goal, 500K represents 16% of CB goal
HABITAT TARGETS Acres/Miles % of Chesapeake Goal
Livestock Exclusion Fencing
Install 2,000 miles of fencing NA
Riparian Forest Buffers
Restore/plant 2,500 miles of riparian forest buffers
2,500 miles represents 17% of CB goal
Stream Restoration Restore 150 miles of streams NA
Wetland Restoration/ Enhancement
Restore/enhance 7,500 acres of wetlands
Acres represents xx% of 30K restored & 150K ac. enhanced
Habitat Restoration Restore/enhance 400,000 acres of habitat lands
Acres represents xx% of conservation practices on 4M ac. of ag. lands
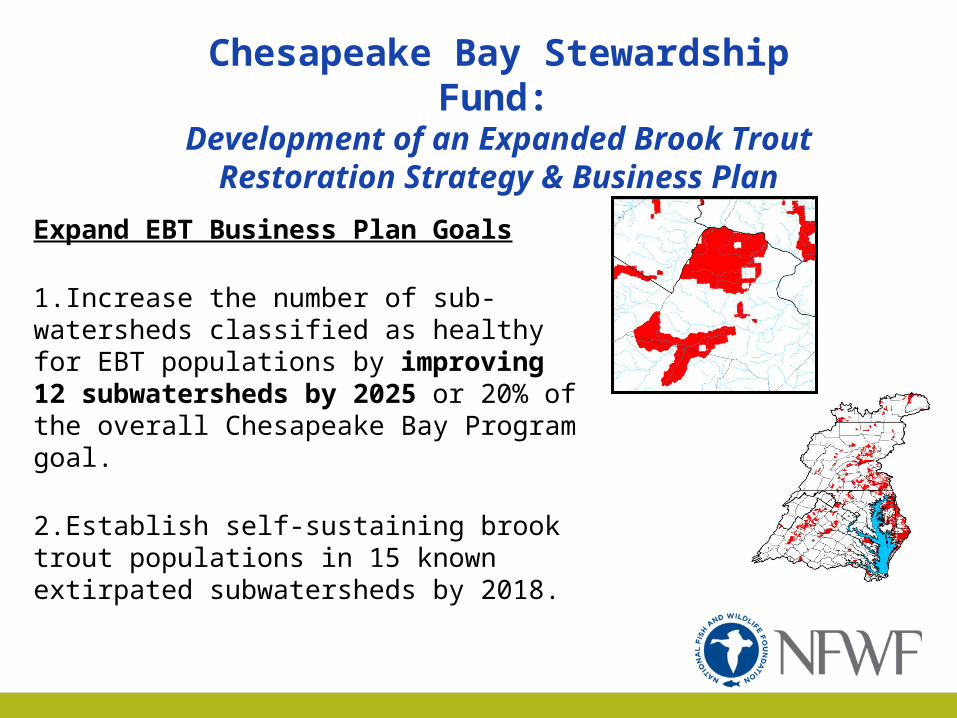
Chesapeake Bay Stewardship Fund:
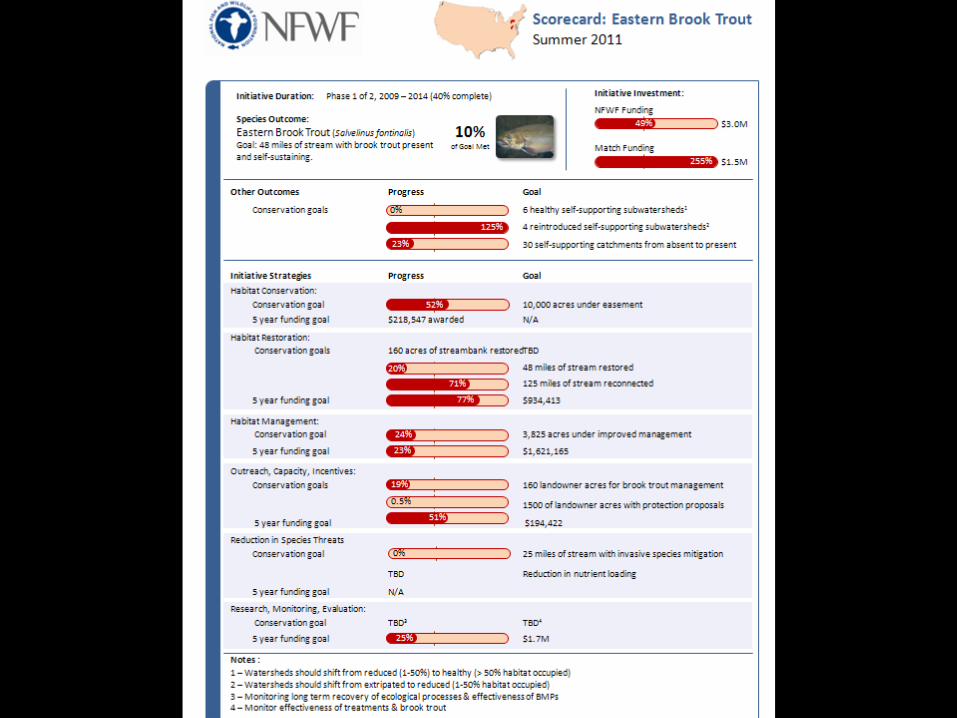
Development of an Expanded Brook Trout Restoration Strategy & Business
PlanExpand EBT Business Plan Goals
1.Increase the number of sub-watersheds classified as healthy for EBT populations by improving 12 subwatersheds by 2025 or 20% of the overall Chesapeake Bay Program goal.
2.Establish self-sustaining brook trout populations in 15 known extirpated subwatersheds by 2018.
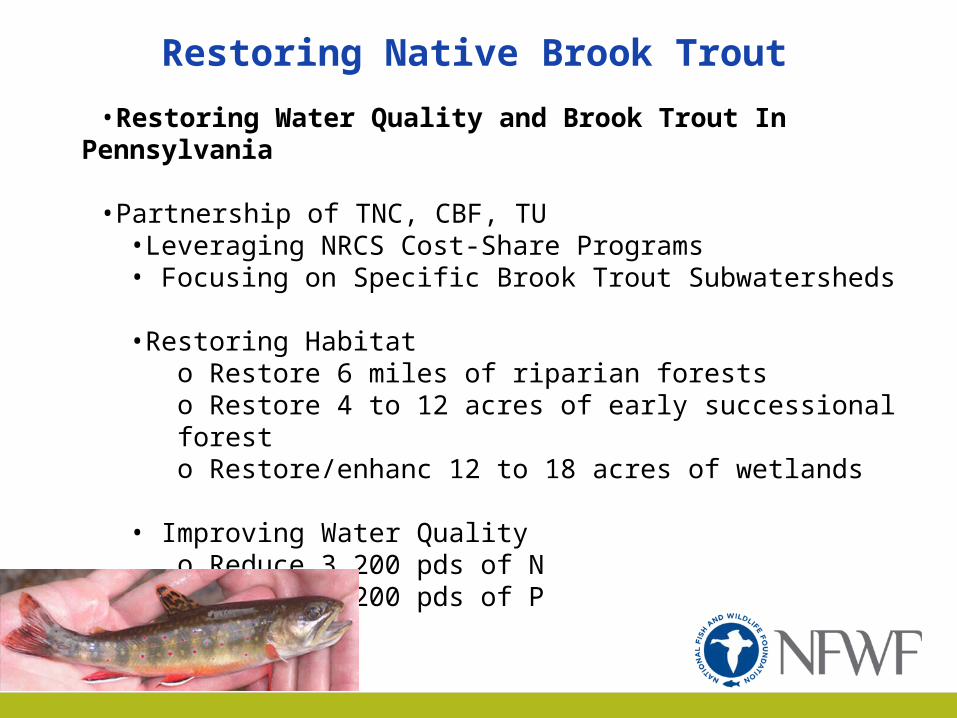
Restoring Native Brook Trout
•Restoring Water Quality and Brook Trout In Pennsylvania
•Partnership of TNC, CBF, TU •Leveraging NRCS Cost-Share Programs• Focusing on Specific Brook Trout Subwatersheds •Restoring Habitat
o Restore 6 miles of riparian forestso Restore 4 to 12 acres of early successional foresto Restore/enhanc 12 to 18 acres of wetlands
• Improving Water Qualityo Reduce 3,200 pds of No Reduce 1,200 pds of P
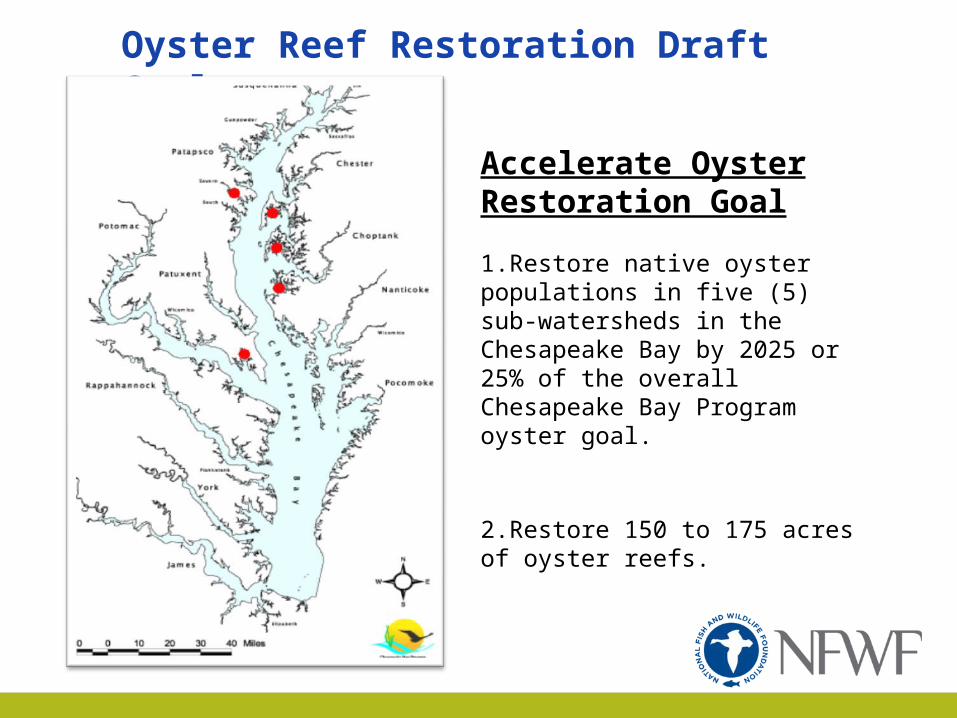
Oyster Reef Restoration Draft Goal
Accelerate Oyster Restoration Goal
1.Restore native oyster populations in five (5) sub-watersheds in the Chesapeake Bay by 2025 or 25% of the overall Chesapeake Bay Program oyster goal.
2.Restore 150 to 175 acres of oyster reefs.
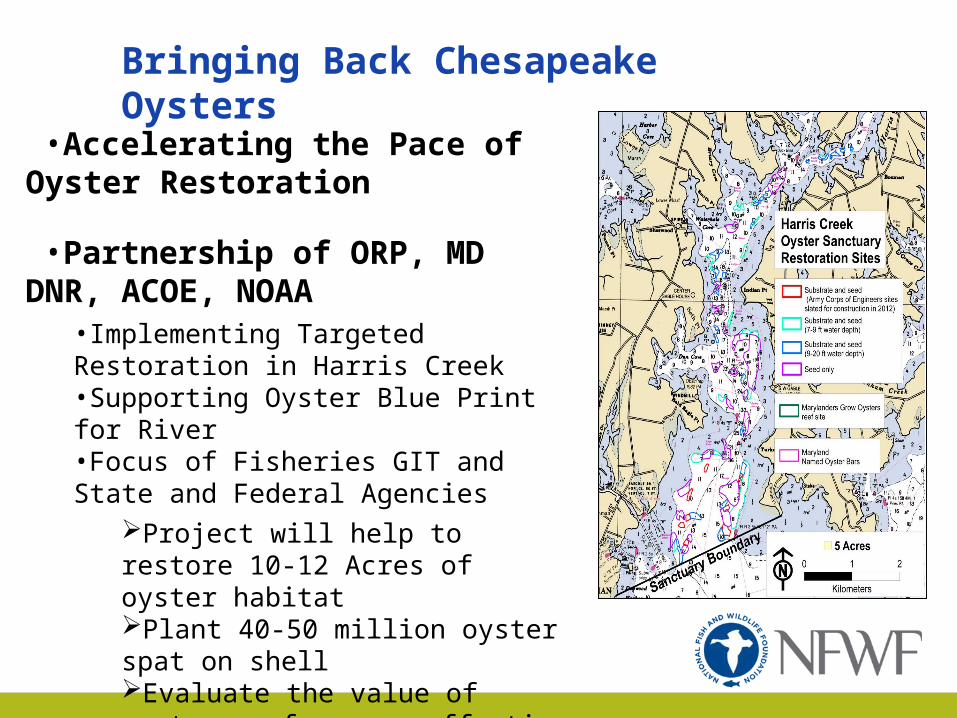
Bringing Back Chesapeake Oysters
•Accelerating the Pace of Oyster Restoration
•Partnership of ORP, MD DNR, ACOE, NOAA
•Implementing Targeted Restoration in Harris Creek •Supporting Oyster Blue Print for River •Focus of Fisheries GIT and State and Federal Agencies
Project will help to restore 10-12 Acres of oyster habitatPlant 40-50 million oyster spat on shellEvaluate the value of oyster reefs as an effective BMP
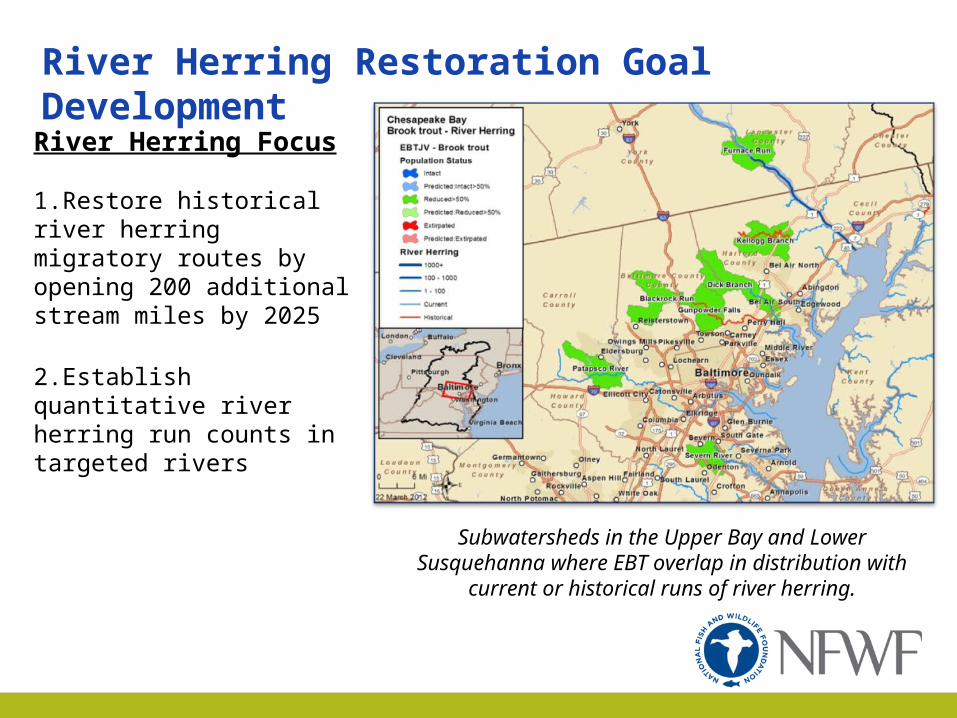
River Herring Restoration Goal Development River Herring Focus
1.Restore historical river herring migratory routes by opening 200 additional stream miles by 2025
2.Establish quantitative river herring run counts in targeted rivers
Subwatersheds in the Upper Bay and Lower Susquehanna where EBT overlap in
distribution with current or historical runs of river herring.
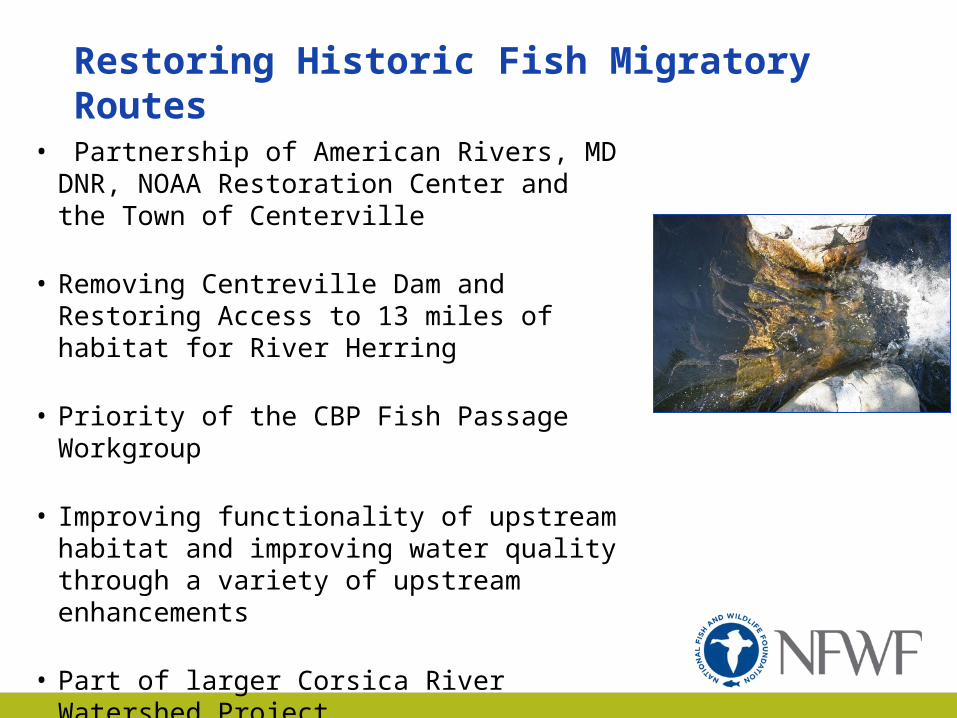
Restoring Historic Fish Migratory Routes
• Partnership of American Rivers, MD DNR, NOAA Restoration Center and the Town of Centerville
• Removing Centreville Dam and Restoring Access to 13 miles of habitat for River Herring
• Priority of the CBP Fish Passage Workgroup
• Improving functionality of upstream habitat and improving water quality through a variety of upstream enhancements
• Part of larger Corsica River Watershed Project
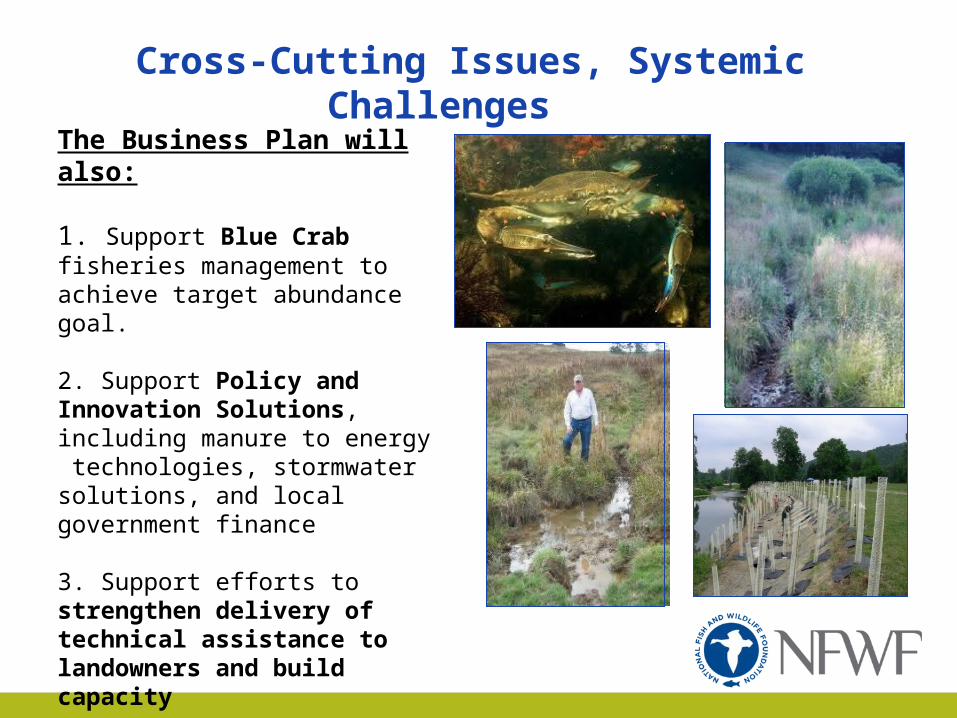
Cross-Cutting Issues, Systemic Challenges
The Business Plan will also:
1. Support Blue Crab fisheries management to achieve target abundance goal.
2. Support Policy and Innovation Solutions, including manure to energy technologies, stormwater solutions, and local government finance
3. Support efforts to strengthen delivery of technical assistance to landowners and build capacity
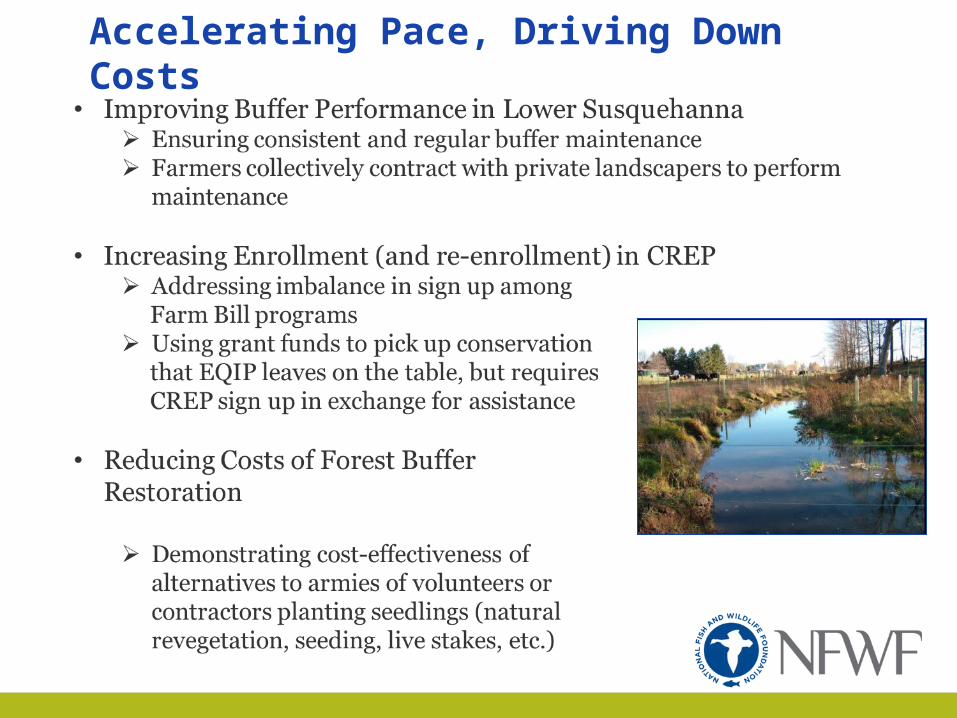
Accelerating Pace, Driving Down Costs
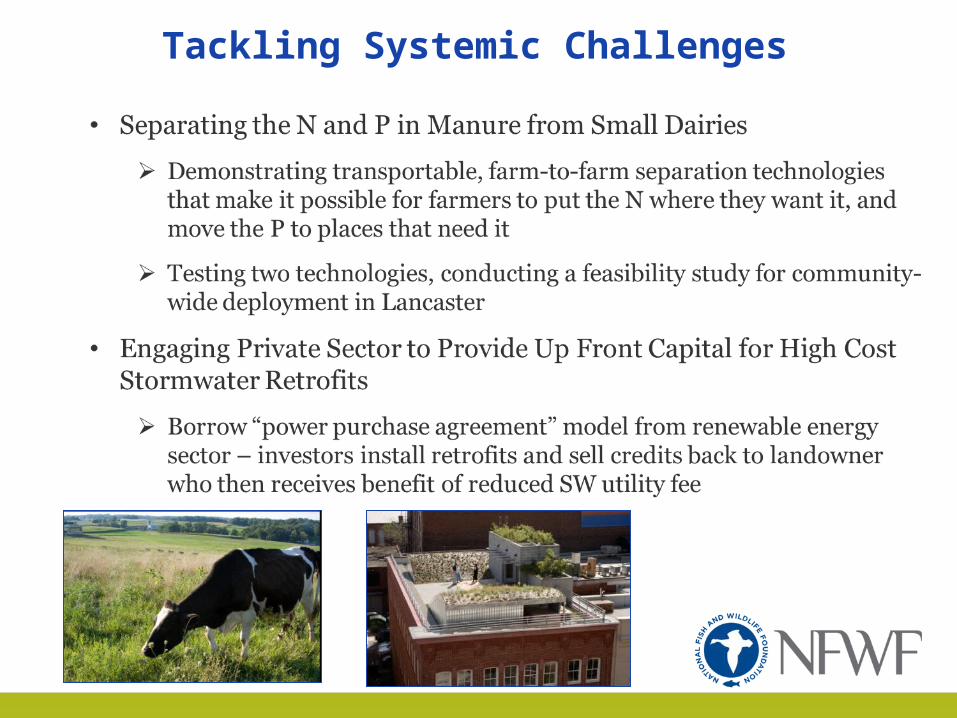
Tackling Systemic Challenges
Next Steps Operationalize Plans
•Contracting with Kristen Saacke-Blunk (formerly PSU Extension) and Jeff Horan (MD DNR/FWS) to advance step-down approach
•Define investment strategies for subwatersheds w/ federal, state and local gov’ts, funding partners and non-profits
•Expand Technical and Funding Partnerships
•Participate on GIT Teams and MD Oyster Advisory Board
•Refine Chesapeake Stewardship Fund RFP for FY13