Embed Size (px)
Citation preview
139
CCHHAAPPTTEERR VV
PPRREESSEENNTT SSTTAATTUUSS OOFF WWOOMMEENN IINN IINNDDIIAA
The present chapter is organised into two sections. Section I discusses the
concept of gender inequality and analyses the different indicators of gender
inequality with reference to India. Section II highlights the gender commitments in
the Indian context to improve the status of women.
Section I
5.1: Introduction
The „Committee on the Status of Women in India, 1974‟ defines „Status of
Women‟, as „the extent of woman‟s access to social and material resources within
the family, community and society or her authority or power within the family or
community and the prestige commanded from those other members or her position
in the social system distinguishable from, yet related to, other positions‟183
. The
term „status‟ includes not only personal and proprietary rights, but also duties,
liabilities and disabilities. “In the case of Indian women, it means her personal
rights, proprietary rights, her duties, liabilities and disabilities vis-à-vis the society
and her family members”184
.
The issue of status of women has become a matter of intense scrutiny and
debate throughout the world and India is not an exception to this. In India, the status
of women has changed from time to time. In ancient India, she enjoyed equal status
with man in all spheres of life. The status of women was deteriorated during the
medieval period. Social and cultural practices like, child marriage, restrictions on
widow remarriage, caste system, joint family system, etc., are the factors that
caused degradation of women in India.
183
Radha Devi., “Status of Women in India: A Comparison by State”, Asia –Pacific Population
Journal, Vol.8, No.4, 1993, pp.59-77. 184
Jena Trailokya., “Status of Women in Indian Society: Towards a Gender Responsive
Governance”, in Mandakini Das and Pritirekha Daspattanayak (eds.), Empowering Women: Issues,
Challenges and Strategies, Dominant Publishers and Distributors Pvt., Ltd., New Delhi, 2009-10,
p.2.
140
During the course of time, the position of women in India has changed
considerably. Though the position of women has improved, extensive inequalities
persist in their access to education, health, nutrition, employment opportunities, etc.
They lack decision making power both at household and government level, they are
also inadequately represented in the political space. In India women work longer
hours than men, though women are overworked, their work is not properly
recognised. “The extent of women‟s contribution is aptly highlighted by a micro
study conducted in the Indian Himalayas which found that on a one-hectare farm, a
pair of bullock works for 1,064 hours, a man 1,212 hours and a woman for 3,485
hours in a year”185
. “Women represent 50 percent of population make up 30 percent
of the official labour force, perform 60 percent of all working hours, receive 10
percent of the world income and own even less than 1 percent of the world
property”. This is the lawful economic profile of women in the world. This is also
true of Indian women and very much true of rural women186
.
A shocking study reveals that half of the world‟s malnourished children live
in India owing primarily to the lack of nutritious food available to their mothers. In
all the critical stages, whether it is infancy, childhood, adolescence or the
reproductive phase, many women suffer malnutrition purely due to the
discrimination and the narrow mindsets of the society187
.
Though India is developing economically and technologically by leaps and
bounds, women here still continue to be discriminated. Women are still
discriminated and subjugated to male dominance in India. Jawaharlal Nehru had
said: “You can tell the condition of a nation by looking at the status of its
women”188
. The Constitution of India, the Parliament of India, State Legislatures
have taken several initiatives with the objective of protecting, promoting and
empowering women in all walks of life, but the gender equality is not yet realised.
185
Jena Trailokya., op.cit., p.8. 186
Sahay Sushma., op.cit., p.3. 187
Gragnolati Michele, Meera Shekar, Monica Das Gupta, Caryn Bredenkamp and Yi-Kyoung Lee.,
“India‟s Undernourished Children: A Call for Reform and Action”, HNP Discussion Paper, World
Bank, 2005, pp.1-4. 188
Chandramohan R and D.Thomas Victor Raja., “Empowering Women: Five Year Plans”,
Southern Economist, Vol.49, No.10, September 15, 2010, p.22. And also Coonrod Carol S.,
“Chronic Hunger and the Status of Women in India”, Introductory Quotes, The Hunger Project,
June 1998.
141
5.2: Present Status of Women in India
According to Census 2001, women constitute 48.3 percent of the India‟s
total population. An attempt is made here to analyse the present status of women in
India, using the following parameters, namely, Life Expectancy at Birth, Sex Ratio,
Literacy Rate, Work Participation Rate, Women CEO‟s in India, Women‟s Political
Participation, Women Judges in Supreme Court and High Courts, etc. These
indicators are analysed as under189
:
5.2.1: Life Expectancy at Birth: Life expectancy is the number of years a new
born infant would live if prevailing patterns of age-specific mortality rates at the
time of birth were to stay the same throughout the child‟s life190
. It summarises the
mortality pattern that prevails across all age groups, children and adolescents, adults
and the elderly191
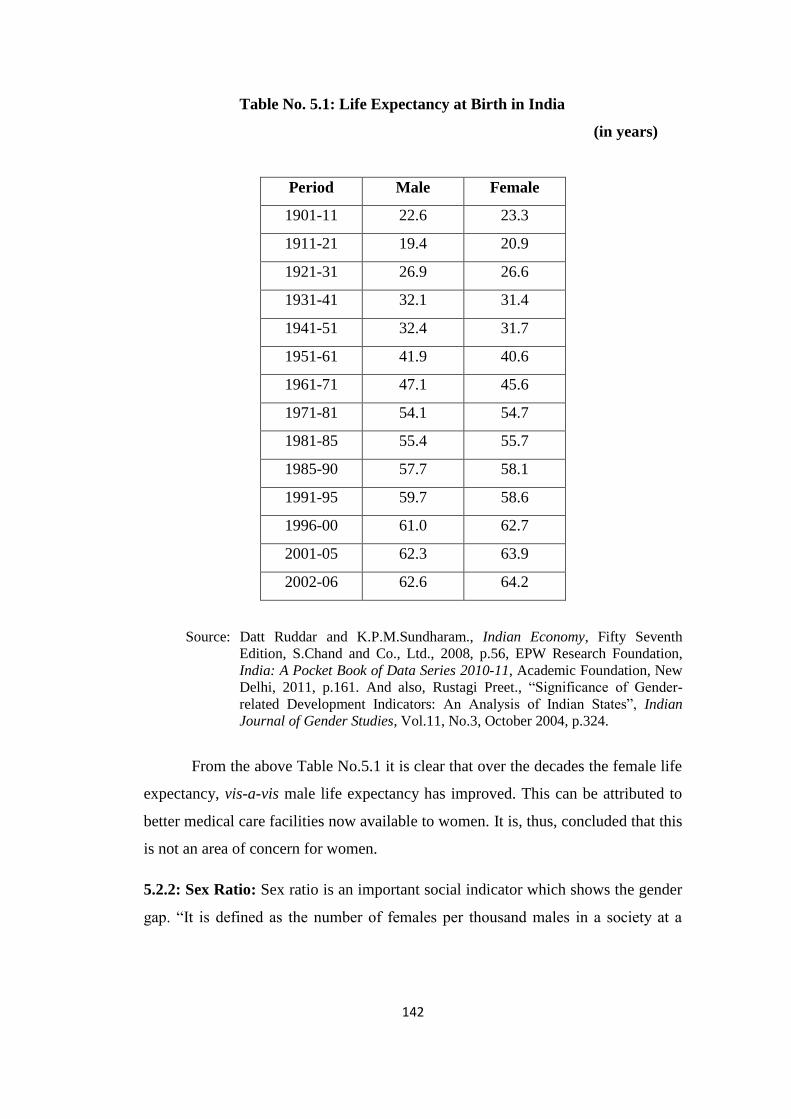
. A perusal of Table No.5.1 reveals the fact that life expectancy
has increased for both men and women in India over the years. For example, during
the decade 1941-51 the male life expectancy was 32.4 years and female life
expectancy was 31.7 years which increased to 41.9 years for male and 40.6 years
for female for the decade 1951-61. Male life expectancy was more than female life
expectancy till 1981. Since, 1981 the female life expectancy has exceeded that of
males. For instance, during the period 1971-81, the male life expectancy was 54.1
years and female life expectancy was 54.7 years. According to Census 2001, the
male life expectancy improved to 63.9 years and female life expectancy to 66.9
years respectively.
189
Peerzade Sayed Afzal and Sushma Angadi., “Gender Gaps and Public Action”, Orient Journal of
Law and Social Sciences, Vol.IV, No.12, November 2010, pp.68-81. 190
United Nations Development Programme, Human Development Report 2007, Oxford University
Press, New York, 2007, p.407. 191
World Health Organization, Indicators, accessed on 4th
June 2009
( www.who.int/whiis/indicators/2007).
142
Table No. 5.1: Life Expectancy at Birth in India
(in years)
Period Male Female
1901-11 22.6 23.3
1911-21 19.4 20.9
1921-31 26.9 26.6
1931-41 32.1 31.4
1941-51 32.4 31.7
1951-61 41.9 40.6
1961-71 47.1 45.6
1971-81 54.1 54.7
1981-85 55.4 55.7
1985-90 57.7 58.1
1991-95 59.7 58.6
1996-00 61.0 62.7
2001-05 62.3 63.9
2002-06 62.6 64.2
Source: Datt Ruddar and K.P.M.Sundharam., Indian Economy, Fifty Seventh
Edition, S.Chand and Co., Ltd., 2008, p.56, EPW Research Foundation,
India: A Pocket Book of Data Series 2010-11, Academic Foundation, New
Delhi, 2011, p.161. And also, Rustagi Preet., “Significance of Gender-
related Development Indicators: An Analysis of Indian States”, Indian
Journal of Gender Studies, Vol.11, No.3, October 2004, p.324.
From the above Table No.5.1 it is clear that over the decades the female life
expectancy, vis-a-vis male life expectancy has improved. This can be attributed to
better medical care facilities now available to women. It is, thus, concluded that this
is not an area of concern for women.
5.2.2: Sex Ratio: Sex ratio is an important social indicator which shows the gender
gap. “It is defined as the number of females per thousand males in a society at a
143
given point of time”192
. The sex composition of the population is affected by the
differentials in mortality conditions of males and females193
. Table No.5.2 shows
sex ratio from 1901 to 2001 in India.
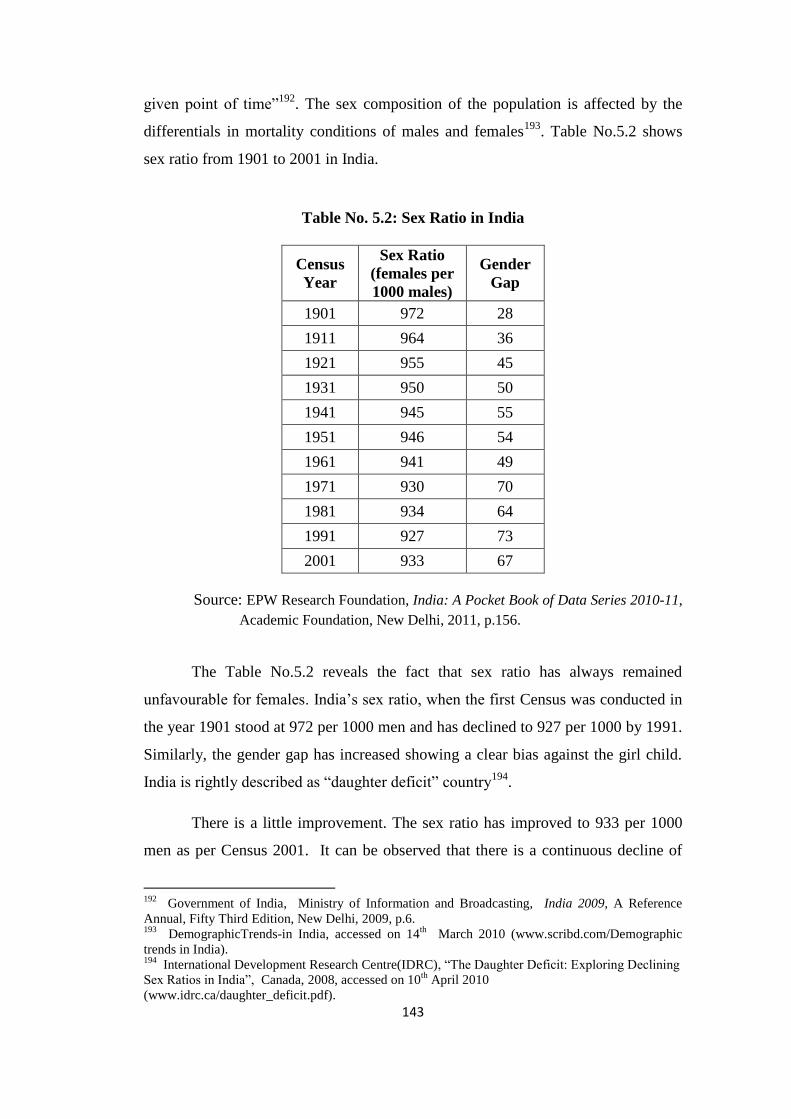
Table No. 5.2: Sex Ratio in India
Census
Year
Sex Ratio
(females per
1000 males)
Gender
Gap
1901 972 28
1911 964 36
1921 955 45
1931 950 50
1941 945 55
1951 946 54
1961 941 49
1971 930 70
1981 934 64
1991 927 73
2001 933 67
Source: EPW Research Foundation, India: A Pocket Book of Data Series 2010-11,
Academic Foundation, New Delhi, 2011, p.156.
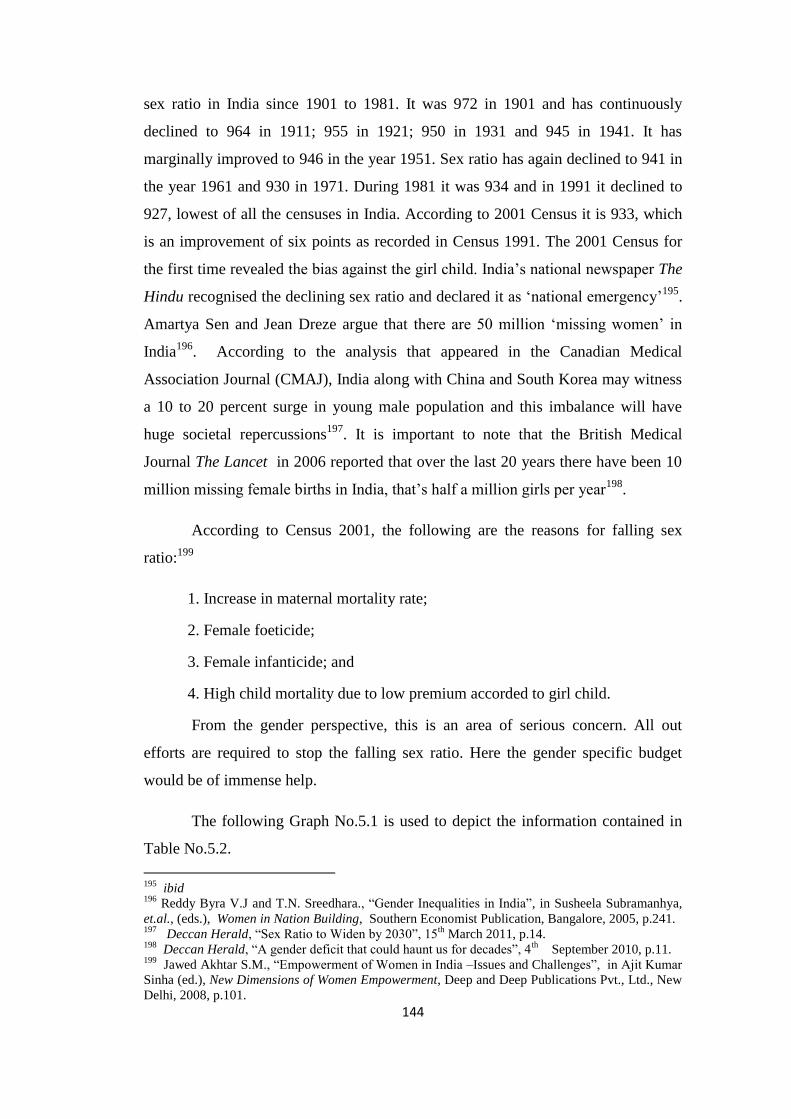
The Table No.5.2 reveals the fact that sex ratio has always remained
unfavourable for females. India‟s sex ratio, when the first Census was conducted in
the year 1901 stood at 972 per 1000 men and has declined to 927 per 1000 by 1991.
Similarly, the gender gap has increased showing a clear bias against the girl child.
India is rightly described as “daughter deficit” country194
.
There is a little improvement. The sex ratio has improved to 933 per 1000
men as per Census 2001. It can be observed that there is a continuous decline of
192
Government of India, Ministry of Information and Broadcasting, India 2009, A Reference
Annual, Fifty Third Edition, New Delhi, 2009, p.6. 193
DemographicTrends-in India, accessed on 14th
March 2010 (www.scribd.com/Demographic
trends in India). 194
International Development Research Centre(IDRC), “The Daughter Deficit: Exploring Declining
Sex Ratios in India”, Canada, 2008, accessed on 10th
April 2010
(www.idrc.ca/daughter_deficit.pdf).
144
sex ratio in India since 1901 to 1981. It was 972 in 1901 and has continuously
declined to 964 in 1911; 955 in 1921; 950 in 1931 and 945 in 1941. It has
marginally improved to 946 in the year 1951. Sex ratio has again declined to 941 in
the year 1961 and 930 in 1971. During 1981 it was 934 and in 1991 it declined to
927, lowest of all the censuses in India. According to 2001 Census it is 933, which
is an improvement of six points as recorded in Census 1991. The 2001 Census for
the first time revealed the bias against the girl child. India‟s national newspaper The
Hindu recognised the declining sex ratio and declared it as „national emergency‟195
.
Amartya Sen and Jean Dreze argue that there are 50 million „missing women‟ in
India196
. According to the analysis that appeared in the Canadian Medical
Association Journal (CMAJ), India along with China and South Korea may witness
a 10 to 20 percent surge in young male population and this imbalance will have
huge societal repercussions197
. It is important to note that the British Medical
Journal The Lancet in 2006 reported that over the last 20 years there have been 10
million missing female births in India, that‟s half a million girls per year198
.
According to Census 2001, the following are the reasons for falling sex
ratio:199
1. Increase in maternal mortality rate;
2. Female foeticide;
3. Female infanticide; and
4. High child mortality due to low premium accorded to girl child.
From the gender perspective, this is an area of serious concern. All out
efforts are required to stop the falling sex ratio. Here the gender specific budget
would be of immense help.
The following Graph No.5.1 is used to depict the information contained in
Table No.5.2.
195
ibid 196
Reddy Byra V.J and T.N. Sreedhara., “Gender Inequalities in India”, in Susheela Subramanhya,
et.al., (eds.), Women in Nation Building, Southern Economist Publication, Bangalore, 2005, p.241. 197
Deccan Herald, “Sex Ratio to Widen by 2030”, 15th
March 2011, p.14. 198
Deccan Herald, “A gender deficit that could haunt us for decades”, 4th
September 2010, p.11. 199
Jawed Akhtar S.M., “Empowerment of Women in India –Issues and Challenges”, in Ajit Kumar
Sinha (ed.), New Dimensions of Women Empowerment, Deep and Deep Publications Pvt., Ltd., New
Delhi, 2008, p.101.
145
Graph No. 5.1: Sex Ratio and Gender Gap
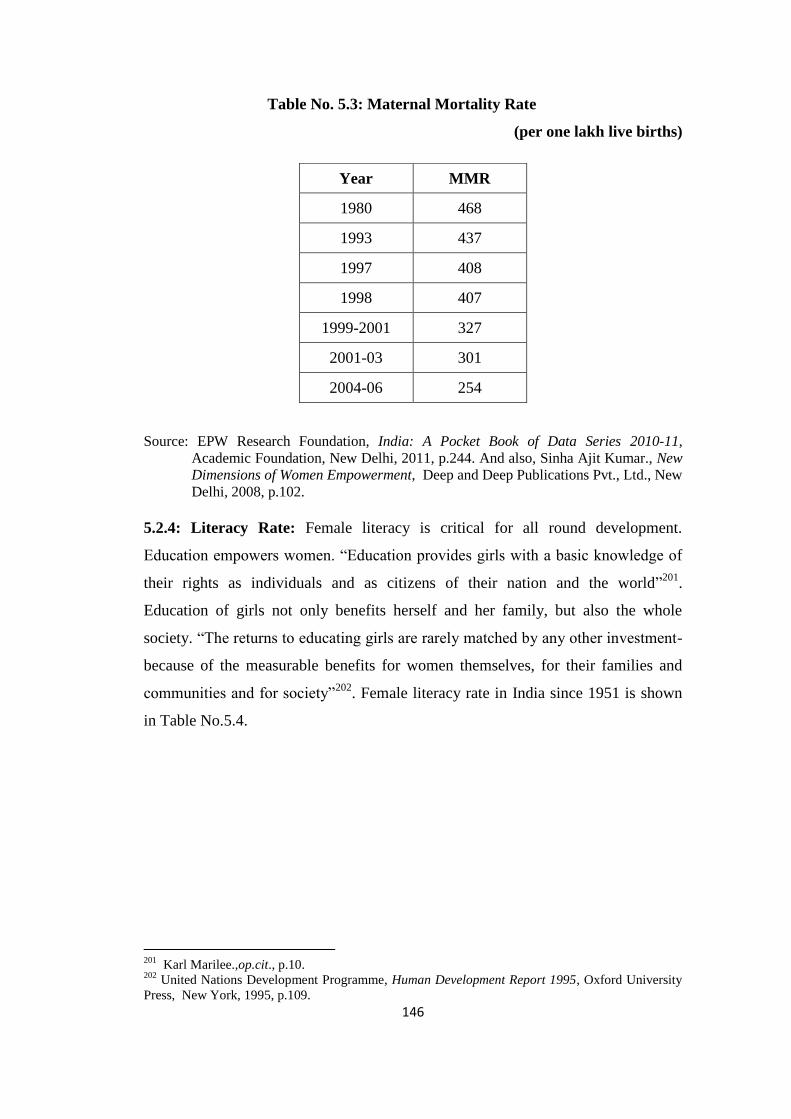
5.2.3: Maternal Mortality Rate (MMR): Maternal Mortality Rate is the number
of maternal deaths per 100,000 live births. Table No.5.3 highlights the maternal
mortality rate for selected years. It is important to note that though maternal
mortality rate has continuously declined over the years, it is still high. According to
Human Development Report 2006 maternal mortality rate was 540 for India, 92 for
Sri Lanka, 56 for China, 17 for United States and 8 for Australia200
. In India,
maternal mortality rate was 468 in the year 1980 and has declined to 437 in 1993
and further to 408 in the year 1997. In the year 1998 it has marginally declined to
407. It has further declined to 327 during 1999-2001 to 301 during 2001-03 and to
254 in 2004-06. Lack of timely health care facilities for expectant women may be
the reason that can be attributed for high mortality rate in India.
200
United Nations Development Programme, Human Development Report 2006, Oxford University
Press, New York, 2006, pp.315-317.
146
Table No. 5.3: Maternal Mortality Rate
(per one lakh live births)
Source: EPW Research Foundation, India: A Pocket Book of Data Series 2010-11,
Academic Foundation, New Delhi, 2011, p.244. And also, Sinha Ajit Kumar., New
Dimensions of Women Empowerment, Deep and Deep Publications Pvt., Ltd., New
Delhi, 2008, p.102.
5.2.4: Literacy Rate: Female literacy is critical for all round development.
Education empowers women. “Education provides girls with a basic knowledge of
their rights as individuals and as citizens of their nation and the world”201
.
Education of girls not only benefits herself and her family, but also the whole
society. “The returns to educating girls are rarely matched by any other investment-
because of the measurable benefits for women themselves, for their families and
communities and for society”202
. Female literacy rate in India since 1951 is shown
in Table No.5.4.
201
Karl Marilee.,op.cit., p.10. 202
United Nations Development Programme, Human Development Report 1995, Oxford University
Press, New York, 1995, p.109.
Year MMR
1980 468
1993 437
1997 408
1998 407
1999-2001 327
2001-03 301
2004-06 254
147
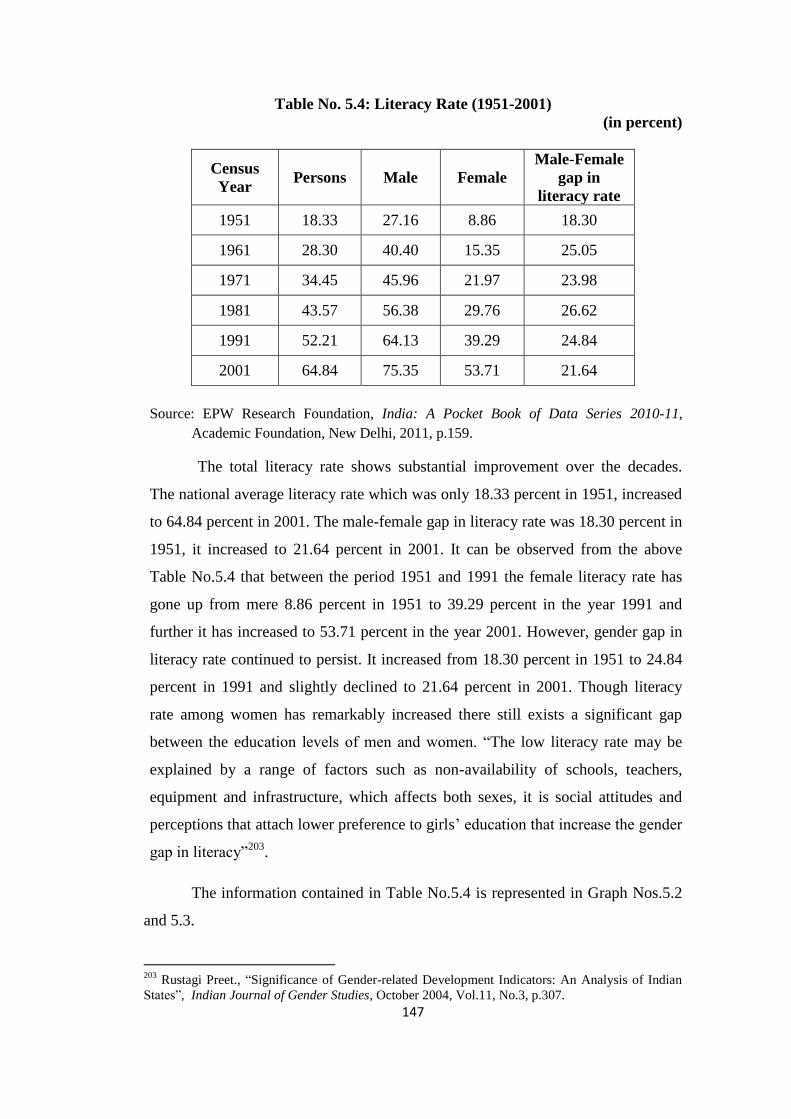
Table No. 5.4: Literacy Rate (1951-2001)
(in percent)
Census
Year Persons Male Female
Male-Female
gap in
literacy rate
1951 18.33 27.16 8.86 18.30
1961 28.30 40.40 15.35 25.05
1971 34.45 45.96 21.97 23.98
1981 43.57 56.38 29.76 26.62
1991 52.21 64.13 39.29 24.84
2001 64.84 75.35 53.71 21.64
Source: EPW Research Foundation, India: A Pocket Book of Data Series 2010-11,
Academic Foundation, New Delhi, 2011, p.159.
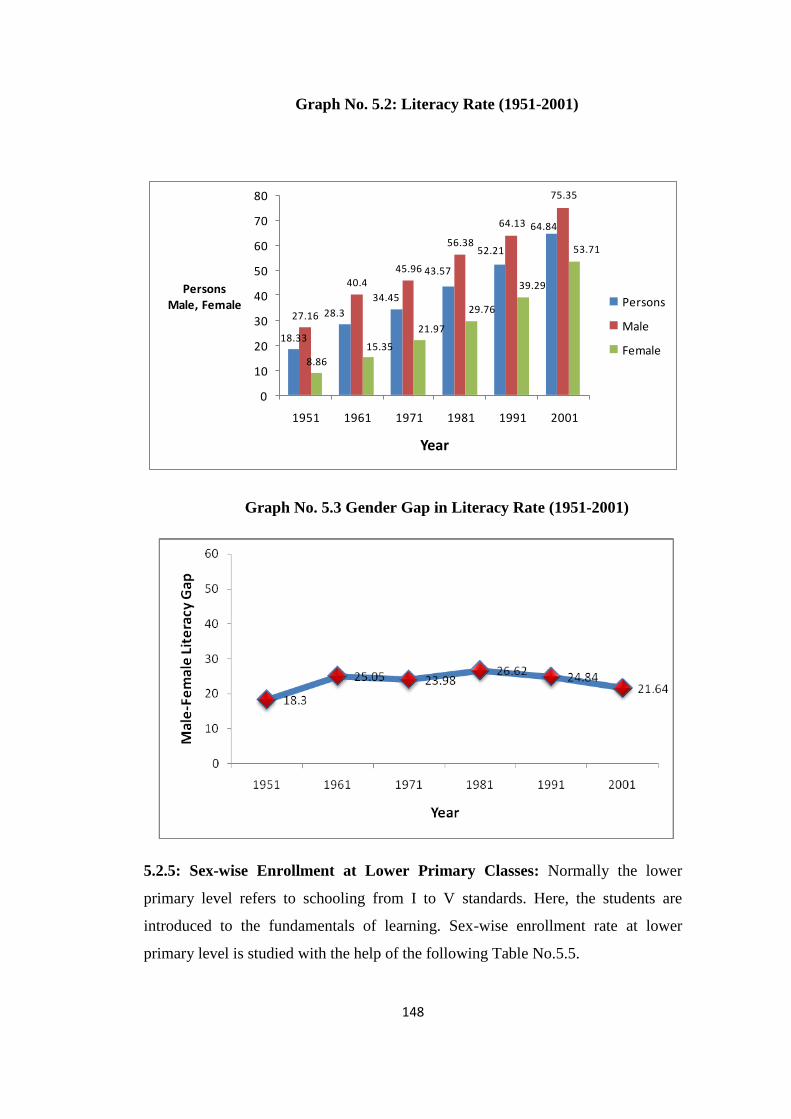
The total literacy rate shows substantial improvement over the decades.
The national average literacy rate which was only 18.33 percent in 1951, increased
to 64.84 percent in 2001. The male-female gap in literacy rate was 18.30 percent in
1951, it increased to 21.64 percent in 2001. It can be observed from the above
Table No.5.4 that between the period 1951 and 1991 the female literacy rate has
gone up from mere 8.86 percent in 1951 to 39.29 percent in the year 1991 and
further it has increased to 53.71 percent in the year 2001. However, gender gap in
literacy rate continued to persist. It increased from 18.30 percent in 1951 to 24.84
percent in 1991 and slightly declined to 21.64 percent in 2001. Though literacy
rate among women has remarkably increased there still exists a significant gap
between the education levels of men and women. “The low literacy rate may be
explained by a range of factors such as non-availability of schools, teachers,
equipment and infrastructure, which affects both sexes, it is social attitudes and
perceptions that attach lower preference to girls‟ education that increase the gender
gap in literacy”203
.
The information contained in Table No.5.4 is represented in Graph Nos.5.2
and 5.3.
203
Rustagi Preet., “Significance of Gender-related Development Indicators: An Analysis of Indian
States”, Indian Journal of Gender Studies, October 2004, Vol.11, No.3, p.307.
148
Graph No. 5.2: Literacy Rate (1951-2001)
18.33
28.3
34.45
43.57
52.21
64.84
27.16
40.4
45.96
56.38
64.13
75.35
8.86
15.35
21.97
29.76
39.29
53.71
0
10
20
30
40
50
60
70
80
1951 1961 1971 1981 1991 2001
Persons Male, Female
Year
Persons
Male
Female
Graph No. 5.3 Gender Gap in Literacy Rate (1951-2001)
5.2.5: Sex-wise Enrollment at Lower Primary Classes: Normally the lower
primary level refers to schooling from I to V standards. Here, the students are
introduced to the fundamentals of learning. Sex-wise enrollment rate at lower
primary level is studied with the help of the following Table No.5.5.
149
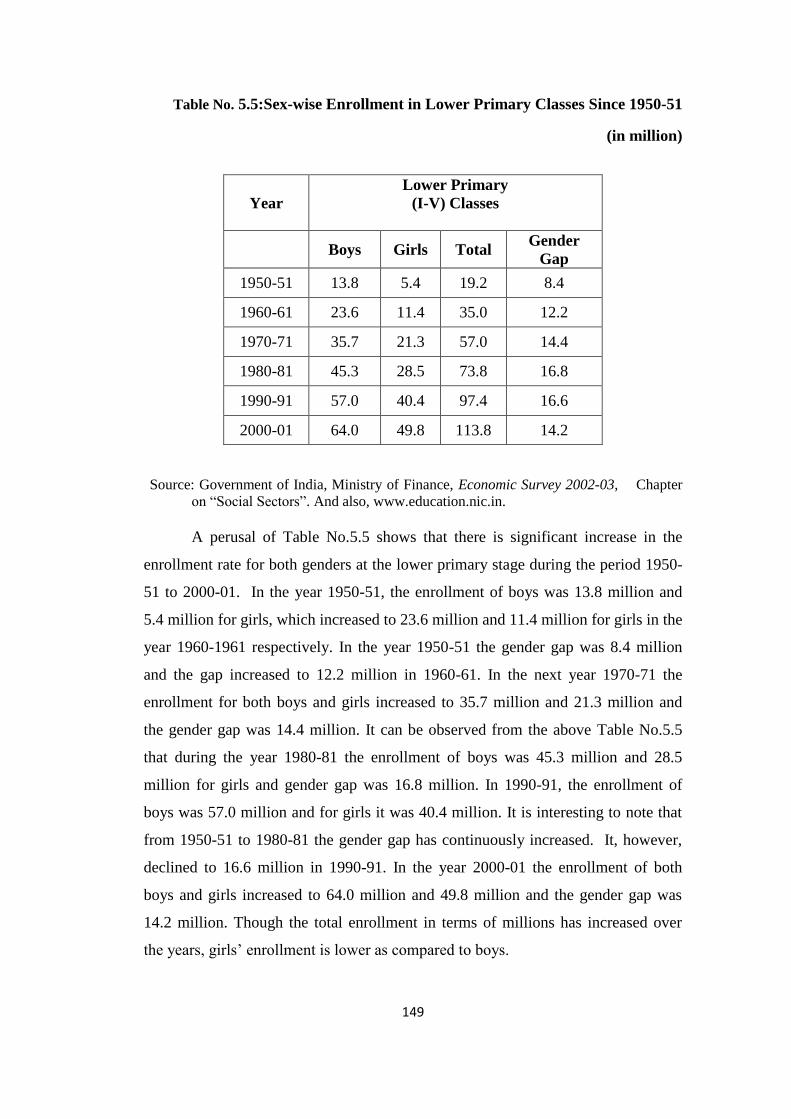
Table No. 5.5:Sex-wise Enrollment in Lower Primary Classes Since 1950-51
(in million)
Source: Government of India, Ministry of Finance, Economic Survey 2002-03, Chapter
on “Social Sectors”. And also, www.education.nic.in.
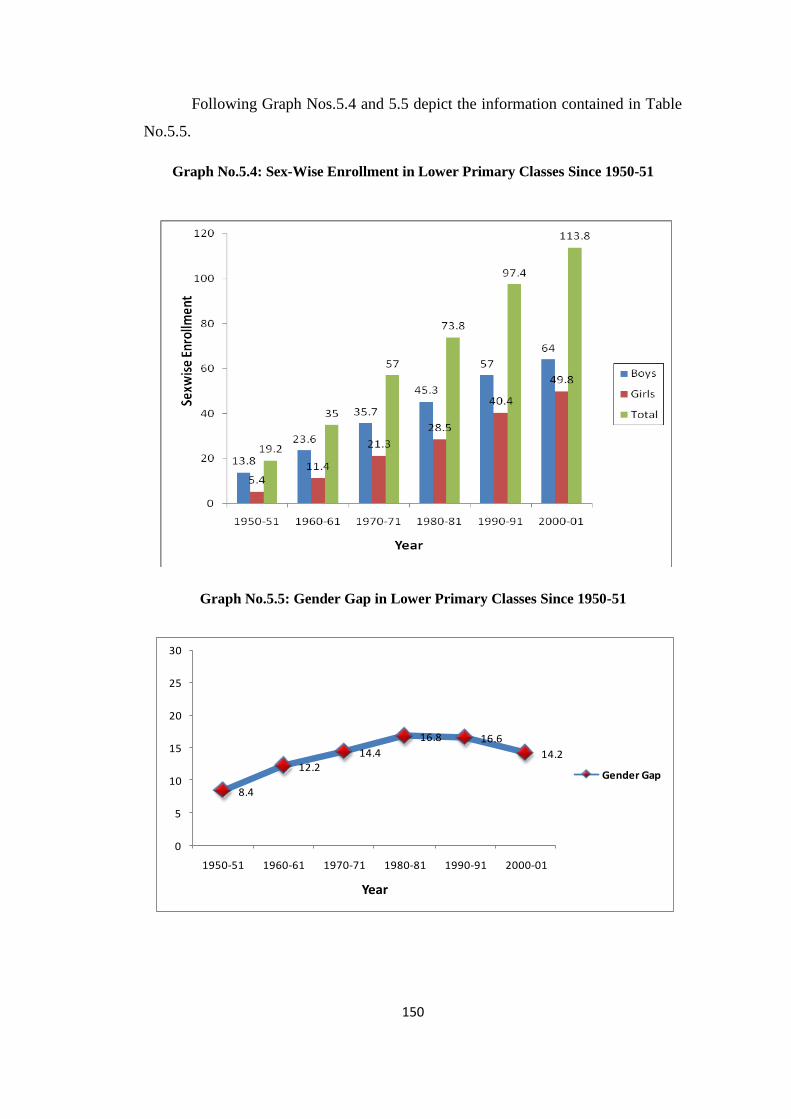
A perusal of Table No.5.5 shows that there is significant increase in the
enrollment rate for both genders at the lower primary stage during the period 1950-
51 to 2000-01. In the year 1950-51, the enrollment of boys was 13.8 million and
5.4 million for girls, which increased to 23.6 million and 11.4 million for girls in the
year 1960-1961 respectively. In the year 1950-51 the gender gap was 8.4 million
and the gap increased to 12.2 million in 1960-61. In the next year 1970-71 the
enrollment for both boys and girls increased to 35.7 million and 21.3 million and
the gender gap was 14.4 million. It can be observed from the above Table No.5.5
that during the year 1980-81 the enrollment of boys was 45.3 million and 28.5
million for girls and gender gap was 16.8 million. In 1990-91, the enrollment of
boys was 57.0 million and for girls it was 40.4 million. It is interesting to note that
from 1950-51 to 1980-81 the gender gap has continuously increased. It, however,
declined to 16.6 million in 1990-91. In the year 2000-01 the enrollment of both
boys and girls increased to 64.0 million and 49.8 million and the gender gap was
14.2 million. Though the total enrollment in terms of millions has increased over
the years, girls‟ enrollment is lower as compared to boys.
Year
Lower Primary
(I-V) Classes
Boys Girls Total Gender
Gap
1950-51 13.8 5.4 19.2 8.4
1960-61 23.6 11.4 35.0 12.2
1970-71 35.7 21.3 57.0 14.4
1980-81 45.3 28.5 73.8 16.8
1990-91 57.0 40.4 97.4 16.6
2000-01 64.0 49.8 113.8 14.2
150
Following Graph Nos.5.4 and 5.5 depict the information contained in Table
No.5.5.
Graph No.5.4: Sex-Wise Enrollment in Lower Primary Classes Since 1950-51
Graph No.5.5: Gender Gap in Lower Primary Classes Since 1950-51
8.4
12.214.4
16.8 16.6
14.2
0
5
10
15
20
25
30
1950-51 1960-61 1970-71 1980-81 1990-91 2000-01
Year
Gender Gap
151
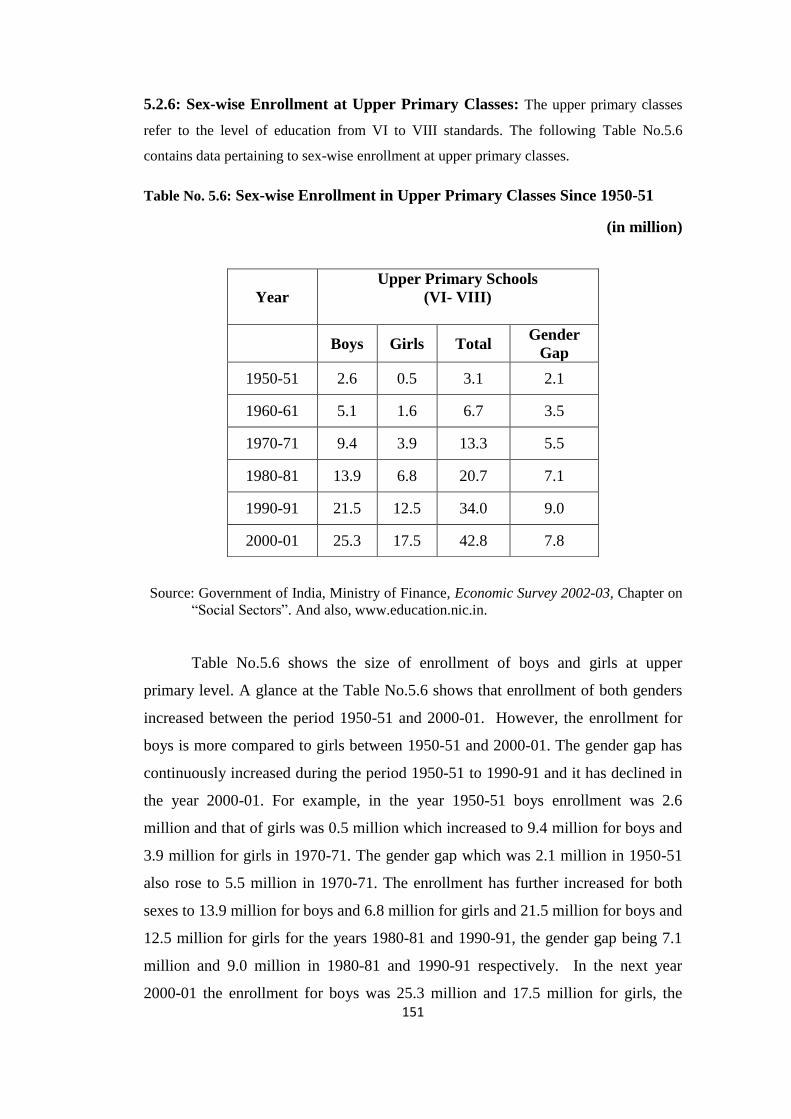
5.2.6: Sex-wise Enrollment at Upper Primary Classes: The upper primary classes
refer to the level of education from VI to VIII standards. The following Table No.5.6
contains data pertaining to sex-wise enrollment at upper primary classes.
Table No. 5.6: Sex-wise Enrollment in Upper Primary Classes Since 1950-51
(in million)
Source: Government of India, Ministry of Finance, Economic Survey 2002-03, Chapter on
“Social Sectors”. And also, www.education.nic.in.
Table No.5.6 shows the size of enrollment of boys and girls at upper
primary level. A glance at the Table No.5.6 shows that enrollment of both genders
increased between the period 1950-51 and 2000-01. However, the enrollment for
boys is more compared to girls between 1950-51 and 2000-01. The gender gap has
continuously increased during the period 1950-51 to 1990-91 and it has declined in
the year 2000-01. For example, in the year 1950-51 boys enrollment was 2.6
million and that of girls was 0.5 million which increased to 9.4 million for boys and
3.9 million for girls in 1970-71. The gender gap which was 2.1 million in 1950-51
also rose to 5.5 million in 1970-71. The enrollment has further increased for both
sexes to 13.9 million for boys and 6.8 million for girls and 21.5 million for boys and
12.5 million for girls for the years 1980-81 and 1990-91, the gender gap being 7.1
million and 9.0 million in 1980-81 and 1990-91 respectively. In the next year
2000-01 the enrollment for boys was 25.3 million and 17.5 million for girls, the
Year
Upper Primary Schools
(VI- VIII)
Boys Girls Total Gender
Gap
1950-51 2.6 0.5 3.1 2.1
1960-61 5.1 1.6 6.7 3.5
1970-71 9.4 3.9 13.3 5.5
1980-81 13.9 6.8 20.7 7.1
1990-91 21.5 12.5 34.0 9.0
2000-01 25.3 17.5 42.8 7.8
152
gender gap stood at 7.8 million. There is decline in the gender gap in the year 2000-
01 by 1.2 million compared to 1990-91.
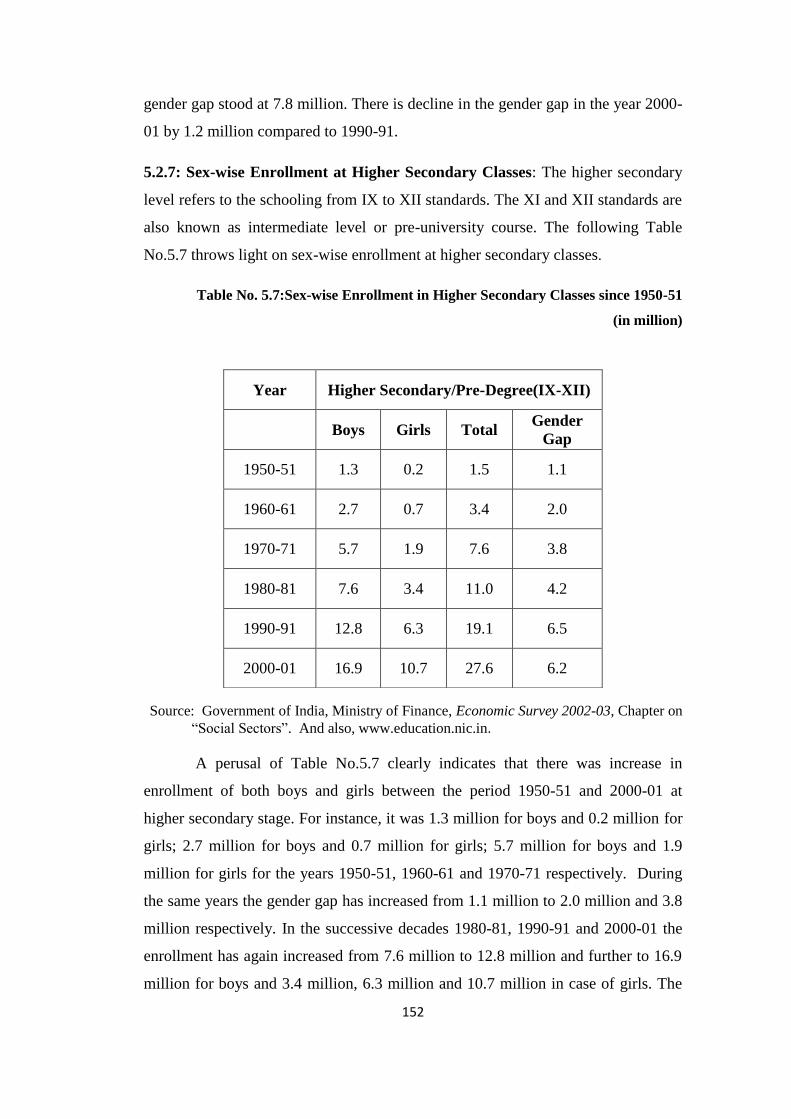
5.2.7: Sex-wise Enrollment at Higher Secondary Classes: The higher secondary
level refers to the schooling from IX to XII standards. The XI and XII standards are
also known as intermediate level or pre-university course. The following Table
No.5.7 throws light on sex-wise enrollment at higher secondary classes.
Table No. 5.7:Sex-wise Enrollment in Higher Secondary Classes since 1950-51
(in million)
Source: Government of India, Ministry of Finance, Economic Survey 2002-03, Chapter on
“Social Sectors”. And also, www.education.nic.in.
A perusal of Table No.5.7 clearly indicates that there was increase in
enrollment of both boys and girls between the period 1950-51 and 2000-01 at
higher secondary stage. For instance, it was 1.3 million for boys and 0.2 million for
girls; 2.7 million for boys and 0.7 million for girls; 5.7 million for boys and 1.9
million for girls for the years 1950-51, 1960-61 and 1970-71 respectively. During
the same years the gender gap has increased from 1.1 million to 2.0 million and 3.8
million respectively. In the successive decades 1980-81, 1990-91 and 2000-01 the
enrollment has again increased from 7.6 million to 12.8 million and further to 16.9
million for boys and 3.4 million, 6.3 million and 10.7 million in case of girls. The
Year Higher Secondary/Pre-Degree(IX-XII)
Boys Girls Total Gender
Gap
1950-51 1.3 0.2 1.5 1.1
1960-61 2.7 0.7 3.4 2.0
1970-71 5.7 1.9 7.6 3.8
1980-81 7.6 3.4 11.0 4.2
1990-91 12.8 6.3 19.1 6.5
2000-01 16.9 10.7 27.6 6.2
153
gender gap, however, has rose to 4.2 million in 1980-81 and again to 6.5 million in
1990-91 and it declined marginally to 6.2 million in the year 2000-01.
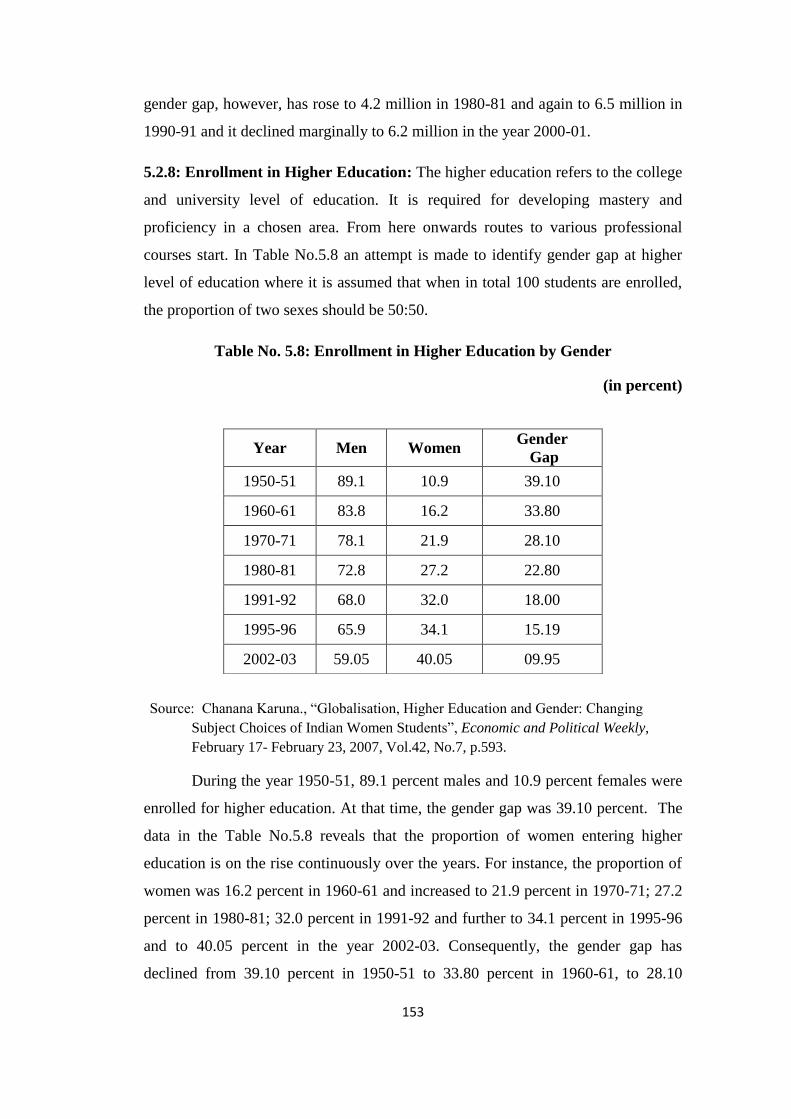
5.2.8: Enrollment in Higher Education: The higher education refers to the college
and university level of education. It is required for developing mastery and
proficiency in a chosen area. From here onwards routes to various professional
courses start. In Table No.5.8 an attempt is made to identify gender gap at higher
level of education where it is assumed that when in total 100 students are enrolled,
the proportion of two sexes should be 50:50.
Table No. 5.8: Enrollment in Higher Education by Gender
(in percent)
Source: Chanana Karuna., “Globalisation, Higher Education and Gender: Changing
Subject Choices of Indian Women Students”, Economic and Political Weekly,
February 17- February 23, 2007, Vol.42, No.7, p.593.
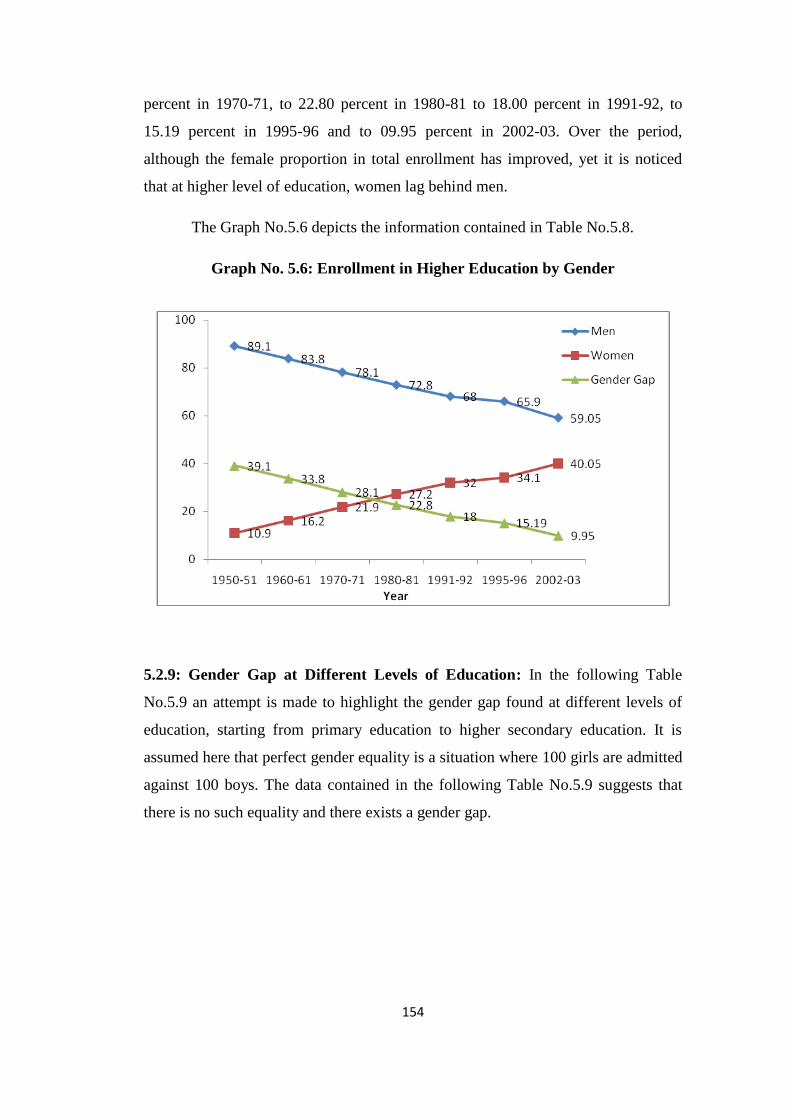
During the year 1950-51, 89.1 percent males and 10.9 percent females were
enrolled for higher education. At that time, the gender gap was 39.10 percent. The
data in the Table No.5.8 reveals that the proportion of women entering higher
education is on the rise continuously over the years. For instance, the proportion of
women was 16.2 percent in 1960-61 and increased to 21.9 percent in 1970-71; 27.2
percent in 1980-81; 32.0 percent in 1991-92 and further to 34.1 percent in 1995-96
and to 40.05 percent in the year 2002-03. Consequently, the gender gap has
declined from 39.10 percent in 1950-51 to 33.80 percent in 1960-61, to 28.10
Year Men Women Gender
Gap
1950-51 89.1 10.9 39.10
1960-61 83.8 16.2 33.80
1970-71 78.1 21.9 28.10
1980-81 72.8 27.2 22.80
1991-92 68.0 32.0 18.00
1995-96 65.9 34.1 15.19
2002-03 59.05 40.05 09.95
154
percent in 1970-71, to 22.80 percent in 1980-81 to 18.00 percent in 1991-92, to
15.19 percent in 1995-96 and to 09.95 percent in 2002-03. Over the period,
although the female proportion in total enrollment has improved, yet it is noticed
that at higher level of education, women lag behind men.
The Graph No.5.6 depicts the information contained in Table No.5.8.
Graph No. 5.6: Enrollment in Higher Education by Gender
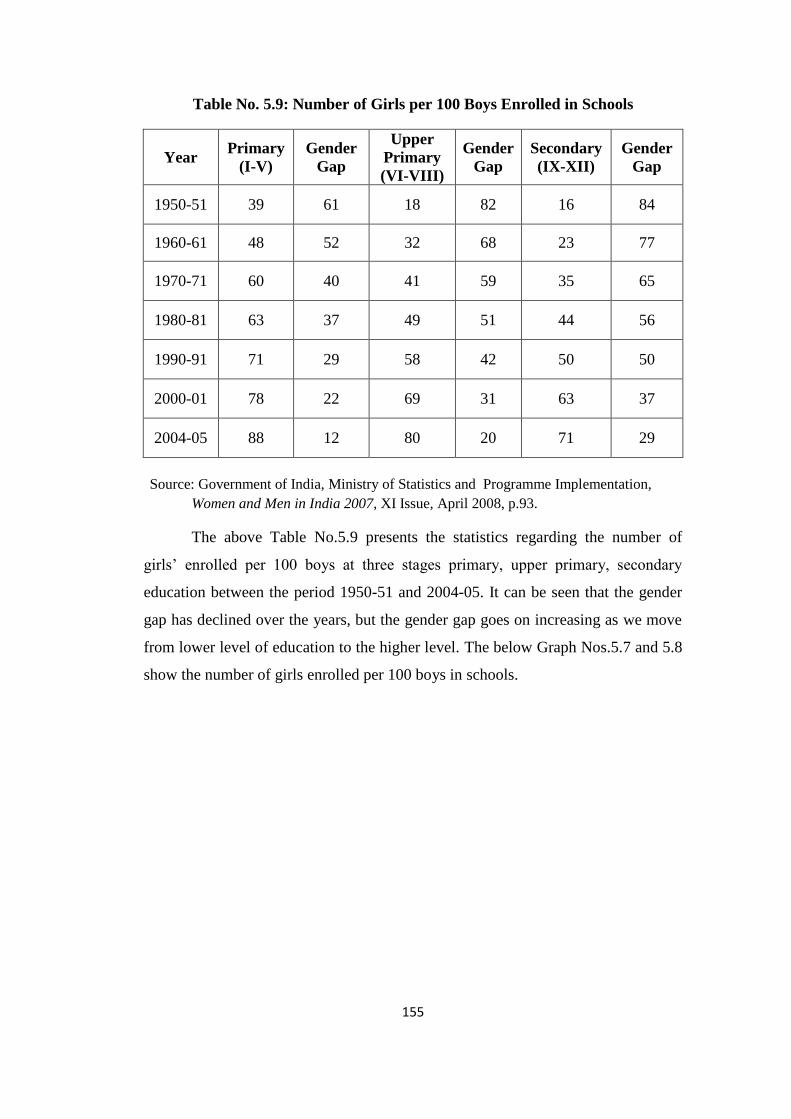
5.2.9: Gender Gap at Different Levels of Education: In the following Table
No.5.9 an attempt is made to highlight the gender gap found at different levels of
education, starting from primary education to higher secondary education. It is
assumed here that perfect gender equality is a situation where 100 girls are admitted
against 100 boys. The data contained in the following Table No.5.9 suggests that
there is no such equality and there exists a gender gap.
155
Table No. 5.9: Number of Girls per 100 Boys Enrolled in Schools
Year Primary
(I-V)
Gender
Gap
Upper
Primary
(VI-VIII)
Gender
Gap
Secondary
(IX-XII)
Gender
Gap
1950-51 39 61 18 82 16 84
1960-61 48 52 32 68 23 77
1970-71 60 40 41 59 35 65
1980-81 63 37 49 51 44 56
1990-91 71 29 58 42 50 50
2000-01 78 22 69 31 63 37
2004-05 88 12 80 20 71 29
Source: Government of India, Ministry of Statistics and Programme Implementation,
Women and Men in India 2007, XI Issue, April 2008, p.93.
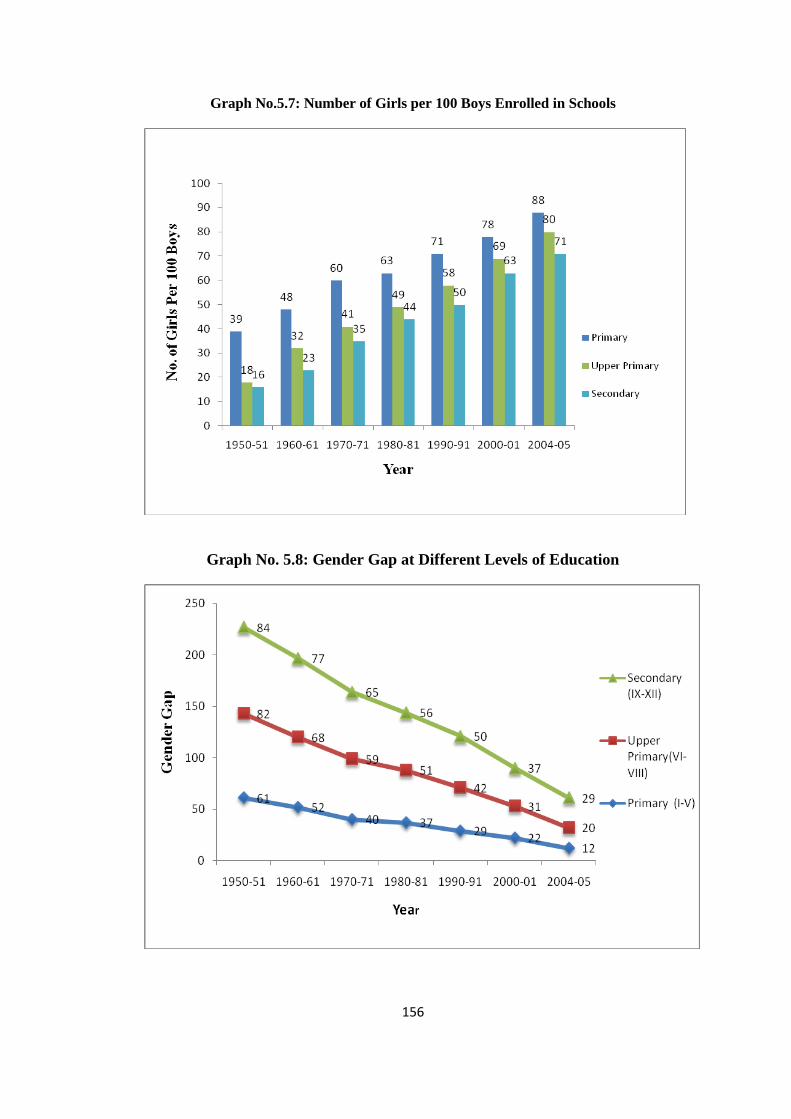
The above Table No.5.9 presents the statistics regarding the number of
girls‟ enrolled per 100 boys at three stages primary, upper primary, secondary
education between the period 1950-51 and 2004-05. It can be seen that the gender
gap has declined over the years, but the gender gap goes on increasing as we move
from lower level of education to the higher level. The below Graph Nos.5.7 and 5.8
show the number of girls enrolled per 100 boys in schools.
156
Graph No.5.7: Number of Girls per 100 Boys Enrolled in Schools
Graph No. 5.8: Gender Gap at Different Levels of Education
157
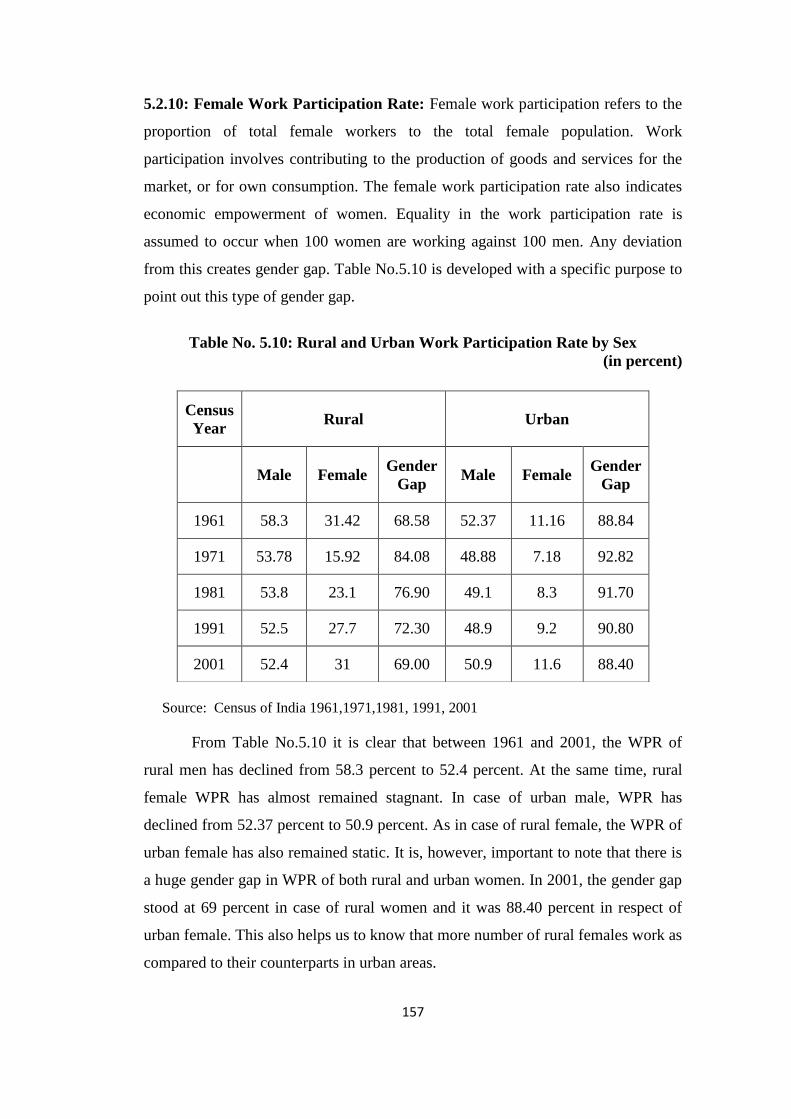
5.2.10: Female Work Participation Rate: Female work participation refers to the
proportion of total female workers to the total female population. Work
participation involves contributing to the production of goods and services for the
market, or for own consumption. The female work participation rate also indicates
economic empowerment of women. Equality in the work participation rate is
assumed to occur when 100 women are working against 100 men. Any deviation
from this creates gender gap. Table No.5.10 is developed with a specific purpose to
point out this type of gender gap.
Table No. 5.10: Rural and Urban Work Participation Rate by Sex
(in percent)
Source: Census of India 1961,1971,1981, 1991, 2001
From Table No.5.10 it is clear that between 1961 and 2001, the WPR of
rural men has declined from 58.3 percent to 52.4 percent. At the same time, rural
female WPR has almost remained stagnant. In case of urban male, WPR has
declined from 52.37 percent to 50.9 percent. As in case of rural female, the WPR of
urban female has also remained static. It is, however, important to note that there is
a huge gender gap in WPR of both rural and urban women. In 2001, the gender gap
stood at 69 percent in case of rural women and it was 88.40 percent in respect of
urban female. This also helps us to know that more number of rural females work as
compared to their counterparts in urban areas.
Census
Year Rural Urban
Male Female Gender
Gap Male Female
Gender
Gap
1961 58.3 31.42 68.58 52.37 11.16 88.84
1971 53.78 15.92 84.08 48.88 7.18 92.82
1981 53.8 23.1 76.90 49.1 8.3 91.70
1991 52.5 27.7 72.30 48.9 9.2 90.80
2001 52.4 31 69.00 50.9 11.6 88.40
158
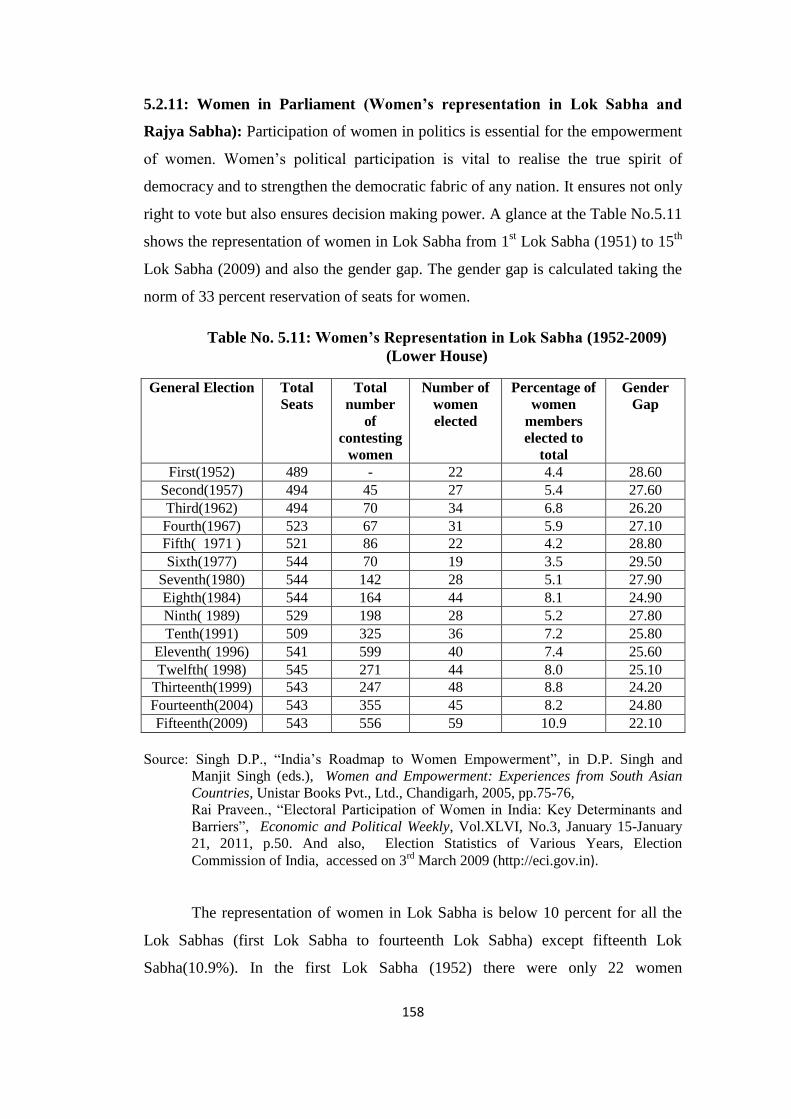
5.2.11: Women in Parliament (Women’s representation in Lok Sabha and
Rajya Sabha): Participation of women in politics is essential for the empowerment
of women. Women‟s political participation is vital to realise the true spirit of
democracy and to strengthen the democratic fabric of any nation. It ensures not only
right to vote but also ensures decision making power. A glance at the Table No.5.11
shows the representation of women in Lok Sabha from 1st Lok Sabha (1951) to 15
th
Lok Sabha (2009) and also the gender gap. The gender gap is calculated taking the
norm of 33 percent reservation of seats for women.
Table No. 5.11: Women’s Representation in Lok Sabha (1952-2009)
(Lower House)
General Election Total
Seats
Total
number
of
contesting
women
Number of
women
elected
Percentage of
women
members
elected to
total
Gender
Gap
First(1952) 489 - 22 4.4 28.60
Second(1957) 494 45 27 5.4 27.60
Third(1962) 494 70 34 6.8 26.20
Fourth(1967) 523 67 31 5.9 27.10
Fifth( 1971 ) 521 86 22 4.2 28.80
Sixth(1977) 544 70 19 3.5 29.50
Seventh(1980) 544 142 28 5.1 27.90
Eighth(1984) 544 164 44 8.1 24.90
Ninth( 1989) 529 198 28 5.2 27.80
Tenth(1991) 509 325 36 7.2 25.80
Eleventh( 1996) 541 599 40 7.4 25.60
Twelfth( 1998) 545 271 44 8.0 25.10
Thirteenth(1999) 543 247 48 8.8 24.20
Fourteenth(2004) 543 355 45 8.2 24.80
Fifteenth(2009) 543 556 59 10.9 22.10
Source: Singh D.P., “India‟s Roadmap to Women Empowerment”, in D.P. Singh and
Manjit Singh (eds.), Women and Empowerment: Experiences from South Asian
Countries, Unistar Books Pvt., Ltd., Chandigarh, 2005, pp.75-76,
Rai Praveen., “Electoral Participation of Women in India: Key Determinants and
Barriers”, Economic and Political Weekly, Vol.XLVI, No.3, January 15-January
21, 2011, p.50. And also, Election Statistics of Various Years, Election
Commission of India, accessed on 3rd
March 2009 (http://eci.gov.in).
The representation of women in Lok Sabha is below 10 percent for all the
Lok Sabhas (first Lok Sabha to fourteenth Lok Sabha) except fifteenth Lok
Sabha(10.9%). In the first Lok Sabha (1952) there were only 22 women
159
representing 4.4 percent of the total strength of the Lower House. The second Lok
Sabha (1957) had 27 women members constituting 5.4 percent of the total. It can be
observed that the representation of women has increased gradually over the years,
except in the sixth Lok Sabha (1977) which had only 19 women members
representing 3.5 percent to the total. The figures in the subsequent Lok Sabhas are:
third Lok Sabha (1962) had 34 women members representing 6.8 percent of the
total; fourth Lok Sabha (1967) consisted of 31 women members, 5.9 percent of the
total; fifth Lok Sabha (1971) had 22 women members representing 4.2 percent of
the total. Similarly, seventh Lok Sabha (1980) had 28 women members (5.1% of
the total); eighth Lok Sabha (1984) comprised of 44 women representatives (8.1%
to the total); ninth Lok Sabha (1989) had 28 women members (5.2% to total); tenth
Lok Sabha (1991) consisted of 36 women members (7.0% to total); eleventh Lok
Sabha (1996) had 40 women members (7.4% to total) and twelfth Lok Sabha (1998)
had 44 women members (8.0% to total). The thirteenth Lok Sabha (1999) had the
maximum of 48 women members constituting 8.8 percent of the total strength of
Lok Sabha. The fourteenth Lok Sabha (2004) had 45 members (8.2% to total) and
fifteenth Lok Sabha (2009) had 59 members constituting 10.9 percent of the total. It
is clear from Table No.5.11 that from the first Lok Sabha to fourteenth Lok Sabha
the percentage of elected women has never exceeded 10 percent. The gender gap
has fluctuated between a maximum of 29.50 percent in sixth Lok Sabha and 22.10
percent in fifteenth Lok Sabha.
The main factors attributed to low representation are204
:
1. socio-historic forces inherited from nationalist movements, current social
policies and the gendered nature of citizenship in hampering women‟s
political participation in government structures, elections and community
organisations;
2. lack of reservation of seats for women in the parliament and state
legislatures;
3. the lack of national consensus and willingness among political parties to
give more tickets to women in elections;
204
Rai Praveen., op.cit., p.50.
160
4. perpetuation of a patriarchal political structure together with class, caste
and gender subordination acting as strong deterrents to women contesting
elections;
5. the lack of awareness and knowledge of electoral politics combined with a
lack of support from the family and political parties in resources, severely
affects women‟s chances to contest and win elections.
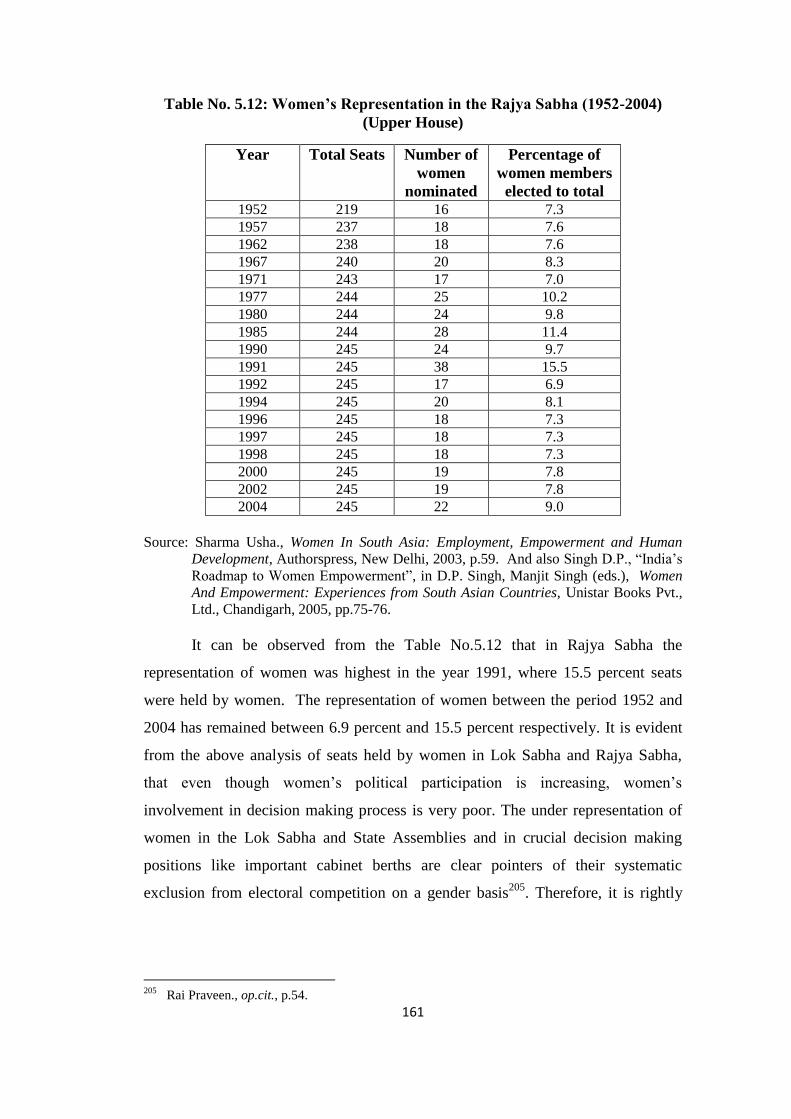
Women’s Representation in the Rajya Sabha (1952-2004) (Upper House):
The Rajya Sabha is upper house of the Parliament. Since British parliamentary
system is adopted, the upper house greatly resembles to the House of Lords and
the lower house greatly resembles to the House of Commons. Here a few
members are elected from the Lok Sabha and a few are nominated by political
parties and still a few others are nominated by the President. The Rajya Sabha is
presided over by the Chairman who happens to be the Vice President of India.
He is assisted by the Deputy Chairman. The following Table No.5.12 highlights
total number of seats held by women in Rajya sabha from 1952 to 2004.
161
Table No. 5.12: Women’s Representation in the Rajya Sabha (1952-2004)
(Upper House)
Year Total Seats Number of
women
nominated
Percentage of
women members
elected to total 1952 219 16 7.3
1957 237 18 7.6
1962 238 18 7.6
1967 240 20 8.3
1971 243 17 7.0
1977 244 25 10.2
1980 244 24 9.8
1985 244 28 11.4
1990 245 24 9.7
1991 245 38 15.5
1992 245 17 6.9
1994 245 20 8.1
1996 245 18 7.3
1997 245 18 7.3
1998 245 18 7.3
2000 245 19 7.8
2002 245 19 7.8
2004 245 22 9.0
Source: Sharma Usha., Women In South Asia: Employment, Empowerment and Human
Development, Authorspress, New Delhi, 2003, p.59. And also Singh D.P., “India‟s
Roadmap to Women Empowerment”, in D.P. Singh, Manjit Singh (eds.), Women
And Empowerment: Experiences from South Asian Countries, Unistar Books Pvt.,
Ltd., Chandigarh, 2005, pp.75-76.
It can be observed from the Table No.5.12 that in Rajya Sabha the
representation of women was highest in the year 1991, where 15.5 percent seats
were held by women. The representation of women between the period 1952 and
2004 has remained between 6.9 percent and 15.5 percent respectively. It is evident
from the above analysis of seats held by women in Lok Sabha and Rajya Sabha,
that even though women‟s political participation is increasing, women‟s
involvement in decision making process is very poor. The under representation of
women in the Lok Sabha and State Assemblies and in crucial decision making
positions like important cabinet berths are clear pointers of their systematic
exclusion from electoral competition on a gender basis205
. Therefore, it is rightly
205
Rai Praveen., op.cit., p.54.
162
remarked in Human Development Report 1995 that, “Political space belongs to all
citizens, but men monopolize it”206
.
5.2.12: Women Judges in Supreme Court and High Courts of India: Judiciary
plays a significant role in a democratic country like India. The Supreme Court of
India is the apex Court, which is the highest body in the entire judicial system. Each
state or group of states has High Court under which there is a hierarchy of
subordinate courts. Each Court has a Chief Justice and such other judges as the
President may, from time to time, appoint. All High Courts have one Chief Justice
and under him there are several judges. The Chief Justice and other judges of
Supreme Court are appointed by the President of India. Chief Justice of a High
Court is appointed by President in consultation with Chief Justice of India and
Governor of the State207
. The procedure for appointing other judges is the same
except the Chief Justice of the High Court concerned is also consulted. The
following Table No.5.13 draws our attention regarding the total number of judges,
male and female, in Supreme Court and in other High Courts of the nation.
206
United Nations Development Programme, Human Development Report 1995, Oxford University
Press, New York, 1995, p.41. 207
Supreme Court of India, accessed on 12th
July 2010 (www.supremecourtofindia.nic.in).
163
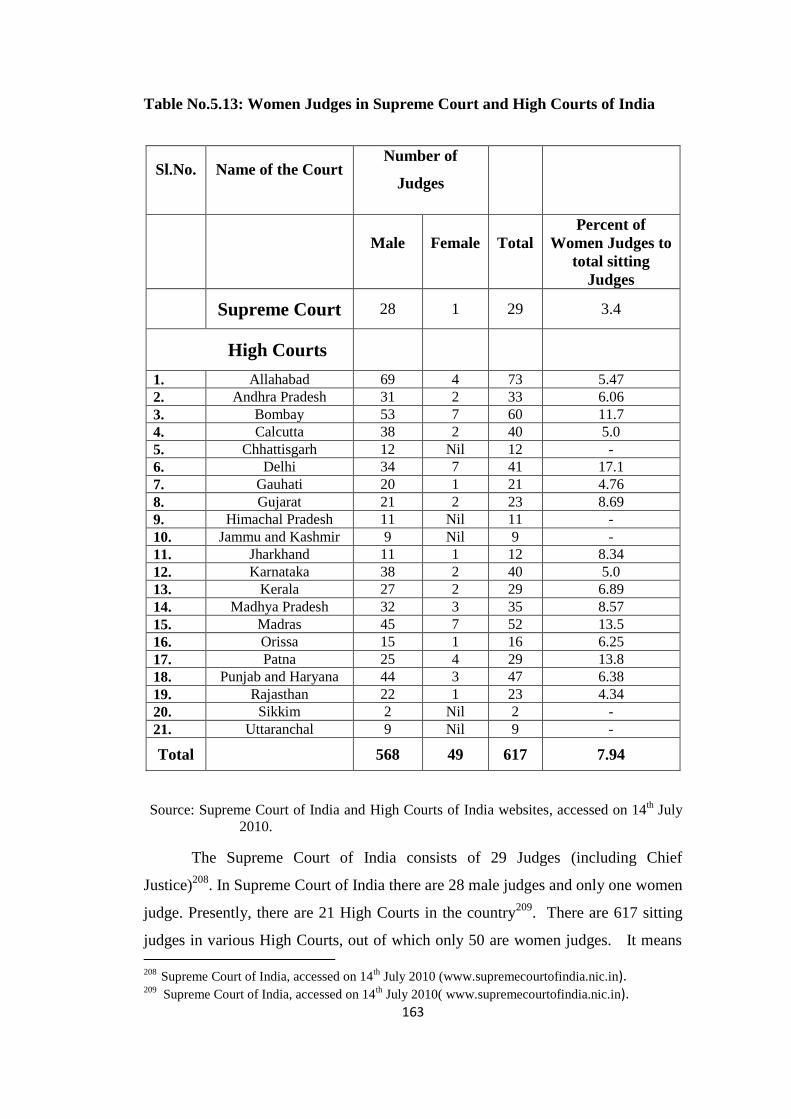
Table No.5.13: Women Judges in Supreme Court and High Courts of India
Source: Supreme Court of India and High Courts of India websites, accessed on 14th July
2010.
The Supreme Court of India consists of 29 Judges (including Chief
Justice)208
. In Supreme Court of India there are 28 male judges and only one women
judge. Presently, there are 21 High Courts in the country209
. There are 617 sitting
judges in various High Courts, out of which only 50 are women judges. It means 208
Supreme Court of India, accessed on 14th
July 2010 (www.supremecourtofindia.nic.in). 209
Supreme Court of India, accessed on 14th
July 2010( www.supremecourtofindia.nic.in).
Sl.No. Name of the Court Number of
Judges
Male
Female
Total
Percent of
Women Judges to
total sitting
Judges
Supreme Court 28 1 29 3.4
High Courts
1. Allahabad 69 4 73 5.47
2. Andhra Pradesh 31 2 33 6.06
3. Bombay 53 7 60 11.7
4. Calcutta 38 2 40 5.0
5. Chhattisgarh 12 Nil 12 -
6. Delhi 34 7 41 17.1
7. Gauhati 20 1 21 4.76
8. Gujarat 21 2 23 8.69
9. Himachal Pradesh 11 Nil 11 -
10. Jammu and Kashmir 9 Nil 9 -
11. Jharkhand 11 1 12 8.34
12. Karnataka 38 2 40 5.0
13. Kerala 27 2 29 6.89
14. Madhya Pradesh 32 3 35 8.57
15. Madras 45 7 52 13.5
16. Orissa 15 1 16 6.25
17. Patna 25 4 29 13.8
18. Punjab and Haryana 44 3 47 6.38
19. Rajasthan 22 1 23 4.34
20. Sikkim 2 Nil 2 -
21. Uttaranchal 9 Nil 9 -
Total 568 49 617 7.94
164
that women judges constitute 7.94 percent to the total. In all the High Courts of
India, the proportion of women judges is meagre. For instance, The Delhi High
Court which has a working strength of 41 judges, has only 7 women judges, The
Bombay High Court has 60 judges, out of which there are only 7 women judges.
Similarly, The Madras High Court has 52 judges and 7 women judges. Allahabad
High Court is the country‟s largest High Court and has 73 judges, of whom only 4
are from the fairer sex. Rajasthan High court has 23 judges and only one women
judge. There are 40 sitting judges in High Court of Karnataka out of which only 2
are women judges. Patna is the only High Court which has women Chief Justice.
These figures present a very dismal picture of gender inequality in
country‟s highest judiciary. In a country like India which seeks 33 percent
reservation for women in Lok Sabha, Rajya Sabha and other State Legislatures,
women‟s representation is not even 10 percent in judiciary. The gender parity is not
visible in the functioning of India‟s highest judiciary. This is an area where serious
efforts are needed to improve the representation of women.
5.2.13: Women in All India Civil Services (IAS, IES, IFS (Foreign), IFS
(Forest), IPS): The All India Services were modelled on the lines of previous
system of ICS. These are the prime and most sought after services in the country.
The best of talent is churned out through a lengthy process handled by the Union
Public Service Commission. Members of these services are actively involved in
decision making process. An important indicator of women empowerment is the
extent of their involvement in the process of decision making at different levels of
government in different capacities.
165
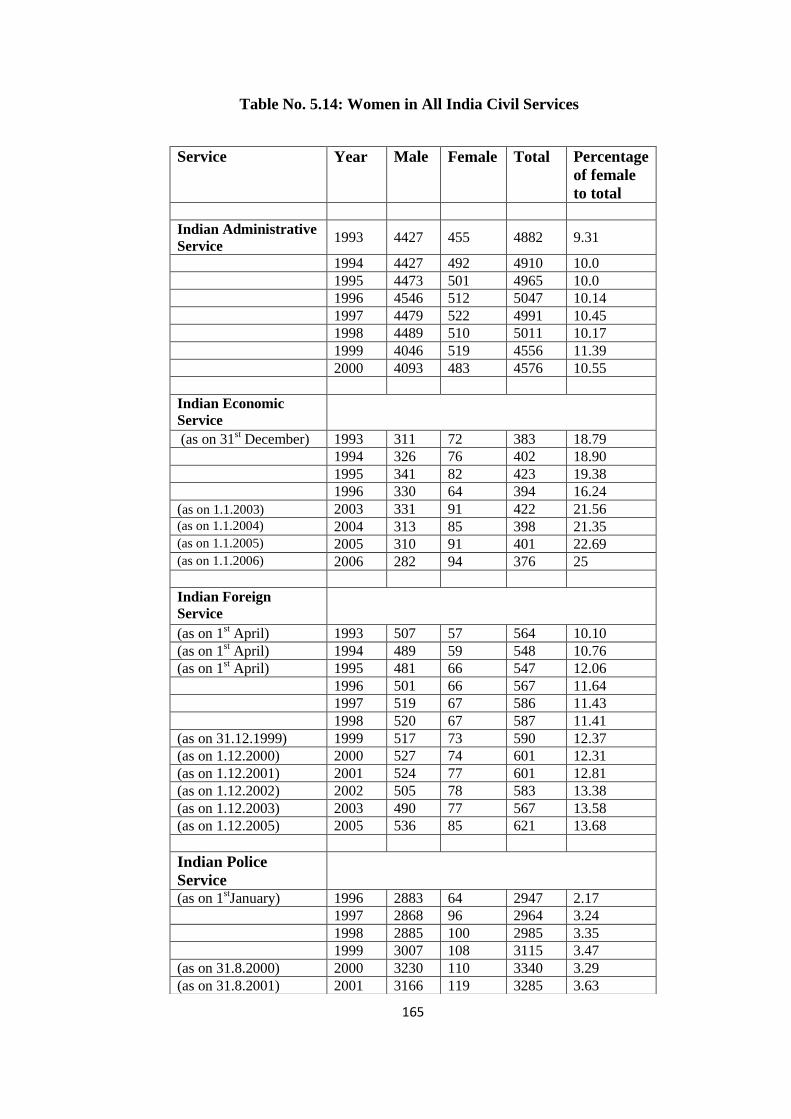
Table No. 5.14: Women in All India Civil Services
Service Year Male Female Total Percentage
of female
to total
Indian Administrative
Service 1993 4427 455 4882 9.31
1994 4427 492 4910 10.0
1995 4473 501 4965 10.0
1996 4546 512 5047 10.14
1997 4479 522 4991 10.45
1998 4489 510 5011 10.17
1999 4046 519 4556 11.39
2000 4093 483 4576 10.55
Indian Economic
Service
(as on 31st December) 1993 311 72 383 18.79
1994 326 76 402 18.90
1995 341 82 423 19.38
1996 330 64 394 16.24
(as on 1.1.2003) 2003 331 91 422 21.56 (as on 1.1.2004) 2004 313 85 398 21.35 (as on 1.1.2005) 2005 310 91 401 22.69 (as on 1.1.2006) 2006 282 94 376 25
Indian Foreign
Service
(as on 1st April) 1993 507 57 564 10.10
(as on 1st April) 1994 489 59 548 10.76
(as on 1st April) 1995 481 66 547 12.06
1996 501 66 567 11.64
1997 519 67 586 11.43
1998 520 67 587 11.41
(as on 31.12.1999) 1999 517 73 590 12.37
(as on 1.12.2000) 2000 527 74 601 12.31
(as on 1.12.2001) 2001 524 77 601 12.81
(as on 1.12.2002) 2002 505 78 583 13.38
(as on 1.12.2003) 2003 490 77 567 13.58
(as on 1.12.2005) 2005 536 85 621 13.68
Indian Police
Service
(as on 1stJanuary) 1996 2883 64 2947 2.17
1997 2868 96 2964 3.24
1998 2885 100 2985 3.35
1999 3007 108 3115 3.47
(as on 31.8.2000) 2000 3230 110 3340 3.29
(as on 31.8.2001) 2001 3166 119 3285 3.63
166
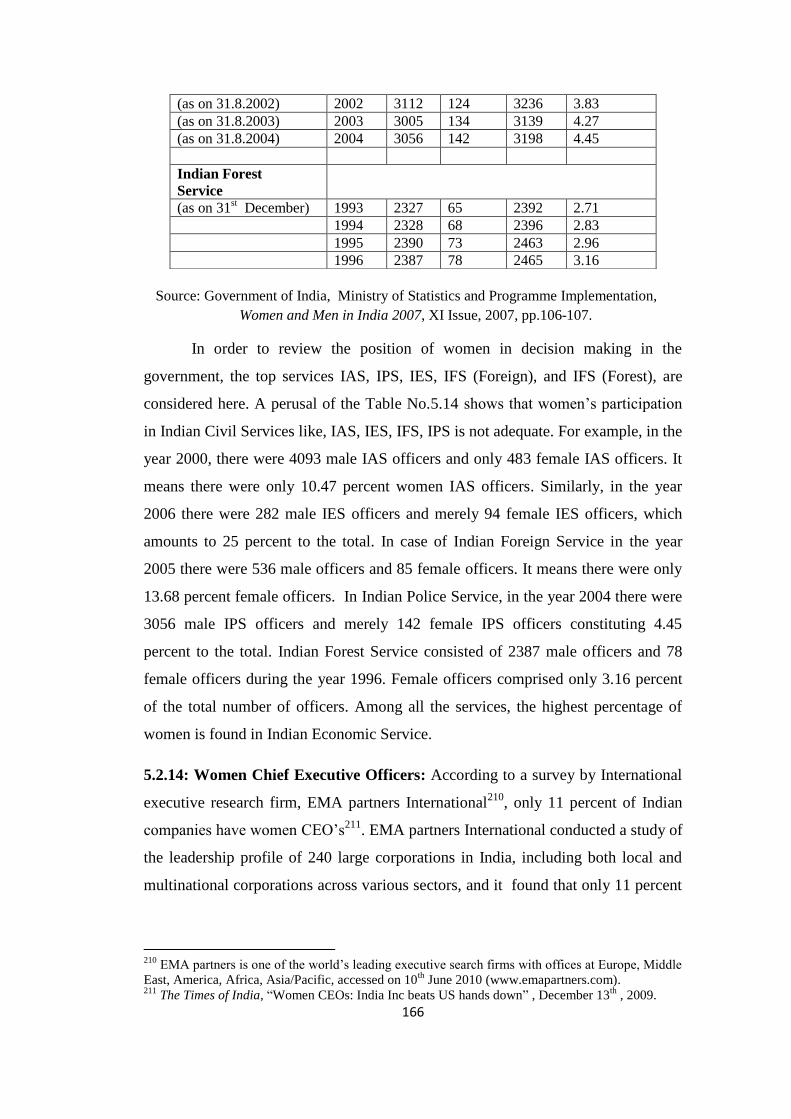
Source: Government of India, Ministry of Statistics and Programme Implementation,
Women and Men in India 2007, XI Issue, 2007, pp.106-107.
In order to review the position of women in decision making in the
government, the top services IAS, IPS, IES, IFS (Foreign), and IFS (Forest), are
considered here. A perusal of the Table No.5.14 shows that women‟s participation
in Indian Civil Services like, IAS, IES, IFS, IPS is not adequate. For example, in the
year 2000, there were 4093 male IAS officers and only 483 female IAS officers. It
means there were only 10.47 percent women IAS officers. Similarly, in the year
2006 there were 282 male IES officers and merely 94 female IES officers, which
amounts to 25 percent to the total. In case of Indian Foreign Service in the year
2005 there were 536 male officers and 85 female officers. It means there were only
13.68 percent female officers. In Indian Police Service, in the year 2004 there were
3056 male IPS officers and merely 142 female IPS officers constituting 4.45
percent to the total. Indian Forest Service consisted of 2387 male officers and 78
female officers during the year 1996. Female officers comprised only 3.16 percent
of the total number of officers. Among all the services, the highest percentage of
women is found in Indian Economic Service.
5.2.14: Women Chief Executive Officers: According to a survey by International
executive research firm, EMA partners International210
, only 11 percent of Indian
companies have women CEO‟s211
. EMA partners International conducted a study of
the leadership profile of 240 large corporations in India, including both local and
multinational corporations across various sectors, and it found that only 11 percent
210
EMA partners is one of the world‟s leading executive search firms with offices at Europe, Middle
East, America, Africa, Asia/Pacific, accessed on 10th
June 2010 (www.emapartners.com). 211
The Times of India, “Women CEOs: India Inc beats US hands down” , December 13th
, 2009.
(as on 31.8.2002) 2002 3112 124 3236 3.83
(as on 31.8.2003) 2003 3005 134 3139 4.27
(as on 31.8.2004) 2004 3056 142 3198 4.45
Indian Forest
Service
(as on 31st December) 1993 2327 65 2392 2.71
1994 2328 68 2396 2.83
1995 2390 73 2463 2.96
1996 2387 78 2465 3.16
167
have women CEO‟s. The companies were selected on the basis of revenues and
market capitalization among others. To name a few women CEO‟s:
1. Kiran Mazumdar Shaw- Chairman and Managing Director of Biocon,
2. Naina Lal Kidwai- Deputy CEO,HSBC,
3. Ranjana Kumar- Chairman, NABARD,
4. Chanda Kocchar- Executive Director ICICI Bank,
5. Renuka Ramnath- CEO ICICI Ventures,
6. Indira Nooyi- Chairman and CEO of PepsiCo, etc.
In a list of 50 most influential women drawn by Forbes magazine, Kiran
Mazumdar Shaw, Naina Lal Kidwai and Chanda Kocchar have found their place212
.
Globally on an average, about 3 percent of top CEOs are women, which is quite
unrepresentative. According to EMA partners estimates, over 25 percent of the
executives are women in Germany, more than 30 percent in Britain, while 35
percent in France.
The analysis of the above parameters indicates that women‟s status is low
compared to men economically, socially and politically. The gender gap existing
here is quite visible. Women are put in a weak position in society and are facing
discriminatory treatment compared to their male counterparts. Gender inequality is
not only a social failure in itself; it also leads to other social failures213
. This calls
for a systematic effort on a long-term basis. The gender budgeting may be viewed
as one such.
212
Sahu Asima., “Empowering Women in India: Issues and Challenges”, in Mandakini Das and
Pritirekha Daspattanayak (eds.), Empowering Women: Issues, Challenges and Strategies, Dominant
Publishers and Distributors Pvt., Ltd., New Delhi, 2009-10, p.27. 213
Sen Amartya and Jean Dreze., “India: Economic Development and Social Opportunity”, in The
Amartya Sen & Jean Dreze Omnibus, Tenth Impression, Oxford University Press, New Delhi, 2006,
p.178.
168
Section II
5.3: Gender Commitments in the Indian Context to Improve the
Status of Women
Several measures have been taken by the Indian Government to improve the
status of women. Some of the gender commitments in the Indian context are as
follows: 214
1. Constitutional Provisions.
2. Legal Provisions– Women Specific Laws and Laws Affecting Women.
3. Institutional Mechanisms and Statutory and Autonomous Organisations for
the upliftment of women.
4. Policies for Advocating Women‟s Concerns.
5. Five Year Plans and Development of Women.
6. Women Specific Programmes.
7. Gender Budgeting.
5.3.1: Constitutional Provisions
An important step taken by the Government of India was providing
constitutional guarantees to its citizens. The Constitution of India was brought into
force on 26th
January, 1950. The Indian Constitution is the lengthiest and the most
detailed of all the written constitutions of the world containing 395 articles in 22
parts, 12 schedules and 94 amendments215
. The Preamble of the Constitution
declares India to be a Sovereign, Socialist, Secular, Democratic Republic, assuring
its citizens of justice, equality and liberty and to promote among them fraternity216
.
214
Goyal Anjali, Women’s Empowerment Through Gender Budgeting-The Indian Context,
Department of Women and Child Development, Government of India, Ministry of Human Resource
Development, November 2005.(www.wcd.nic/gb/unifem.ppt). 215
Government of India, Ministry of Law and Justice, accessed on 5th
July 2010
(www.lawmin.nic.in). 216
Pandey J.N., Constitutional Law of India, Forty Third Edition, Central Law Agency, Allahabad ,
2006, p.29.
169
The principle of gender equality is enshrined in the Indian Constitution in its
Preamble, Fundamental Duties and Directive Principles.
The Constitution of India has made several provisions to protect the interests
of women. A few important provisions for women are:
Article 14: Article 14 ensures gender equality by conferring equal rights and
opportunities on men and women in the political, economic and social spheres. It
says: “The State shall not deny to any person equality before the law or equal
protection of the laws within the territory of India”217
. It promises „Equality before
law‟ and „Equal protection of law‟.
Article 15: Article 15 prohibits discrimination against any citizen on the grounds of
sex, religion, race, caste, etc218
. Article 15(1) directs the State not to discriminate
against a citizen on grounds only of religion, race, caste, sex, or place of birth or
any of them. Article 15(2) prohibits citizens as well as the States from making such
discrimination with regard to access to shops, hotels, public roads, wells, tanks, etc.,
and all places of public entertainment. The third clause, Article 15(3) empowers the
State to make special provisions for the protection of women and children. That is
the State can make special provisions or concessions for women and children.
Article 16: It deals with equality of opportunity. Article 16(1) guarantees equality
of opportunity for all citizens in matters of „employment‟ or „appointment‟ to any
post under the State. Article 16 (2) says that no citizen shall, on grounds only of
religion, race, caste, sex, descent, place of birth, residence or any of them, be
ineligible for or discriminated against in respect of any employment or office under
the State219
. Article 16 (1) and (2) lays down the general rule that no citizen can be
discriminated against or be ineligible for any employment or office under the State
on grounds only of religion, race, caste, sex, descent, place of birth, residence or
any of them.
217
Pandey J.N., op.cit., p.73. 218
Pandey J.N., op.cit., p.122. 219
Pandey J.N., op.cit., p.134.
170
Article 39: Article 39 (a to f) contains the principles of policy to be followed by the
State for securing economic justice220
. It also promotes equality between men and
women as specified in Article 39 (a) and Article 39(d). Article 39 (a) provides the
right to a means of livelihood for both men and women. Equal pay for work is
guaranteed under Article 39 (d).
Article 42: Article 42 directs the State to make provisions for ensuring just and
humane conditions of work and maternity relief221
.
Article 51-(A) (e) imposes a fundamental duty on every citizen to renounce the
practices derogatory to the dignity of women.
Article 325: Article 325 of the Indian Constitution guarantees political equality to
women. Article 325 states that “there shall be one general electoral roll for every
territorial constituency and no person shall be ineligible for inclusion in any such
roll on grounds only of religion, race, caste, sex or any of them”. Article 325
prohibits exclusion from electoral rolls on the basis of sex.
The 73rd
and 74th
Amendment Act 1993 provides 33 percent reservation for
women in Panchayat Raj and other elected bodies leading to their political
empowerment.
5.3.2: Women and Legal Provisions
In order to support the Constitutional provisions the Government of India
has enacted many women specific and women related laws and legislations. A few
women specific legislations and laws are:222
1. Immoral Traffic (Prevention) Act, 1956,
2. The Maternity Benefit Act, 1961,
3. The Dowry Prohibition Act, 1961,
4. Indecent Representation of Women(Prohibition) Act, 1986,
220
Pandey J.N., op.cit., p.380. 221
Pandey J.N., op.cit.,p.383. 222
Index, “Initiatives for Empowerment”, Yojana, October 2006, Vol.50, p.7.
171
5. The Commission of Sati (Prevention) Act, 1987,
6. Protection of Women from Domestic Violence Act, 2005.
Certain economic legislations are as under:
1. Factories Act, 1948,
2. Minimum Wages Act, 1948,
3. Equal Remuneration Act, 1976,
4. The Employees‟ State Insurance Act, 1948,
5. The Plantation Labour Act, 1951,
6. The Bonded Labour System (Abolition) Act, 1976,
7. The Adoption of National Perspective Plan for Women 1988-2000.
Certain social legislations are as under:
1. Family Court‟s Act, 1984,
2. The Indian Succession Act, 1925,
3. The Medical Termination of Pregnancy Act, 1971,
4. The Child Marriage Restraint Act, 1929,
5. The Hindu Marriage Act, 1955, The Hindu Succession Act,
1956(and amended in 2005),
6. The Indian Divorce Act, 1969,
7. The National Commission for Women Act, 1992.
Certain legislations providing protection to women are:
1. Relevant provisions of Code of Criminal Procedure, 1973,
2. Special Provisions under IPC,
3. The Legal Practitioners(Women) Act, 1923,
172
4. The Pre-Natal Diagnostic Technique (Regulation and Prevention of
Misuse) Act, 1994.
Besides the Constitution, the government took recourse to legislation in the
Parliament to alter the state of affairs relating to women. This process of
“empowerment through legislation” continues till to date and arguably, this can be
also regarded as one of the effective means of enhancing the status of women223
.
5.3.3: Institutional Mechanisms and Statutory and Autonomous
Organisations for Empowering Women
Institutional Mechanisms: Institutional mechanisms for the advancement of
women include institutions of different types- government, non-government, central
and state government, local government, which support the cause of women‟s
advancement. Institutional mechanisms for integrating gender perspectives in policy
and planning include such innovative features as „gender budgeting‟.
India has ratified several international conventions and human rights
instruments committing to secure equal rights of women. Some of the important
among them are, The Mexico Plan of Action (1975), The Nairobi Forward Looking
Strategies (1985), the Convention on Elimination of All forms of Discrimination
Against Women (CEDAW) (1993). India signed the CEDAW on 30th
July 1980 and
ratified it on 9th
July 1993. The Convention has made it obligatory for the State to
undertake proper legislative and other measures to eliminate discrimination against
women.
The Beijing Declaration as well as the Platform for Action (1995) was a
landmark for the empowerment of women when a Declaration and Platform for
Action (BPFA) has identified twelve critical areas of concern for women. India has
adopted both. Another one is the Outcome Document adopted by the UNGA
Session on Gender Equality and Development & Peace for the 21st century, titled,
223
Sahu Asima., “Empowering Women in India: Issues and Challenges”, in Mandakini Das and
Pritirekha Daspattanayak (eds.), Empowering Women: Issues, Challenges and Strategies, Dominant
Publishers and Distributors Pvt., Ltd., New Delhi, 2009-10, pp.27-28.
173
“Further actions and initiatives to implement the Beijing Declaration and the
Platform for Action” is also endorsed by India224
.
Statutory and Autonomous Organisations: There are several statutory and
autonomous organisations which work for gender empowerment. For the
bureaucratic structure, the Department of Women and Child Development (DWCD)
can be seen as being at the centre. A few are discussed briefly as under:
1. Department of Women and Child Development (DWCD): The DWCD was
set up in 1985 as a part of the Ministry of Human Resources for the advancement of
women and children.
2. Central Social Welfare Board (CSWB): Central Social Welfare Board was set
up in August 1953. The objective of this is promoting social welfare activities and
implementing welfare programmes for women, children and handicapped through
voluntary organisations. There are 33 State Social Welfare Boards which implement
the programmes such as Awareness Generation Programme, Condensed Course of
Education for Women, Family Counselling Centres, Short Stay Home, Rajiv
Gandhi National Creche Scheme, Hostels for Working Women, etc.
3. National Commission for Women (NCW): National Commission for Women
was constituted on 31st January 1992, under the National Commission for Women
Act, 1990, with a specific mandate to study and monitor all matters relating to the
constitutional and legal safe guards provided for women, to suggest amendments,
wherever necessary. The annual report of NCW containing the recommendations is
placed in Parliament by the Government of India with a detailed compliance report.
4. Rashtriya Mahila Kosh (RMK): This is also called as National Credit Fund for
Women. Rashtriya Mahila Kosh was set up on 30th
March 1993, under Societies
Registration Act, 1860, to facilitate credit support to poor women for their socio-
economic upliftment. The support is extended through NGOs, Women
224
Verma H.S., “Commitments and Their Operationalisation:Assessing Policy Formulation,
Programme and Organization Design of Women Empowerment in India”, in R.B.S Verma, H.S.
Verma and Nadeem Hasnain (eds.), The Indian State And The Women’s Problematic: Running With
The Hare and Hunting With The Hounds, Serial Publications, New Delhi, 2007, pp.229-230.
174
Development Corporations, State Government agencies like Dairy Federations,
Municipal Councils, etc.
5. State Departments of Women and Child Development, State Commissions
for Women and State Social Welfare Boards225
: State Departments of Women
and Child Development, State Commissions for Women and State Social Welfare
Boards form part of the institutional system. Women‟s Development Corporations
(WDCs) are set up in most of the states to help the government implement the
programme.
6. Panchyati Raj Institution and Urban Local Self-government Bodies: The
Panchyati Raj Institution and Urban Local Self-government bodies provide a
framework for women‟s empowerment in political participation and decision
making all over the country.
7. Parliamentary Committee on Empowerment of Women: A Parliamentary
Committee on Empowerment of Women was constituted by the Lok Sabha in 1997,
and reconstituted in 2004, to review the effectiveness of measures taken by the
central government for the empowerment of women226
.
8. Planning Commission: The Planning Commission carries out periodical reviews
of programmes and policies impacting women.
5.3.4: Policies Advocating Women’s Concerns
The Government of India has enunciated several policies advocating
women‟s issues. It has created an environment in which women‟s issues are
reflected and various policy measures are implemented for the upliftment of women
and girls. Two types of policies can be identified:227
1. Women Specific Policies; 2.
Women Related Policies.
I) Women Specific Policies: Women specific policies are specifically meant for the
development of women. Certain specific actions are:
225
Government of India, Ministry of Human Resource Development, Department of Women and
Child Development, Platform for Action-10 years after: India Country Report, p.56. 226
ibid. 227
Kumar Arun., Empowering Women, Sarup and Sons, New Delhi, 2002, pp.67-69.
175
1. The National Commission on the Status of Women “Towards Equality” in 1974
provides clear picture about status of women in India and has suggested several
recommendations for improving the conditions of women. The National Plan of
Action (NPA) adopted in 1976 became a guiding document for the development of
women.
2. The National Expert Committee on Women Prisoners in 1986 examined the
condition of women prisoners in the criminal correctional justice system and made
necessary recommendations regarding legislative and prison reforms and about the
rehabilitation of the prisoners so far as women prisoners are concerned.
3. The „Shramshakti‟- The Report of National Commission on Self Employed
Women and Women in the Informal Sector (1988) examined the issues faced by
women in the unorganised sector and made recommendations relating to
employment, occupational hazards, legislative protection, training and skill
development, marketing and credit for women in the informal sector for their
betterment.
4. The National Perspective Plan for Women (NPP) (1988-2000) is more or less a
long term policy document advocating a holistic approach for the development of
women.
5. The National Nutritional Policy (NNP), 1993 articulates consideration in all
important policy instruments of government and identifies short-term and long-term
measures necessary to improve the nutritional status of women, children and the
country as a whole.
6. The National Plan of Action for the Girl Child (NPA) (1991-2000) is an
integrated multi-sectoral decadal Plan of Action, for ensuring survival, protection
and development of children with a special gender sensitivity built for the girl child
and adolescent girls.
7. The National Policy for the Empowerment of Women (2001) was adopted by the
Government of India on 20th
March 2001228
. The broad objective of the policy is to
228
Government of India, Ministry of Information and Broadcasting, India 2009, A Reference
Annual, Fifty Third Edition, 2009, New Delhi, p.998.
176
bring about the advancement, development and empowerment of women. The
specific objectives are:229
a) Creating an environment for full development of women to enable them to
realise their full potential;
b) Enabling enjoyment of all human rights and fundamental freedom by
women on equal basis with men in all spheres- political, economic, social,
cultural and civil;
c) Providing equal access to participation and decision making of women in
social, political and economic life of the nation;
d) Giving equal access to women to health care, quality education at all levels,
career and vocational guidance, employment, equal remuneration,
occupational health and safety, social security and public office, etc.
e) Strengthening legal systems aimed at elimination of all forms of
discrimination against women;
f) Changing societal attitudes and community practices by active participation
and involvement of both men and women;
g) Elimination of discrimination and all forms of violence against women and
the girl child;
h) Mainstreaming a gender perspective in the development process; and
i) Building and strengthening partnerships with civil society, particularly
women‟s organisations.
II) Women Related Policies: In addition to women specific policies, there are
several women related policies, some of them are:
1. The National Policy on Education (NPE) 1996, which laid emphasis on women‟s
participation in education at different levels.
229
Verma H.S., op.cit., p.230.
177
2. The National Health Policy (NHP) (1983), advocates the welfare and
development of women and children in the country.
5.3.5: Five Year Plans and Development of Women
The process of economic planning began in 1950 and we are in the terminal
stage of 11th
Five Year Plan. It is important to note that women in the earlier plans,
from 1st Plan to 5
th Plan were treated as subjects of „welfare‟. Till the Fifth Five
Year Plan women were viewed as „beneficiaries‟ of welfare programmes. There
was shift in approach from „welfare‟ to „development‟ in the Fifth Plan. In the 8th
Plan again there was change in approach from „development‟ to „empowerment‟.
In the First Five Year Plan (1951-56) emphasis was laid on the development
of women through welfare perspective. The Central Social Welfare Board was
formed in 1953 that carried out several welfare measures through voluntary
organisations. In the Second Five Year Plan (1956-61), women were organised into
Mahila Mandals to act as focal points at the grass root levels for the development of
women by identifying issues like organising women workers, protection of women
against injurious work, maternity benefits, remuneration for equal work, women‟s
training, etc.
The Third, Fourth and Interim Plans (1961-74) focused on women‟s
education as a vital welfare measure230
. It also gave importance to improve maternal
and child health services, supplementary feeding for children and care for nursing
and expectant mothers. In the Fifth Five Year Plan (1974-78), there was shift from
„welfare‟ approach to „development‟ approach. This approach aspired to integrate
welfare with developmental services. Women were recognised as participants in the
developmental process. This plan coincided with International Women‟s Decade
and the submission of Report of the Committee on the Status of Women in India. In
1976, Women‟s Welfare and Development Bureau was set up under the Ministry of
230
Peerzade Sayed Afzal and Prema Parande., “Empowerment of Women: A Study”, Kurukshetra,
Vol.54, No.1, November 2005, p.7.
178
Social Welfare. It was to act as a nodal point to coordinate policies and programmes
for women‟s development231
.
The Sixth Five Year Plan (1980-85) was a landmark in the history of
women‟s development as women‟s development was integrated into developmental
sector. „Women‟s Development‟ was included as a separate chapter in this plan.
Three important sectors namely, health, education and employment were
emphasised. The National Commission on Rural Labour established in 1983
emphasised on amending inheritance laws.
In the Seventh Five Year Plan (1985-90), importance was given to
qualitative aspects like inculcating confidence among women and bring about
awareness about their own potential and their rights and privileges. Efforts were
made to bring women into mainstream of national development. In the year 1985,
the Department of Women and Child Development was set up as a part of the
Ministry of Human Resource Development to give the much needed impetus to the
holistic development of women and children.
In the Seventh Plan period, 27 major women specific schemes were
identified for monitoring to assess quantum of funds/benefits by Department of
Women and Child Development232
. During this plan period, National Perspective
Plan (NPP) for women (1988-2000) was prepared and The National Commission
for Self-Employed Women (1987-88) was constituted.
The Eighth Five Year Plan (1992-97) highlighted on human development as
its major focus. It played a vital role for the betterment of women. In this plan the
approach toward women‟s development was shifted from „development‟ to
„empowerment‟. Eighth Plan document made an express statement that “…..the
benefits of development from different sectors should not bypass women and
special programmes on women should complement to the general development
programmes. The latter, in turn reflect greater gender sensitivity”233
. Some of the
231
Peerzade Sayed Afzal and Prema Parande., “Economic Empowerment Programmes for Women:
A Case Study”, in Shahida and Lalitha Sami (eds.), Indian Women in Development Perspective,
Anmol Publications Pvt., Ltd., New Delhi, 2007, p.128. 232
ibid. 233
Patel Vibhuti., “Gender Budgeting in India”, in Swapna Gopalan (ed.), Gender Budgeting in
India: Towards Achieving Gender Equity, ICFAI University Press, Tripura, 2008, pp.56-57.
179
important initiatives that took place during this period were the establishment of
National Commission for Women (NCW) in the year 1992 to safeguard the rights
of women, Rashtriya Mahila Kosh (1993), National Nutritional Policy (1993),
Mahila Samridhi Yojana (1993) and Indira Mahila Yojana (1995)234
.
The Ninth Five Year Plan (1997-2002) made noteworthy changes in the
approach toward planning for women. „Empowerment of women‟ became one of
the nine primary objectives of Ninth Plan. This plan adopted a strategy of Women
Component Plan, and directed both the Central and State Governments to ensure
that “not less than 30 percent funds are earmarked in all women-related sectors.
Special vigil advocated on the flow of the earmarked funds/benefits through an
effective mechanism to ensure that the proposed strategy brings forth a holistic
approach toward empowering women”235
.
For the first time, gender analysis of the Union Budget was carried out in
2001-02. A need was realised to analyse state budgets with a gender perspective
since the States/Union Territories account for bulk of the expenditure in the social
sector which impinges on the welfare, development and empowerment236
. This plan
adopted “National Policy for Empowering Women” and “Gender Development
Index” to monitor the impact of its implementation in raising the status of women
from time to time. The National Policy for Empowerment of Women 2001 of
Government of India envisaged introduction of a gender perspective in the
budgeting process as an operational strategy237
. The commitment of the Ninth Plan
was empowering women as „agents‟ of social change and development.
The Tenth Five Year Plan (2002-2007) continued with the major strategy of
„Empowering Women‟ as agents of social change and development. The important
strategies of Tenth Plan were to adopt a sector-specific 3-fold strategy for
empowering women, based on the prescriptions of the National Policy for
Empowerment of Women 2001. They include:
234
Singh D.P., “India‟s Roadmap to Women Empowerment”, in D.P. Singh and Manjit Singh (eds.),
Women And Empowerment: Experiences from South Asian Countries, Unistar Books Pvt., Ltd.,
Chandigarh, 2005, p.84. 235
Patel Vibhuti., op.cit., p.57. 236
Government of Rajasthan, Department of Planning, Snapshots of Gender Responsive Budgeting
in Rajasthan, 2005-2006. 237
ibid.
180
Social Empowerment: It aimed to create an enabling environment through various
affirmative Developmental Policies and Programmes for development of women
besides providing them easy and equal access to all basic minimum services so as to
enable them to realise their full potentials.
Economic Empowerment: It aimed to ensure provision of training, employment and
income generation activities with both „forward‟ and „backward‟ linkages with the
ultimate objective of making all potential women economically independent and
self-reliant.
Gender-Justice: It sought to eliminate all forms of gender discrimination and thus
allow women to enjoy all rights and fundamental freedom with men in all spheres,
namely, economic, social, political, civil, cultural, etc.
Strengthening Women‟s Component Plan: The Tenth Plan ensures not only
defining the concept of WCP clearly, but also identifies schemes and programmes
of various Ministries/Departments, which should be covered under WCP. During
Tenth Plan period, that is, in the year 2006, Department of Women and Child
Development was upgraded to Ministry of Women and Child Development.
The Ninth Plan ensured gender just/gender-sensitive budget, the Tenth Plan
appreciated the efforts and promised “……to continue the process of dissecting the
government budget to establish its gender differential impact and to translate gender
commitments into budgetary commitments. ……the Tenth Plan will initiate
immediate action in tying up these two effective concepts of „Women Component
Plan‟ and „Gender Budgeting‟ to play a complementary role to each other, and thus
ensure both preventive and post facto action in enabling women to receive their
rightful share from all the women-related general developmental sectors”238
.
Approach Paper to the Eleventh Five Year Plan by the Government of India
states that: “Gender equity requires adequate provisions to be made in policies and
schemes across Ministries and Departments. It also entails strict adherence to
gender budgeting across the board. It promises special efforts for creation of an
238
Goyal Anjali., “Women Empowerment through Gender Budgeting-A Review in the Indian
Context”, Ministry of Women and Child Development, p.3, accessed on 15th
November
2009(www.wcd.nic.in).
181
enabling environment for women to become economically, politically and socially
empowered”239
.
5.3.6: Women Specific Programmes
There are number of women specific programmes which supplement the
broad developmental efforts for improving the status of women. They are:
I) Women’s Education: In this area certain important programmes are as under:
1. Mahila Samakhya: The Mahila Samakhya programme was initiated in 1987-88
in pursuance of the goals of the New Education Policy(1986) and the Programme of
Action as a concrete programme for the education and empowerment of women in
rural areas, particularly women from socially and economically marginalised
groups. Mahila Samakhya means education for women‟s equality.
2. Kasturba Gandhi Balika Vidyalaya (KGBV): Kasturba Gandhi Balika
Vidyalaya (KGBV) was launched in July 2004, for setting up residential schools at
upper primary level for girls belonging mainly to the SC, ST, OBC and minority
communities. The scheme is being implemented in educationally backward blocks
of the country where the female rural literacy is below the national average (46.13%
as per Census 2001) and gender gap (21.59% as per Census 2001) is above the
national average. The scheme provides for a minimum reservation of 75 percent of
the seats for girls belonging to SC, ST, OBC and minority communities and priority
for the remaining 25 percent is given to girls from families below poverty line.
3. Condensed Courses of Education for Women: Central Social Welfare Board
(CSWB) initiated the scheme of Condensed Courses of Education for Women in
1958 to cater to the needs of adult women/girls who could not join the mainstream
education system or were school dropouts. The Scheme is being implemented
through voluntary organisations and educational institutions having proper
infrastructure and experience in the field of women/ social development and
education across the country.
239
Government of India, Ministry of Women and Child Development, Gender Budgeting Handbook
for Government of India Ministries & Departments, 2007, p.12.
182
II) Women’s Employment: Certain programmes designed for creating job
opportunities for women are enumerated as under:
1.Training-cum-Employment-cum-Production Centres (Norwegian Agencies
for Development Corporation) (NORAD), 1982-83: “Training –cum-
Employment-cum-Production Centres” which is commonly known as „NORAD
assisted Training Programmes for Women‟ extends financial assistance to public
sector undertakings/corporations/autonomous bodies/voluntary organisations to
train women in non-traditional trades and provide employment on a sustainable
basis.
2. Support to Training and Employment Programme (STEP): This programme
was launched as a Central Sector Scheme in 1987. The programme of STEP aims to
make a significant impact on women in traditional sectors by upgrading skills and
providing employment to such women on a project basis by mobilising women in
viable groups, improving skills, arranging for productive assets, creating backward
and forward linkages, improving/arranging for support services, providing access to
credit, awareness generation, gender sensitization, nutrition, education, sensitization
of project functionaries.
3. Swayamsidha: The Swayamsidha, which is an integrated scheme for women's
empowerment, was formally launched on 29th
November 2001, replacing the
erstwhile Indira Mahila Yojana and subsuming the Mahila Samridhi Yojana. Like
the Indira Mahila Yojana, the programme is based on the formation of women into
Self-Help Groups (SHGs), but it aims at more comprehensive and holistic
empowerment of women through awareness generation, economic empowerment
and convergence of various schemes.
4. Rajiv Gandhi Creche Scheme: Rajiv Gandhi National Creche Scheme for the
children of working mothers was launched with effect from 1st January, 2006, by
merging the National Creche Fund with the Scheme of Assistance to voluntary
organisations for Creches for Working/Ailing Women‟s Children.
183
5. Rashtriya Mahila Kosh: The National Credit Fund for Women or the Rashtriya
Mahila Kosh was set up in March 1993 as an independent registered society by the
Department of Women and Child Development, to provide micro-credit facilities to
poor women for income generation activities or for asset creation.
III) Women’s Health: The important programmes to improve the health status of
women are:
1. Reproductive Health (RCH) Programme: In order to improve the health status
of women in India, RCH programme was launched during 1997-98 for
implementation during the Ninth Plan period by integrating Child Survival and Safe
Motherhood (CSSM) Programme with other reproductive and child health services.
2. Nursing Services: This Scheme was started in 1987-88 that is, during the
Seventh Five Year Plan under which, short-term orientation courses are conducted
to help in-service nursing educators and administrators in updating their knowledge
and skills in Primary Health Care with special reference to health care delivery
system and speciality areas of clinical training240
.
IV) Women in Difficult Circumstances: There are certain programmes desgined
specifically to help those women who are facing difficult circumstances. These are:
1. Swadhar: The Swadhar scheme was launched during the year 2001-02 as a
central sector scheme, for providing holistic and integrated services to women in
difficult circumstances, such as destitute widows deserted by their families in
religious places like Vrindaban and Kashi, women prisoners released from jails and
without family support, women survivors of natural disasters who have been
rendered homeless, mentally challenged women who are without any support of
family or relatives, etc.
2. Short Stay Homes: The Scheme of Short Stay Homes was launched in the year
1969 with the objective to protect and rehabilitate those women and girls who are
facing social, economic and emotional problems due to family stress, moral danger,
etc.
240
Government of India, Ministry of Health and Family Welfare, accessed on 3rd
August 2010
(www.mohfw.nic.in/kk/95/ib).
184
V) Most Marginalised Women: Some major schemes for Dalit and Tribal women
are:
A] For Scheduled Castes
1. Special Central Assistance to Scheduled Castes Sub Plan (SCSP): Special
Central Assistance (SCA) to Scheduled Castes Sub Plan (SCSP) is a central scheme
under which 100 percent grant is given to the States/UTs as an additive to their
Scheduled Castes Sub Plan. The important objective of the scheme is to give thrust
to family oriented schemes of economic development of SCs below the poverty
line241
.
2. Self-Employment Scheme for Rehabilitation of Manual Scavengers:
Government of India has introduced a Self-Employment Scheme for the
Rehabilitation of Manual Scavengers from January 2007. The identified manual
scavengers are provided a capital subsidy upto Rs.20,000 and concessional loan for
undertaking self employment ventures.
B] For Scheduled Tribes
1. Special Central Assistance to Tribal-Sub-Plan (TSP): The Special Central
Assistance (SCA) is provided by the Ministry of Tribal Affairs to the State
Government as an additive to the State TSP. SCA is meant for family oriented
income-generation schemes in sectors of agriculture, horticulture, sericulture and
animal husbandry cooperation. The objective of SCA is socio-economic
development of STs and SCA primarily funds schemes/projects for economic
development of STs242
.
2. Upgradation of Merit ST Students:243
The ST students are unable to take
advantage of different avenues because of their educational deficiencies which have
become available through reservation of seats. The quota reserved for them remains
under-utilised. Therefore, the Scheme of Upgradation of Merit of ST students
241
Government of India, Ministry of Social Justice, Special Central Assistance to Scheduled Castes
Sub Plan, accessed on 4th
September 2010 (www.socialjustice.nic.in). 242
Government of India, Ministry of Tribal Affairs, Special Central Assistance to Tribal-Sub-Plan,
accessed on 4th
September 2010(www.tribal.nic.in). 243
Government of India, Ministry of Tribal Affairs, Upgradation of Merit of ST Students, accessed
on 4th
September 2010 (www.tribal.nic.in).
185
provides for 100 percent Central Assistance to States/UTs for arranging remedial
and special coaching for Scheduled Tribes students studying in classes IX to XII.
The State Governments/UTs should have a target to include at least 30 percent girl
ST students and at least 3 percent to disabled ST students.
3. Construction of Boys/Girls Hostels for STs: The students from ST community
are normally too poor to bear the burden of stay in other areas to continue their
education. In this way the purpose of empowerment is not served. Taking this fact
into consideration, the Government of India has launched a scheme of construction
of hostels meant for ST only.
It suffices here to argue that the parameters analysed in Section I are not in
favour of women. The trickle down effects of macroeconomic policies have failed
to redress the problems of better half of the community. It is need of the hour that
women should be empowered economically, socially and politically so that they
become a strong and vigorous force in the country. As reported in Asia Pacific
Human Development Report 2010, Equality is Good Economics: “The challenge of
increasing the economic growth of a country is .… to a considerable extent linked
to the role played by women in the society. The costs of discrimination toward
women in education and employment not only harm the women concerned, but
impose a cost for the entire society”244
. Women‟s empowerment is a sine qua non
of a nation‟s development. Therefore, the immediate task is to put emphasis on
„including‟ the „excluded‟, that is, government policies and programmes should be
framed and implemented through gender perspective. Gender perspective should be
included in government budgets for the betterment of women and girls.
244
United Nations Development Programme, Asia Pacific Human Development Report 2010,
published for UNDP by Macmillan Publishers India, Ltd., 2010, pp.26-27.