Embed Size (px)
Citation preview

CHI-SQUARE AND ODDS RATIOS
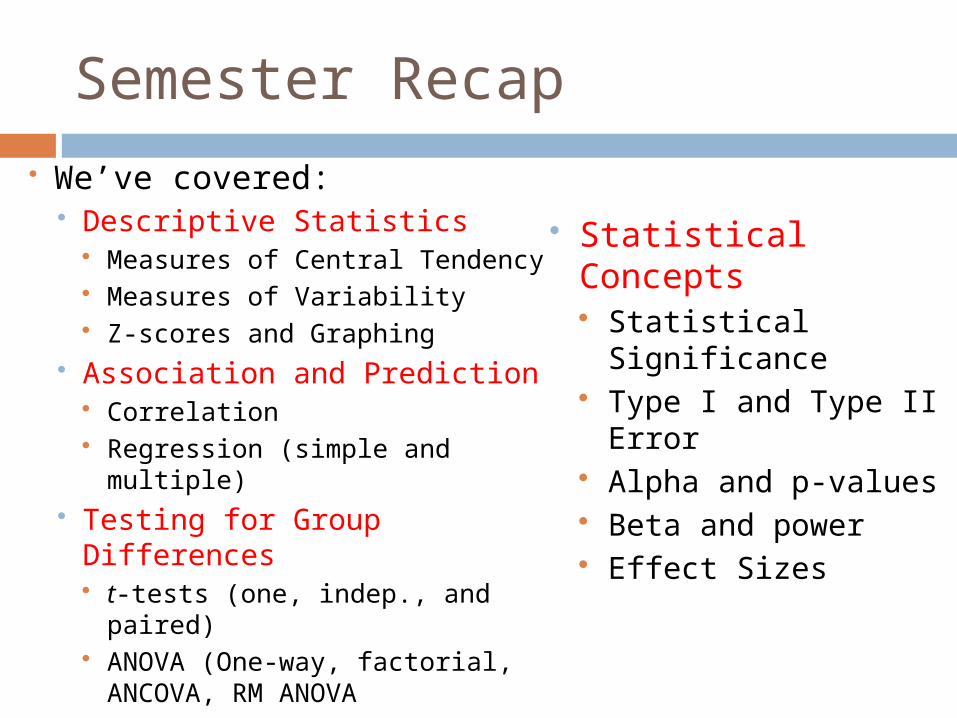
Semester Recap We’ve covered:
Descriptive Statistics Measures of Central Tendency Measures of Variability Z-scores and Graphing
Association and Prediction Correlation Regression (simple and multiple)
Testing for Group Differences t-tests (one, indep., and paired) ANOVA (One-way, factorial,
ANCOVA, RM ANOVA
Statistical Concepts Statistical
Significance Type I and Type II
Error Alpha and p-values Beta and power Effect Sizes
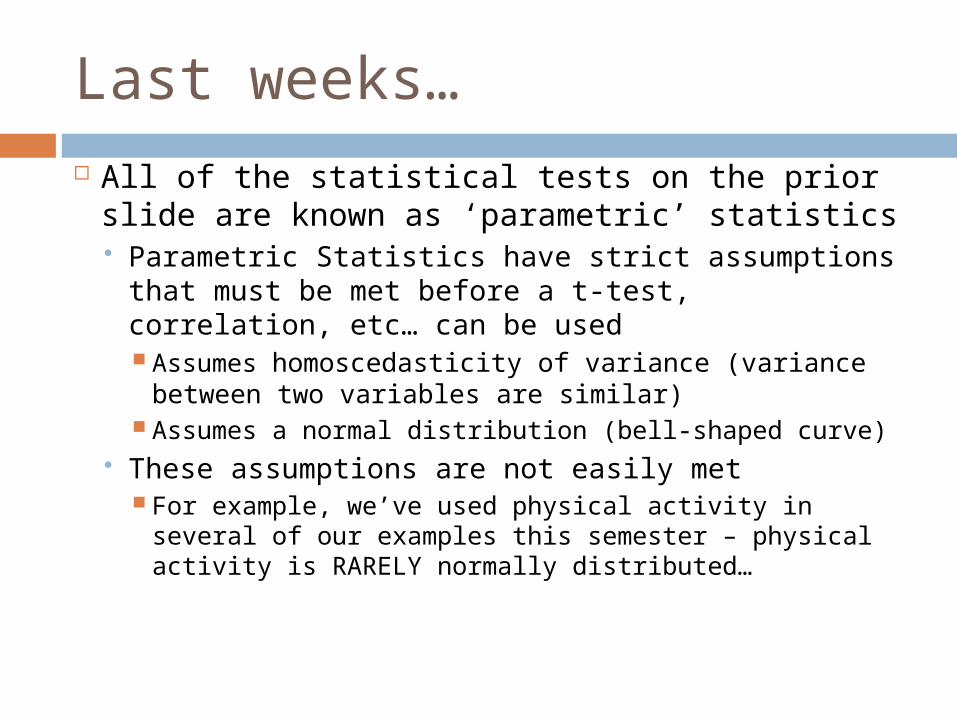
Last weeks… All of the statistical tests on the prior slide are
known as ‘parametric’ statistics Parametric Statistics have strict assumptions that
must be met before a t-test, correlation, etc… can be used Assumes homoscedasticity of variance (variance
between two variables are similar) Assumes a normal distribution (bell-shaped curve)
These assumptions are not easily met For example, we’ve used physical activity in several of
our examples this semester – physical activity is RARELY normally distributed…
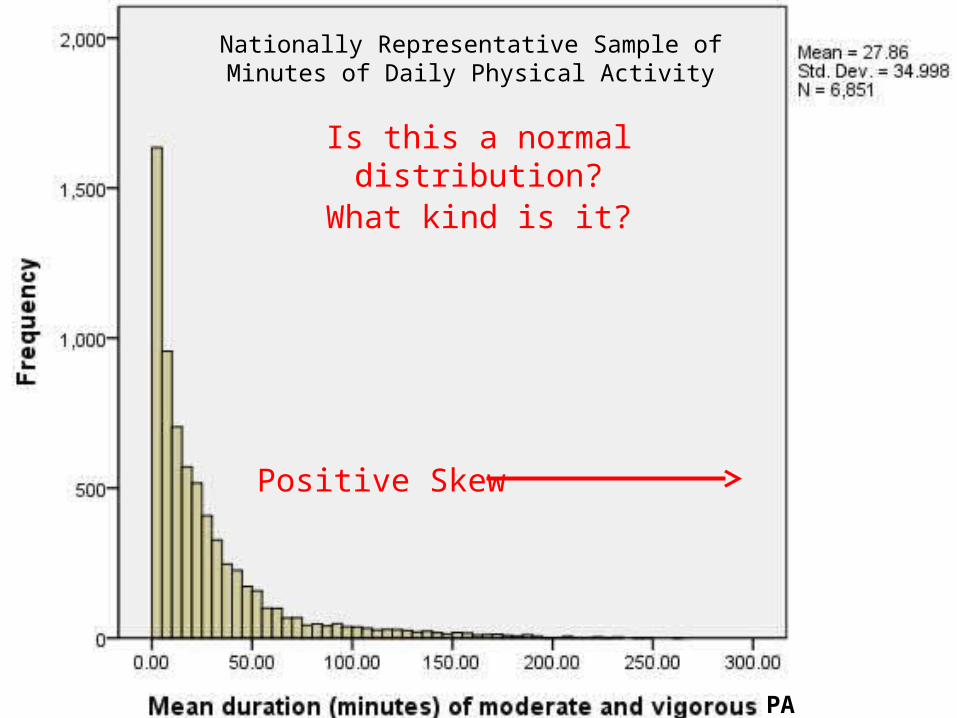
PA
Nationally Representative Sample of Minutes of Daily Physical Activity
Is this a normal distribution?
What kind is it?
Positive Skew

Additionally…
Sometimes you need to use a dependent variable that is categorical (grouping) Recall from the chart that the statistical tests
we’ve discussed all require 1 continuous dependent variables
Example Research Question: Are there more male than female athletic trainers
across the United States? I want to know if there are more men than women –
this is a nominal dependent variable No correlation, regression, or ANOVA, etc…
will help me answer this simple question
Non-Parametric Tests
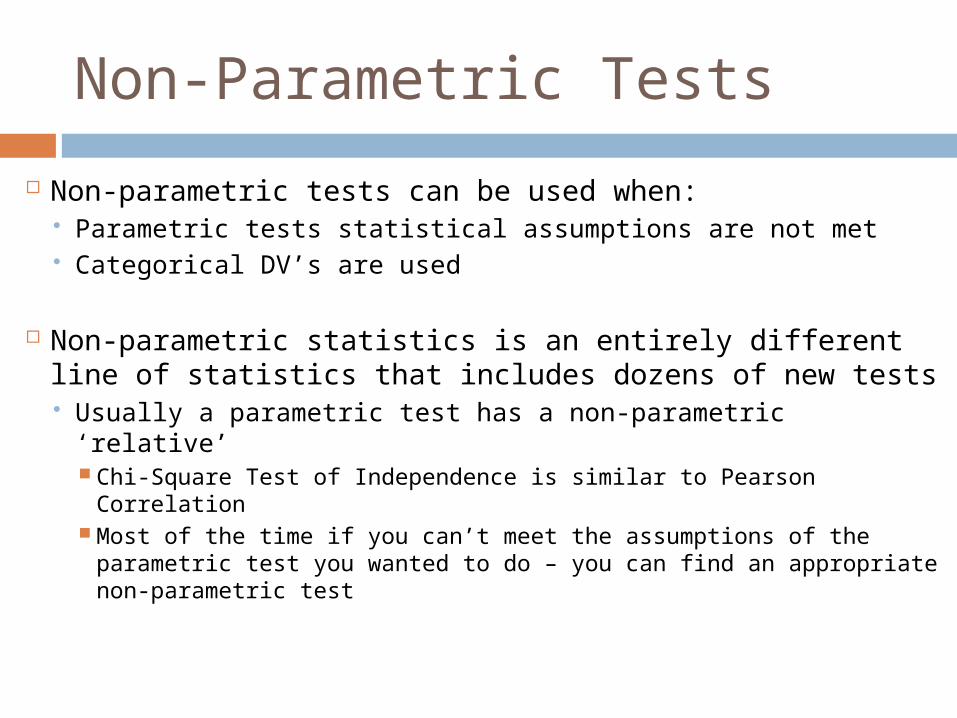
Non-parametric tests can be used when: Parametric tests statistical assumptions are not met Categorical DV’s are used
Non-parametric statistics is an entirely different line of statistics that includes dozens of new tests Usually a parametric test has a non-parametric ‘relative’
Chi-Square Test of Independence is similar to Pearson Correlation
Most of the time if you can’t meet the assumptions of the parametric test you wanted to do – you can find an appropriate non-parametric test
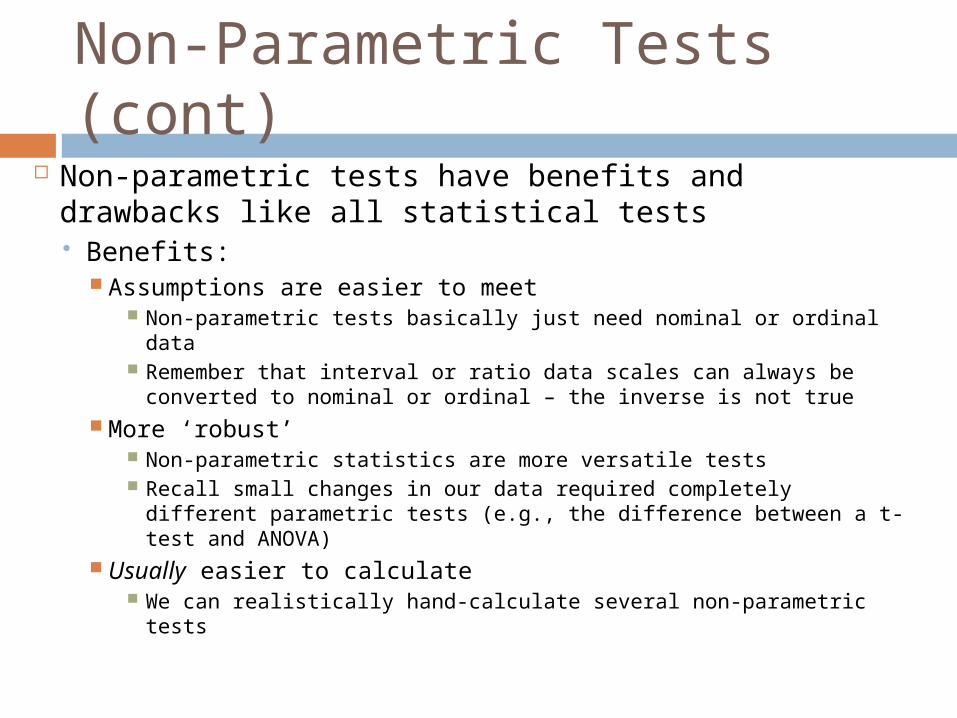
Non-Parametric Tests (cont) Non-parametric tests have benefits and
drawbacks like all statistical tests Benefits:
Assumptions are easier to meet Non-parametric tests basically just need nominal or ordinal data Remember that interval or ratio data scales can always be
converted to nominal or ordinal – the inverse is not true More ‘robust’
Non-parametric statistics are more versatile tests Recall small changes in our data required completely different
parametric tests (e.g., the difference between a t-test and ANOVA)
Usually easier to calculate We can realistically hand-calculate several non-parametric tests

Non-Parametric Tests (cont)
Non-parametric tests have benefits and drawbacks like all statistical tests Drawbacks:
Less ‘mainstream’ Non-parametric tests are commonly used – but far less
frequently than parametric tests Less powerful
By design, non-parametric tests have less statistical power…
What’s that mean? Unless you NEED to use a categorical dependent
variable, if your data meets the statistical assumptions you should use parametric stats
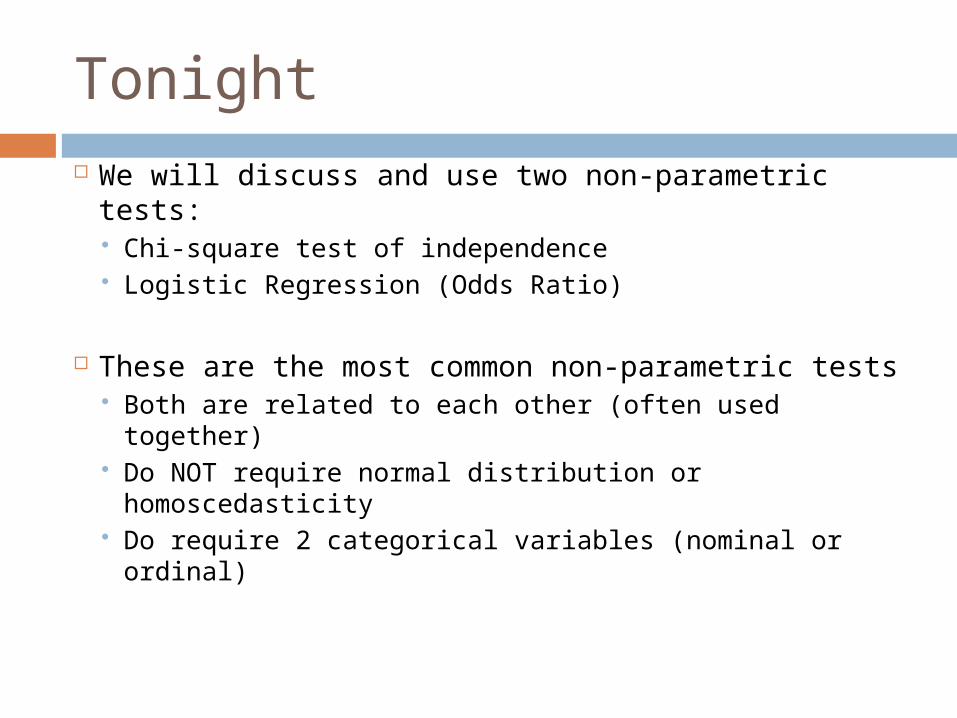
Tonight We will discuss and use two non-parametric tests:
Chi-square test of independence Logistic Regression (Odds Ratio)
These are the most common non-parametric tests Both are related to each other (often used together) Do NOT require normal distribution or
homoscedasticity Do require 2 categorical variables (nominal or
ordinal)
Chi-Square, χ2
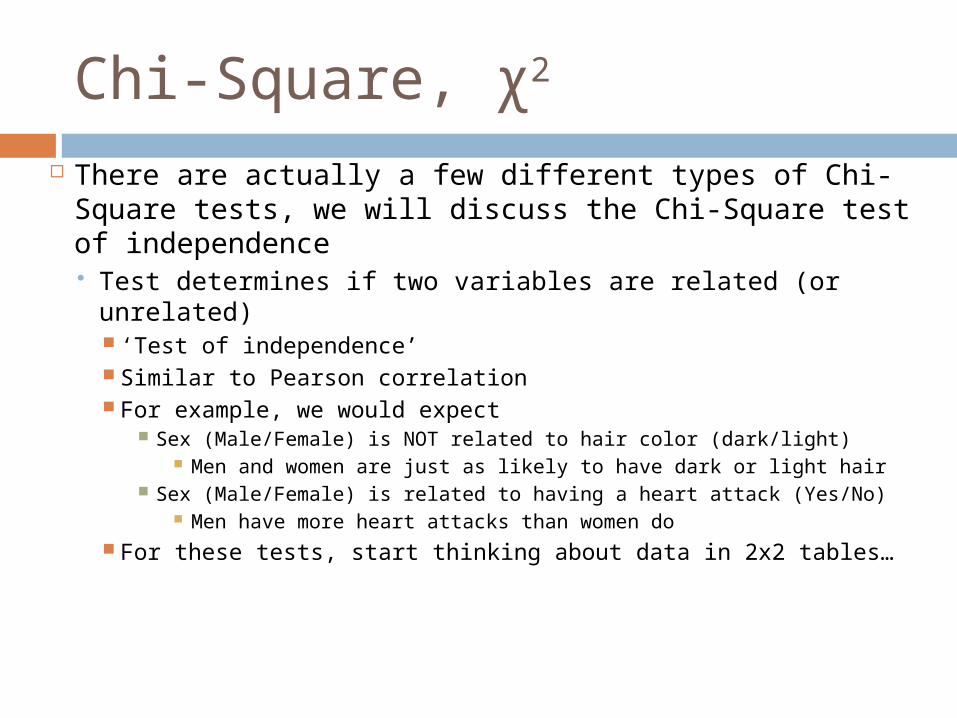
There are actually a few different types of Chi-Square tests, we will discuss the Chi-Square test of independence Test determines if two variables are related (or
unrelated) ‘Test of independence’ Similar to Pearson correlation For example, we would expect
Sex (Male/Female) is NOT related to hair color (dark/light) Men and women are just as likely to have dark or light hair
Sex (Male/Female) is related to having a heart attack (Yes/No) Men have more heart attacks than women do
For these tests, start thinking about data in 2x2 tables…

Chi-Square Data ‘Picture’
A 2x2 table provides a nice summary of the data In this example, ‘Sex’ is the IV and ‘Heart Attack’ is the DV
Does male/female increase risk of heart attack? This table provides frequency of occurrence Can also convert to percentage – you will get the same result
Cause of Death in Men and
Women
Heart Attack?
Yes No
SexMen 68 32
Women 42 58
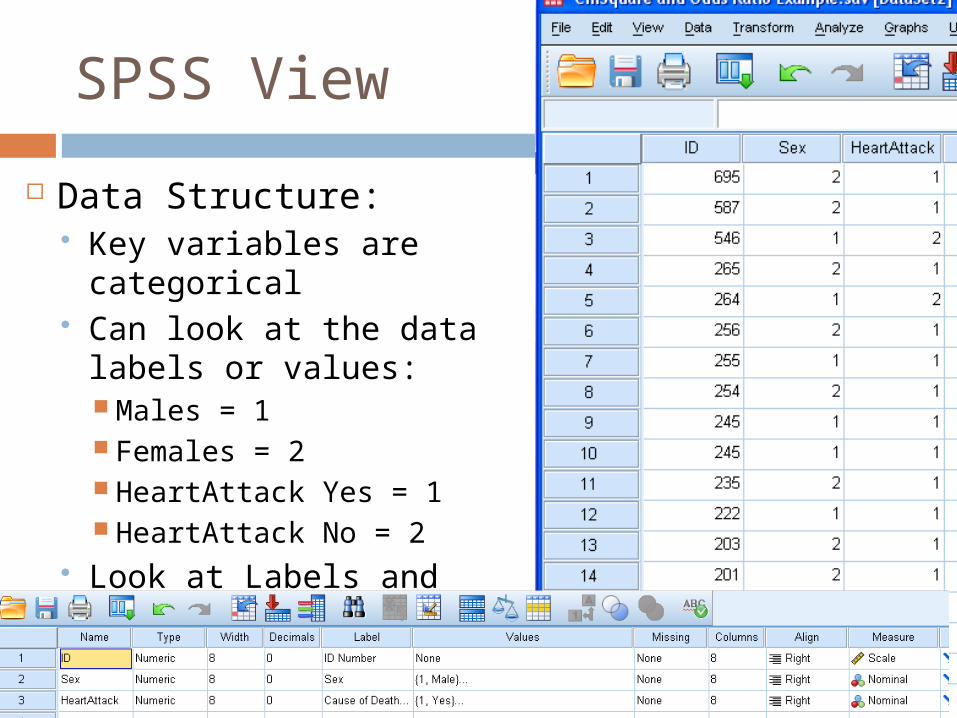
SPSS View
Data Structure: Key variables are
categorical Can look at the data labels
or values: Males = 1 Females = 2 HeartAttack Yes = 1 HeartAttack No = 2
Look at Labels and Values:

SPSS View
Data Structure: Key variables are
categorical Can look at the data
labels or values: Males = 1 Females = 2 HeartAttack Yes = 1 HeartAttack No = 2

Chi-Square Data ‘Picture’
You should fill out the margins of the table (how many men, women, total n, heart attacks, other causes, etc… Do on board
Cause of Death in Men and
Women
Heart Attack?
Yes No
SexMen 68 32
Women 42 58
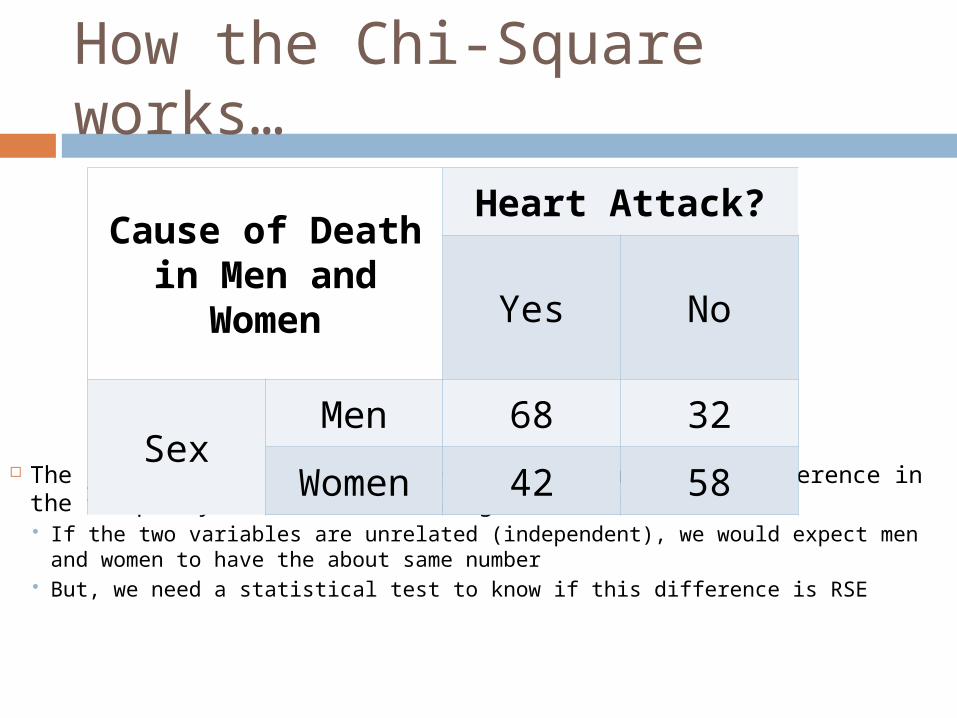
How the Chi-Square works…
The χ2 test has a null hypothesis that there is no difference in the frequency of men/women having heart attacks If the two variables are unrelated (independent), we would expect
men and women to have the about same number But, we need a statistical test to know if this difference is RSE
Cause of Death in Men and
Women
Heart Attack?
Yes No
SexMen 68 32
Women 42 58
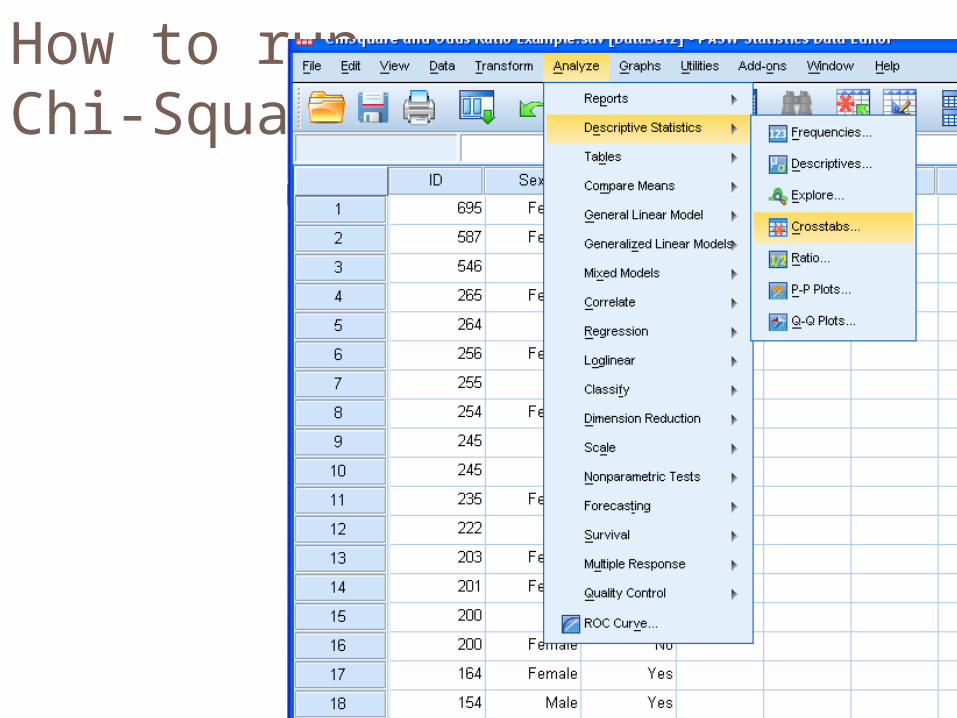
How to run Chi-Square
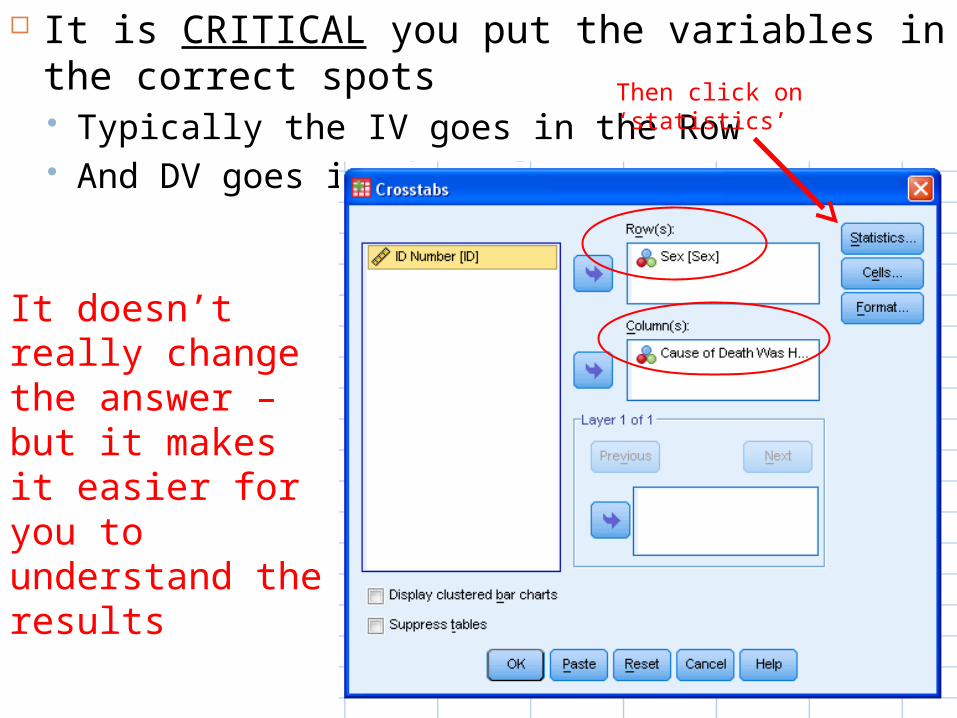
It is CRITICAL you put the variables in the correct spots Typically the IV goes in the Row And DV goes in the Column
It doesn’t really change the answer – but it makes it easier for you to understand the results
Then click on ‘statistics’

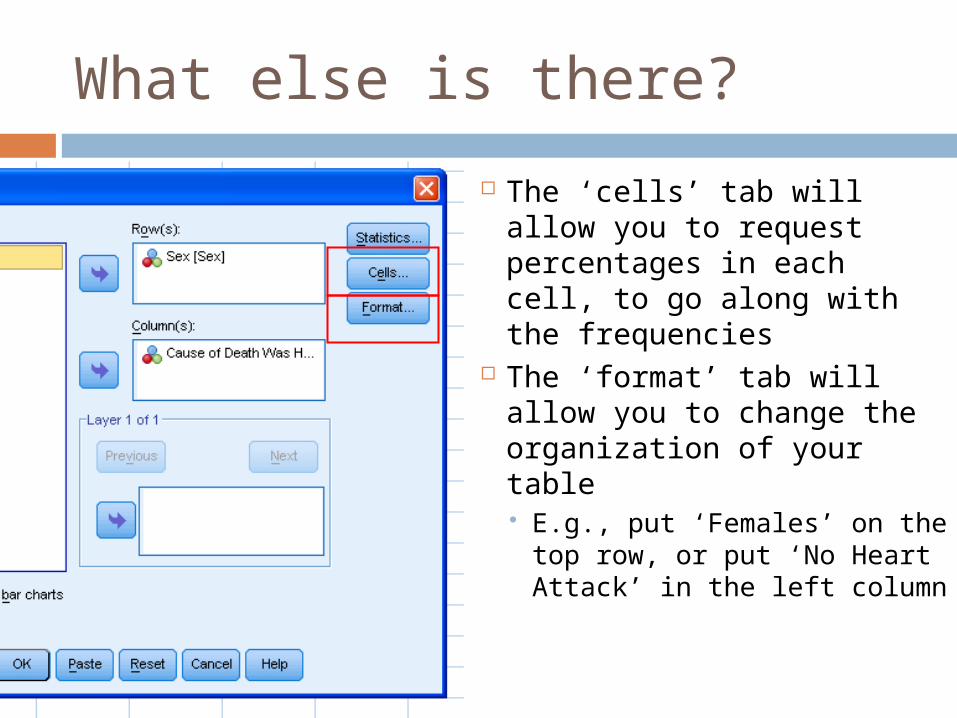
What else is there?
The ‘cells’ tab will allow you to request percentages in each cell, to go along with the frequencies
The ‘format’ tab will allow you to change the organization of your table E.g., put ‘Females’ on the
top row, or put ‘No Heart Attack’ in the left column

SPSS Output
SPSS provides two initial tables: 1) Case Processing Summary: Ignore,
repeat info of… 2) CrossTabs Table (our 2x2):
= Frequency. Could have asked for Percentages

Chi-Square Tests We only care about the ‘Pearson Chi-Square’ –
yeah, it’s that same guy from correlation… Important info is the χ2 = 13.657, df, p, and n
χ2 = 13.66 is just like the t-statistic or r, or F ratio...

Chi-Square df df is calculated by (number of columns –
1) multiplied by (number of rows – 1) 2 rows – 1 = 1 2 columns – 1 = 1 1 x 1 = 1 df All 2x2 tables have 1 df, more variables will
change this
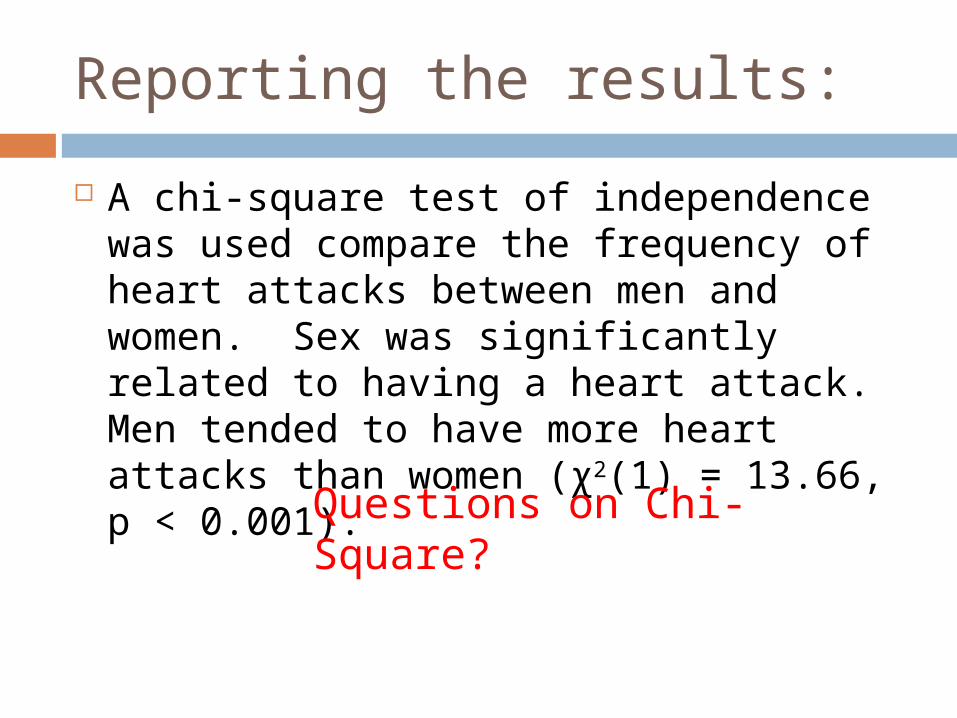
Reporting the results:
A chi-square test of independence was used compare the frequency of heart attacks between men and women. Sex was significantly related to having a heart attack. Men tended to have more heart attacks than women (χ2(1) = 13.66, p < 0.001).
Questions on Chi-Square?
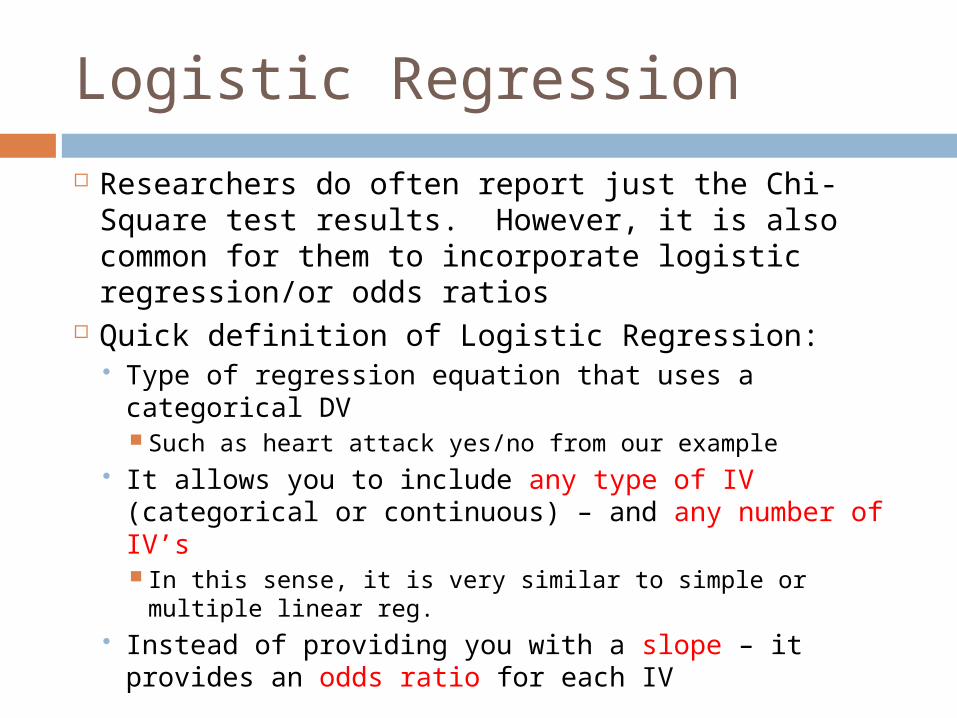
Logistic Regression
Researchers do often report just the Chi-Square test results. However, it is also common for them to incorporate logistic regression/or odds ratios
Quick definition of Logistic Regression: Type of regression equation that uses a categorical
DV Such as heart attack yes/no from our example
It allows you to include any type of IV (categorical or continuous) – and any number of IV’s In this sense, it is very similar to simple or multiple
linear reg. Instead of providing you with a slope – it provides
an odds ratio for each IV

What are the odds…?
Odds The probability of an event happening divided
by the probability of the event not happening Students often get confused here…
A die has 6 sizes, each with a difference number On one die, the odds of rolling a 1 is…? 1 side has a 1 on it, 5 sides do NOT Odds of rolling a 1:
1/5, or 20%
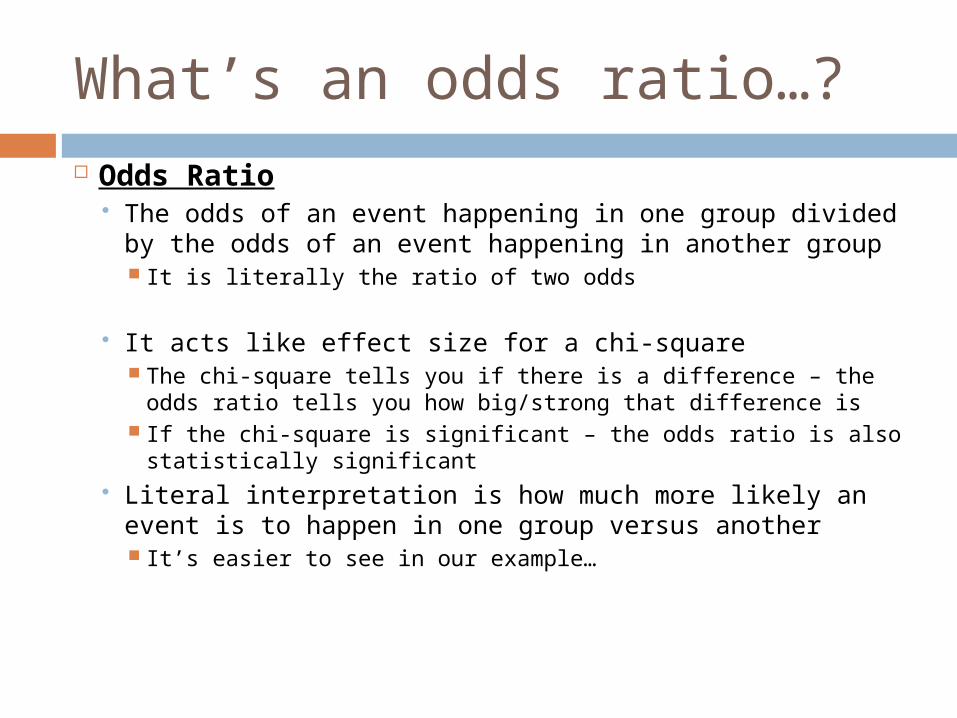
What’s an odds ratio…? Odds Ratio
The odds of an event happening in one group divided by the odds of an event happening in another group It is literally the ratio of two odds
It acts like effect size for a chi-square The chi-square tells you if there is a difference – the odds
ratio tells you how big/strong that difference is If the chi-square is significant – the odds ratio is also
statistically significant Literal interpretation is how much more likely an event
is to happen in one group versus another It’s easier to see in our example…

Back to our example
What are the odds of a heart attack in men? 68/32, or 2.125
What are the odds of a heart attack in women? 42/58, or 0.724Cause of Death
in Men and Women
Heart Attack?
Yes No
SexMen 68 32
Women 42 58

Back to our example
What is the ratio of these odds, or odds ratio? 2.125 / 0.724 = 2.9 = OR
Interpretation: Men are 2.9 times more likely to have a
heart attack than women (we know it’s significant because of the χ2)Cause of Death
in Men and Women
Heart Attack?
Yes No
SexMen 68 32
Women 42 58
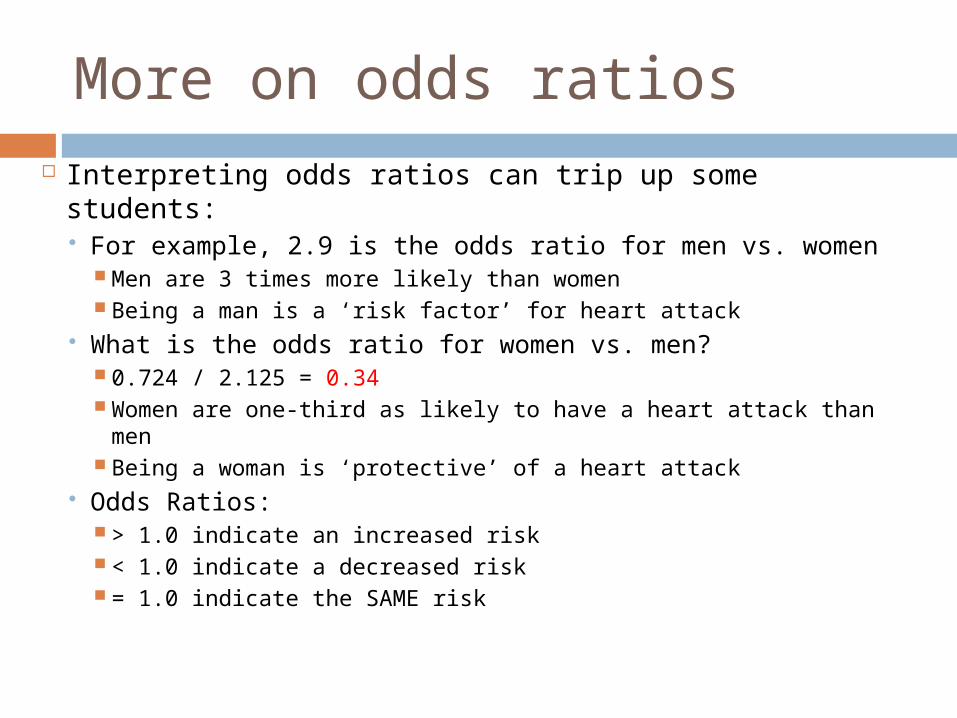
More on odds ratios Interpreting odds ratios can trip up some students:
For example, 2.9 is the odds ratio for men vs. women Men are 3 times more likely than women Being a man is a ‘risk factor’ for heart attack
What is the odds ratio for women vs. men? 0.724 / 2.125 = 0.34 Women are one-third as likely to have a heart attack than
men Being a woman is ‘protective’ of a heart attack
Odds Ratios: > 1.0 indicate an increased risk < 1.0 indicate a decreased risk = 1.0 indicate the SAME risk

Another Example: Lung Cancer
First, notice that way more women had lung cancer But – there are way more women in this sample I’ll run a chi-square in SPSS to see if there is a
difference…
Cause of Death in Men and
Women
Lung Cancer?
Yes No
SexMen 6 64
Women 16 201
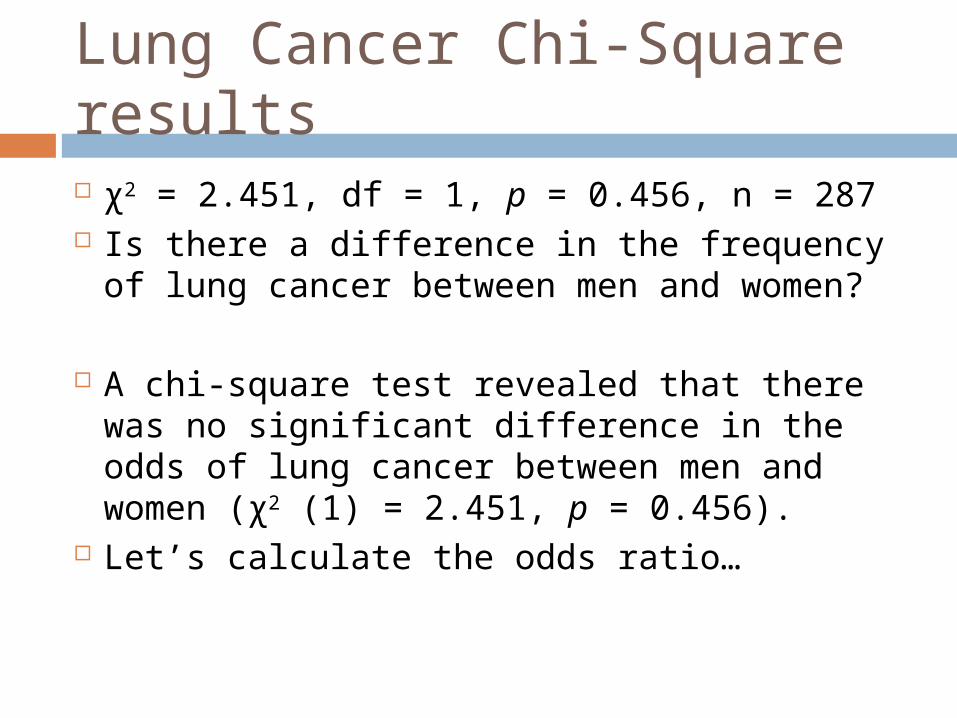
Lung Cancer Chi-Square results χ2 = 2.451, df = 1, p = 0.456, n = 287 Is there a difference in the frequency of
lung cancer between men and women?
A chi-square test revealed that there was no significant difference in the odds of lung cancer between men and women (χ2 (1) = 2.451, p = 0.456).
Let’s calculate the odds ratio…

Odds Ratio: Lung Cancer What are the odds of cancer in men?
6/64 = 0.094 In women?
16/201 = 0.079 What is the OR?
Cause of Death in Men and
Women
Lung Cancer?
Yes No
SexMen 6 64
Women 16 201
Odds Ratio = 0.094 / 0.079 = 1.19
It appears men might be slightly more likely than
women, but this could be due to RSE
More on Odds Ratios
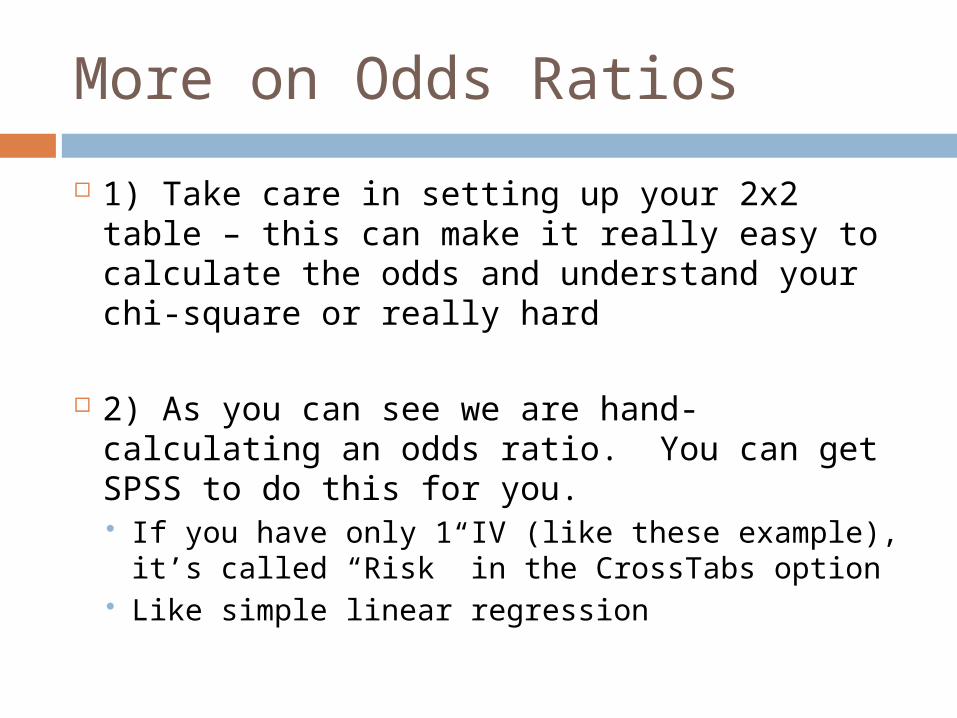
1) Take care in setting up your 2x2 table – this can make it really easy to calculate the odds and understand your chi-square or really hard
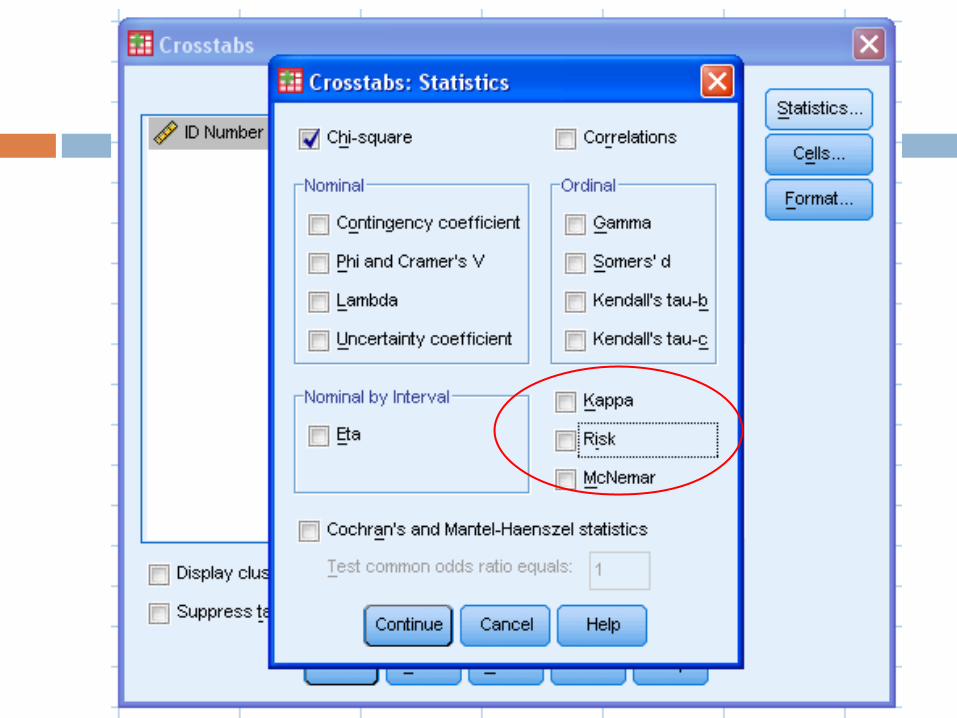
2) As you can see we are hand-calculating an odds ratio. You can get SPSS to do this for you. If you have only 1 IV (like these example), it’s
called “Risk” in the CrossTabs option Like simple linear regression

New Heart Attack Output
When you do this, ignore the bottom rows of the box (they are more confusing than helpful) You get the OR and the 95% CI This is the same result we got from hand
calculating it, and we knew it was significant because of the chi-square test

95% CI’s and Odds Ratios
Is this odds ratio statistically significant?
How can you tell?
More on Odds Ratios
2) As you can see we are hand-calculating an odds ratio. You can get SPSS to do this for you. With 1 IV, use crosstabs With multiple IV’s, use ‘logistic regression’
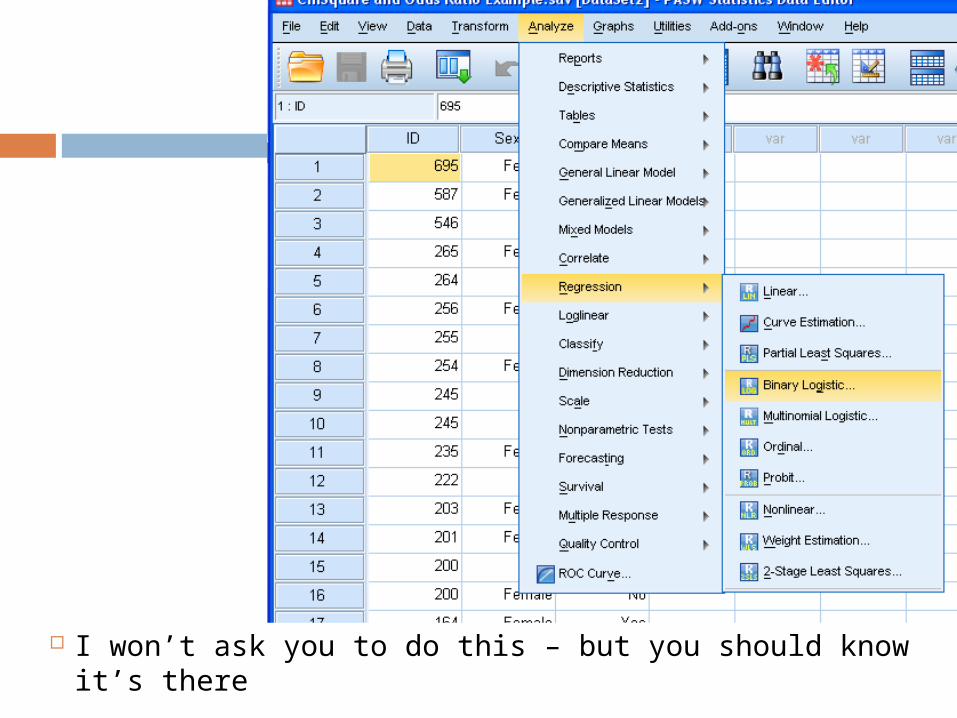
I won’t ask you to do this – but you should know it’s there

More on Odds Ratios
2) As you can see we are hand-calculating an odds ratio. You can get SPSS to do this for you. With 1 IV, use crosstabs With multiple IV’s, use ‘logistic regression’
3) Odds Ratios can be tricky without the 2x2 table They tell you how much more likely something is to
happen for a certain group (like males vs females) But, you should always include the information in
the 2x2 table so people know what you’re talking about
Example…

Odds of Winning the Powerball Odds of winning the Powerball lotto with 1 ticket:
1 / 175,223,510 = 0.00000000571 Odds of winning the Powerball with 10 tickets:
10/175,223,510 = 0.0000000571 Odds Ratio = 10.0
You are 10 times as likely to win with 10 tickets!!!!! Still better odds to die driving to buy your ticket – or
getting hit by lightning – than winning with 10 tickets.
Odds Ratios are great statistics – but should not be used to model VERY, VERY rare things
Referent Group 4) Odds ratios are a ratio between two groups
The odds ratio was 2.9 or 0.34 for our heart attack example – depending on which group was the referent
Referent Group = The ‘baseline’ group in the odds ratio. The group that is in the denominator. 2.125 / 0.724 = 2.9 Women were the referent group – meaning men were 2.9 times
more likely than women Must mention this when talking about your odds ratio – you can’t
just say, ‘the odds ratio was 2.9’. WHO was 2.9 times more likely than WHO?
This is especially important when using them for more than 2 groups…
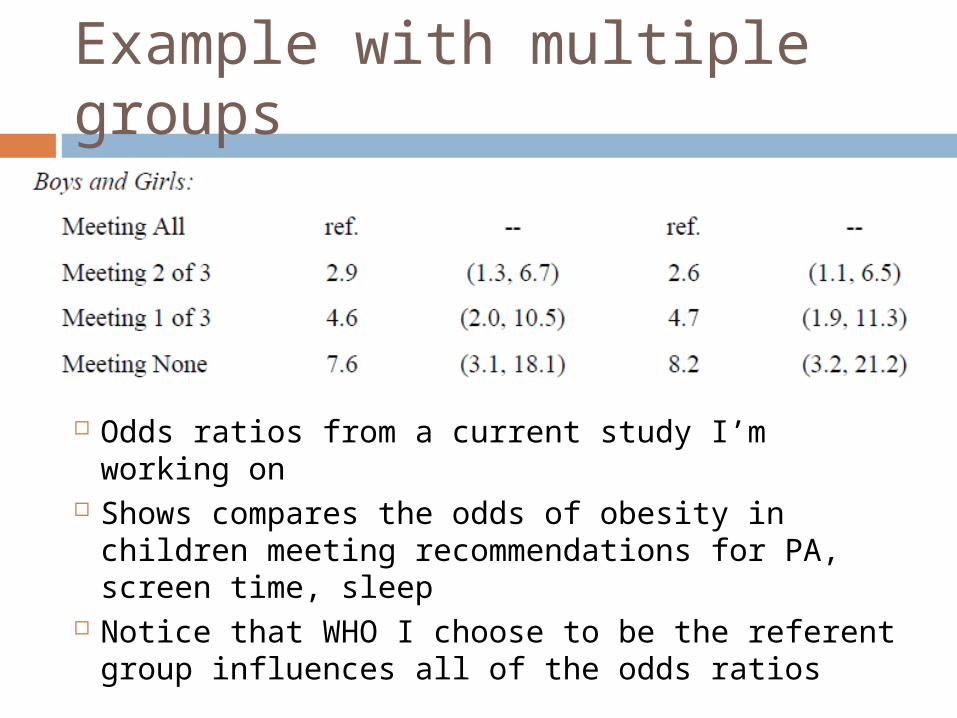
Example with multiple groups
Odds ratios from a current study I’m working on Shows compares the odds of obesity in children
meeting recommendations for PA, screen time, sleep
Notice that WHO I choose to be the referent group influences all of the odds ratios

QUESTIONS ON CHI-SQUARE?
ODDS RATIOS?

Upcoming…
In-class activity Homework:
Cronk – Read Section 7.2 on Chi-Square of Independence
Holcomb Exercises 55, 56, 57 and 59 Exercises 55-57 are on Chi-Square, 59 is on Odds
Ratio