Embed Size (px)
Citation preview

THE CIVIC FEDERATION/FEDERAL RESERVE BANK OF CHICAGO
Chicago Fiscal Future: Growth or Insolvency?
Dealing with and Overcoming Fiscal Distress
James E. Spiotto Managing Director
Chapman Strategic Advisors LLC Co-Publisher Muninetguide.com
April 19, 2017
4188616
© 2017 by James E. Spiotto. All rights reserved. James E. Spiotto is the Co-Publisher of Muninet Guide and a retired partner of Chapman and Cutler LLP as well as Managing Director of Chapman Strategic Advisors LLC and President of JASSEE Advisors, LLC. This document is for informational purposes, general in nature and based on authorities that are subject to change. It is not intended as a recommendation or advice with regard to any action or inaction to be taken. The views expressed herein are solely those of the author and do not reflect the position, opinion or views of Chapman and Cutler LLP or Chapman Strategic Advisors LLC. This presentation discusses the current state of the Chapter 9 market including a detailed analysis of these issues. For further reading: Remarks of James E. Spiotto of Chapman and Cutler LLP to the U.S. Securities and Exchange Commission field hearing at Birmingham, Alabama on July 29, 2011 on the State of the Municipal Securities Market, Remarks of James E. Spiotto of Chapman and Cutler LLP, and the Second Edition of “MUNICIPALITIES IN DISTRESS?” authored by James E. Spiotto and published by Chapman and Cutler LLP which is a 50-State Survey of State Laws Dealing with Financial Emergencies of Local Governments, Rights and Remedies Provided by States to Investors in Financially Distressed Local Government Debt, and State Authorization of Municipalities to File Chapter 9 Bankruptcy, which is available from Chapman and Cutler LLP or on Amazon.com, PRIMER ON MUNICIPAL DEBT ADJUSTMENT, published by Chapman and Cutler LLP, which is available from Chapman and Cutler LLP, “The Role of the State in Supervising and Assisting Municipalities, Especially in Times of Financial Distress,” by James E. Spiotto in the MUNICIPAL FINANCE JOURNAL, Winter/Spring 2013 and “How Municipalities in Financial Distress Should Deal with Unfunded Pension Obligations and Appropriate Funding of Essential Services,” 50 WILLAMETTE LAW REVIEW 515 (2014), “Reducing Risk to Payment of State and Local Government Debt Obligations, Statutory Liens from Rhode Island to California SB 222” MUNINET GUIDE (July 28, 2015) http:www.muninetguide.com/articles/reducing-risk-to-payment-of-state-and-local-government-debt-7401, and Remarks of James E. Spiotto to the United Stats Senate Committee on the Judiciary in connection with the hearing on December 1, 2015 on the financial distress in Puerto Rico and the role of Congress.

A. Financial Distress of State and Local Governments is Rare
but It Does Occur:
1. The default rate for rated state and local government bond debt is
1/50 to 1/100 (1 or 2%) of that of the rated corporate bond defaults.
2. The rate of Chapter 9 bankruptcies for municipalities is actually .086%
of corporate Chapter 11 filings or 8.6/10,000 of that of corporate
Chapter 11 per year over the last 36 years.
2
I. THE GATHERING STORM

3
0.00% 0.50% 1.00% 1.50% 2.00%
Fitch *3
S&P *2
Moody's *1
Rated Municipal vs. Corporate Default Rates by Ratings Service
Municipal
Corporate
1. Moody’s Investors Services, U.S. Municipal Bond Defaults and Recoveries, 1970-2009 (February 2010); Moody’s Investors ServCorporate Default and Recovery Rates, 1920-2009
(February 2010). Percentages based upon average one-year default rate.
2. Standard & Poor’s, 2009 Global Corporate Default Study and Ratings Transitions (March 17, 2010); Standard & Poor’s; U.S. Municipal Ratings Transitions and Defaults, 1986-2009
(March 11, 2009). Percentages based on average default rate.
3. Fitch Ratings Inc. U.S. Public Finance Transition and Default Study (1999-2009), March 25, 2010; Fitch Ratings Global Corporate Finance 2009 Transition and Default Study.
1.57% [1,707 defaults (1970-2009)]
0.01% [54 defaults (1970-2009)]
1.54% [1,604 defaults (1986-2008)]
0.02% [39 defaults (1986-2008)]
0.04% [10 defaults (1999-2009)]
0.89% [238 defaults (1999-2009)]
I. THE GATHERING STORM

B. Recent Default Rate: Historically, there is a low default rate
for bonds issued by municipalities and states and studies of
recent default since 1970 continue the trend:
The late Dr. John Petersen of George Mason University noted in his
paper on “Municipal Defaults: Eighty Years Made a Big Difference”
(2011) that, between 1970’s-2000’s, the municipal default for
municipalities averaged per decade .10% to .24% (adjusted for WPPSS
and Jefferson County, Alabama) not including the fact that over 80% of
the defaults were conduit financings and not essential public financings.
This is a far cry from the corporate bond default rate on average for
investment grade and non-investment grade of about 10%. (Petersen,
2013).
States have not defaulted on general obligations bonds since the late
1880’s, with the exception of Arkansas debt in 1933, which was
thereafter refinanced.
4
I. THE GATHERING STORM

Recorded Defaults, by Type of Local Government Unit
1839-1969
a The number of local government units has changed rapidly. For example, in 1932 there were 127,108 school districts, 8,580 other districts, and 175,369 state and local
government units.
b The percent of annual default in total defaults by type divided by number of governments divided by 130 (years).
Sources: Default information in The Daily Bond Buyer, The Commercial and Financial Chronicle and The Investment Bankers’ Associations Bulletin: default lists from Federal
Deposit Insurance Corporation, Life Insurance Commission, and U.S. Courts; and Albert M. Hillhouse, Defaulted Municipal Bonds (Chicago: Municipal Financial Officers
Association, 1935). Number of local government units from: U.S. Department of Commerce, Bureau of Census, Census of Governments, 1967, Vol. 1 ”Governmental
Organization” (Gov’t Printing Office, 1969) and ACIR Report Bankruptcy, Defaults and Other Local Government Financial Emergencies U.S. Government 1973.
5
1839 -49
1850 -59
1860 -69
1870 -79
1880 -89
1890 -99
1900 -09
1910 -19
1920 -29
1930 -39
1940 -49
1950 -59
1960 -69
Total Defaults
Number of Local
Governments in 1967a
% of Annual Default Rate
Over 130 Yrs.b
By Type of Units
Counties and parishes 7 15 57 30 94 43 7 15 417 6 12 24 727 3,049 .183%
Incorp. munics. 4 4 13 50 30 93 51 17 39 1,434 31 31 114 1911 18,048 .081%
Nunincorp. Munics. 4 9 46 31 50 33 5 10 88 7 4 26 313 17,105 .014%
School districts 4 5 0 11 14 1241 5 23 60 1,272 21,782 .048%
Other districts 2 1 12 11 7 107 1,590 30 42 70 1,872 21,264 .067%
Totals 4 15 37 159 97 258 149 36 185 4,770 79 112 294 6,195 81,248 .058%
I. THE GATHERING STORM

Historically, based on default rate, willingness to pay has not been a real
problem but current events may test that premise.
Essential service debt financing has historically enjoyed a significantly
lower default rate than healthcare, housing and conduit state and local
governmental financing.
Unfunded pension obligations and deferred infrastructure costs are a
more recent phenomenon – Prior to 1960s, most pension obligations
were treated as gratuities and a significant number of big ticket
infrastructure costs are only now starting to age such as the interstate
highway system, electric grid, waste water treatment facilities, etc.
We are closer to a tipping point and departure from the historical
assurances than we have ever been. The difference may be whether
there will be adherence to the Washington-Hamilton principle of
honoring the payment of public debts and reinvesting in state and local
government going forward.
6
I. THE GATHERING STORM

D. What Is Chapter 9?
Exclusive chapter of the Bankruptcy Code that provides a method for
municipalities to adjust debt.
Not a tool for elimination of municipal debt.
It is voluntary, a municipality cannot be forced into bankruptcy.
States cannot file a Chapter 9 bankruptcy because they are also co-
equal Sovereigns with the federal government and federal courts cannot
involuntarily alter states rights under Article X of the U.S. Constitution.
See Written Testimony of James E. Spiotto “The Role of Public
Employees Pensions in Contributing to State Insolvency and Possible
State Bankruptcy Chapter 9”. Hearing before the U.S. House
Subcommittee on County/Commercial and Administrative Law, 112th
Cong. 54 (2011) available at
http://Judiciary.house.gov/hearings/printers/112th/112-25_64585.pdf
7
I. THE GATHERING STORM

D. For What Purpose has Chapter 9 Municipal Bankruptcy Been
Used?
To adjust the level of debt obligations of a municipality so the debt is
sustainable and affordable.
To restructure burdensome labor contracts.
To avoid or restructure legal settlements and judgments.
To address losses on or poor investment strategies.
To restructure pension and health care related liabilities.
To restructure contractual obligations.
To restructure debt on a failed enterprise or proprietary project.
To restructure tax-exempt debt.
To be used as a last resort when all other compromise and restructuring
efforts fail to reduce debt obligations of municipalities so that essential
governmental services can continue to be provided.
8
I. THE GATHERING STORM

E. Historically the Use of Chapter 9 Bankruptcy by a
Municipality Has Been Rare and a Last Resort, Especially
Compared to Corporate Chapter 11 Filings:
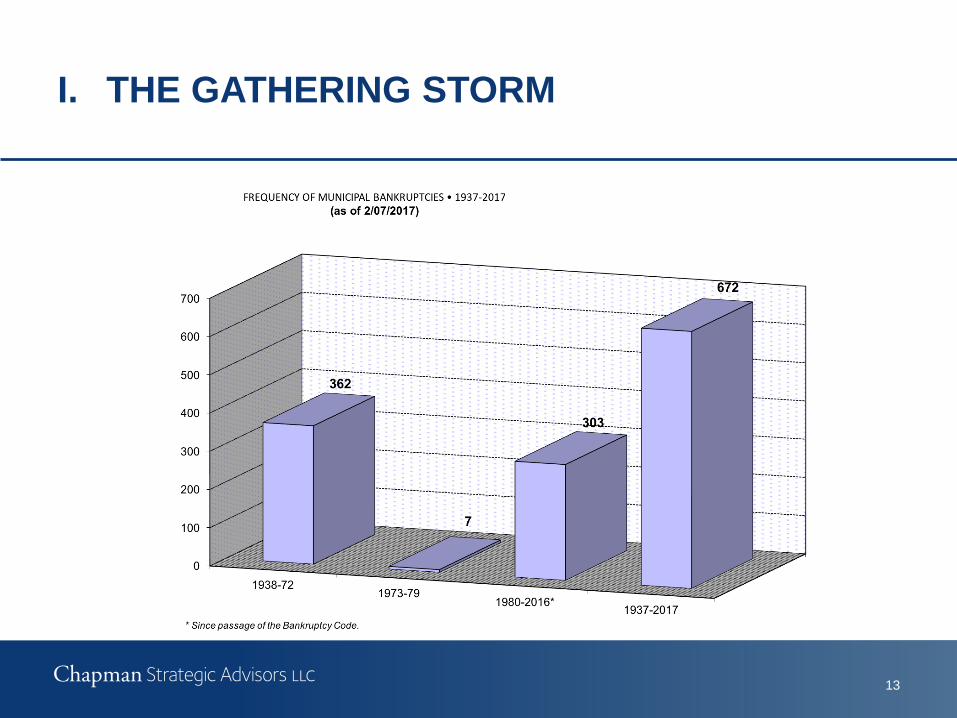
Since 1937 when Chapter 9 municipal debt adjustment was enacted
almost 80 years ago there have been only 672 Chapter 9 filings namely
by small municipal utilities and special tax districts and by some cities,
towns, villages and counties but generally not of any significant size.
Since 1954, virtually all of those municipalities that filed Chapter 9 were
small or not major issuers of bond debt except for Bridgeport, CT in
1991, Orange County in 1994, Vallejo, CA in 2008, Jefferson County, AL
in 2011, Stockton and San Bernardino, CA in 2012 and Detroit in 2013.
Both Harrisburg, PA and Boise County, ID. cases were dismissed as was
Bridgeport in 1991.
9
I. THE GATHERING STORM

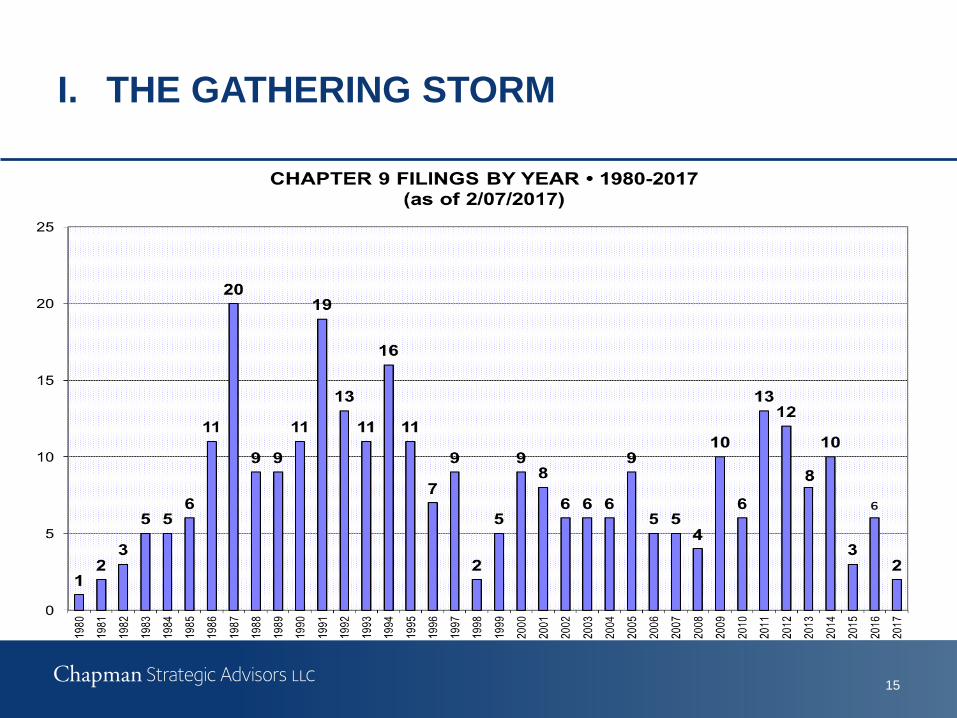
Of the 303 Chapter 9 filings since 1980 and of the 328 filings since
1954, 178 (193 since 1954) have been municipal utilities and special
districts and only 54 (64 since 1954) have been cities, counties, towns
and villages. The remaining, 57(since 1954 and 1980) have been
hospitals or healthcare, 8 transportation and 6 school or educational
facilities. Less than 70% of the Chapter 9 filings resulted in a confirmed
plan of debt adjustment.
Since 1980 Chapter 11 corporate filings have averaged at least 10,000
per year compared to about 8.6 Chapter 9 filings per year.
10
I. THE GATHERING STORM
11
I. THE GATHERING STORM
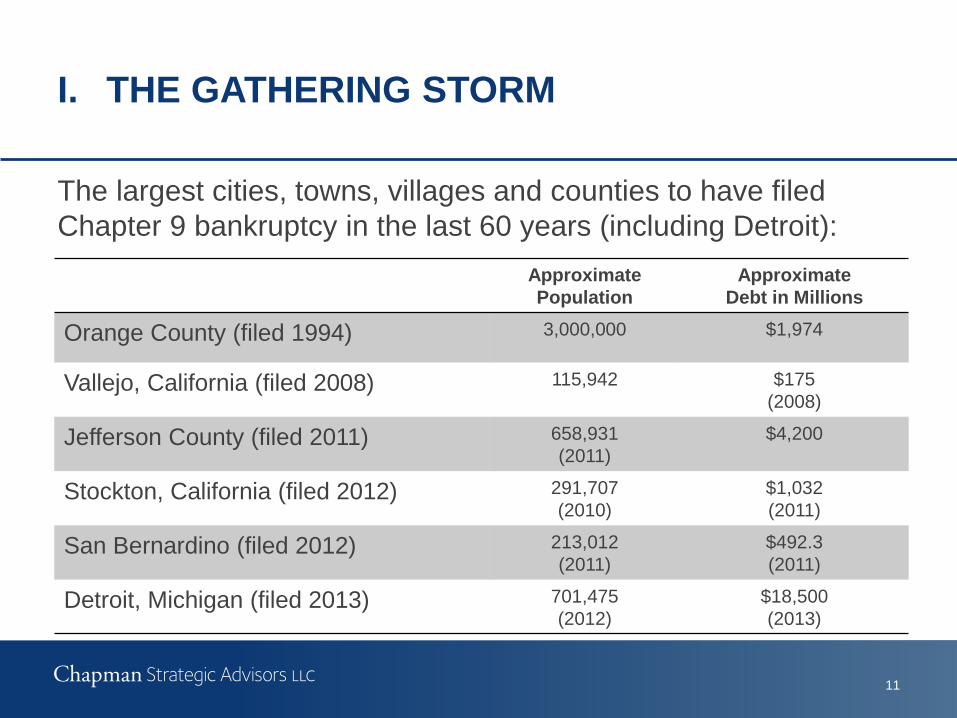
The largest cities, towns, villages and counties to have filed
Chapter 9 bankruptcy in the last 60 years (including Detroit):
Approximate
Population
Approximate
Debt in Millions
Orange County (filed 1994) 3,000,000 $1,974
Vallejo, California (filed 2008) 115,942 $175
(2008)
Jefferson County (filed 2011) 658,931
(2011)
$4,200
Stockton, California (filed 2012) 291,707
(2010)
$1,032
(2011)
San Bernardino (filed 2012) 213,012
(2011)
$492.3
(2011)
Detroit, Michigan (filed 2013) 701,475
(2012)
$18,500
(2013)

12
I. THE GATHERING STORM
F. Current Use of Chapter 9: No Tsunami of Chapter 9 filings in 2012, 2013, 2014, 2015 and 2016.
Only 13 Chapter 9 filings in 2011, 12 in 2012, 8 in 2013, 10 in 2014, 3 in 2015, 6 in
2016 and 2 so far in 2017.
Only 4 cities, towns, counties or villages filed Chapter 9 (municipal bankruptcy) in
2011, namely Jefferson County, Central Falls, Boise County and Harrisburg, PA (Boise
County and Harrisburg were dismissed), 3 in 2012, namely Stockton, San Bernardino
and Mammoth Lakes (which was dismissed that year) and only 1 in July, 2013 –
namely Detroit. Since the Detroit Chapter 9 was filed in 2013, 2014, 2015, 2016 and,
so far in 2017, only one city, Hillview, KY in August 2015, filed and that was dismissed
in April, 2016 without filing a plan of debt adjustment.
Total Chapter 9 filings since 1937 – 672. States cannot file Chapter 9 –
Co-Sovereign with Federal Government and 10th Amendment Issues.
Still RARE and mainly small special tax districts, municipal utilities.
In the last 60 years, only 64 cities, towns, counties and villages have filed out of 328
Chapter 9 filings that have been made. Twenty-nine of the 64 (44%) were Chapter 9
cases dismissed before any plan of debt adjustment was confirmed with purportedly
the city, town, village or county finding a better resolution or was not authorized to file
under state laws.
13
I. THE GATHERING STORM
14
I. THE GATHERING STORM
15
I. THE GATHERING STORM

16
I. THE GATHERING STORM
178
54 57
8 6
0
20
40
60
80
100
120
140
160
180
Municipal Utilitiesand Special
Districts
City, Village orCounty
Hospital, HealthCare
Transportation School, Education
CHAPTER 9 FILINGS BY TYPE • 1980-2017 (as of 2/07/2017)

G. Chapter 9 Is Not a Tool for Elimination of Municipal Debt:
Since a municipal unit is intended to continue to provide
governmental services in perpetuity and is not intended to liquidate
its assets to satisfy creditors but rather continue to function as a
municipality, the primary purpose of Chapter 9 is to allow the
municipality to continue operating and keep creditors away while it
adjusts or refinances creditor claims.
Adjustment of the debts of a municipality is typically accomplished
either by extending debt maturities, reducing the amount of principal
or interest, or refinancing the debt by obtaining a new loan.
More appropriate to refer to Chapter 9 as municipal debt adjustment
rather than municipal bankruptcy.
17
I. THE GATHERING STORM
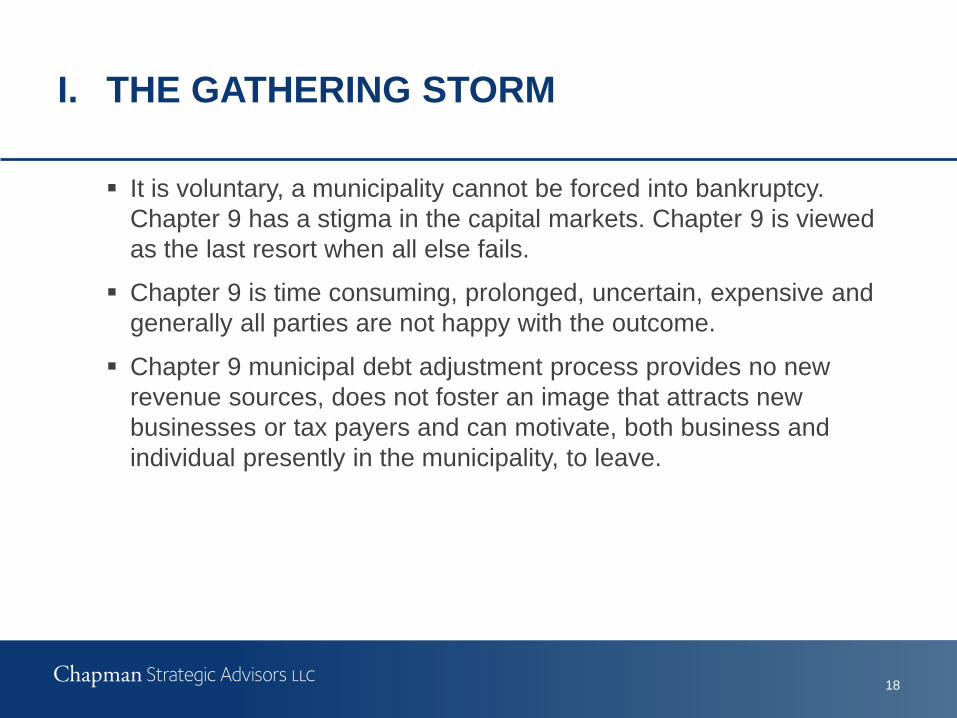
It is voluntary, a municipality cannot be forced into bankruptcy.
Chapter 9 has a stigma in the capital markets. Chapter 9 is viewed
as the last resort when all else fails.
Chapter 9 is time consuming, prolonged, uncertain, expensive and
generally all parties are not happy with the outcome.
Chapter 9 municipal debt adjustment process provides no new
revenue sources, does not foster an image that attracts new
businesses or tax payers and can motivate, both business and
individual presently in the municipality, to leave.
18
I. THE GATHERING STORM

H. Limitations on the Chapter 9 Bankruptcy Court’s Jurisdiction:
The Bankruptcy Court in a Chapter 9 proceeding cannot interfere with
the government property, revenues and affairs of the municipality without
the municipalities consent and cannot impair, limit or interfere with any
mandated actions under state law (§§ 903 and 904 of the Bankruptcy
Code.
Other than the lack of revenues to pay creditors, municipal services are
determined as to whether they will be provided by the governmental
body, not by the Bankruptcy Judge. (See e.g., Bankruptcy Court’s
refusal to overturn the “Water Shut Off” ruling by the Detroit utility for
nonpayment.)
Unlike Chapter 11, the municipality can sell its assets, incur debt and
engage in governmental affairs without necessarily having to obtain the
approval of the Bankruptcy Court.
19
I. THE GATHERING STORM

I. Labor Issues in Chapter 9:
Burdensome labor contracts can be rejected for cause (City of Vallejo,
Detroit and San Bernardino) unlike the Chapter 11 (Corporate
Reorganization) §1113 there is no time consuming detailed process of
proposals, information sharing, negotiation prior to any rejection motion
can be filed.
Unfunded pension liabilities are unsecured obligations and no priority for
wages, vacation, pension or healthcare in Chapter 9 unlike Chapter 11.
20
I. THE GATHERING STORM

J. Who Can File Chapter 9?
No Chapter 9 for states: States can not file for Chapter 9 bankruptcy
because they are co-sovereigns with the Federal Government under
the U.S. Constitution (10th Amendment). States have the right as
sovereigns to permit their respective sub-sovereigns (municipalities)
to file.
Who can be a Chapter 9 debtor?: Not every municipality can be a
debtor in Chapter 9. Only municipalities in states that specifically
authorize their municipalities to file can use Chapter 9. To be a
debtor in a Chapter 9, an entity must be:
A municipality.
21
I. THE GATHERING STORM

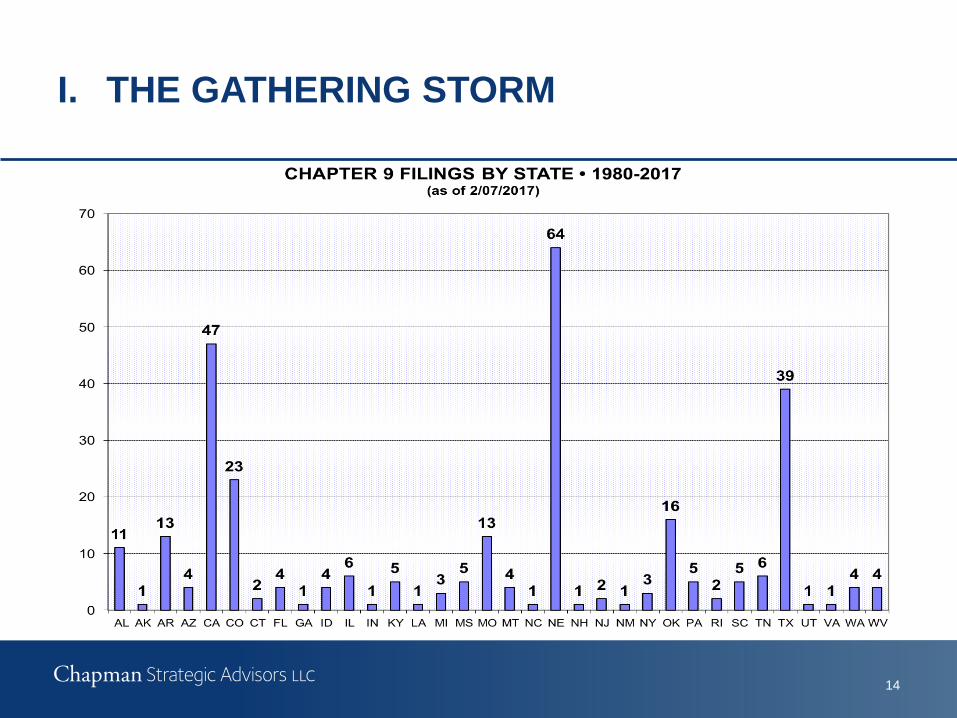
Special authorized under state law to be a Chapter 9 debtor. Twelve states have statutory provisions in which the state specifically authorizes filing Chapter 9 by a municipality (AL, AZ, AR, ID, MN, MO, MT, NE, OK, SC, TX, WA), another twelve states authorize a filing of Chapter 9 by a municipality conditioned on a further act of the state, an elected official or state entity (CA, CT, FL, KY, LA, MI, NJ, NC, NY, OH, PA, RI). Three states (CO, OR and IL) grant limited authorization, two states prohibit filing of Chapter 9 (GA) but one of them (IA) has an exception to the prohibition. The remaining 21 are either unclear or do not have specific authorization for their municipalities to file Chapter 9.
Insolvent (unable to pay its debt as they mature).
Willing to effectuate a plan.
Either has obtained the agreement of creditors holding majority amount of the claim of each class that the municipality intends to impair or has attempted to negotiate in good faith, but was unable to fically do so or it was impractical to negotiate with creditors or a creditor is attempting to obtain a preference.
22
I. THE GATHERING STORM

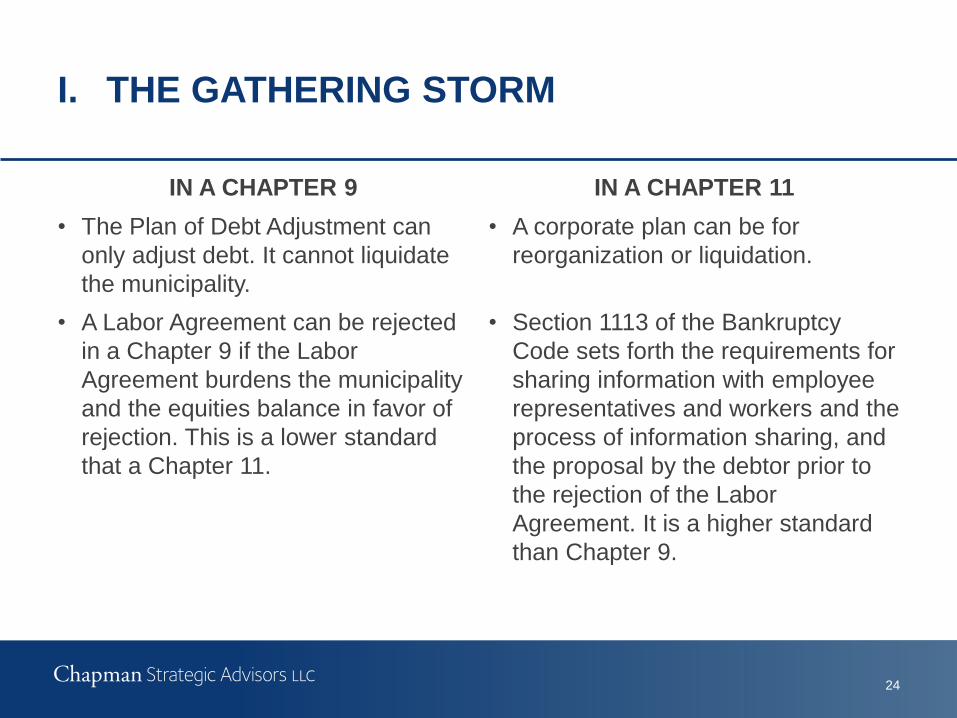
K. Chapter 9 – (Municipal Debt Adjustment) Is Unlike
Chapter 11 (Corporate Reorganization):
23
I. THE GATHERING STORM
IN A CHAPTER 9 IN A CHAPTER 11
• Only the municipality can initiate a
Chapter 9 if authorized by state law.
• The corporation (voluntary) or its
creditors (involuntary) can initiate a
Chapter 11 case if the corporation is
a moneyed entity (not a non-for-
profit) and insolvent.
• Only the municipality can file a Plan
of Debt Adjustment.
• The corporate debtor (during the
exclusive period) or any creditor
(after the exclusive period) may file
a Plan of Reorganization or
Liquidation.
24
I. THE GATHERING STORM
IN A CHAPTER 9 IN A CHAPTER 11
• The Plan of Debt Adjustment can
only adjust debt. It cannot liquidate
the municipality.
• A corporate plan can be for
reorganization or liquidation.
• A Labor Agreement can be rejected
in a Chapter 9 if the Labor
Agreement burdens the municipality
and the equities balance in favor of
rejection. This is a lower standard
that a Chapter 11.
• Section 1113 of the Bankruptcy
Code sets forth the requirements for
sharing information with employee
representatives and workers and the
process of information sharing, and
the proposal by the debtor prior to
the rejection of the Labor
Agreement. It is a higher standard
than Chapter 9.

25
I. THE GATHERING STORM
IN A CHAPTER 9 IN A CHAPTER 11
• There is no limitation on damages on
real estate leases held by a Trustee or
Municipal Building Authority for a
lease financing and the lease
financing will be treated as a secured
debt financing.
• There is a limitation of the greater of
one year’s rent or 15% of the
remaining terms of the lease not to
exceed three years for lease damages
in a corporate Chapter 11. It is not
treated as secured debt of the
corporate debtor if it is a true lease.
• Payments to defease or pay current
interest or principal on bonds or notes
within the 90 day preference period
before a Chapter 9 filing are not
capable of being voided or deemed a
preference.
• Payment of principal or interest not
secured by collateral could be voided
or deemed a preference during the 90
day period prior to filing a Chapter 11
if the holder would receive more than
what it would be entitled to in a
Chapter 7 liquidation.

26
I. THE GATHERING STORM
IN A CHAPTER 9 IN A CHAPTER 11
• There are no priorities ahead of
unsecured claims for prepetition
claims due to employee wages,
pensions, accrued vacations,
healthcare and other employment
benefits.
• There is a priority ahead of
unsecured claims of up to $12,475
per employee for pre-petition
wages, benefits, accrued vacation
and healthcare benefits.
• “Special Revenues” and “Statutory
Liens” are not limited or terminated
by a Chapter 9 filing and are
intended to continue to be paid to
secured creditor and are unimpaired
by the Chapter 9 filing (there is no
Chapter 11 provisions comparable).
• Accounts receivable and inventory
created post petition are not
covered by the pre-petition lien of a
secured lender and the pre-petition
lien is terminated except for
“proceeds” of the pre-petition lien.
27
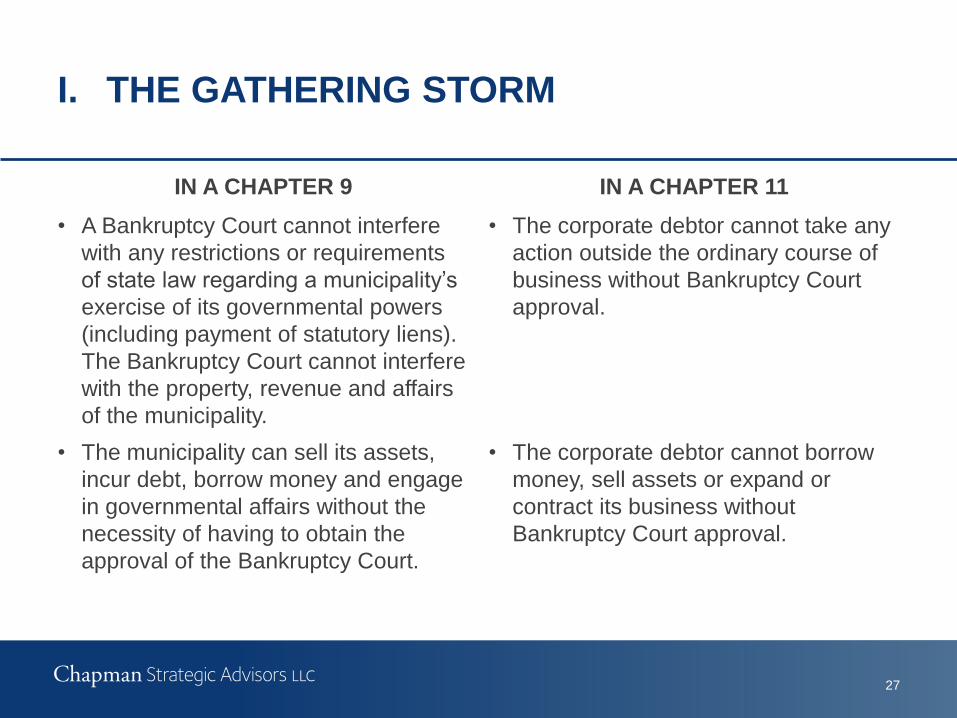
I. THE GATHERING STORM
IN A CHAPTER 9 IN A CHAPTER 11
• A Bankruptcy Court cannot interfere
with any restrictions or requirements
of state law regarding a municipality’s
exercise of its governmental powers
(including payment of statutory liens).
The Bankruptcy Court cannot interfere
with the property, revenue and affairs
of the municipality.
• The corporate debtor cannot take any
action outside the ordinary course of
business without Bankruptcy Court
approval.
• The municipality can sell its assets,
incur debt, borrow money and engage
in governmental affairs without the
necessity of having to obtain the
approval of the Bankruptcy Court.
• The corporate debtor cannot borrow
money, sell assets or expand or
contract its business without
Bankruptcy Court approval.
L. Illinois and Its Municipalities Have Faced Some Challenging
Financial Developments Due to the Great Recession, 2010
Reduction in Income Tax Rates and Income, Increased
Unfunded Pension Obligations and Loss of Manufacturing
Jobs Among Other Reasons:
1. Illinois and Chicago Metropolitan Statistical Area (“MSA”) had A
bittersweet economic climate since 2000.
The Sweet!
Illinois is the 5th largest state by population and GDP but the 15th by per
capita GDP
Chicago MSA in 2015 is the 8th, 6th or 5th largest metropolitan area by
GDP in the world (it was 4th in 2008).
In the Midwest, Illinois has the highest GDP per capita but also the highest
public debt per capita and the highest percentage of public debt to GDP
28
I. THE GATHERING STORM
The Not So Sweet and Bitter!
From 1985 to 2000, Illinois and Chicago MSA were competitive with
the increase in percentage of personal income and jobs compared
to that for the U.S.A. average and the Los Angeles and New York
City MSAs.
After 2000, Illinois and Chicago MSA lagged in the percentage
increase in personal income and jobs in comparison to the average
for the U.S.A. and New York City and Los Angeles MSAs.
This could be due to the adverse effects of NAFTA, China joining
the World Trade Organization or the economic downturns of 2001
and 2008 and the combined loss of over 75% in value of the Dow
from the beginning to the end of the 2001 and 2008 economic
downturns.
29
I. THE GATHERING STORM

Since 2000:
Illinois’ increase in jobs was 17% slower than U.S.A. average.
Illinois and Chicago MSA had 22-24% less GDP growth than U.S.A.
average and higher unemployment rates.
Due to a sunset of a tax increase in 2015, Illinois income tax
collections were reduced by $4 billion in FY2016 compared to 2014.
Illinois’ unpaid bills were estimated to be $14 billion by the end of
FY2017.
Illinois’ five pension systems unfunded liabilities have increased
over 650% since 1995 to about $129 billion by the end of FY2016.
The Chicago Public Schools purportedly had no unfunded pension
liabilities in 2000 and now have as of FY2014 over $9.4 billion
unfunded pension liabilities.
30
I. THE GATHERING STORM

Illinois and Chicago MSA are one of the largest manufacturing
areas in the U.S.A. Chicago MSA is the second largest
manufacturing area in the U.S.A. Since 2000, Illinois and Chicago
MSA lost about 18% more manufacturing jobs than the U.S.A.
average. However, the City of Chicago in 2015 added a net 80,000
jobs and a net 60,000 additional jobs in 2016 with an average
annual salary of about $72,000 mainly due to company
headquarter relocations to Chicago.
The following charts provide additional detail on the financial
distress suffered by Illinois and the Chicago MSA over the last 16
years.
31
I. THE GATHERING STORM

Development of a Local Government Protection Authority (“LGPA”) as
a Quasi-Judicial Entity to Determine What Costs Are Sustainable and
Affordable and Which Are Not, Including Labor Costs and Benefits and
Whether Taxes Should Be Raised or Costs Reduced. (Illinois H.B.
2575 modeled after a Civic Federation Proposal):
Evolution of Past Mechanisms that Worked. Under consideration by some
states is the use of a local government protection authority utilizing some of
the best aspects from the mediation process of the neutral evaluator and the
oversight and supervision of financial control boards and a receiver.
State-Created Quasi Judicial Function. Under this municipal debt resolution
mechanism, the state would establish an entity that would have a quasi-judicial
function and power similar to a commission or special master appointed by a
state supreme court or other objective nonpolitical process. The members of
the authority would be independent, experienced experts in governmental
operation or finance as well as in mediation and debt resolution techniques,
including bankruptcy.
32
II. ALTERNATIVES AVAILABLE TO THE STATE OF ILLINOIS
AND ITS MUNICIPALITIES TO MONITOR AND PROVIDE
OVERSIGHT AND ASSISTANCE TO FINANCIALLY
TROUBLED MUNICIPALITIES

33
A. The Natural Attributes of Chicago for Business Development. 1. Nation’s Transportation Center. Chicago is the center of commerce especially
as far as Transportation (major rail, land and air as well as water).
2. Major Manufacturing Center. Chicago USA is the second largest manufacturing
metropolitan area in the U.S.A. and has a long history in manufacturing given
its central location and ease of transportation.
3. Educated Workforce. Chicago has an educated workforce and the ability to
educate and train new workers for the new manufacturing models of the future.
B. Development of Upside Chicago. 1. Business Lead Innovation. The Concept was created by local business
professionals on a pro bono basis who had experience with operations,
manufacturing, finance, insurance and Special Economic Zones, both
domestically and internationally.
2. Use of Special Economic Zone Experience. The factors that produced lower
cost for production and distribution of goods that led to the development of the
Maquiladora in Mexico and Special Economic Zones in China and elsewhere
are now present in Chicago.
Part of the Solution for Illinois and Chicago —
VIII. UPSIDE CHICAGO — CREATION OF 10-18 INDUSTRIAL PARKS
IN THE CHICAGO AREA CREATING 20,000 NEW GOOD JOBS
FOR ABOUT 100-140 NEW OR RELOCATED COMPANIES

34
3. Significant Cost Saving. For Labor and Freight Intensive Manufacturing the cost
of shipping can be 8-16% or more of Sales Price while labor can be 15-22% of
Sales Price. A savings of 3-6% or more of sale costs is the equivalent of reducing
employment cost by about 25% or more.
4. Project Costs. Chicago’s unique transportation facilities could reduce shipping
and handling costs by 4-6% or more of Sale Price depending on the comparative
shipping locations.
5. Benefit of Managing Agent and Shared Services. Establishing a non for profit
special purpose entity that would be the Industrial Parks Coordinating and
Supervising Managing Agent (“Park Agent”) that would offer manufacturing site
with cost efficiencies for smaller manufacturing companies, 100-250 employees
by shared services (similar to condominiums for manufacturing) where building
outside maintenance, public safety, freight services, public safety inspection,
insurance (worker compensation and other general liability) etc. are shared costs
with the leverage in negotiation of the mega manufacturer with 20,000 workers. In
additional all available financing assistance through local government economic
development incentives, site improvement assistance and financing structures
would be pursued to the extent appropriate.
Part of the Solution for Illinois and Chicago —
VIII. UPSIDE CHICAGO — CREATION OF 10-18 INDUSTRIAL PARKS
IN THE CHICAGO AREA CREATING 20,000 NEW GOOD JOBS
FOR ABOUT 100-140 NEW OR RELOCATED COMPANIES

35
6. Target Manufacturing Businesses. The main focus would be the lower skilled jobs
with the higher shipping and handling costs such as auto reclamation, parts
remanufacturing (roughly 2,100 companies in U.S.A.), recyclers (about 3,000
companies in USA, 103,000 employees), return processing (or on-line sales return
processing), data storage and processing center etc. Given the projected savings
(from reduced shipping costs and shared services savings as well as possible
governmental incentives), it would be very attractive to these companies to move to
Upside Chicago.
7. Sufficient Workforce. More than sufficient supply of high quantity low skilled and semi-
skilled workers in Chicago area — the commutable area has at least 1.4 million
workers.
8. Attraction of Industrial Park. Companies can envision themselves in a clean, modern,
safe, digitally wired, next generation industrial park opposed to being attracted to
disparate (perhaps) degraded individual site. Park companies will bond with each
other for the benefit of all. They will learn from each other with regard to workers,
safety, security, environmental compliance, security etc. The bundled economics
benefits of Upside Chicago gives small companies the benefit of a larger enterprise
and increased free time by reducing or eliminating time which would have been spent
negotiating individually on shared services provided by the Park Manager.
Part of the Solution for Illinois and Chicago —
VIII. UPSIDE CHICAGO — CREATION OF 10-18 INDUSTRIAL PARKS
IN THE CHICAGO AREA CREATING 20,000 NEW GOOD JOBS
FOR ABOUT 100-140 NEW OR RELOCATED COMPANIES

36
C. Projected Economic Benefits of Upside Chicago Concept.
Upside Chicago and the goal of creating 20,000 new
manufacturing jobs (with additional indirect and induced
jobs) should over the long run:
Create 44,000 jobs more or less (direct, indirect and induced job
multiplier).
Increase state and local taxes by $426 million or more.
Help improve infrastructure and government services with increase tax
revenues in addition to the Industrial Park site improvements and
infrastructures.
Produce an estimated economic benefit of the Industrial Park Program
of over $8 billion.
Part of the Solution for Illinois and Chicago —
VIII. UPSIDE CHICAGO — CREATION OF 10-18 INDUSTRIAL PARKS
IN THE CHICAGO AREA CREATING 20,000 NEW GOOD JOBS
FOR ABOUT 100-140 NEW OR RELOCATED COMPANIES

The services of Chapman Strategic Advisors LLC do not include legal services and the protections of the client-lawyer
relationship will not exist. Only Chapman and Cutler LLP can provide legal services, if retained pursuant to a separate
engagement agreement with a client. This document has been prepared by Chapman Strategic Advisors LLC for
informational purposes only. It is general in nature and based on authorities that are subject to change. It is not intended as
a recommendation or advice with respect to municipal financial products or the issuance of municipal securities. Accordingly,
readers should consult with, and seek the advice of, their own independent registered municipal advisor with respect to any
individual situation that involves the material contained in this document, the application of such material to their specific
circumstances, or any questions relating to their own affairs that may be raised by such material.
© 2017 Chapman Strategic Advisors LLC
37


![Literaturschlüssel - aegyptologie.uni-muenchen.de · 5 Chicago Oriental Institute publication), Chicago 1935–1961. [T, Ü] Budge, E. A. W.: Coptic Homilies. In the Dialect of Upper](https://img.pdfslide.net/doc/110x75/5e13140dbbfad330f97dad38/literaturschlssel-5-chicago-oriental-institute-publication-chicago-1935a1961.jpg)