Embed Size (px)
Citation preview

CHICAGO NEIGHBORHOOD MARKET REPORTInsight, trends and outlook on your local real estate marketUPDATED NOVEMBER 17, 2015

Area Name Page Sub-Neighborhoods
Albany Park 3 Albany Park Mayfair North Mayfair Ravenswood Manor
Avondale 4 Avondale
Edgewater 5 Andersonville Edgewater Edgewater Glen Lakewood/Balmoral
Edison Park 6 Edison Park
Forest Glen 7 Forest Glen
Humboldt Park 8 Humboldt Park
Hyde Park 9 Hyde Park
Irving Park 10 Irving Park Kilbourn Park Old Irving Park The Villa
Jefferson Park 11 Jefferson Park
Kenwood 12 Kenwood
Lakeview 13 Lake View East North Halsted West Lakeview Wrigleyville
Lincoln Park 14 DePaul Old Town Triangle Park West Lincoln Park Ranch Triangle SheffieldNeighbors Wrightwood Neighbors
Lincoln Square 15 Lincoln Square Bowmanville Ravenswood Ravenswood Gardens
Logan Square 16 Logan Square Bucktown Palmer SquareLoop 17 The Loop New Eastside Printer’s Row South Loop
Area Name Page Sub-Neighborhoods
Near North Side 18 Old Town Gold Coast Near North Side MagnificentMile River North Streeterville
Near South Side 19 Dearborn Park Near South Side Museum Park Prarie Ave. Historic District
Near West Side 20 Columbus Circle Greektown Little Italy Medical Center Near West Side Fulton River District University Village Tri-Taylor
North Center 21 Northcenter Roscoe Village Saint Ben’s
North Park 22 North ParkNorwood Park 23 Norwood Park
Portage Park 24 Portage Park
Rogers Park 25 Loyola Rogers Park
South Shore 26 South Shore
Uptown 27 Clarendon Park Buena Park Sheridan Park Uptown
West Town 28 Ukrainian Village Wicker Park River West Logan Square Noble Square
Chicago Area and Neighborhood List

3
*Each dot represents the change in median sales price from the prior year using a 6-month weighted average. This means that each of the 6 months used in a dot are proportioned according to their share of sales during that period. | All data from Midwest Real Estate Data LLC. Powered by 10K Research and Marketing.
A RESEARCH TOOL PROVIDED BY MIDWEST REAL ESTATE DATA LLC RESIDENTIAL ACTIVITY ONLY | Data current as of January 16, 2013
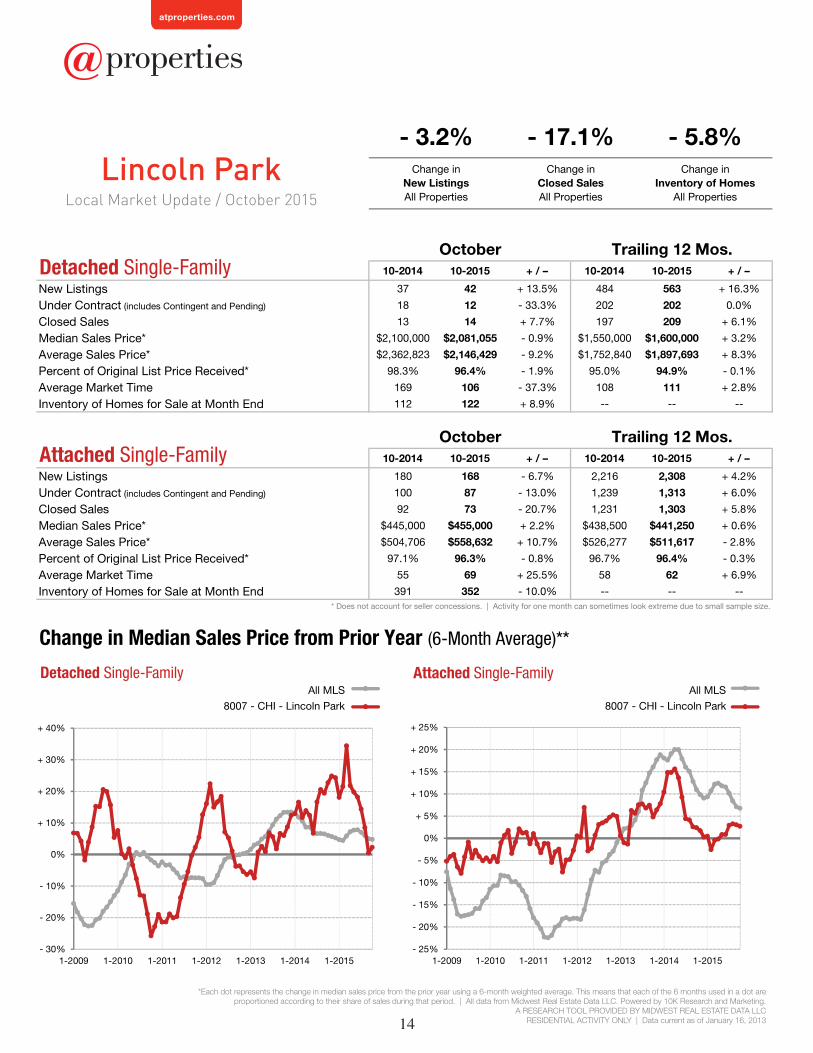
Local Market Update / October 2015
10-2014 10-2015 + / – 10-2014 10-2015 + / –
New Listings 25 23 - 8.0% 234 300 + 28.2%
Under Contract (includes Contingent and Pending) 5 17 + 240.0% 120 163 + 35.8%
Closed Sales 12 8 - 33.3% 127 143 + 12.6%
Median Sales Price* $327,000 $345,500 + 5.7% $310,000 $342,500 + 10.5%
Average Sales Price* $423,417 $366,700 - 13.4% $347,377 $382,313 + 10.1%
Percent of Original List Price Received* 93.3% 96.0% + 2.9% 95.7% 95.0% - 0.7%
Average Market Time 58 131 + 125.9% 70 104 + 48.6%
Inventory of Homes for Sale at Month End 61 48 - 21.3% -- -- --
10-2014 10-2015 + / – 10-2014 10-2015 + / –
New Listings 22 25 + 13.6% 265 352 + 32.8%
Under Contract (includes Contingent and Pending) 12 12 0.0% 146 175 + 19.9%
Closed Sales 13 17 + 30.8% 153 176 + 15.0%
Median Sales Price* $102,000 $166,750 + 63.5% $122,500 $161,200 + 31.6%
Average Sales Price* $120,331 $189,591 + 57.6% $136,976 $165,299 + 20.7%
Percent of Original List Price Received* 93.9% 94.0% + 0.1% 94.2% 93.0% - 1.3%
Average Market Time 59 57 - 3.4% 83 92 + 10.8%
Inventory of Homes for Sale at Month End 72 67 - 6.9% -- -- --* Does not account for seller concessions. | Activity for one month can sometimes look extreme due to small sample size.
+ 2.1% 0.0%
October Trailing 12 Mos.Detached Single-Family
- 13.5%Change in
New ListingsAll Properties
Change inClosed SalesAll Properties
Change in Inventory of Homes
All Properties
Change in Median Sales Price from Prior Year (6-Month Average)**
8014 - CHI - Albany Park
All MLSAll MLS
8014 - CHI - Albany Park
October Trailing 12 Mos.Attached Single-Family
- 40%
- 30%
- 20%
- 10%
0%
+ 10%
+ 20%
+ 30%
+ 40%
+ 50%
+ 60%
+ 70%
1-2009 1-2010 1-2011 1-2012 1-2013 1-2014 1-2015
Detached Single-Familyb
a
- 80%
- 60%
- 40%
- 20%
0%
+ 20%
+ 40%
+ 60%
+ 80%
+ 100%
1-2009 1-2010 1-2011 1-2012 1-2013 1-2014 1-2015
Attached Single-Familyb
a
Albany Park

4
*Each dot represents the change in median sales price from the prior year using a 6-month weighted average. This means that each of the 6 months used in a dot are proportioned according to their share of sales during that period. | All data from Midwest Real Estate Data LLC. Powered by 10K Research and Marketing.
A RESEARCH TOOL PROVIDED BY MIDWEST REAL ESTATE DATA LLC RESIDENTIAL ACTIVITY ONLY | Data current as of January 16, 2013
Local Market Update / October 2015
10-2014 10-2015 + / – 10-2014 10-2015 + / –
New Listings 24 16 - 33.3% 177 226 + 27.7%
Under Contract (includes Contingent and Pending) 8 12 + 50.0% 108 126 + 16.7%
Closed Sales 6 14 + 133.3% 103 123 + 19.4%
Median Sales Price* $296,500 $264,950 - 10.6% $335,000 $389,500 + 16.3%
Average Sales Price* $345,792 $342,605 - 0.9% $371,063 $401,160 + 8.1%
Percent of Original List Price Received* 95.0% 95.0% 0.0% 98.3% 96.1% - 2.2%
Average Market Time 39 65 + 66.7% 43 57 + 32.6%
Inventory of Homes for Sale at Month End 34 32 - 5.9% -- -- --
10-2014 10-2015 + / – 10-2014 10-2015 + / –
New Listings 26 13 - 50.0% 285 224 - 21.4%
Under Contract (includes Contingent and Pending) 8 8 0.0% 139 156 + 12.2%
Closed Sales 20 9 - 55.0% 128 180 + 40.6%
Median Sales Price* $309,950 $250,000 - 19.3% $263,000 $298,000 + 13.3%
Average Sales Price* $283,823 $281,787 - 0.7% $262,054 $287,285 + 9.6%
Percent of Original List Price Received* 99.1% 98.6% - 0.5% 96.9% 97.9% + 1.0%
Average Market Time 75 48 - 36.0% 80 65 - 18.8%
Inventory of Homes for Sale at Month End 54 39 - 27.8% -- -- --* Does not account for seller concessions. | Activity for one month can sometimes look extreme due to small sample size.
- 42.0% - 11.5%
October Trailing 12 Mos.Detached Single-Family
- 19.3%Change in
New ListingsAll Properties
Change inClosed SalesAll Properties
Change in Inventory of Homes
All Properties
Change in Median Sales Price from Prior Year (6-Month Average)**
8021 - CHI - Avondale
All MLSAll MLS
8021 - CHI - Avondale
October Trailing 12 Mos.Attached Single-Family
- 60%
- 40%
- 20%
0%
+ 20%
+ 40%
+ 60%
+ 80%
+ 100%
+ 120%
+ 140%
1-2009 1-2010 1-2011 1-2012 1-2013 1-2014 1-2015
Detached Single-Familyb
a
- 60%
- 40%
- 20%
0%
+ 20%
+ 40%
+ 60%
+ 80%
+ 100%
1-2009 1-2010 1-2011 1-2012 1-2013 1-2014 1-2015
Attached Single-Familyb
a
Avondale

5
*Each dot represents the change in median sales price from the prior year using a 6-month weighted average. This means that each of the 6 months used in a dot are proportioned according to their share of sales during that period. | All data from Midwest Real Estate Data LLC. Powered by 10K Research and Marketing.
A RESEARCH TOOL PROVIDED BY MIDWEST REAL ESTATE DATA LLC RESIDENTIAL ACTIVITY ONLY | Data current as of January 16, 2013
Local Market Update / October 2015
10-2014 10-2015 + / – 10-2014 10-2015 + / –
New Listings 14 13 - 7.1% 129 180 + 39.5%
Under Contract (includes Contingent and Pending) 8 5 - 37.5% 62 77 + 24.2%
Closed Sales 6 1 - 83.3% 60 73 + 21.7%
Median Sales Price* $524,125 $729,000 + 39.1% $632,000 $585,500 - 7.4%
Average Sales Price* $587,625 $729,000 + 24.1% $659,118 $651,393 - 1.2%
Percent of Original List Price Received* 92.8% 97.2% + 4.7% 93.6% 95.7% + 2.2%
Average Market Time 59 8 - 86.4% 47 65 + 38.3%
Inventory of Homes for Sale at Month End 21 37 + 76.2% -- -- --
10-2014 10-2015 + / – 10-2014 10-2015 + / –
New Listings 106 85 - 19.8% 1,203 1,317 + 9.5%
Under Contract (includes Contingent and Pending) 54 62 + 14.8% 676 771 + 14.1%
Closed Sales 43 57 + 32.6% 704 741 + 5.3%
Median Sales Price* $170,000 $179,000 + 5.3% $170,943 $185,000 + 8.2%
Average Sales Price* $193,583 $231,125 + 19.4% $193,057 $209,865 + 8.7%
Percent of Original List Price Received* 97.1% 94.5% - 2.7% 94.8% 93.7% - 1.2%
Average Market Time 67 86 + 28.4% 82 83 + 1.2%
Inventory of Homes for Sale at Month End 274 248 - 9.5% -- -- --* Does not account for seller concessions. | Activity for one month can sometimes look extreme due to small sample size.
- 18.3% + 18.4%
October Trailing 12 Mos.Detached Single-Family
- 3.4%Change in
New ListingsAll Properties
Change inClosed SalesAll Properties
Change in Inventory of Homes
All Properties
Change in Median Sales Price from Prior Year (6-Month Average)**
8077 - CHI - Edgewater
All MLSAll MLS
8077 - CHI - Edgewater
October Trailing 12 Mos.Attached Single-Family
- 40%
- 20%
0%
+ 20%
+ 40%
+ 60%
+ 80%
+ 100%
1-2009 1-2010 1-2011 1-2012 1-2013 1-2014 1-2015
Detached Single-Familyb
a
- 40%
- 30%
- 20%
- 10%
0%
+ 10%
+ 20%
+ 30%
1-2009 1-2010 1-2011 1-2012 1-2013 1-2014 1-2015
Attached Single-Familyb
a
Edgewater

6
*Each dot represents the change in median sales price from the prior year using a 6-month weighted average. This means that each of the 6 months used in a dot are proportioned according to their share of sales during that period. | All data from Midwest Real Estate Data LLC. Powered by 10K Research and Marketing.
A RESEARCH TOOL PROVIDED BY MIDWEST REAL ESTATE DATA LLC RESIDENTIAL ACTIVITY ONLY | Data current as of January 16, 2013
Local Market Update / October 2015
Edison Park
10-2014 10-2015 + / – 10-2014 10-2015 + / –
New Listings 21 10 - 52.4% 220 223 + 1.4%
Under Contract (includes Contingent and Pending) 13 7 - 46.2% 110 124 + 12.7%
Closed Sales 6 8 + 33.3% 104 132 + 26.9%
Median Sales Price* $337,500 $346,450 + 2.7% $331,000 $359,950 + 8.7%
Average Sales Price* $348,333 $364,738 + 4.7% $368,035 $397,483 + 8.0%
Percent of Original List Price Received* 98.7% 95.3% - 3.4% 97.2% 95.9% - 1.3%
Average Market Time 35 79 + 125.7% 69 87 + 26.1%
Inventory of Homes for Sale at Month End 44 35 - 20.5% -- -- --
10-2014 10-2015 + / – 10-2014 10-2015 + / –
New Listings 7 7 0.0% 62 90 + 45.2%
Under Contract (includes Contingent and Pending) 1 6 + 500.0% 33 50 + 51.5%
Closed Sales 3 5 + 66.7% 43 41 - 4.7%
Median Sales Price* $115,000 $127,500 + 10.9% $118,000 $134,900 + 14.3%
Average Sales Price* $124,400 $142,300 + 14.4% $133,496 $147,776 + 10.7%
Percent of Original List Price Received* 99.6% 84.3% - 15.4% 95.5% 94.2% - 1.4%
Average Market Time 33 68 + 106.1% 70 73 + 4.3%
Inventory of Homes for Sale at Month End 14 15 + 7.1% -- -- --* Does not account for seller concessions. | Activity for one month can sometimes look extreme due to small sample size.
- 39.3% + 44.4%
October Trailing 12 Mos.Detached Single-Family
- 13.8%Change in
New ListingsAll Properties
Change inClosed SalesAll Properties
Change in Inventory of Homes
All Properties
Change in Median Sales Price from Prior Year (6-Month Average)**
8009 - CHI - Edison Park
All MLSAll MLS
8009 - CHI - Edison Park
October Trailing 12 Mos.Attached Single-Family
- 30%
- 20%
- 10%
0%
+ 10%
+ 20%
+ 30%
+ 40%
+ 50%
1-2009 1-2010 1-2011 1-2012 1-2013 1-2014 1-2015
Detached Single-Familyb
a
- 50%
- 40%
- 30%
- 20%
- 10%
0%
+ 10%
+ 20%
+ 30%
+ 40%
+ 50%
1-2009 1-2010 1-2011 1-2012 1-2013 1-2014 1-2015
Attached Single-Familyb
a

7
*Each dot represents the change in median sales price from the prior year using a 6-month weighted average. This means that each of the 6 months used in a dot are proportioned according to their share of sales during that period. | All data from Midwest Real Estate Data LLC. Powered by 10K Research and Marketing.
A RESEARCH TOOL PROVIDED BY MIDWEST REAL ESTATE DATA LLC RESIDENTIAL ACTIVITY ONLY | Data current as of January 16, 2013
Local Market Update / October 2015
10-2014 10-2015 + / – 10-2014 10-2015 + / –
New Listings 39 46 + 17.9% 431 472 + 9.5%
Under Contract (includes Contingent and Pending) 10 18 + 80.0% 209 250 + 19.6%
Closed Sales 12 21 + 75.0% 219 241 + 10.0%
Median Sales Price* $388,750 $425,000 + 9.3% $406,100 $425,000 + 4.7%
Average Sales Price* $387,250 $436,095 + 12.6% $420,171 $452,548 + 7.7%
Percent of Original List Price Received* 94.1% 94.4% + 0.3% 95.2% 94.3% - 0.9%
Average Market Time 89 73 - 18.0% 82 93 + 13.4%
Inventory of Homes for Sale at Month End 96 98 + 2.1% -- -- --
10-2014 10-2015 + / – 10-2014 10-2015 + / –
New Listings 0 5 -- 24 40 + 66.7%
Under Contract (includes Contingent and Pending) 0 2 -- 11 21 + 90.9%
Closed Sales 3 3 0.0% 10 21 + 110.0%
Median Sales Price* $318,000 $109,000 - 65.7% $225,750 $169,950 - 24.7%
Average Sales Price* $367,633 $114,667 - 68.8% $235,581 $173,417 - 26.4%
Percent of Original List Price Received* 95.2% 88.7% - 6.8% 91.4% 93.8% + 2.6%
Average Market Time 54 49 - 9.3% 52 80 + 53.8%
Inventory of Homes for Sale at Month End 4 10 + 150.0% -- -- --* Does not account for seller concessions. | Activity for one month can sometimes look extreme due to small sample size.
+ 30.8% + 60.0%
October Trailing 12 Mos.Detached Single-Family
+ 8.0%Change in
New ListingsAll Properties
Change inClosed SalesAll Properties
Change in Inventory of Homes
All Properties
Change in Median Sales Price from Prior Year (6-Month Average)**
8012 - CHI - Forest Glen
All MLSAll MLS
8012 - CHI - Forest Glen
October Trailing 12 Mos.Attached Single-Family
- 25%
- 20%
- 15%
- 10%
- 5%
0%
+ 5%
+ 10%
+ 15%
+ 20%
+ 25%
1-2009 1-2010 1-2011 1-2012 1-2013 1-2014 1-2015
Detached Single-Familyb
a
- 40%
- 20%
0%
+ 20%
+ 40%
+ 60%
+ 80%
+ 100%
+ 120%
+ 140%
1-2009 1-2010 1-2011 1-2012 1-2013 1-2014 1-2015
Attached Single-Familyb
a
Forest Glen

8
*Each dot represents the change in median sales price from the prior year using a 6-month weighted average. This means that each of the 6 months used in a dot are proportioned according to their share of sales during that period. | All data from Midwest Real Estate Data LLC. Powered by 10K Research and Marketing.
A RESEARCH TOOL PROVIDED BY MIDWEST REAL ESTATE DATA LLC RESIDENTIAL ACTIVITY ONLY | Data current as of January 16, 2013
Local Market Update / October 2015
Humboldt Park
10-2014 10-2015 + / – 10-2014 10-2015 + / –
New Listings 24 16 - 33.3% 243 237 - 2.5%
Under Contract (includes Contingent and Pending) 12 11 - 8.3% 136 143 + 5.1%
Closed Sales 17 14 - 17.6% 149 131 - 12.1%
Median Sales Price* $80,000 $132,450 + 65.6% $81,173 $130,000 + 60.2%
Average Sales Price* $101,093 $159,925 + 58.2% $121,386 $164,070 + 35.2%
Percent of Original List Price Received* 86.7% 89.1% + 2.8% 103.0% 96.0% - 6.8%
Average Market Time 107 53 - 50.5% 84 71 - 15.5%
Inventory of Homes for Sale at Month End 62 53 - 14.5% -- -- --
10-2014 10-2015 + / – 10-2014 10-2015 + / –
New Listings 4 4 0.0% 67 62 - 7.5%
Under Contract (includes Contingent and Pending) 2 5 + 150.0% 34 30 - 11.8%
Closed Sales 1 5 + 400.0% 34 29 - 14.7%
Median Sales Price* $25,420 $53,000 + 108.5% $72,250 $185,000 + 156.1%
Average Sales Price* $25,420 $61,500 + 141.9% $103,229 $204,009 + 97.6%
Percent of Original List Price Received* 87.7% 82.9% - 5.5% 91.6% 95.9% + 4.7%
Average Market Time 29 72 + 148.3% 122 87 - 28.7%
Inventory of Homes for Sale at Month End 13 7 - 46.2% -- -- --* Does not account for seller concessions. | Activity for one month can sometimes look extreme due to small sample size.
- 28.6% + 5.6%
October Trailing 12 Mos.Detached Single-Family
- 20.0%Change in
New ListingsAll Properties
Change inClosed SalesAll Properties
Change in Inventory of Homes
All Properties
Change in Median Sales Price from Prior Year (6-Month Average)**
8023 - CHI - Humboldt Park
All MLSAll MLS
8023 - CHI - Humboldt Park
October Trailing 12 Mos.Attached Single-Family
- 80%
- 60%
- 40%
- 20%
0%
+ 20%
+ 40%
+ 60%
+ 80%
+ 100%
1-2009 1-2010 1-2011 1-2012 1-2013 1-2014 1-2015
Detached Single-Familyb
a
- 500%
0%
+ 500%
+ 1000%
+ 1500%
+ 2000%
+ 2500%
+ 3000%
+ 3500%
1-2009 1-2010 1-2011 1-2012 1-2013 1-2014 1-2015
Attached Single-Familyb
a

9
*Each dot represents the change in median sales price from the prior year using a 6-month weighted average. This means that each of the 6 months used in a dot are proportioned according to their share of sales during that period. | All data from Midwest Real Estate Data LLC. Powered by 10K Research and Marketing.
A RESEARCH TOOL PROVIDED BY MIDWEST REAL ESTATE DATA LLC RESIDENTIAL ACTIVITY ONLY | Data current as of January 16, 2013
Local Market Update / October 2015
10-2014 10-2015 + / – 10-2014 10-2015 + / –
New Listings 5 5 0.0% 48 48 0.0%
Under Contract (includes Contingent and Pending) 1 1 0.0% 18 29 + 61.1%
Closed Sales 2 3 + 50.0% 19 30 + 57.9%
Median Sales Price* $395,000 $468,000 + 18.5% $850,000 $802,500 - 5.6%
Average Sales Price* $395,000 $641,000 + 62.3% $942,211 $791,600 - 16.0%
Percent of Original List Price Received* 77.9% 92.5% + 18.7% 85.8% 92.4% + 7.7%
Average Market Time 266 236 - 11.3% 142 143 + 0.7%
Inventory of Homes for Sale at Month End 23 15 - 34.8% -- -- --
10-2014 10-2015 + / – 10-2014 10-2015 + / –
New Listings 31 23 - 25.8% 481 442 - 8.1%
Under Contract (includes Contingent and Pending) 8 22 + 175.0% 208 270 + 29.8%
Closed Sales 16 20 + 25.0% 210 252 + 20.0%
Median Sales Price* $157,090 $128,750 - 18.0% $150,000 $163,000 + 8.7%
Average Sales Price* $231,043 $147,128 - 36.3% $210,229 $207,262 - 1.4%
Percent of Original List Price Received* 86.1% 88.7% + 3.0% 88.3% 89.2% + 1.0%
Average Market Time 142 88 - 38.0% 133 153 + 15.0%
Inventory of Homes for Sale at Month End 195 133 - 31.8% -- -- --* Does not account for seller concessions. | Activity for one month can sometimes look extreme due to small sample size.
- 22.2% + 27.8%
October Trailing 12 Mos.Detached Single-Family
- 32.1%Change in
New ListingsAll Properties
Change inClosed SalesAll Properties
Change in Inventory of Homes
All Properties
Change in Median Sales Price from Prior Year (6-Month Average)**
8041 - CHI - Hyde Park
All MLSAll MLS
8041 - CHI - Hyde Park
October Trailing 12 Mos.Attached Single-Family
- 60%
- 40%
- 20%
0%
+ 20%
+ 40%
+ 60%
+ 80%
+ 100%
+ 120%
+ 140%
+ 160%
1-2009 1-2010 1-2011 1-2012 1-2013 1-2014 1-2015
Detached Single-Familyb
a
- 30%
- 20%
- 10%
0%
+ 10%
+ 20%
+ 30%
+ 40%
+ 50%
+ 60%
+ 70%
1-2009 1-2010 1-2011 1-2012 1-2013 1-2014 1-2015
Attached Single-Familyb
a
Hyde Park

10
*Each dot represents the change in median sales price from the prior year using a 6-month weighted average. This means that each of the 6 months used in a dot are proportioned according to their share of sales during that period. | All data from Midwest Real Estate Data LLC. Powered by 10K Research and Marketing.
A RESEARCH TOOL PROVIDED BY MIDWEST REAL ESTATE DATA LLC RESIDENTIAL ACTIVITY ONLY | Data current as of January 16, 2013
Local Market Update / October 2015
10-2014 10-2015 + / – 10-2014 10-2015 + / –
New Listings 51 54 + 5.9% 449 570 + 26.9%
Under Contract (includes Contingent and Pending) 18 18 0.0% 234 275 + 17.5%
Closed Sales 21 18 - 14.3% 226 270 + 19.5%
Median Sales Price* $342,000 $485,250 + 41.9% $391,500 $406,000 + 3.7%
Average Sales Price* $385,719 $478,689 + 24.1% $412,425 $456,240 + 10.6%
Percent of Original List Price Received* 92.2% 93.8% + 1.7% 97.3% 95.4% - 2.0%
Average Market Time 50 69 + 38.0% 72 69 - 4.2%
Inventory of Homes for Sale at Month End 98 111 + 13.3% -- -- --
10-2014 10-2015 + / – 10-2014 10-2015 + / –
New Listings 37 50 + 35.1% 353 468 + 32.6%
Under Contract (includes Contingent and Pending) 22 23 + 4.5% 204 226 + 10.8%
Closed Sales 15 14 - 6.7% 210 226 + 7.6%
Median Sales Price* $179,900 $173,000 - 3.8% $151,500 $179,935 + 18.8%
Average Sales Price* $233,134 $180,071 - 22.8% $173,343 $200,615 + 15.7%
Percent of Original List Price Received* 93.0% 94.5% + 1.6% 95.5% 93.8% - 1.8%
Average Market Time 66 82 + 24.2% 77 80 + 3.9%
Inventory of Homes for Sale at Month End 82 103 + 25.6% -- -- --* Does not account for seller concessions. | Activity for one month can sometimes look extreme due to small sample size.
+ 18.2% - 11.1%
October Trailing 12 Mos.Detached Single-Family
+ 18.9%Change in
New ListingsAll Properties
Change inClosed SalesAll Properties
Change in Inventory of Homes
All Properties
Change in Median Sales Price from Prior Year (6-Month Average)**
8016 - CHI - Irving Park
All MLSAll MLS
8016 - CHI - Irving Park
October Trailing 12 Mos.Attached Single-Family
- 40%
- 30%
- 20%
- 10%
0%
+ 10%
+ 20%
+ 30%
+ 40%
+ 50%
1-2009 1-2010 1-2011 1-2012 1-2013 1-2014 1-2015
Detached Single-Familyb
a
- 40%
- 30%
- 20%
- 10%
0%
+ 10%
+ 20%
+ 30%
+ 40%
+ 50%
+ 60%
1-2009 1-2010 1-2011 1-2012 1-2013 1-2014 1-2015
Attached Single-Familyb
a
Irving Park

11
*Each dot represents the change in median sales price from the prior year using a 6-month weighted average. This means that each of the 6 months used in a dot are proportioned according to their share of sales during that period. | All data from Midwest Real Estate Data LLC. Powered by 10K Research and Marketing.
A RESEARCH TOOL PROVIDED BY MIDWEST REAL ESTATE DATA LLC RESIDENTIAL ACTIVITY ONLY | Data current as of January 16, 2013
Local Market Update / October 2015
Jefferson Park
10-2014 10-2015 + / – 10-2014 10-2015 + / –
New Listings 37 28 - 24.3% 368 381 + 3.5%
Under Contract (includes Contingent and Pending) 14 10 - 28.6% 184 218 + 18.5%
Closed Sales 18 16 - 11.1% 195 215 + 10.3%
Median Sales Price* $265,500 $317,500 + 19.6% $257,500 $280,500 + 8.9%
Average Sales Price* $284,689 $315,750 + 10.9% $284,567 $295,179 + 3.7%
Percent of Original List Price Received* 93.2% 93.5% + 0.3% 96.2% 94.0% - 2.3%
Average Market Time 62 107 + 72.6% 62 85 + 37.1%
Inventory of Homes for Sale at Month End 77 55 - 28.6% -- -- --
10-2014 10-2015 + / – 10-2014 10-2015 + / –
New Listings 6 4 - 33.3% 76 123 + 61.8%
Under Contract (includes Contingent and Pending) 6 10 + 66.7% 59 80 + 35.6%
Closed Sales 9 9 0.0% 61 71 + 16.4%
Median Sales Price* $110,000 $145,000 + 31.8% $124,000 $135,000 + 8.9%
Average Sales Price* $132,056 $143,267 + 8.5% $127,600 $149,844 + 17.4%
Percent of Original List Price Received* 96.2% 90.1% - 6.3% 94.9% 91.6% - 3.5%
Average Market Time 44 96 + 118.2% 77 53 - 31.2%
Inventory of Homes for Sale at Month End 11 14 + 27.3% -- -- --* Does not account for seller concessions. | Activity for one month can sometimes look extreme due to small sample size.
- 25.6% - 7.4%
October Trailing 12 Mos.Detached Single-Family
- 21.6%Change in
New ListingsAll Properties
Change inClosed SalesAll Properties
Change in Inventory of Homes
All Properties
Change in Median Sales Price from Prior Year (6-Month Average)**
8011 - CHI - Jefferson Park
All MLSAll MLS
8011 - CHI - Jefferson Park
October Trailing 12 Mos.Attached Single-Family
- 30%
- 20%
- 10%
0%
+ 10%
+ 20%
+ 30%
1-2009 1-2010 1-2011 1-2012 1-2013 1-2014 1-2015
Detached Single-Familyb
a
- 40%
- 20%
0%
+ 20%
+ 40%
+ 60%
+ 80%
1-2009 1-2010 1-2011 1-2012 1-2013 1-2014 1-2015
Attached Single-Familyb
a

12
*Each dot represents the change in median sales price from the prior year using a 6-month weighted average. This means that each of the 6 months used in a dot are proportioned according to their share of sales during that period. | All data from Midwest Real Estate Data LLC. Powered by 10K Research and Marketing.
A RESEARCH TOOL PROVIDED BY MIDWEST REAL ESTATE DATA LLC RESIDENTIAL ACTIVITY ONLY | Data current as of January 16, 2013
Local Market Update / October 2015
10-2014 10-2015 + / – 10-2014 10-2015 + / –
New Listings 7 8 + 14.3% 72 67 - 6.9%
Under Contract (includes Contingent and Pending) 4 3 - 25.0% 28 28 0.0%
Closed Sales 3 3 0.0% 29 32 + 10.3%
Median Sales Price* $300,000 $700,000 + 133.3% $515,000 $680,750 + 32.2%
Average Sales Price* $850,000 $772,500 - 9.1% $834,605 $796,331 - 4.6%
Percent of Original List Price Received* 85.1% 78.7% - 7.5% 85.7% 90.4% + 5.5%
Average Market Time 213 237 + 11.3% 144 176 + 22.2%
Inventory of Homes for Sale at Month End 23 22 - 4.3% -- -- --
10-2014 10-2015 + / – 10-2014 10-2015 + / –
New Listings 15 27 + 80.0% 258 293 + 13.6%
Under Contract (includes Contingent and Pending) 10 13 + 30.0% 122 152 + 24.6%
Closed Sales 19 17 - 10.5% 131 136 + 3.8%
Median Sales Price* $94,900 $130,000 + 37.0% $130,000 $142,500 + 9.6%
Average Sales Price* $116,063 $138,965 + 19.7% $156,986 $167,753 + 6.9%
Percent of Original List Price Received* 83.0% 88.0% + 6.0% 89.4% 87.6% - 2.0%
Average Market Time 122 220 + 80.3% 146 143 - 2.1%
Inventory of Homes for Sale at Month End 94 78 - 17.0% -- -- --* Does not account for seller concessions. | Activity for one month can sometimes look extreme due to small sample size.
+ 59.1% - 9.1%
October Trailing 12 Mos.Detached Single-Family
- 14.5%Change in
New ListingsAll Properties
Change inClosed SalesAll Properties
Change in Inventory of Homes
All Properties
Change in Median Sales Price from Prior Year (6-Month Average)**
8039 - CHI - Kenwood
All MLSAll MLS
8039 - CHI - Kenwood
October Trailing 12 Mos.Attached Single-Family
- 100%
- 50%
0%
+ 50%
+ 100%
+ 150%
+ 200%
+ 250%
1-2009 1-2010 1-2011 1-2012 1-2013 1-2014 1-2015
Detached Single-Familyb
a
- 60%
- 40%
- 20%
0%
+ 20%
+ 40%
+ 60%
+ 80%
+ 100%
1-2009 1-2010 1-2011 1-2012 1-2013 1-2014 1-2015
Attached Single-Familyb
a
Kenwood

13
*Each dot represents the change in median sales price from the prior year using a 6-month weighted average. This means that each of the 6 months used in a dot are proportioned according to their share of sales during that period. | All data from Midwest Real Estate Data LLC. Powered by 10K Research and Marketing.
A RESEARCH TOOL PROVIDED BY MIDWEST REAL ESTATE DATA LLC RESIDENTIAL ACTIVITY ONLY | Data current as of January 16, 2013
Local Market Update / October 2015
10-2014 10-2015 + / – 10-2014 10-2015 + / –
New Listings 38 27 - 28.9% 343 402 + 17.2%
Under Contract (includes Contingent and Pending) 11 9 - 18.2% 159 164 + 3.1%
Closed Sales 17 11 - 35.3% 167 163 - 2.4%
Median Sales Price* $1,437,500 $1,380,744 - 3.9% $1,240,000 $1,307,500 + 5.4%
Average Sales Price* $1,386,647 $1,474,249 + 6.3% $1,297,756 $1,457,018 + 12.3%
Percent of Original List Price Received* 95.9% 99.8% + 4.1% 96.2% 95.4% - 0.8%
Average Market Time 69 55 - 20.3% 62 98 + 58.1%
Inventory of Homes for Sale at Month End 67 89 + 32.8% -- -- --
10-2014 10-2015 + / – 10-2014 10-2015 + / –
New Listings 255 222 - 12.9% 3,373 3,424 + 1.5%
Under Contract (includes Contingent and Pending) 93 131 + 40.9% 1,813 2,061 + 13.7%
Closed Sales 149 124 - 16.8% 1,863 2,006 + 7.7%
Median Sales Price* $368,500 $307,500 - 16.6% $355,000 $339,950 - 4.2%
Average Sales Price* $376,263 $361,693 - 3.9% $372,315 $368,117 - 1.1%
Percent of Original List Price Received* 94.7% 95.7% + 1.1% 96.0% 96.2% + 0.2%
Average Market Time 64 71 + 10.9% 65 78 + 20.0%
Inventory of Homes for Sale at Month End 659 531 - 19.4% -- -- --* Does not account for seller concessions. | Activity for one month can sometimes look extreme due to small sample size.
- 15.0% - 18.7%
October Trailing 12 Mos.Detached Single-Family
- 14.6%Change in
New ListingsAll Properties
Change inClosed SalesAll Properties
Change in Inventory of Homes
All Properties
Change in Median Sales Price from Prior Year (6-Month Average)**
8006 - CHI - Lake View
All MLSAll MLS
8006 - CHI - Lake View
October Trailing 12 Mos.Attached Single-Family
- 50%
- 40%
- 30%
- 20%
- 10%
0%
+ 10%
+ 20%
+ 30%
+ 40%
1-2009 1-2010 1-2011 1-2012 1-2013 1-2014 1-2015
Detached Single-Familyb
a
- 25%
- 20%
- 15%
- 10%
- 5%
0%
+ 5%
+ 10%
+ 15%
+ 20%
+ 25%
1-2009 1-2010 1-2011 1-2012 1-2013 1-2014 1-2015
Attached Single-Familyb
a
Lakeview
14
*Each dot represents the change in median sales price from the prior year using a 6-month weighted average. This means that each of the 6 months used in a dot are proportioned according to their share of sales during that period. | All data from Midwest Real Estate Data LLC. Powered by 10K Research and Marketing.
A RESEARCH TOOL PROVIDED BY MIDWEST REAL ESTATE DATA LLC RESIDENTIAL ACTIVITY ONLY | Data current as of January 16, 2013
Local Market Update / October 2015
10-2014 10-2015 + / – 10-2014 10-2015 + / –
New Listings 37 42 + 13.5% 484 563 + 16.3%
Under Contract (includes Contingent and Pending) 18 12 - 33.3% 202 202 0.0%
Closed Sales 13 14 + 7.7% 197 209 + 6.1%
Median Sales Price* $2,100,000 $2,081,055 - 0.9% $1,550,000 $1,600,000 + 3.2%
Average Sales Price* $2,362,823 $2,146,429 - 9.2% $1,752,840 $1,897,693 + 8.3%
Percent of Original List Price Received* 98.3% 96.4% - 1.9% 95.0% 94.9% - 0.1%
Average Market Time 169 106 - 37.3% 108 111 + 2.8%
Inventory of Homes for Sale at Month End 112 122 + 8.9% -- -- --
10-2014 10-2015 + / – 10-2014 10-2015 + / –
New Listings 180 168 - 6.7% 2,216 2,308 + 4.2%
Under Contract (includes Contingent and Pending) 100 87 - 13.0% 1,239 1,313 + 6.0%
Closed Sales 92 73 - 20.7% 1,231 1,303 + 5.8%
Median Sales Price* $445,000 $455,000 + 2.2% $438,500 $441,250 + 0.6%
Average Sales Price* $504,706 $558,632 + 10.7% $526,277 $511,617 - 2.8%
Percent of Original List Price Received* 97.1% 96.3% - 0.8% 96.7% 96.4% - 0.3%
Average Market Time 55 69 + 25.5% 58 62 + 6.9%
Inventory of Homes for Sale at Month End 391 352 - 10.0% -- -- --* Does not account for seller concessions. | Activity for one month can sometimes look extreme due to small sample size.
- 3.2% - 17.1%
October Trailing 12 Mos.Detached Single-Family
- 5.8%Change in
New ListingsAll Properties
Change inClosed SalesAll Properties
Change in Inventory of Homes
All Properties
Change in Median Sales Price from Prior Year (6-Month Average)**
8007 - CHI - Lincoln Park
All MLSAll MLS
8007 - CHI - Lincoln Park
October Trailing 12 Mos.Attached Single-Family
- 30%
- 20%
- 10%
0%
+ 10%
+ 20%
+ 30%
+ 40%
1-2009 1-2010 1-2011 1-2012 1-2013 1-2014 1-2015
Detached Single-Familyb
a
- 25%
- 20%
- 15%
- 10%
- 5%
0%
+ 5%
+ 10%
+ 15%
+ 20%
+ 25%
1-2009 1-2010 1-2011 1-2012 1-2013 1-2014 1-2015
Attached Single-Familyb
a
Lincoln Park

15
*Each dot represents the change in median sales price from the prior year using a 6-month weighted average. This means that each of the 6 months used in a dot are proportioned according to their share of sales during that period. | All data from Midwest Real Estate Data LLC. Powered by 10K Research and Marketing.
A RESEARCH TOOL PROVIDED BY MIDWEST REAL ESTATE DATA LLC RESIDENTIAL ACTIVITY ONLY | Data current as of January 16, 2013
Local Market Update / October 2015
10-2014 10-2015 + / – 10-2014 10-2015 + / –
New Listings 16 30 + 87.5% 183 238 + 30.1%
Under Contract (includes Contingent and Pending) 9 7 - 22.2% 96 130 + 35.4%
Closed Sales 5 8 + 60.0% 99 132 + 33.3%
Median Sales Price* $685,000 $730,000 + 6.6% $630,000 $670,000 + 6.3%
Average Sales Price* $937,882 $672,513 - 28.3% $705,410 $733,466 + 4.0%
Percent of Original List Price Received* 99.3% 92.6% - 6.7% 96.7% 96.4% - 0.3%
Average Market Time 17 46 + 170.6% 46 65 + 41.3%
Inventory of Homes for Sale at Month End 44 42 - 4.5% -- -- --
10-2014 10-2015 + / – 10-2014 10-2015 + / –
New Listings 42 35 - 16.7% 624 603 - 3.4%
Under Contract (includes Contingent and Pending) 18 22 + 22.2% 309 341 + 10.4%
Closed Sales 23 24 + 4.3% 312 347 + 11.2%
Median Sales Price* $219,500 $238,250 + 8.5% $263,500 $262,500 - 0.4%
Average Sales Price* $250,978 $256,840 + 2.3% $269,088 $281,198 + 4.5%
Percent of Original List Price Received* 94.4% 94.6% + 0.2% 96.3% 95.1% - 1.2%
Average Market Time 57 48 - 15.8% 55 69 + 25.5%
Inventory of Homes for Sale at Month End 115 108 - 6.1% -- -- --* Does not account for seller concessions. | Activity for one month can sometimes look extreme due to small sample size.
+ 12.1% + 14.3%
October Trailing 12 Mos.Detached Single-Family
- 5.7%Change in
New ListingsAll Properties
Change inClosed SalesAll Properties
Change in Inventory of Homes
All Properties
Change in Median Sales Price from Prior Year (6-Month Average)**
8004 - CHI - Lincoln Square
All MLSAll MLS
8004 - CHI - Lincoln Square
October Trailing 12 Mos.Attached Single-Family
- 30%
- 20%
- 10%
0%
+ 10%
+ 20%
+ 30%
+ 40%
+ 50%
+ 60%
1-2009 1-2010 1-2011 1-2012 1-2013 1-2014 1-2015
Detached Single-Familyb
a
- 60%
- 40%
- 20%
0%
+ 20%
+ 40%
+ 60%
+ 80%
+ 100%
+ 120%
1-2009 1-2010 1-2011 1-2012 1-2013 1-2014 1-2015
Attached Single-Familyb
a
Lincoln Square

16
*Each dot represents the change in median sales price from the prior year using a 6-month weighted average. This means that each of the 6 months used in a dot are proportioned according to their share of sales during that period. | All data from Midwest Real Estate Data LLC. Powered by 10K Research and Marketing.
A RESEARCH TOOL PROVIDED BY MIDWEST REAL ESTATE DATA LLC RESIDENTIAL ACTIVITY ONLY | Data current as of January 16, 2013
Local Market Update / October 2015
10-2014 10-2015 + / – 10-2014 10-2015 + / –
New Listings 36 44 + 22.2% 430 493 + 14.7%
Under Contract (includes Contingent and Pending) 17 22 + 29.4% 265 272 + 2.6%
Closed Sales 20 30 + 50.0% 263 273 + 3.8%
Median Sales Price* $508,356 $587,450 + 15.6% $529,000 $645,000 + 21.9%
Average Sales Price* $615,301 $695,879 + 13.1% $637,874 $680,809 + 6.7%
Percent of Original List Price Received* 98.1% 98.6% + 0.5% 97.9% 98.8% + 0.9%
Average Market Time 62 62 0.0% 52 63 + 21.2%
Inventory of Homes for Sale at Month End 80 72 - 10.0% -- -- --
10-2014 10-2015 + / – 10-2014 10-2015 + / –
New Listings 56 68 + 21.4% 880 892 + 1.4%
Under Contract (includes Contingent and Pending) 43 43 0.0% 516 601 + 16.5%
Closed Sales 37 41 + 10.8% 498 593 + 19.1%
Median Sales Price* $309,900 $345,500 + 11.5% $322,250 $330,000 + 2.4%
Average Sales Price* $319,808 $421,004 + 31.6% $338,097 $358,778 + 6.1%
Percent of Original List Price Received* 95.1% 97.0% + 2.0% 96.8% 96.4% - 0.4%
Average Market Time 65 33 - 49.2% 60 56 - 6.7%
Inventory of Homes for Sale at Month End 140 105 - 25.0% -- -- --* Does not account for seller concessions. | Activity for one month can sometimes look extreme due to small sample size.
+ 21.7% + 24.6%
October Trailing 12 Mos.Detached Single-Family
- 19.5%Change in
New ListingsAll Properties
Change inClosed SalesAll Properties
Change in Inventory of Homes
All Properties
Change in Median Sales Price from Prior Year (6-Month Average)**
8022 - CHI - Logan Square
All MLSAll MLS
8022 - CHI - Logan Square
October Trailing 12 Mos.Attached Single-Family
- 60%
- 40%
- 20%
0%
+ 20%
+ 40%
+ 60%
+ 80%
1-2009 1-2010 1-2011 1-2012 1-2013 1-2014 1-2015
Detached Single-Familyb
a
- 30%
- 20%
- 10%
0%
+ 10%
+ 20%
+ 30%
+ 40%
1-2009 1-2010 1-2011 1-2012 1-2013 1-2014 1-2015
Attached Single-Familyb
a
Logan Square

17
*Each dot represents the change in median sales price from the prior year using a 6-month weighted average. This means that each of the 6 months used in a dot are proportioned according to their share of sales during that period. | All data from Midwest Real Estate Data LLC. Powered by 10K Research and Marketing.
A RESEARCH TOOL PROVIDED BY MIDWEST REAL ESTATE DATA LLC RESIDENTIAL ACTIVITY ONLY | Data current as of January 16, 2013
Local Market Update / October 2015
10-2014 10-2015 + / – 10-2014 10-2015 + / –
New Listings 0 0 -- 1 1 0.0%
Under Contract (includes Contingent and Pending) 0 0 -- 0 0 --
Closed Sales 0 0 -- 0 0 --
Median Sales Price* $0 $0 -- $0 $0 --
Average Sales Price* $0 $0 -- $0 $0 --
Percent of Original List Price Received* 0.0% 0.0% -- 0.0% 0.0% --
Average Market Time 0 0 -- 0 0 --
Inventory of Homes for Sale at Month End 0 0 -- -- -- --
10-2014 10-2015 + / – 10-2014 10-2015 + / –
New Listings 107 109 + 1.9% 1,372 1,432 + 4.4%
Under Contract (includes Contingent and Pending) 52 73 + 40.4% 781 840 + 7.6%
Closed Sales 55 78 + 41.8% 811 816 + 0.6%
Median Sales Price* $405,000 $365,000 - 9.9% $345,000 $345,250 + 0.1%
Average Sales Price* $534,860 $510,427 - 4.6% $484,645 $495,197 + 2.2%
Percent of Original List Price Received* 95.2% 96.5% + 1.4% 96.6% 96.1% - 0.5%
Average Market Time 126 87 - 31.0% 89 82 - 7.9%
Inventory of Homes for Sale at Month End 328 306 - 6.7% -- -- --* Does not account for seller concessions. | Activity for one month can sometimes look extreme due to small sample size.
+ 1.9% + 41.8%
October Trailing 12 Mos.Detached Single-Family
- 6.7%Change in
New ListingsAll Properties
Change inClosed SalesAll Properties
Change in Inventory of Homes
All Properties
Change in Median Sales Price from Prior Year (6-Month Average)**
8032 - CHI - Loop
All MLSAll MLS
8032 - CHI - Loop
October Trailing 12 Mos.Attached Single-Family
- 25%
- 20%
- 15%
- 10%
- 5%
0%
+ 5%
+ 10%
+ 15%
+ 20%
1-2009 1-2010 1-2011 1-2012 1-2013 1-2014 1-2015
Detached Single-Familyb
a
- 40%
- 30%
- 20%
- 10%
0%
+ 10%
+ 20%
+ 30%
1-2009 1-2010 1-2011 1-2012 1-2013 1-2014 1-2015
Attached Single-Familyb
a
Loop

18
*Each dot represents the change in median sales price from the prior year using a 6-month weighted average. This means that each of the 6 months used in a dot are proportioned according to their share of sales during that period. | All data from Midwest Real Estate Data LLC. Powered by 10K Research and Marketing.
A RESEARCH TOOL PROVIDED BY MIDWEST REAL ESTATE DATA LLC RESIDENTIAL ACTIVITY ONLY | Data current as of January 16, 2013
Local Market Update / October 2015
10-2014 10-2015 + / – 10-2014 10-2015 + / –
New Listings 19 8 - 57.9% 106 96 - 9.4%
Under Contract (includes Contingent and Pending) 1 3 + 200.0% 36 27 - 25.0%
Closed Sales 2 1 - 50.0% 39 26 - 33.3%
Median Sales Price* $2,384,500 $2,600,000 + 9.0% $2,175,000 $2,105,000 - 3.2%
Average Sales Price* $2,384,500 $2,600,000 + 9.0% $2,633,472 $2,229,808 - 15.3%
Percent of Original List Price Received* 85.1% 94.6% + 11.2% 92.0% 92.8% + 0.9%
Average Market Time 195 140 - 28.2% 232 195 - 15.9%
Inventory of Homes for Sale at Month End 41 48 + 17.1% -- -- --
10-2014 10-2015 + / – 10-2014 10-2015 + / –
New Listings 383 318 - 17.0% 4,700 4,905 + 4.4%
Under Contract (includes Contingent and Pending) 184 198 + 7.6% 2,541 2,815 + 10.8%
Closed Sales 206 222 + 7.8% 2,545 2,719 + 6.8%
Median Sales Price* $380,000 $378,500 - 0.4% $388,000 $398,000 + 2.6%
Average Sales Price* $559,032 $512,841 - 8.3% $557,952 $561,942 + 0.7%
Percent of Original List Price Received* 95.6% 96.4% + 0.8% 96.1% 96.1% 0.0%
Average Market Time 84 79 - 6.0% 80 86 + 7.5%
Inventory of Homes for Sale at Month End 1,101 1,013 - 8.0% -- -- --* Does not account for seller concessions. | Activity for one month can sometimes look extreme due to small sample size.
- 18.9% + 7.2%
October Trailing 12 Mos.Detached Single-Family
- 7.1%Change in
New ListingsAll Properties
Change inClosed SalesAll Properties
Change in Inventory of Homes
All Properties
Change in Median Sales Price from Prior Year (6-Month Average)**
8008 - CHI - Near North Side
All MLSAll MLS
8008 - CHI - Near North Side
October Trailing 12 Mos.Attached Single-Family
- 100%
- 50%
0%
+ 50%
+ 100%
+ 150%
+ 200%
1-2009 1-2010 1-2011 1-2012 1-2013 1-2014 1-2015
Detached Single-Familyb
a
- 30%
- 20%
- 10%
0%
+ 10%
+ 20%
+ 30%
1-2009 1-2010 1-2011 1-2012 1-2013 1-2014 1-2015
Attached Single-Familyb
a
Near North Side

19
*Each dot represents the change in median sales price from the prior year using a 6-month weighted average. This means that each of the 6 months used in a dot are proportioned according to their share of sales during that period. | All data from Midwest Real Estate Data LLC. Powered by 10K Research and Marketing.
A RESEARCH TOOL PROVIDED BY MIDWEST REAL ESTATE DATA LLC RESIDENTIAL ACTIVITY ONLY | Data current as of January 16, 2013
Local Market Update / October 2015
10-2014 10-2015 + / – 10-2014 10-2015 + / –
New Listings 1 1 0.0% 12 5 - 58.3%
Under Contract (includes Contingent and Pending) 1 1 0.0% 9 2 - 77.8%
Closed Sales 1 1 0.0% 8 3 - 62.5%
Median Sales Price* $867,000 $1,200,000 + 38.4% $950,000 $1,620,000 + 70.5%
Average Sales Price* $867,000 $1,200,000 + 38.4% $1,056,000 $1,573,333 + 49.0%
Percent of Original List Price Received* 96.4% 80.0% - 17.0% 93.0% 85.3% - 8.3%
Average Market Time 38 169 + 344.7% 50 108 + 116.0%
Inventory of Homes for Sale at Month End 1 2 + 100.0% -- -- --
10-2014 10-2015 + / – 10-2014 10-2015 + / –
New Listings 73 90 + 23.3% 1,309 1,407 + 7.5%
Under Contract (includes Contingent and Pending) 66 53 - 19.7% 792 866 + 9.3%
Closed Sales 62 59 - 4.8% 795 873 + 9.8%
Median Sales Price* $358,000 $327,500 - 8.5% $373,000 $362,400 - 2.8%
Average Sales Price* $408,611 $383,530 - 6.1% $434,727 $437,924 + 0.7%
Percent of Original List Price Received* 97.0% 98.7% + 1.8% 98.6% 99.5% + 0.9%
Average Market Time 73 79 + 8.2% 63 62 - 1.6%
Inventory of Homes for Sale at Month End 205 215 + 4.9% -- -- --* Does not account for seller concessions. | Activity for one month can sometimes look extreme due to small sample size.
+ 23.0% - 4.8%
October Trailing 12 Mos.Detached Single-Family
+ 5.3%Change in
New ListingsAll Properties
Change inClosed SalesAll Properties
Change in Inventory of Homes
All Properties
Change in Median Sales Price from Prior Year (6-Month Average)**
8033 - CHI - Near South Side
All MLSAll MLS
8033 - CHI - Near South Side
October Trailing 12 Mos.Attached Single-Family
- 70%
- 60%
- 50%
- 40%
- 30%
- 20%
- 10%
0%
+ 10%
+ 20%
+ 30%
+ 40%
1-2009 1-2010 1-2011 1-2012 1-2013 1-2014 1-2015
Detached Single-Familyb
a
- 30%
- 20%
- 10%
0%
+ 10%
+ 20%
+ 30%
+ 40%
+ 50%
1-2009 1-2010 1-2011 1-2012 1-2013 1-2014 1-2015
Attached Single-Familyb
a
Near South Side

20
*Each dot represents the change in median sales price from the prior year using a 6-month weighted average. This means that each of the 6 months used in a dot are proportioned according to their share of sales during that period. | All data from Midwest Real Estate Data LLC. Powered by 10K Research and Marketing.
A RESEARCH TOOL PROVIDED BY MIDWEST REAL ESTATE DATA LLC RESIDENTIAL ACTIVITY ONLY | Data current as of January 16, 2013
Local Market Update / October 2015
10-2014 10-2015 + / – 10-2014 10-2015 + / –
New Listings 10 7 - 30.0% 57 98 + 71.9%
Under Contract (includes Contingent and Pending) 4 6 + 50.0% 23 47 + 104.3%
Closed Sales 1 6 + 500.0% 24 42 + 75.0%
Median Sales Price* $1,325,000 $405,650 - 69.4% $354,000 $374,500 + 5.8%
Average Sales Price* $1,325,000 $614,133 - 53.7% $541,844 $450,454 - 16.9%
Percent of Original List Price Received* 68.0% 94.0% + 38.2% 98.3% 96.1% - 2.2%
Average Market Time 120 25 - 79.2% 69 97 + 40.6%
Inventory of Homes for Sale at Month End 19 18 - 5.3% -- -- --
10-2014 10-2015 + / – 10-2014 10-2015 + / –
New Listings 107 93 - 13.1% 1,546 1,543 - 0.2%
Under Contract (includes Contingent and Pending) 66 82 + 24.2% 1,040 1,135 + 9.1%
Closed Sales 82 75 - 8.5% 1,095 1,152 + 5.2%
Median Sales Price* $350,000 $330,000 - 5.7% $310,000 $327,500 + 5.6%
Average Sales Price* $416,336 $357,357 - 14.2% $351,297 $382,860 + 9.0%
Percent of Original List Price Received* 99.2% 98.3% - 0.9% 98.6% 98.7% + 0.1%
Average Market Time 63 46 - 27.0% 58 51 - 12.1%
Inventory of Homes for Sale at Month End 246 172 - 30.1% -- -- --* Does not account for seller concessions. | Activity for one month can sometimes look extreme due to small sample size.
- 14.5% - 2.4%
October Trailing 12 Mos.Detached Single-Family
- 28.3%Change in
New ListingsAll Properties
Change inClosed SalesAll Properties
Change in Inventory of Homes
All Properties
Change in Median Sales Price from Prior Year (6-Month Average)**
8028 - CHI - Near West Side
All MLSAll MLS
8028 - CHI - Near West Side
October Trailing 12 Mos.Attached Single-Family
- 100%
- 50%
0%
+ 50%
+ 100%
+ 150%
+ 200%
+ 250%
+ 300%
+ 350%
+ 400%
+ 450%
1-2009 1-2010 1-2011 1-2012 1-2013 1-2014 1-2015
Detached Single-Familyb
a
- 30%
- 20%
- 10%
0%
+ 10%
+ 20%
+ 30%
1-2009 1-2010 1-2011 1-2012 1-2013 1-2014 1-2015
Attached Single-Familyb
a
Near West Side
21
*Each dot represents the change in median sales price from the prior year using a 6-month weighted average. This means that each of the 6 months used in a dot are proportioned according to their share of sales during that period. | All data from Midwest Real Estate Data LLC. Powered by 10K Research and Marketing.
A RESEARCH TOOL PROVIDED BY MIDWEST REAL ESTATE DATA LLC RESIDENTIAL ACTIVITY ONLY | Data current as of January 16, 2013
Local Market Update / October 2015
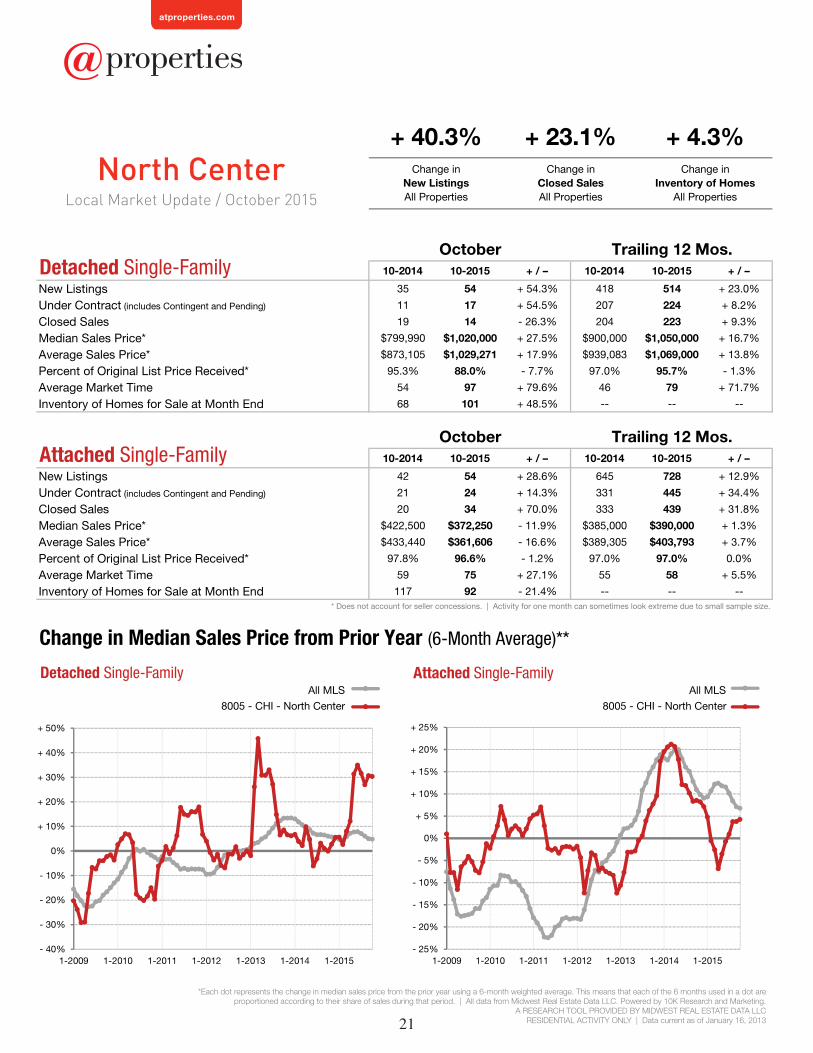
10-2014 10-2015 + / – 10-2014 10-2015 + / –
New Listings 35 54 + 54.3% 418 514 + 23.0%
Under Contract (includes Contingent and Pending) 11 17 + 54.5% 207 224 + 8.2%
Closed Sales 19 14 - 26.3% 204 223 + 9.3%
Median Sales Price* $799,990 $1,020,000 + 27.5% $900,000 $1,050,000 + 16.7%
Average Sales Price* $873,105 $1,029,271 + 17.9% $939,083 $1,069,000 + 13.8%
Percent of Original List Price Received* 95.3% 88.0% - 7.7% 97.0% 95.7% - 1.3%
Average Market Time 54 97 + 79.6% 46 79 + 71.7%
Inventory of Homes for Sale at Month End 68 101 + 48.5% -- -- --
10-2014 10-2015 + / – 10-2014 10-2015 + / –
New Listings 42 54 + 28.6% 645 728 + 12.9%
Under Contract (includes Contingent and Pending) 21 24 + 14.3% 331 445 + 34.4%
Closed Sales 20 34 + 70.0% 333 439 + 31.8%
Median Sales Price* $422,500 $372,250 - 11.9% $385,000 $390,000 + 1.3%
Average Sales Price* $433,440 $361,606 - 16.6% $389,305 $403,793 + 3.7%
Percent of Original List Price Received* 97.8% 96.6% - 1.2% 97.0% 97.0% 0.0%
Average Market Time 59 75 + 27.1% 55 58 + 5.5%
Inventory of Homes for Sale at Month End 117 92 - 21.4% -- -- --* Does not account for seller concessions. | Activity for one month can sometimes look extreme due to small sample size.
+ 40.3% + 23.1%
October Trailing 12 Mos.Detached Single-Family
+ 4.3%Change in
New ListingsAll Properties
Change inClosed SalesAll Properties
Change in Inventory of Homes
All Properties
Change in Median Sales Price from Prior Year (6-Month Average)**
8005 - CHI - North Center
All MLSAll MLS
8005 - CHI - North Center
October Trailing 12 Mos.Attached Single-Family
- 40%
- 30%
- 20%
- 10%
0%
+ 10%
+ 20%
+ 30%
+ 40%
+ 50%
1-2009 1-2010 1-2011 1-2012 1-2013 1-2014 1-2015
Detached Single-Familyb
a
- 25%
- 20%
- 15%
- 10%
- 5%
0%
+ 5%
+ 10%
+ 15%
+ 20%
+ 25%
1-2009 1-2010 1-2011 1-2012 1-2013 1-2014 1-2015
Attached Single-Familyb
a
North Center
22
*Each dot represents the change in median sales price from the prior year using a 6-month weighted average. This means that each of the 6 months used in a dot are proportioned according to their share of sales during that period. | All data from Midwest Real Estate Data LLC. Powered by 10K Research and Marketing.
A RESEARCH TOOL PROVIDED BY MIDWEST REAL ESTATE DATA LLC RESIDENTIAL ACTIVITY ONLY | Data current as of January 16, 2013
Local Market Update / October 2015
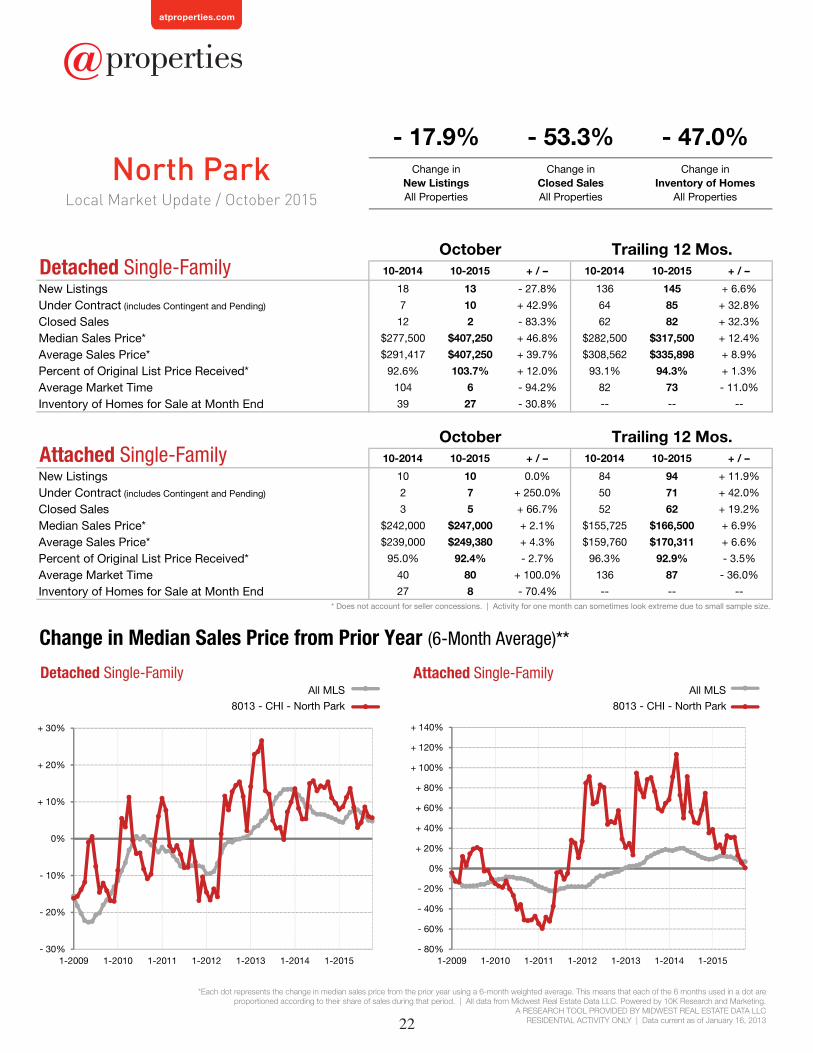
North Park
10-2014 10-2015 + / – 10-2014 10-2015 + / –
New Listings 18 13 - 27.8% 136 145 + 6.6%
Under Contract (includes Contingent and Pending) 7 10 + 42.9% 64 85 + 32.8%
Closed Sales 12 2 - 83.3% 62 82 + 32.3%
Median Sales Price* $277,500 $407,250 + 46.8% $282,500 $317,500 + 12.4%
Average Sales Price* $291,417 $407,250 + 39.7% $308,562 $335,898 + 8.9%
Percent of Original List Price Received* 92.6% 103.7% + 12.0% 93.1% 94.3% + 1.3%
Average Market Time 104 6 - 94.2% 82 73 - 11.0%
Inventory of Homes for Sale at Month End 39 27 - 30.8% -- -- --
10-2014 10-2015 + / – 10-2014 10-2015 + / –
New Listings 10 10 0.0% 84 94 + 11.9%
Under Contract (includes Contingent and Pending) 2 7 + 250.0% 50 71 + 42.0%
Closed Sales 3 5 + 66.7% 52 62 + 19.2%
Median Sales Price* $242,000 $247,000 + 2.1% $155,725 $166,500 + 6.9%
Average Sales Price* $239,000 $249,380 + 4.3% $159,760 $170,311 + 6.6%
Percent of Original List Price Received* 95.0% 92.4% - 2.7% 96.3% 92.9% - 3.5%
Average Market Time 40 80 + 100.0% 136 87 - 36.0%
Inventory of Homes for Sale at Month End 27 8 - 70.4% -- -- --* Does not account for seller concessions. | Activity for one month can sometimes look extreme due to small sample size.
- 17.9% - 53.3%
October Trailing 12 Mos.Detached Single-Family
- 47.0%Change in
New ListingsAll Properties
Change inClosed SalesAll Properties
Change in Inventory of Homes
All Properties
Change in Median Sales Price from Prior Year (6-Month Average)**
8013 - CHI - North Park
All MLSAll MLS
8013 - CHI - North Park
October Trailing 12 Mos.Attached Single-Family
- 30%
- 20%
- 10%
0%
+ 10%
+ 20%
+ 30%
1-2009 1-2010 1-2011 1-2012 1-2013 1-2014 1-2015
Detached Single-Familyb
a
- 80%
- 60%
- 40%
- 20%
0%
+ 20%
+ 40%
+ 60%
+ 80%
+ 100%
+ 120%
+ 140%
1-2009 1-2010 1-2011 1-2012 1-2013 1-2014 1-2015
Attached Single-Familyb
a

23
*Each dot represents the change in median sales price from the prior year using a 6-month weighted average. This means that each of the 6 months used in a dot are proportioned according to their share of sales during that period. | All data from Midwest Real Estate Data LLC. Powered by 10K Research and Marketing.
A RESEARCH TOOL PROVIDED BY MIDWEST REAL ESTATE DATA LLC RESIDENTIAL ACTIVITY ONLY | Data current as of January 16, 2013
Local Market Update / October 2015
Norwood Park
10-2014 10-2015 + / – 10-2014 10-2015 + / –
New Listings 55 60 + 9.1% 706 777 + 10.1%
Under Contract (includes Contingent and Pending) 33 40 + 21.2% 385 415 + 7.8%
Closed Sales 33 29 - 12.1% 373 410 + 9.9%
Median Sales Price* $270,000 $280,000 + 3.7% $292,500 $285,000 - 2.6%
Average Sales Price* $304,076 $289,595 - 4.8% $313,868 $309,577 - 1.4%
Percent of Original List Price Received* 92.8% 89.9% - 3.1% 95.4% 94.3% - 1.2%
Average Market Time 68 60 - 11.8% 72 85 + 18.1%
Inventory of Homes for Sale at Month End 138 126 - 8.7% -- -- --
10-2014 10-2015 + / – 10-2014 10-2015 + / –
New Listings 13 11 - 15.4% 127 160 + 26.0%
Under Contract (includes Contingent and Pending) 4 8 + 100.0% 77 90 + 16.9%
Closed Sales 8 9 + 12.5% 88 91 + 3.4%
Median Sales Price* $102,501 $148,000 + 44.4% $108,250 $125,000 + 15.5%
Average Sales Price* $120,938 $159,919 + 32.2% $118,170 $138,671 + 17.3%
Percent of Original List Price Received* 93.0% 91.5% - 1.6% 95.0% 94.5% - 0.5%
Average Market Time 48 84 + 75.0% 61 74 + 21.3%
Inventory of Homes for Sale at Month End 27 24 - 11.1% -- -- --* Does not account for seller concessions. | Activity for one month can sometimes look extreme due to small sample size.
+ 4.4% - 7.3%
October Trailing 12 Mos.Detached Single-Family
- 9.1%Change in
New ListingsAll Properties
Change inClosed SalesAll Properties
Change in Inventory of Homes
All Properties
Change in Median Sales Price from Prior Year (6-Month Average)**
8010 - CHI - Norwood Park
All MLSAll MLS
8010 - CHI - Norwood Park
October Trailing 12 Mos.Attached Single-Family
- 30%
- 20%
- 10%
0%
+ 10%
+ 20%
+ 30%
+ 40%
1-2009 1-2010 1-2011 1-2012 1-2013 1-2014 1-2015
Detached Single-Familyb
a
- 50%
- 40%
- 30%
- 20%
- 10%
0%
+ 10%
+ 20%
+ 30%
+ 40%
+ 50%
+ 60%
1-2009 1-2010 1-2011 1-2012 1-2013 1-2014 1-2015
Attached Single-Familyb
a

24
*Each dot represents the change in median sales price from the prior year using a 6-month weighted average. This means that each of the 6 months used in a dot are proportioned according to their share of sales during that period. | All data from Midwest Real Estate Data LLC. Powered by 10K Research and Marketing.
A RESEARCH TOOL PROVIDED BY MIDWEST REAL ESTATE DATA LLC RESIDENTIAL ACTIVITY ONLY | Data current as of January 16, 2013
Local Market Update / October 2015
Portage Park
10-2014 10-2015 + / – 10-2014 10-2015 + / –
New Listings 66 79 + 19.7% 675 793 + 17.5%
Under Contract (includes Contingent and Pending) 38 33 - 13.2% 383 421 + 9.9%
Closed Sales 35 32 - 8.6% 390 415 + 6.4%
Median Sales Price* $239,700 $238,000 - 0.7% $239,000 $254,000 + 6.3%
Average Sales Price* $250,669 $250,694 + 0.0% $258,214 $274,621 + 6.4%
Percent of Original List Price Received* 94.6% 93.2% - 1.5% 95.7% 94.2% - 1.6%
Average Market Time 98 80 - 18.4% 70 81 + 15.7%
Inventory of Homes for Sale at Month End 151 155 + 2.6% -- -- --
10-2014 10-2015 + / – 10-2014 10-2015 + / –
New Listings 10 14 + 40.0% 133 158 + 18.8%
Under Contract (includes Contingent and Pending) 6 8 + 33.3% 102 81 - 20.6%
Closed Sales 6 9 + 50.0% 111 76 - 31.5%
Median Sales Price* $64,750 $124,000 + 91.5% $90,000 $124,500 + 38.3%
Average Sales Price* $101,650 $205,611 + 102.3% $108,373 $164,887 + 52.1%
Percent of Original List Price Received* 85.8% 95.4% + 11.2% 96.0% 93.6% - 2.5%
Average Market Time 66 26 - 60.6% 127 68 - 46.5%
Inventory of Homes for Sale at Month End 20 36 + 80.0% -- -- --* Does not account for seller concessions. | Activity for one month can sometimes look extreme due to small sample size.
+ 22.4% 0.0%
October Trailing 12 Mos.Detached Single-Family
+ 11.7%Change in
New ListingsAll Properties
Change inClosed SalesAll Properties
Change in Inventory of Homes
All Properties
Change in Median Sales Price from Prior Year (6-Month Average)**
8015 - CHI - Portage Park
All MLSAll MLS
8015 - CHI - Portage Park
October Trailing 12 Mos.Attached Single-Family
- 30%
- 20%
- 10%
0%
+ 10%
+ 20%
+ 30%
1-2009 1-2010 1-2011 1-2012 1-2013 1-2014 1-2015
Detached Single-Familyb
a
- 80%
- 60%
- 40%
- 20%
0%
+ 20%
+ 40%
+ 60%
+ 80%
+ 100%
+ 120%
1-2009 1-2010 1-2011 1-2012 1-2013 1-2014 1-2015
Attached Single-Familyb
a

25
*Each dot represents the change in median sales price from the prior year using a 6-month weighted average. This means that each of the 6 months used in a dot are proportioned according to their share of sales during that period. | All data from Midwest Real Estate Data LLC. Powered by 10K Research and Marketing.
A RESEARCH TOOL PROVIDED BY MIDWEST REAL ESTATE DATA LLC RESIDENTIAL ACTIVITY ONLY | Data current as of January 16, 2013
Local Market Update / October 2015
10-2014 10-2015 + / – 10-2014 10-2015 + / –
New Listings 7 10 + 42.9% 63 82 + 30.2%
Under Contract (includes Contingent and Pending) 3 7 + 133.3% 43 38 - 11.6%
Closed Sales 5 1 - 80.0% 43 34 - 20.9%
Median Sales Price* $540,000 $559,500 + 3.6% $410,000 $342,500 - 16.5%
Average Sales Price* $509,400 $559,500 + 9.8% $414,308 $387,026 - 6.6%
Percent of Original List Price Received* 96.2% 97.5% + 1.4% 93.3% 94.6% + 1.4%
Average Market Time 102 114 + 11.8% 75 76 + 1.3%
Inventory of Homes for Sale at Month End 11 19 + 72.7% -- -- --
10-2014 10-2015 + / – 10-2014 10-2015 + / –
New Listings 42 59 + 40.5% 679 763 + 12.4%
Under Contract (includes Contingent and Pending) 24 39 + 62.5% 418 419 + 0.2%
Closed Sales 32 32 0.0% 436 398 - 8.7%
Median Sales Price* $117,500 $123,500 + 5.1% $104,525 $153,570 + 46.9%
Average Sales Price* $130,642 $147,727 + 13.1% $129,637 $162,738 + 25.5%
Percent of Original List Price Received* 95.3% 91.3% - 4.2% 95.4% 93.6% - 1.9%
Average Market Time 69 145 + 110.1% 85 98 + 15.3%
Inventory of Homes for Sale at Month End 154 156 + 1.3% -- -- --* Does not account for seller concessions. | Activity for one month can sometimes look extreme due to small sample size.
+ 40.8% - 10.8%
October Trailing 12 Mos.Detached Single-Family
+ 6.1%Change in
New ListingsAll Properties
Change inClosed SalesAll Properties
Change in Inventory of Homes
All Properties
Change in Median Sales Price from Prior Year (6-Month Average)**
8001 - CHI - Rogers Park
All MLSAll MLS
8001 - CHI - Rogers Park
October Trailing 12 Mos.Attached Single-Family
- 60%
- 40%
- 20%
0%
+ 20%
+ 40%
+ 60%
+ 80%
+ 100%
+ 120%
+ 140%
1-2009 1-2010 1-2011 1-2012 1-2013 1-2014 1-2015
Detached Single-Familyb
a
- 80%
- 60%
- 40%
- 20%
0%
+ 20%
+ 40%
+ 60%
+ 80%
1-2009 1-2010 1-2011 1-2012 1-2013 1-2014 1-2015
Attached Single-Familyb
a
Rogers Park

26
*Each dot represents the change in median sales price from the prior year using a 6-month weighted average. This means that each of the 6 months used in a dot are proportioned according to their share of sales during that period. | All data from Midwest Real Estate Data LLC. Powered by 10K Research and Marketing.
A RESEARCH TOOL PROVIDED BY MIDWEST REAL ESTATE DATA LLC RESIDENTIAL ACTIVITY ONLY | Data current as of January 16, 2013
Local Market Update / October 2015
10-2014 10-2015 + / – 10-2014 10-2015 + / –
New Listings 23 26 + 13.0% 290 266 - 8.3%
Under Contract (includes Contingent and Pending) 16 17 + 6.3% 119 131 + 10.1%
Closed Sales 10 11 + 10.0% 110 124 + 12.7%
Median Sales Price* $91,000 $59,900 - 34.2% $70,000 $91,200 + 30.3%
Average Sales Price* $111,110 $102,100 - 8.1% $137,289 $123,596 - 10.0%
Percent of Original List Price Received* 88.8% 87.5% - 1.5% 93.0% 86.7% - 6.8%
Average Market Time 271 75 - 72.3% 144 120 - 16.7%
Inventory of Homes for Sale at Month End 90 64 - 28.9% -- -- --
10-2014 10-2015 + / – 10-2014 10-2015 + / –
New Listings 14 21 + 50.0% 267 241 - 9.7%
Under Contract (includes Contingent and Pending) 12 15 + 25.0% 144 144 0.0%
Closed Sales 17 12 - 29.4% 147 136 - 7.5%
Median Sales Price* $27,500 $41,000 + 49.1% $26,000 $29,950 + 15.2%
Average Sales Price* $37,306 $47,730 + 27.9% $34,645 $39,103 + 12.9%
Percent of Original List Price Received* 78.0% 81.3% + 4.2% 82.9% 93.0% + 12.2%
Average Market Time 80 113 + 41.3% 134 134 0.0%
Inventory of Homes for Sale at Month End 89 68 - 23.6% -- -- --* Does not account for seller concessions. | Activity for one month can sometimes look extreme due to small sample size.
+ 27.0% - 14.8%
October Trailing 12 Mos.Detached Single-Family
- 26.3%Change in
New ListingsAll Properties
Change inClosed SalesAll Properties
Change in Inventory of Homes
All Properties
Change in Median Sales Price from Prior Year (6-Month Average)**
8043 - CHI - South Shore
All MLSAll MLS
8043 - CHI - South Shore
October Trailing 12 Mos.Attached Single-Family
- 100%
- 50%
0%
+ 50%
+ 100%
+ 150%
+ 200%
1-2009 1-2010 1-2011 1-2012 1-2013 1-2014 1-2015
Detached Single-Familyb
a
- 80%
- 60%
- 40%
- 20%
0%
+ 20%
+ 40%
+ 60%
1-2009 1-2010 1-2011 1-2012 1-2013 1-2014 1-2015
Attached Single-Familyb
a
South Shore

27
*Each dot represents the change in median sales price from the prior year using a 6-month weighted average. This means that each of the 6 months used in a dot are proportioned according to their share of sales during that period. | All data from Midwest Real Estate Data LLC. Powered by 10K Research and Marketing.
A RESEARCH TOOL PROVIDED BY MIDWEST REAL ESTATE DATA LLC RESIDENTIAL ACTIVITY ONLY | Data current as of January 16, 2013
Local Market Update / October 2015
10-2014 10-2015 + / – 10-2014 10-2015 + / –
New Listings 2 7 + 250.0% 64 82 + 28.1%
Under Contract (includes Contingent and Pending) 3 4 + 33.3% 32 29 - 9.4%
Closed Sales 5 3 - 40.0% 36 27 - 25.0%
Median Sales Price* $876,000 $920,000 + 5.0% $810,000 $709,000 - 12.5%
Average Sales Price* $830,320 $901,667 + 8.6% $877,375 $804,986 - 8.3%
Percent of Original List Price Received* 97.7% 89.6% - 8.3% 98.4% 93.5% - 5.0%
Average Market Time 86 69 - 19.8% 83 74 - 10.8%
Inventory of Homes for Sale at Month End 13 21 + 61.5% -- -- --
10-2014 10-2015 + / – 10-2014 10-2015 + / –
New Listings 103 83 - 19.4% 1,476 1,446 - 2.0%
Under Contract (includes Contingent and Pending) 48 41 - 14.6% 732 810 + 10.7%
Closed Sales 56 50 - 10.7% 754 795 + 5.4%
Median Sales Price* $198,000 $217,500 + 9.8% $228,000 $230,000 + 0.9%
Average Sales Price* $235,979 $228,064 - 3.4% $237,524 $237,332 - 0.1%
Percent of Original List Price Received* 92.7% 95.1% + 2.6% 95.0% 94.2% - 0.8%
Average Market Time 89 78 - 12.4% 82 97 + 18.3%
Inventory of Homes for Sale at Month End 343 246 - 28.3% -- -- --* Does not account for seller concessions. | Activity for one month can sometimes look extreme due to small sample size.
- 14.3% - 13.1%
October Trailing 12 Mos.Detached Single-Family
- 25.0%Change in
New ListingsAll Properties
Change inClosed SalesAll Properties
Change in Inventory of Homes
All Properties
Change in Median Sales Price from Prior Year (6-Month Average)**
8003 - CHI - Uptown
All MLSAll MLS
8003 - CHI - Uptown
October Trailing 12 Mos.Attached Single-Family
- 60%
- 40%
- 20%
0%
+ 20%
+ 40%
+ 60%
+ 80%
+ 100%
1-2009 1-2010 1-2011 1-2012 1-2013 1-2014 1-2015
Detached Single-Familyb
a
- 50%
- 40%
- 30%
- 20%
- 10%
0%
+ 10%
+ 20%
+ 30%
+ 40%
1-2009 1-2010 1-2011 1-2012 1-2013 1-2014 1-2015
Attached Single-Familyb
a
Uptown
28
*Each dot represents the change in median sales price from the prior year using a 6-month weighted average. This means that each of the 6 months used in a dot are proportioned according to their share of sales during that period. | All data from Midwest Real Estate Data LLC. Powered by 10K Research and Marketing.
A RESEARCH TOOL PROVIDED BY MIDWEST REAL ESTATE DATA LLC RESIDENTIAL ACTIVITY ONLY | Data current as of January 16, 2013
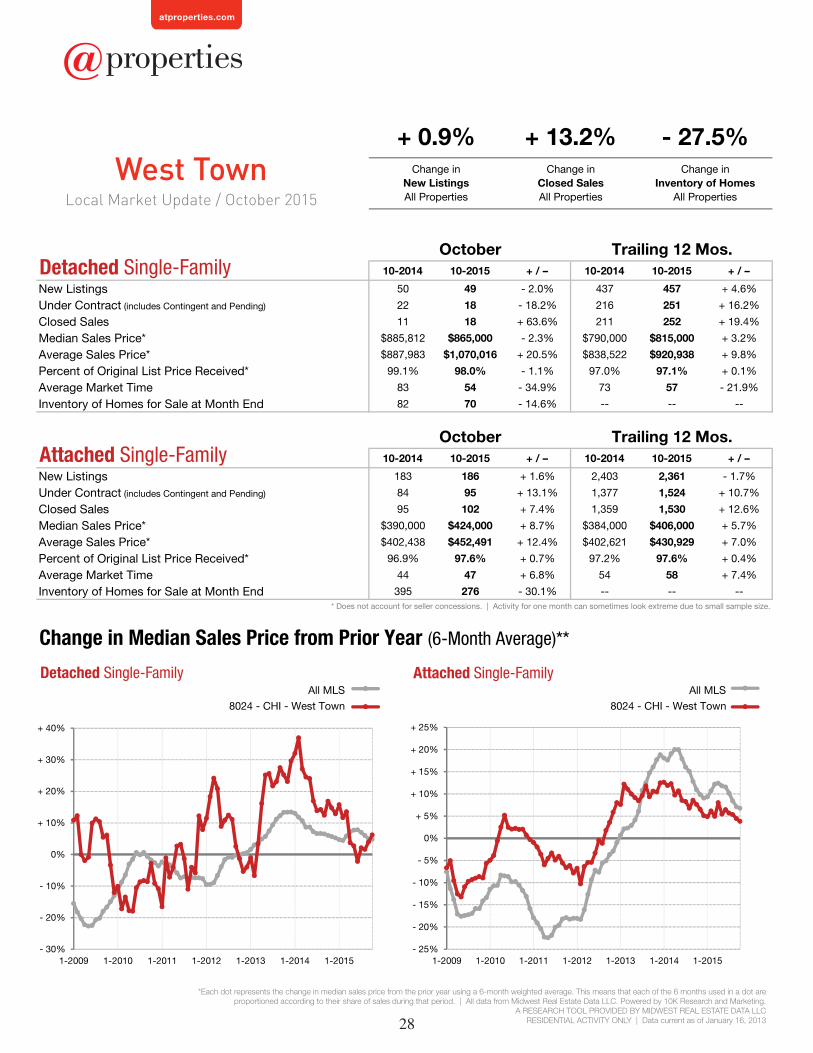
Local Market Update / October 2015
10-2014 10-2015 + / – 10-2014 10-2015 + / –
New Listings 50 49 - 2.0% 437 457 + 4.6%
Under Contract (includes Contingent and Pending) 22 18 - 18.2% 216 251 + 16.2%
Closed Sales 11 18 + 63.6% 211 252 + 19.4%
Median Sales Price* $885,812 $865,000 - 2.3% $790,000 $815,000 + 3.2%
Average Sales Price* $887,983 $1,070,016 + 20.5% $838,522 $920,938 + 9.8%
Percent of Original List Price Received* 99.1% 98.0% - 1.1% 97.0% 97.1% + 0.1%
Average Market Time 83 54 - 34.9% 73 57 - 21.9%
Inventory of Homes for Sale at Month End 82 70 - 14.6% -- -- --
10-2014 10-2015 + / – 10-2014 10-2015 + / –
New Listings 183 186 + 1.6% 2,403 2,361 - 1.7%
Under Contract (includes Contingent and Pending) 84 95 + 13.1% 1,377 1,524 + 10.7%
Closed Sales 95 102 + 7.4% 1,359 1,530 + 12.6%
Median Sales Price* $390,000 $424,000 + 8.7% $384,000 $406,000 + 5.7%
Average Sales Price* $402,438 $452,491 + 12.4% $402,621 $430,929 + 7.0%
Percent of Original List Price Received* 96.9% 97.6% + 0.7% 97.2% 97.6% + 0.4%
Average Market Time 44 47 + 6.8% 54 58 + 7.4%
Inventory of Homes for Sale at Month End 395 276 - 30.1% -- -- --* Does not account for seller concessions. | Activity for one month can sometimes look extreme due to small sample size.
+ 0.9% + 13.2%
October Trailing 12 Mos.Detached Single-Family
- 27.5%Change in
New ListingsAll Properties
Change inClosed SalesAll Properties
Change in Inventory of Homes
All Properties
Change in Median Sales Price from Prior Year (6-Month Average)**
8024 - CHI - West Town
All MLSAll MLS
8024 - CHI - West Town
October Trailing 12 Mos.Attached Single-Family
- 30%
- 20%
- 10%
0%
+ 10%
+ 20%
+ 30%
+ 40%
1-2009 1-2010 1-2011 1-2012 1-2013 1-2014 1-2015
Detached Single-Familyb
a
- 25%
- 20%
- 15%
- 10%
- 5%
0%
+ 5%
+ 10%
+ 15%
+ 20%
+ 25%
1-2009 1-2010 1-2011 1-2012 1-2013 1-2014 1-2015
Attached Single-Familyb
a
West Town