Embed Size (px)
Citation preview
Chief Joseph Kokanee Enhancement Project
Strobe Light Deterrent Efficacy Test and Fish BehaviorDetermination at Grand Coulee Dam Third Powerplant Forebay
Annual Report 2005 - 2006 March 2006 DOE/BP-00000652-33
This Document should be cited as follows:
Simmons, M., Robert Johnson, C. McKinstry, C. Simmons, C. Cook, S. Thorsten, Bret Nine,Richard LeCaire, S. Francis, "Chief Joseph Kokanee Enhancement Project; Strobe LightDeterrent Efficacy Test and Fish Behavior Determination at Grand Coulee Dam ThirdPowerplant Forebay", 2005-2006 Annual Report, Project No. 199501100, 69 electronic pages,(BPA Report DOE/BP-00000652-33)
Bonneville Power AdministrationP.O. Box 3621Portland, OR 97208
This report was funded by the Bonneville Power Administration (BPA),U.S. Department of Energy, as part of BPA's program to protect, mitigate,and enhance fish and wildlife affected by the development and operationof hydroelectric facilities on the Columbia River and its tributaries. Theviews in this report are the author's and do not necessarily represent theviews of BPA.

Chief Joseph Kokanee Enhancement Project: Strobe Light Deterrent Efficacy Test and Fish Behavior Determination at
Grand Coulee Dam Third Powerplant Forebay
Annual Report
2005–2006
Prepared by
Mary Ann Simmons, Robert L. Johnson, Craig A. McKinstry, C. Stephen Simmons, Christopher B. Cook, and Susan L. Thorsten
Pacific Northwest National Laboratory
Richland, Washington
Bret D. Nine
Consulting Services Airway Heights, Washington
Richard LeCaire and Stephen Francis
Confederated Tribes of the Colville Reservation Nespelem, Washington
Prepared for
U.S. Department of Energy Bonneville Power Administration
Division of Fish and Wildlife Portland, Oregon
Project No. 1995-011-00 Contract No. 00000652-00015
March 2006

Strobe Light Deterrent Efficacy Test 2005 Final Report
iii
Summary
The construction of Grand Coulee and Chief Joseph dams on the Columbia River resulted in the complete extirpation of the anadromous fishery upstream of these structures. Today, this area is totally dependent upon resident fish resources to support local fisheries. The resident fishing is enhanced by an extensive stocking program for target species in the existing fishery, including kokanee (Oncorhynchus nerka kennerlyi) and rainbow trout (O. mykiss). The kokanee fishery in Lake Roosevelt has not been meeting the return goals set by fisheries managers despite the stocking program. Investigations of physical and biological factors that could affect the kokanee population found predation and entrainment had a significant impact on the fish population. In 1999 and 2000, walleye (Sander vitreum) consumed between 15% and 9%, respectively, of the hatchery kokanee within 41 days of their release, while results from a study in the late 1990s estimated that entrainment at Grand Coulee Dam could account for up to 30% of the total mortality of the stocked fish.
To address the entrainment loss, the Bonneville Power Administration commissioned a study to determine if fish would avoid areas illuminated by strobe lights in the forebay of the third powerplant. This work was conducted by Pacific Northwest National Laboratory (PNNL) in conjunction with the Confederated Tribes of the Colville Reservation (Colville Confederated Tribes).
From 2002 through 2004, six strobe lights were suspended in the center of the opening to the third powerplant forebay during summer months. Results from those studies indicated that fish appeared to be attracted to the illuminated area but only at night and when flow conditions within the third powerplant forebay were minimal. However, small but consistent results from these studies indicated that under high flow conditions, fish might be avoiding the lights. The 2005 study was designed to examine whether, under high flow conditions near the penstock openings, fish would avoid the lighted regions. Four omni-directional strobe lights were deployed on the one trash rack directly in front of one turbine penstock. Seven splitbeam transducers were deployed to monitor fish approaching three penstock openings either from in front of the trash racks or moving down the dam behind the trash racks.
Four key results emerged from the 2005 study. The results provide insight into the current level of entrainment and how fish respond to strobe lights under high flow conditions.
First, very few fish were detected inside the trash racks. Of the more than 3,200 targets identified by the data processing, less than 100 were detected inside the trash racks. Only 23 fish were found inside the trash racks behind the strobe lights. Of those 21 fish, 13 were detected when the lights were on. Most of the fish detected behind the trash racks were above the turbine penstock but were headed downward. No fish were detected at night when minimal flows occurred between midnight and 4:00 a.m.
Second, significantly more fish (P < 0.001) were detected in front of the trash racks when the lights were on at night. On a count-per-hour basis, the difference between lights off and lights on was apparent in the early morning hours at depths between 25 m and 50 m from the transducers. The lights were approximately 34 m below the splitbeam transducers, and fish detected at night with lights on were found at a median depth of approximately 35 m, compared to a median depth of from 20.6 to 23.5 m when the lights were off. The differences in depth between lights on and off at night were also significant

Strobe Light Deterrent Efficacy Test 2005 Final Report
iv
(P < 0.001). Additionally, the increase in fish occurred only in front of the trash rack where the strobe lights were mounted; there was no increase in the number of detections by the transducers aimed away from the lights.
Third, fish clearly manifested a behavioral response to the strobe lights during the day. When the lights were on, fish detected by three of the four transducers generally were swimming north, parallel to the face of the dam. However, the distribution of swimming directions for fish detected by the transducer immediately to the north of the lights was bimodal, with some fish swimming south toward the lighted region. This behavior was similar to that seen at night when the lights were on.
Fourth, kokanee, rainbow trout, and walleye were detected near the strobe lights. Data were obtained from three sources: fish size from the hydroacoustic sensors and fish species from gill netting and video recording. Fish ranging in length from 30 to 600 mm (averaging 125 mm) were detected by the splitbeam transducers. There was little difference in target strength for fish detected above 25 m depth with respect to time of day or light treatment. Below 25 m and closer to the strobe lights, larger fish were present when the lights were on during the night, and smaller fish were present during the day. Eight fish―five rainbow trout, two walleye, and one kokanee―were captured by the gill nets in 10 nights of sampling distributed over the study period. From approximately 72 hours of video recordings made when the strobe lights were on, six fish were close enough to the camera to be identified and appeared to be either walleye or salmonids.
The 2005 study resulted in four primary conclusions:
• The low number of fish detected inside the trash racks suggests that entrainment rates may have been substantially lower than reported earlier or that fish moved through the system at a different time of the year.
• As in previous years, fish were attracted to the regions illuminated by the strobe lights at night.
• Fish responded to strobe lights during daylight hours at the third powerplant by swimming toward the lights.
• Salmonids and walleye appeared to be attracted to the strobe lights.
Information obtained during the 2005 study supports the following recommendations:
Strobe lights should not be used at Grand Coulee Dam to deter fish from entering the third powerplant forebay or penstocks. Despite the presence of flow, fish continued to accumulate in the area illuminated by the strobe lights as they did in the open forebay, but in a more dangerous location― directly in front of an operating turbine unit. Although fish accumulated in front of the trash racks when the strobe lights were on, only a few entered the high-velocity region inside the trash racks.
A direct capture method of sampling the entrainment rate at the dam would provide the information necessary to substantiate and quantify the entrainment problem, which continues to be a key uncertainty.

Strobe Light Deterrent Efficacy Test 2005 Final Report
v
The 2005 study results also suggest two areas for future research:
Additional information is needed to understand the movements of post-release hatchery kokanee and rainbow trout and associated predation rates during their early life history in Lake Roosevelt. Conjunctive to the entrainment metrics, it is important to know when and how many fish ultimately arrive at the dam and become susceptible to entrainment. Emerging technologies from the Pacific Northwest National Laboratory using very small sonic tags capable of detecting a predation event would yield invaluable information about the movements of post-release hatchery kokanee and rainbow trout. Predation event detection would also provide valuable information about predator behavior and predation rates. All of these factors have far-reaching management implications for the hatchery stocks of kokanee and rainbow trout released into Lake Roosevelt.
The potential of strobe lights to guide anadromous juvenile fish to preferred outlets at Grand Coulee Dam should be evaluated. The fish-attractant nature of constant light as used on the lower Columbia and Snake River dams to guide fish into passage bypass channels might be used also at Grand Coulee to guide fish to a “preferred” intake structure operated to maximize safe passage for downstream migration. This could be a very cost-effective guidance technique for deep-water intakes such as those at Grand Coulee Dam where purposeful entrainment would provide safe passage through the project.
Therefore, we recommend a study to characterize a range of turbine operations and their effects on fish passing through Francis turbines under varying operational configurations or scenarios. The use of constant light to attract fish to a preferred unit should be evaluated also. A detailed hydraulic model also should be developed to test varying operational scenarios relative to fish passage. A possible scenario for downstream fish passage might be to designate Units 19 and 24, for example, as fish passage units during the abbreviated out-migration season, with each lighted to attract fish and pass them safely downstream. Permanently installed hydroacoustic monitoring instruments would be used to determine when a large portion of the run had passed safely, at which time normal operations would be resumed.

Strobe Light Deterrent Efficacy Test 2005 Final Report
vii
Acknowledgments
We sincerely acknowledge the cooperation, assistance, and dedication of the following persons during this four-year study:
• Bonneville Power Administration − Tracy Hauser (Contracting Officer’s Technical Representative)
• U.S. Bureau of Reclamation (Denver Office) − Steve Hiebert (scientific input and technical review)
• U.S. Bureau of Reclamation (Grand Coulee Dam) − Blanche Achord (badges and keys) − Terri Aubertin (logistical and operational support) − Dale Carriere (security) − Steve Sauer (project oversight) − Jan Schrader (point of contact) − Randy Spotts (dam operations data) − Craig Sprankle (public relations) − Robert Steffens and rigging crew (deployment and recovery of equipment)
• Confederated Tribes of the Colville Reservation − Charlie Joseph (on-site technician) − Rod Stensgar (on-site technician)
• Terra Byte Systems − Alan Cain (wireless communications and Internet service provider)
• Precision Acoustic Systems − Alan Wirtz (hydroacoustic equipment support)
• Flash Technology − Ron Brown (strobe light systems, support, and technical review)
• Idaho Fish and Game − Melo Maiolie (scientific input and technical review)
• Pacific Northwest National Laboratory − Lila Andor (publication design) − Charlie Brandt (technical review) − Andrea Currie (technical editor) − Gayle Dirkes (administrative support) − Corey Duberstein (demobilization) − David Geist (scientific advice - technical review)

Strobe Light Deterrent Efficacy Test 2005 Final Report
viii
• Pacific Northwest National Laboratory (continued) − Kenneth Ham (scientific input) − Nathan Johnson (graphics design) − Geoff McMichael (technical review) − Tyrell Monter (setup, data collection, roping lessons) − Bob Mueller (video equipment support) − Dennis Mullen (mechanical engineering and design) − Tim Peters (light evaluation) − John Serkowski (graphics and animation) − John Stephenson (demobilization) − John Thomas (statistical guidance and technical review) − Jake Tucker (mechanical engineering and computer networking) − Cherylyn Tunnicliffe (multibeam processing) − Rose Urbina (publication design) − Janie Vickerman (monthly reporting)

Strobe Light Deterrent Efficacy Test 2005 Final Report
ix
Abbreviations
°C degrees Celsius
cm centimeter
cfs cubic feet per second (ft3/s; 0.0283 m3/s)
dB decibel
dB counts||μPa decibel counts relative to microPascal
E east
e.g. (exempli gratia) for example
et al. (et alii) and others
etc. (et cetera) and so forth
°F degrees Fahrenheit
ft foot
hr hour
i.e. (id est) that is
in. inch
kcfs 1000 cubic feet per second
kHz kilohertz
m meter
mi mile
MW megawatt
N north
NTU nephelometric turbidity unit(s)
NWPCC Northwest Power and Conservation Council
PAS Precision Acoustic Systems
PNNL Pacific Northwest National Laboratory
pps pings per second (acoustics) or pulses per second (light)
QA quality assurance
s second
S south
V volt
W west

Strobe Light Deterrent Efficacy Test 2005 Final Report
xi
Glossary
anadromous pertaining to fish that ascend freshwater streams from the sea to spawn
decibel dimensionless unit used to express logarithmic ratios of sound intensity; abbreviated as dB
entrainment the pickup and movement of fish by current flow
forebay portion of a reservoir or canal immediately upstream from a dam or pumping plant, from which water is taken to run equipment (e.g., a turbine)
hydroacoustics the use of transmitted sound to detect objects (e.g., fish) in water
lumen SI unit for measuring the flux of light produced by a light source or received by a surface
nephelometric see turbidity turbidity unit
penstock a closed water conduit controlled by valves and located between the intake and the turbine in a hyrdoelectric plant
ping a pulse of transmitted sound
pulse a dose of a substance over a short period of time (e.g., a pulse of light)
track a trajectory associated with a single target; composed of a series of echo returns
transducer a pressure-sensitive device that converts electrical energy into sound energy for sound transmission, and sound energy into electrical energy during reception
turbidity the extent to which water is thick or opaque with suspended particles – It is usually measured by nephelometry (the relative measurement of light scattering through a restricted range of angles to the incident light beam).

Strobe Light Deterrent Efficacy Test 2005 Final Report
xiii
Contents
Summary ............................................................................................................................................ iii
Acknowledgments.............................................................................................................................. vii
Abbreviations..................................................................................................................................... ix
Glossary ............................................................................................................................................. xi
1.0 Introduction................................................................................................................................ 1.1
1.1 Background ........................................................................................................................ 1.1
1.2 Study Scope........................................................................................................................ 1.1
1.3 Report Contents.................................................................................................................. 1.2
2.0 Study Site Description................................................................................................................ 2.1
3.0 Methods...................................................................................................................................... 3.1
3.1 Strobe Lights ...................................................................................................................... 3.1
3.2 Transducer Deployment ..................................................................................................... 3.3
3.3 Study Design ...................................................................................................................... 3.5
3.4 Data Processing .................................................................................................................. 3.5
3.5 Data Analysis ..................................................................................................................... 3.6
3.6 Ancillary Data .................................................................................................................... 3.7
3.6.1 Gill Net Sampling .................................................................................................... 3.7
3.6.2 Underwater Video Sampling.................................................................................... 3.8
4.0 Results ........................................................................................................................................ 4.1
5.0 Discussion .................................................................................................................................. 5.1
6.0 Conclusions and Recommendations .......................................................................................... 6.1
6.1 Conclusions ........................................................................................................................ 6.1
6.2 Recommendations .............................................................................................................. 6.1
6.3 Areas for Future Research.................................................................................................. 6.2
7.0 References .................................................................................................................................. 7.1
Appendix A – Environmental Conditions at Grand Coulee Dam...................................................... A.1
Appendix B – Hydroacoustic System Calibration ............................................................................. B.1
Appendix C – Hydrodynamic Characterization of Velocity Field Within Third Powerplant Forebay.................................................................................................... C.1

Strobe Light Deterrent Efficacy Test 2005 Final Report
xiv
Figures
2.1 Location of the 11 Columbia River Dams, Including Grand Coulee, in Washington State....... 2.2
2.2 Location of Powerplants and Third Powerplant Forebay at Grand Coulee Dam....................... 2.2
2.3 Discharge at Grand Coulee Dam from the Left, Right, and Third Powerplant During the 2005 Study Period ................................................................................................................ 2.3
2.4 Average, Minimum, and Maximum Hourly Discharge at the Third Powerplant at Grand Coulee Dam Between July and October 2005 ................................................................ 2.3
2.5 Turbine Unit Locations in Third Powerplant, Grand Coulee Dam ............................................ 2.4
3.1 Aquatic Guidance Lighting Strobe Light Attached to Steel Beam for Deployment at Grand Coulee Dam in 2005........................................................................................................ 3.1
3.2 Strobe Light Assembly Bar with 11.3-m Lifting I-Beam on Top .............................................. 3.2
3.3 Transducer and Strobe Light Placements with Respect to Third Powerplant Turbine Units..... 3.2
3.4 Splitbeam Transducer and Motorized Actuator on Trash-Rack Mount ..................................... 3.3
3.5 Trash-Rack–Mounted Splitbeam Transducer............................................................................. 3.4
3.6 Wall-Mounted Splitbeam Transducers ...................................................................................... 3.4
3.7 Strobe Light 3, Light Sensor, and One of Two Video Cameras ................................................ 3.8
4.1 Average Direction of Travel and Velocity for Fish Detected Inside the Trash Racks at Turbine Units 20, 21, and 22.................................................................................................. 4.2
4.2 Average Hourly Counts of Fish Detected by Splitbeam Transducers Aimed Toward and Away from the Strobe Lights When the Lights Were Off and On............................................. 4.4
4.3 Depth Distribution for Fish Targets Detected Outside the Trash Racks During Daylight and Nighttime Hours When the Strobe Lights Were Off and On .............................................. 4.5
4.4 Screen Shot of Raw Data Collected by Multiplexed Splitbeam Transducers Aimed Outside the Trash Racks............................................................................................................. 4.6
4.5 Horizontal Component of Swimming Direction for Fish Detected Between 25 and 50 m from the Splitbeam Transducers During Daylight Hours When the Strobe Lights Were Off and On........................................................................................................................ 4.7
4.6 Horizontal Component of Swimming Direction for Fish Detected Between 25 and 50 m from the Splitbeam Transducers During Nighttime Hours When the Strobe Lights Were Off and On............................................................................................................. 4.8
4.7. Mean Target Strength of Fish Detected in Front of the Trash Racks at Turbine Units 20, 21, and 22 ................................................................................................................... 4.9
4.8 Fish Images Captured by Video Cameras Positioned near the Strobe Lights in Front of the Trash Rack on Turbine Unit 21.............................................................................. 4.10
5.1 Total Number of Fish Detected Within a Two-Day Block Between July 30, 2005, and October 8, 2005, in Front of the Trash Racks at Turbine Units 20, 21, and 22 at Grand Coulee Dam................................................................................................................. 5.2

Strobe Light Deterrent Efficacy Test 2005 Final Report
xv
5.2 Water Velocities Modeled at Turbine Unit 21 Using Computational Fluid Dynamics Model for Conditions on August 20, 2005................................................................................. 5.3
5.3 Water Velocities at Center of Turbine Unit 21 Penstock Opening Modeled Using a Computational Fluid Dynamics Model ...................................................................................... 5.4
5.4 Simulated Water Velocities Within Areas Ensonified by Splitbeam Transducers Positioned in Front of and Behind the Trash Rack at Turbine Unit 21...................................... 5.4
Tables
3.1 Operating Parameters for the Seven Splitbeam Transducers Monitoring Fish During the 2005 Study Period ................................................................................................................ 3.5
3.2 Light Treatment Schedule for the 2005 Study ........................................................................... 3.5
3.3 Factor Variable Definitions for Statistical Analysis .................................................................. 3.7
4.1 Number of Fish Detected by the Seven Splitbeam Transducers Deployed at Grand Coulee Dam Third Powerplant from July 20, 2005, Through October 12, 2005....................... 4.1
4.2 Number of Fish Detected Inside the Trash Racks in Front of Turbine Units 20, 21, and 22..... 4.2
4.3 Number of Fish Detected by Four Splitbeam Transducers Aimed in Front of the Trash Racks at Turbine Units 20, 21, and 22 ....................................................................................... 4.3
4.4 Counts and Catch Per Unit Effort for Gill Net Sampling at the Entrance to the Third Powerplant Forebay, Grand Coulee Dam, Between August 8, 2005, and September 28, 2005.................................................................................................................... 4.10

Strobe Light Deterrent Efficacy Test 2005 Final Report
1.1
1.0 Introduction
In 2005, the last in a series of studies was conducted to evaluate the effectiveness of strobe lights in reducing the entrainment of kokanee (Oncorhynchus nerka kennerlyi) and rainbow trout (O. mykiss) at Grand Coulee Dam. In earlier studies, we placed strobe lights at the entrance to the third powerplant forebay to determine if the lights would deter the fish from entering the forebay. For 2005, strobe lights were deployed on the trash rack directly in front of the intake to a turbine penstrock to evaluate the potential for reducing entrainment in a dynamic velocity flux environment. This work was conducted for the Bonneville Power Administration, U.S. Department of Energy, by Pacific Northwest National Laboratory (PNNL) in conjunction with the Confederated Tribes of the Colville Reservation (Colville Confederated Tribes).
1.1 Background
The construction of Grand Coulee and Chief Joseph dams on the Columbia River in 1933 and 1956, respectively, resulted in the complete extirpation of the anadromous fishery upstream of these structures. Today, the area above the two dams is totally dependent upon resident fish resources to support local fisheries. Target species in the existing fishery include, but are not limited to, kokanee, rainbow trout, white sturgeon (Acipenser transmontanus), and walleye (Sander vitreum). Kokanee, a land-locked sockeye salmon, is a species of special interest because of its historical significance to native cultures and its role in the functioning ecosystem within the affected area.
Resident fishery resources have been supplemented since 1988 by release of hatchery-raised rainbow trout and kokanee (Baldwin and Polacek 2002). Evaluation of the fishery found kokanee numbers less than expected. This information, coupled with the appearance of hatchery kokanee at downstream counting facilities, indicated that entrainment at Grand Coulee Dam might be a major source of loss for the fishery. A 42-month entrainment investigation from March 1996 through September 1999 estimated that from 211,685 to 576,676 fish were being entrained annually at Grand Coulee Dam (LeCaire 1999; Sullivan 2000). These studies found that entrainment was potentially correlated with annual reservoir water regimes, hydropower operations, and timing of reservoir net pen and hatchery releases. Further analysis determined that 85% of the entrainment occurred at the dam’s third powerplant (LeCaire 1999; Sullivan 2000). Peak entrainment rates of 51 to 66 fish per hour were measured in June and July 1999 (LeCaire 1999).
The Independent Scientific Review Panel of the Northwest Power and Conservation Council (NWPCC) suggested that because of the substantial entrainment, something needed to be done to reduce or eliminate this loss of resident fish. The panel noted that studies conducted at Dworshak Dam and other areas in Idaho by Idaho Fish and Game found that kokanee avoided areas illuminated by strobe lights (Maiolie et al. 2001). It was suggested that strobe light technology might also deter kokanee from entering the third powerplant forebay at Grand Coulee Dam.
1.2 Study Scope
The scope of work for the original Chief Joseph Kokanee Enhancement Project was modified to include a multiyear pilot test of a strobe light system to determine its effectiveness in reducing fish entrainment. The first four years of the pilot test (2001-2004) consisted of suspending three (2001) and

Strobe Light Deterrent Efficacy Test 2005 Final Report
1.2
six (2002-2004) strobe lights in the center of the third powerplant forebay and using hydroacoustic systems to remotely and unobtrusively monitor fish distribution and behavior. The results indicated that instead of avoiding the region, fish congregated in the vicinity of the lights at night under low flow conditions, while during daytime and high flow, there was no apparent response to the lights. Some results suggested that at night when flows were higher, fish were avoiding the lights. However, fish detected under this combination of high flows at night represented too small a sample for statistical analysis. In addition, the species of fish congregating near the strobe lights was unknown.
The study in 2005 was designed to address these issues. Four omnidirectional strobe lights were positioned on the trash rack in front of the intake to a single turbine penstock from the third powerplant. At this depth, the lights would be visible during the daytime high-flow conditions as well as at night. Species information was collected by using gill nets to capture fish entering the third powerplant forebay and by video recording fish in the lighted area near the trash rack.
1.3 Report Contents
Section 2 of this report describes the study site at Grand Coulee Dam. Section 3 provides the methods of sampling and analysis. Results are presented in Section 4. Section 5 provides a discussion of results, while conclusions, recommendations, and suggestions for future research are presented in Section 6. References are in Section 7.
A series of appendixes provides supporting information: environmental conditions at the study site (A); hydroacoustic system calibration (B); and hydrodynamic characterization of the forebay (C).

Strobe Light Deterrent Efficacy Test 2005 Final Report
2.1
2.0 Study Site Description
Grand Coulee Dam, the farthest upstream of the 11 U.S. dams on the Columbia River, is sited at river kilometer 960.1 (river mile 596.6) (Figure 2.1). The dam complex contains four powerplants (pumping plant, left powerplant, right powerplant, and third powerplant) and a spillway (Figure 2.2). The third powerplant contributes more than 60% of the generating capacity at Grand Coulee Dam and, during the study period in 2005, contributed up to 85% of the total powerplant discharge during the day (Figure 2.3). Discharge patterns for the third powerplant show a peak during the daytime and fall to near zero during the night hours consistent with normal Grand Coulee Dam power peaking operation (Figure 2.4). Operations data were supplied by the U.S. Bureau of Reclamation.(a) Additional information related to forebay elevation and surface turbidity is in Appendix A.
The third powerplant contains six turbine units (numbered 19 through 24 from south to north) (Figure 2.5). Units 19 through 21 have a generating capacity of 600 MW each, while Units 22 through 24 have a capacity of 805 MW. The operation of the turbine units is dictated by power demands. During the study, Unit 21 was operated daily; the unit to the south (Unit 20) did not operate until August 3, 2005, and was down several times during the study, while Unit 22 did not operate consistently after August 31, 2005.
The effectiveness of strobe lights in eliciting a negative phototactic response in fish was evaluated at Unit 21 of the third powerplant. Factors influencing the selection of this turbine unit included the
• need to avoid the north end of the forebay (near Unit 24) because of large accumulations of floating debris at the end of the cul-de-sac
• need to avoid the highly variable flows at the southern end of the forebay (Unit 19) where water comes around the corner of the dam
• need to monitor activity at turbine units on each side of the lights
• Only two turbine units met these criteria. Of those two, Unit 21 had the most consistent operation (fewer planned downtime periods) over the past four years and during 2005.
(a) Randy Spotts (U.S. Bureau of Reclamation, Grand Coulee Dam), personal communication.

Strobe Light Deterrent Efficacy Test 2005 Final Report
2.2
Figure 2.1. Location of the 11 Columbia River Dams, Including Grand Coulee, in Washington State
Figure 2.2. Location of Powerplants and Third Powerplant Forebay at Grand Coulee Dam

Strobe Light Deterrent Efficacy Test 2005 Final Report
2.3
0
1000
2000
3000
4000
5000
7/22 7/29 8/5 8/12 8/19 8/26 9/2 9/9 9/16 9/23 9/30 10/7 10/14
Date
Dis
char
ge (m
3 /s)
Third Right Left
Figure 2.3. Discharge at Grand Coulee Dam from the Left, Right, and Third Powerplant During the 2005 Study Period
0
2000
4000
6000
0 4 8 12 16 20 24
Hour
Disc
harg
e (m
3 /s)
Average Minimum Maximum
Figure 2.4. Average, Minimum, and Maximum Hourly Discharge at the Third Powerplant at Grand Coulee Dam Between July and October 2005. Zero hour is midnight.

Strobe Light Deterrent Efficacy Test 2005 Final Report
2.4
Figure 2.5. Turbine Unit Locations in Third Powerplant, Grand Coulee Dam

Strobe Light Deterrent Efficacy Test 2005 Final Report
3.1
3.0 Methods
This section describes the placement and operation of the strobe lights and splitbeam transducers, the study design, and data processing and analysis. Additional information collected during the study included water turbidity, video recording near the strobe lights, and gill netting of fish at the entrance to the forebay of the third powerplant.
3.1 Strobe Lights
Four FH-920-1 Aquatic Guidance Lighting™ strobe lights (manufactured by Flash Technology, Franklin, Tennessee) were used in the study (Figure 3.1). These lights are omni directional with a beam spread of 360 degrees in the horizontal direction and 100 degrees in the vertical direction. The strobe lights produced approximately 20,000 lumen-s/flash with the flash rate set at 360 flashes per minute. Each strobe light was controlled by a control box linked via RS485 communication to a control panel. The control panel was operated manually using a circuit breaker switch.
The four strobe lights were attached to bracket bars measuring 10.2 cm × 68.6 cm × 1.3 cm. These bracket bars were attached to a 0.95-cm × 30.5-cm × 20.9-m strobe light assembly bar, which was designed to follow the contour of the trash rack in front of the penstock opening (Figure 3.2). The strobe lights were spaced approximately 6.2 m apart along the bar and adjusted to a 45-degree downward tilt angle. The light bar was positioned directly in front of the trash rack opposite the top of the penstock opening of turbine unit 21 (Figure 3.3). The placement of the bar and the tilt of the strobe lights provided maximum illumination above the penstock opening behind the trash rack and in front of the trash rack opposite the penstock opening.
Figure 3.1. Aquatic Guidance Lighting Strobe Light Attached to Steel Beam for Deployment at Grand Coulee Dam in 2005

Strobe Light Deterrent Efficacy Test 2005 Final Report
3.2
Figure 3.2. Strobe Light Assembly Bar (pictured prior to attaching strobe lights) with 11.3-m Lifting I-Beam on Top
Figure 3.3. Transducer and Strobe Light Placements with Respect to Third Powerplant Turbine Units

Strobe Light Deterrent Efficacy Test 2005 Final Report
3.3
3.2 Transducer Deployment
Seven splitbeam transducers were used to monitor fish both inside and in front of the trash racks near turbine unit 21 of the third powerplant. Precision Acoustic Systems (PAS), Seattle, Washington, supplied the splitbeam hydroacoustics system. The system comprised a Model PAS-103 Multimode Scientific Echo Sounder operating at 420 kHz; a Model PAS-203 Remote Underwater Quad Multiplexer; a Model PAS-203 Local Quad Multiplexer; seven 6-degree (nominal beam diameter), 420-kHz splitbeam transducers; and associated power cables.
Splitbeam transducers were attached to the trash racks of Units 20, 21, and 22 (Figure 3.3). The trash-rack–mounted transducers were lowered into position from the deck of the dam using attached underwater video cameras to locate openings in the trash rack, and a boat tethered to the face of the dam to assist in positioning the mount. The transducers were placed 12.2 to 15.2 m above the penstock openings and oriented to look inside the opening, with depth depending on ability to pass the mounts through the trash racks at a specific location. Some areas of the trash racks were so badly corroded or bent that it was difficult to insert the transducers into openings in the trash rack using the underwater video. To accommodate placement of these transducers, each was attached to a mount assembly hanger containing a motorized actuator (Figure 3.4). The motorized actuator made it possible to retract the transducer during insertion through the trash rack while the frame of the hanger protected the transducer during deployment. Once the transducer was in place, the actuator rotated it into position so that the top and bottom of the penstock opening were acoustically visible (Figure 3.5). The remaining four trans-ducers were mounted in pairs between Units 20 and 21 and between Units 21 and 22 (Figures 3.3 and 3.6). The transducer pairs were attached to the wall of the dam at the bottom of a 7.3-m pole. One transducer in each pair was aimed at the area in front of the lights on Unit 21, while the other was aimed in front of the adjacent turbine unit (either Unit 20 or 22).
Figure 3.4. Splitbeam Transducer and Motorized Actuator on Trash-Rack Mount

Strobe Light Deterrent Efficacy Test 2005 Final Report
3.4
Figure 3.5. Trash-Rack–Mounted Splitbeam Transducer (left to right: fully retracted; partially retracted; fully deployed). Splitbeam transducer is pictured in green; motorized actuator is in blue.
Figure 3.6. Wall-Mounted Splitbeam Transducers (pictured with acoustic lenses that were later removed; see discussion in Appendix B)
The operating parameters for each transducer are found in Table 3.1. Each of the three inside-looking transducers mounted on trash racks collected data for three 5-minute periods each hour, while each pair of the outward-looking wall mounted transducers was fast-multiplexed over a 7.5-minute period. The splitbeam system operated 24 hours a day and collected data for more than 60 days. Transducer calibration data can be found in Appendix B.

Strobe Light Deterrent Efficacy Test 2005 Final Report
3.5
Table 3.1. Operating Parameters for the Seven Splitbeam Transducers Monitoring Fish During the 2005 Study Period
Transducer ID
Turbine Opening
Ensonified
Position Relative to Trash Rack
Sampling Duration (minutes per hour) Pings per Second
20-I 20 Inside 15 20 21-I 21 Inside 15 20 22-I 22 Inside 15 20 20-O 20 Outside 3.25 5 21-N 21 (north) Outside 3.25 5 21-S 21 (south) Outside 3.25 5 22-O 22 Outside 3.25 5
3.3 Study Design
The study period ran from July 22 through September 28, 2005. This period was chosen because July and August were peak entrainment months in the 1996-1999 entrainment study (LeCaire 1999), and from our earlier strobe light studies, the maximum number of fish were detected at the end of July and the first part of August. Two light treatments were evaluated during the study period―all lights on for 24 hours and all lights off for 24 hours. These treatments were assigned randomly within each 2-day block over the study period, which extended from July 22, 2005, through September 28, 2005. Wednesdays of each week were used for calibration and other testing. Data collected during the first week were not used because of equipment problems. Additional data were collected between September 28 and October 10, 2005, because equipment retrieval was delayed by operations on the dam. However, these data did not follow the on/off treatment design (Table 3.2).
Table 3.2. Light Treatment Schedule for the 2005 Study
Start Date End Date Comments 7/22/2005 7/29/2005 Equipment problems; data not used in analysis 7/30/2005 9/28/2005 Alternating 24-hr lights on and off; 26 blocks used in
statistical analysis 9/28/2005 10/5/2005 Lights off continuously 10/5/2005 10/10/2005 Lights on continuously
3.4 Data Processing
Acoustic splitbeam data were processed using software developed by PNNL to identify linear traces. The software allowed users the option of manually selecting tracks (manual tracking) or having the software choose the tracks (autotracking). Manual tracking allowed us to develop tracking criteria needed for the autotracking calibration and to screen the data for possible noise events. Manual tracking was used also to estimate the detectability of the autotracking process. Approximately 15% of the files for a day were randomly selected for manual tracking. All the files were autotracked.

Strobe Light Deterrent Efficacy Test 2005 Final Report
3.6
Following the autotracking processing, the tracks were subjected to additional filtering to select targets that exhibited fish-like behavior. Tracks are composed of a sequence of locations (position vectors)—that is, echo locations—for which the displacement between locations depends on the fish velocity and the sample rate of the equipment (acoustic pings sent out per second, or pps). However, each track contains random departures resulting from movement of the equipment, inaccuracy in locating the angular direction, and basic accuracy limitations of the tracking software. Therefore, a filtering process is needed to remove location errors and to smooth the data to remove or reduce random departures from the actual path of a fish. The processing of target tracks by filtering and smoothing must be done to obtain the most accurate estimate possible of the overall velocity allowed for by the measurement conditions. Criteria and procedures used to filter and smooth the splitbeam data included excessive position and velocity shifts and tracks containing less than five echo locations, given the angle of the splitbeam and the ping rate. Additional details about the data filters are given in Simmons et al. (2004).
3.5 Data Analysis
In analyzing and interpreting the data, a number of environmental and system factors, aside from the strobe light treatments, must be considered. Factors associated with the sampling method (i.e., hydro-acoustics) include the shape of the area sampled, the presence of noise in the data, and inability to distinguish species and identify unique targets. Splitbeam transducers sample an approximate conical volume, with the narrower sample volume close to the transducer, expanding to a larger volume further away. Thus, the distribution of fish within the beam is not invariant with distance from the transducer.
Noise in the hydroacoustic data can make it difficult to identify fish targets. Noise encountered during the study period was associated primarily with dam operations. This confounded the analysis, because high noise events occurred during the day when operations peaked and were minimal at night when most of the third powerplant was idle. Of the three in-turbine transducers, the one in turbine 21 where the lights were deployed experienced minimal noise, even during the day. The other two in-turbine transducers were noisier, especially during the day. We think that debris on the trash racks in front of turbine units 20 and 22 may have produced the noise detected by those in-turbine transducers. Additional filtering considerations helped remove extraneous echoes or noise.
Due to these factors, the count estimates of fish used in the analysis cannot be considered as a measure of abundance but rather as an index of activity based on target detections. Analysis of these detections provides information about fish activity, such as swimming speed and direction in the vicinity of the strobe lights.
This study was designed to evaluate the response of fish to the presence of strobe lights near the penstock entrances. The response of fish to strobe lights was evaluated to answer two questions: 1) How were fish distributed in relation to the lights? and 2) What was the swimming response of fish to the lights?
For the question relating to the distribution of fish activity, statistical analyses were used to test the null hypothesis that the strobe lights had no effect on where the fish were detected with respect to the strobe lights. For fish detections, we were interested in differences in the distribution of fish detections for similar regions and periods of the day. If the strobe lights had no effect on distribution, we would expect the number of fish detected by each of the splitbeam transducers to be independent of the light condition (on or off). Data collected between July 30 and September 28 were used in this analysis.

Strobe Light Deterrent Efficacy Test 2005 Final Report
3.7
Analysis of variance models were used to test hypotheses regarding light treatment effects on changes in target depth distribution and change in counts observed in the four splitbeam transducers aimed outside the trash racks. In both models, effects of sequential treatment blocks (temporal effects) and splitbeam transducer (spatial effects) were controlled for before differences due to light treatment were assessed. Table 3.3 lists and defines the factors or classification variables used in the statistical analysis.
Behavioral data involving swimming direction were analyzed using circular statistics (Fisher 1993). Straight-line trajectories on the horizontal plane from the initial to the final position in each track were converted from Cartesian (x,y) to polar (r,θ) coordinates and statistically analyzed as circular data on the angles (θ). The von Mises distribution was used to define the parameters of the distribution (see Johnson et al. 2005, Appendix D). All data were used in the analysis of the behavioral response to the strobe lights.
Table 3.3. Factor Variable Definitions for Statistical Analysis
Factor Variable Number of
Levels Description Strobe Light Treatment 2 Lights Off – 24 hours; Lights On – 24 hours Depth 2 Distance from splitbeam transducers: 0–25m; 26–50m Time of Day 4 Sunrise, Day, Sunset, Night (based on 1 hour before and after sunrise
and sunset) Blocks Number of 2-day treatment blocks
3.6 Ancillary Data
In addition to the hydroacoustic data, ancillary data were collected that, we hoped, would provide information about the fish species present in the area near the strobe lights. While it was not possible to identify fish species using hydroacoustics, we did obtain information from the splitbeam data about the acoustic size of the ensonified target, which allows an inference as to the fish species. In addition, gill nets were set at the entrance to the forebay, and video cameras were deployed near the strobe lights to record fish seen when the lights were on.
3.6.1 Gill Net Sampling
Gill net sampling was conducted at the entrance to the third powerplant forebay to determine the species of fish entering the forebay. The gill nets were set two nights each week, when conditions permitted, beginning August 9, 2005 and ending September 28, 2005. An 18.3-m × 4.6-m gill net with graduated variable mesh (2.5 cm, 3.8 cm, 5.1 cm, 6.4 cm, and 7.6 cm) was suspended such that the top of the net was approximately 15 m below the surface of the water in the center of the forebay opening. For each sampling date, the gill net was rotated so that the mesh size nearest the dam alternated between small (2.5 cm) and large (7.6 cm). Next to the gill net, on the dam side, a strobe light was suspended beneath a floating barge. The strobe light was aimed across the downstream side of the gill net. The net was set in the evening between 9:00 and 11:00 p.m. and raised in the morning around 6:30 a.m. This was done to avoid the high currents during daytime dam operations and because the strobe lights are relatively ineffective in daylight (Johnson et al. 2005).

Strobe Light Deterrent Efficacy Test 2005 Final Report
3.8
3.6.2 Underwater Video Sampling
Two video cameras (JAI CV-M10 SX Progressive Scan with Tamron 23FM08-L 8-mm locking lenses) were mounted on top of the strobe light bar in underwater housings (Figure 3.7). The cameras were positioned to capture images directly in front of the center of the trash rack between the center two strobe lights. The cameras were designed to record in sync with the strobe lights. However, because of problems with this feature, the cameras operated only from September 7, 2005, until September 24, 2005. In addition, video was recorded only when the strobe lights were on; data were stored on VHS videotape.
Figure 3.7. Strobe Light 3, Light Sensor, and One of Two Video Cameras (shown post-deployment)

Strobe Light Deterrent Efficacy Test 2005 Final Report
4.1
4.0 Results
Four key results emerged from this year’s study of fish response to strobe lights in the vicinity of the turbine penstocks at the Grand Coulee Dam third powerplant:
Very few fish were detected inside the trash racks. Of the more than 3,200 targets identified by the data processing, less than 100 were detected inside the trash racks (Table 4.1). Only 23 fish were found inside the trash racks at Unit 21 where the strobe lights were positioned. Of those 23 fish, 13 were detected when the lights were on (Table 4.1). Most of the fish detected within the trash racks were above the turbine penstock (less than 15 m from the transducer) but were headed downward toward the opening (Figure 4.1). The area where most of the fish were detected was the area most illuminated by the strobe lights through the trash racks because of the tilt of the lights. Most fish were detected during the daytime, while fish detected at night were present before minimal flows occurred between midnight and 4:00 a.m. (Table 4.2).
Table 4.1. Number of Fish Detected by the Seven Splitbeam Transducers Deployed at Grand Coulee Dam Third Powerplant from July 20, 2005, Through October 12, 2005. Three transducers were aimed inside (I) the trash racks at Units 20, 21, and 22. Four transducers were aimed outside (O, N, S) the trash racks (see Figure 3.3 for transducer position).
Splitbeam Transducer Location Inside Trash Racks In Front of Trash Racks
Strobe Lights 20-I 21-I 22-I 20-O 21-S 21-N 22-O Total Off 16 10 8 406 397 355 293 1485 On 35 13 6 480 524 422 291 1771 Total 51 23 14 886 921 777 584 3256
Second, significantly more fish (P < 0.001) were detected in front of the trash racks, at the depth of the lights, when the lights were on at night (Table 4.3). On a count-per-hour basis, the difference between lights off and lights on was apparent in the early morning hours at depths greater than 25 m from the transducers (Figure 4.2). Note all depths are relative to the position of the splitbeam transducers, which were approximately 20 m below full pool elevation (393.3 m). The lights were approximately 34 m below the splitbeam transducers, and fish detected at night with lights on were found at a median depth of approximately 35 m (Figure 4.3). At night, when the lights were off, fish were found at a median depth of from 20.6 to 23.5 m. The differences in depth between lights on and off at night were also significant (P < 0.001). Additionally, the increase in fish occurred in the lighted region in front of Unit 21; there was no increase in the number of detections by the two transducers aimed away from the lights (Figure 4.2). The difference between the transducers aimed toward and away from the strobe lights is readily apparent in a screen shot of the raw data collected from one of the multiplexed transducer pairs (Figure 4.4). The top part of Figure 4.4 shows data collected by the transducer aimed toward the strobe lights (22-N), and many tracks are visible at approximately 35 m, which was the approximate distance from the transducer. The bottom part of Figure 4.4 displays data collected by the transducer aimed from a comparable area in front of the adjacent turbine unit (22-O); no tracks are visible. Data for both parts of Figure 4.4 were collected nearly simultaneously using fast multiplexing (i.e., alternating pings). These fish were detected approximately 9 m from the strobe lights.

Strobe Light Deterrent Efficacy Test 2005 Final Report
4.2
Figure 4.1. Average Direction of Travel and Velocity for Fish Detected Inside the Trash Racks at Turbine Units 20, 21, and 22. Water velocities shown are simulated for August 20, 2005, conditions at Unit 21 for comparison.
Table 4.2. Number of Fish Detected Inside the Trash Racks in Front of Turbine Units 20, 21, and 22. Sunrise and sunset periods included the hour before and after.
Lights Off Lights On Location Sunrise Day Sunset Night Total Sunrise Day Sunset Night Total Total
Turbine 20 2 12 2 16 2 23 10 35 51 Turbine 21 7 1 2 10 6 3 4 13 23 Turbine 22 1 5 1 1 8 4 1 1 6 14
88
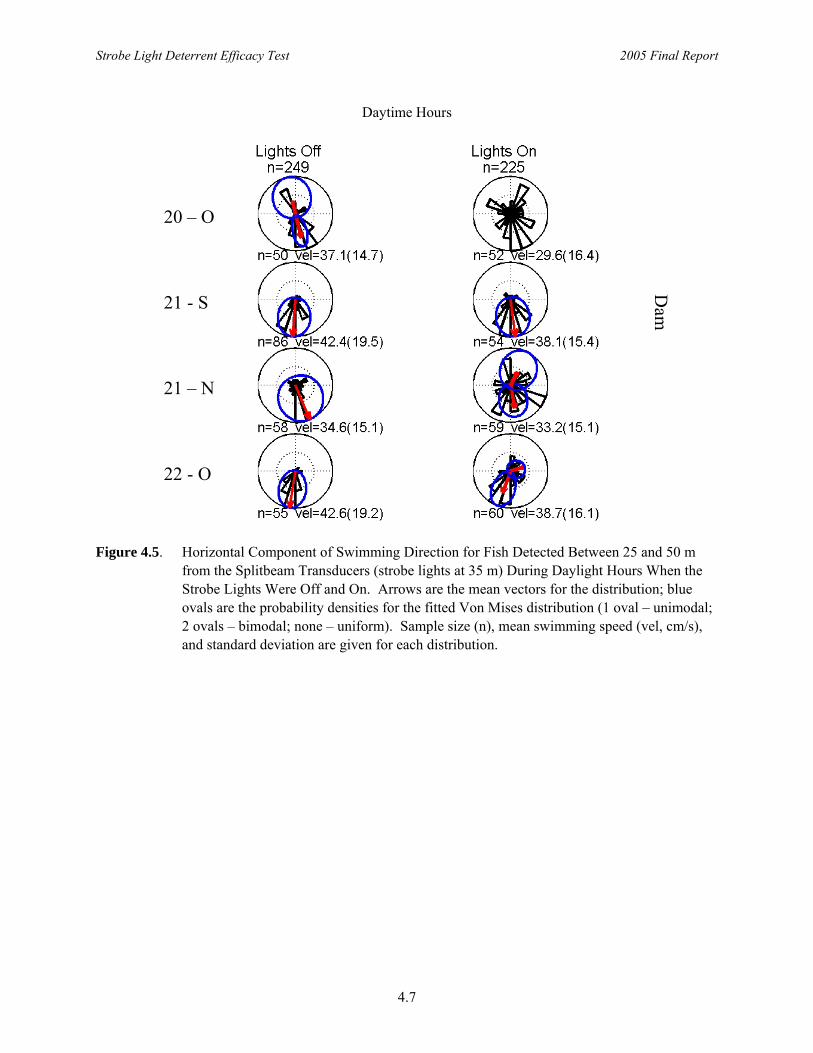
Third, fish clearly manifested a behavioral response to the strobe lights during the day, detected by the transducers aimed in front of the trash racks. This response was apparent in the swimming direction of fish detected by the transducer looking toward the lighted area from the north (i.e., 21-N) (Figure 4.5). When the lights were on, fish detected by the other three transducers generally were swimming north, parallel to the face of the dam. However, the distribution of swimming directions for fish detected by the transducer to the north of the lights was bimodal, with some fish swimming south toward the lighted region. This behavior was not evident when the lights were off. At night when the lights were on, fish detected near the strobe lights (21-N and 21-S) were swimming toward and away from the lights, while there was no predominant direction for fish detected farther from the lights (Figure 4.6).

Strobe Light Deterrent Efficacy Test 2005 Final Report
4.3
Table 4.3. Number of Fish Detected by Four Splitbeam Transducers Aimed in Front of the Trash Racks at Turbine Units 20, 21, and 22. Counts represent targets detected above and below 25 m from the transducers when the strobe lights were off and on during daylight and nighttime hours.
Distance from Transducer Strobe Lights Daylight Nighttime
<25 m Off 1016 112 On 1014 68
>25 m Off 251 72 On 258 377
Fourth, kokanee and rainbow trout were found near the strobe lights. Data were obtained from three sources: the hydroacoustic sensors (fish size, or target strength) and gill netting and video recording (fish species).
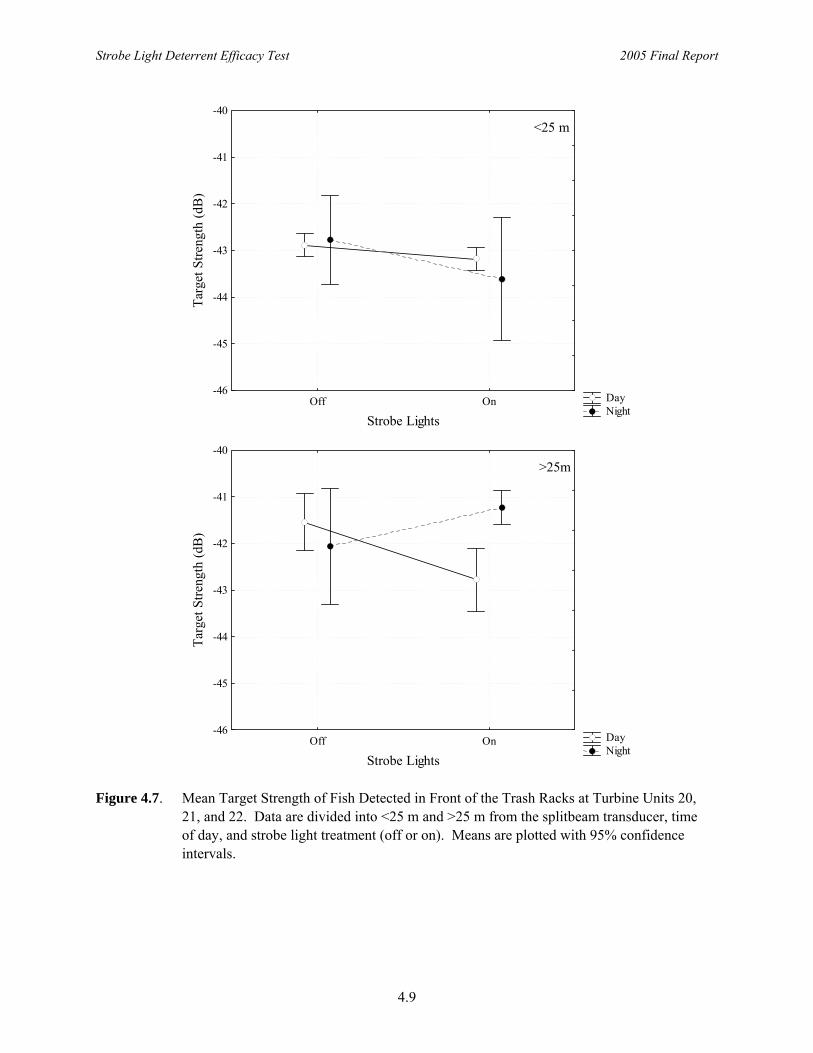
Analysis of target strength data was confined to data collected by the four transducers aimed outside the trash racks. Few fish were detected inside the trash racks, and the downward trajectory of the fish resulted in target strengths based on a “tail-end” view rather than a dorsal or ventral aspect. The target strength for fish detected outside the trash racks averaged −43 dB and ranged from −55 to −30 dB. Using Love’s formula (Love 1977) and assuming a dorsal aspect, this range of target strengths corresponds to fish lengths from 30 to 600 mm, with the mean around 125 mm. There was little difference in target strength for fish detected above 25 m with respect to time of day or light treatment. Below 25 m and closer to the strobe lights, larger fish were present when the lights were on during the night, and smaller fish were present during the day (Figure 4.7).
Gill nets were deployed at the entrance to the third powerplant forebay to intercept fish entering the forebay. Eight fish―five rainbow trout, two walleye, and one kokanee―were captured by the gill nets in 10 nights of sampling distributed over the study period (Table 4.4). The volume immediately down-stream of the gill net was illuminated continuously by a single strobe light during night sampling.
Approximately 72 hours of video recordings were made when the strobe lights were on. Six fish were close enough to the camera to be identified (see Figure 4.8 for two examples), and these appeared to be either walleye or salmonids. Other fish species noted in the forebay were bass, seen by observers standing on the deck of the dam and in boats adjacent to the face of the dam during the daytime. These fish appeared to be at the same depth as the transducers (i.e., <25 m) and coincided with times when large numbers of targets were detected by the transducers in the upper part of the water column during the daylight hours (Figure 4.2).

Strobe Light Deterrent Efficacy Test 2005 Final Report
4.4
0
1
2
3
1 2 3 4 5 6 7 8 9 10 11 12 13 14 15 16 17 18 19 20 21 22 23 24
Hour
Hou
rly C
ount
<25m /Lights off <25m /Lights on
>25m /Lights off >25m /Lights on
Aimed Toward Lights
0
1
2
3
1 2 3 4 5 6 7 8 9 10 11 12 13 14 15 16 17 18 19 20 21 22 23 24
Hour
Hou
rly C
ount
<25m /Lights off <25m /Lights on>25m /Lights off >25m /Lights on
Aimed Away from Lights
Figure 4.2. Average Hourly Counts of Fish Detected by Splitbeam Transducers Aimed Toward (21-N and 21-S) and Away (20-O and 22-O) from the Strobe Lights When the Lights Were Off and On. The water column was divided into two depth ranges: <25 m and >25 m from the splitbeam transducers. Shaded areas are sunrise and sunset periods. Hours are military time.

Strobe Light Deterrent Efficacy Test 2005 Final Report
4.5
Figure 4.3. Depth Distribution for Fish Targets Detected Outside the Trash Racks During Daylight and Nighttime Hours When the Strobe Lights Were Off and On. Splitbeam transducers 20-O and 22-O were aimed in front of turbine units 20 and 22, respectively; 21-N and 21-S were aimed in front of turbine unit 21, one from the north and one from the south. The grey dashed line indicates the approximate depth of the strobe lights relative to the splitbeam transducers. The boxes represent the middle 50% of the data (25th to 75th percentile); the notch represents the median. Lines bracketing the boxes are the widths of the 1st to the 99th percentile.

Strobe Light Deterrent Efficacy Test 2005 Final Report
4.6
Figure 4.4. Screen Shot of Raw Data Collected by Multiplexed Splitbeam Transducers Aimed Outside the Trash Racks. Top shows data collected by transducer 21-N aimed toward the strobe lights on Unit 21. Bottom shows data collected by transducer 22-O aimed in front of the trash rack at Unit 22. Data were collected on August 21, 2005, at 1:52 a.m. when the lights were on. The x-axis is time (0 to 600 s); the y-axis is distance from the transducer (0 to 55 m; axis reversed). The targets on the top half of the figure are at approximately 35 m.
Strobe Light Deterrent Efficacy Test 2005 Final Report
4.7
Figure 4.5. Horizontal Component of Swimming Direction for Fish Detected Between 25 and 50 m from the Splitbeam Transducers (strobe lights at 35 m) During Daylight Hours When the Strobe Lights Were Off and On. Arrows are the mean vectors for the distribution; blue ovals are the probability densities for the fitted Von Mises distribution (1 oval – unimodal; 2 ovals – bimodal; none – uniform). Sample size (n), mean swimming speed (vel, cm/s), and standard deviation are given for each distribution.
Daytime Hours
Dam
20 – O 21 - S 21 – N 22 - O

Strobe Light Deterrent Efficacy Test 2005 Final Report
4.8
Figure 4.6. Horizontal Component of Swimming Direction for Fish Detected Between 25 and 50 m from the Splitbeam Transducers (strobe lights at 35 m) During Nighttime Hours When the Strobe Lights Were Off and On. Arrows are the mean vectors for the distribution; blue ovals are the probability densities for the fitted Von Mises distribution (1 oval – unimodal; 2 ovals – bimodal; none – uniform). Sample size (n), mean swimming speed (vel, cm/s), and standard deviation are given for each distribution.
Nighttime Hours
Dam
20 – O 21 - S 21 – N 22 - O
Strobe Light Deterrent Efficacy Test 2005 Final Report
4.9
Day Night
Off On
Strobe Lights
-46
-45
-44
-43
-42
-41
-40
Targ
et S
treng
th (d
B)
<25 m
Day Night
Off On
Strobe Lights
-46
-45
-44
-43
-42
-41
-40
Targ
et S
treng
th (d
B)
>25m
Figure 4.7. Mean Target Strength of Fish Detected in Front of the Trash Racks at Turbine Units 20, 21, and 22. Data are divided into <25 m and >25 m from the splitbeam transducer, time of day, and strobe light treatment (off or on). Means are plotted with 95% confidence intervals.

Strobe Light Deterrent Efficacy Test 2005 Final Report
4.10
Table 4.4. Counts and Catch Per Unit Effort (CPUE) for Gill Net Sampling at the Entrance to the Third Powerplant Forebay, Grand Coulee Dam, Between August 8, 2005, and September 28, 2005
Species Count CPUE (hr) All fish 8 0.089 Rainbow trout 5 0.056 Walleye 2 0.022 Kokanee 1 0.011
Figure 4.8. Fish Images Captured by Video Cameras Positioned near the Strobe Lights in Front of the Trash Rack on Turbine Unit 21. Image to the left appears to be a walleye (note white tip on tail and double dorsal fins), while the one on the right is a salmonid.

Strobe Light Deterrent Efficacy Test 2005 Final Report
5.1
5.0 Discussion
The kokanee fishery in Lake Roosevelt has not been meeting the return goals set by fisheries managers despite an extensive stocking program. Investigations of physical and biological factors that potentially could lead to negative impacts on the kokanee population found that temperature, dissolved oxygen levels, and food were not limiting in the lake (Baldwin and Polacek 2002). However, predation and entrainment appear to have a significant impact on the fish population. Assessments of hatchery kokanee predation in 1999 and 2000 indicate that walleye consumed between 15% and 9%, respectively, of the kokanee within 41 days of their release (Baldwin et al. 2003), while results from a study in the late 1990s estimated that entrainment at Grand Coulee Dam could account for up to 30% of the total mortality of the stocked fish (LeCaire 1999).
To address the entrainment loss, the Bonneville Power Administration commissioned a study to determine if fish would avoid areas illuminated by strobe lights in the forebay of the third powerplant. From 2002 through 2004, six strobe lights were suspended in the center of the opening to the third powerplant forebay during summer months. Results from those studies indicated that fish appeared to be attracted to the illuminated area but only at night and when flow conditions within the third powerplant forebay were minimal (Johnson et al. 2005). However, small but consistent results from these studies indicated that under high flow conditions, fish might be avoiding the lights. This study was designed to examine whether, under high flow conditions near the penstock openings, fish would avoid the lighted regions. Splitbeam transducers were deployed to monitor fish approaching the penstock openings either from in front of the trash racks or moving down the dam behind the trash racks. The results of the study provide insight into the current level of entrainment and how fish respond to strobe lights under high flow conditions.
With respect to entrainment, fewer than 100 fish (or less than 1% of the fish detected in front of the trash racks) were detected behind the trash racks at the three turbine units over the course of the study. All these fish were detected when the turbine units were operating and, from their trajectory, most likely would have been entrained through the penstock. This suggests that losses due to entrainment may be less than previously thought, or that entrainment has decreased since 1999. Factors possibly contributing to the differences in entrainment estimates between the earlier study (1996-1999) and ours include the time of year, the specific penstock entrance(s) that were monitored, dam operations, and differences in the monitoring equipment.
The sampling period in 2005 corresponded to the months with some of the highest entrainment rates in 1996 (August), 1998 (August), and 1999 (July). Also, during our previous strobe light studies in 2002 through 2004, the highest number of fish at the entrance to the third powerplant forebay were detected at the end of July and beginning of August. This year, in front of the turbine units, fish counts were the highest in August (Figure 5.1). The peak count may have occurred slightly earlier in late July this year, but numbers did not decrease appreciably until October.
Entrainment differences could stem also from bias associated with the units sampled and dam operations. The highest entrainment during the 1996-1999 study occurred in Units 23 and 24, which are at the downstream end of the forebay. We chose units in the middle of the forebay to avoid the high noise areas at the entrance to the forebay and at the downstream end, which would make detection of targets more difficult. Unit 21 was selected as our primary test unit because of planned continuous use of that

Strobe Light Deterrent Efficacy Test 2005 Final Report
5.2
0
100
200
300
400
30-Jul 13-Aug 27-Aug 10-Sep 24-Sep 8-Oct
2-Day Blocks
Tota
l Cou
nts
Figure 5.1. Total Number of Fish Detected Within a Two-Day Block Between July 30, 2005, and October 8, 2005, in Front of the Trash Racks at Turbine Units 20, 21, and 22 at Grand Coulee Dam
unit during our sample period. Also, Grand Coulee Dam operations prioritized Unit 21 during our sample period, so that the only time the unit was not operating was during low demand periods, usually at night from midnight to 4:00 a.m. Operations for the units on either side of Unit 21 were somewhat more variable. Unit 20 was down until August 3, while Unit 22 was taken off-line in September for planned maintenance. The specific operational configuration could have affected the distribution of fish in proximity to the trash racks and thus their exposure to entrainment.
Another factor that could affect the estimates of entrainment is the monitoring equipment. The 1996-1999 entrainment study was conducted using single-beam hydroacoustics. Single-beam hydroacoustics lack the ability to determine target direction and size. If fish were swimming back and forth through the acoustic beam, a single fish might be counted multiple times without the operator knowing. This could have resulted in a bias toward larger counts, particularly if it was assumed that the fish were passing through the trash racks and into the penstock when they were not. Further, because size cannot be determined, objects other than fish could have been counted such as debris entrained in the flow. This may have been the reason for high counts at Units 23 and 24 where large amounts of floating debris were often observed. The floating debris eventually disappeared, presumably by sinking and being passed through the turbines or resting on the bottom. Splitbeam hydroacoustics were used in the current study and allow us to determine both fish trajectory and size. From these data, it is apparent that fish detected in front of the trash rack were generally swimming parallel to the face of the dam, while those inside the trash rack were swimming down toward the penstock opening. Target size data also correspond to the size of fish that would be released from upstream net pens (Johnson et al. 2005).
Entrainment was defined in the 1996-1999 study as “…those fish, spatially and temporally weighted fish, observed adjacent to the turbine intake” (LeCaire 1999). It was assumed that fish present in front of

Strobe Light Deterrent Efficacy Test 2005 Final Report
5.3
the trash racks were entrained because velocities in that region could potentially exceed a fish’s escape velocity. Velocities at and around the penstock for Unit 21 were modeled in this study for peak discharge conditions, which were 706 m3/s for Unit 21 (Appendix C). From the model, water velocities were approximately 1.0 to 1.5 m/s in front of the trash rack (Figures 5.2 and 5.3). Velocities increase rapidly inside the trash rack, quickly exceeding 6 m/s. Salmon smolts are able to swim at speeds of 0.76 to 1.64 m/s for 2 to 10 minutes (Peake and McKinley 1998). Burst swimming modes for rainbow trout range from 1.75 to 3.5 m/s(a) for fish from 15 to 30 cm in length. Figure 5.4 shows the simulated water velocities in the areas ensonified by the splitbeam transducers. Comparing Figure 5.4 to Figure 4.5, we see that when the lights are off, fish are swimming parallel to the face of the dam while the water is flowing toward the penstock openings. Thus, it appears that while velocities within the trash rack do exceed escape velocities for salmonid species, water velocities in front of the trash racks are below critical velocities (Clay 1995).
Figure 5.2. Water Velocities Modeled at Turbine Unit 21 Using Computational Fluid Dynamics Model for Conditions on August 20, 2005. This is a vertical slice through the center of the penstock opening.
Assuming that kokanee and rainbow trout can escape the velocities outside the trash rack, then the most vulnerable time might be when the turbine unit is in condense mode (idle) and is suddenly brought on-line. At this time, any fish that may have strayed inside the trash rack would be subjected to velocities well beyond critical swimming velocities and swept into the penstock. Our data suggest that this would not likely have resulted in large numbers of fish being entrained because no fish were present inside the trash rack at night when the unit was down, regardless of the strobe lights being on or off.
(a) http://www.fishbase.org/Physiology/SpeedList.cfm?ID=239&GenusName=Oncorhynchus&SpeciesName=mykiss

Strobe Light Deterrent Efficacy Test 2005 Final Report
5.4
Figure 5.3. Water Velocities at Center of Turbine Unit 21 Penstock Opening Modeled Using a Computational Fluid Dynamics Model
Figure 5.4. Simulated Water Velocities Within Areas Ensonified by Splitbeam Transducers Positioned in Front of and Behind the Trash Rack at Turbine Unit 21. Flows simulated for conditions on August 20, 2005.
Strobe Light Deterrent Efficacy Test 2005 Final Report
5.5
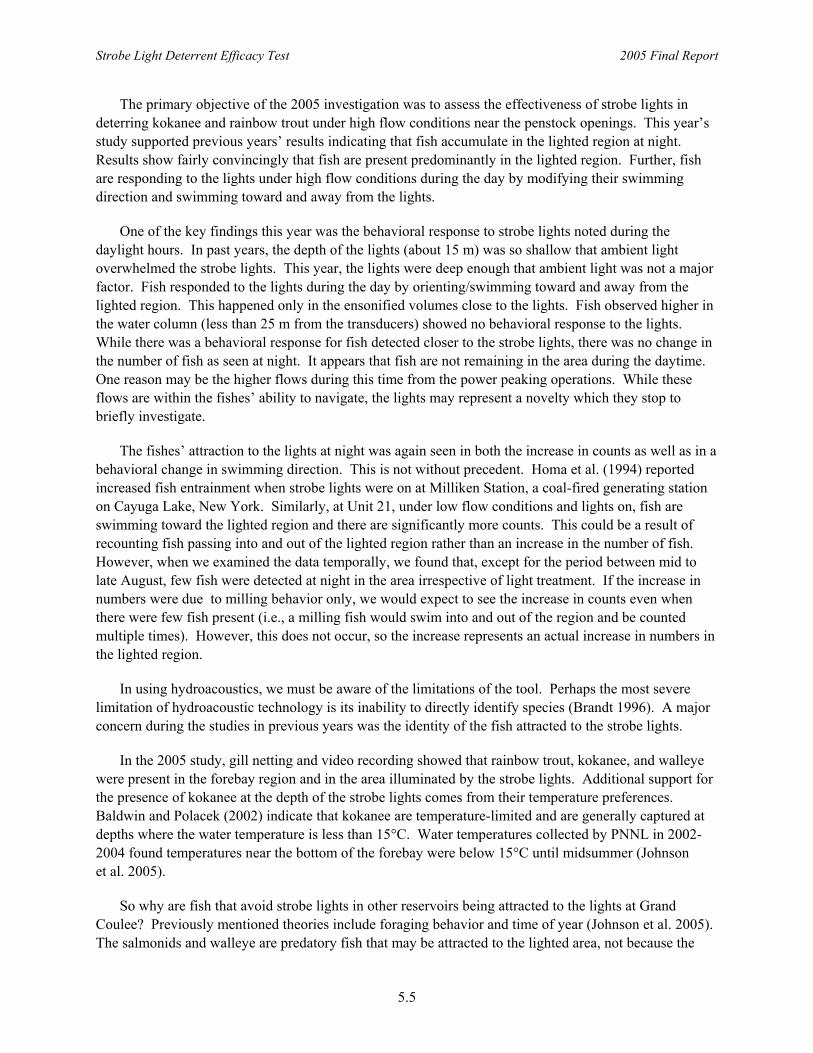
The primary objective of the 2005 investigation was to assess the effectiveness of strobe lights in deterring kokanee and rainbow trout under high flow conditions near the penstock openings. This year’s study supported previous years’ results indicating that fish accumulate in the lighted region at night. Results show fairly convincingly that fish are present predominantly in the lighted region. Further, fish are responding to the lights under high flow conditions during the day by modifying their swimming direction and swimming toward and away from the lights.
One of the key findings this year was the behavioral response to strobe lights noted during the daylight hours. In past years, the depth of the lights (about 15 m) was so shallow that ambient light overwhelmed the strobe lights. This year, the lights were deep enough that ambient light was not a major factor. Fish responded to the lights during the day by orienting/swimming toward and away from the lighted region. This happened only in the ensonified volumes close to the lights. Fish observed higher in the water column (less than 25 m from the transducers) showed no behavioral response to the lights. While there was a behavioral response for fish detected closer to the strobe lights, there was no change in the number of fish as seen at night. It appears that fish are not remaining in the area during the daytime. One reason may be the higher flows during this time from the power peaking operations. While these flows are within the fishes’ ability to navigate, the lights may represent a novelty which they stop to briefly investigate.
The fishes’ attraction to the lights at night was again seen in both the increase in counts as well as in a behavioral change in swimming direction. This is not without precedent. Homa et al. (1994) reported increased fish entrainment when strobe lights were on at Milliken Station, a coal-fired generating station on Cayuga Lake, New York. Similarly, at Unit 21, under low flow conditions and lights on, fish are swimming toward the lighted region and there are significantly more counts. This could be a result of recounting fish passing into and out of the lighted region rather than an increase in the number of fish. However, when we examined the data temporally, we found that, except for the period between mid to late August, few fish were detected at night in the area irrespective of light treatment. If the increase in numbers were due to milling behavior only, we would expect to see the increase in counts even when there were few fish present (i.e., a milling fish would swim into and out of the region and be counted multiple times). However, this does not occur, so the increase represents an actual increase in numbers in the lighted region.
In using hydroacoustics, we must be aware of the limitations of the tool. Perhaps the most severe limitation of hydroacoustic technology is its inability to directly identify species (Brandt 1996). A major concern during the studies in previous years was the identity of the fish attracted to the strobe lights.
In the 2005 study, gill netting and video recording showed that rainbow trout, kokanee, and walleye were present in the forebay region and in the area illuminated by the strobe lights. Additional support for the presence of kokanee at the depth of the strobe lights comes from their temperature preferences. Baldwin and Polacek (2002) indicate that kokanee are temperature-limited and are generally captured at depths where the water temperature is less than 15°C. Water temperatures collected by PNNL in 2002-2004 found temperatures near the bottom of the forebay were below 15°C until midsummer (Johnson et al. 2005).
So why are fish that avoid strobe lights in other reservoirs being attracted to the lights at Grand Coulee? Previously mentioned theories include foraging behavior and time of year (Johnson et al. 2005). The salmonids and walleye are predatory fish that may be attracted to the lighted area, not because the

Strobe Light Deterrent Efficacy Test 2005 Final Report
5.6
lights themselves are attractive but because they aid in the search for food. It is not unreasonable to assume that fish use the illuminated area for predation and eventually might become habituated to the flashing. Koski et al. (2003) found young-of-the-year kokanee were more selective in feeding on Daphnia at higher light levels. Additionally, there is anecdotal evidence that kokanee under some conditions are attracted to lights (Johnson et al. 2005). Maiolie found entrainment at Dworshak occurred primarily in the late winter and early spring flooding period when kokanee were concentrated near the dam (Maiolie 2001). The density of fish at Dworshak was also much greater than at Grand Coulee. Our highest counts were less than 10 fish in an hour. So there may be a seasonal component to the response to strobe lights as well as possibly a density dependency.
After five years, it is apparent that fish are attracted to strobe lights in the third powerplant forebay of Grand Coulee Dam. In addition, it appears that few fish were entrained at Units 20, 21, and 22, so the reasons for the low returns for the kokanee fishery are still unknown. One possible explanation may be an increase in the number of predatory fish. Walleye is one of the most abundant fish in Lake Roosevelt and has been found to preferentially consume salmonids (Cichosz et al. 1999). Thus, enhancing the kokanee fishery in Lake Roosevelt may involve managing predatory fish in the lake rather than making physical modifications to the environment near Grand Coulee Dam.

Strobe Light Deterrent Efficacy Test 2005 Final Report
6.1
6.0 Conclusions and Recommendations
The conclusions and recommendations presented in this section are the result of primarily the 2005 study, although reference is made also to data from previous study years (2002 through 2004) at the Grand Coulee Dam third powerplant.
6.1 Conclusions
The 2005 study resulted in four primary conclusions:
• The low number of fish detected inside the trash racks suggests that entrainment rates may have been substantially lower than reported earlier or that fish moved through the system at a different time of the year. (Tables 4.1 and 4.2)
• As in previous years, fish were attracted to the regions illuminated by the strobe lights at night. (Figure 4.2)
• Fish responded to strobe lights during daylight hours at the third powerplant by swimming toward the lights. (Figure 4.4)
• Salmonids and walleye appeared to be attracted to the strobe lights. (Figure 4.8 and Table 4.5)
6.2 Recommendations
Information obtained during this study supports the following recommendations:
Strobe lights should not be used at Grand Coulee Dam to deter fish from entering the third powerplant forebay or penstocks. In 2004, there was an indication that the combination of flow and strobe lights might have a deterrent effect on fish within a 10-m range of the lights. This was the driving assumption that motivated the 2005 study and, in particular, mounting the strobe lights on the trash rack of Unit 21. However, despite the presence of flow, fish continued to accumulate in the area lit by the strobe lights as they did in the open forebay, but in a more dangerous location―directly in front of an operating turbine unit. Salmonids were among the fish detected by video surveillance in proximity to the strobe lights. Although fish accumulated in front of the trash racks when the strobe lights were on, most did not appear to enter the high-velocity region inside the trash racks. Nor did the fish enter the trash racks when the lights were off. Because the fish were higher in the water column and fewer in number when the strobe lights were off, the vulnerability of the population to entrainment would be assumed to be less. For this reason, we find the use of strobe lights as a deterrent to entrainment to be lacking for the population that we sampled in 2005. An important caveat to this finding is that we may not have sampled the population that represented the spring hatchery releases.
Entrainment rates at Grand Coulee Dam continue to be a key uncertainty that requires research effort and resolution. Past evidence suggests that entrainment is a problem at Grand Coulee Dam and particularly at the third powerplant (LeCaire 1999). During our sampling period (July through September 2005), we saw very little evidence of entrainment at Unit 21 or the adjacent units (20 and 22), even though earlier hydroacoustic monitoring had estimated high entrainment during this period.
Strobe Light Deterrent Efficacy Test 2005 Final Report
6.2
Specifically the number of fish detected inside the trash racks at Units 20, 21, and 22, represented less than 1% of the fish detected in front of the trash racks. Our data suggest that low velocities outside the trash racks were generally manageable by fish within the size range that we were targeting, which means that they could easily avoid entering the trash racks. A fish would need to enter the trash racks and experience the accelerating flows downstream of the trash racks in excess of 1.8 m/s to be entrained into the penstock, or be inside the trash racks when the generation flows are initiated.
A direct capture method of sampling the entrainment at Grand Coulee Dam would provide the information necessary to substantiate and quantify the entrainment problem. A preferred method for direct capture would be to position nets at the exits of the draft tubes. However, this is not considered a workable deployment because of the exceedingly high discharge rates (ranging between 20 and 25 kcfs) at the third powerplant outlets. A viable alternative is to sample the exit channel below the highway bridge just downstream of the main tailrace area. Using the bridge structure as an anchor, modified (commercial style) trawl nets could be fished on a tram system to capture fish passed through the dam yielding not only an index of entrainment, but also species composition. This type of sampling has been successfully used at Richard B. Russell Dam on the Savannah River (Schilt et al. 1995). Finally, hydroacoustics could be used to verify entrainment at the third powerplant by deploying the actuator technique we developed in 2005. The transducer deployment was straightforward and could be accomplished during periods of minimal or no discharge such as occur regularly at night. This would minimize impact to dam operations. The splitbeam sampling approach downstream of the trash racks provides improved information and a preferred technological embodiment when coupled with hard sampling such as a downstream netting operation for validation and species composition.
6.3 Areas for Future Research
In addition to the above recommendations, research in the following areas could provide useful data for managing the kokanee fishery in Lake Roosevelt.
Additional information is needed to understand the movements of post-release hatchery kokanee and rainbow trout and associated predation rates during their early life history in Lake Roosevelt. Conjunctive to the entrainment metrics, it is important to know when and how many fish ultimately arrive at the dam and become susceptible to entrainment. Emerging technologies using very small sonic tags capable of detecting a predation event would yield invaluable information about the movements of post-release hatchery kokanee and rainbow trout. By detecting the occurrence of a predation event, we also would gain valuable information about predator behavior and predation rates. All of these factors have far-reaching management implications for the hatchery stocks of kokanee and rainbow trout released into Lake Roosevelt.
The potential of strobe lights to guide anadromous juvenile fish to preferred outlets at Grand Coulee Dam should be evaluated. Our studies have substantiated that lights alter fish behavior at the Grand Coulee Dam third powerplant forebay, whether in the forebay at large or near the dam. The behaviors that we observed could be used to guide migrant fish to a preferred outlet. First, however, the outlets of Grand Coulee Dam need to be characterized for fish passage, and flows need to be modeled to determine the optimum flow net for fish attraction at selected intakes. If plans to reintroduce anadromous fish above Grand Coulee Dam should become reality, it will be important to characterize the nature of the downstream passage routes to ensure safe passage for out-migrants.

Strobe Light Deterrent Efficacy Test 2005 Final Report
6.3
The fish-attractant nature of constant light as used on the lower Columbia and Snake River dams to guide fish into passage bypass channels might be used also at Grand Coulee to guide fish to a “preferred” intake structure that is operated to maximize safe passage for downstream migrating fish. This could be a very cost-effective guidance technique for deep water intakes such as those at Grand Coulee Dam where purposeful entrainment would provide safe passage through the project. Therefore, we recommend a study to characterize a range of turbine operations and their effects on fish passing through Francis turbines under varying operational configurations or scenarios. The use of constant light to attract fish to a preferred unit should be evaluated also.
Finally, a detailed hydraulic model should be developed to test varying operational scenarios relative to fish passage. A possible scenario for downstream fish passage might be to designate Units 19 and 24, for example, as fish passage units during the abbreviated out-migration season, with each lighted to attract fish and pass them safely downstream. Permanently installed hydroacoustic monitoring instruments would be used to determine when a large portion of the run had passed safely, at which time normal operations would be resumed.

Strobe Light Deterrent Efficacy Test 2005 Final Report
7.1
7.0 References
Baldwin CM and MC Polacek. 2002. Evaluation of Limiting Factors for Stocked Kokanee and Rainbow Trout in Lake Roosevelt, Washington, 1999. FPA 04-03, Washington Department of Fish and Wildlife, Spokane, Washington.
Baldwin CM, JG McLellan, MC Polacek, and K Underwood. 2003. “Walleye Predation on Hatchery Releases of Kokanees and Rainbow Trout in Lake Roosevelt, Washington.” North American Journal of Fisheries Management 23(3):660–676.
Brandt SB. 1996. “Acoustic Assessment of Fish Abundance and Distribution.” In Fisheries Techniques. Second Edition, BR Murphy and DW Willis (eds.), pp. 385–432. American Fisheries Society, Bethesda, Maryland.
Cichosz TA, JP Shields, and KD Underwood. 1999. Lake Roosevelt Monitoring/Data Collection Program – 1997 Annual Report. DOE/BP-32148-3, Bonneville Power Administration, Portland, Oregon.
Clay CH. 1995. Design of Fishways and Other Fish Facilities. CRC Press, Boca Raton, Florida.
Fisher NI. 1993. Statistical Analysis of Circular Data. Cambridge Press, London, England.
Homa JJ, M Stafford-Glase, and ME Conners. 1994. An Evaluation of the Effectiveness of the Strobe Light Deterrent System at Milliken Station on Cayuga Lake, Tompkins County, New York (Dec. 1993 and April through August 1994). Report prepared for New York State Electric and Gas Corporation, Binghamton, New York.
Johnson RL, MA Simmons, CA McKinstry, CS Simmons, CB Cook, RS Brown, DK Tano, SL Thorsten, DM Faber, R LeCaire, and S Francis. 2005. Strobe Light Deterrent Efficacy Test and Fish Behavior Determination at Grand Coulee Dam Third Powerplant Forebay. PNNL-15007, Pacific Northwest National Laboratory, Richland, Washington.
Koski ML, BM Johnson, and TM Stecklein. 2003. “Effects of Light on Size-Selectivity of Kokanee Feeding on Daphnia.” Journal of Fish Biology 62:1456-1461.
LeCaire R. 1999. Chief Joseph Kokanee Enhancement Project, 1999 Annual Report and Final Report on Entrainment at Grand Coulee Dam 96-99. Colville Confederated Tribes Fish and Wildlife Department. Prepared for the U.S. Department of Energy, Bonneville Power Administration, Portland, Oregon.
Maiolie MA, B Harryman, and B Ament. 2001. “Response of Free-Ranging Kokanee to Strobe Lights.” In Behavioral Technologies for Fish Guidance, CC Coutant (ed.), pp. 27-35. American Fisheries Society, Symposium 26, Bethesda, Maryland.
Peake S and RS McKinley. 1998. “A Re-Evaluation of Swimming Performance in Juvenile Salmonids Relative to Downstream Migration.” Canadian Journal of Fisheries and Aquatic Sciences 55:682-687.

Strobe Light Deterrent Efficacy Test 2005 Final Report
7.2
Schilt CR, PD Vu, and JM Nestler. 1995. “Learning the Ropes at Richard B. Russell Dam: Net Systems for Medium Head Hydropower Pumpback and Generation Fish Sampling.” In Waterpower ‘95 - Proceedings of the International Conference on Hydropower, JJ Cassidy (ed.). American Society of Civil Engineers, New York.
Simmons MA, RL Johnson, CA McKinstry, CS Simmons, CB Cook, RS Brown, DK Tano, SL Thorsten, DM Faber, R LeCaire, and S Francis. 2004. Strobe Light Deterrent Efficacy Test and Fish Behavior Determination at Grand Coulee Dam Third Powerplant Forebay. PNNL-14512, Pacific Northwest National Laboratory, Richland, Washington.
Sullivan C. 2000. Final Report on Fish Entrainment at Grand Coulee Dam 1996-1999. Prepared for Confederated Tribes of the Colville Reservation, Fish and Wildlife Department, Nespelem, Washington.

Strobe Light Deterrent Efficacy Test 2005 Final Report
Appendix A
Environmental Conditions at Grand Coulee Dam

Strobe Light Deterrent Efficacy Test 2005 Final Report
A.1
Appendix A
Environmental Conditions at Grand Coulee Dam
Environmental factors at the time of the study play a role in data processing and interpretation and are important for year-to-year comparisons. The river conditions (water elevation and turbidity) can affect fish distribution (vertical and spatial), immigration, and visual discernment (Levy 1990; Merigoux and Ponton 1999).
A.1 Forebay Elevation
Forebay elevation data in front of the left powerplant were obtained from the U.S. Department of the Interior Bureau of Reclamation. Over the 2005 field season, the water level in the forebay changed approximately 3 m, starting at 392 m in mid July, declining to 389 m in early September, and then rising back to 392 m by the end of the study in mid October (Figure A.1).
380
385
390
395
7/22 7/29 8/5 8/12 8/19 8/26 9/2 9/9 9/16 9/23 9/30 10/7 10/14
Fore
bay
Elev
atio
n (m
)
Figure A.1. Forebay Elevation in Front of the Left Powerplant During the 2005 Field Season
A.2 Turbidity
Turbidity can affect the distribution of fish both vertically and spatially (Swenson 1978; Matthews 1984). Surface turbidity measurements were taken weekly starting in August. A Van Doren bottle was lowered from the deck of the dam near turbine unit 21. Three replicate grab samples were analyzed using a Hach Model 2100P Portable Turbidimeter.(a)
(a) Hach Company, Loveland, Colorado.

Strobe Light Deterrent Efficacy Test 2005 Final Report
A.2
Surface turbidity measurements ranged from 0.7 nephelometric turbidity unit (NTU) in early August to 2.0 NTU by mid-September. Values then declined through the end of the month. These values are higher than those measured in 2001 and 2003 at the entrance to the forebay (Figure A.2). The difference could be related to where the measurement were taken―center of the forebay in previous study years—compared to next to the dam in 2005. Another factor may be the time of year; no measurements were made in September in 2001 and 2003. Turbidity values in early August 2005 were similar to those measured in late July in 2001 and 2003. An increase in turbidity in late summer may be related to changes in reservoir levels and/or increased phyto- and zooplankton production, which generally peaks in August within the reservoir (Lee et al. 2003). No adverse physiological effects have been noted in salmonids at turbidity levels less than 10 NTU (Bash et al. 2001). However, turbidity as low as 3 NTU was found to affect the response of lake trout to prey under low light levels (Vogel and Beauchamp 1999). In addition, increased turbidity would affect the visible range of the strobe lights.
0
1
2
3
6/17 7/1 7/15 7/29 8/12 8/26 9/9 9/23 10/7
Nep
hlom
etric
Tur
bidi
ty U
nit 2001 2003 2005
Figure A.2. Surface Turbidity Levels at Grand Coulee Dam for Three Study Years (June 30 through August 1, 2001; June 20 through July 25, 2003; August 6 through September 27, 2005)
A.3 References
Bash J, C Berman, and S Bolton. 2001. Effects of Turbidity and Suspended Solids on Salmonids. WA-RD 526.1, Washington State Department of Transportation, Seattle, Washington.
Lee C, B Scofield, D Pavik, and K Fields. 2003. Lake Roosevelt Fisheries Evaluation Program, 2000 Annual Report. http://www.lrf.org/Env/EnvReports/LRFEP2000AnnRep-Lee.PDF
Levy D. 1990. “Sensory Mechanism and Selective Advantage for Diel Vertical Migration in Juvenile Sockeye Salmon, Oncorhynchus nerka.” Canadian Journal of Fisheries and Aquatic Sciences 47:1796-1802.
Matthews WJ. 1984. “Influence of Turbid Inflows on Vertical Distribution of Larval Shad and Freshwater Drum.” Transactions of the American Fisheries Society 113(2):192-198.
Strobe Light Deterrent Efficacy Test 2005 Final Report
A.3
Merigoux S and D Ponton. 1999. “Spatio-Temporal Distribution of Young Fish in Tributaries of Natural and Flow-Regulated Sections of a Neotropical River in French Guiana.” Freshwater Biology 42(1):177-198.
Swenson WA. 1978. Influence of Turbidity on Fish Abundance in Western Lake Superior. U.S. Envi-ronmental Protection Agency, Duluth, Minnesota.
Vogel JL and DA Beauchamp. 1999. “Effects of Light, Prey Size, and Turbidity on Reaction Distances of Lake Trout (Salvelinus namaycush) to Salmonid Prey.” Canadian Journal of Fisheries and Aquatic Sciences 56:1293-1297.

Strobe Light Deterrent Efficacy Test 2005 Final Report
Appendix B
Hydroacoustic System Calibration

Strobe Light Deterrent Efficacy Test 2005 Final Report
B.1
Appendix B
Hydroacoustic System Calibration
Pacific Northwest National Laboratory (PNNL) has a formal quality assurance (QA) program that provides the structure within the Laboratory for the development and delivery of quality products. The QA program is based upon the basic requirements as defined in U.S. Department of Energy Order 414.1A, Quality Assurance, and 10 CFR 830 Subpart A, Energy/Nuclear Safety Management/Quality Assurance Requirements.
PNNL has chosen to implement the requirements of 414.1A and 10 CFR 830 Subpart A by inte-grating them into the Laboratory's management systems and daily operating processes. The Quality Management System administers the QA program with a focus on integrating the four basic quality principles (plan, perform, assess, and improve) into the work of PNNL. The procedures necessary to implement the requirements have not been consolidated into a single, stand-alone QA manual but are documented throughout PNNL’s Standards-Based Management System.
The PNNL formal QA program has been designed to ensure that appropriate technical and adminis-trative controls are applied to work activities commensurate with the risk associated with the Laboratory’s responsibility for health and safety, environmental protection, reliability and continuity of operation, and acquisition of valid research and development data. Work at the Laboratory is managed through a hierarchy of governing documents—policies, standards, management systems, and subject areas with procedures and guidelines.
The hydroacoustic equipment manufacturer, Precision Acoustic Systems, Seattle, Washington, performed all hydroacoustic system calibrations. Precision Acoustic Systems is an authorized calibration facility subject to triennial audit by the PNNL QA program.
This appendix lists results for calibration completed on November 1, 2005. A pre-season calibration also was completed on May 28, 2005, but was not used for data collection. When the system was deployed near the entrance to turbine unit 21, we discovered a disproportionate amount of noise associated with that region. The noise problem was mitigated by removing the 10 degree lenses that had been used in past sampling at Grand Coulee Dam, which rendered the pre-season calibration useless. Subsequently, we performed an interim adjustment to the pre-season calibration values by looking at historical calibration values for the transducers prior to the installation of the lenses. The post-season calibration listed in this appendix was then compared to the pre-season calibration to assure that the data collected during the field season was within acceptable limits for our evaluation. The comparison of the two calibrations is listed at the end of the calibration data.

Strobe Light Deterrent Efficacy Test 2005 Final Report
B.2
Date: 4/3/2003 Calibration: Split Beam System for Grand Coulee Dam
System Hookup for All Calibrations Sounder PAS-103-29 to: 60' Breakout Box/Cable PAS-01-6BS-60-100 to: Local Surface Mux PAS-203-21 Port #0 to: 157' 4-Chan. Wet/MS Xducer Cable PAS-01-4D-157-95 to: Xducer PAS-420-SPB-438 Port #1 to: 157' 4-Chan. Wet/MS Xducer Cable PAS-01-4D-157-96 to: Xducer PAS-420-SPB-447 Port #2 to: 157' 4-Chan. Wet/MS Xducer Cable PAS-01-4D-157-97 to: Xducer PAS-420-SPB-449 Port #3 to: 6-Channel Breakout Cable PAS-02-6D-17-115 to: Remote UW MUX PAS-203-RU-002 Port #0 to: 470' 4-Chan. Wet/Wet Xducer Cable PAS-05-4D-470-200 to: Xducer PAS-420-SPB-431 Port #1 to: 470' 4-Chan. Wet/Wet Xducer Cable PAS-05-4D-470-201 to: Xducer PAS-420-SPB-432 Port #2 to: 470' 4-Chan. Wet/Wet Xducer Cable PAS-05-4D-470-202 to: Xducer PAS-420-SPB-433 Port #3 to: 470' 4-Chan. Wet/Wet Xducer Cable PAS-05-4D-470-203 to: Xducer PAS-420-SPB-434 Note: The -4dB Static Transmit Power Level was used for all transmit patterns and is the recommended level for Data Collection
Frequency: 420 kHz. Operating Mode: Standard Receiver Gain, L: 10 dB. Bandwidth: 11.49 kHz. Xmit Pulse Width: 0.4 ms. Sounder TVG Start Range: 1.0 m. Gx Measurement Range, Rx: 10 m. Absorbtion Coeff: 0 dB/km. (Off)
Standard Type: PAS Standard Transducer #: 236 Receive Sensitivity of Standard, Ss: -203.44 dBV||uPa Transmit Sensitivity of Standard, Ts: 170.09 dBuPa/Vrms @ 1 meter. Separation Between Transducers, Rs: 3.416 m 20 Log (Rs) = 10.67 dB. Water Temperature: 15.28 deg. C
Calibration Data
Source Level, SL = Vs + 20 Log (Rs) - Ss in dB uPa @ 1 meter Where Vs is the voltage out of the standard in dBV.
Stat Xmit Dyn Xmit Stat Xmit Dyn Xmit Level Level Vs SL Level Level Vs SL
-8 -6 1.11 215.22 -6 -6 3.73 217.84 -7 -6 2.56 216.67 -5 -6 4.57 218.68
Receive Sensitivity, Gx = Vout + 20 Log (Rs) - Ts - Vs in dBV || uPa @ Rx
Where Vs in the voltage drive to the standard transducer in dBV, and Vout is the voltage out of the receiver in dBV.
Receive Sensitivity, G1 = Gx - Gtvg - L in dBV || uPa Referred to 1 meter @ 0 dB Receiver Gain. Where Gtvg = 40 or 20 Log (Rx) = 40.00 dB-40 or 20.00 dB-20
Receiver Output -48 dB Cal Osc Vs Vdet Out Vout-dB Gx G1
Receiver #1, Log Sum Beam, 40 Log (R) 4.001 -24 4.029 80.58 -54.84 -104.84 Receiver #2, X Phase (AC/BD) 2.490 -24 2.525 N/A N/A N/A Receiver #3, Y Phase (AB/CD) 2.512 -24 2.464 N/A N/A N/A

Strobe Light Deterrent Efficacy Test 2005 Final Report
B.3
Splitbeam Conversion Coefficients for Phase to Mechanical Angle and Phase to Beam Pattern Factor All Transducers with Lens #09 (10 deg.) Transducer Axis SAx SAy OAx OAy SBx SBy OBx OBy
434 X 295.7 2052 -118800 2032 434 Y 294.5 2073 -119700 2065 431 X 296.4 2038 -118500 2028 431 Y 290.2 2085 -116600 2079 432 X 298.4 2046 -119700 2041 432 Y 297.8 2043 -119600 2057 433 X 292.7 2033 -115000 2036 433 Y 294.7 2059 -116100 2067 447 X 289.6 2065 -120400 2056 447 Y 288.4 2062 -119600 2068 438 X 299.0 2076 -135900 2058 438 Y 298.0 2014 -134500 2023 449 X 288.5 2046 -121000 2043 449 Y 288.7 2027 -120000 2056

B.4
Strobe Light Deterrent Efficacy Test 2005 Final Report
Xmit
Xmit
Xm
it (P
atte
rns)
Xm
it
Y
Xd
ucer
A
xis
Leve
l V
s S
L Le
vel
Vs
SL
Leve
l V
s S
L Le
vel
Vs
SL
Cal
43
8 X
-8
-
-7
-
-6
3.
51
217.
62
-5
-
2.51
4 43
8 Y
-8
0.10
21
4.21
-7
2.
39
216.
50
-6
3.53
21
7.64
-5
4.
34
218.
45
2.51
4 44
7 X
-8
-0.7
4 21
3.37
-7
0.
09
214.
20
-6
2.25
21
6.36
-5
3.
27
217.
38
2.51
2 44
7 Y
-8
-0.7
5 21
3.36
-7
0.
09
214.
20
-6
2.24
21
6.35
-5
3.
26
217.
37
2.51
2 44
9 X
-8
-0.5
8 21
3.53
-7
1.
02
215.
13
-6
2.38
21
6.49
-5
3.
37
217.
48
2.51
2 44
9 Y
-8
-0.5
9 21
3.52
-7
1.
00
215.
11
-6
2.34
21
6.45
-5
3.
35
217.
46
2.51
2 43
1 X
-8
-6.1
8 20
7.93
-7
-3
.87
210.
24
-6
-1.8
2 21
2.29
-5
-0
.22
213.
89
2.51
1 43
1 Y
-8
-6.2
0 20
7.91
-7
-3
.90
210.
21
-6
-1.8
6 21
2.25
-5
-0
.27
213.
84
2.51
1 43
2 X
-8
-6.3
9 20
7.72
-7
-4
.10
210.
01
-6
-2.0
7 21
2.04
-5
-0
.44
213.
67
2.51
1 43
2 Y
-8
-6.3
6 20
7.75
-7
-4
.02
210.
09
-6
-1.9
7 21
2.14
-5
-0
.38
213.
73
2.51
0 43
3 X
-8
-6.3
3 20
7.78
-7
-3
.92
210.
19
-6
-1.7
9 21
2.32
-5
-0
.14
213.
97
2.51
4 43
3 Y
-8
-6.3
6 20
7.75
-7
-3
.94
210.
17
-6
-1.8
2 21
2.29
-5
-0
.16
213.
95
2.51
4 43
4 X
-8
-6.5
0 20
7.61
-7
-4
.17
209.
94
-6
-2.1
0 21
2.01
-5
-0
.46
213.
65
2.51
4 43
4 Y
-8
-6.5
5 20
7.56
-7
-4
.24
209.
87
-6
-2.1
3 21
1.98
-5
-0
.51
213.
60
2.51
4
Vdet
X Y
-48
dB
X Y
Xduc
er
Axi
s O
ut
G1
Out
O
ut
Cal
C
al
Cal
438
X 4.
027
-104
.88
2.53
2 2.
467
3.99
1 2.
487
2.51
4
43
8 Y
4.02
5 -1
04.9
2 2.
533
2.46
7 3.
991
2.48
7 2.
514
447
X 4.
050
-104
.42
2.52
2 2.
520
4.00
1 2.
490
2.51
2
44
7 Y
4.05
2 -1
04.3
8 2.
522
2.52
0 4.
001
2.49
1 2.
512
449
X 4.
046
-104
.50
2.50
5 2.
479
4.00
1 2.
491
2.51
2
44
9 Y
4.04
6 -1
04.5
0 2.
506
2.47
9 4.
001
2.49
1 2.
512
431
X 3.
978
-105
.86
2.49
2 2.
539
4.00
1 2.
492
2.51
1
43
1 Y
3.97
9 -1
05.8
4 2.
495
2.53
5 4.
001
2.49
3 2.
511
432
X 3.
963
-106
.16
2.50
0 2.
487
4.00
1 2.
493
2.51
1
43
2 Y
3.96
5 -1
06.1
2 2.
511
2.48
7 4.
001
2.49
3 2.
510
433
X 3.
979
-105
.84
2.48
5 2.
516
4.00
1 2.
490
2.51
4
43
3 Y
3.97
7 -1
05.8
8 2.
485
2.51
6 4.
001
2.49
0 2.
514
434
X 3.
967
-106
.08
2.50
5 2.
527
4.00
1 2.
491
2.51
4
43
4 Y
3.96
5 -1
06.1
2 2.
507
2.52
6 4.
001
2.49
1 2.
514

Strobe Light Deterrent Efficacy Test 2005 Final Report
B.5
7/22/2005 Updated 11/1/05 Grand Coulee 2005 CALFRM and System Sensitivity Summary - NO LENSES SL, G1, SA, OA, SB & OB values from previous year calibration (SPB_GC2A.XLS) New Xmit Power Setting of -6 dB. "SL Adjust" compensates for shorter cable lengths in 2005 deployment. Estimated Calibration Results July 2005 Cable Length
Previous SL Date Xducer Axis OA SA Axis OB SB SL/G1 /Current Adjusted
4/13/2002 438 X 2073.00 309.30 X 2053 -125000 215.44 700 219.76 4/13/2002 438 Y 1989.00 309.20 Y 2026 -122800 -107.43 217 4/13/2002 447 X 2059.00 300.00 X 2049 -115600 214.95 700 219.27 4/13/2002 447 Y 2034.00 298.00 Y 2059 -115100 -107.02 217 4/13/2002 449 X 2039.00 297.70 X 2023 -114900 215.07 700 219.39 4/13/2002 449 Y 1992.00 297.00 Y 2041 -115600 -107.03 217 4/13/2002 431 X 2023.00 306.10 X 2008 -120100 214.71 700 216.23 4/13/2002 431 Y 2043.00 301.80 Y 2096 -117500 -108.18 530 4/13/2002 432 X 2030.00 309.10 X 2040 -123700 215.29 700 216.81 4/13/2002 432 Y 2038.00 307.00 Y 2060 -122500 -107.87 530 4/13/2002 433 X 2028.00 301.30 X 2031 -116100 214.69 700 216.21 4/13/2002 433 Y 2050.00 304.50 Y 2057 -117200 -107.89 530 4/13/2002 434 X 2038.00 305.80 X 2017 -121500 215.03 700 216.55 4/13/2002 434 Y 2047.00 304.10 Y 2064 -120700 -107.99 530 Overall System
Response Date Xducer Axis OA SA OB SB SL/G1 Adjustment
4/13/2002 438 X 2076.00 299.00 2058 -135900 217.63 0.40 4/13/2002 438 Y 2014.00 298.00 2023 -134500 -104.90 dB 4/13/2002 447 X 2065.00 289.60 2056 -120400 216.35 -0.30 4/13/2002 447 Y 2062.00 288.40 2068 -119600 -104.40 dB 4/13/2002 449 X 2046.00 288.50 2043 -121000 216.47 -0.39 4/13/2002 449 Y 2027.00 288.70 2056 -120000 -104.50 dB 4/13/2002 431 X 2038.00 296.40 2028 -118500 212.27 -1.63 4/13/2002 431 Y 2085.00 290.20 2079 -116600 -105.85 dB 4/13/2002 432 X 2046.00 298.40 2041 -119700 212.09 -2.99 4/13/2002 432 Y 2043.00 297.80 2057 -119600 -106.14 dB 4/13/2002 433 X 2033.00 292.70 2036 -115000 212.31 -1.87 4/13/2002 433 Y 2059.00 294.70 2067 -116100 -105.86 dB 4/13/2002 434 X 2052.00 295.70 2032 -118800 212.00 -2.66 4/13/2002 434 Y 2073.00 294.50 2065 -119700 -106.10 dB
Notes: 1) The "Updated Calibration Results 10/27/05 & 11/1/05" are the most up-to-date and contain the best calibration information
2) The OA & OB values represent offsets in target positions while the SA & SB values represent scale factors.
3) The differences in Offsets and Scale factors will shift and scale the target positions. The Distance from the transducer to the targets will remain unchanged.
4) The overall System Response Adjustment in dB needs to be added to the target size estimates based on the "Estimated Calibration Results July 2005"

Strobe Light Deterrent Efficacy Test 2005 Final Report
Appendix C
Hydrodynamic Characterization of Velocity Field Within Third Powerplant Forebay

Strobe Light Deterrent Efficacy Test 2005 Final Report
C.1
Appendix C
Hydrodynamic Characterization of Velocity Field Within Third Powerplant Forebay
A computational fluid dynamics (CFD) model was used to simulate the three-dimensional velocity field within the third powerplant forebay at Grand Coulee Dam. The model, Flow-3D is a commercial software package supported through Flow Science Inc. Flow-3D uses the finite volume method to solve the three-dimensional Reynolds-averaged Navier-Stokes (RANS) equations.
The date for the simulation was based on when the maximum number of fish were detected, which occurred between mid to late August. From that period, flow conditions for August 20, 2005, between 1300 and 1700 hours were selected (Table C.1). Water temperature was not measured during 2005, so water temperatures from August 16 and 17, 2004, were used in the model (Table C.2).
Simulations focused on four elevations: 343 m at the bottom of the penstock opening, 348 m near the center of the opening, 355 m at the top of the opening, and 365 m, the depth of the splitbeam transducers aimed outside the trash racks (Figure 2.5). Results from the simulations are displayed in Figures C.1 through C.9. Figure C.1 is a side view, showing modeled flows in front of the trash racks and into the turbine unit. Flows inside the turbine units were truncated to 3 m/s to provide more detail of the flows in front of the trash rack. Figures C.2 through C.5 are top views of the modeled flow vectors at the four elevations. Again, only flows between 0 and 3 m/s are shown. Flows at the elevation of the transducers (365 m, Figure C.2) are less than 1 m/s. From the top of the turbine intake (Figure C.3) to the bottom (Figure C.5), flows rapidly accelerate across the trash rack to the turbine opening, going from approximately 1 m/s to more than 3 m/s. Figures C.6 through C.9 illustrate the modeled water velocities within the third powerplant forebay at four elevations. Note the change in velocity scale for these figures. Two areas are of interest in these figures. The first is the high flow area (>1 m/s) where the water swings around the dam into the forebay. High flows in this area are evident at all elevations and are also noticeable at the water surface. The other area of interest is the downstream end of the forebay where slack water (velocities <0.25 m/s) is evident at all elevations. This is also the region where debris accumulates.
Table C.1. Average Elevation and Discharge, Third Powerplant at Grand Coulee for August 20, 2005, Between 1300 and 1700 Hours
Elevation (m)
Turbine 19 (m3/s)
Turbine 20 (m3/s)
Turbine 21 (m3/s)
Turbine 22 (m3/s)
Turbine 23 (m3/s)
Turbine 24 (m3/s)
390.5 703.5 688.9 705.6 780.1 0.0 776.0

Strobe Light Deterrent Efficacy Test 2005 Final Report
C.2
Table C.2. Water Temperature Profile from 2004 Used in Computational Fluid Dynamics Model
Depth Range Temperature
0 to 10 m 24.0°C 10 to 20 m 21.5°C 20 to 40 m 20.0°C
>40 m 19.0°C
Figure C.1. CFD Model Results for August 20, 2005, between 1300 and 1700 Hours at Turbine Unit 21, Third Powerplant, Grand Coulee Dam. Black vertical bars are the trash rack.

Strobe Light Deterrent Efficacy Test 2005 Final Report
C.3
Figure C.2. Top View of Turbine Unit 21, Third Powerplant, Grand Coulee Dam, at Elevation 365 m Showing Modeled Water Velocities for August 20, 2005

Strobe Light Deterrent Efficacy Test 2005 Final Report
C.4
Figure C.3. Top View of Turbine Unit 21, Third Powerplant, Grand Coulee Dam, at Elevation 355 m (top of penstock opening) Showing Modeled Water Velocities for August 20, 2005

Strobe Light Deterrent Efficacy Test 2005 Final Report
C.5
Figure C.4. Top View of Turbine Unit 21, Third Powerplant, Grand Coulee Dam, at Elevation 348 m (center of penstock opening) Showing Modeled Water Velocities for August 20, 2005
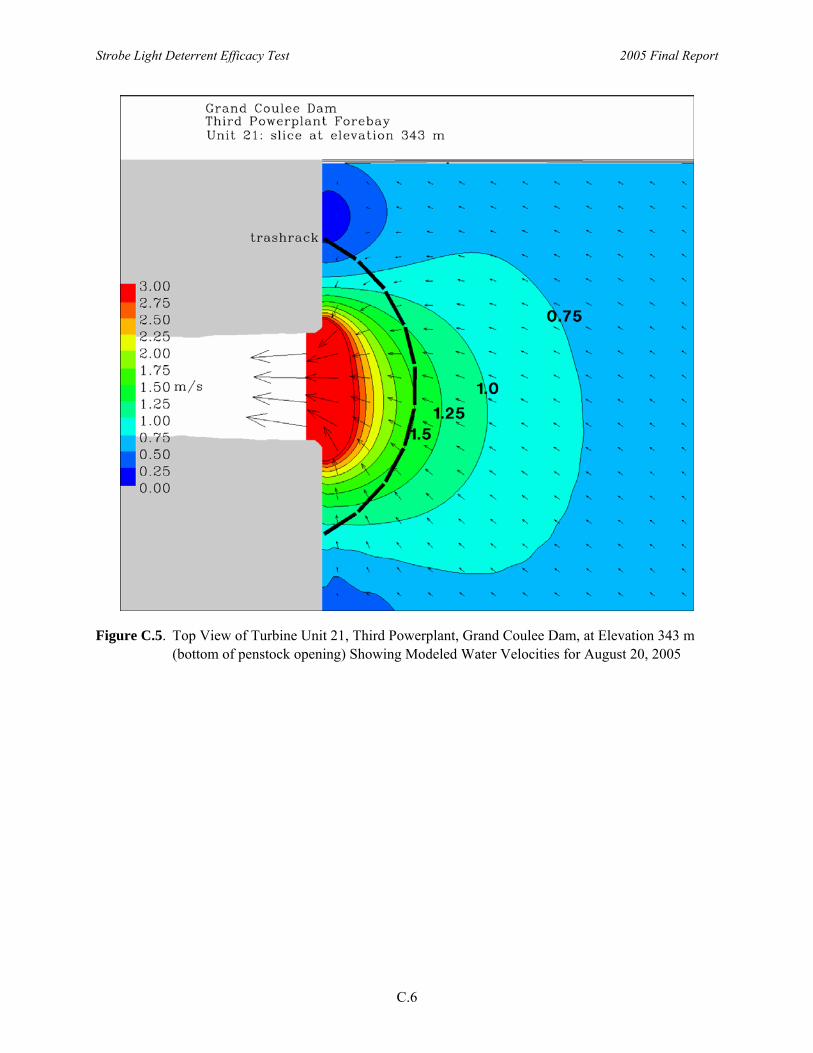
Strobe Light Deterrent Efficacy Test 2005 Final Report
C.6
Figure C.5. Top View of Turbine Unit 21, Third Powerplant, Grand Coulee Dam, at Elevation 343 m (bottom of penstock opening) Showing Modeled Water Velocities for August 20, 2005
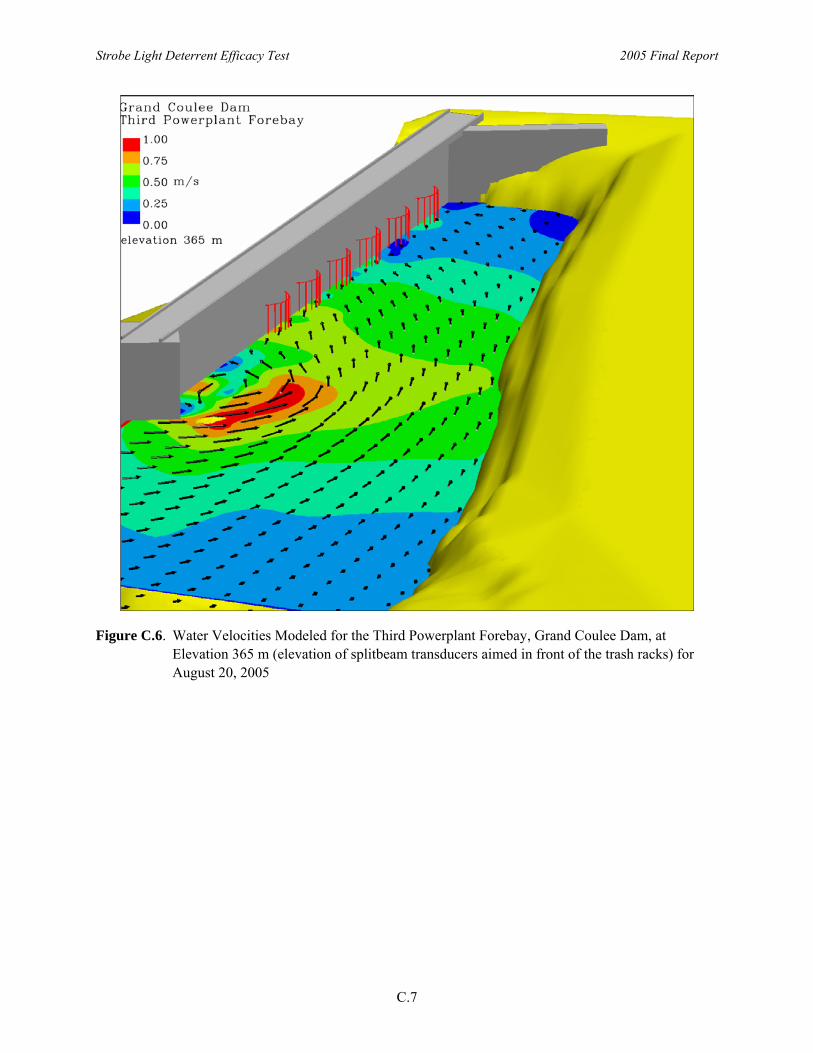
Strobe Light Deterrent Efficacy Test 2005 Final Report
C.7
Figure C.6. Water Velocities Modeled for the Third Powerplant Forebay, Grand Coulee Dam, at Elevation 365 m (elevation of splitbeam transducers aimed in front of the trash racks) for August 20, 2005
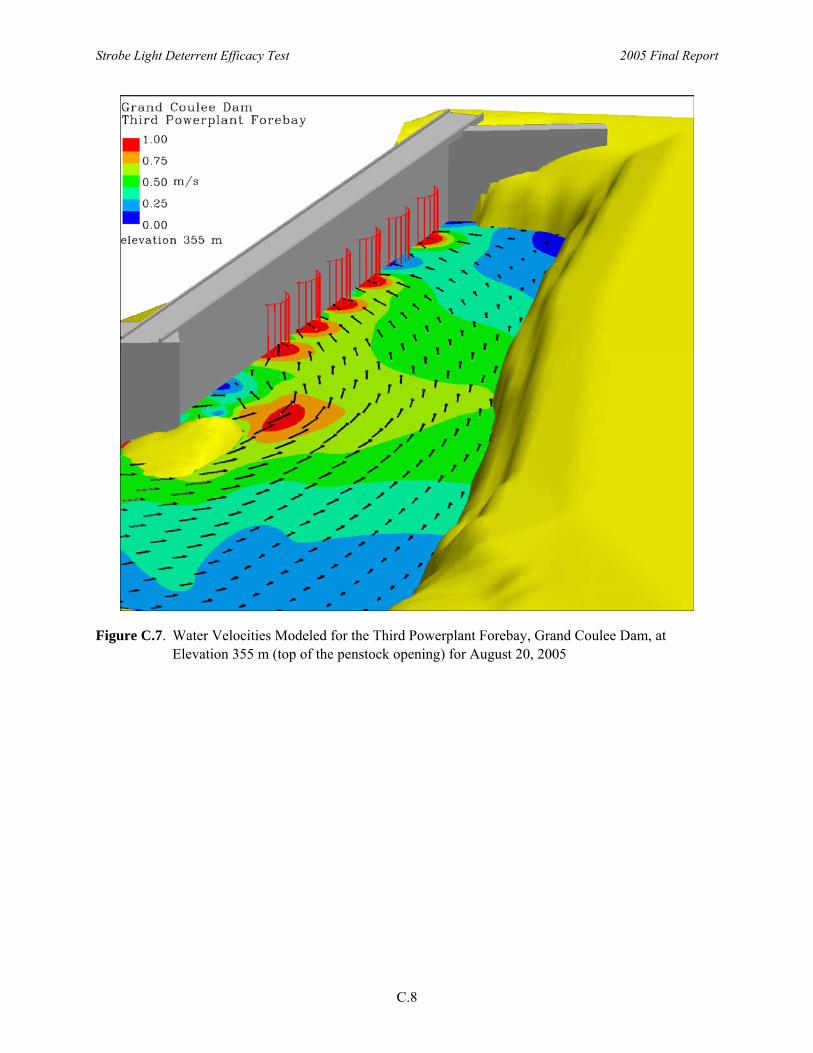
Strobe Light Deterrent Efficacy Test 2005 Final Report
C.8
Figure C.7. Water Velocities Modeled for the Third Powerplant Forebay, Grand Coulee Dam, at Elevation 355 m (top of the penstock opening) for August 20, 2005

Strobe Light Deterrent Efficacy Test 2005 Final Report
C.9
Figure C.8. Water Velocities Modeled for the Third Powerplant Forebay, Grand Coulee Dam, at Elevation 348 m (middle of the penstock opening) for August 20, 2005

Strobe Light Deterrent Efficacy Test 2005 Final Report
C.10
Figure C.9. Water Velocities Modeled for the Third Powerplant Forebay at Grand Coulee Dam at Elevation 343 m (bottom of penstock opening) for August 20, 2005