Embed Size (px)
Citation preview
CHILD ABUSE AND NEGLECT
STATISTICSADDENDUM: CHILD DEATHS AND NEAR DEATHS
STATE FISCAL YEAR 2014July 2013 — June 2014
TABLE OF CONTENTSStatistics-Introduction 2
Child Death Substantiations Child Death 2004 - 2014 3 Child Death by County 4
Child Death Categories Age of Child 5 Abuse and Neglect 5 Race 6 Gender 6 Cause of Death 7
Child Death by Perpetrator Child Abuse by Relationship 8 Child Neglect by Relationship 8 Age of Perpetrator 9
Child Near Death Substantiations Child Near Death 2004 - 2014 10 Child Near Death by County 11
Child Near Death Categories Age of Child 12 Abuse and Neglect 12 Race 13 Gender 13 Cause of Near Death 14
Child Near Death by Perpetrator Child Abuse by Relationship 15 Child Neglect by Relationship 15 Age of Perpetrator 16
TABLE OF CONTENTS 1
STATISTICS — INTRODUCTIONThis statistical document is an addendum to the State Fiscal Year 2014 Child Abuse and Neglect Statistics and pertains solely to child deaths and near deaths that were investigated and substantiated to be the result of child abuse or neglect by the person responsible for the child’s care. The 34 child death and 56 near death victims in this document were previously included in the overall total of 14,159 children substantiated to be victims of abuse and neglect in state fiscal year 2014.
The Oklahoma Department of Human Services (DHS) is charged with the responsibility of promptly investigating all reports of child deaths and near deaths alleged to be the result of abuse or neglect by the person responsible for the child’s care. Persons responsible for the care of children are parents, guardians, custodians, foster parents, any other adults living in the home of the child, and operators, owners, or employees of child care facilities or homes.
For purposes of this document, the definition of near death is when a child is admitted to a hospital in either serious or critical condition with injuries sustained from abuse or neglect by the person responsible for the child’s care. DHS began publishing near death data in state fiscal year 2004.
STATISTICS 2
FiscalYear
Deaths
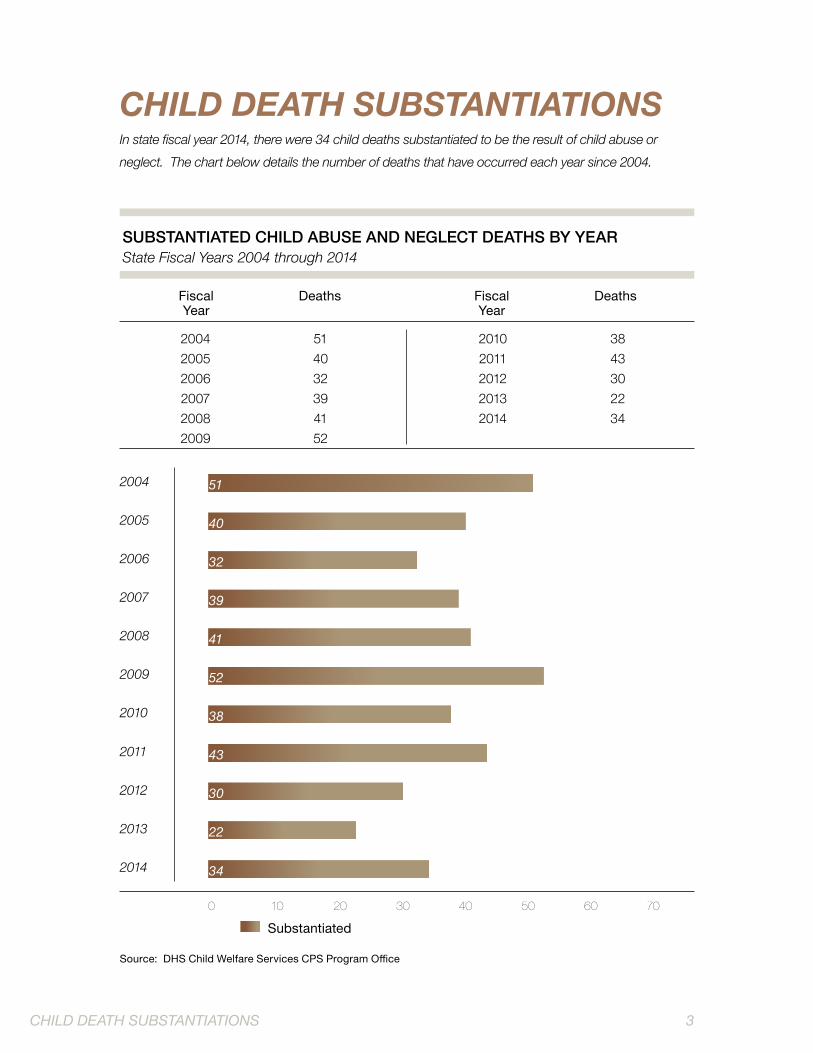
CHILD DEATH SUBSTANTIATIONSIn state fiscal year 2014, there were 34 child deaths substantiated to be the result of child abuse or neglect. The chart below details the number of deaths that have occurred each year since 2004.
SUBSTANTIATED CHILD ABUSE AND NEGLECT DEATHS BY YEARState Fiscal Years 2004 through 2014
FiscalYear
Deaths
2004 512005 402006 322007 392008 412009 52
2010 382011 432012 302013 222014 34
0 10 20 30 40 50 60 70
Substantiated
2013
2014
2004 51
22
34
30
43
38
52
41
39
32
402005
2006
2007
2008
2009
2010
2011
2012
Source: DHS Child Welfare Services CPS Program Office
CHILD DEATH SUBSTANTIATIONS 3
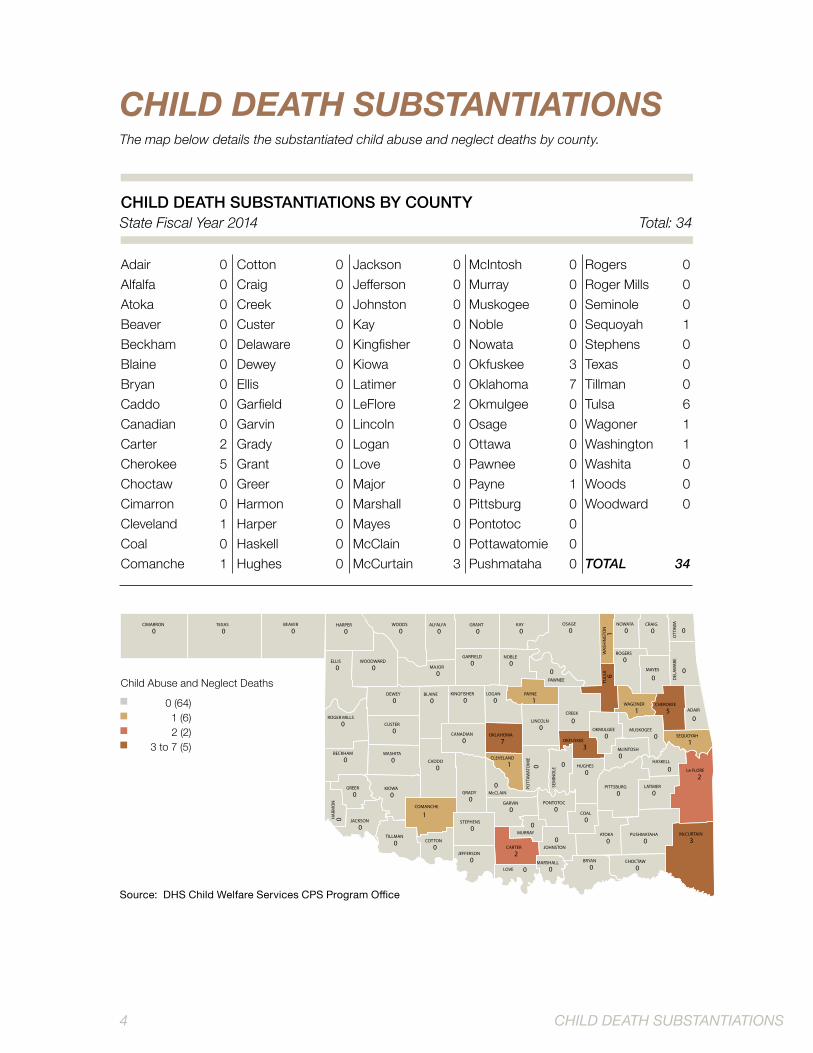
Total: 34
CHILD DEATH SUBSTANTIATIONS
CHILD DEATH SUBSTANTIATIONS BY COUNTYState Fiscal Year 2014
The map below details the substantiated child abuse and neglect deaths by county.
Adair 0Alfalfa 0Atoka 0Beaver 0Beckham 0Blaine 0Bryan 0Caddo 0Canadian 0Carter 2Cherokee 5Choctaw 0Cimarron 0Cleveland 1Coal 0Comanche 1
Cotton 0Craig 0Creek 0Custer 0Delaware 0Dewey 0Ellis 0Garfield 0Garvin 0Grady 0Grant 0Greer 0Harmon 0Harper 0Haskell 0Hughes 0
Jackson 0Jefferson 0Johnston 0Kay 0Kingfisher 0Kiowa 0Latimer 0LeFlore 2Lincoln 0Logan 0Love 0Major 0Marshall 0Mayes 0McClain 0McCurtain 3
McIntosh 0Murray 0Muskogee 0Noble 0Nowata 0Okfuskee 3Oklahoma 7Okmulgee 0Osage 0Ottawa 0Pawnee 0Payne 1Pittsburg 0Pontotoc 0Pottawatomie 0Pushmataha 0
Rogers 0Roger Mills 0Seminole 0Sequoyah 1Stephens 0Texas 0Tillman 0Tulsa 6Wagoner 1Washington 1Washita 0Woods 0Woodward 0
TOTAL 34
CUSTER
ELLIS
BECKHAM WASHITA
CADDO
McCLAIN
SEM
INO
LE
HUGHESHASKELL
Le FLORE
LATIMERPITTSBURG
COAL
ATOKA
PONTOTOC
JOHNSTON
GARVIN
MURRAY
CARTER
LOVE
BRYAN CHOCTAW
PUSHMATAHA McCURTAIN
GRADYKIOWA
TILLMAN
JACKSON
HA
RMO
N
GREER
COTTON
JEFFERSON
STEPHENS
COMANCHE
McINTOSH
CLEVELAND
POTT
AWAT
OM
IE
BLAINEDEWEY
CANADIAN
MAJOR
GRANT KAY OSAGE
WA
SHIN
GTO
N
CRAIG
ROGERS
NOWATA
CHEROKEEADAIR
TULS
A
WAGONER
MAYES
OKMULGEE
CREEK
LINCOLN
LOGAN PAYNEKINGFISHER
OKLAHOMAOKFUSKEE
MUSKOGEESEQUOYAH
DEL
AWA
REO
TTAW
A
GARFIELD NOBLE
PAWNEE
WOODS ALFALFAHARPERBEAVERTEXASCIMARRON
WOODWARD
ROGER MILLS
MARSHALL
0
0
0 00
0
00 0
2
00
0
0
0
0
0
0
2
0 0 0
0 3
00
0
0
0
0
0
0
0
1
01 0
00
0
0
0 0 0 1 0
0
0
50
6
1
0
0
00
0 10
73
01
0
0
0 00
0 00000
0
0
0
Child Abuse and Neglect Deaths
0 (64)1 (6)2 (2)
3 to 7 (5)
Source: DHS Child Welfare Services CPS Program Office
4 CHILD DEATH SUBSTANTIATIONS
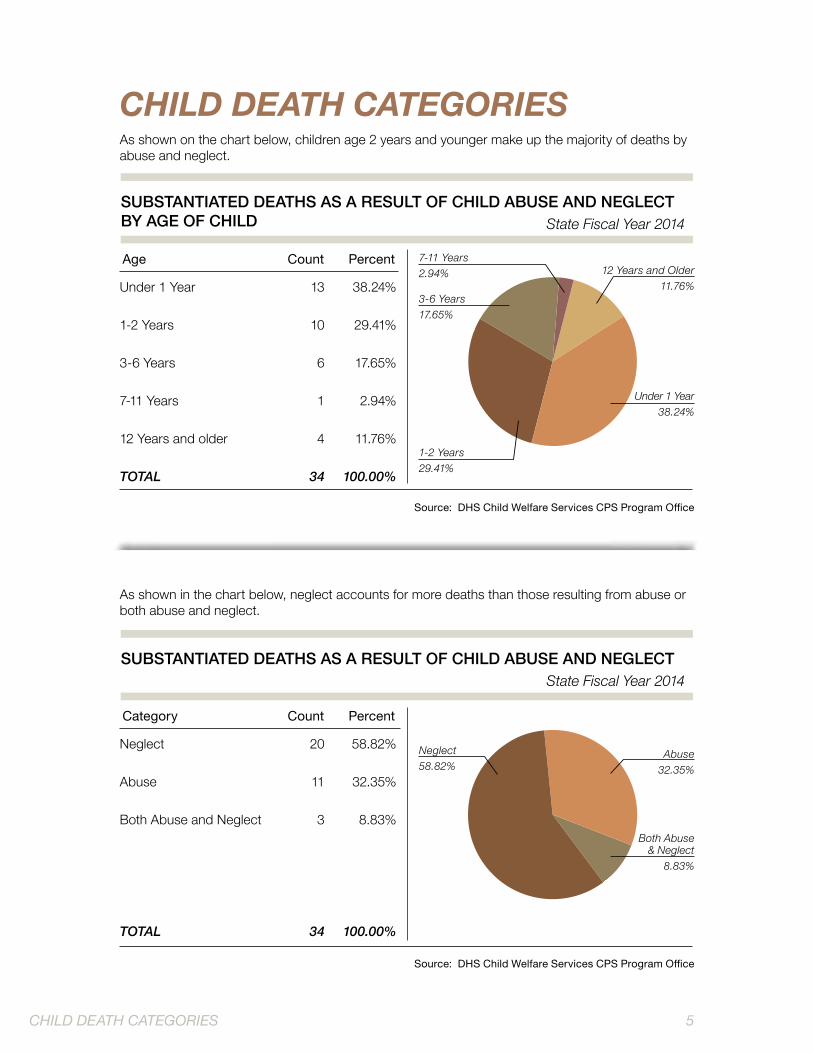
CHILD DEATH CATEGORIESAs shown on the chart below, children age 2 years and younger make up the majority of deaths by abuse and neglect.
SUBSTANTIATED DEATHS AS A RESULT OF CHILD ABUSE AND NEGLECTBY AGE OF CHILD State Fiscal Year 2014
Age Count Percent
Under 1 Year 13 38.24%
1-2 Years 10 29.41%
3-6 Years 6 17.65%
7-11 Years 1 2.94%
12 Years and older 4 11.76%
TOTAL 34 100.00%
3-6 Years17.65%
12 Years and Older11.76%
Under 1 Year38.24%
1-2 Years29.41%
7-11 Years2.94%
Source: DHS Child Welfare Services CPS Program Office
As shown in the chart below, neglect accounts for more deaths than those resulting from abuse or both abuse and neglect.
SUBSTANTIATED DEATHS AS A RESULT OF CHILD ABUSE AND NEGLECTState Fiscal Year 2014
Category Count Percent
Neglect 20 58.82%
Abuse 11 32.35%
Both Abuse and Neglect 3 8.83%
TOTAL 34 100.00%
Neglect58.82%
Abuse32.35%
Both Abuse& Neglect
8.83%
Source: DHS Child Welfare Services CPS Program Office
CHILD DEATH CATEGORIES 5
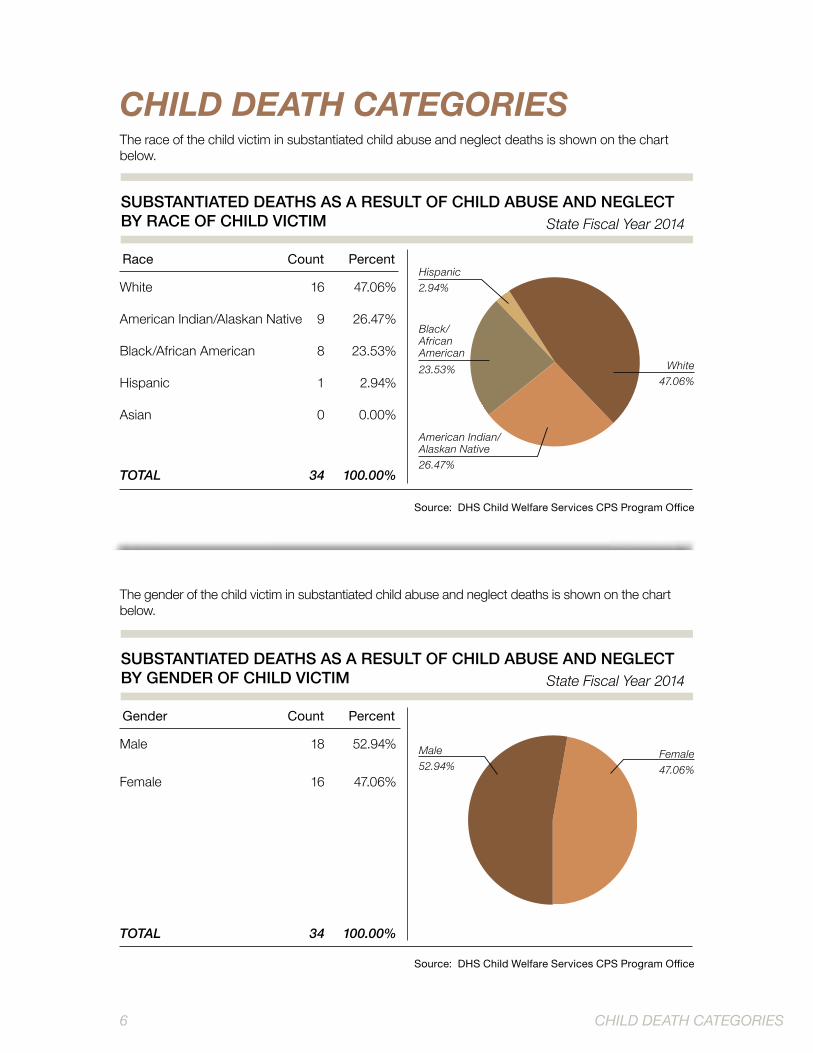
CHILD DEATH CATEGORIESThe race of the child victim in substantiated child abuse and neglect deaths is shown on the chart below.
SUBSTANTIATED DEATHS AS A RESULT OF CHILD ABUSE AND NEGLECTBY RACE OF CHILD VICTIM State Fiscal Year 2014
Race Count Percent
White 16 47.06%
American Indian/Alaskan Native 9 26.47%
Black/African American 8 23.53%
Hispanic 1 2.94%
Asian 0 0.00%
TOTAL 34 100.00%
Black/African American23.53%
Asian4.54%
White47.06%
American Indian/ Alaskan Native26.47%
Hispanic2.94%
Source: DHS Child Welfare Services CPS Program Office
The gender of the child victim in substantiated child abuse and neglect deaths is shown on the chart below.
SUBSTANTIATED DEATHS AS A RESULT OF CHILD ABUSE AND NEGLECTBY GENDER OF CHILD VICTIM State Fiscal Year 2014
Gender Count Percent
Male 18 52.94%
Female 16 47.06%
TOTAL 34 100.00%
Male52.94%
Female47.06%
Source: DHS Child Welfare Services CPS Program Office
6 CHILD DEATH CATEGORIES
Category Count Percent
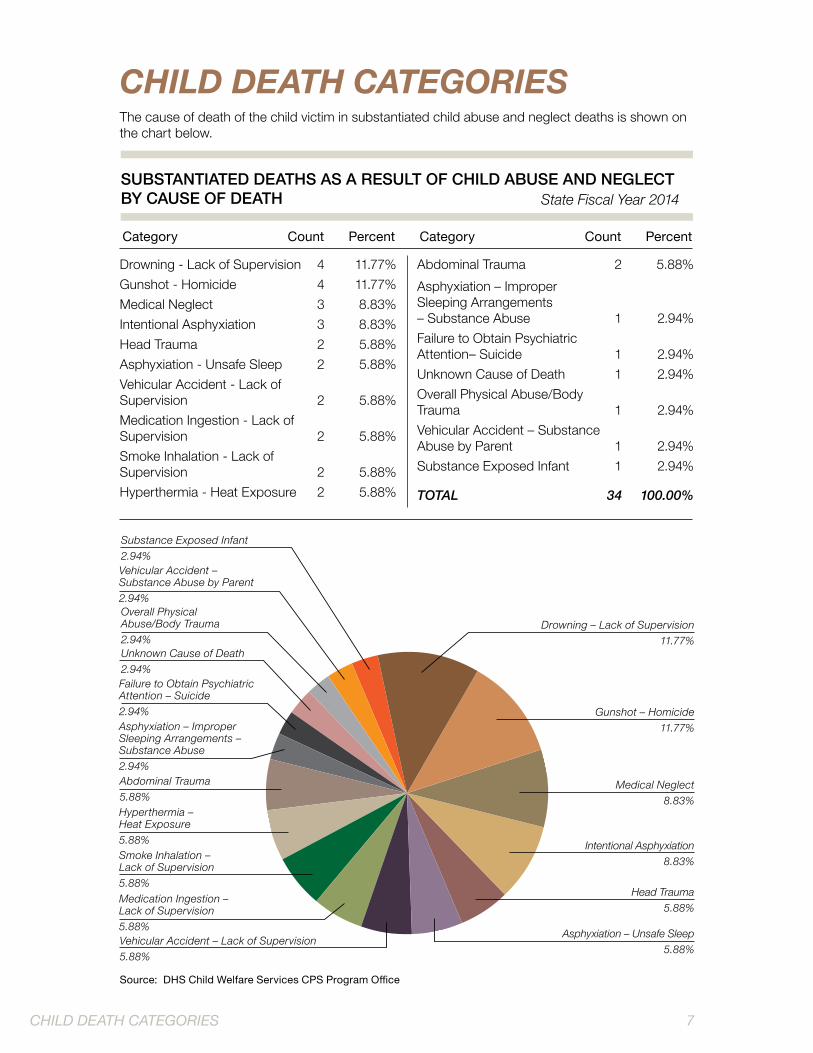
CHILD DEATH CATEGORIESThe cause of death of the child victim in substantiated child abuse and neglect deaths is shown on the chart below.
SUBSTANTIATED DEATHS AS A RESULT OF CHILD ABUSE AND NEGLECTBY CAUSE OF DEATH State Fiscal Year 2014
Category Count Percent
Drowning - Lack of Supervision 4 11.77%Gunshot - Homicide 4 11.77%Medical Neglect 3 8.83%Intentional Asphyxiation 3 8.83%Head Trauma 2 5.88%Asphyxiation - Unsafe Sleep 2 5.88%Vehicular Accident - Lack ofSupervision 2 5.88%Medication Ingestion - Lack ofSupervision 2 5.88%Smoke Inhalation - Lack ofSupervision 2 5.88%Hyperthermia - Heat Exposure 2 5.88%
Abdominal Trauma 2 5.88%Asphyxiation – Improper Sleeping Arrangements – Substance Abuse 1 2.94%Failure to Obtain PsychiatricAttention– Suicide 1 2.94%Unknown Cause of Death 1 2.94%Overall Physical Abuse/BodyTrauma 1 2.94%Vehicular Accident – SubstanceAbuse by Parent 1 2.94%Substance Exposed Infant 1 2.94%
TOTAL 34 100.00%
Medication Ingestion – Lack of Supervision5.88%
Smoke Inhalation – Lack of Supervision5.88%
Failure to Obtain PsychiatricAttention – Suicide2.94%
Vehicular Accident – Substance Abuse by Parent2.94%
Asphyxiation – ImproperSleeping Arrangements – Substance Abuse2.94%
Hyperthermia – Heat Exposure5.88%
Drowning – Lack of Supervision11.77%
Substance Exposed Infant2.94%
Unknown Cause of Death2.94%
Overall PhysicalAbuse/Body Trauma2.94%
Vehicular Accident – Lack of Supervision5.88%
Abdominal Trauma5.88%
Gunshot – Homicide11.77%
Medical Neglect8.83%
Intentional Asphyxiation 8.83%
Head Trauma 5.88%
Asphyxiation – Unsafe Sleep5.88%
Source: DHS Child Welfare Services CPS Program Office
CHILD DEATH CATEGORIES 7
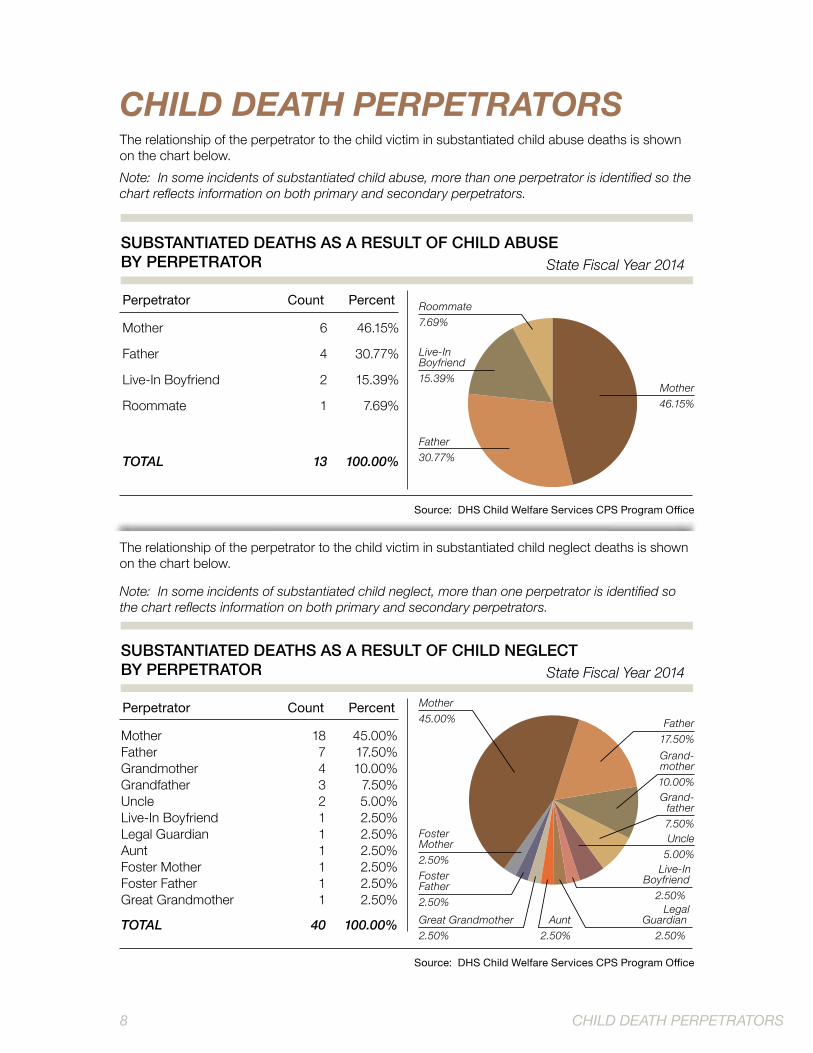
CHILD DEATH PERPETRATORSThe relationship of the perpetrator to the child victim in substantiated child abuse deaths is shown on the chart below.Note: In some incidents of substantiated child abuse, more than one perpetrator is identified so the chart reflects information on both primary and secondary perpetrators.
SUBSTANTIATED DEATHS AS A RESULT OF CHILD ABUSE BY PERPETRATOR State Fiscal Year 2014
Perpetrator Count Percent
Mother 6 46.15%
Father 4 30.77%
Live-In Boyfriend 2 15.39%
Roommate 1 7.69%
TOTAL 13 100.00%
Live-InBoyfriend15.39%
Roommate7.69%
Mother46.15%
Father30.77%
Source: DHS Child Welfare Services CPS Program Office
The relationship of the perpetrator to the child victim in substantiated child neglect deaths is shown on the chart below.
Note: In some incidents of substantiated child neglect, more than one perpetrator is identified so the chart reflects information on both primary and secondary perpetrators.
SUBSTANTIATED DEATHS AS A RESULT OF CHILD NEGLECTBY PERPETRATOR State Fiscal Year 2014
Perpetrator Count Percent
Mother 18 45.00%Father 7 17.50%Grandmother 4 10.00%Grandfather 3 7.50%Uncle 2 5.00%Live-In Boyfriend 1 2.50%Legal Guardian 1 2.50%Aunt 1 2.50%Foster Mother 1 2.50%Foster Father 1 2.50%Great Grandmother 1 2.50%
TOTAL 40 100.00%
Grand-mother10.00%Grand-
father7.50%Uncle
5.00%
Mother45.00%
FosterMother2.50%FosterFather2.50%Great Grandmother2.50%
Live-InBoyfriend
2.50%Legal
Guardian2.50%
Father17.50%
Aunt2.50%
Source: DHS Child Welfare Services CPS Program Office
8 CHILD DEATH PERPETRATORS
Perpetrator Count Percent
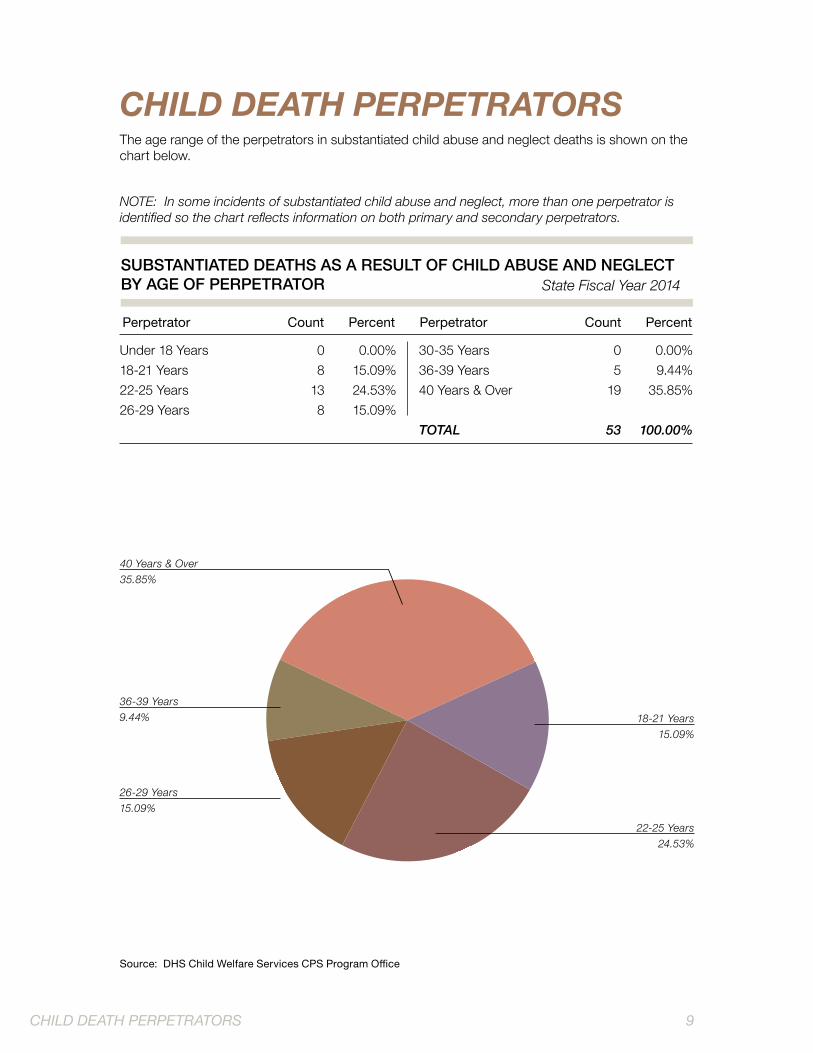
CHILD DEATH PERPETRATORSThe age range of the perpetrators in substantiated child abuse and neglect deaths is shown on the chart below.
NOTE: In some incidents of substantiated child abuse and neglect, more than one perpetrator is identified so the chart reflects information on both primary and secondary perpetrators.
SUBSTANTIATED DEATHS AS A RESULT OF CHILD ABUSE AND NEGLECT BY AGE OF PERPETRATOR State Fiscal Year 2014
Perpetrator Count Percent
Under 18 Years 0 0.00%18-21 Years 8 15.09%22-25 Years 13 24.53%26-29 Years 8 15.09%
30-35 Years 0 0.00%36-39 Years 5 9.44%40 Years & Over 19 35.85%
TOTAL 53 100.00%
18-21 Years15.09%
22-25 Years24.53%
40 Years & Over35.85%
36-39 Years 9.44%
26-29 Years15.09%
Source: DHS Child Welfare Services CPS Program Office
CHILD DEATH PERPETRATORS 9
FiscalYear
Deaths
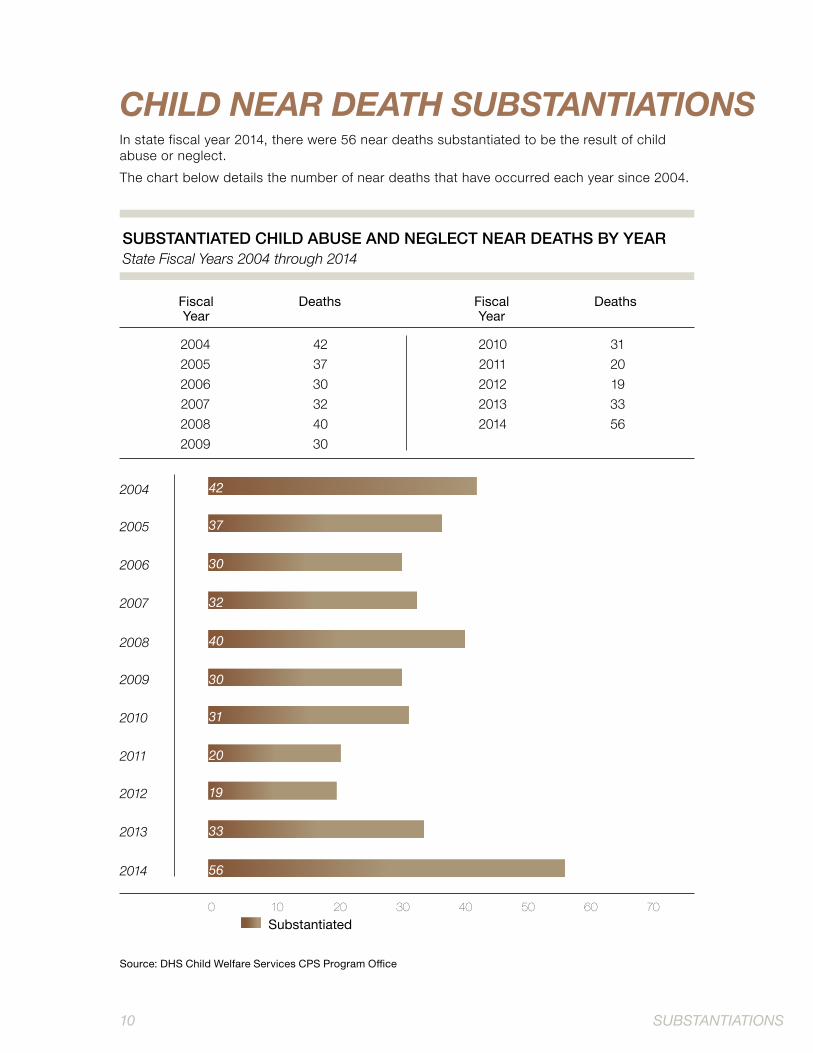
CHILD NEAR DEATH SUBSTANTIATIONSIn state fiscal year 2014, there were 56 near deaths substantiated to be the result of child abuse or neglect. The chart below details the number of near deaths that have occurred each year since 2004.
SUBSTANTIATED CHILD ABUSE AND NEGLECT NEAR DEATHS BY YEARState Fiscal Years 2004 through 2014
FiscalYear
Deaths
2004 422005 372006 302007 322008 402009 30
2010 312011 202012 192013 332014 56
2005
2009
2010
2011
2006
2007
2008
2012
2013 33
19
20
31
30
40
32
30
2004
0 10 20 30 40 50 60 70 Substantiated
42
2014 56
37
Source: DHS Child Welfare Services CPS Program Office
10 SUBSTANTIATIONS

CHILD NEAR DEATH SUBSTANTIATIONSThe map below details the substantiated child abuse and neglect near deaths by county.
SUBSTANTIATED CHILD ABUSE AND NEGLECT NEAR DEATHS BY COUNTYState Fiscal Year 2014 TOTAL: 56
Adair 0Alfalfa 0Atoka 0Beaver 0Beckham 0Blaine 0Bryan 1Caddo 0Canadian 1Carter 1Cherokee 2Choctaw 0Cimarron 0Cleveland 0Coal 0Comanche 1
Cotton 0Craig 0Creek 3Custer 0Delaware 2Dewey 0Ellis 0Garfield 0Garvin 1Grady 0Grant 0Greer 0Harmon 0Harper 0Haskell 0Hughes 0
Jackson 0Jefferson 0Johnston 0Kay 0Kingfisher 0Kiowa 0Latimer 0LeFlore 4Lincoln 0Logan 0Love 0Major 0Marshall 0Mayes 1McClain 0McCurtain 1
McIntosh 0Murray 0Muskogee 2Noble 0Nowata 1Okfuskee 1Oklahoma 18Okmulgee 0Osage 1Ottawa 0Pawnee 0Payne 0Pittsburg 0Pontotoc 1Pottawatomie 4Pushmataha 0
Rogers 0Roger Mills 0Seminole 0Sequoyah 2Stephens 0Texas 1Tillman 0Tulsa 6Wagoner 1Washington 0Washita 0Woods 0Woodward 0
TOTAL 56
CUSTER
ELLIS
BECKHAM WASHITA
CADDO
McCLAIN
SEM
INO
LE
HUGHESHASKELL
Le FLORE
LATIMERPITTSBURG
COAL
ATOKA
PONTOTOC
JOHNSTON
GARVIN
MURRAY
CARTER
LOVE
BRYAN CHOCTAW
PUSHMATAHA McCURTAIN
GRADYKIOWA
TILLMAN
JACKSON
HA
RMO
N
GREER
COTTON
JEFFERSON
STEPHENS
COMANCHE
McINTOSH
CLEVELAND
POTT
AWAT
OM
IE
BLAINEDEWEY
CANADIAN
MAJOR
GRANT KAY OSAGE
WA
SHIN
GTO
N
CRAIG
ROGERS
NOWATA
CHEROKEEADAIR
TULS
A
WAGONER
MAYES
OKMULGEE
CREEK
LINCOLN
LOGAN PAYNEKINGFISHER
OKLAHOMAOKFUSKEE
MUSKOGEESEQUOYAH
DEL
AWA
REO
TTAW
A
GARFIELD NOBLE
PAWNEE
WOODS ALFALFAHARPERBEAVERTEXASCIMARRON
WOODWARD
ROGER MILLS
MARSHALL
0
0
0 00
0
00 0
4
00
0
0
1
0
1
0
1
0 1 0
0 1
00
0
0
0
0
0
0
0
1
00 4
00
1
0
0 0 1 0 0
0
1
20
6
1
1
0
30
0 00
181
22
2
0
0 00
0 00010
0
0
0
Child Abuse and Neglect Near Deaths
0 (55)1 (13)
2-18 (9)
Source: DHS Child Welfare Services CPS Program Office
CHILD NEAR DEATH SUBSTANTIATIONS 11
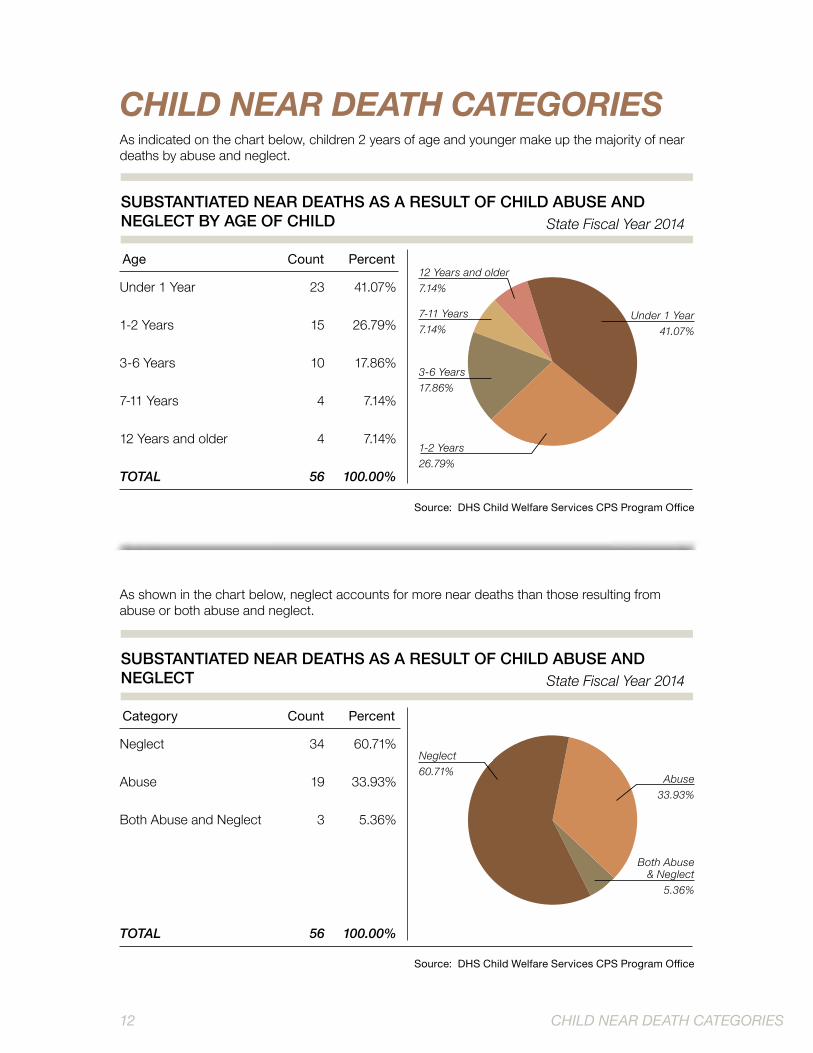
CHILD NEAR DEATH CATEGORIESAs indicated on the chart below, children 2 years of age and younger make up the majority of near deaths by abuse and neglect.
SUBSTANTIATED NEAR DEATHS AS A RESULT OF CHILD ABUSE AND NEGLECT BY AGE OF CHILD State Fiscal Year 2014
Age Count Percent
Under 1 Year 23 41.07%
1-2 Years 15 26.79%
3-6 Years 10 17.86%
7-11 Years 4 7.14%
12 Years and older 4 7.14%
TOTAL 56 100.00%
3-6 Years17.86%
7-11 Years7.14%
12 Years and older7.14%
Under 1 Year41.07%
1-2 Years26.79%
Source: DHS Child Welfare Services CPS Program Office
As shown in the chart below, neglect accounts for more near deaths than those resulting from abuse or both abuse and neglect.
SUBSTANTIATED NEAR DEATHS AS A RESULT OF CHILD ABUSE AND NEGLECT State Fiscal Year 2014
Category Count Percent
Neglect 34 60.71%
Abuse 19 33.93%
Both Abuse and Neglect 3 5.36%
TOTAL 56 100.00%
Neglect60.71% Abuse
33.93%
Both Abuse& Neglect
5.36%
Source: DHS Child Welfare Services CPS Program Office
12 CHILD NEAR DEATH CATEGORIES
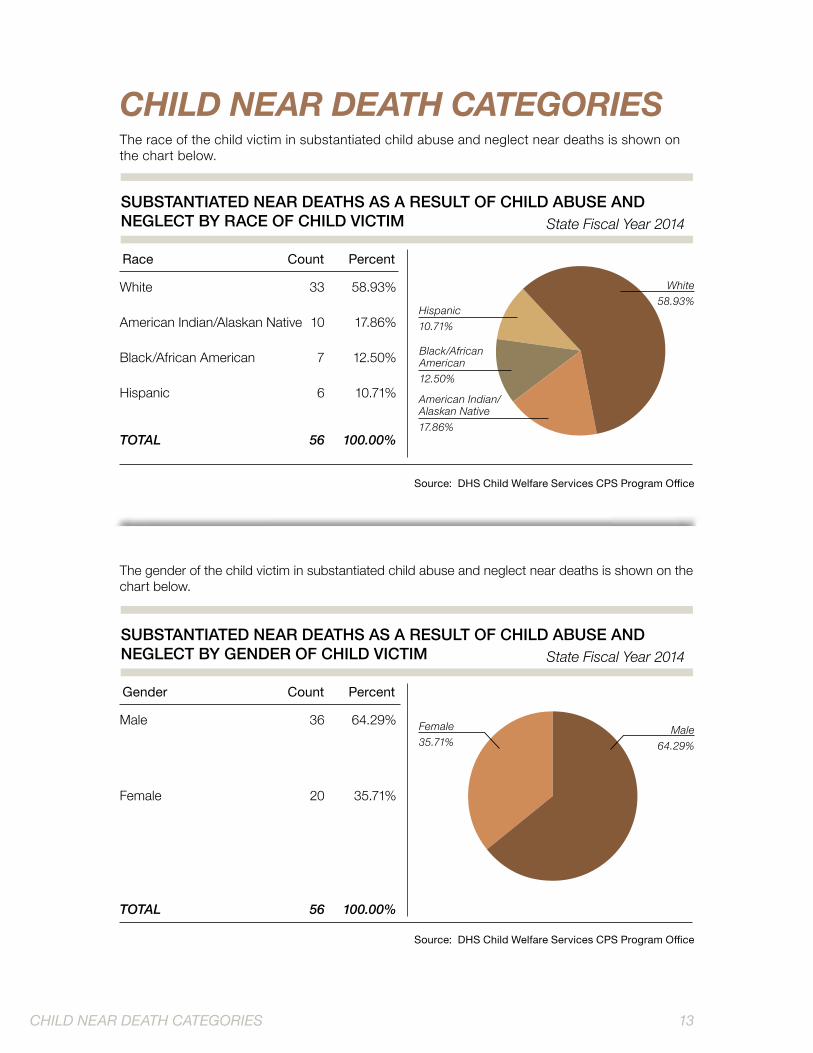
CHILD NEAR DEATH CATEGORIESThe race of the child victim in substantiated child abuse and neglect near deaths is shown on the chart below.
SUBSTANTIATED NEAR DEATHS AS A RESULT OF CHILD ABUSE AND NEGLECT BY RACE OF CHILD VICTIM State Fiscal Year 2014
Race Count Percent
White 33 58.93%
American Indian/Alaskan Native 10 17.86%
Black/African American 7 12.50%
Hispanic 6 10.71%
TOTAL 56 100.00%
White58.93%
American Indian/Alaskan Native17.86%
Hispanic10.71%
Black/African American12.50%
Source: DHS Child Welfare Services CPS Program Office
The gender of the child victim in substantiated child abuse and neglect near deaths is shown on the chart below.
SUBSTANTIATED NEAR DEATHS AS A RESULT OF CHILD ABUSE AND NEGLECT BY GENDER OF CHILD VICTIM State Fiscal Year 2014
Gender Count Percent
Male 36 64.29%
Female 20 35.71%
TOTAL 56 100.00%
Male64.29%
Female35.71%
Source: DHS Child Welfare Services CPS Program Office
CHILD NEAR DEATH CATEGORIES 13
Category Count Percent
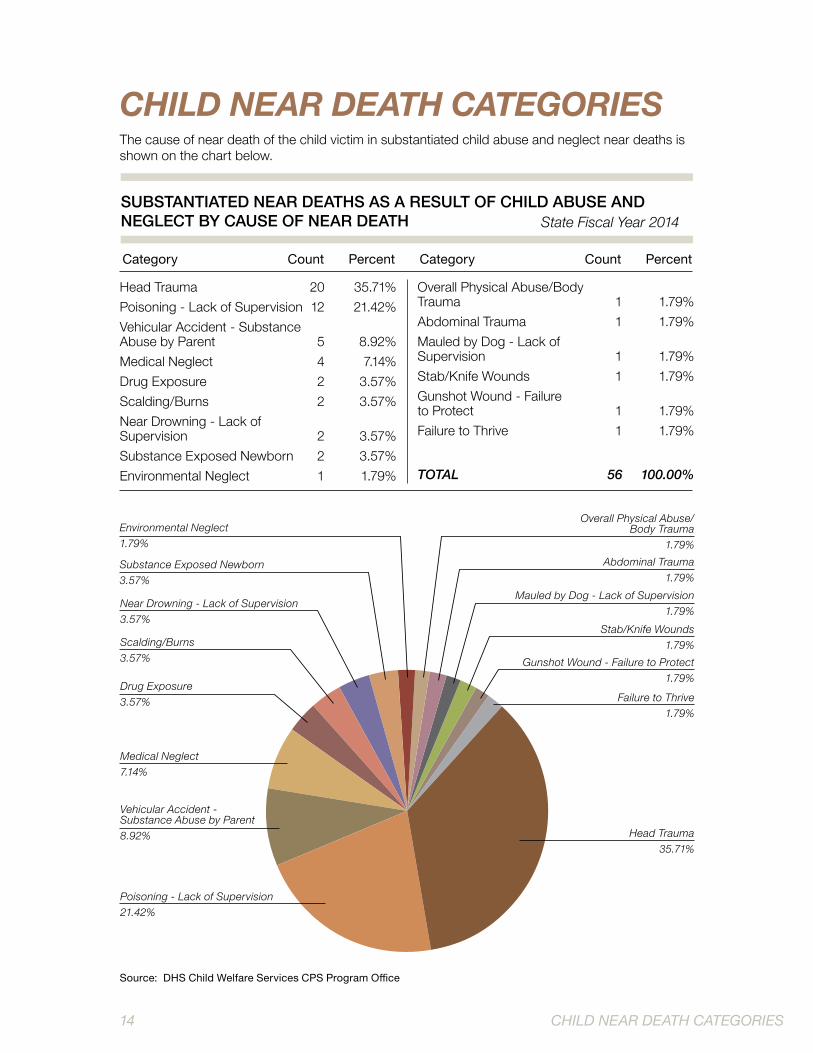
CHILD NEAR DEATH CATEGORIESThe cause of near death of the child victim in substantiated child abuse and neglect near deaths is shown on the chart below.
SUBSTANTIATED NEAR DEATHS AS A RESULT OF CHILD ABUSE AND NEGLECT BY CAUSE OF NEAR DEATH State Fiscal Year 2014
Category Count Percent
Head Trauma 20 35.71%Poisoning - Lack of Supervision 12 21.42%Vehicular Accident - Substance Abuse by Parent 5 8.92%Medical Neglect 4 7.14%Drug Exposure 2 3.57%Scalding/Burns 2 3.57%Near Drowning - Lack of Supervision 2 3.57%Substance Exposed Newborn 2 3.57%Environmental Neglect 1 1.79%
Overall Physical Abuse/BodyTrauma 1 1.79%Abdominal Trauma 1 1.79%Mauled by Dog - Lack ofSupervision 1 1.79%Stab/Knife Wounds 1 1.79%Gunshot Wound - Failureto Protect 1 1.79%Failure to Thrive 1 1.79%
TOTAL 56 100.00%
Head Trauma 35.71%
Drug Exposure3.57%
Medical Neglect7.14%
Vehicular Accident -Substance Abuse by Parent8.92%
Poisoning - Lack of Supervision21.42%
Overall Physical Abuse/Body Trauma
1.79%Environmental Neglect1.79%
Scalding/Burns3.57%
Near Drowning - Lack of Supervision3.57%
Stab/Knife Wounds1.79%
Gunshot Wound - Failure to Protect1.79%
Failure to Thrive1.79%
Mauled by Dog - Lack of Supervision1.79%
Abdominal Trauma1.79%
Substance Exposed Newborn3.57%
Source: DHS Child Welfare Services CPS Program Office
14 CHILD NEAR DEATH CATEGORIES
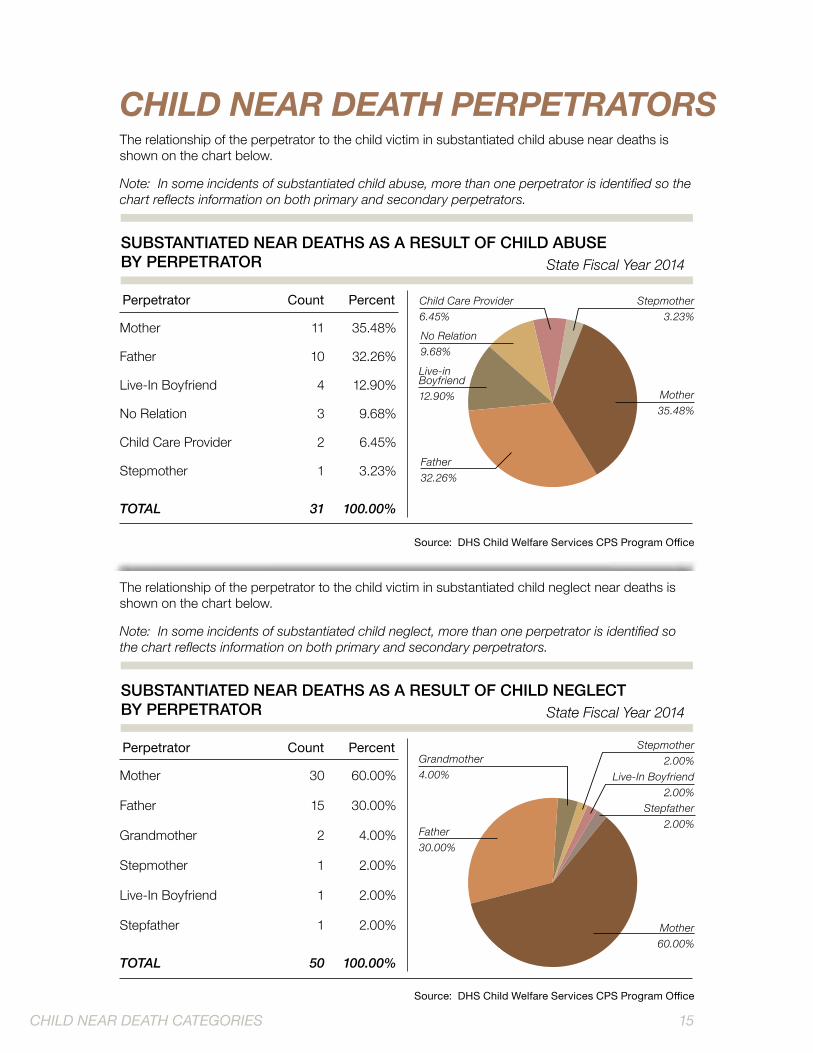
CHILD NEAR DEATH PERPETRATORSThe relationship of the perpetrator to the child victim in substantiated child abuse near deaths is shown on the chart below.
Note: In some incidents of substantiated child abuse, more than one perpetrator is identified so the chart reflects information on both primary and secondary perpetrators.
SUBSTANTIATED NEAR DEATHS AS A RESULT OF CHILD ABUSEBY PERPETRATOR State Fiscal Year 2014
Perpetrator Count Percent
Mother 11 35.48%
Father 10 32.26%
Live-In Boyfriend 4 12.90%
No Relation 3 9.68%
Child Care Provider 2 6.45%
Stepmother 1 3.23%
TOTAL 31 100.00%
No Relation9.68%
Mother35.48%
Father32.26%
Live-in Boyfriend12.90%
Stepmother3.23%
Child Care Provider6.45%
Source: DHS Child Welfare Services CPS Program Office
The relationship of the perpetrator to the child victim in substantiated child neglect near deaths is shown on the chart below.
Note: In some incidents of substantiated child neglect, more than one perpetrator is identified so the chart reflects information on both primary and secondary perpetrators.
SUBSTANTIATED NEAR DEATHS AS A RESULT OF CHILD NEGLECTBY PERPETRATOR State Fiscal Year 2014
Perpetrator Count Percent
Mother 30 60.00%
Father 15 30.00%
Grandmother 2 4.00%
Stepmother 1 2.00%
Live-In Boyfriend 1 2.00%
Stepfather 1 2.00%
TOTAL 50 100.00%
Father30.00%
Grandmother4.00%
Mother60.00%
Stepfather2.00%
Stepmother2.00%
Live-In Boyfriend2.00%
Source: DHS Child Welfare Services CPS Program Office
CHILD NEAR DEATH CATEGORIES 15
Perpetrator Count Percent
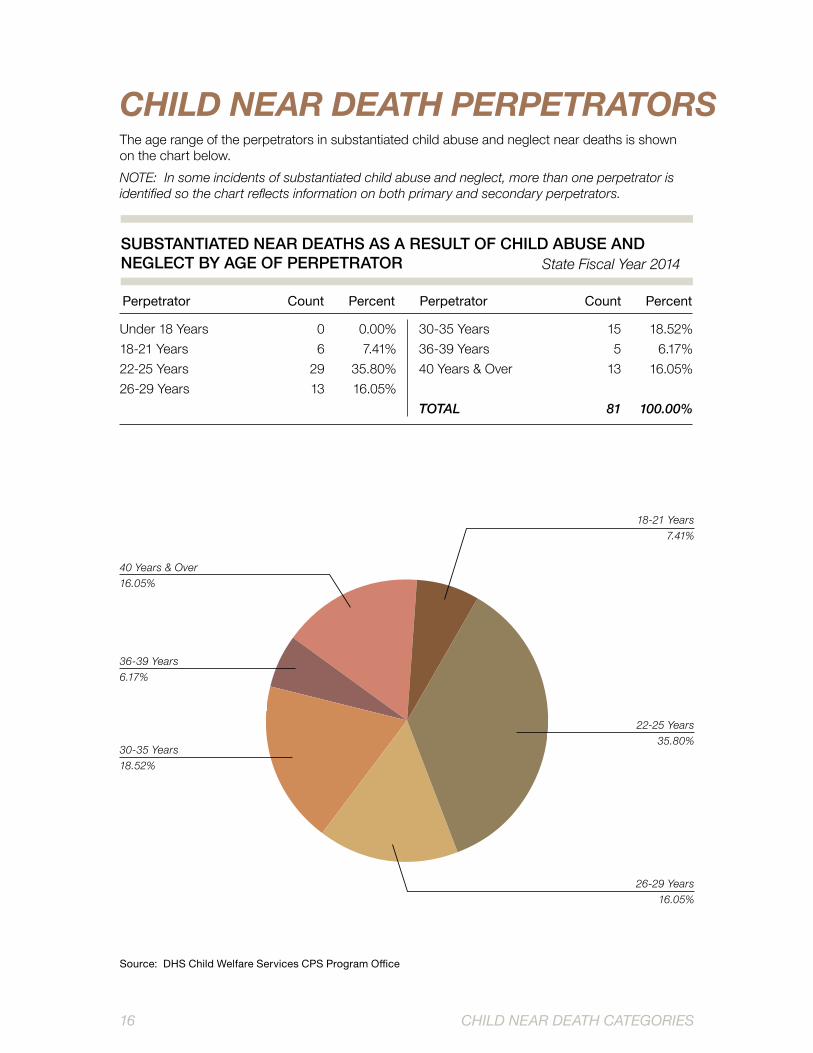
CHILD NEAR DEATH PERPETRATORSThe age range of the perpetrators in substantiated child abuse and neglect near deaths is shown on the chart below. NOTE: In some incidents of substantiated child abuse and neglect, more than one perpetrator is identified so the chart reflects information on both primary and secondary perpetrators.
SUBSTANTIATED NEAR DEATHS AS A RESULT OF CHILD ABUSE AND NEGLECT BY AGE OF PERPETRATOR State Fiscal Year 2014
Perpetrator Count Percent
Under 18 Years 0 0.00%18-21 Years 6 7.41%22-25 Years 29 35.80%26-29 Years 13 16.05%
30-35 Years 15 18.52%36-39 Years 5 6.17%40 Years & Over 13 16.05%
TOTAL 81 100.00%
18-21 Years7.41%
22-25 Years35.80%
30-35 Years 18.52%
40 Years & Over 16.05%
36-39 Years 6.17%
26-29 Years16.05%
Source: DHS Child Welfare Services CPS Program Office
CHILD NEAR DEATH CATEGORIES16

S17020 DHS Issued 7/17This publication is authorized by Oklahoma Department of Human Services Director Ed Lake and printed by DHS in accordance with state and federal regulations at a cost of $242.88 for 85 copies. Copies have been deposited with the Publications Clearinghouse of the Oklahoma Department of Libraries. DHS offices may request copies on ADM-9 (23AM009E) electronic supply
orders. Members of the public may obtain copies by calling 1-877-283-4113 (toll free), by faxing an order to (405) 962-1741, or by downloading a copy at www.okdhs.org/library.