Embed Size (px)
Citation preview
Child Care and Child Care and Children Children
with Special Needswith Special Needs
Challenges for Challenges for Low-income FamiliesLow-income Families
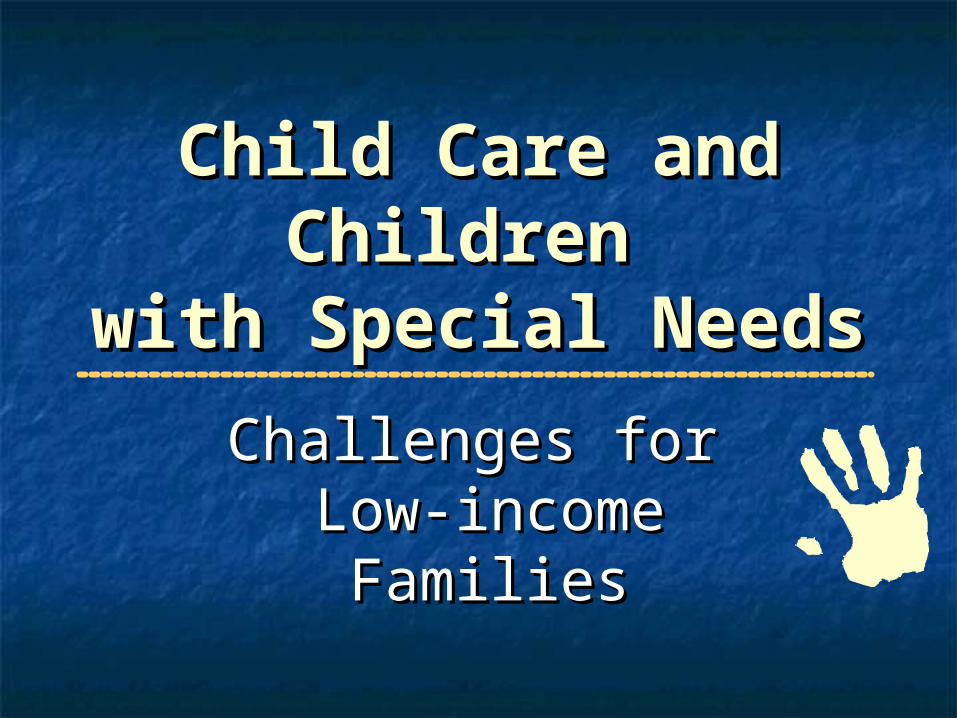
Mixed Method, Multi-level Mixed Method, Multi-level StudyStudy
Qualitative Research:Qualitative Research: Focus groups, interviewsFocus groups, interviews of parents of children with special needs of parents of children with special needs
representing 39 families in six communities in Maine and Connecticut representing 39 families in six communities in Maine and Connecticut (completed)(completed)
Field studyField study in three Maine communities consisting of interviews with in three Maine communities consisting of interviews with professionals who work with families with children with special needs professionals who work with families with children with special needs (completed)(completed)
Quantitative Research:Quantitative Research: Child care provider surveyChild care provider survey of random statewide sample of 430 of random statewide sample of 430
licensed providers with a response rate of 42% (n-179) licensed providers with a response rate of 42% (n-179) (completed, (completed, analysis ongoing)analysis ongoing)
Parent surveyParent survey by phone of 441 parents with children with special by phone of 441 parents with children with special needs (completed, analysis ongoing) needs (completed, analysis ongoing)
National data setNational data set analysis (NSAF and NLSY) analysis (NSAF and NLSY) (on-going)(on-going)
Study Population and Study Population and Research QuestionsResearch Questions
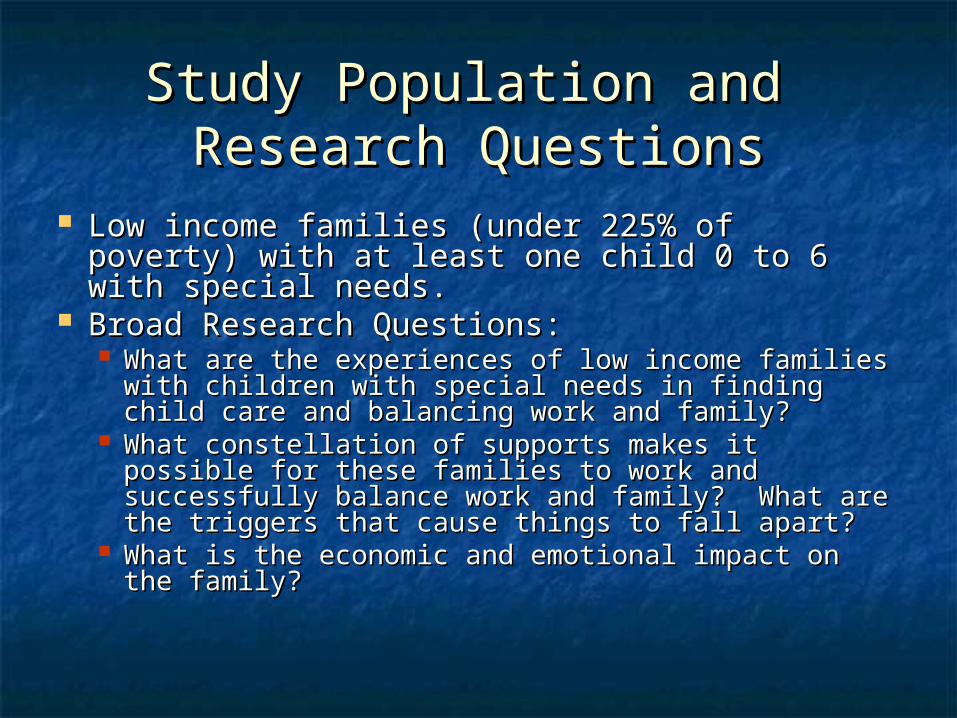
Low income families (under 225% of poverty) Low income families (under 225% of poverty) with at least one child 0 to 6 with special with at least one child 0 to 6 with special needs.needs.
Broad Research Questions:Broad Research Questions: What are the experiences of low income families What are the experiences of low income families
with children with special needs in finding child with children with special needs in finding child care and balancing work and family?care and balancing work and family?
What constellation of supports makes it possible What constellation of supports makes it possible for these families to work and successfully balance for these families to work and successfully balance work and family? What are the triggers that cause work and family? What are the triggers that cause things to fall apart?things to fall apart?
What is the economic and emotional impact on the What is the economic and emotional impact on the family?family?
Preliminary Findings from Preliminary Findings from Statewide Survey of Parents of Statewide Survey of Parents of
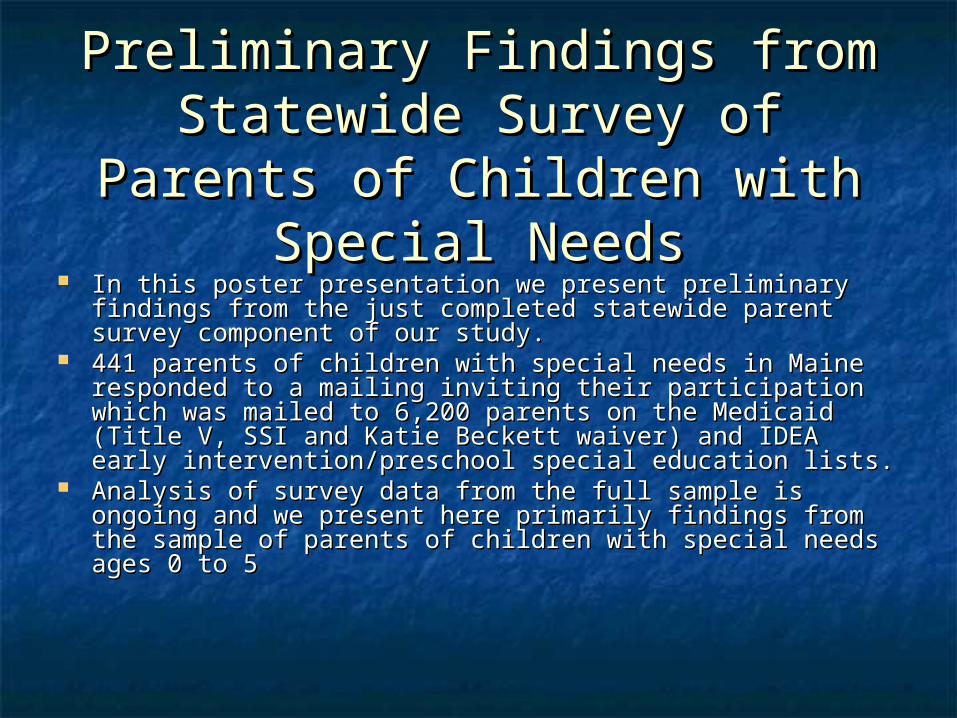
Children with Special NeedsChildren with Special Needs In this poster presentation we present preliminary findings In this poster presentation we present preliminary findings
from the just completed statewide parent survey from the just completed statewide parent survey component of our study. component of our study.
441 parents of children with special needs in Maine 441 parents of children with special needs in Maine responded to a mailing inviting their participation which responded to a mailing inviting their participation which was mailed to 6,200 parents on the Medicaid (Title V, SSI was mailed to 6,200 parents on the Medicaid (Title V, SSI and Katie Beckett waiver) and IDEA early and Katie Beckett waiver) and IDEA early intervention/preschool special education lists.intervention/preschool special education lists.
Analysis of survey data from the full sample is ongoing and Analysis of survey data from the full sample is ongoing and we present here primarily findings from the sample of we present here primarily findings from the sample of parents of children with special needs ages 0 to 5parents of children with special needs ages 0 to 5
Full SampleFull Sample
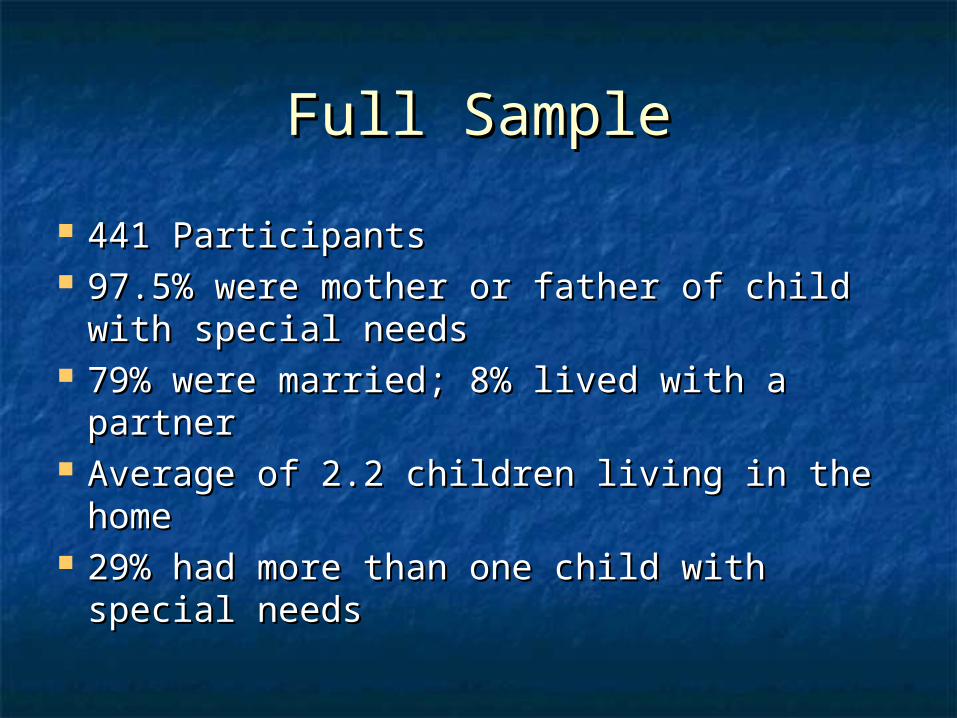
441 Participants441 Participants 97.5% were mother or father of child with 97.5% were mother or father of child with
special needs special needs 79% were married; 8% lived with a 79% were married; 8% lived with a
partnerpartner Average of 2.2 children living in the homeAverage of 2.2 children living in the home 29% had more than one child with special 29% had more than one child with special
needsneeds
Age of ChildAge of Child
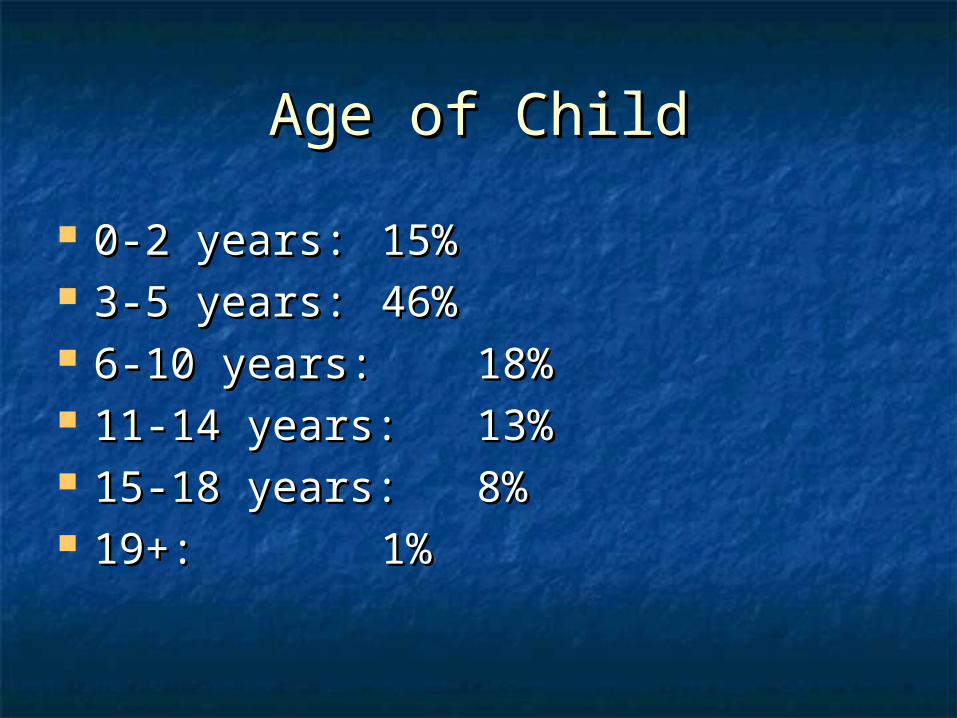
0-2 years: 0-2 years: 15%15% 3-5 years: 3-5 years: 46%46% 6-10 years: 6-10 years: 18%18% 11-14 years: 11-14 years: 13%13% 15-18 years: 15-18 years: 8%8% 19+:19+: 1%1%
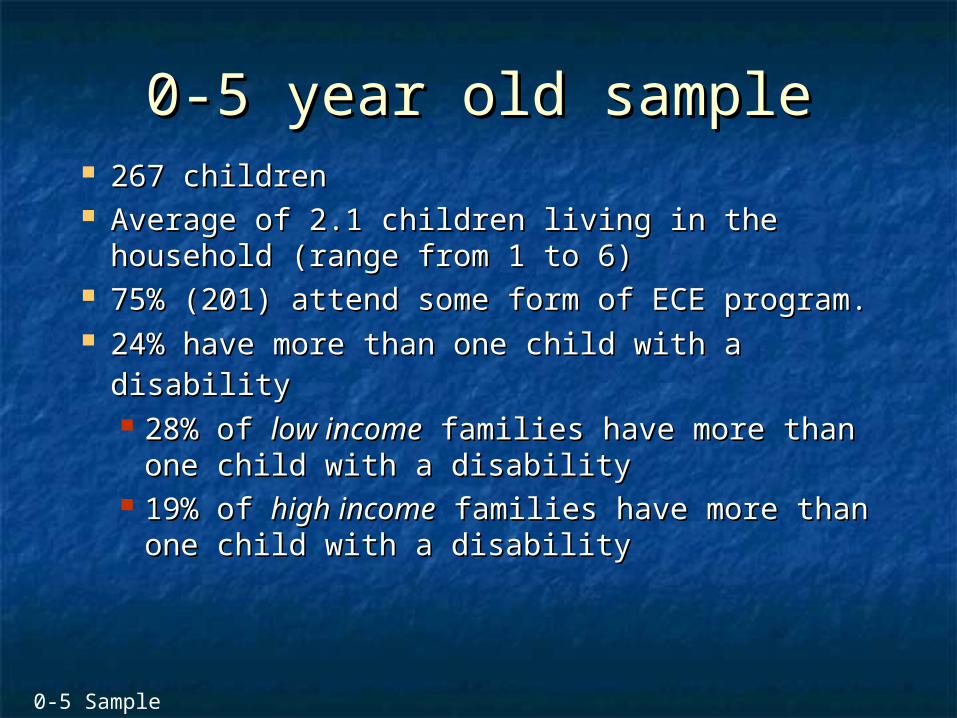
0-5 year old sample0-5 year old sample 267 children267 children Average of 2.1 children living in the household Average of 2.1 children living in the household
(range from 1 to 6)(range from 1 to 6) 75% (201) attend some form of ECE program.75% (201) attend some form of ECE program. 24% have more than one child with a 24% have more than one child with a
disabilitydisability 28% of 28% of low incomelow income families have more than families have more than
one child with a disabilityone child with a disability 19% of 19% of high incomehigh income families have more families have more
than one child with a disabilitythan one child with a disability
0-5 Sample

Primary DiagnosisPrimary Diagnosisof Childrenof Children
28% (76) have a primarily behavioral 28% (76) have a primarily behavioral diagnosisdiagnosis
19% (51) have a primarily physical diagnosis19% (51) have a primarily physical diagnosis 21% (57) have a mixed diagnosis (physical 21% (57) have a mixed diagnosis (physical
and behavioral)and behavioral) 31% (83) speech/language31% (83) speech/language
0-5 Sample0-5 Sample
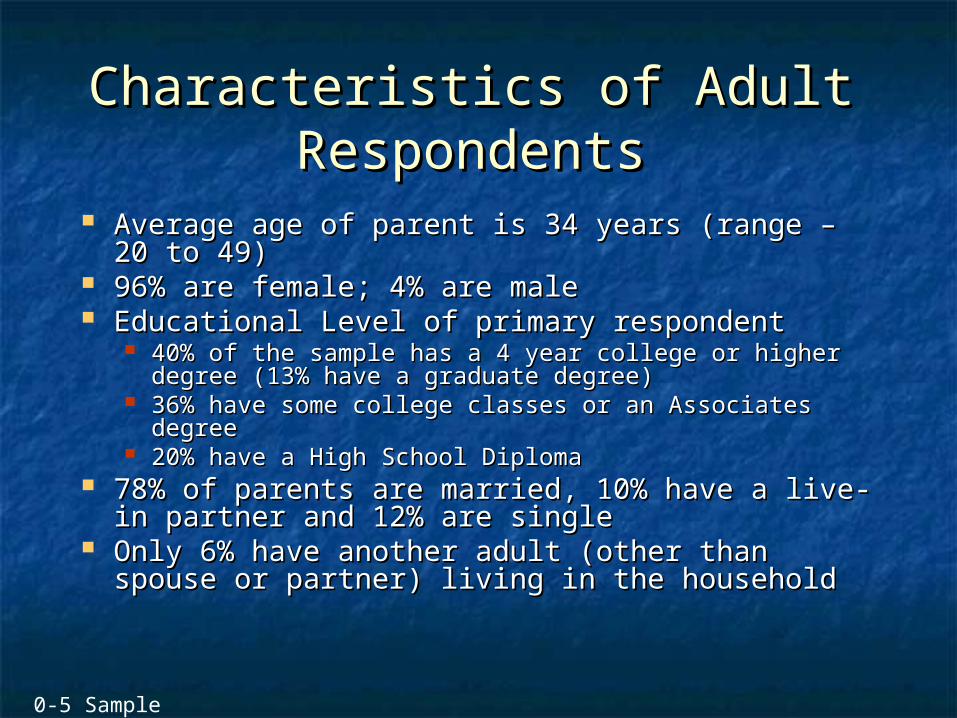
Characteristics of Adult Characteristics of Adult RespondentsRespondents
Average age of parent is 34 years (range – 20 to Average age of parent is 34 years (range – 20 to 49) 49)
96% are female; 4% are male96% are female; 4% are male Educational Level of primary respondentEducational Level of primary respondent
40% of the sample has a 4 year college or higher 40% of the sample has a 4 year college or higher degree (13% have a graduate degree)degree (13% have a graduate degree)
36% have some college classes or an Associates degree36% have some college classes or an Associates degree 20% have a High School Diploma20% have a High School Diploma
78% of parents are married, 10% have a live-in 78% of parents are married, 10% have a live-in partner and 12% are singlepartner and 12% are single
Only 6% have another adult (other than spouse Only 6% have another adult (other than spouse or partner) living in the householdor partner) living in the household
0-5 Sample
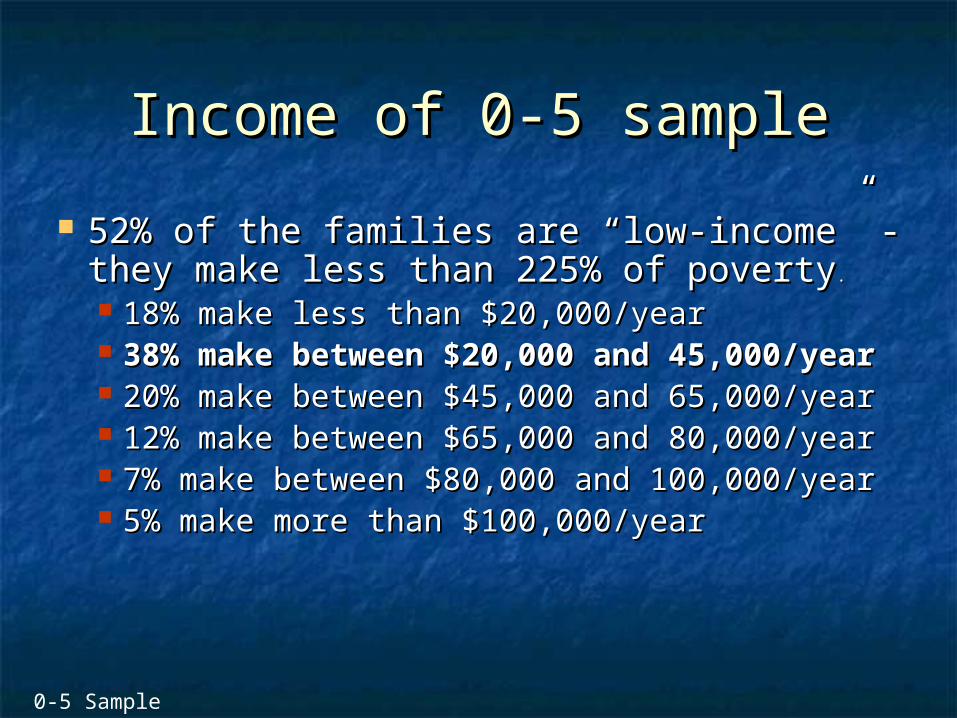
Income of 0-5 sampleIncome of 0-5 sample
52% of the families are “low-income” - they 52% of the families are “low-income” - they make less than 225% of povertymake less than 225% of poverty ..
18% make less than $20,000/year18% make less than $20,000/year 38% make between $20,000 and 38% make between $20,000 and
45,000/year45,000/year 20% make between $45,000 and 65,000/year20% make between $45,000 and 65,000/year 12% make between $65,000 and 80,000/year12% make between $65,000 and 80,000/year 7% make between $80,000 and 100,000/year7% make between $80,000 and 100,000/year 5% make more than $100,000/year5% make more than $100,000/year
0-5 Sample
Child Care IssuesChild Care Issues
What are the experiences of families What are the experiences of families in finding child care for their children in finding child care for their children with special needs? with special needs?
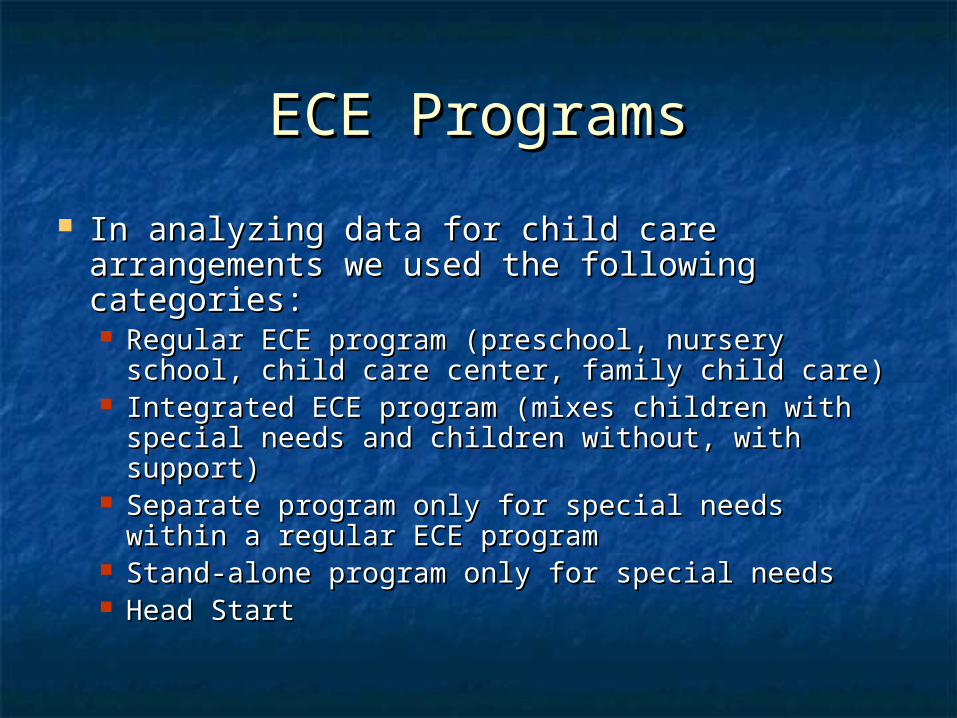
ECE ProgramsECE Programs
In analyzing data for child care arrangements In analyzing data for child care arrangements we used the following categories:we used the following categories: Regular ECE program (preschool, nursery school, Regular ECE program (preschool, nursery school,
child care center, family child care)child care center, family child care) Integrated ECE program (mixes children with Integrated ECE program (mixes children with
special needs and children without, with support)special needs and children without, with support) Separate program only for special needs within a Separate program only for special needs within a
regular ECE programregular ECE program Stand-alone program only for special needsStand-alone program only for special needs Head StartHead Start
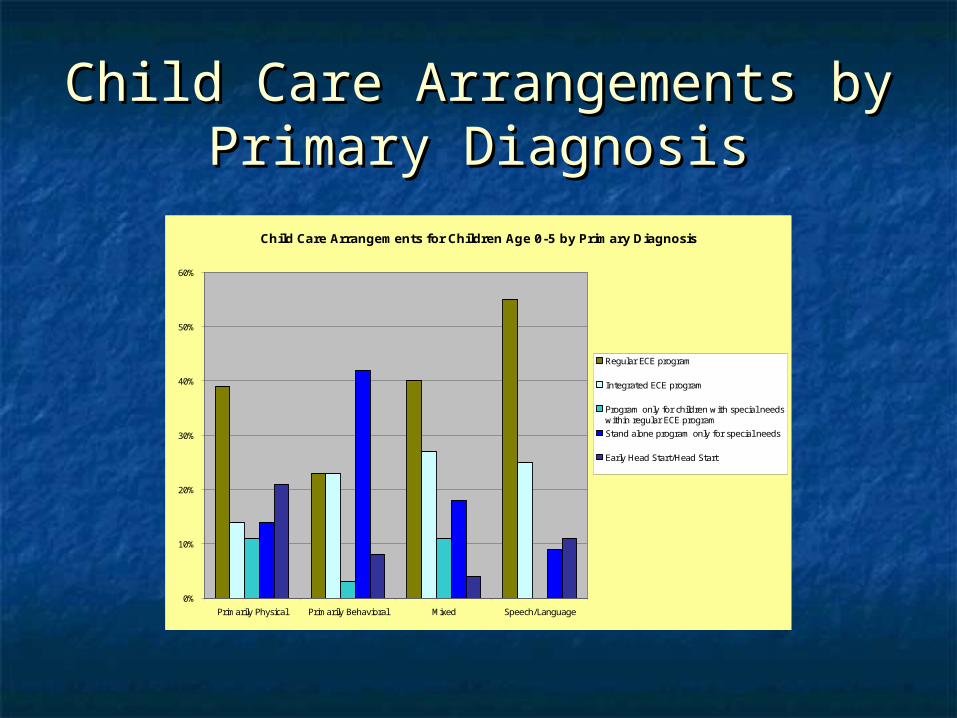
Child Care Arrangements by Child Care Arrangements by Primary DiagnosisPrimary Diagnosis
Child Care Arrangements for Children Age 0-5 by Primary Diagnosis
0%
10%
20%
30%
40%
50%
60%
Primarily Physical Primarily Behavioral Mixed Speech/Language
Regular ECE program
Integrated ECE program
Program only for children with special needswithin regular ECE program
Stand alone program only for special needs
Early Head Start/Head Start
Use of Family Child Care Use of Family Child Care Homes Homes
for Children with Special for Children with Special NeedsNeeds Statewide surveys show that 40% of Statewide surveys show that 40% of
Maine’s 0-5 population as a whole Maine’s 0-5 population as a whole are using family child care homes. are using family child care homes. (Maine OCCHS, 2002).(Maine OCCHS, 2002).
Yet in our study, only 5% of our Yet in our study, only 5% of our sample of children with special needs sample of children with special needs are using family child care as their are using family child care as their primary child care arrangement.primary child care arrangement.
0-5 Sample
Special Services Received Special Services Received by Children 0-5by Children 0-5
93% of children received special services (OT, PT, 93% of children received special services (OT, PT, ST, counseling, talk therapy)ST, counseling, talk therapy) 56% of children have services delivered at an early care 56% of children have services delivered at an early care
and education settingand education setting 31% of children have services delivered at home31% of children have services delivered at home
63% of children 0-2 had services delivered at home63% of children 0-2 had services delivered at home 21% of children 3-5 had services delivered at home21% of children 3-5 had services delivered at home
53% of children have services delivered at 53% of children have services delivered at specialist’s office*specialist’s office*
*Percentages add up to more than 100% because some children are receiving services at multiple *Percentages add up to more than 100% because some children are receiving services at multiple locations.locations.
0-5 Sample
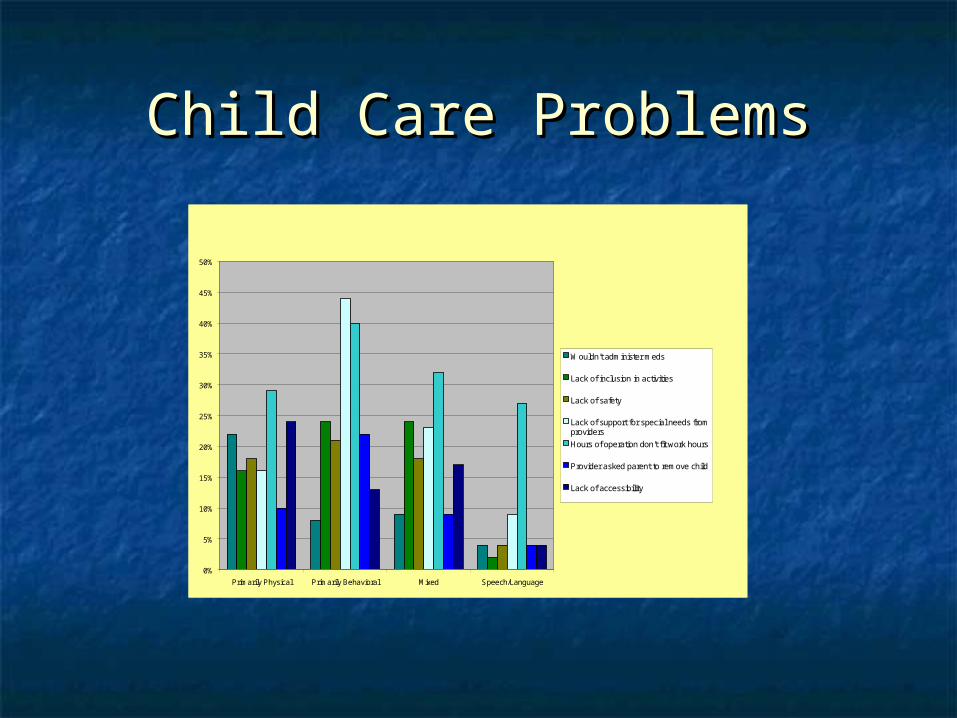
Child Care ProblemsChild Care Problems
0%
5%
10%
15%
20%
25%
30%
35%
40%
45%
50%
Primarily Physical Primarily Behavioral Mixed Speech/Language
Wouldn't administer meds
Lack of inclusion in activities
Lack of safety
Lack of support for special needs fromproviders
Hours of operation don't fit work hours
Provider asked parent to remove child
Lack of accessibility
Problems with Child Care by Primary Diagnosis
Number of Child Care Number of Child Care Problems by Primary Problems by Primary
DiagnosisDiagnosis Even after controlling for age, location Even after controlling for age, location
(urban/rural) and income, having a (urban/rural) and income, having a child with a behavioral issue is child with a behavioral issue is strongly related to the number of child strongly related to the number of child care problems (F = 7.95, p < .01)care problems (F = 7.95, p < .01)
Having a child with a physical or Having a child with a physical or mixed diagnosis is mixed diagnosis is notnot related to the related to the number of child care problems.number of child care problems.
0-5 Sample
Work IssuesWork Issues
What are the experiences of parents What are the experiences of parents of children with special needs in of children with special needs in balancing work and meeting the balancing work and meeting the needs of their children? needs of their children?
EmploymentEmployment
63% of respondents are currently 63% of respondents are currently employedemployed
10% of those working have a second job10% of those working have a second job In a typical week, respondents work an In a typical week, respondents work an
average of 33 hours (ranging from 1 to average of 33 hours (ranging from 1 to 98); the most common number of hours 98); the most common number of hours is 35 hours per week.is 35 hours per week.
26% work off-hours26% work off-hours
0-21 Sample
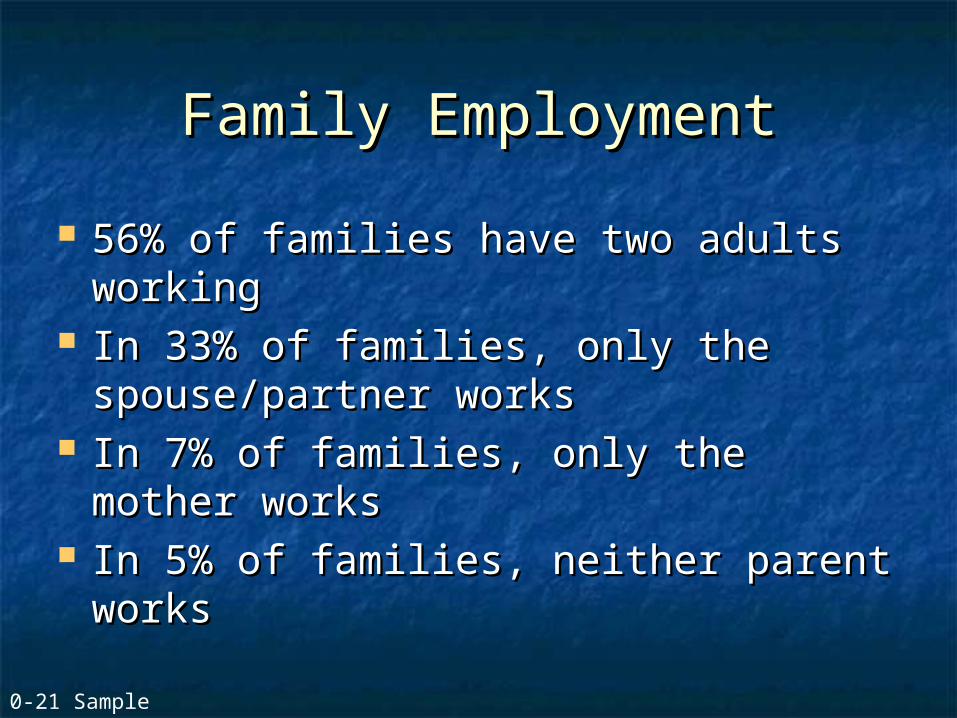
Family EmploymentFamily Employment
56% of families have two adults 56% of families have two adults workingworking
In 33% of families, only the In 33% of families, only the spouse/partner worksspouse/partner works
In 7% of families, only the mother In 7% of families, only the mother worksworks
In 5% of families, neither parent In 5% of families, neither parent worksworks
0-21 Sample
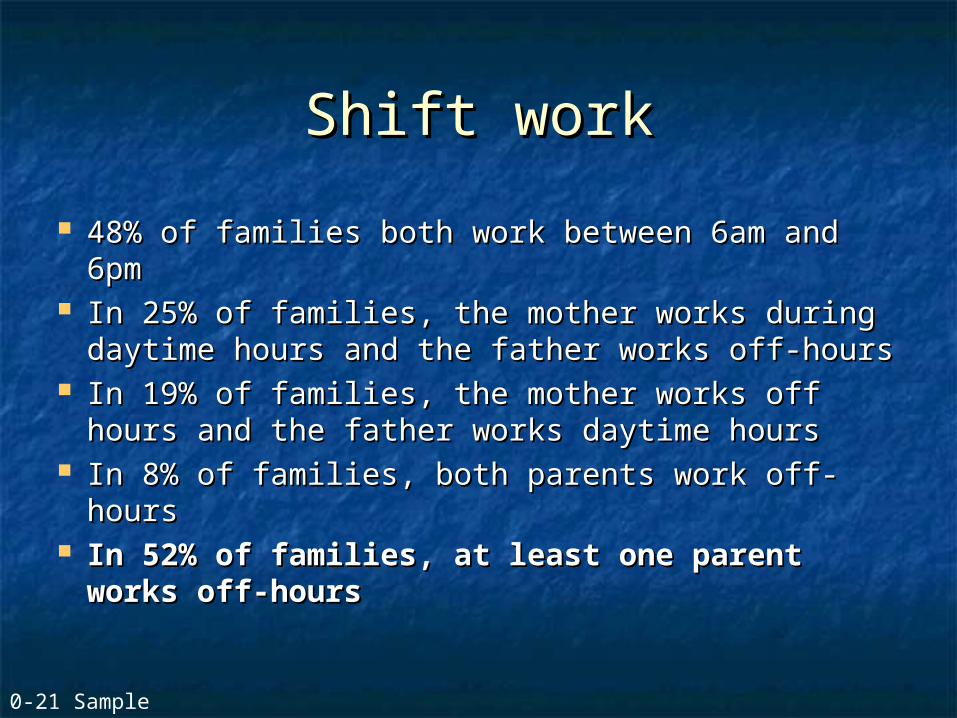
Shift workShift work
48% of families both work between 6am and 48% of families both work between 6am and 6pm6pm
In 25% of families, the mother works during In 25% of families, the mother works during daytime hours and the father works off-hoursdaytime hours and the father works off-hours
In 19% of families, the mother works off In 19% of families, the mother works off hours and the father works daytime hourshours and the father works daytime hours
In 8% of families, both parents work off-hoursIn 8% of families, both parents work off-hours In 52% of families, at least one parent In 52% of families, at least one parent
works off-hoursworks off-hours
0-21 Sample

Employment Problems Employment Problems RelatedRelated
to Having a Child to Having a Child with Special Needswith Special Needs
57% of parents have had to reduce work hours in order to 57% of parents have had to reduce work hours in order to care for their childcare for their child
44% changed work hours to a different time of day44% changed work hours to a different time of day 30% of parents have quit work (other than for normal 30% of parents have quit work (other than for normal
maternity leave)maternity leave) 29% turned down a better job or promotion29% turned down a better job or promotion 27% of parents have changed jobs27% of parents have changed jobs 26% worried that they were at risk of losing their job26% worried that they were at risk of losing their job 5% have lost or been fired from a job5% have lost or been fired from a job
Respondents were asked whether they have had any of these employment problems because of Respondents were asked whether they have had any of these employment problems because of having a child with special needs now or in the past.having a child with special needs now or in the past.
0-21 Sample
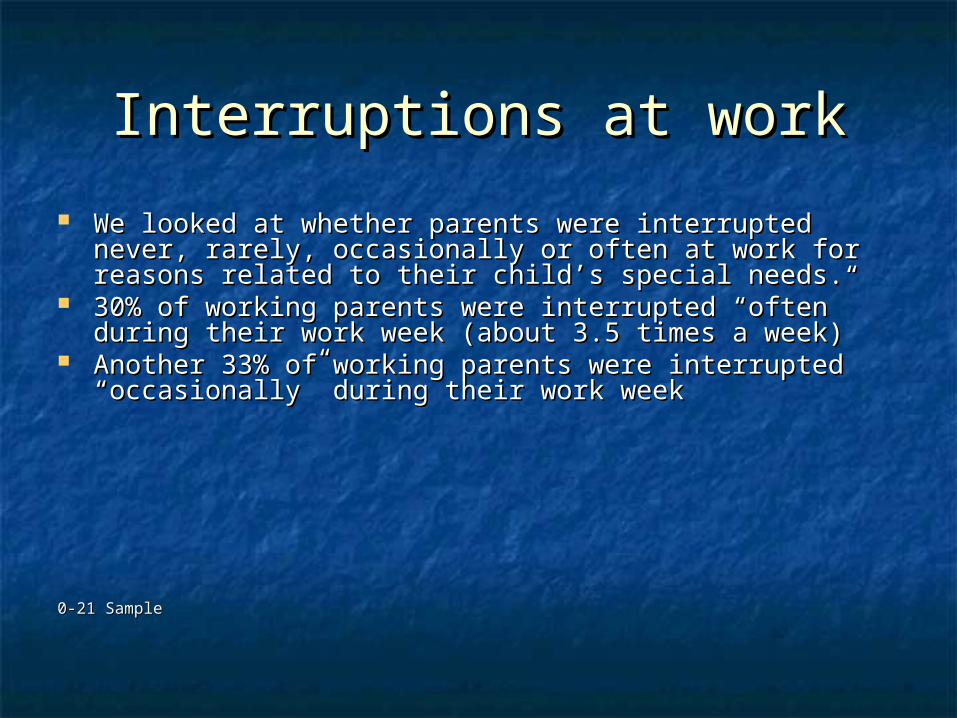
Interruptions at workInterruptions at work
We looked at whether parents were interrupted never, We looked at whether parents were interrupted never, rarely, occasionally or often at work for reasons related to rarely, occasionally or often at work for reasons related to their child’s special needs.their child’s special needs.
30% of working parents were interrupted “often” during 30% of working parents were interrupted “often” during their work week (about 3.5 times a week)their work week (about 3.5 times a week)
Another 33% of working parents were interrupted Another 33% of working parents were interrupted “occasionally” during their work week“occasionally” during their work week
0-21 Sample0-21 Sample
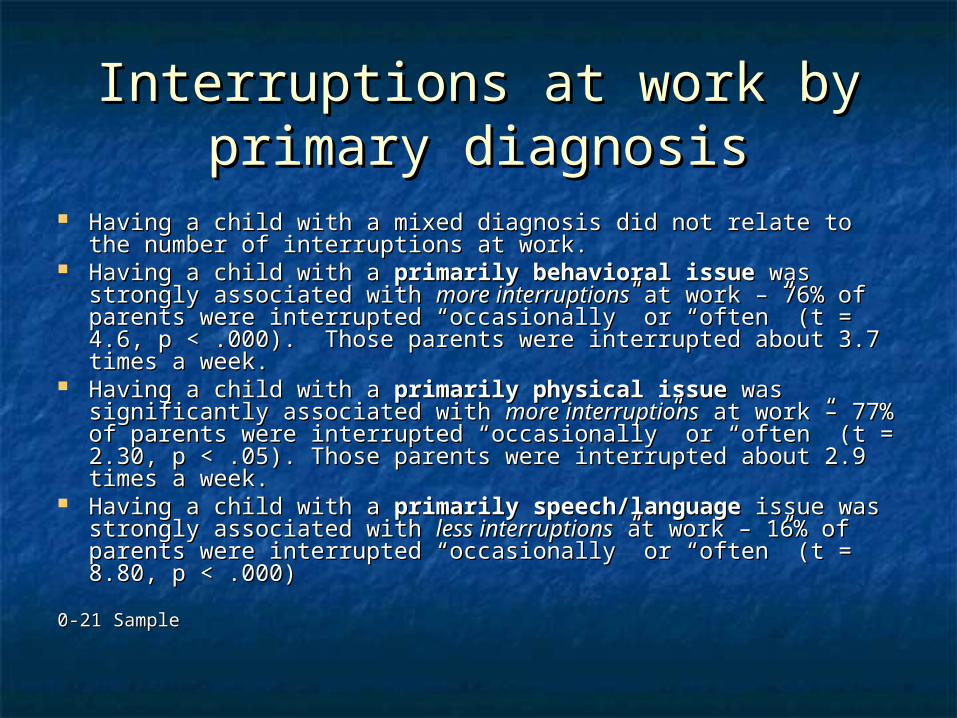
Interruptions at work by Interruptions at work by primary diagnosisprimary diagnosis
Having a child with a mixed diagnosis did not relate to the Having a child with a mixed diagnosis did not relate to the number of interruptions at work.number of interruptions at work.
Having a child with a Having a child with a primarily behavioral issueprimarily behavioral issue was was strongly associated with strongly associated with more interruptionsmore interruptions at work – 76% of at work – 76% of parents were interrupted “occasionally” or “often” (t = 4.6, p < parents were interrupted “occasionally” or “often” (t = 4.6, p < .000). Those parents were interrupted about 3.7 times a week..000). Those parents were interrupted about 3.7 times a week.
Having a child with a Having a child with a primarily physical issueprimarily physical issue was was significantly associated with significantly associated with more interruptionsmore interruptions at work – 77% at work – 77% of parents were interrupted “occasionally” or “often” (t = 2.30, of parents were interrupted “occasionally” or “often” (t = 2.30, p < .05). Those parents were interrupted about 2.9 times a p < .05). Those parents were interrupted about 2.9 times a week.week.
Having a child with a Having a child with a primarily speech/languageprimarily speech/language issue was issue was strongly associated with strongly associated with less interruptionsless interruptions at work – 16% of at work – 16% of parents were interrupted “occasionally” or “often” (t = 8.80, p parents were interrupted “occasionally” or “often” (t = 8.80, p < .000)< .000)
0-21 Sample0-21 Sample
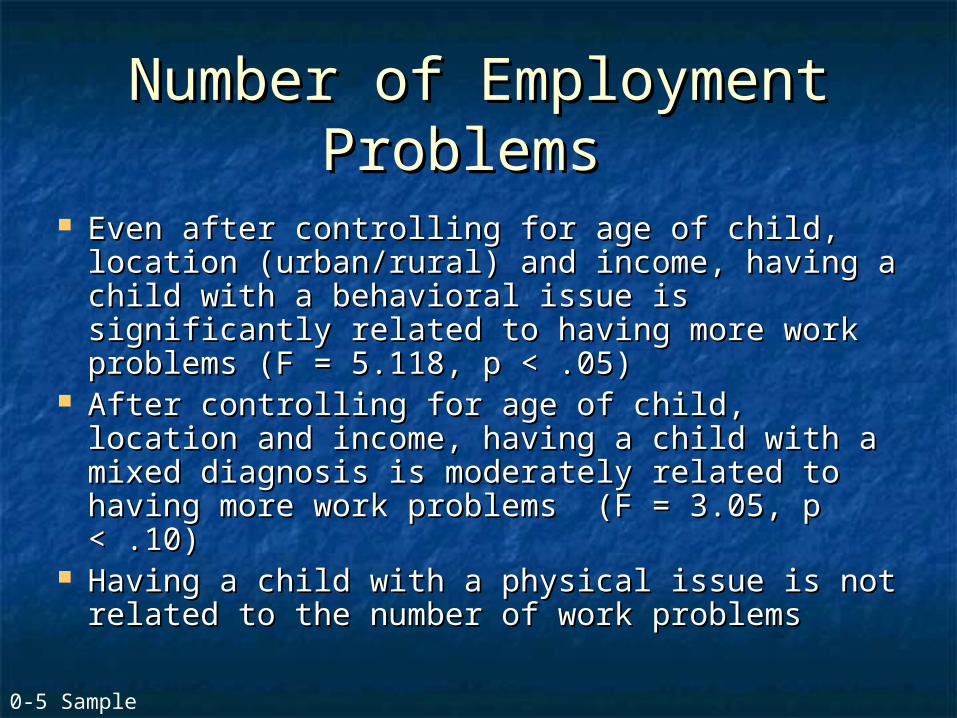
Number of Employment Number of Employment Problems Problems
Even after controlling for age of child, location Even after controlling for age of child, location (urban/rural) and income, having a child with (urban/rural) and income, having a child with a behavioral issue is significantly related to a behavioral issue is significantly related to having more work problems (F = 5.118, p having more work problems (F = 5.118, p < .05)< .05)
After controlling for age of child, location and After controlling for age of child, location and income, having a child with a mixed diagnosis income, having a child with a mixed diagnosis is moderately related to having more work is moderately related to having more work problems (F = 3.05, p < .10)problems (F = 3.05, p < .10)
Having a child with a physical issue is not Having a child with a physical issue is not related to the number of work problemsrelated to the number of work problems
0-5 Sample
Reports:Reports: Parents’ Voices (available in pdf format on Parents’ Voices (available in pdf format on
our web site)our web site) Final Report and issue briefs, Spring, 2005Final Report and issue briefs, Spring, 2005
For more information, please visit our websiteFor more information, please visit our website
at at http://muskie.usm.maine.edu/specialneedshttp://muskie.usm.maine.edu/specialneeds or contact: or contact:
Helen Ward, JD., Project Director/Co-Principal InvestigatorHelen Ward, JD., Project Director/Co-Principal Investigator
207-780-5831207-780-5831
[email protected]@usm.maine.edu
oror
Lisa Morris, PhD.Lisa Morris, PhD., , Co-Principal InvestigatorCo-Principal Investigator
207-780-5846207-780-5846
[email protected]@usm.maine.edu
University of Southern MaineUniversity of Southern Maine
Edmund S. Muskie School of Public PolicyEdmund S. Muskie School of Public Policy
Institute for Child and Family PolicyInstitute for Child and Family Policy