Embed Size (px)
Citation preview
Discussion Papers
Statistics NorwayResearch department
No. 808•May 2015
Nina Drange and Tarjei Havnes
Child care before age two and the development of language and numeracyEvidence from a lottery

Discussion Papers No. 808, May 2015 Statistics Norway, Research Department
Nina Drange and Tarjei Havnes
Child care before age two and the development of language and numeracy Evidence from a lottery
Abstract Young children are thought to be vulnerable to separation from the primary caregiver/s. This raises concern about whether early child care enrollment may harm children's development. We use child care assignment lotteries to estimate the effect of child care starting age on early cognitive achievement in Oslo, Norway. Getting a lottery offer lowers starting age by about four months, from a mean of about 19 months in the control group. Lottery estimates show significant score gains for children at age seven. Survey evidence and an increase in employment of both mothers and fathers following the offer, suggest that parental care is the most relevant alternative mode of care. We document that the assignment lottery generates balance in observable characteristics, supporting our empirical approach.
Keywords: early child care; child development
JEL classification: J13, J21
Acknowledgements: Thanks to Oslo Municipality for generously providing data, institutional detail and feedback on the project, in particular to Eli Aspelund, Thomas Bang and Ragnhild Walberg at HEV. The project received financial support from the Norwegian Research Council (Grant Number 212305 and Grant Number 236947). The project is also part of the research activities at the ESOP center at the Department of Economics, University of Oslo. ESOP is supported by The Research Council of Norway (grant no. 179552).
Address: Nina Drange, Statistics Norway, Research Department. E-mail: [email protected]
Tarjei Havnes, Department of Economics, University of Oslo; Statistics Norway, Research Department, E-mail: [email protected]

Discussion Papers comprise research papers intended for international journals or books. A preprint of a Discussion Paper may be longer and more elaborate than a standard journal article, as it may include intermediate calculations and background material etc.
© Statistics Norway Abstracts with downloadable Discussion Papers in PDF are available on the Internet: http://www.ssb.no/en/forskning/discussion-papers http://ideas.repec.org/s/ssb/dispap.html ISSN 1892-753X (electronic)

3
Sammendrag
Bruken av barnehage blant de minste barna har økt i mange land i løpet av det siste tiåret. I 2010 gikk om lag 43 % av barna under to år i barnehage i USA, og det tilsvarende gjennomsnittet i OECD-land var 33 %, opp fra 20 % i 2003. I flere land er bruken av barnehage vesentlig høyere, med en andel over 50 % i land som Danmark, Korea, Nederland og Norge. Samtidig er både forskere og politikere bekymret for at tidlig barnehagestart, og dermed tidlig separasjon fra den primære omsorgspersonen (vanligvis mor), kan forårsake stress og angst hos barnet, og at dette kan ha potensielt negative effekter for senere utvikling (Bowlby, 1969, Mercer, 2006). Likevel vet vi fremdeles lite om hvordan barnehagen påvirker utviklingen til de minste barna. Dette er bekymringsfullt for beslutningstagere fordi offentlige midler brukes til å subsidiere barnehagen, men også for foreldre som skal bestemme om og når de skal la sine barn starte i barnehagen. I denne artikkelen undersøker vi effekten av barnehage for barn i alderen 1-2 år på senere kognitiv utvikling i språk og regning (målt ved syv års alder). Det er av avgjørende betydning at vi forstår hvilke effekter barnehagen har for denne aldersgruppen, både fordi bruken av barnehage for disse barna øker sterkt, og fordi barn er antatt å være spesielt sårbare i denne perioden. Vi utnytter et randomisert lotteri som brukes i Oslo kommune for å fordele tilbud om barnehage når det er flere barn som søker enn det er tilgjengelige plasser. Dette gir tilfeldig variasjon i alder ved barnehagestart. Vi dokumenterer at den tilfeldige tildelingen genererer to grupper av barn som ser svært like ut på observerbare kjennetegn, noe som støtter vår empiriske tilnærming. Vi har tilgang til unike data på alle som søker plass, hvem som får tilbud og hvem som starter. Dessuten har vi tilgang til kartleggingsprøver i språk og regning når barna er syv år. Vi bruker den tilfeldige fordelingen av barnehageplasser som en instrumentvariabel for barnets alder når han eller hun først starter i barnehagen. Vi benytter data for kohortene 2004-2006, i denne perioden var det langt flere som ønsket barnehage for sine ettåringer enn som faktisk fikk plass. Våre resultater viser at barn som tilfeldig får et tilbud om barnehage presterer bedre på både språk-testen (0,12 SD) og testen i regning (0,12 SD). Mens barn som «vinner i lotteriet» og får tilbud om barnehageplass starter i barnehagen ved ca 15 måneders alder, er gjennomsnittsalderen ved barnehage-start for barn som ikke får et tilbud ca 19 måneder. Blant barna som ikke får et tilbud, starter om lag to tredeler et helt år senere. Kartleggingsprøvene vi benytter som mål på barnas utvikling er konstruert for å plukke opp barn som scorer lavt, så et flertall av barna scorer høyt på prøvene. Dette medfører en skjev fordeling av testresultatene, og vi må derfor vise varsomhet når vi skal fortolke resultatene. Én måte å gjøre dette på, er å sammenligne våre estimater med gapet mellom testresultater for enkelte veldefinerte undergrupper av befolkningen. For eksempel tilsvarer den estimerte effekten av å få et tilbud omtrent det gjennomsnittlige gapet i testprestasjoner mellom gutter og jenter, eller mellom 30 % og 40 % av gapet mellom barn med lavt og høyt utdannede foreldre. Merk likevel at testresultatene vi benytter kan betraktes som toppsensurerte, noe som betyr at gapene vi observerer sannsynligvis er mindre enn hva vi ville ha sett med en mer symmetrisk fordeling av testresultater. Et viktig argument for å subsidiere barnehage, er at barnehagen kan bidra til å utjevne forskjeller i kognitiv utvikling mellom barn fra ulike sosioøkonomiske bakgrunn. Vi finner delvis støtte for dette i våre data: Vi finner sterkere effekter av tidlig barnehage blant barn fra familier med lav inntekt, og ingen effekt blant familier med høy inntekt, verken i språk eller regning. Dette kan tyde på at subsidier til barnehage kan være mer effektive dersom de rettes mot husholdninger med lav inntekt.

4
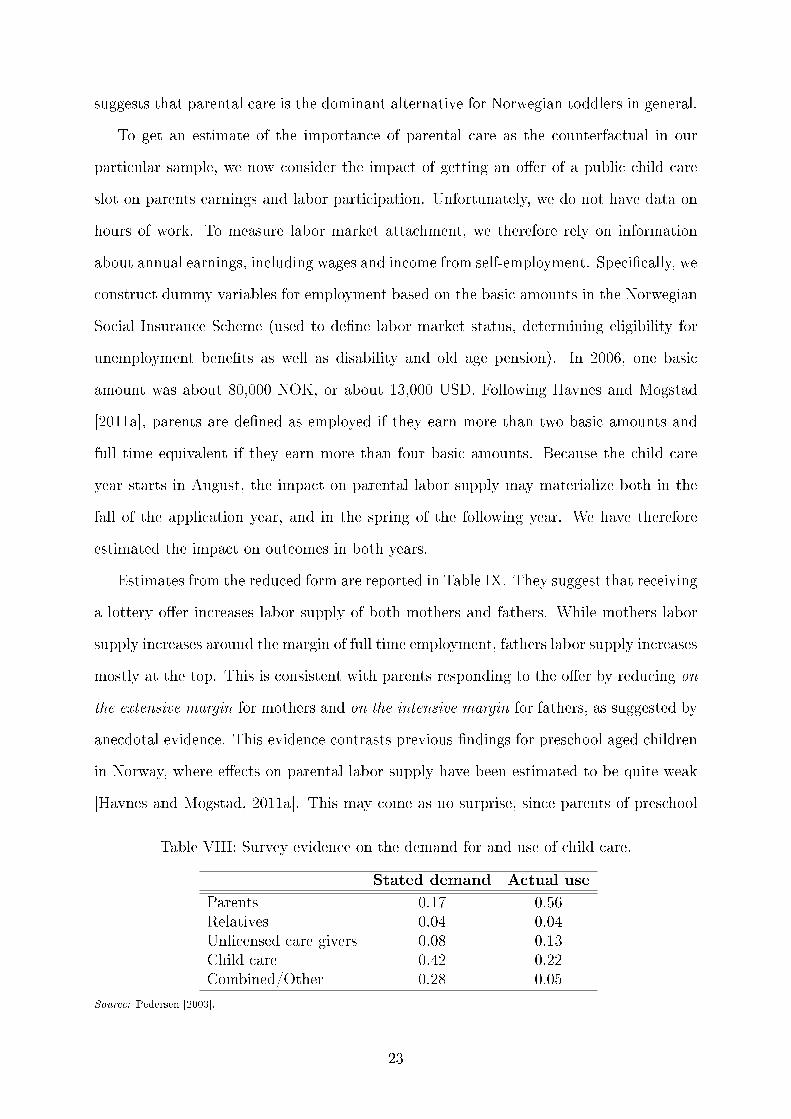
I studier av hvordan barnehagen påvirker barns utvikling, er det viktig å belyse hvilken type barnepass barna ville hatt dersom de ikke hadde fått barnehageplass. Vanligvis vurderer man alternativene foreldreomsorg, og andre, mer uformelle, kilder til omsorg. For å undersøke hvilket alternativ som var mest aktuelt for barna i vår studie, starter vi med å se på resultater fra en spørreundersøkelse fra 2002 der man spurte etter etterspørselen etter og faktisk bruk av barnehage blant foreldre med små barn. Mens opp mot 70 % av foreldrene oppgir at de etterspør barnehage, enten på heltid eller deltid, er det bare 33 % som faktisk har sine små barn i barnehagen. Til sammenligning er det 56 % av foreldrene som sier at de passer på barna sine selv, mens bare 17 % faktisk foretrekker denne løsningen. Dette tyder på at foreldreomsorg er det dominerende alternativet for norske småbarn generelt. For å få et anslag på foreldrenes omsorg kontra mer uformell barnepass undersøker vi virkningen av å få et tilbud om barnehage på foreldrenes arbeidstilbud. Resultatene tyder på at tilbud om barnehage øker arbeidstilbudet noe blant både mødre og fedre.
1 Introduction
Child care enrollment of toddlers has increased in many countries over the last decade.
In 2010, the enrollment of children below age two stood at 43 % in the United States, and
at 33 % in OECD countries, up from 20 % in 2003. In several countries, enrollment is
much higher, with rates above 50 % in countries like Denmark, Korea, the Netherlands and
Norway.1 At the same time, there is concern among both researchers and policymakers
that separation from the primary caregiver, typically the mother, may cause stress and
anxiety in the child, with potentially adverse e�ects on children's development [Bowlby,
1969, Mercer, 2006].2 Yet, evidence on how child care a�ects the development of toddlers
is largely missing.3 This is worrying for policymakers, because programs are often heavily
subsidized, but also for parents who need to decide whether and when to enroll their
children in child care.
In this paper, we provide �rst evidence on the impact of child care enrollment for chil-
dren age 1�2 years old (henceforth toddlers), on their cognitive performance in language
and mathematics at age seven. Determining the impact in this age group is of key impor-
tance, both because enrollment rates are increasing at a strong rate and because children
are thought to be particularly vulnerable during this period. For identi�cation, we exploit
a randomized lottery used by the city government in the Norwegian capital Oslo in order
to allocate o�ers of child care places when child care institutions are over-subscribed, sim-
ilar to the strategy used by Abdulkadiroglu et al. [2011]. This should provide variation in
child care starting age that is as good as random. Indeed, we document that the alloca-
tion mechanism generates balance in observable characteristics, supporting our empirical
approach. Armed with unique data on all applicants, o�ers and enrollment, as well as
1Source: OECD Family data base.2Bowlby [1969] de�nes the attachment phase as the period when the child is from 6�8 months to 24
months old. The age period we study in this paper is largely around 12�24 months.3We are aware of only one other study that estimates how child care a�ects the development of toddlers.
Felfe and Lalive [2014] estimate marginal treatment e�ects of child care attendance before age three usingcounty level variation in child care coverage rates in West Germany. They �nd positive impacts of childcare on the youngest children, boys, and children from low SES families. A related strand of literaturemay indirectly re�ect the e�ects of child care attendance in looking at the e�ect of parental leave policieson child outcomes (e.g. Dustmann and Schønberg [2012], Liu and Skans [2010], Carneiro et al. [2015]).The alternative to parental care in most of this studies is, however, likely to be informal and not formalsources of care.
5
performance tests in language and mathematics at age seven, we use the randomized o�er
of a public child care slot as an instrumental variable for the age of the child when he
or she �rst attends child care. Speci�cally, we consider cohorts born 2004�2006, among
whom there was substantial oversubscription of toddlers to child care institutions in Oslo.
Our results show that children who randomly get an o�er of public child care perform
better on both the language test (0.12 SD) and the mathematics test (0.12 SD) at age 6�7.
Next, while children that get an o�er �rst attend child care at about 15 months of age on
average, children who randomly do not get an o�er �rst attend at about 19 months of age
on average. Among children delayed, about two thirds start a full year later. When we
estimate the impact of child care starting age using the lottery o�er as an instrumental
variable, we �nd that starting child care one month earlier causes an improvement in test
scores of 0.027 SD and 0.028 SD in language and mathematics, respectively.
Because the distribution of the test score we consider is skewed, we must be careful
when interpreting the economic signi�cance of our estimates. One way to do this is to
compare our estimates to the gaps in test scores that we observe between well de�ned
sub-groups of the population. For instance, the estimated impact of getting an o�er
corresponds to about the average gap in test performance between boys and girls, or to
between 30 % and 40 % of the performance gap between children of low and high educated
parents. One should keep in mind, though, that the test scores we consider are essentially
truncated at the top, which means that the observed gaps are likely smaller than what
we would observe with more symmetrically distributed test scores.
One important argument for why governments want to subsidize child care, is that
they can help counter di�erences in school readiness between children from di�erent so-
cioeconomic backgrounds. When estimating in subgroups, our evidence partly supports
this case: We �nd stronger e�ects of early child care start among children from low income
families, and no impact among high income families in neither language nor mathematics.
This suggests that child care policies may be more e�ective if targeted at low income
households.
Our results on how child care a�ects the development of toddlers complement the
6
growing recent literature on how child care institutions a�ect the development of preschool
age children.4 The literature is divided in two distinct branches, one focussed on targeted
programs, and another focussed on universal programs available to the general population.
While studies of targeted programs often �nd positive e�ects,5 the literature on universal
programs is smaller and �ndings are mixed.6 Perhaps as a consequence, the discussion
on child care policies is based largely on the targeted literature and descriptive evidence,
even when the policies considered are universal. In contrast, we study the impact of a
universally available program among applicants that are explicitly not prioritized in child
care.
In studies of how child care a�ects child development, it is crucial to shed light on
the alternative mode of care that children would have been exposed to if they did not
attend child care. Typically, one considers three alternatives: Parental care, formal child
care and other, more informal, sources of care [Blau and Currie, 2006]. To investigate the
counterfactual mode of care for children who get an o�er of a public child care slot, we
start by considering survey data on stated demand and actual use for the population of
parents with toddlers. While about 70 % of parents state demand for child care, either
full time or part time, only 33 % actually have their children enrolled in child care. In
comparison, while 56 % of parents say that they care for their children themselves, only
17 % actually prefer to do so. This suggests that parental care is the dominant alternative
for Norwegian toddlers in general.
To get an estimate of the importance of parental care as the counterfactual in our
particular sample, we next consider the impact of getting an o�er of a public child care
4For recent reviews, see Almond and Currie [2010], Ruhm and Waldfogel [2011], or Baker [2011].5The Perry Preschool and Abecedarian programs are examples of targeted randomized programs (see
Barnett [1995] and Karoly et al. [2005] for surveys of the literature.), while the US Head Start programprovides an example of a targeted non-randomized program (see e.g. Currie [2001] or McKey et al. [1985]for a review of the �ndings). While the picture is somewhat mixed, the most robust evidence on HeadStart tends to show positive e�ects on long-run outcomes such as high school dropout, college attendanceand crime [Currie and Thomas, 1995, Garces et al., 2000, Ludwig and Miller, 2007, Deming, 2009].
6Several studies from Canada show a negative impact on a variety of child outcomes [Baker et al.,2008, Lefebvre and Merrigan, 2008a, DeCicca and Smith, 2013], while Cascio [2009] and Gupta andSimonsen [2010] �nd essentially no impact from child care programs in the US and Denmark, respectively.In contrast, positive impacts on a number of outcomes are found from child care programs in severalcountries, including the US [Fitzpatrick, 2008], Uruguay [Berlinski et al., 2008], Norway [Havnes andMogstad, 2011b, 2014], Germany [Dustmann et al., 2013, Felfe and Lalive, 2014], and Spain [Felfe et al.,2015].
7
slot on parents employment. Results suggest that the o�er increases employment of both
mothers and fathers. While mothers labor supply increases around the margin of full time
employment, fathers labor supply increases mostly at the top. This is consistent with
parents responding to the o�er by reducing the position of mothers and the work hours of
fathers. This evidence contrasts previous �ndings for preschool aged children in Norway,
where e�ects on parental labor supply have been estimated to be quite weak [Havnes and
Mogstad, 2011a].7 At the same time, this may not come as a surprise, since parents of
preschool children may both have stronger options in the informal market and be more
willing to use them, compared to parents of toddlers. Also, our estimates relate to the
mid-2000s, while Havnes and Mogstad [2011a] estimate the impact of the introduction
of child care in Norway from the late 1970s. With much higher employment rates of
Norwegian women in recent years, informal sources of care may well be less available.
The paper proceeds as follows. We �rst discuss the institutional background in Section
2. Section 3 presents and discusses our empirical approach, before Section 4 describes our
data. Section 5 presents our main results, including discussions on heterogeneous impacts
and mechanisms, while section 6 concludes.
2 Institutional background
In this section, we provide brief instititutional background about care of young children
in Norway, with a focus on the child care sector.
Parental leave. In 2005, Norwegian parents were entitled to 43 weeks of parental leave
with full wage compensation (alternatively 53 weeks with 80 % compensation).8 This was
expanded to 44 (54) weeks in 2006. Parents are further entitled to one year each of unpaid
7Evidence from other countries is mixed. In a survey of the early literature, Blau and Currie [2006]report elasticities of maternal employment with respect to the price of child care ranging from 0 to -1.More recently, Baker et al. [2008] �nd a positive e�ect on maternal labor supply following the introductionof heavily subsidized universally available child care in Quebec. Meanwhile, Lundin et al. [2008] �nd nosuch e�ect when studying a childcare reform which capped childcare prices in Sweden. See also Schlosser[2005], Cascio [2009], Havnes and Mogstad [2011b], Lefebvre and Merrigan [2008b] and Berlinski andGaliani [2007]. For a review of the literature, see Blau and Currie [2006].
8This entitlement is conditional on maternal employment during at least six of the ten months beforethe birth. About 85 % of new mothers satisfy this requirement (NOU 2012:15). Remaining parents areentitled to unpaid parental leave with employment protection, and receive a one-time payment of about35,000 NOK.
8

leave in immediate continuation of regular parental leave. In practice, most parents can
thus stay at home with their newborn for about a year.
Structure and content of child care in Norway. To help interpret our results, we
must understand the type of care we are studying. Child care in Norway is heavily
regulated, with provisions on sta� quali�cations, number of children per adult and per
teacher, size of play area, and educational orientation. Institutions are run by an educated
pre-school teacher responsible for day-to-day management and educational content. The
pre-school teacher education is a one year college degree, including supervised practice in
a formal child care institution. The head teacher is responsible for planning, observation,
collaboration and evaluation of all activities. The head teacher is also responsible for
communication and collaboration with parents and local authorities, including health
stations and child welfare services when necessary. Child care regulations specify that
there should be at least one educated pre-school teacher per 10 children aged below three.
In addition, regulations specify that there should be one adult per three children below
three, including the teacher. There is no educational requirements for the additional sta�.
In Oslo, about 60 % of child care institutions are public, while the remaining are privately
operated. Both public and private institutions require municipal approval and supervision
to be entitled to federal subsidies that cover around 80 % of costs. Since 2003, parental
copayment is capped at around 2,500 NOK per month for a full time slot. Child care
institutions are typically open from around 7.30 am to 5 pm.
In terms of educational content, a social pedagogy tradition has dominated child care
practices in Norway since its inception in the 1970s. According to this tradition children
should develop social, language and physical skills mainly through play and informal
learning.9 The informal learning is typically carried out in the context of day-to-day
social interaction between children and sta�, in addition to speci�c activities for di�erent
age groups.
In table I, we report some institutional characteristics of the institutions in our sample.
9The social pedagogy tradition to early education has been especially in�uential in the Nordic coun-tries and Central-Europe. In contrast, a so-called pre-primary pedagogic approach to early educationhas dominated many English and French-speaking countries, favoring formal learning processes to meetexplicit standards for what children should know and be able to do before they start school.
9
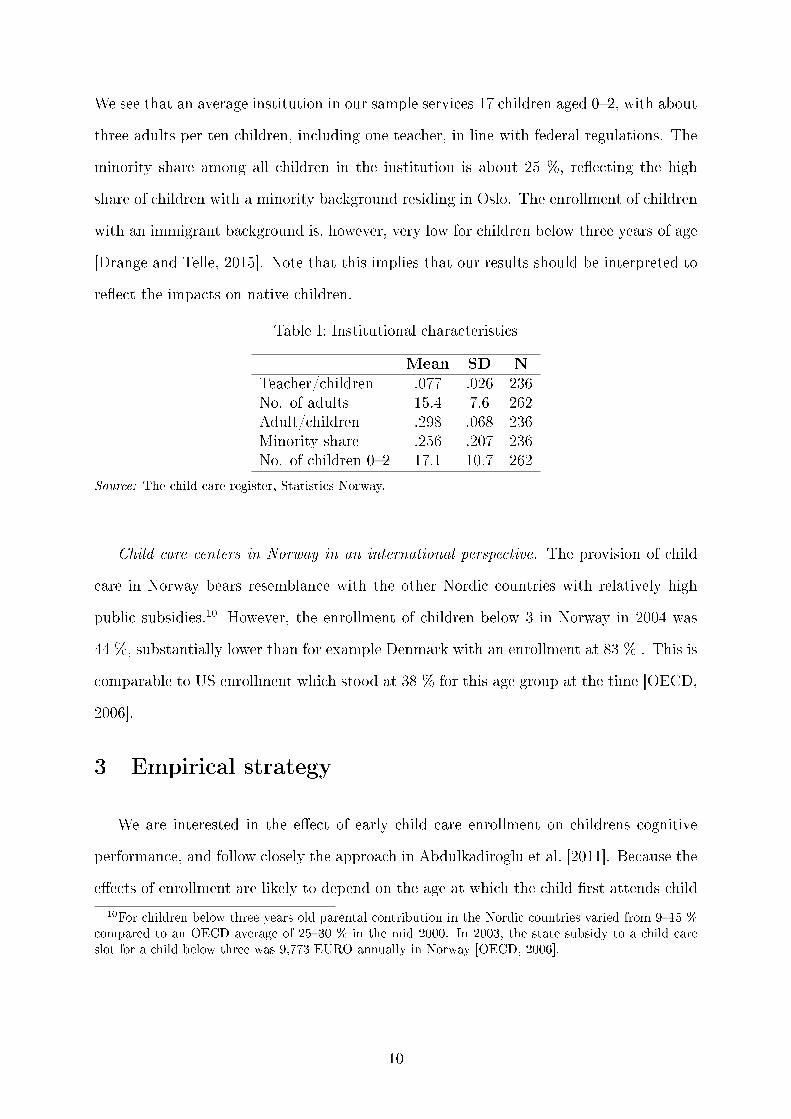
We see that an average institution in our sample services 17 children aged 0�2, with about
three adults per ten children, including one teacher, in line with federal regulations. The
minority share among all children in the institution is about 25 %, re�ecting the high
share of children with a minority background residing in Oslo. The enrollment of children
with an immigrant background is, however, very low for children below three years of age
[Drange and Telle, 2015]. Note that this implies that our results should be interpreted to
re�ect the impacts on native children.
Table I: Institutional characteristics
Mean SD N
Teacher/children .077 .026 236No. of adults 15.4 7.6 262Adult/children .298 .068 236Minority share .256 .207 236No. of children 0�2 17.1 10.7 262
Source: The child care register, Statistics Norway.
Child care centers in Norway in an international perspective. The provision of child
care in Norway bears resemblance with the other Nordic countries with relatively high
public subsidies.10 However, the enrollment of children below 3 in Norway in 2004 was
44 %, substantially lower than for example Denmark with an enrollment at 83 % . This is
comparable to US enrollment which stood at 38 % for this age group at the time [OECD,
2006].
3 Empirical strategy
We are interested in the e�ect of early child care enrollment on childrens cognitive
performance, and follow closely the approach in Abdulkadiroglu et al. [2011]. Because the
e�ects of enrollment are likely to depend on the age at which the child �rst attends child
10For children below three years old parental contribution in the Nordic countries varied from 9�15 %compared to an OECD average of 25�30 % in the mid 2000. In 2003, the state subsidy to a child careslot for a child below three was 9,773 EURO annually in Norway [OECD, 2006].
10
care, we start with the following outcome equation,
yit = γAGEit +X ′itβ + εit (1)
where t denotes the cohort, and AGEit is the age of the child in months when he or she �rst
attends any child care institution, public or private. Xit are a set of socio-demographic
characteristics of the child and parents, measured the year before the child was born.11
Because enrollment in child care is likely determined in part by parental preferences
and child innate characteristics, starting age is likely to be correlated with unobserved
determinants of cognitive performance. For instance, we might expect more able parents
to be more closely tied to the labor market, and therefore enroll their children in child
care earlier. If so, then we may expect that children who are enrolled early would perform
better in any case. On the other hand, we might expect more child-centered parents to
enroll their children in child care later. If so, being enrolled early could be a marker for a
poor home environment, which would suggest that these children should perform worse.
This implies that estimation of equation (1) will give biased estimates of the impact of
child care starting age on cognitive performance.
To circumvent this problem, we take advantage of an assignment lottery used by
the Oslo city administration to distribute o�ers to applicants when institutions were
oversubscribed. Each year, the vast majority of available child care slots in both public
and private institutions are allocated in a centralized allocation round. The application
deadline is around March 1 of each year, for enrollment in mid-August. Parents may
apply for placement in up to seven child care centers in their application, and may list
both public and private institutions.
Allocation takes place inside the city district of residence, but available slots may be
allocated to children from other city districts after the main allocation round. Children
may be awarded priority placement if they have, for instance, a sibling in the same child
care instititution or are disabled. In our sample, 24 % of children get priority placement.
11Child characteristics include gender, month of birth and birth order. Parental characteristics includedummy variables for full time work, receipt of social assistance, high school completion, college degree,missing parental education, and missing parent identi�er.
11
Children that have their �rst birthday after September 1 are not included in the main
allocation round, but may receive o�ers after this round is over. In our analysis we exclude
both of the former groups, to focus on the main group of children that are included in
the main allocation round without being assigned priority.
Based on the applications received, the municipality generates lists of non-priority
applicants to each institution. Lists for private instititutions are transmitted to the in-
stitutions, which handle their own admissions based on these lists along with full details
of the individual child and application. In line with Abdulkadiroglu et al. [2011], we
therefore exclude from our analysis children that have a private institution ranked �rst
on their application.
The mechanism for assignment to public institutions resembles a serial dictatorship:
The order of children on the full list of applicants to each public institution is randomized
in the computer before they are presented to the city o�cial. Available slots are then
allocated according to the random rank on the application list, and o�ers are sent to
parents. Parents may accept or reject the o�er. If they reject, the o�er is conferred to
the highest ranked child on the application list who did not already get an o�er at this
or some other institution. Once a child receives an o�er for a child care place, the child
is taken out of the lists to other institutions to which it applied. The child may, however,
maintain their application to the �rst ranked institution. This along with the upper limit
on institutions on the list could raise concern about strategic application behavior, but
we �nd no suggestions of this below.
The main allocation round ends each year around June 1. After the main allocation
round, available slots may be o�ered to any applicant, whether or not they ranked the
institution on their application. This process is largely at the discretion of the city o�cials
or even child care managers, and is therefore susceptible to manipulation. We therefore
use only o�ers dated before June 1 each year in our analysis.
To help identify the e�ect of early child care enrollment, we use an IV strategy, where
we let the o�ers generated in the assignment lottery act as instruments for child care
starting age. Speci�cally, we specify our IV-model as follows, where equation (2) is the
12
second stage and equation (3) is the �rst stage.
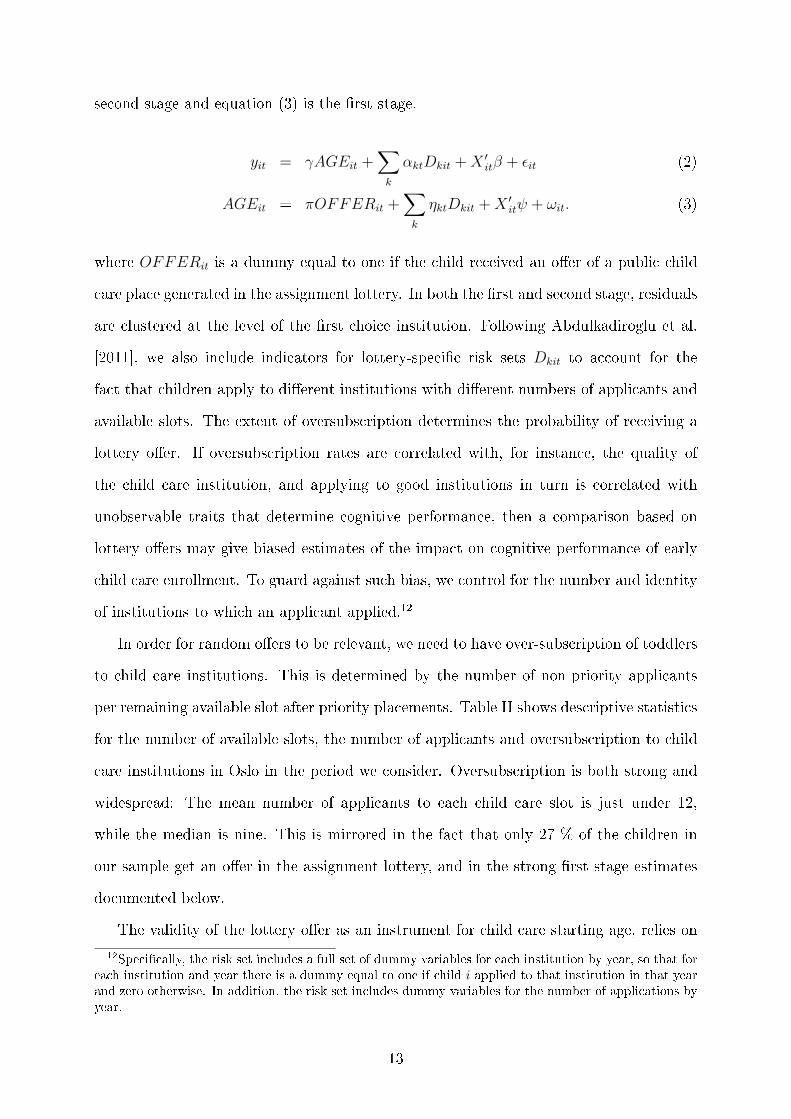
yit = γAGEit +∑k
αktDkit +X ′itβ + εit (2)
AGEit = πOFFERit +∑k
ηktDkit +X ′itψ + ωit. (3)
where OFFERit is a dummy equal to one if the child received an o�er of a public child
care place generated in the assignment lottery. In both the �rst and second stage, residuals
are clustered at the level of the �rst choice institution. Following Abdulkadiroglu et al.
[2011], we also include indicators for lottery-speci�c risk sets Dkit to account for the
fact that children apply to di�erent institutions with di�erent numbers of applicants and
available slots. The extent of oversubscription determines the probability of receiving a
lottery o�er. If oversubscription rates are correlated with, for instance, the quality of
the child care institution, and applying to good institutions in turn is correlated with
unobservable traits that determine cognitive performance, then a comparison based on
lottery o�ers may give biased estimates of the impact on cognitive performance of early
child care enrollment. To guard against such bias, we control for the number and identity
of institutions to which an applicant applied.12
In order for random o�ers to be relevant, we need to have over-subscription of toddlers
to child care institutions. This is determined by the number of non-priority applicants
per remaining available slot after priority placements. Table II shows descriptive statistics
for the number of available slots, the number of applicants and oversubscription to child
care institutions in Oslo in the period we consider. Oversubscription is both strong and
widespread: The mean number of applicants to each child care slot is just under 12,
while the median is nine. This is mirrored in the fact that only 27 % of the children in
our sample get an o�er in the assignment lottery, and in the strong �rst stage estimates
documented below.
The validity of the lottery o�er as an instrument for child care starting age, relies on
12Speci�cally, the risk set includes a full set of dummy variables for each institution by year, so that foreach institution and year there is a dummy equal to one if child i applied to that institution in that yearand zero otherwise. In addition, the risk set includes dummy variables for the number of applications byyear.
13

Table II: Applications, places and oversubscription in child care institutions in the cen-tralized admission process in Oslo, 2005�2007.
Mean SD Min Max
No. of places 6.21 4.75 0 33No. of applicants 50.75 30.49 1 165Applicants � Places 44.55 29.47 1 158Applicants / Places 11.91 11.56 1.5 109
the quality of the assignment lottery. While the city administration ensures us that the
lottery was randomized by a computer algorithm, as described earlier, there is always
the possibility that the randomization failed, or that there was manipulation between the
actual randomization and the sending out of o�ers. To verify that the randomization was
successful, the �rst four columns of Table III reports means and standard deviations of
background characteristics for children in our estimation sample, separately by whether
the child received an o�er or not. Table III shows that the two groups look well balanced.
We also test this formally in the context of our econometric model, by regressing the o�er
dummy on all characteristics, controlling for the risk sets. The �nal column of Table III
reports t-statistics of the individual coe�cients from this regression, which are usually
very low. In a joint test of whether coe�cients on all covariates are equal to zero, we get
an F -value of 1.22, con�rming that the two groups are indeed well balanced.
14
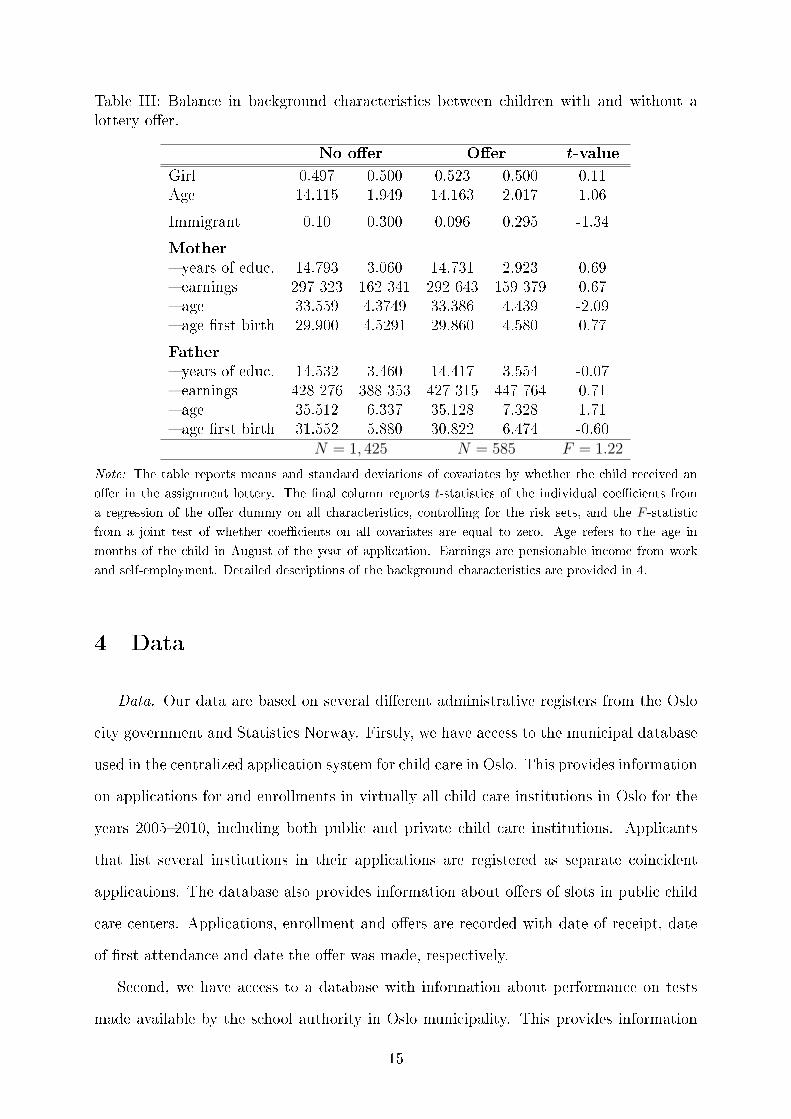
Table III: Balance in background characteristics between children with and without alottery o�er.
No o�er O�er t-value
Girl 0.497 0.500 0.523 0.500 0.11Age 14.115 1.949 14.163 2.017 1.06
Immigrant 0.10 0.300 0.096 0.295 -1.34
Mother
� years of educ. 14.793 3.060 14.731 2.923 0.69� earnings 297 323 162 341 292 643 159 379 0.67� age 33.559 4.3749 33.386 4.439 -2.09� age �rst birth 29.900 4.5291 29.860 4.580 0.77
Father
� years of educ. 14.532 3.460 14.417 3.554 -0.07� earnings 428 276 388 353 427 315 447 764 0.71� age 35.512 6.337 35.128 7.328 1.71� age �rst birth 31.552 5.880 30.822 6.474 -0.60
N = 1, 425 N = 585 F = 1.22
Note: The table reports means and standard deviations of covariates by whether the child received an
o�er in the assignment lottery. The �nal column reports t-statistics of the individual coe�cients from
a regression of the o�er dummy on all characteristics, controlling for the risk sets, and the F -statistic
from a joint test of whether coe�cients on all covariates are equal to zero. Age refers to the age in
months of the child in August of the year of application. Earnings are pensionable income from work
and self-employment. Detailed descriptions of the background characteristics are provided in 4.
4 Data
Data. Our data are based on several di�erent administrative registers from the Oslo
city government and Statistics Norway. Firstly, we have access to the municipal database
used in the centralized application system for child care in Oslo. This provides information
on applications for and enrollments in virtually all child care institutions in Oslo for the
years 2005�2010, including both public and private child care institutions. Applicants
that list several institutions in their applications are registered as separate coincident
applications. The database also provides information about o�ers of slots in public child
care centers. Applications, enrollment and o�ers are recorded with date of receipt, date
of �rst attendance and date the o�er was made, respectively.
Second, we have access to a database with information about performance on tests
made available by the school authority in Oslo municipality. This provides information
15

about enrollment in primary school and score on performance tests in Norwegian language
and mathematics, conducted in April of �rst grade. The tests are designed nationally,
and are intended to help identify underperforming children, enabling schools to allocate
resources to these children. The language test maps the ability to write letters, recognize
written letters, identify spoken letters, combine sounds, write words, read words and read
sentences. The mathematics test maps the ability to count, to compare numbers, to rank
numbers, to recognize sequences of numbers, to count forward and backward from a given
number, to split a number into two other numbers (i.e. 4 = 1 + . . .), to solve textual
assignments and to add two numbers. We provide further detail on these tests in the
appendix.
Each test is scored on a relatively �ne scale, where students may score from zero to
105 in language, and zero to 50 in mathematics. Because tests are designed to identify
children with problems, test score distributions are skewed,13 with about ten and 15 % of
children in our sample getting the top score in language and mathematics, respectively.
This is important to keep in mind when interpreting our results.
In our analysis, we consider two outcomes from each test. First, we normalize the
scores to have mean zero and standard deviation equal to one. Second, we use dummy
variables for performance below a nationally determined threshold. Thresholds are set for
individual parts of each test from a trial of the test on a panel of children, conducted prior
to actual testing each year. The thresholds are intended to identify the bottom 15�20 %
of children. From these we de�ne the dummy variables Below threshold equal to one if
the child has one or more test parts with scores below the threshold, and zero otherwise,
separately for language and mathematics. Finally, as a summary measure of cognitive
skills, we also consider the unweighted average of the standardized test scores in language
and mathematics.
Third, we can link both databases to rich Norwegian administrative registers avail-
able from Statistics Norway, with individual information on demographics (e.g. sex, age,
immigrant status, marital status, number of children), socioeconomic status (e.g. years
13Appendix �gure (A1) draws the distribution of test scores in our sample.
16
of education, income, employment status), and residence. Income and employment data
are collected from tax records and other administrative registers. The household infor-
mation is from the Central Population Register, which is updated annually by the local
population registries and veri�ed by the Norwegian Tax Authority. We also have access
to national registry data on municipal child care coverage reported by the child care in-
stitutions themselves. The reliability of Norwegian register data is considered to be very
good, as is documented by the fact that they received the highest rating in a data qual-
ity assessment prepared for the OECD by Atkinson et al. [1995]. Importantly, all data
sources contain personal identi�ers that allow us to link individuals across all registers.
Estimation sample. We start with the universe of children born 2004�2006,14 for whom
parents apply for a child care slot in Oslo for the �rst time the calender year they turn one
year old. Because our identi�cation comes from o�ers of public child care slots, we focus
attention on children with a public institution on the �rst rank, while we allow both private
and public institutions on ranks 2�7. As discussed above, we also exclude children who had
priority in child care or who turn one after September 1 in the application year, since our
identi�cation does not in�uence these children. We �nally exclude a handful of children
with missing values on our dependent variables, and a handful of children registered as
starting in child care before ten months old. Rather than excluding children with missing
values on control variables, we construct dummy variables for missing and include these
in our regressions. Our �nal estimation sample then consists of 2,010 children.
5 Empirical results
We now turn to our main analysis of how early enrollment in child care a�ected the
cognitive performance of children at age seven. We start by a reduced form analysis,
where we compare outcomes of children who got a lottery o�er to children who did not
get a lottery o�er. Table IV shows means and standard deviations of our main outcome
variables and our key explanatory variable, child care starting age. The mean test scores
14Due to a restrictive storage policy in the municipality, data on children born in January and February2004 were deleted from the application data base before we got access to it. We are therefore not able toinclude these children in our sample.
17
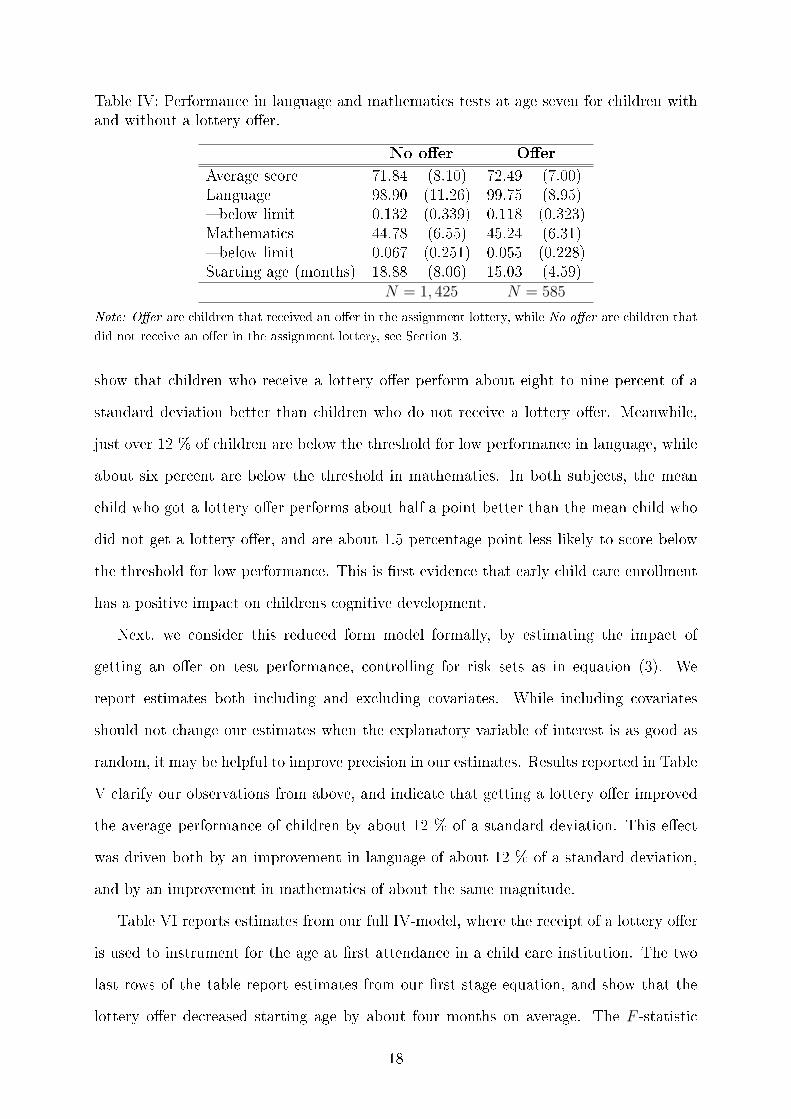
Table IV: Performance in language and mathematics tests at age seven for children withand without a lottery o�er.
No o�er O�er
Average score 71.84 (8.10) 72.49 (7.00)Language 98.90 (11.26) 99.75 (8.95)� below limit 0.132 (0.339) 0.118 (0.323)Mathematics 44.78 (6.55) 45.24 (6.31)� below limit 0.067 (0.251) 0.055 (0.228)Starting age (months) 18.88 (8.06) 15.03 (4.59)
N = 1, 425 N = 585
Note: O�er are children that received an o�er in the assignment lottery, while No o�er are children that
did not receive an o�er in the assignment lottery, see Section 3.
show that children who receive a lottery o�er perform about eight to nine percent of a
standard deviation better than children who do not receive a lottery o�er. Meanwhile,
just over 12 % of children are below the threshold for low performance in language, while
about six percent are below the threshold in mathematics. In both subjects, the mean
child who got a lottery o�er performs about half a point better than the mean child who
did not get a lottery o�er, and are about 1.5 percentage point less likely to score below
the threshold for low performance. This is �rst evidence that early child care enrollment
has a positive impact on childrens cognitive development.
Next, we consider this reduced form model formally, by estimating the impact of
getting an o�er on test performance, controlling for risk sets as in equation (3). We
report estimates both including and excluding covariates. While including covariates
should not change our estimates when the explanatory variable of interest is as good as
random, it may be helpful to improve precision in our estimates. Results reported in Table
V clarify our observations from above, and indicate that getting a lottery o�er improved
the average performance of children by about 12 % of a standard deviation. This e�ect
was driven both by an improvement in language of about 12 % of a standard deviation,
and by an improvement in mathematics of about the same magnitude.
Table VI reports estimates from our full IV-model, where the receipt of a lottery o�er
is used to instrument for the age at �rst attendance in a child care institution. The two
last rows of the table report estimates from our �rst stage equation, and show that the
lottery o�er decreased starting age by about four months on average. The F -statistic
18
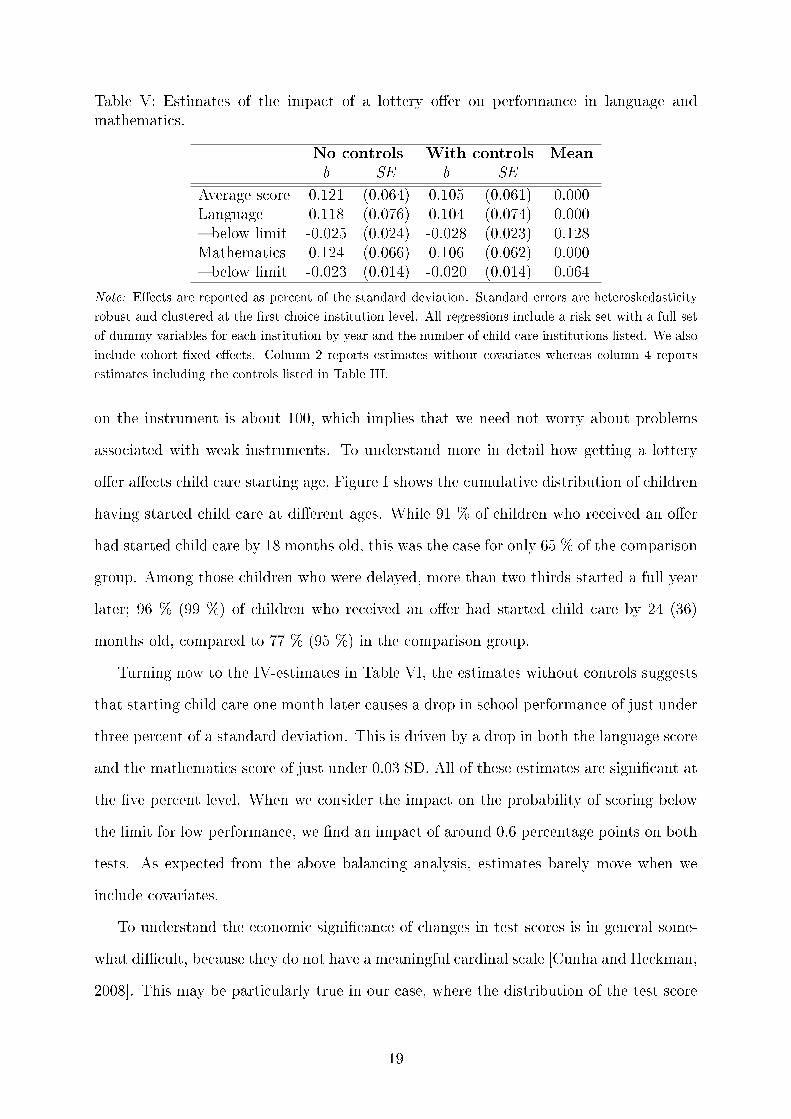
Table V: Estimates of the impact of a lottery o�er on performance in language andmathematics.
No controls With controls Mean
b SE b SE
Average score 0.121 (0.064) 0.105 (0.061) 0.000Language 0.118 (0.076) 0.104 (0.074) 0.000� below limit -0.025 (0.024) -0.028 (0.023) 0.128Mathematics 0.124 (0.066) 0.106 (0.062) 0.000� below limit -0.023 (0.014) -0.020 (0.014) 0.064
Note: E�ects are reported as percent of the standard deviation. Standard errors are heteroskedasticity
robust and clustered at the �rst choice institution level. All regressions include a risk set with a full set
of dummy variables for each institution by year and the number of child care institutions listed. We also
include cohort �xed e�ects. Column 2 reports estimates without covariates whereas column 4 reports
estimates including the controls listed in Table III.
on the instrument is about 100, which implies that we need not worry about problems
associated with weak instruments. To understand more in detail how getting a lottery
o�er a�ects child care starting age, Figure I shows the cumulative distribution of children
having started child care at di�erent ages. While 91 % of children who received an o�er
had started child care by 18 months old, this was the case for only 65 % of the comparison
group. Among those children who were delayed, more than two thirds started a full year
later; 96 % (99 %) of children who received an o�er had started child care by 24 (36)
months old, compared to 77 % (95 %) in the comparison group.
Turning now to the IV-estimates in Table VI, the estimates without controls suggests
that starting child care one month later causes a drop in school performance of just under
three percent of a standard deviation. This is driven by a drop in both the language score
and the mathematics score of just under 0.03 SD. All of these estimates are signi�cant at
the �ve percent level. When we consider the impact on the probability of scoring below
the limit for low performance, we �nd an impact of around 0.6 percentage points on both
tests. As expected from the above balancing analysis, estimates barely move when we
include covariates.
To understand the economic signi�cance of changes in test scores is in general some-
what di�cult, because they do not have a meaningful cardinal scale [Cunha and Heckman,
2008]. This may be particularly true in our case, where the distribution of the test score
19
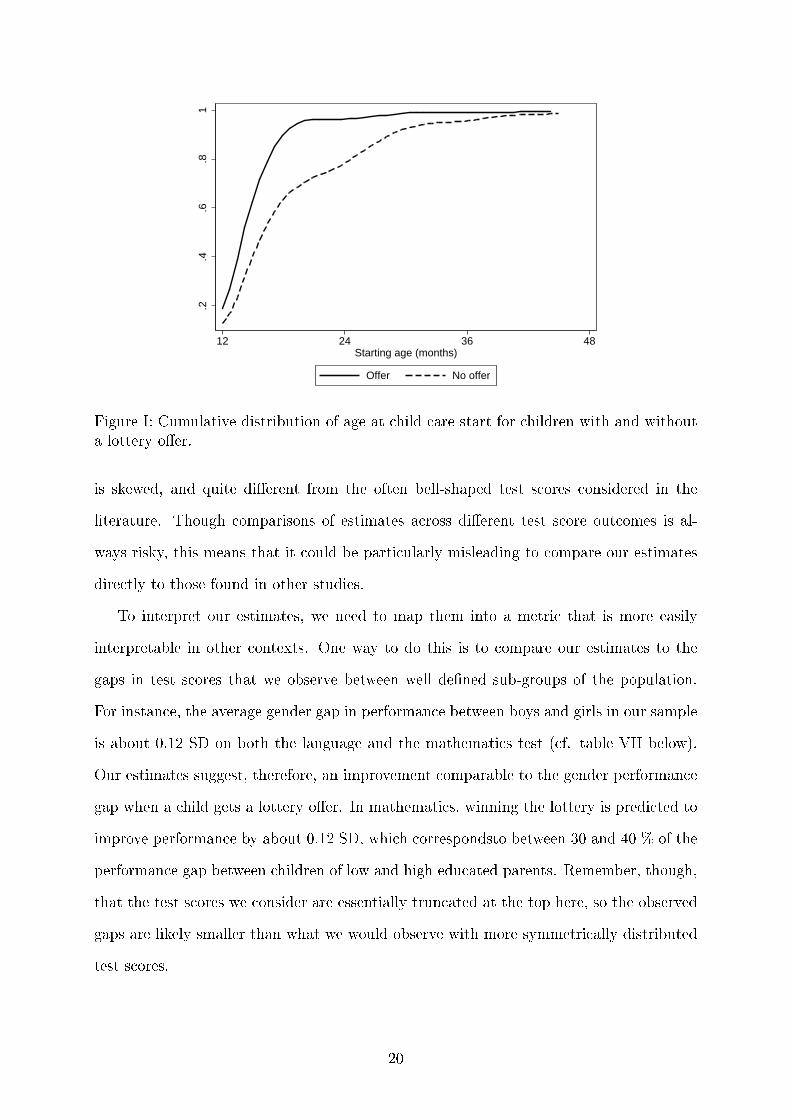
.2.4
.6.8
1
12 24 36 48Starting age (months)
Offer No offer
Figure I: Cumulative distribution of age at child care start for children with and withouta lottery o�er.
is skewed, and quite di�erent from the often bell-shaped test scores considered in the
literature. Though comparisons of estimates across di�erent test score outcomes is al-
ways risky, this means that it could be particularly misleading to compare our estimates
directly to those found in other studies.
To interpret our estimates, we need to map them into a metric that is more easily
interpretable in other contexts. One way to do this is to compare our estimates to the
gaps in test scores that we observe between well de�ned sub-groups of the population.
For instance, the average gender gap in performance between boys and girls in our sample
is about 0.12 SD on both the language and the mathematics test (cf. table VII below).
Our estimates suggest, therefore, an improvement comparable to the gender performance
gap when a child gets a lottery o�er. In mathematics, winning the lottery is predicted to
improve performance by about 0.12 SD, which correspondsto between 30 and 40 % of the
performance gap between children of low and high educated parents. Remember, though,
that the test scores we consider are essentially truncated at the top here, so the observed
gaps are likely smaller than what we would observe with more symmetrically distributed
test scores.
20
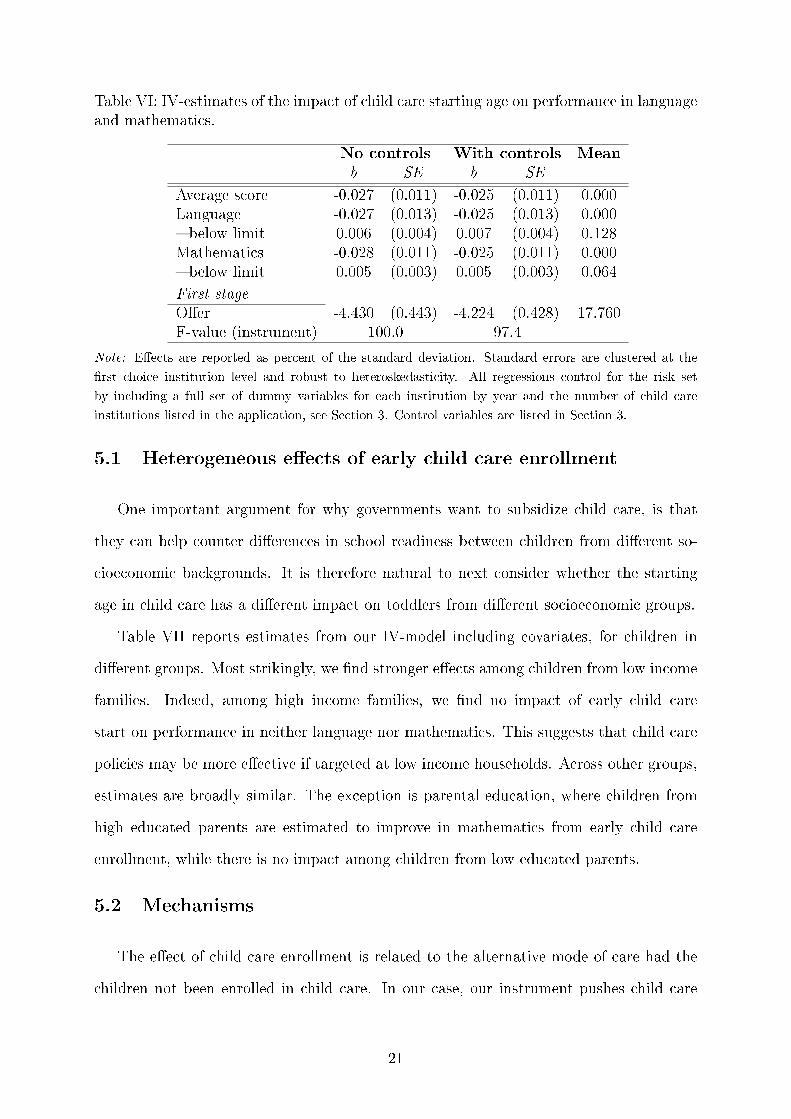
Table VI: IV-estimates of the impact of child care starting age on performance in languageand mathematics.
No controls With controls Mean
b SE b SE
Average score -0.027 (0.011) -0.025 (0.011) 0.000Language -0.027 (0.013) -0.025 (0.013) 0.000� below limit 0.006 (0.004) 0.007 (0.004) 0.128Mathematics -0.028 (0.011) -0.025 (0.011) 0.000� below limit 0.005 (0.003) 0.005 (0.003) 0.064
First stageO�er -4.430 (0.443) -4.224 (0.428) 17.760F-value (instrument) 100.0 97.4
Note: E�ects are reported as percent of the standard deviation. Standard errors are clustered at the
�rst choice institution level and robust to heteroskedasticity. All regressions control for the risk set
by including a full set of dummy variables for each institution by year and the number of child care
institutions listed in the application, see Section 3. Control variables are listed in Section 3.
5.1 Heterogeneous e�ects of early child care enrollment
One important argument for why governments want to subsidize child care, is that
they can help counter di�erences in school readiness between children from di�erent so-
cioeconomic backgrounds. It is therefore natural to next consider whether the starting
age in child care has a di�erent impact on toddlers from di�erent socioeconomic groups.
Table VII reports estimates from our IV-model including covariates, for children in
di�erent groups. Most strikingly, we �nd stronger e�ects among children from low income
families. Indeed, among high income families, we �nd no impact of early child care
start on performance in neither language nor mathematics. This suggests that child care
policies may be more e�ective if targeted at low income households. Across other groups,
estimates are broadly similar. The exception is parental education, where children from
high educated parents are estimated to improve in mathematics from early child care
enrollment, while there is no impact among children from low educated parents.
5.2 Mechanisms
The e�ect of child care enrollment is related to the alternative mode of care had the
children not been enrolled in child care. In our case, our instrument pushes child care
21
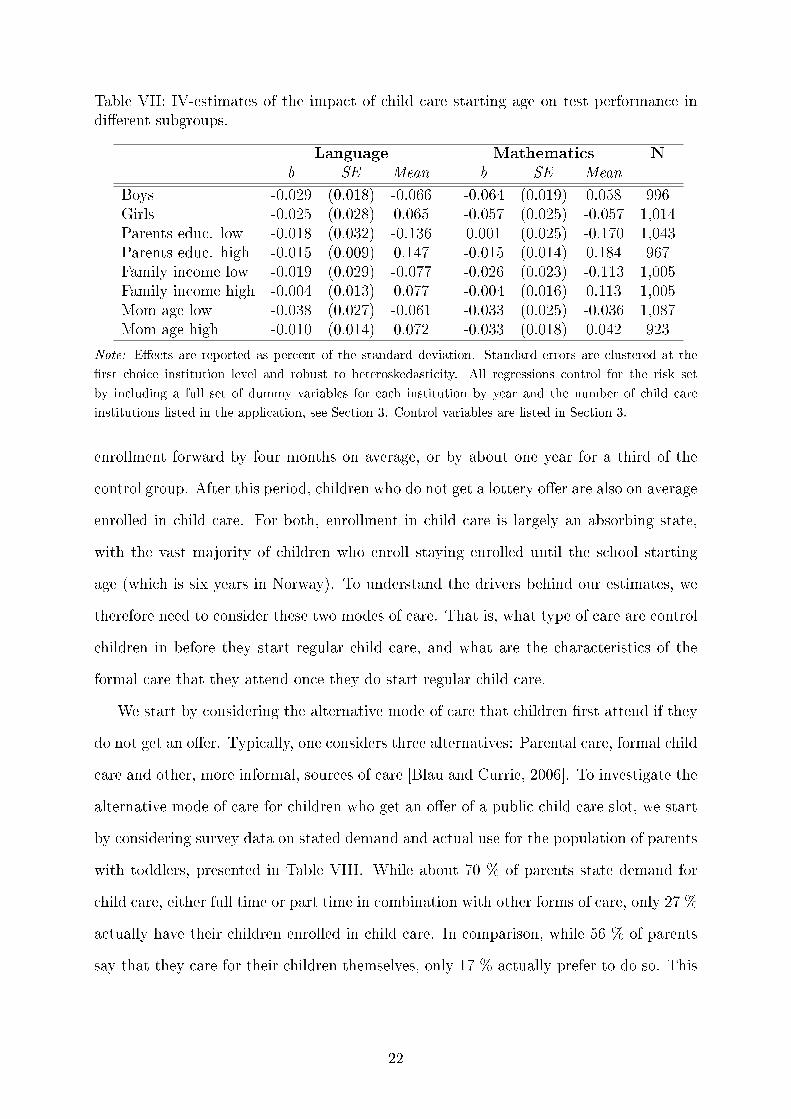
Table VII: IV-estimates of the impact of child care starting age on test performance indi�erent subgroups.
Language Mathematics N
b SE Mean b SE Mean
Boys -0.029 (0.018) -0.066 -0.064 (0.019) 0.058 996Girls -0.025 (0.028) 0.065 -0.057 (0.025) -0.057 1,014Parents educ. low -0.018 (0.032) -0.136 0.001 (0.025) -0.170 1,043Parents educ. high -0.015 (0.009) 0.147 -0.015 (0.014) 0.184 967Family income low -0.019 (0.029) -0.077 -0.026 (0.023) -0.113 1,005Family income high -0.004 (0.013) 0.077 -0.004 (0.016) 0.113 1,005Mom age low -0.038 (0.027) -0.061 -0.033 (0.025) -0.036 1,087Mom age high -0.010 (0.014) 0.072 -0.033 (0.018) 0.042 923
Note: E�ects are reported as percent of the standard deviation. Standard errors are clustered at the
�rst choice institution level and robust to heteroskedasticity. All regressions control for the risk set
by including a full set of dummy variables for each institution by year and the number of child care
institutions listed in the application, see Section 3. Control variables are listed in Section 3.
enrollment forward by four months on average, or by about one year for a third of the
control group. After this period, children who do not get a lottery o�er are also on average
enrolled in child care. For both, enrollment in child care is largely an absorbing state,
with the vast majority of children who enroll staying enrolled until the school starting
age (which is six years in Norway). To understand the drivers behind our estimates, we
therefore need to consider these two modes of care. That is, what type of care are control
children in before they start regular child care, and what are the characteristics of the
formal care that they attend once they do start regular child care.
We start by considering the alternative mode of care that children �rst attend if they
do not get an o�er. Typically, one considers three alternatives: Parental care, formal child
care and other, more informal, sources of care [Blau and Currie, 2006]. To investigate the
alternative mode of care for children who get an o�er of a public child care slot, we start
by considering survey data on stated demand and actual use for the population of parents
with toddlers, presented in Table VIII. While about 70 % of parents state demand for
child care, either full time or part time in combination with other forms of care, only 27 %
actually have their children enrolled in child care. In comparison, while 56 % of parents
say that they care for their children themselves, only 17 % actually prefer to do so. This
22
suggests that parental care is the dominant alternative for Norwegian toddlers in general.
To get an estimate of the importance of parental care as the counterfactual in our
particular sample, we now consider the impact of getting an o�er of a public child care
slot on parents earnings and labor participation. Unfortunately, we do not have data on
hours of work. To measure labor market attachment, we therefore rely on information
about annual earnings, including wages and income from self-employment. Speci�cally, we
construct dummy variables for employment based on the basic amounts in the Norwegian
Social Insurance Scheme (used to de�ne labor market status, determining eligibility for
unemployment bene�ts as well as disability and old age pension). In 2006, one basic
amount was about 80,000 NOK, or about 13,000 USD. Following Havnes and Mogstad
[2011a], parents are de�ned as employed if they earn more than two basic amounts and
full time equivalent if they earn more than four basic amounts. Because the child care
year starts in August, the impact on parental labor supply may materialize both in the
fall of the application year, and in the spring of the following year. We have therefore
estimated the impact on outcomes in both years.
Estimates from the reduced form are reported in Table IX. They suggest that receiving
a lottery o�er increases labor supply of both mothers and fathers. While mothers labor
supply increases around the margin of full time employment, fathers labor supply increases
mostly at the top. This is consistent with parents responding to the o�er by reducing on
the extensive margin for mothers and on the intensive margin for fathers, as suggested by
anecdotal evidence. This evidence contrasts previous �ndings for preschool aged children
in Norway, where e�ects on parental labor supply have been estimated to be quite weak
[Havnes and Mogstad, 2011a]. This may come as no surprise, since parents of preschool
Table VIII: Survey evidence on the demand for and use of child care.
Stated demand Actual use
Parents 0.17 0.56Relatives 0.04 0.04Unlicensed care givers 0.08 0.13Child care 0.42 0.22Combined/Other 0.28 0.05
Source: Pedersen [2003].
23
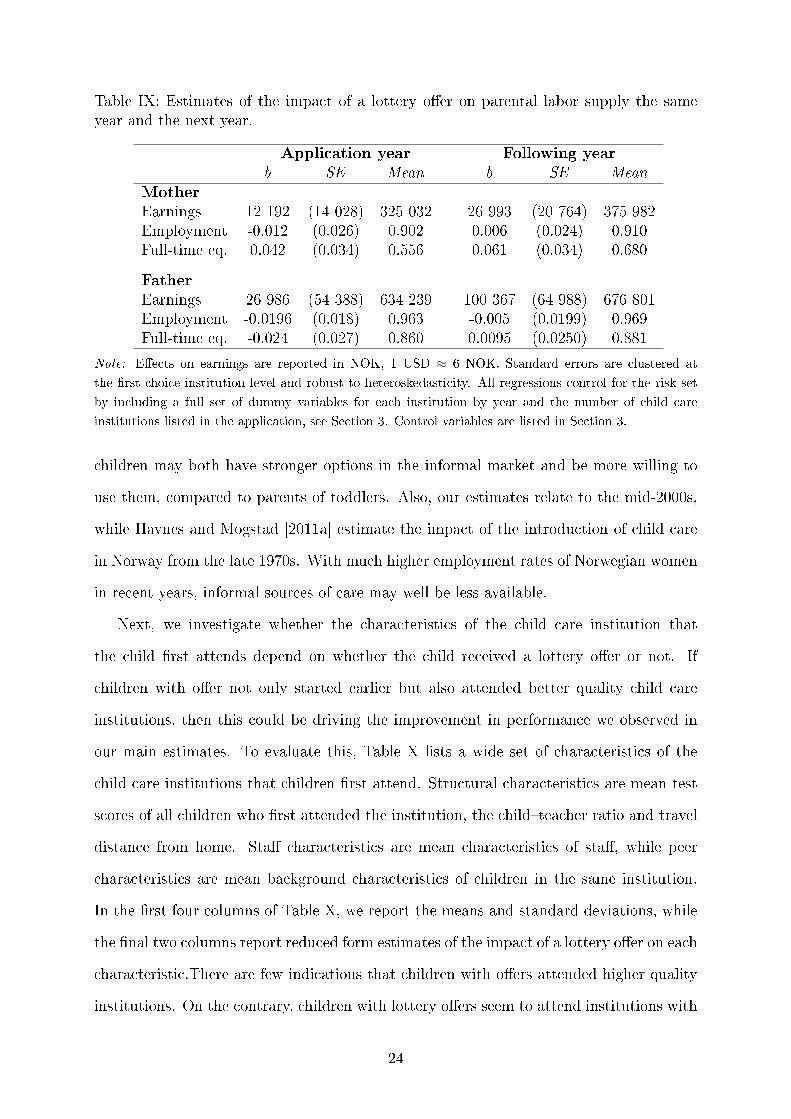
Table IX: Estimates of the impact of a lottery o�er on parental labor supply the sameyear and the next year.
Application year Following year
b SE Mean b SE MeanMother
Earnings 12 192 (14 028) 325 032 26 993 (20 764) 375 982Employment -0.012 (0.026) 0.902 0.006 (0.024) 0.910Full-time eq. 0.042 (0.034) 0.556 0.061 (0.034) 0.680
Father
Earnings 26 986 (54 388) 634 239 100 367 (64 988) 676 801Employment -0.0196 (0.018) 0.963 -0.005 (0.0199) 0.969Full-time eq. -0.024 (0.027) 0.860 0.0095 (0.0250) 0.881
Note: E�ects on earnings are reported in NOK, 1 USD ≈ 6 NOK. Standard errors are clustered at
the �rst choice institution level and robust to heteroskedasticity. All regressions control for the risk set
by including a full set of dummy variables for each institution by year and the number of child care
institutions listed in the application, see Section 3. Control variables are listed in Section 3.
children may both have stronger options in the informal market and be more willing to
use them, compared to parents of toddlers. Also, our estimates relate to the mid-2000s,
while Havnes and Mogstad [2011a] estimate the impact of the introduction of child care
in Norway from the late 1970s. With much higher employment rates of Norwegian women
in recent years, informal sources of care may well be less available.
Next, we investigate whether the characteristics of the child care institution that
the child �rst attends depend on whether the child received a lottery o�er or not. If
children with o�er not only started earlier but also attended better quality child care
institutions, then this could be driving the improvement in performance we observed in
our main estimates. To evaluate this, Table X lists a wide set of characteristics of the
child care institutions that children �rst attend. Structural characteristics are mean test
scores of all children who �rst attended the institution, the child�teacher ratio and travel
distance from home. Sta� characteristics are mean characteristics of sta�, while peer
characteristics are mean background characteristics of children in the same institution.
In the �rst four columns of Table X, we report the means and standard deviations, while
the �nal two columns report reduced form estimates of the impact of a lottery o�er on each
characteristic.There are few indications that children with o�ers attended higher quality
institutions. On the contrary, children with lottery o�ers seem to attend institutions with
24
Table X: Characteristics of the �rst child care institution attended for children with andwithout a lottery o�er
No o�er O�er Red. form
Mean SD Mean SD b SE
Structural characteristics
Language 98.668 6.077 98.645 5.358 -0.493 0.357� below limit 44.427 3.766 44.772 3.139 0.128 0.230Mathematics 0.130 0.169 0.123 0.149 0.008 0.010� below limit 0.083 0.141 0.067 0.102 -0.013 0.010Children/teacher 14.732 7.968 16.950 6.102 1.309 0.675Distance (km) 3.206 4.031 2.315 3.559 -0.535 0.293Distance (min) 6.215 7.239 4.330 5.864 -1.066 0.543
Sta� characteristics
Income 249,267 41,712 261,939 26,632 13,163 3,379College graduates 0.361 0.155 0.3570 0.100 0.001 0.012Immigrants 0.233 0.193 0.2247 0.153 -0.006 0.014Males 0.110 0.115 0.1053 0.100 -0.006 0.010Age 36.913 6.354 39.2731 5.137 1.699 0.524
Peer characteristics
Family income 760,797 273,276 734,690 239,658 -23,174 16,747College graduates 0.505 0.242 0.474 0.216 -0.003 0.014Immigrants 0.074 0.117 0.088 0.124 0.010 0.007Males 0.500 0.196 0.503 0.193 0.009 0.014Young 0.498 0.217 0.466 0.188 -0.023 0.014
Note: O�er are children that received an o�er from the assignment lottery, while No o�er are children
that did not receive an o�er from the assignment lottery, see Section 3. Mean re�ects average charac-
teristics of the child care center that the child �rst attends. The �rst four columns report means and
standard deviations. The �nal two columns report reduced form-estimates from our IV-model, including
all covariates and a full set of dummy variables for each institution by year and the number of child care
institutions listed in the application, see Section 3.
slightly less teachers and adults per child, higher minority shares and larger numbers of
children. At the same time the sta� and peer composition is largely similar across the
two groups.
25
9999
.299
.499
.699
.810
0
12 18 24 30 36Starting child care before age (months)
Offer No offer
(a) Language
44.8
4545
.245
.445
.6
12 18 24 30 36Starting child care before age (months)
Offer No offer
(b) Mathematics
Figure II: Performance in language and mathematics by child care starting age, for chil-dren with and without a lottery o�er.Note: Figures show local linear regression estimates of mean language and mathematics performance
against starting age in child care, using an epanichnikov kernel with bandwidth set to one month.
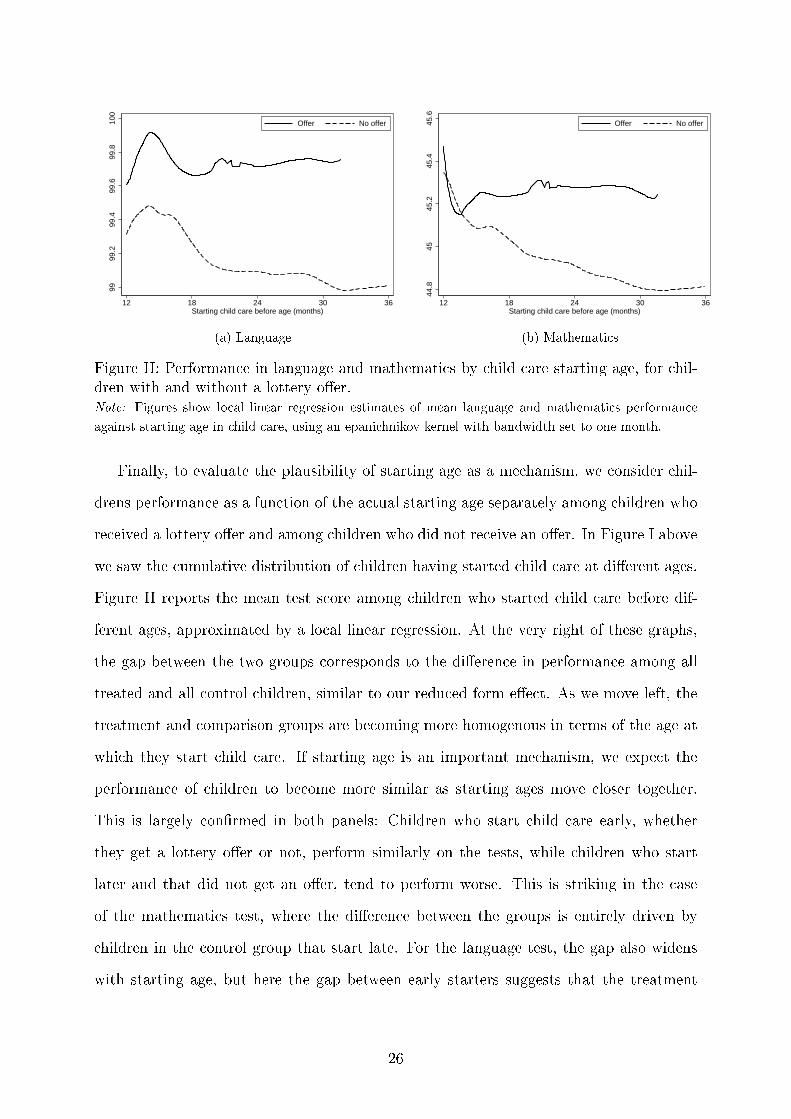
Finally, to evaluate the plausibility of starting age as a mechanism, we consider chil-
drens performance as a function of the actual starting age separately among children who
received a lottery o�er and among children who did not receive an o�er. In Figure I above
we saw the cumulative distribution of children having started child care at di�erent ages.
Figure II reports the mean test score among children who started child care before dif-
ferent ages, approximated by a local linear regression. At the very right of these graphs,
the gap between the two groups corresponds to the di�erence in performance among all
treated and all control children, similar to our reduced form e�ect. As we move left, the
treatment and comparison groups are becoming more homogenous in terms of the age at
which they start child care. If starting age is an important mechanism, we expect the
performance of children to become more similar as starting ages move closer together.
This is largely con�rmed in both panels: Children who start child care early, whether
they get a lottery o�er or not, perform similarly on the tests, while children who start
later and that did not get an o�er, tend to perform worse. This is striking in the case
of the mathematics test, where the di�erence between the groups is entirely driven by
children in the control group that start late. For the language test, the gap also widens
with starting age, but here the gap between early starters suggests that the treatment
26
also generates other relevant di�erences.
6 Concluding remarks
Child care enrollment of young children is substantial and growing, and child care is
often heavily subsidized by the government. At the same time, there is concern among
both researchers and policymakers that separation from the primary caregiver, typically
the mother, may cause stress and anxiety in the child, with potentially adverse e�ects
on children's development [Bowlby, 1969, Mercer, 2006]. Yet, evidence on how child care
a�ects the development of toddlers is largely missing.
In this paper, we present evidence on the impact of early child care enrollment on
the cognitive performance of children at age seven. Results indicate that early child care
enrollment has a bene�cial e�ect for children's performance both on a language test and
on a mathematics test. Looking across subgroups, we �nd stronger e�ects of starting child
care early among children from low income families, and no impact among high income
families in neither language nor mathematics. This suggests that child care policies may
be more e�ective if targeted at low income households.
Our results on how child care a�ects the development of toddlers extends the growing
recent literature on how child care institutions a�ect the development of preschool age
children. While results are mixed, several studies have shown positive e�ects, in particular
for children from disadvantaged families. Our study shows that positive e�ects of child
care are not unique to preschool children, but can be extended also to toddlers below
18 months of age. Importantly, our estimates lend no support to the concerns about
detrimental impact of child care at early ages. This is true even though children who are
stopped from starting child care early are likely to be at home with a parent.
References
Atila Abdulkadiroglu, Joshua D. Angrist, Susan M. Dynarski, Thomas J.
Kane, and Parag A. Pathak. Accountability and �exibility in public
schools: Evidence from boston's charters and pilots. The Quarterly Jour-
27

nal of Economics, 126(2):699�748, 2011. doi: 10.1093/qje/qjr017. URL
http://qje.oxfordjournals.org/content/126/2/699.abstract.
Douglas Almond and Janet Currie. Human capital development before age �ve. NBER
Working Papers 15827, National Bureau of Economic Research, Inc, March 2010.
A. B. Atkinson, Lee Rainwater, and Timothy M. Smeeding. Income distribution in OECD
countries : evidence from the Luxembourg Income Study. OECD Publications and
Information Center, Paris, 1995. ISBN 926414577.
Michael Baker. Innis lecture: Universal early childhood interventions: what is the evi-
dence base? Canadian Journal of Economics, 44(4):1069�1105, November 2011. URL
http://ideas.repec.org/a/cje/issued/v44y2011i4p1069-1105.html.
Michael Baker, Jonathan Gruber, and Kevin Milligan. Universal child care, maternal labor
supply, and family well-being. The Journal of Political Economy, 116(4):pp. 709�745,
2008. ISSN 00223808.
W. Steven Barnett. Long-term e�ects of early childhood programs on cognitive and school
outcomes. Future of Children, pages 22�50, 1995.
Samuel Berlinski and Sebastian Galiani. The e�ect of a large expansion of pre-primary
school facilities on preschool attendance and maternal employment. Labour Economics,
14(3):665�680, June 2007.
Samuel Berlinski, Sebastian Galiani, and Marco Manacorda. Giv-
ing children a better start: Preschool attendance and school-age pro-
�les. Journal of Public Economics, 92(5-6):1416�1440, June 2008. URL
http://ideas.repec.org/a/eee/pubeco/v92y2008i5-6p1416-1440.html.
David Blau and Janet Currie. Pre-School, Day Care, and After-School Care: Who's
Minding the Kids?, volume 2 of Handbook of the Economics of Education, chapter 20,
pages 1163�1278. Elsevier, 2006.
John Bowlby. Attachment and Loss (Vol 1) Attachment. Hogarth, London, 1969.
28
Pedro Manuel Carneiro, Katrine V. Løken, and Kjell G. Salvanes. A �ying start? mater-
nity leave bene�ts and long run outcomes of children. Journal of Political Economy,
Forthcoming, April 2015.
Elizabeth U. Cascio. Do investments in universal early education pay o�? long-term
e�ects of introducing kindergartens into public schools. Working Paper 14951, National
Bureau of Economic Research, May 2009.
Flavio Cunha and James J. Heckman. Formulating, identifying and estimating the tech-
nology of cognitive and noncognitive skill formation. Journal of Human Resources, 43
(4):738�782, 2008.
Janet Currie. Early childhood education programs. Journal of Economic Perspectives,
15:213�238, 2001.
Janet Currie and Duncan Thomas. Does head start make a di�erence? American Eco-
nomic Review, 85(3):341�364, June 1995.
Phillip DeCicca and Justin Smith. The long-run impacts of early childhood education:
Evidence from a failed policy experiment. Economics of Education Review, 36:41�59,
2013.
David Deming. Early childhood intervention and life-cycle skill development: Evidence
from head start. American Economic Journal: Applied Economics, 1(3):111�134, 2009.
Nina Drange and Kjetil Telle. Promoting integration of immigrants: E�ects of free child
care on child enrollment and parental employment. Labour Economics, Fortcoming,
2015.
Christian Dustmann and Uta Schønberg. Expansions in maternity leave cov-
erage and children's long-term outcomes. American Economic Journal: Ap-
plied Economics, 4(3):190�224, 2012. doi: 10.1257/app.4.3.190. URL
http://www.aeaweb.org/articles.php?doi=10.1257/app.4.3.190.
29
Christian Dustmann, Anna Raute, and Uta Schønberg. Does universal childcare matter?
evidence from a large expansion in pre-school education. Working paper, University
College of London, 2013.
Christina Felfe and Rafael Lalive. Does early child care help or hurt children's develop-
ment? IZA Discussion Papers 8484, IZA, 2014.
Christina Felfe, Natalia Nollenberger, and Nuria Rodriguez-Planas. Can't buy mommy's
love? universal childcare and children's long-term cognitive development. Journal of
Population Economics, 28(2):393�422, 2015.
Maria D. Fitzpatrick. Starting school at four: The e�ect of universal pre-kindergarten on
children's academic achievement. The B.E. Journal of Economic Analysis & Policy, 8
(1), 2008.
Eliana Garces, Duncan Thomas, and Janet Currie. Longer term e�ects of head start.
Working Paper 8054, National Bureau of Economic Research, December 2000.
Nabanita Datta Gupta and Marianne Simonsen. Non-cognitive child outcomes
and universal high quality child care. Journal of Public Economics, 94(1-2):
30 � 43, 2010. ISSN 0047-2727. doi: 10.1016/j.jpubeco.2009.10.001. URL
http://www.sciencedirect.com/science/article/pii/S0047272709001169.
Tarjei Havnes and Magne Mogstad. Money for nothing? universal child care and maternal
employment. Journal of Public Economics, 95(11-12):1455�1465, 2011a.
Tarjei Havnes and Magne Mogstad. No child left behind. subsidized child care and chil-
dren's long-run outcomes. American Economic Journal: Economic Policy, 2011b.
Tarjei Havnes and Magne Mogstad. Is universal child care leveling the playing �eld?
Journal of Public Economics, In press, 2014.
Lynn A. Karoly, M. Rebecca Kilburn, and Jill S. Cannon. Early Childhood Interventions:
Proven Results, Future Promise. RAND Corporation, Santa Monica, CA, 2005.
30
Pierre Lefebvre and Philip Merrigan. Family background, family income, cognitive tests
scores, behavioural scales and their relationship with post-secondary education partic-
ipation: Evidence from the nlscy. Cahiers de recherche 0830, CIRPEE, 2008a. URL
http://ideas.repec.org/p/lvl/lacicr/0830.html.
Pierre Lefebvre and Philip Merrigan. Child-care policy and the labor supply
of mothers with young children: A natural experiment from canada. Jour-
nal of Labor Economics, 26(3):519�548, 2008b. doi: 10.1086/587760. URL
http://www.journals.uchicago.edu/doi/abs/10.1086/587760.
Qian Liu and Oskar Nordstrom Skans. The duration of paid parental leave and children's
scholastic performance. The B.E. Journal of Economic Analysis & Policy, 10(1):1�35,
January 2010. URL http://ideas.repec.org/a/bpj/bejeap/v10y2010i1n3.html.
Jens Ludwig and Douglas L. Miller. Does head start improve children's life chances?
evidence from a regression discontinuity design. The Quarterly Journal of Economics,
122(1):159�208, 2007. doi: 10.1162/qjec.122.1.159.
Daniela Lundin, Eva Mork, and Bjorn Ockert. How far can reduced childcare prices
push female labour supply? Labour Economics, 15(4):647�659, August 2008. URL
http://ideas.repec.org/a/eee/labeco/v15y2008i4p647-659.html.
Ruth Hubbell McKey, Larry Condelli, Harriet Ganson, Barbara J. Barrett, Catherine
McConkey, and Margaret Plantz. The impact of head start on children, families and
communities. �nal report of the head start evaluation, synthesis and utilization project.
Technical report, U.S. Department of Health and Human Services, 1985.
Jean Mercer. Understanding Attachment: Parenting, Child Care, and Emotional Devel-
opment. Praeger, 2006.
OECD. Starting strong ii: Early childhood education and care. Technical report, 2006.
Department of Education. Kartlegging av tallforståelse og regneferdighet på 1. trinn.
laererveiledning. 2011a.
31
Department of Education. Obligatorisk kartleggingsprøve: Kartlegging av leseferdighet
1. årstrinn del 1: Laererveiledning. 2011b.
Silje Vatne Pedersen. Barnefamiliers tilsynsordninger, yrkesdeltakelse og bruk av kon-
tantstøtte våren 2002. Reports 3, Statistics Norway, 2003.
Christopher J. Ruhm and Jane Waldfogel. Long-Term E�ects of Early Childhood Care
and Education. SSRN eLibrary, 2011.
Analia Schlosser. Public preschool and the labor supply of arab mothers: Evidence from
a natural experiment. Technical report, Mimeo, The Hebrew University of Jerusalem,
2005.
32
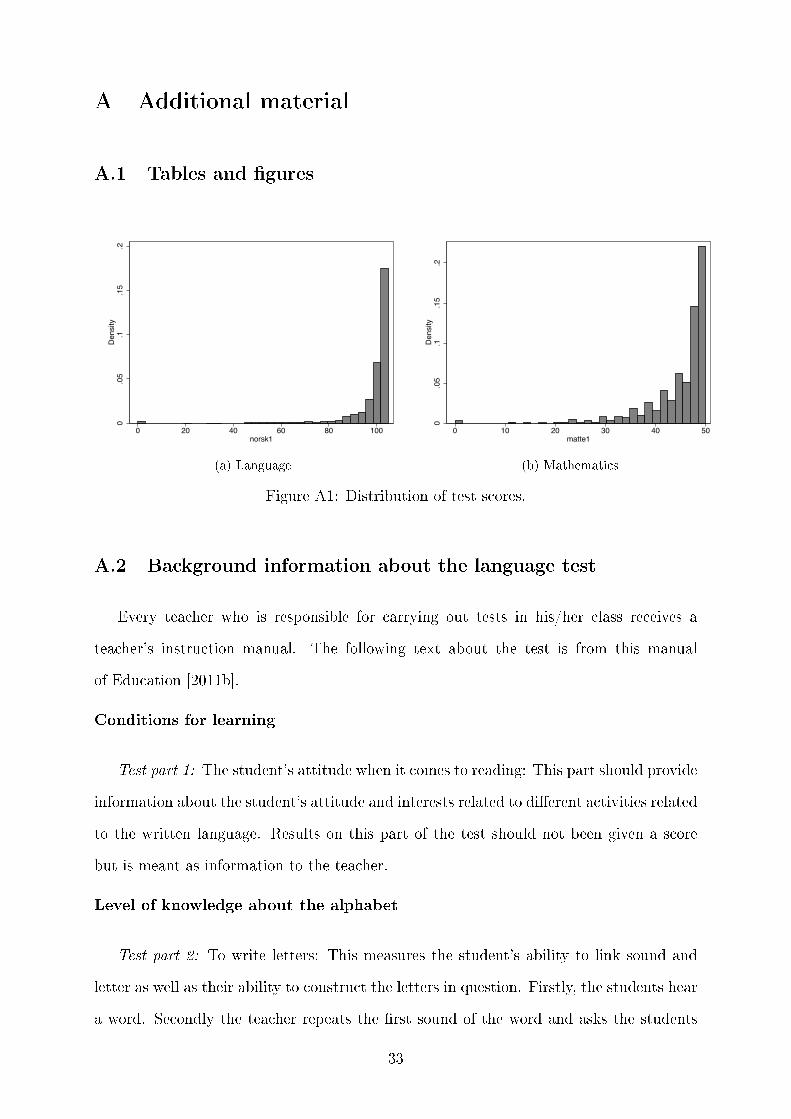
A Additional material
A.1 Tables and �gures
0.05
.1.15
.2Density
0 20 40 60 80 100norsk1
(a) Language
0.05
.1.15
.2Density
0 10 20 30 40 50matte1
(b) Mathematics
Figure A1: Distribution of test scores.
A.2 Background information about the language test
Every teacher who is responsible for carrying out tests in his/her class receives a
teacher's instruction manual. The following text about the test is from this manual
of Education [2011b].
Conditions for learning
Test part 1: The student's attitude when it comes to reading: This part should provide
information about the student's attitude and interests related to di�erent activities related
to the written language. Results on this part of the test should not been given a score
but is meant as information to the teacher.
Level of knowledge about the alphabet
Test part 2: To write letters: This measures the student's ability to link sound and
letter as well as their ability to construct the letters in question. Firstly, the students hear
a word. Secondly the teacher repeats the �rst sound of the word and asks the students
33

to write the letter that goes with that sound. There is a picture supporting the word in
the student book. The students' results on this test should be scored by the teacher.
Test part 3: To recognize letters: This part measures one of the basic skills in reading.
Students have four minutes to their disposal. With the starting point a capital letter
(versal) the students shall recognize the same lower case letter among several other lower
case letters (minuskler). The students' results on this test should be scored by the teacher.
This test part does not have a �critical threshold� since many students may have been
exposed to only one type of letter throughout the �rst school year. The score registrations
are meant as information to the teacher about which of the capital letters and lower case
letters the students can recognize and link.
Test part 4: To identify the initial sound: This measure the students' ability to do
exactly this. The teacher reads a word and asks the students to identify the �rst sound
of the word and write this down. There is a picture supporting the word in the student
book. The students' results on this test should be scored by the teacher.
Test part 5: To draw together sounds: Maps the students' abilities in phonological
synthesis. Each part of this test contains a sequence with four pictures that illustrate
di�erent words. The teacher instructs the students by �rstly presenting the word that
illustrate each picture and thereafter the target word, sound by sound, with a break
between every sound. The task of the students is to carry through the synthesis process
and determine which picture that goes with the target word. The students' results on
this test should be scored by the teacher.
Understanding words
Test part 6: To write words: Consists of a word dictation where each word is presented
for the students in a sentence. This test part comprises 8 sentences in total. The students'
results on this test should be scored by the teacher.
Test part 7: To read words implies that the students should compare an illustration
with four written words and subsequently identify the word that �ts with the illustration.
The students should identify as many word as possible (total possible words 19) within
34

�ve minutes. The students' results on this test should be scored by the teacher.
Understanding sentences
Test part 8: To read sentences consists of nine sub-parts. In each part the student
reads a sentence and mark the picture that illustrates the entire content of the sentence
among four alternative pictures with similar content. The length of the sentences increases
from two to �ve words as the test proceeds. The students should link as many pictures
and sentences as possible within �ve minutes. The students' results on this test should
be scored by the teacher.
A.3 Background information about the mathematics test
Every teacher responsible for carrying out tests in his/her class receives a teacher's
instruction manual. The following text about the test is from this manual of Education
[2011a].
This test consists of nine pages with several di�erent tasks (se below). The points
scored on each page should be added together. The critical threshold for the mathematics
test is based on the aggregated sum of points.
Page 1: Maps the students' ability to count, as well as if they know the numbers and
can link a number of items to a certain �gure
Page 2: Maps if the students understand the idea �equally many�, i.e. that they can
compare the number in two di�erent countable sets
Page 3: Investigates if the students' can rank the numbers in two di�erent countable
sets and if they understand the concept �most�
35
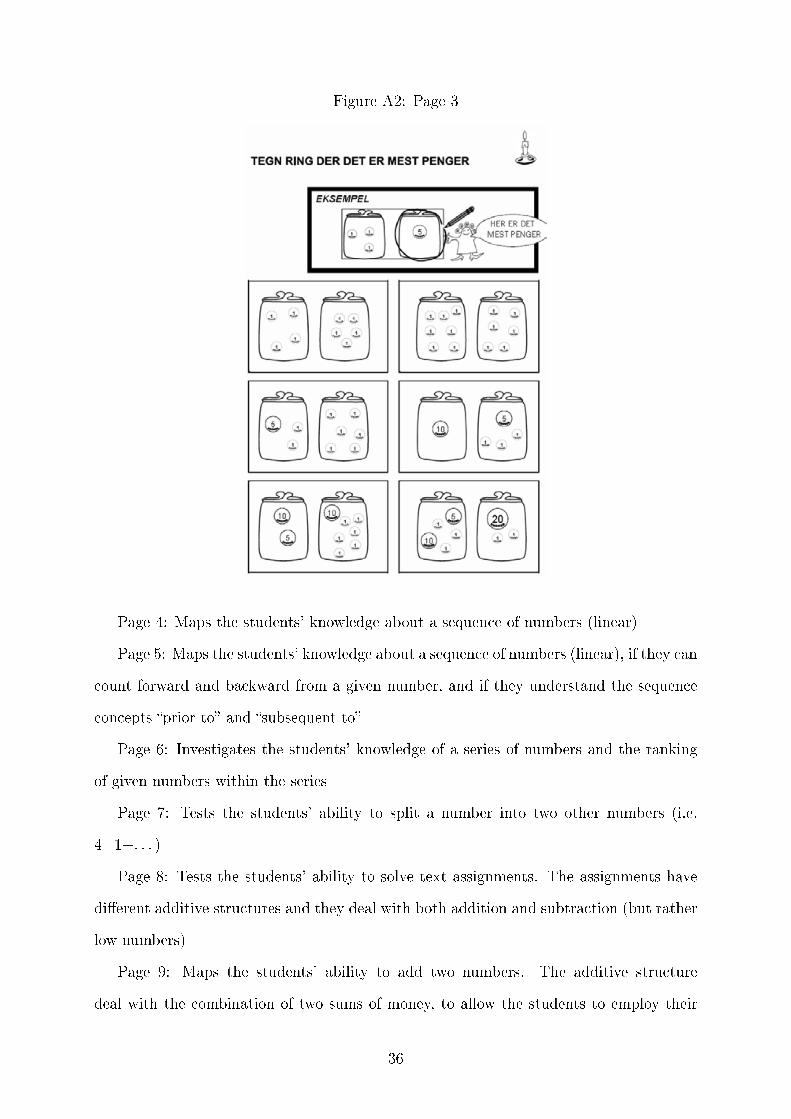
Figure A2: Page 3
Page 4: Maps the students' knowledge about a sequence of numbers (linear)
Page 5: Maps the students' knowledge about a sequence of numbers (linear), if they can
count forward and backward from a given number, and if they understand the sequence
concepts �prior to� and �subsequent to�
Page 6: Investigates the students' knowledge of a series of numbers and the ranking
of given numbers within the series
Page 7: Tests the students' ability to split a number into two other numbers (i.e.
4=1+. . . )
Page 8: Tests the students' ability to solve text assignments. The assignments have
di�erent additive structures and they deal with both addition and subtraction (but rather
low numbers)
Page 9: Maps the students' ability to add two numbers. The additive structure
deal with the combination of two sums of money, to allow the students to employ their
36

knowledge about money and coins to arrive at the correct answer
37

Statistics Norway
Postal address:PO Box 8131 DeptNO-0033 Oslo
Offi ce address:Akersveien 26, OsloOterveien 23, Kongsvinger
E-mail: [email protected]: www.ssb.noTelephone: + 47 62 88 50 00
ISSN: 1892-753X
Desig
n: Siri B
oq
uist