Embed Size (px)
Citation preview
Child Grooms:
Prevalence and Correlates of Early Marriage among Men
Kerry L.D. MacQuarrie 1
Jeffrey Edmeades 2
Population Association of America annual meetings
San Diego, CA, April 30-May 2, 2015
Session 197: Men’s Sexual Health, Fertility, and Family Planning
1 The DHS Program (Avenir Health)
2 International Center for Research on Women
Corresponding author: Kerry L.D. MacQuarrie, The DHS Program, c/o ICF International, 530 Gaither
Road, Rockville, Maryland, USA; phone: 301-572-0282; fax: 301–407-6501; email:
Abstract
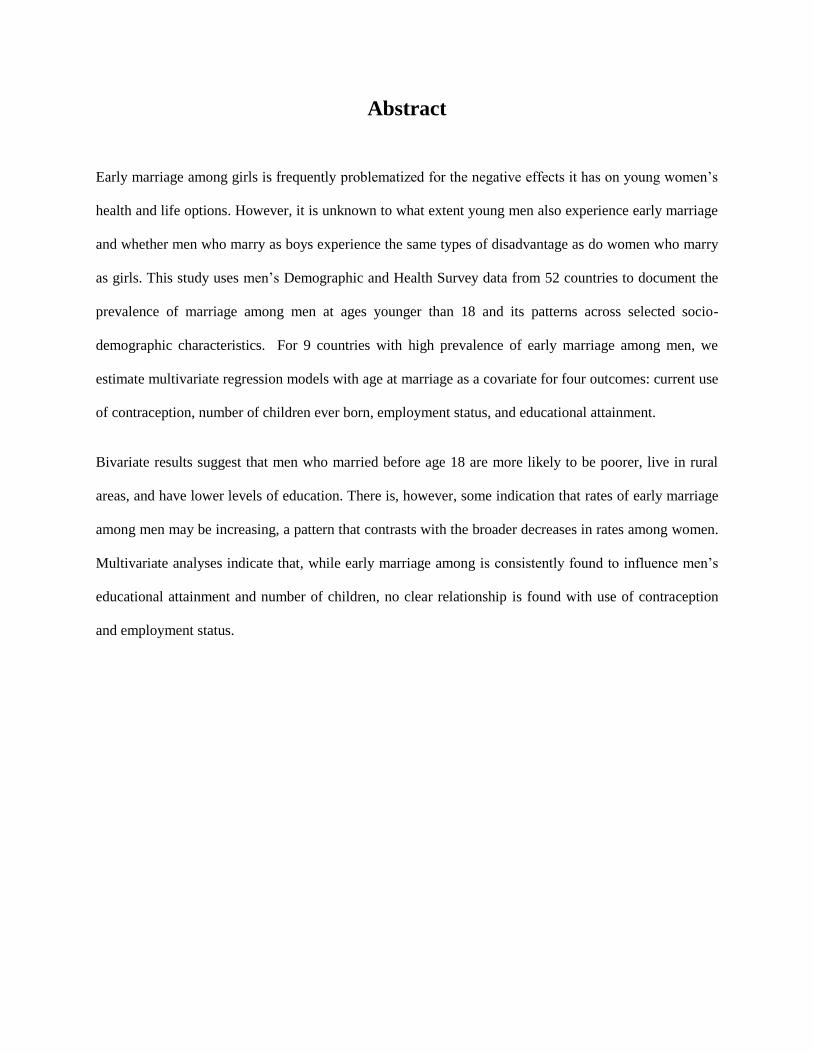
Early marriage among girls is frequently problematized for the negative effects it has on young women’s
health and life options. However, it is unknown to what extent young men also experience early marriage
and whether men who marry as boys experience the same types of disadvantage as do women who marry
as girls. This study uses men’s Demographic and Health Survey data from 52 countries to document the
prevalence of marriage among men at ages younger than 18 and its patterns across selected socio-
demographic characteristics. For 9 countries with high prevalence of early marriage among men, we
estimate multivariate regression models with age at marriage as a covariate for four outcomes: current use
of contraception, number of children ever born, employment status, and educational attainment.
Bivariate results suggest that men who married before age 18 are more likely to be poorer, live in rural
areas, and have lower levels of education. There is, however, some indication that rates of early marriage
among men may be increasing, a pattern that contrasts with the broader decreases in rates among women.
Multivariate analyses indicate that, while early marriage among is consistently found to influence men’s
educational attainment and number of children, no clear relationship is found with use of contraception
and employment status.
1
Background
Early marriage among girls is frequently problematized for the negative effects it has on young women’s
health and life options. Adolescent pregnancy, closely associated with adolescent marriage, poses risks
for a range of negative maternal and peri-natal health outcomes, with the risk heightened for the youngest
girls (de Vienne et al. 2009; Haldre et al. 2007; Goonewardene and Waduge 2005; Cooper et al. 1995). In
particular, girls younger than 19 have a 50% increased risk of stillbirths and neonatal deaths, as well as
preterm birth, low birth weight, and asphyxia. Women who marry young are not only likely to have their
first birth at a young age, but are less likely to use contraception and tend to have shorter birth intervals
(also a health risk) (Tsui 1982) and a greater number of births over their lifetime. This pattern is
sufficiently strong that delays in the age at marriage for women can result in reductions in aggregate
fertility levels (Timaeus and Moultrie 2008; Akam, 2007; Fall and Ngom, 2001; Hirschman 1985;
Hirschman and Rindfuss 1980).
Beyond health risks, early marriage for girls is associated with various social disadvantages. Studies
indicate that young, recently married girls are less empowered than either unmarried adolescents in their
natal home (Gage 2000) or women who marry at older ages, and that this relative disempowerment
persists throughout their reproductive lives (MacQuarrie 2009). Women who marry as girls are likely to
have lower levels of education, as girls frequently drop out of schooling upon marriage. Women who
marry as girls also have limited employment opportunities and are more likely to live in poorer
households.
While the causes and consequences of early marriage among girls have received widespread interest,
scant attention has been paid to understanding the phenomenon of early marriage among boys. As a
result, very little is known about the prevalence of early marriage among boys, in which countries it
occurs, which (if any) population sub-groups it is concentrated in, or what the causes or consequences
may be for boys. For example, there is very little research that explores whether men who marry as boys
2
experience the same types of health and social disadvantages as do women who marry as girls or what the
long term implications of early marriage are for men, as opposed to women. This study aims to begin to
fill some of these knowledge gaps by analyzing data on men in Demographic and Health Surveys (DHS).
Data and Methods
Data
DHS surveys are nationally representative, population-based surveys of households and, primarily,
women of reproductive age. While the DHS Program has conducted more than 300 surveys with women
in over 90 countries since its inception in 1984, 207 of these surveys have also interviewed men. This
study uses data from the most recent men’s survey provided that survey was conducted since 2000 and
the data were publicly available by December 2014. These criteria yielded 52 surveys available for
analysis. In most surveys, the sampling strategy for men is the same as that for women and all men of
eligible age (usually 15-59) are interviewed in each selected household. However, in some surveys, the
men’s questionnaire is administered in every second or third household, yielding sample sizes that are
smaller than for the women’s survey.
The DHS uses multistage cluster sampling techniques to obtain samples that are representative at the
national level and at one or more sub-national levels. In the first sampling stage each country is stratified
into regions from which census-based enumeration areas are selected, with a probability proportional to
size. A mapping and household listing operation is then conducted in selected enumeration areas. In the
second sampling stage, households are randomly selected from the household list within each selected
enumeration area. Urban and less populous areas are typically oversampled. All analyses are weighted to
account for sampling probability and survey non-response. Additionally, we use the survey (svy)
commands available within Stata 13 to account for the complex (clustered) sampling design and estimate
robust standard errors.
3
Analytical Strategy
The analysis in this study is organized into two broad sections. In the first, this study uses men’s DHS
data from all 52 countries to document the prevalence of marriage among men at ages younger than 18.
Marriage is defined as married or living together as if married and so includes all marriages whether they
have been legalized or not, formal or informal. The analytic sample is restricted to men age 20-59 as not
all those in the youngest age group, 15-19, have not had the opportunity to marry or remain unmarried by
age18 (i.e., they are censored). The prevalence of early marriage among men is compared to women’s
prevalence (proportion marrying by age 18 among women age 20-49) to determine if early marriage for
men co-occurs in the same countries as early marriage for women.
For nine countries with prevalence of early marriage among men exceeding 10%, the distributional
patterns of early marriage across selected socio-demographic characteristics is assessed. First, this allows
us to determine if men marrying early—however rare or commonplace—is a generalized phenomenon or
if it is more concentrated in selected subgroups. Secondly, it allows us to identify which factors may be
salient to early marriage for men. The distribution of early marriage is examined according to:
urban/rural residence, household wealth quintile (Rutstein 2008; Rutstein and Johnson 2004), education,
religion, ethnicity, and age. Around our point estimates, we calculate 95% confidence intervals.
Significant differences are assessed through a combination of a χ2 test and determining if the lower and
upper bounds of the confidence interval for one category overlaps with those of other categories.
Following this bivariate analysis, and for these same nine countries, we estimate multivariate regression
models on selected outcomes, using men’s age at marriage as the explanatory variable of interest and
other control variables. We select two outcomes each in two domains for which research has shown early
marriage for women to have negative consequences—(1) reproduction/fertility-related and (2) life
options/well-being—to explore whether men who marry early also experience similar disadvantages. The
4
modeled outcomes are: current use of contraception, number of children ever born, employment status,
and educational attainment.
Measures
Married before age 18 is a dichotomous variable coded as ‘1’ for men who were less than 18 years of age
when they first married or lived with a woman as if married and ‘0’ for men who married or lived with
someone as if married at age 18 or older.
Current use of contraception is captured through the question, “The last time you had sex did you or your
partner use any method to avoid or prevent a pregnancy?” Men who respond yes are coded as ‘1’ on this
variable regardless of the method used while men who respond no or do not know are coded as ‘0’. As a
dichotomous variable, current use of contraception is modeled as a logistic regression and is regressed on
men’s age at marriage and current age, wealth, education, residence, occupation, and employment status.
Total number of children ever born—Men are asked about any children they have had during their life
that are biologically theirs, even if they are not legally theirs or do not have their last name. This variable
is the sum of all children a man has fathered, regardless of whether the child had since died, is living or
not living with the man, or was born to the same or different mother. Number of children ever born is
modeled as a linear regression with the same set of regressors as in the model for current use of
contraception. This variable is unavailable for the Dominican Republic so no model is estimated for this
outcome there.
Employment status is coded as ‘1’ for men who report that they are currently working and ‘0’ if they are
not currently working. This variable is modeled in a logistic regression regressed on men’s age at
marriage and controlling for current age, wealth, education, and residence. The DHS survey in the
5
Dominican Republic did not collect data on employment status so no model is estimated for this outcome
in this country.
Educational attainment is a standard DHS variable with “no education,” “primary education,” “secondary
education,” and “higher education” as response codes for the level of education completed. The DHS
survey in the Dominican Republic did not collect data on employment status. All four categories of
education are retained for the bivariate analysis examining the distribution of men’s early marriage across
categories of education completed. In the multivariate analysis, educational attainment outcome is
expressed as a dichotomous variable comparing men completing secondary or higher education with
those with no or primary education and uses the full set of regressors. When used as a regressor in
regression models for the other outcomes, “no education” is the referent category.
Current age is measured in five-year age groups and captures completed age, in years, at the time of the
survey. The 20-24 age group is the reference category. While DHS surveys typically interview men
between the ages of 15 and 59, India’s DHS (also known as the National Family and Health Survey
(NFHS-2)) interviewed men age 15-54 and Nepal’s DHS interviewed men ag 15-49 and so lack the oldest
age groups.
Household wealth quintiles are calculated by the DHS Program based on factor analysis of material asset
items (Filmer and Pritchett 2001; Rutstein 2008; Rutstein and Johnson 2004). This measure captures
relative wealth within a country at the time of the survey for the household in which the man resides. The
reference category is the poorest wealth quintile.
Occupation is a categorical variable with the following as categories: none (reference); professional,
technical, or manual; agriculture; services or sales; and manual labor. The Dominican Republic survey
did not collect data on current employment status or on occupation, so these variables are omitted from
the models for this country. While occupation is not collinear with employment status, this variable is
omitted from the list of regressors in the model for employment status as an outcome variable.
6
Place of residence distinguishes men living in rural areas from those living in urban areas. Urban
residence is the reference category.
Ethnicity and religion are both country-specific variables. They are categorical variables with customized
response codes that are meaningful for each country. Religion is an available variable in all nine surveys,
with the number of response options ranging from two (Comoros) to ten (India). Five countries—
Ethiopia, Honduras, India, Nepal, and Sierra Leone—collect data on ethnicity, with as many as 52
response options in Ethiopia and as few as four capturing caste in India. As these are country-specific, we
examine the distribution of men’s early marriage according to religion and ethnicity in bivariate analyses,
but we do not include these variables in our regression models.
Results
Prevalence of Early Marriage among Men
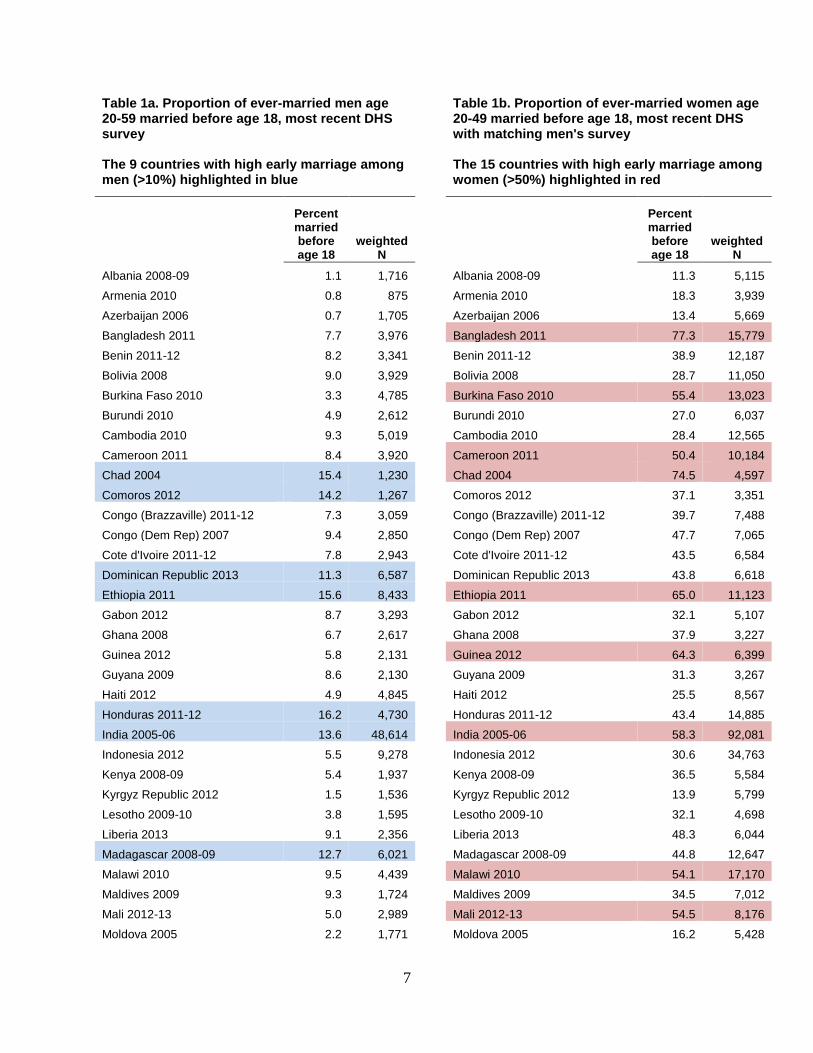
Early marriage1 among men is a relatively rare phenomenon. As shown in Table 1, the large majority of
all married men age 20-59 married at an age older than 18. The prevalence of early marriage ranges from
less than 1% in Azerbaijan to 21% in Nepal. On average2, 7.4% of men age 20-59 marry before the age
of 18. Early marriage is very rare (<1%) in the Eastern European and Central Asian countries of Albania,
Armenia, and Azerbaijan. In all but nine countries, the proportion of men marrying before age 18 is less
than 10%, a level used (somewhat arbitrarily) to designate higher prevalence of early marriage among
men.
1 Early marriage is defined as marriage before the age of 18.
2 Each country is weighted equally, without regard to population size.
7
Table 1a. Proportion of ever-married men age 20-59 married before age 18, most recent DHS survey The 9 countries with high early marriage among men (>10%) highlighted in blue
Table 1b. Proportion of ever-married women age 20-49 married before age 18, most recent DHS with matching men's survey The 15 countries with high early marriage among women (>50%) highlighted in red
Percent married before age 18
weighted N
Percent married before age 18
weighted N
Albania 2008-09 1.1 1,716
Albania 2008-09 11.3 5,115
Armenia 2010 0.8 875
Armenia 2010 18.3 3,939
Azerbaijan 2006 0.7 1,705
Azerbaijan 2006 13.4 5,669
Bangladesh 2011 7.7 3,976
Bangladesh 2011 77.3 15,779
Benin 2011-12 8.2 3,341
Benin 2011-12 38.9 12,187
Bolivia 2008 9.0 3,929
Bolivia 2008 28.7 11,050
Burkina Faso 2010 3.3 4,785
Burkina Faso 2010 55.4 13,023
Burundi 2010 4.9 2,612
Burundi 2010 27.0 6,037
Cambodia 2010 9.3 5,019
Cambodia 2010 28.4 12,565
Cameroon 2011 8.4 3,920
Cameroon 2011 50.4 10,184
Chad 2004 15.4 1,230
Chad 2004 74.5 4,597
Comoros 2012 14.2 1,267
Comoros 2012 37.1 3,351
Congo (Brazzaville) 2011-12 7.3 3,059
Congo (Brazzaville) 2011-12 39.7 7,488
Congo (Dem Rep) 2007 9.4 2,850
Congo (Dem Rep) 2007 47.7 7,065
Cote d'Ivoire 2011-12 7.8 2,943
Cote d'Ivoire 2011-12 43.5 6,584
Dominican Republic 2013 11.3 6,587
Dominican Republic 2013 43.8 6,618
Ethiopia 2011 15.6 8,433
Ethiopia 2011 65.0 11,123
Gabon 2012 8.7 3,293
Gabon 2012 32.1 5,107
Ghana 2008 6.7 2,617
Ghana 2008 37.9 3,227
Guinea 2012 5.8 2,131
Guinea 2012 64.3 6,399
Guyana 2009 8.6 2,130
Guyana 2009 31.3 3,267
Haiti 2012 4.9 4,845
Haiti 2012 25.5 8,567
Honduras 2011-12 16.2 4,730
Honduras 2011-12 43.4 14,885
India 2005-06 13.6 48,614
India 2005-06 58.3 92,081
Indonesia 2012 5.5 9,278
Indonesia 2012 30.6 34,763
Kenya 2008-09 5.4 1,937
Kenya 2008-09 36.5 5,584
Kyrgyz Republic 2012 1.5 1,536
Kyrgyz Republic 2012 13.9 5,799
Lesotho 2009-10 3.8 1,595
Lesotho 2009-10 32.1 4,698
Liberia 2013 9.1 2,356
Liberia 2013 48.3 6,044
Madagascar 2008-09 12.7 6,021
Madagascar 2008-09 44.8 12,647
Malawi 2010 9.5 4,439
Malawi 2010 54.1 17,170
Maldives 2009 9.3 1,724
Maldives 2009 34.5 7,012
Mali 2012-13 5.0 2,989
Mali 2012-13 54.5 8,176
Moldova 2005 2.2 1,771
Moldova 2005 16.2 5,428
8
Table 1a. Proportion of ever-married men age 20-59 married before age 18, most recent DHS survey The 9 countries with high early marriage among men (>10%) highlighted in blue
Table 1b. Proportion of ever-married women age 20-49 married before age 18, most recent DHS with matching men's survey The 15 countries with high early marriage among women (>50%) highlighted in red
Percent married before age 18
weighted N
Percent married before age 18
weighted N
Mozambique 2011 8.1 2,745
Mozambique 2011 47.0 9,976
Namibia 2013 4.2 1,680
Namibia 2006-07 15.8 3,606
Nepal 2011 20.8 2,619
Nepal 2011 56.3 9,168
Niger 2012 6.0 2,785
Niger 2012 78.7 9,125
Nigeria 2013 5.9 8,935
Nigeria 2013 54.4 27,310
Pakistan 2012-13 9.1 3,098
Pakistan 2012-13 39.1 12,953
Philippines 2003 6.5 2,830
Philippines 2003 20.4 8,997
Rwanda 2011 4.2 3,446
Rwanda 2011 19.1 8,280
São Tomé and Príncipe 2008-09 7.0 1,348
São Tomé and Príncipe 2008-09 40.2 1,884
Senegal 2010-11 3.7 2,167
Senegal 2010-11 46.0 10,238
Sierra Leone 2008 10.3 4,391
Sierra Leone 2008 54.8 11,164
Swaziland 2006-07 4.0 1,419
Swaziland 2006-07 22.4 2,407
Tanzania 2010 4.9 1,452
Tanzania 2010 43.8 7,172
Timor-Leste 2009-10 6.2 2,207
Timor-Leste 2009-10 28.0 8,204
Uganda 2011 9.2 1,444
Uganda 2011 52.9 6,086
Ukraine 2007 2.9 2,120
Ukraine 2007 14.7 5,246
Zambia 2007 6.9 3,926
Zambia 2007 51.7 4,984
Zimbabwe 2010-11 4.7 4,233
Zimbabwe 2010-11 34.3 6,469
Total 7.4 213,098
Total 40.0 536,497
Note: Men age 20-54 in India 2005-06 and age 20-49 in Nepal 2011.
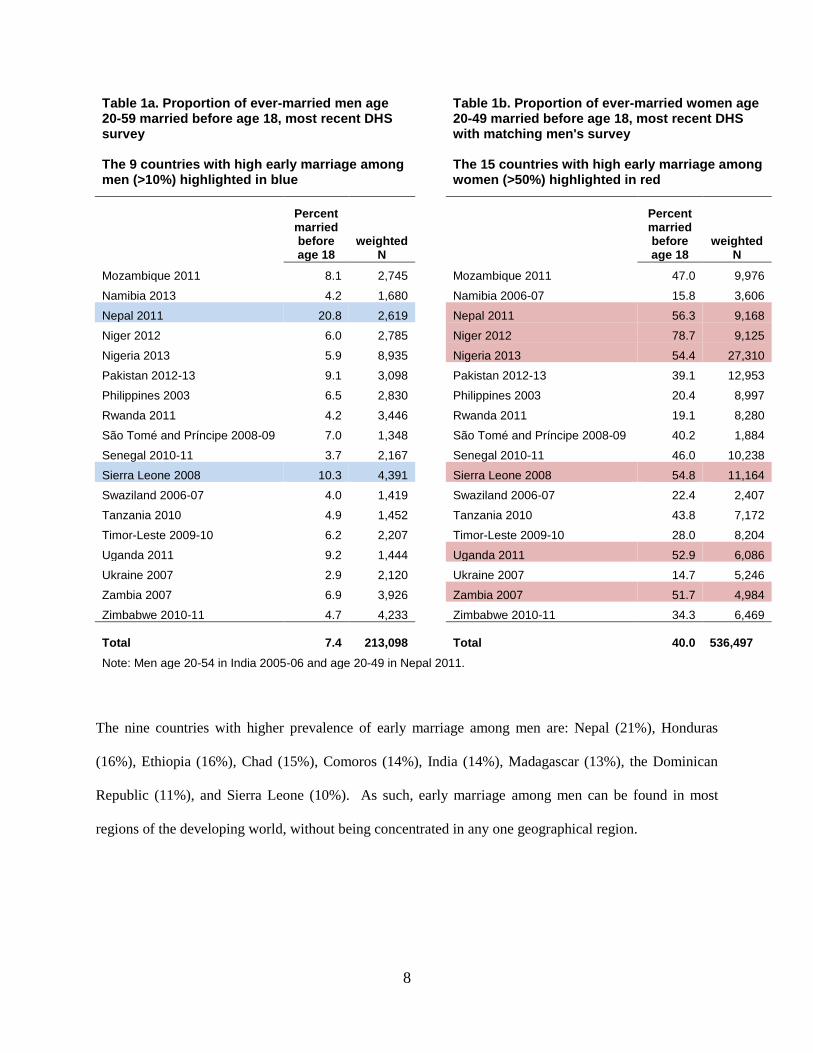
The nine countries with higher prevalence of early marriage among men are: Nepal (21%), Honduras
(16%), Ethiopia (16%), Chad (15%), Comoros (14%), India (14%), Madagascar (13%), the Dominican
Republic (11%), and Sierra Leone (10%). As such, early marriage among men can be found in most
regions of the developing world, without being concentrated in any one geographical region.
9
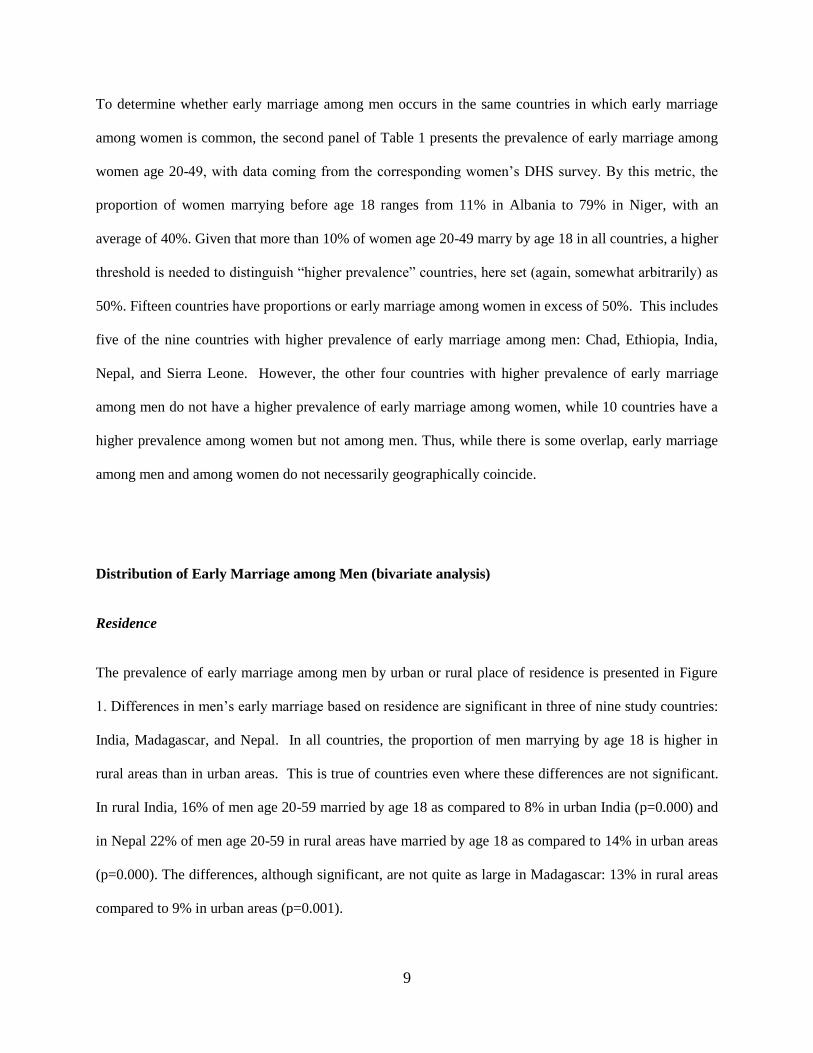
To determine whether early marriage among men occurs in the same countries in which early marriage
among women is common, the second panel of Table 1 presents the prevalence of early marriage among
women age 20-49, with data coming from the corresponding women’s DHS survey. By this metric, the
proportion of women marrying before age 18 ranges from 11% in Albania to 79% in Niger, with an
average of 40%. Given that more than 10% of women age 20-49 marry by age 18 in all countries, a higher
threshold is needed to distinguish “higher prevalence” countries, here set (again, somewhat arbitrarily) as
50%. Fifteen countries have proportions or early marriage among women in excess of 50%. This includes
five of the nine countries with higher prevalence of early marriage among men: Chad, Ethiopia, India,
Nepal, and Sierra Leone. However, the other four countries with higher prevalence of early marriage
among men do not have a higher prevalence of early marriage among women, while 10 countries have a
higher prevalence among women but not among men. Thus, while there is some overlap, early marriage
among men and among women do not necessarily geographically coincide.
Distribution of Early Marriage among Men (bivariate analysis)
Residence
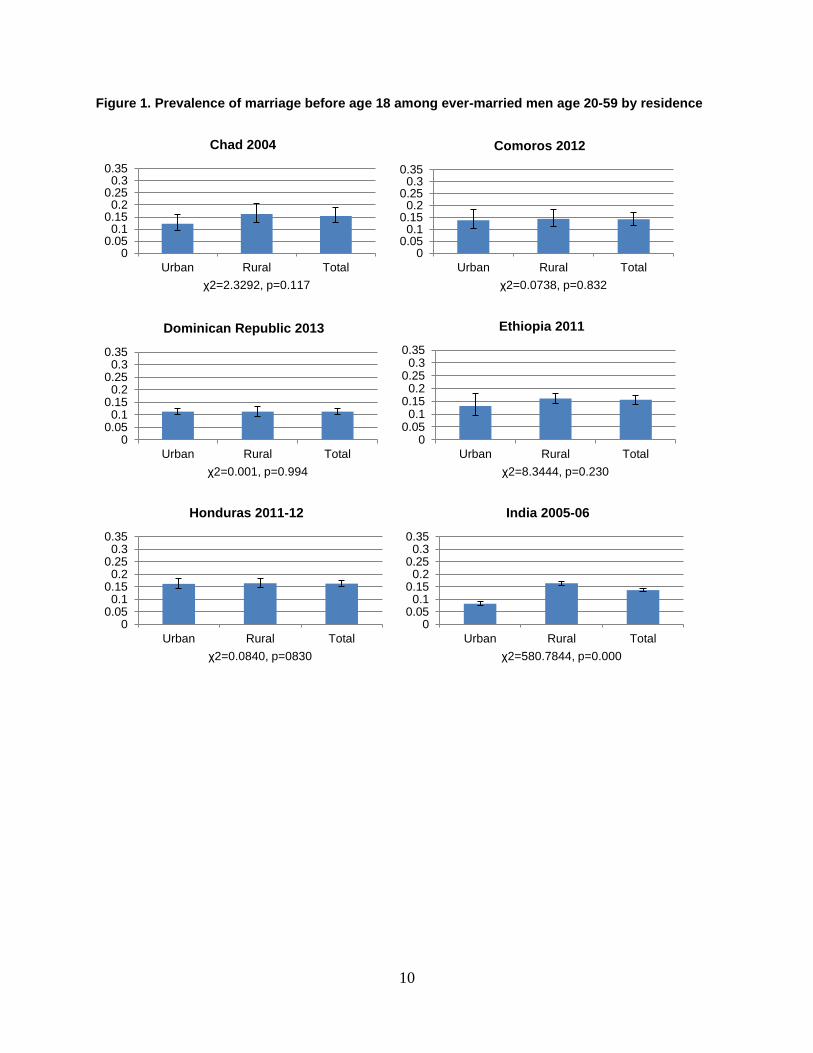
The prevalence of early marriage among men by urban or rural place of residence is presented in Figure
1. Differences in men’s early marriage based on residence are significant in three of nine study countries:
India, Madagascar, and Nepal. In all countries, the proportion of men marrying by age 18 is higher in
rural areas than in urban areas. This is true of countries even where these differences are not significant.
In rural India, 16% of men age 20-59 married by age 18 as compared to 8% in urban India (p=0.000) and
in Nepal 22% of men age 20-59 in rural areas have married by age 18 as compared to 14% in urban areas
(p=0.000). The differences, although significant, are not quite as large in Madagascar: 13% in rural areas
compared to 9% in urban areas (p=0.001).
10
Figure 1. Prevalence of marriage before age 18 among ever-married men age 20-59 by residence
00.05
0.10.15
0.20.25
0.30.35
Urban Rural Total
χ2=2.3292, p=0.117
Chad 2004
00.05
0.10.15
0.20.25
0.30.35
Urban Rural Total
χ2=0.0738, p=0.832
Comoros 2012
00.05
0.10.15
0.20.25
0.30.35
Urban Rural Total
χ2=0.001, p=0.994
Dominican Republic 2013
00.050.1
0.150.2
0.250.3
0.35
Urban Rural Total
χ2=8.3444, p=0.230
Ethiopia 2011
00.05
0.10.15
0.20.25
0.30.35
Urban Rural Total
χ2=0.0840, p=0830
Honduras 2011-12
00.050.1
0.150.2
0.250.3
0.35
Urban Rural Total
χ2=580.7844, p=0.000
India 2005-06
11
Household wealth quintile
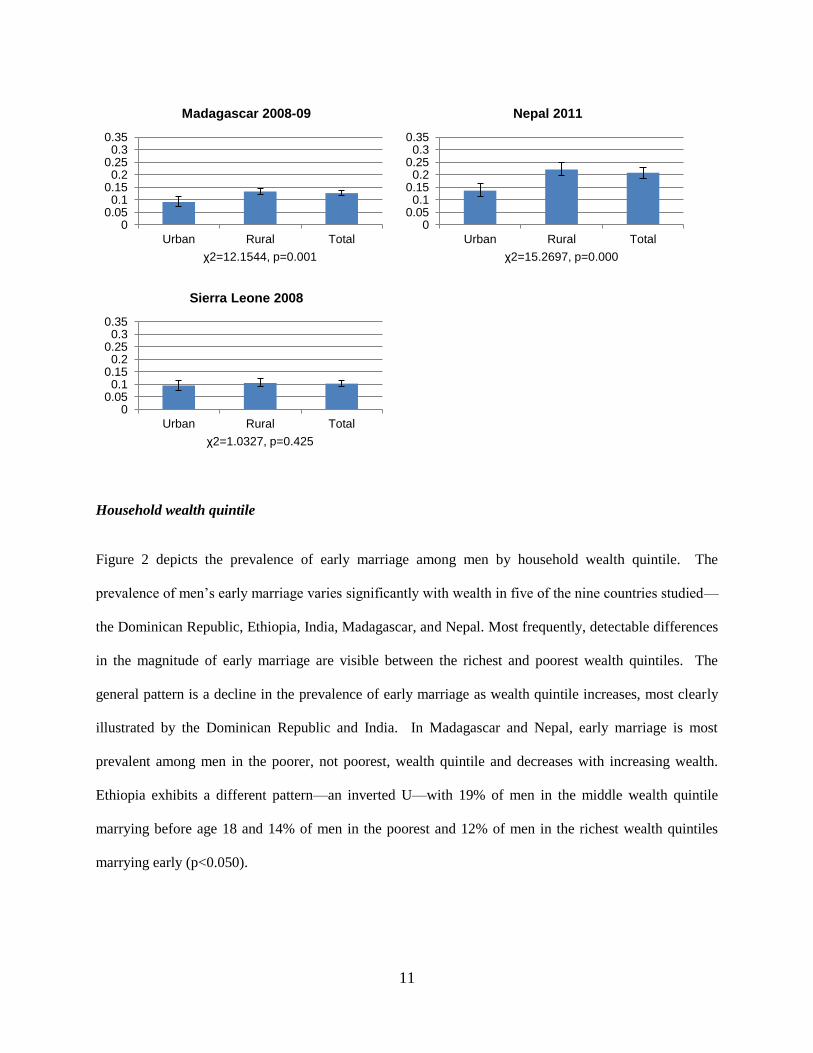
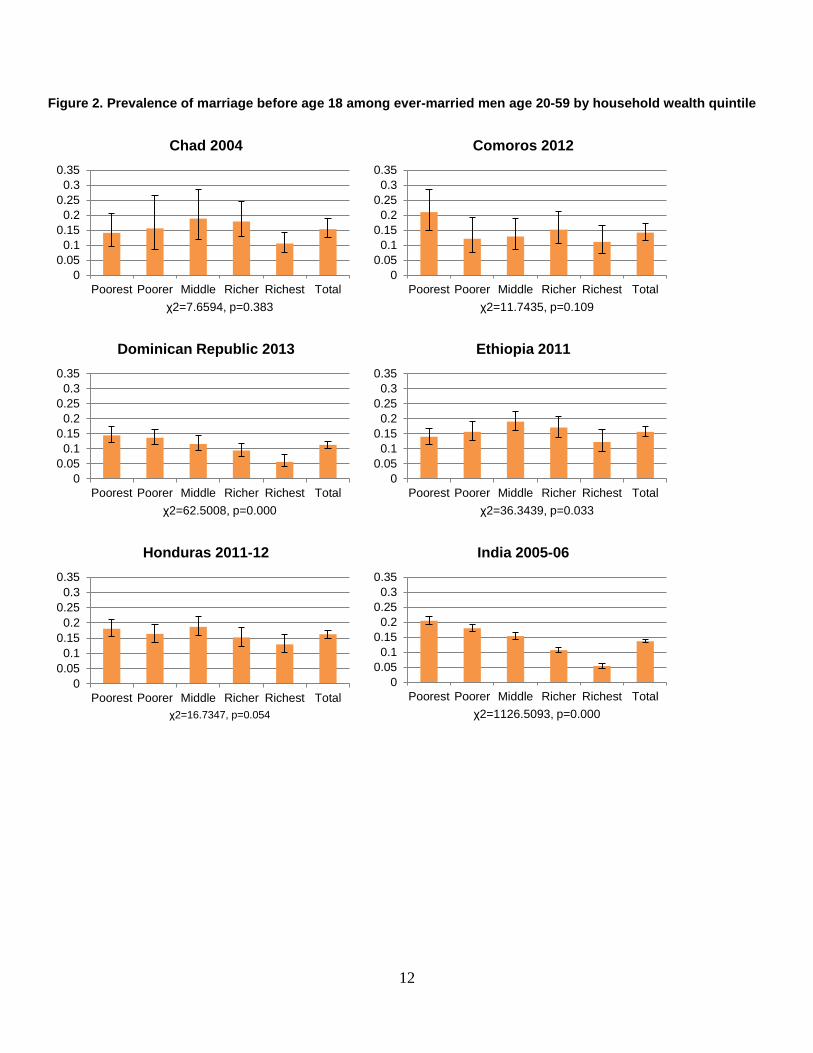
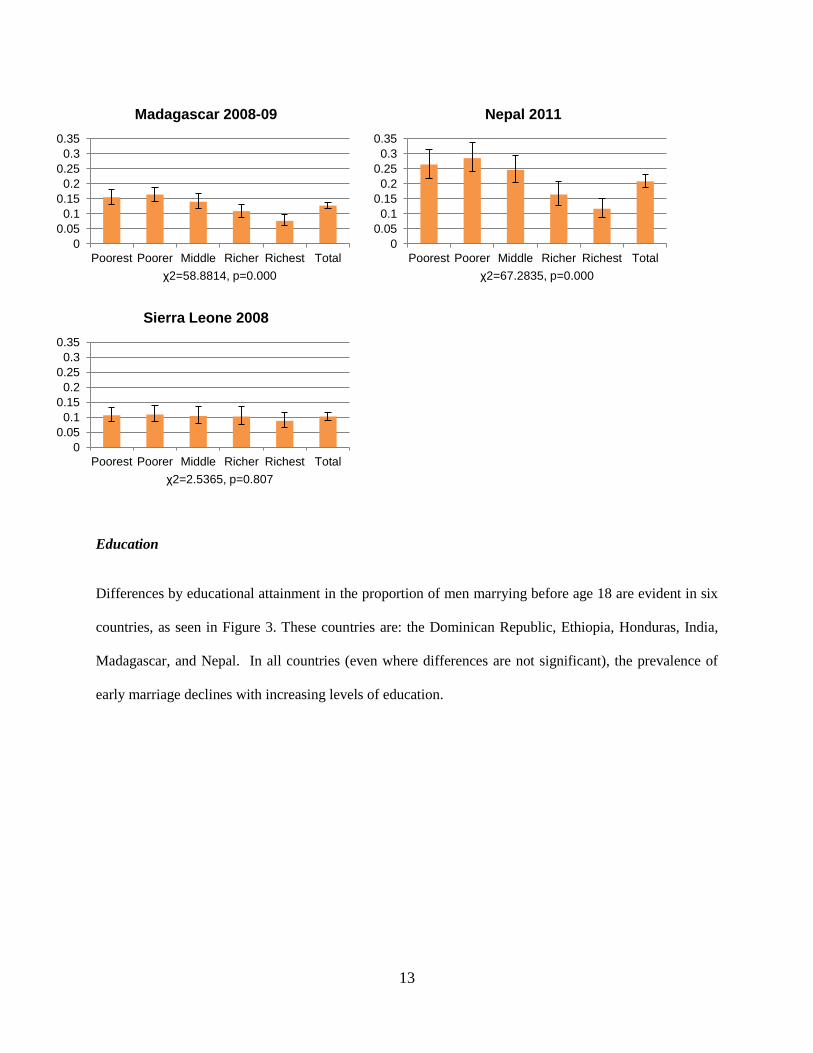
Figure 2 depicts the prevalence of early marriage among men by household wealth quintile. The
prevalence of men’s early marriage varies significantly with wealth in five of the nine countries studied—
the Dominican Republic, Ethiopia, India, Madagascar, and Nepal. Most frequently, detectable differences
in the magnitude of early marriage are visible between the richest and poorest wealth quintiles. The
general pattern is a decline in the prevalence of early marriage as wealth quintile increases, most clearly
illustrated by the Dominican Republic and India. In Madagascar and Nepal, early marriage is most
prevalent among men in the poorer, not poorest, wealth quintile and decreases with increasing wealth.
Ethiopia exhibits a different pattern—an inverted U—with 19% of men in the middle wealth quintile
marrying before age 18 and 14% of men in the poorest and 12% of men in the richest wealth quintiles
marrying early (p<0.050).
00.05
0.10.15
0.20.25
0.30.35
Urban Rural Total
χ2=12.1544, p=0.001
Madagascar 2008-09
00.050.1
0.150.2
0.250.3
0.35
Urban Rural Total
χ2=15.2697, p=0.000
Nepal 2011
00.05
0.10.15
0.20.25
0.30.35
Urban Rural Total
χ2=1.0327, p=0.425
Sierra Leone 2008
12
Figure 2. Prevalence of marriage before age 18 among ever-married men age 20-59 by household wealth quintile
0
0.05
0.1
0.15
0.2
0.25
0.3
0.35
Poorest Poorer Middle Richer Richest Total
χ2=7.6594, p=0.383
Chad 2004
0
0.05
0.1
0.15
0.2
0.25
0.3
0.35
Poorest Poorer Middle Richer Richest Total
χ2=11.7435, p=0.109
Comoros 2012
0
0.05
0.1
0.15
0.2
0.25
0.3
0.35
Poorest Poorer Middle Richer Richest Total
χ2=62.5008, p=0.000
Dominican Republic 2013
0
0.05
0.1
0.15
0.2
0.25
0.3
0.35
Poorest Poorer Middle Richer Richest Total
χ2=36.3439, p=0.033
Ethiopia 2011
0
0.05
0.1
0.15
0.2
0.25
0.3
0.35
Poorest Poorer Middle Richer Richest Total
χ2=16.7347, p=0.054
Honduras 2011-12
0
0.05
0.1
0.15
0.2
0.25
0.3
0.35
Poorest Poorer Middle Richer Richest Total
χ2=1126.5093, p=0.000
India 2005-06
13
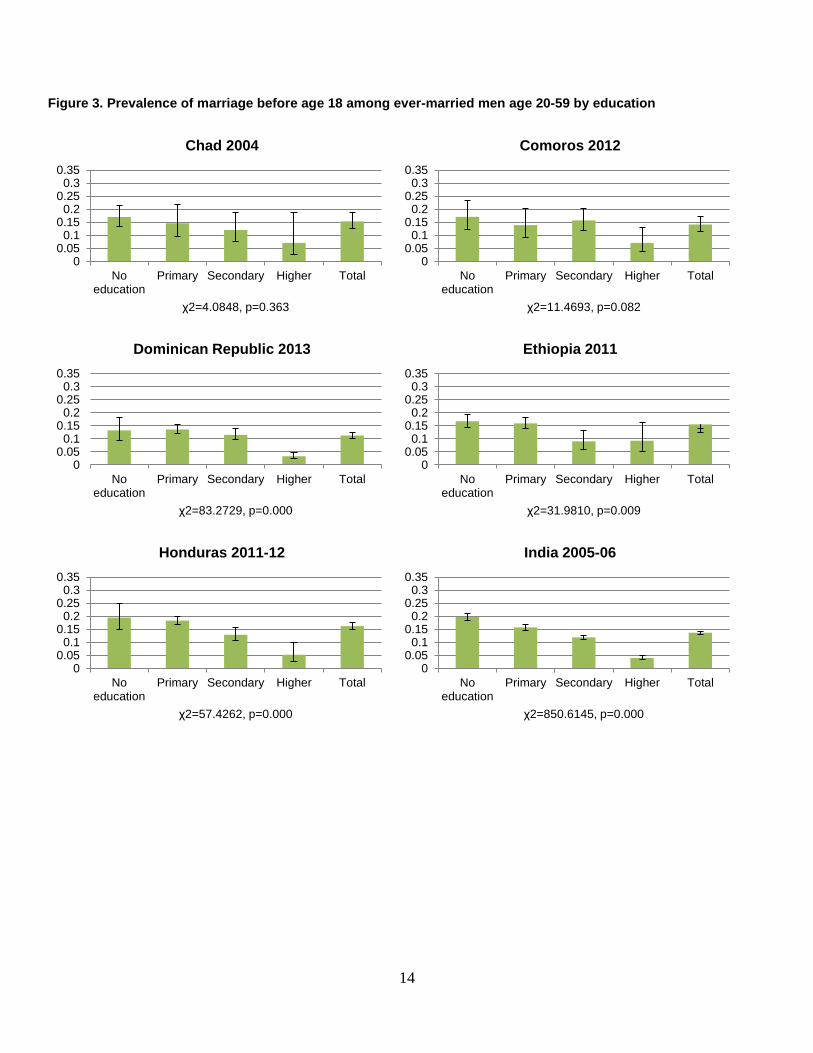
Education
Differences by educational attainment in the proportion of men marrying before age 18 are evident in six
countries, as seen in Figure 3. These countries are: the Dominican Republic, Ethiopia, Honduras, India,
Madagascar, and Nepal. In all countries (even where differences are not significant), the prevalence of
early marriage declines with increasing levels of education.
0
0.05
0.1
0.15
0.2
0.25
0.3
0.35
Poorest Poorer Middle Richer Richest Total
χ2=58.8814, p=0.000
Madagascar 2008-09
0
0.05
0.1
0.15
0.2
0.25
0.3
0.35
Poorest Poorer Middle Richer Richest Total
χ2=67.2835, p=0.000
Nepal 2011
0
0.05
0.1
0.15
0.2
0.25
0.3
0.35
Poorest Poorer Middle Richer Richest Total
χ2=2.5365, p=0.807
Sierra Leone 2008
14
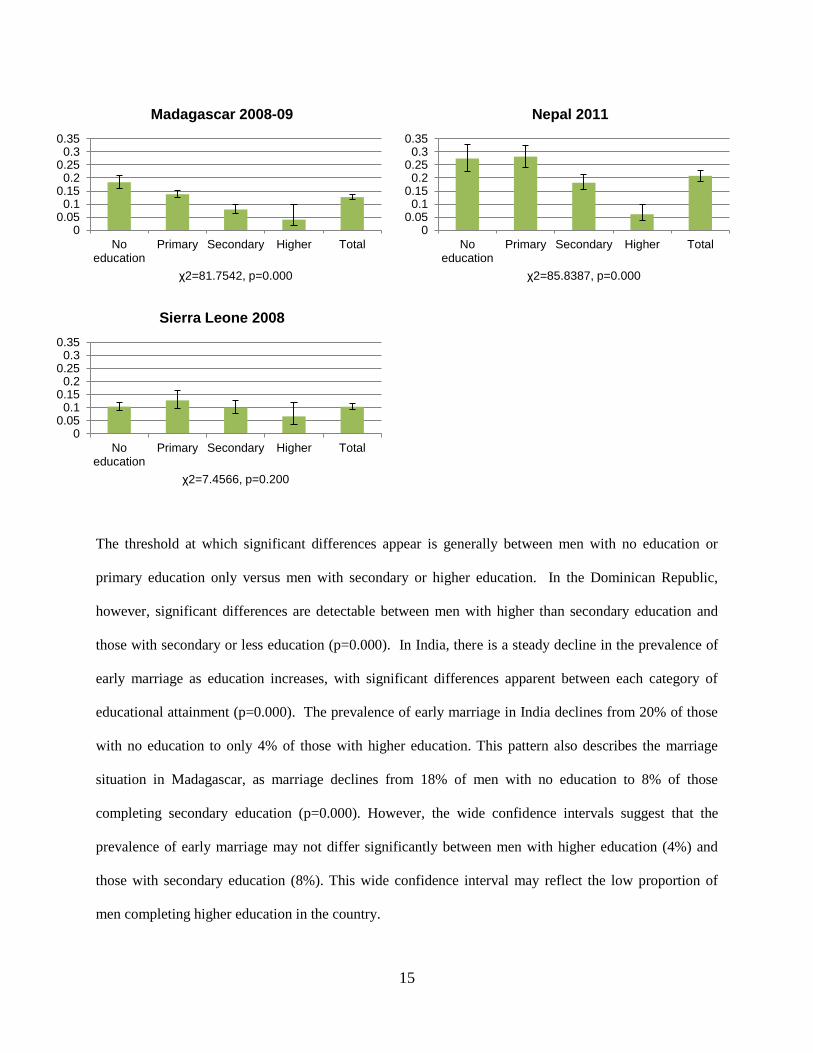
Figure 3. Prevalence of marriage before age 18 among ever-married men age 20-59 by education
00.05
0.10.15
0.20.25
0.30.35
Noeducation
Primary Secondary Higher Total
χ2=4.0848, p=0.363
Chad 2004
00.05
0.10.15
0.20.25
0.30.35
Noeducation
Primary Secondary Higher Total
χ2=11.4693, p=0.082
Comoros 2012
00.05
0.10.15
0.20.25
0.30.35
Noeducation
Primary Secondary Higher Total
χ2=83.2729, p=0.000
Dominican Republic 2013
00.05
0.10.15
0.20.25
0.30.35
Noeducation
Primary Secondary Higher Total
χ2=31.9810, p=0.009
Ethiopia 2011
00.05
0.10.15
0.20.25
0.30.35
Noeducation
Primary Secondary Higher Total
χ2=57.4262, p=0.000
Honduras 2011-12
00.05
0.10.15
0.20.25
0.30.35
Noeducation
Primary Secondary Higher Total
χ2=850.6145, p=0.000
India 2005-06
15
The threshold at which significant differences appear is generally between men with no education or
primary education only versus men with secondary or higher education. In the Dominican Republic,
however, significant differences are detectable between men with higher than secondary education and
those with secondary or less education (p=0.000). In India, there is a steady decline in the prevalence of
early marriage as education increases, with significant differences apparent between each category of
educational attainment (p=0.000). The prevalence of early marriage in India declines from 20% of those
with no education to only 4% of those with higher education. This pattern also describes the marriage
situation in Madagascar, as marriage declines from 18% of men with no education to 8% of those
completing secondary education (p=0.000). However, the wide confidence intervals suggest that the
prevalence of early marriage may not differ significantly between men with higher education (4%) and
those with secondary education (8%). This wide confidence interval may reflect the low proportion of
men completing higher education in the country.
00.05
0.10.15
0.20.25
0.30.35
Noeducation
Primary Secondary Higher Total
χ2=81.7542, p=0.000
Madagascar 2008-09
00.05
0.10.15
0.20.25
0.30.35
Noeducation
Primary Secondary Higher Total
χ2=85.8387, p=0.000
Nepal 2011
00.05
0.10.15
0.20.25
0.30.35
Noeducation
Primary Secondary Higher Total
χ2=7.4566, p=0.200
Sierra Leone 2008
16
Age cohort
As with the other socio-economic characteristics reported on here, current age can be interpreted as
another factor in the distributional pattern of early marriage among men. However, analysis by age cohort
presents a second possible interpretation. Examining men’s early marriage patterns by age cohort can
provide evidence of a period shock in marriage patterns or of secular trends over time. The prevalence of
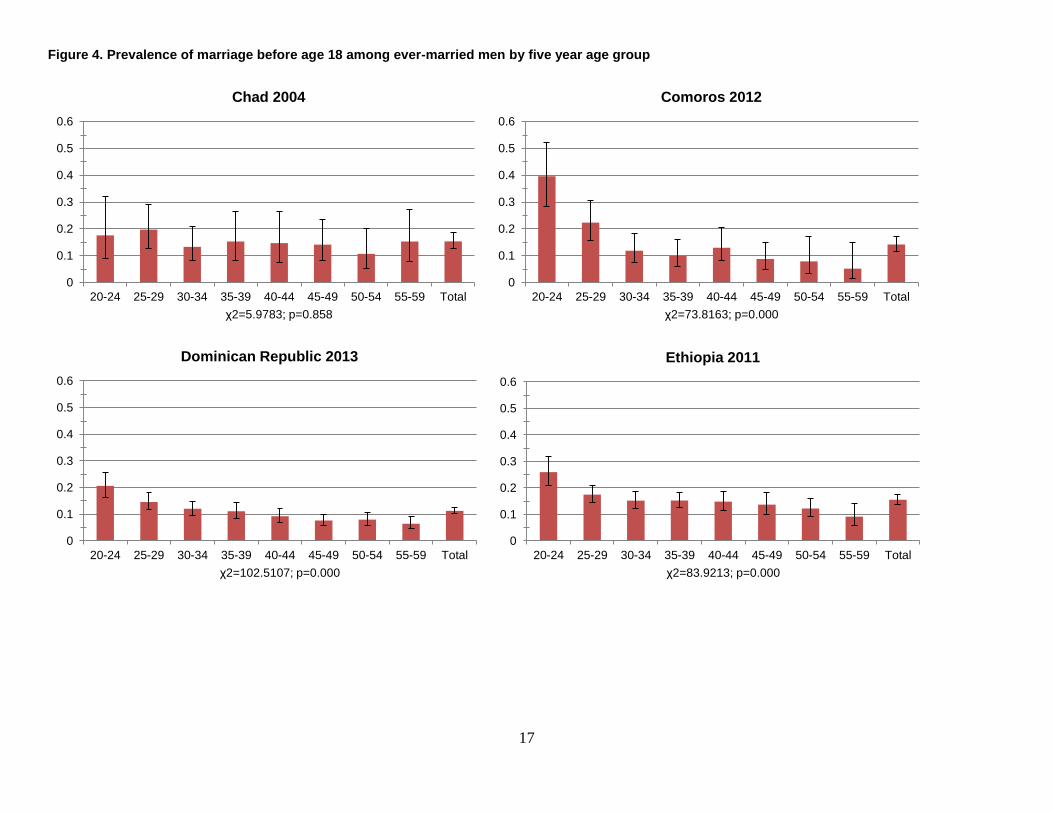
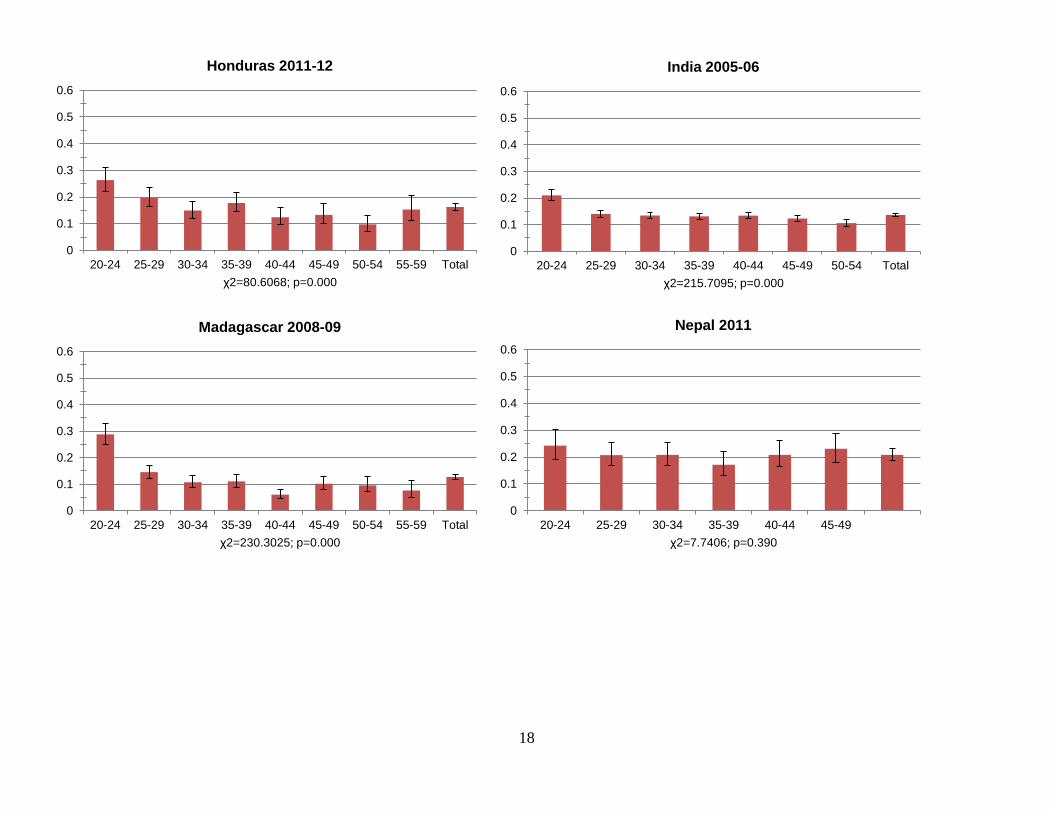
men’s marriage before age 18 by five-year age group is presented in Figure 4.
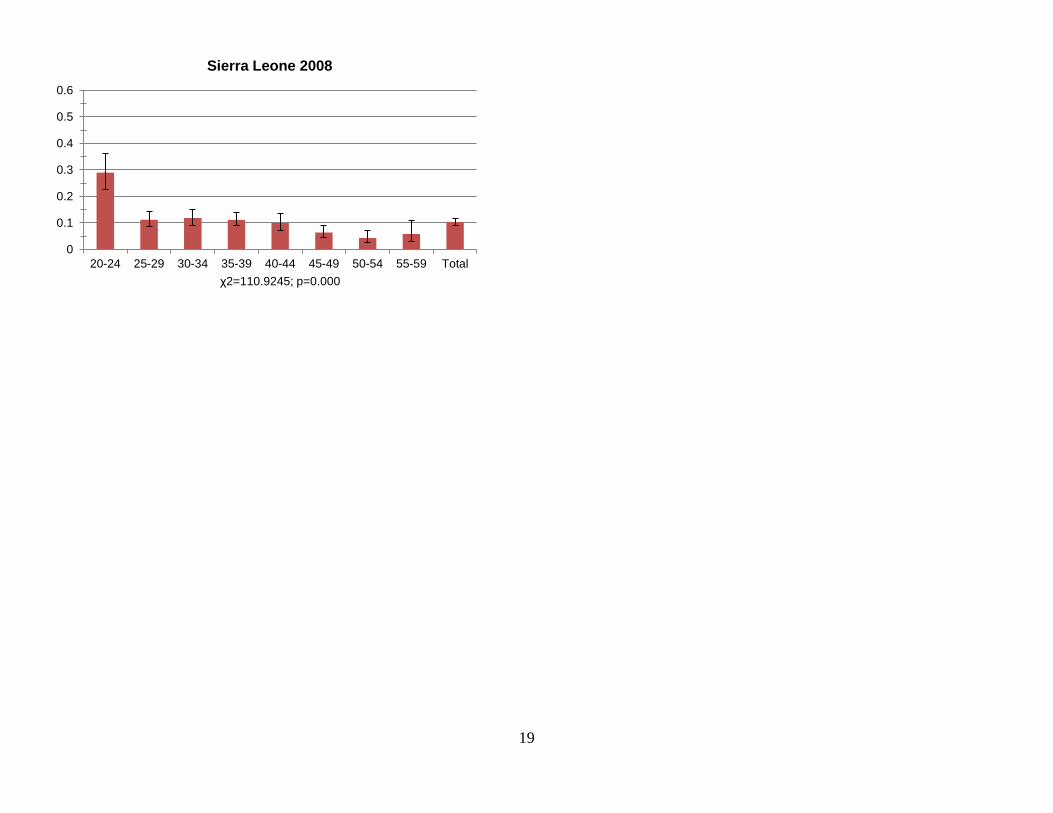
Men’s early marriage varies significantly by age cohort in seven of the nine countries studied here3. Only
in Chad and Nepal are differences by age not statistically significant. In all countries in which
statistically significant differences are found, the prevalence of early marriage is higher among the
youngest cohorts and lower among older cohorts of men. This finding would imply, perhaps countering
expectations, that the prevalence of early marriage among men in these countries has increased rather than
decreased over time.
Several countries show a pattern where the proportion of men marrying before age 18 steadily declines as
one moves from younger to older cohorts. The differences are perhaps starkest in the Comoros, where
40% of men age 20-24 married by age 18 compared to 5% of men age 55-59. In contrast, while the
proportion of men married by age 18 decreases steadily over each age cohort in the Dominican Republic,
the differences between each age group are much smaller. Nonetheless, 20% of men age 20-24 married by
age 18 compared to 6% among those age 55-59.
3 The prevalence of marriage before age 18 was also examined by 10-year age group (data not shown), resulting in
the same findings.
17
Figure 4. Prevalence of marriage before age 18 among ever-married men by five year age group
0
0.1
0.2
0.3
0.4
0.5
0.6
20-24 25-29 30-34 35-39 40-44 45-49 50-54 55-59 Total
χ2=5.9783; p=0.858
Chad 2004
0
0.1
0.2
0.3
0.4
0.5
0.6
20-24 25-29 30-34 35-39 40-44 45-49 50-54 55-59 Total
χ2=73.8163; p=0.000
Comoros 2012
0
0.1
0.2
0.3
0.4
0.5
0.6
20-24 25-29 30-34 35-39 40-44 45-49 50-54 55-59 Total
χ2=102.5107; p=0.000
Dominican Republic 2013
0
0.1
0.2
0.3
0.4
0.5
0.6
20-24 25-29 30-34 35-39 40-44 45-49 50-54 55-59 Total
χ2=83.9213; p=0.000
Ethiopia 2011
18
0
0.1
0.2
0.3
0.4
0.5
0.6
20-24 25-29 30-34 35-39 40-44 45-49 50-54 55-59 Total
χ2=80.6068; p=0.000
Honduras 2011-12
0
0.1
0.2
0.3
0.4
0.5
0.6
20-24 25-29 30-34 35-39 40-44 45-49 50-54 Total
χ2=215.7095; p=0.000
India 2005-06
0
0.1
0.2
0.3
0.4
0.5
0.6
20-24 25-29 30-34 35-39 40-44 45-49 50-54 55-59 Total
χ2=230.3025; p=0.000
Madagascar 2008-09
0
0.1
0.2
0.3
0.4
0.5
0.6
20-24 25-29 30-34 35-39 40-44 45-49
χ2=7.7406; p=0.390
Nepal 2011
19
0
0.1
0.2
0.3
0.4
0.5
0.6
20-24 25-29 30-34 35-39 40-44 45-49 50-54 55-59 Total
χ2=110.9245; p=0.000
Sierra Leone 2008
20
The largest difference frequently is between the youngest age cohort (20-24 year old men) and those five
or ten years older with much smaller difference among older age cohorts, as in the Comoros, Madagascar,
and Sierra Leone. The prevalence of men’s early marriage falls from 40% among men age 20-24 to 22%
among men age 25-29 and 12% among men age 30-34 in the Comoros; from 29% among men age 20-24
to 15% among men age 25-29 in Madagascar; and from 29% to 11% in Sierra Leone. In India and
Ethiopia, the difference in prevalence among age groups for men age 30-49 are barely distinguishable,
though a smaller proportion of older men and a larger proportion of younger men married early in these
countries.
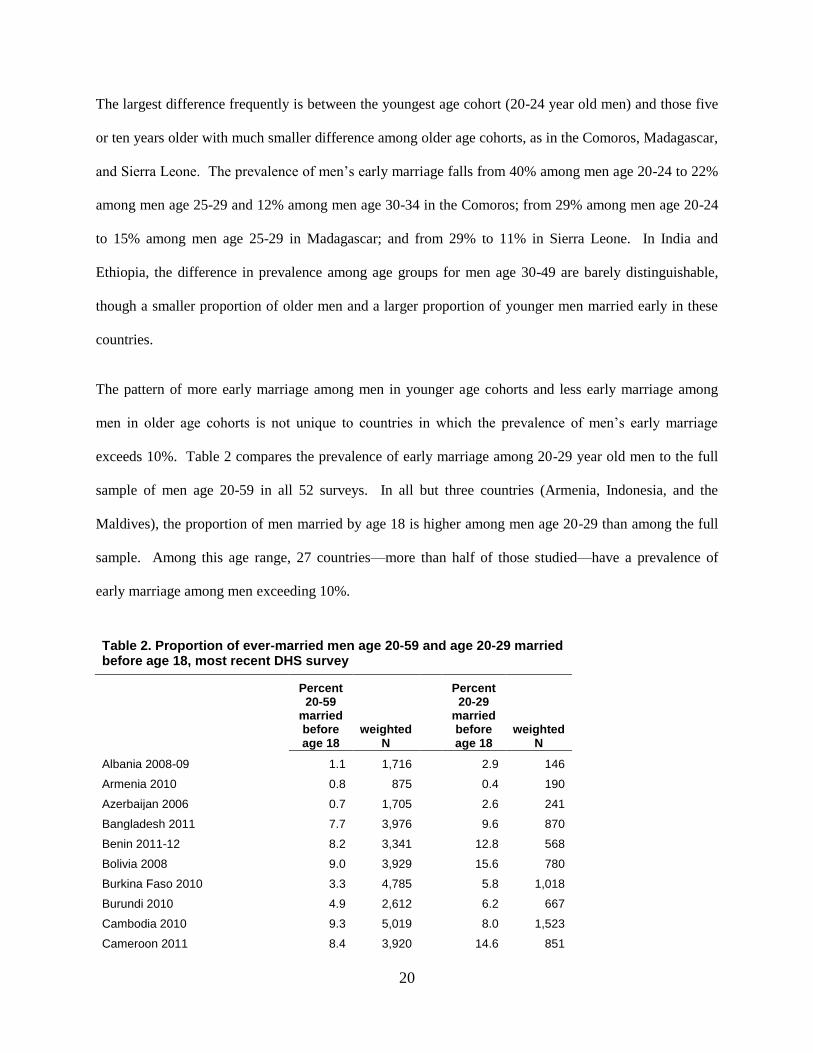
The pattern of more early marriage among men in younger age cohorts and less early marriage among
men in older age cohorts is not unique to countries in which the prevalence of men’s early marriage
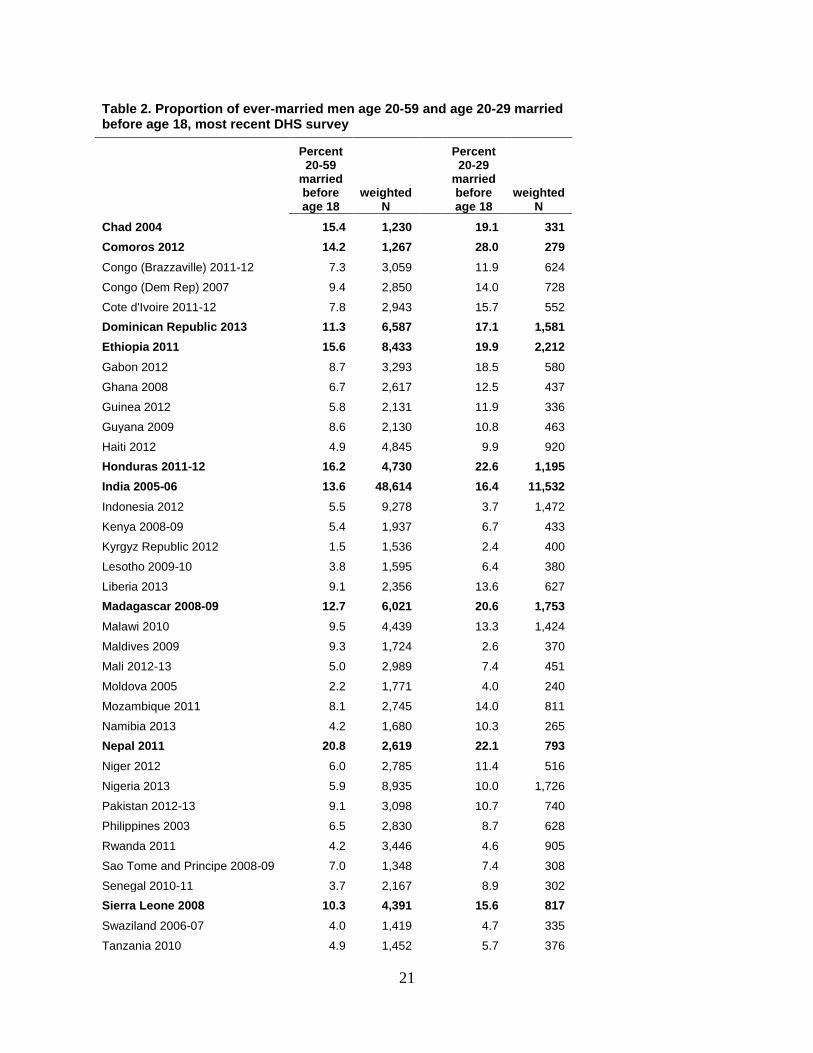
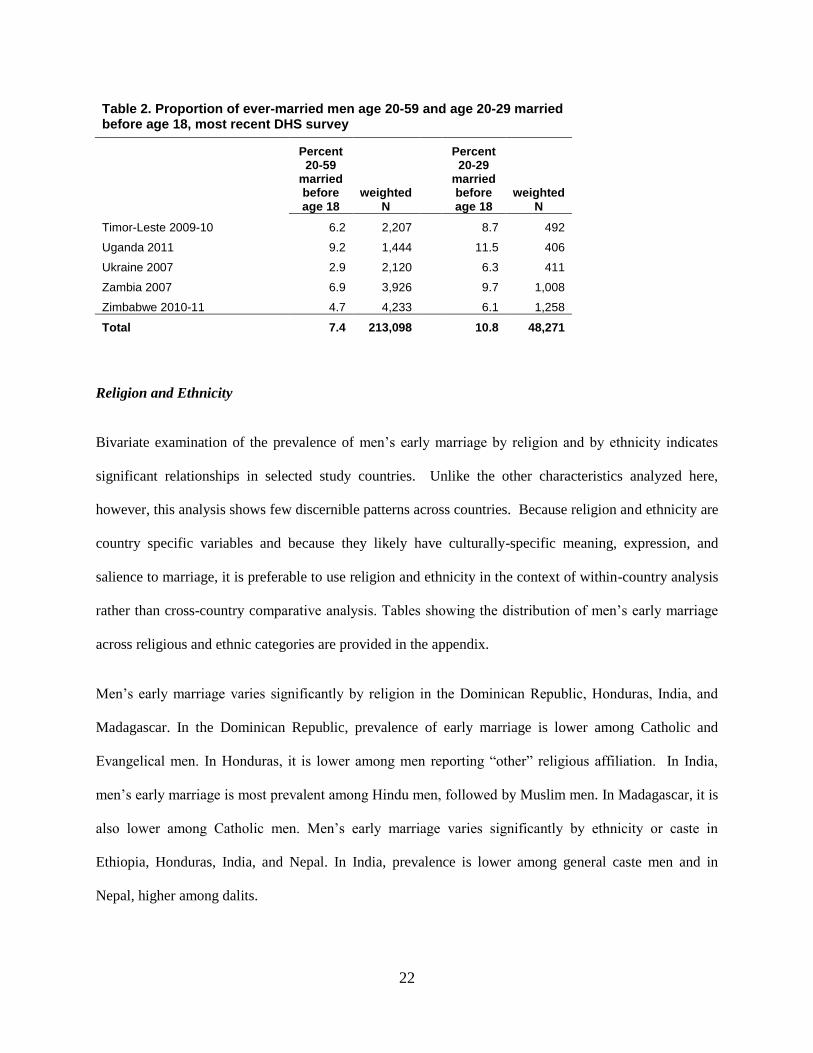
exceeds 10%. Table 2 compares the prevalence of early marriage among 20-29 year old men to the full
sample of men age 20-59 in all 52 surveys. In all but three countries (Armenia, Indonesia, and the
Maldives), the proportion of men married by age 18 is higher among men age 20-29 than among the full
sample. Among this age range, 27 countries—more than half of those studied—have a prevalence of
early marriage among men exceeding 10%.
Table 2. Proportion of ever-married men age 20-59 and age 20-29 married before age 18, most recent DHS survey
Percent 20-59
married before age 18
weighted N
Percent 20-29
married before age 18
weighted N
Albania 2008-09 1.1 1,716
2.9 146
Armenia 2010 0.8 875
0.4 190
Azerbaijan 2006 0.7 1,705
2.6 241
Bangladesh 2011 7.7 3,976
9.6 870
Benin 2011-12 8.2 3,341
12.8 568
Bolivia 2008 9.0 3,929
15.6 780
Burkina Faso 2010 3.3 4,785
5.8 1,018
Burundi 2010 4.9 2,612
6.2 667
Cambodia 2010 9.3 5,019
8.0 1,523
Cameroon 2011 8.4 3,920
14.6 851
21
Table 2. Proportion of ever-married men age 20-59 and age 20-29 married before age 18, most recent DHS survey
Percent 20-59
married before age 18
weighted N
Percent 20-29
married before age 18
weighted N
Chad 2004 15.4 1,230
19.1 331
Comoros 2012 14.2 1,267
28.0 279
Congo (Brazzaville) 2011-12 7.3 3,059
11.9 624
Congo (Dem Rep) 2007 9.4 2,850
14.0 728
Cote d'Ivoire 2011-12 7.8 2,943
15.7 552
Dominican Republic 2013 11.3 6,587
17.1 1,581
Ethiopia 2011 15.6 8,433
19.9 2,212
Gabon 2012 8.7 3,293
18.5 580
Ghana 2008 6.7 2,617
12.5 437
Guinea 2012 5.8 2,131
11.9 336
Guyana 2009 8.6 2,130
10.8 463
Haiti 2012 4.9 4,845
9.9 920
Honduras 2011-12 16.2 4,730
22.6 1,195
India 2005-06 13.6 48,614
16.4 11,532
Indonesia 2012 5.5 9,278
3.7 1,472
Kenya 2008-09 5.4 1,937
6.7 433
Kyrgyz Republic 2012 1.5 1,536
2.4 400
Lesotho 2009-10 3.8 1,595
6.4 380
Liberia 2013 9.1 2,356
13.6 627
Madagascar 2008-09 12.7 6,021
20.6 1,753
Malawi 2010 9.5 4,439
13.3 1,424
Maldives 2009 9.3 1,724
2.6 370
Mali 2012-13 5.0 2,989
7.4 451
Moldova 2005 2.2 1,771
4.0 240
Mozambique 2011 8.1 2,745
14.0 811
Namibia 2013 4.2 1,680
10.3 265
Nepal 2011 20.8 2,619
22.1 793
Niger 2012 6.0 2,785
11.4 516
Nigeria 2013 5.9 8,935
10.0 1,726
Pakistan 2012-13 9.1 3,098
10.7 740
Philippines 2003 6.5 2,830
8.7 628
Rwanda 2011 4.2 3,446
4.6 905
Sao Tome and Principe 2008-09 7.0 1,348
7.4 308
Senegal 2010-11 3.7 2,167
8.9 302
Sierra Leone 2008 10.3 4,391
15.6 817
Swaziland 2006-07 4.0 1,419
4.7 335
Tanzania 2010 4.9 1,452
5.7 376
22
Table 2. Proportion of ever-married men age 20-59 and age 20-29 married before age 18, most recent DHS survey
Percent 20-59
married before age 18
weighted N
Percent 20-29
married before age 18
weighted N
Timor-Leste 2009-10 6.2 2,207
8.7 492
Uganda 2011 9.2 1,444
11.5 406
Ukraine 2007 2.9 2,120
6.3 411
Zambia 2007 6.9 3,926
9.7 1,008
Zimbabwe 2010-11 4.7 4,233
6.1 1,258
Total 7.4 213,098 10.8 48,271
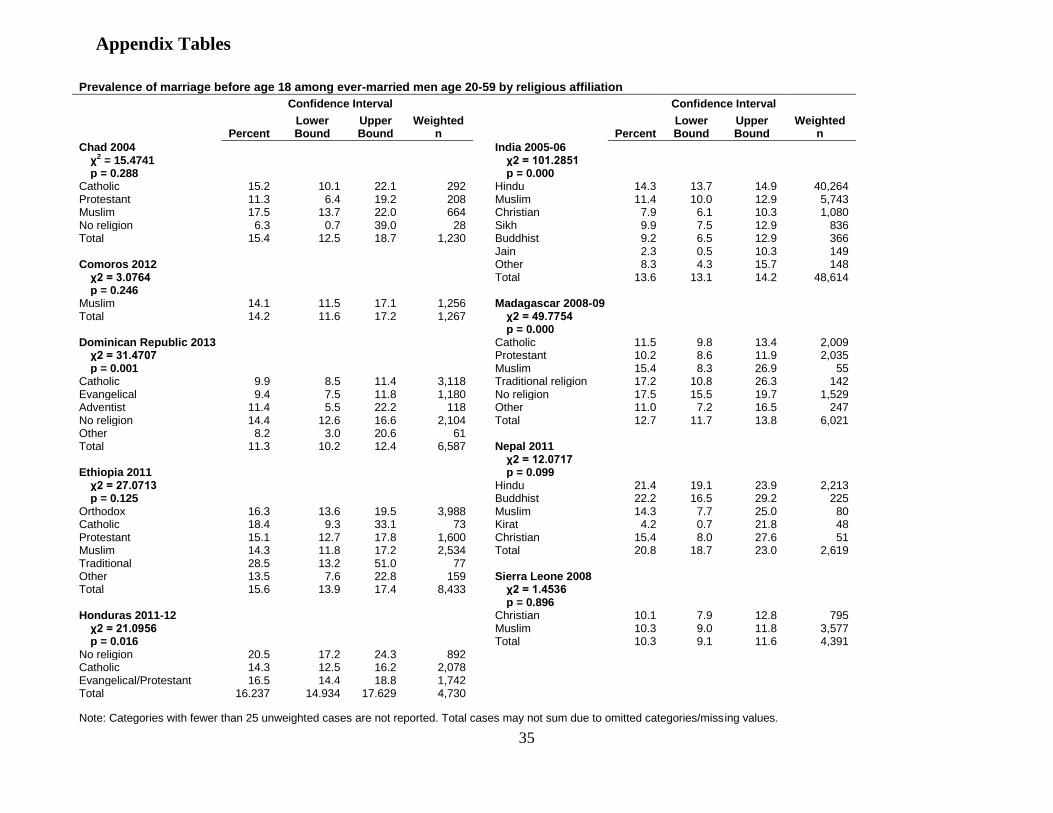
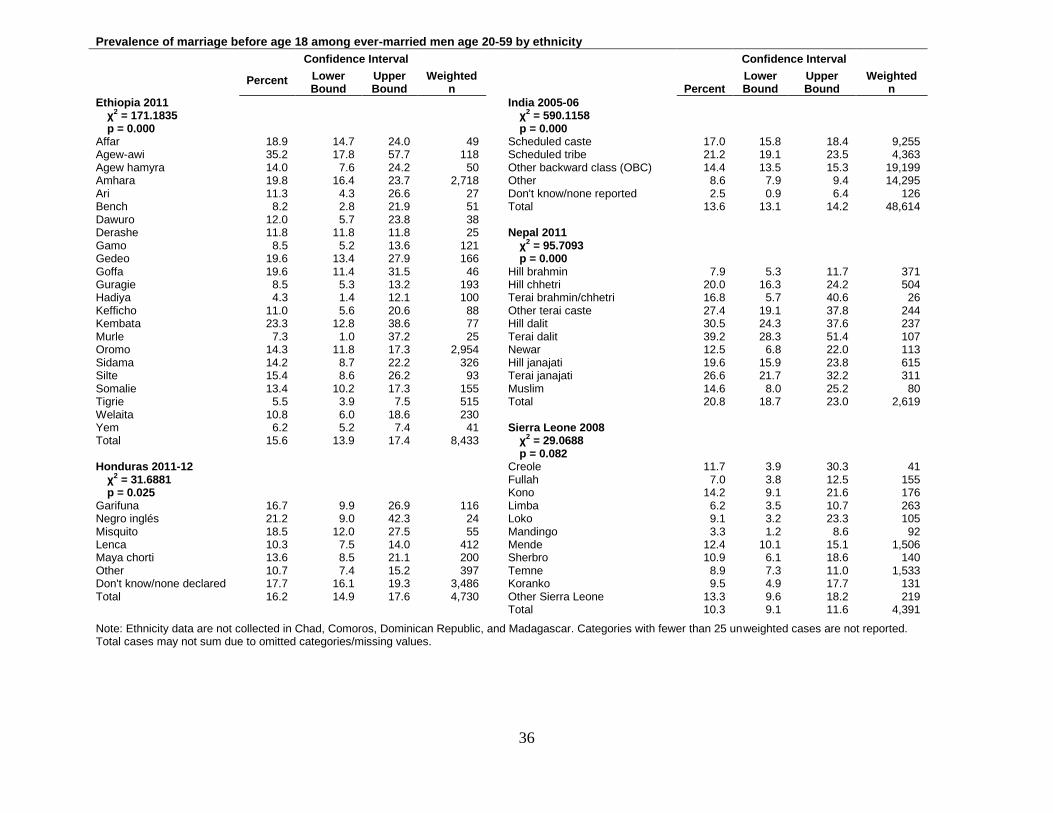
Religion and Ethnicity
Bivariate examination of the prevalence of men’s early marriage by religion and by ethnicity indicates
significant relationships in selected study countries. Unlike the other characteristics analyzed here,
however, this analysis shows few discernible patterns across countries. Because religion and ethnicity are
country specific variables and because they likely have culturally-specific meaning, expression, and
salience to marriage, it is preferable to use religion and ethnicity in the context of within-country analysis
rather than cross-country comparative analysis. Tables showing the distribution of men’s early marriage
across religious and ethnic categories are provided in the appendix.
Men’s early marriage varies significantly by religion in the Dominican Republic, Honduras, India, and
Madagascar. In the Dominican Republic, prevalence of early marriage is lower among Catholic and
Evangelical men. In Honduras, it is lower among men reporting “other” religious affiliation. In India,
men’s early marriage is most prevalent among Hindu men, followed by Muslim men. In Madagascar, it is
also lower among Catholic men. Men’s early marriage varies significantly by ethnicity or caste in
Ethiopia, Honduras, India, and Nepal. In India, prevalence is lower among general caste men and in
Nepal, higher among dalits.
23
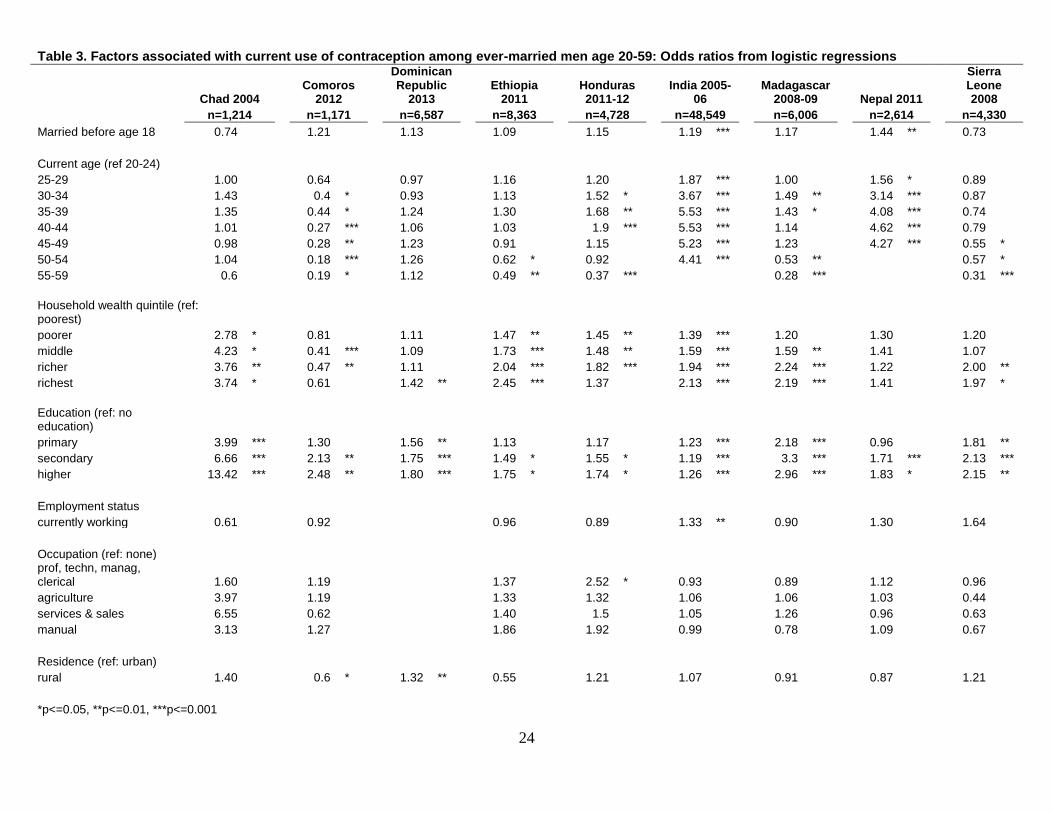
Early Marriage and Fertility-related Outcomes
Current use of contraception
To investigate whether men’s early marriage influences current use of contraception, we estimate a
multivariate logistic regression using marriage before age 18 and other controls as covariates,4 with
results shown in Table 3. In only two surveys is marriage before age 18 associated with current use of
contraception, net of other factors. In both cases, early marriage is associated with greater likelihood of
currently using contraception. In India, the odds of currently using contraception are 19% greater men
who married before the age of 18 (p≤0.001) and, in Nepal, the odds are 44% greater (p≤0.01).
4 This model controls for current age, household wealth quintile, educational attainment, employment status,
occupation, and urban/rural residence. The Dominican Republic 2013 DHS did not collect data on employment
status or occupation and so the model for this country omits these variables.
24
Table 3. Factors associated with current use of contraception among ever-married men age 20-59: Odds ratios from logistic regressions
Chad 2004
Comoros 2012
Dominican Republic
2013
Ethiopia 2011
Honduras 2011-12
India 2005-06
Madagascar 2008-09
Nepal 2011
Sierra Leone 2008
n=1,214
n=1,171
n=6,587
n=8,363
n=4,728
n=48,549
n=6,006
n=2,614
n=4,330
Married before age 18 0.74
1.21
1.13
1.09
1.15
1.19 ***
1.17
1.44 **
0.73
Current age (ref 20-24) 25-29 1.00
0.64
0.97
1.16
1.20
1.87 ***
1.00
1.56 *
0.89
30-34 1.43
0.4 *
0.93
1.13
1.52 *
3.67 ***
1.49 **
3.14 ***
0.87 35-39 1.35
0.44 *
1.24
1.30
1.68 **
5.53 ***
1.43 *
4.08 ***
0.74
40-44 1.01
0.27 ***
1.06
1.03
1.9 ***
5.53 ***
1.14
4.62 ***
0.79 45-49 0.98
0.28 **
1.23
0.91
1.15
5.23 ***
1.23
4.27 ***
0.55 *
50-54 1.04
0.18 ***
1.26
0.62 *
0.92
4.41 ***
0.53 **
0.57 *
55-59 0.6
0.19 *
1.12
0.49 **
0.37 ***
0.28 ***
0.31 ***
Household wealth quintile (ref: poorest)
poorer 2.78 *
0.81
1.11
1.47 **
1.45 **
1.39 ***
1.20
1.30
1.20 middle 4.23 *
0.41 ***
1.09
1.73 ***
1.48 **
1.59 ***
1.59 **
1.41
1.07
richer 3.76 **
0.47 **
1.11
2.04 ***
1.82 ***
1.94 ***
2.24 ***
1.22
2.00 **
richest 3.74 *
0.61
1.42 **
2.45 ***
1.37
2.13 ***
2.19 ***
1.41
1.97 *
Education (ref: no education)
primary 3.99 ***
1.30
1.56 **
1.13
1.17
1.23 ***
2.18 ***
0.96
1.81 **
secondary 6.66 ***
2.13 **
1.75 ***
1.49 *
1.55 *
1.19 ***
3.3 ***
1.71 ***
2.13 ***
higher 13.42 ***
2.48 **
1.80 ***
1.75 *
1.74 *
1.26 ***
2.96 ***
1.83 *
2.15 **
Employment status currently working 0.61
0.92
0.96
0.89
1.33 **
0.90
1.30
1.64
Occupation (ref: none) prof, techn, manag,
clerical 1.60
1.19
1.37
2.52 *
0.93
0.89
1.12
0.96 agriculture 3.97
1.19
1.33
1.32
1.06
1.06
1.03
0.44
services & sales 6.55
0.62
1.40
1.5
1.05
1.26
0.96
0.63 manual 3.13
1.27
1.86
1.92
0.99
0.78
1.09
0.67
Residence (ref: urban) rural 1.40
0.6 *
1.32 **
0.55
1.21
1.07
0.91
0.87
1.21
*p<=0.05, **p<=0.01, ***p<=0.001
25
While one might be inclined to surmise that the positive association between men’s early marriage and
current use of contraception is restricted to South Asia, it should be noted that an earlier analysis using
2007 DHS data from the Dominican Republic also found a strong positive association (OR = 1.28,
p≤0.01). This association is not evident in the 2013 data. Additionally, that five of the seven surveys with
no statistical significance nonetheless have odds in the same direction is tentatively suggestive that the
relationship between men’s early marriage and current contraceptive use, wherever it is statistically
detectable, is likely to be a positive one.
Factors that are more universally (and positively) associated with current use of contraception are
household wealth and education. Current age is associated with current use of contraception in six of nine
study countries. Employment status and occupation are seldom associated with contraceptive use in any
of the surveys.
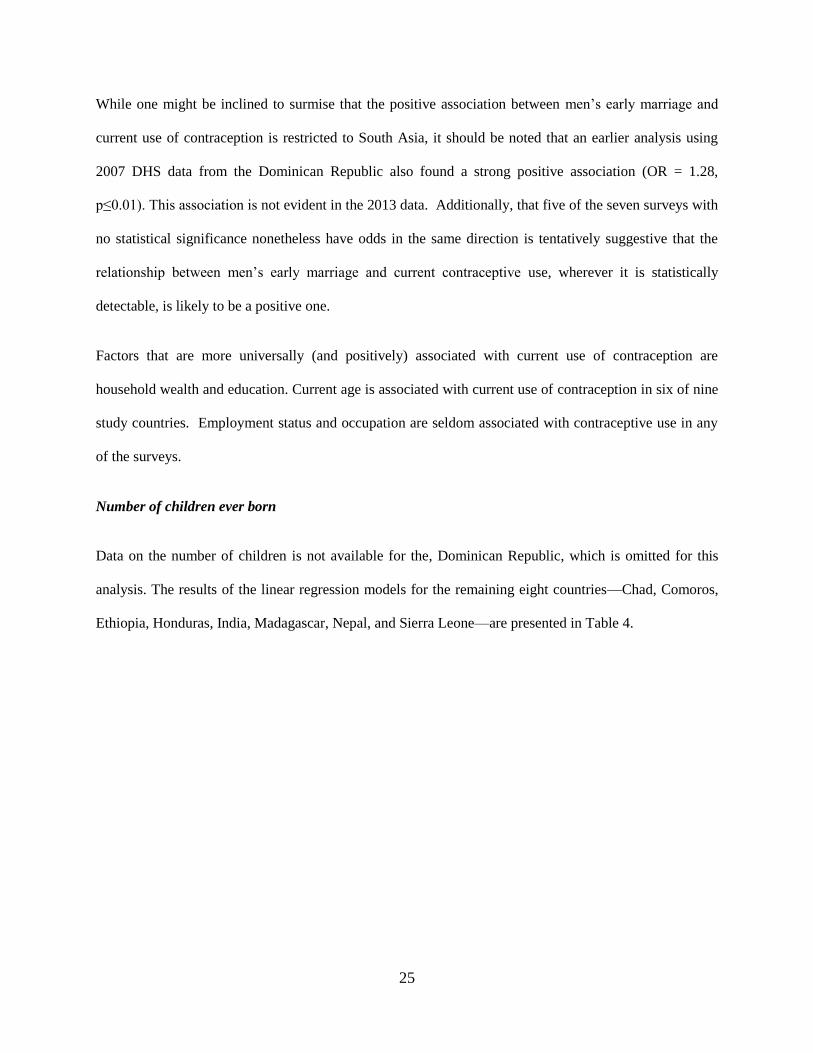
Number of children ever born
Data on the number of children is not available for the, Dominican Republic, which is omitted for this
analysis. The results of the linear regression models for the remaining eight countries—Chad, Comoros,
Ethiopia, Honduras, India, Madagascar, Nepal, and Sierra Leone—are presented in Table 4.
26
Table 4. Factors associated with the number of children ever born among ever-married men age 20-59: Coefficients from linear regressions
Chad 2004
Comoros 2012
Ethiopia 2011
Honduras 2011-12
India 2005-06
Madagascar 2008-09
Nepal 2011
Sierra Leone 2008
n=1,214
n=1,171
n=8,363
n=4,728
n=48,549
n=6,006
n=2,614
n=4,330
Married before age 18 4.60 ***
5.23 ***
3.56 ***
2.45 ***
2.64 ***
3.47 ***
2.66 ***
3.03 ***
Current age (ref 20-24) 25-29 3.79 ***
1.98
3.35 ***
2.09 ***
2.73 ***
2.98 ***
2.16 ***
2.42 ***
30-34 17.02 ***
7.10 ***
14.31 ***
4.14 ***
6.70 ***
10.12 ***
4.58 ***
8.06 ***
35-39 90.14 ***
16.71 ***
50.35 ***
9.43 ***
12.29 ***
28.51 ***
11.19 ***
34.02 ***
40-44 744.04 ***
52.37 ***
227.82 ***
20.75 ***
19.83 ***
69.60 ***
20.09 ***
107.01 ***
45-49 3044.7 ***
119.46 ***
669.44 ***
44.03 ***
27.88 ***
124.15 ***
26.90 ***
382.47 ***
50-54 4024 ***
256.89 ***
1460.2 ***
107.8 ***
33.36 ***
346.60 ***
792.29 ***
55-59 7823 ***
215.44 ***
2418.9 ***
229.02 ***
511.11 ***
1613.4 ***
Household wealth quintile (ref: poorest) poorer 2.35
0.23 ***
0.70 **
0.61 ***
0.82 ***
0.62 ***
0.62 ***
1.20
middle 3.91 **
0.2
0.83
0.46 ***
0.61 ***
0.56 ***
0.56 ***
1.72 **
richer 3.97 **
0.12 ***
0.87
0.36 ***
0.50 ***
0.48 ***
0.41 ***
1.72 **
richest 6.02 **
0.08 ***
0.86
0.30 ***
0.33 ***
0.22 ***
0.3 ***
1.24
Education (ref: no education) primary 0.78
0.26 ***
1.17
0.72
0.79 ***
1.22
0.74 *
0.64 *
secondary 0.64
0.26 ***
0.80
0.72
0.67
0.96
0.58 ***
0.61 **
higher 0.10 ***
0.14 ***
0.50 *
0.40 ***
0.48 ***
0.54 **
0.4 ***
0.39 **
Employment status currently working 1.08
1.34
1.10
1.18
0.87
0.74
1.05
0.53
Occupation (ref: none) prof, techn, manag, clerical 2.60
1.23
0.50
0.90
1.12
1.34
1.39
3.21 agriculture 3.15
1.12
1.00
0.93
1.28
1.68
1.52
5.45 **
services & sales 6.19
1.80
0.63
0.76
1.36 *
1.24
1.64 *
2.33 manual 1.27
1.33
0.40 *
0.99
1.37 *
1.39
1.55
3.21
Residence (ref: urban) rural 2.24
0.97
2.87 ***
1.14
1.08 *
1.13
1.07
2.24 ***
*p<=0.05, **p<=0.01, ***p<=0.001
27
Men’s early marriage is positively and strongly associated with the total number of children ever born in
all eight countries. The effect is smallest in Honduras, India, and Nepal where the number of children
born to men who marry early is 2.45 to 2.66 greater than among men who marry after age 18 (p≤0.001),
controlling for other factors. In Chad and the Comoros, men who marry before age 18 have 4.6 and 5.23
more children, respectively, than men who marry at or above age 18 (p≤0.001).
Among other factors, men’s age is consistently and positively associated with the number of children ever
born. Household wealth is negatively associated with the number of children ever born in six surveys and
shows a positive association in two surveys (Chad and Sierra Leone). The number of children ever born
decreases with each level of education attained in the Comoros, India, Nepal, and Sierra Leone.
Elsewhere, the number of children ever born is significantly lower only among men achieving higher
education. Rural residence is associated with more children born in Ethiopia, India, and Sierra Leone.
Employment status and occupation do not show a consistent pattern of association with men’s number of
children ever born.
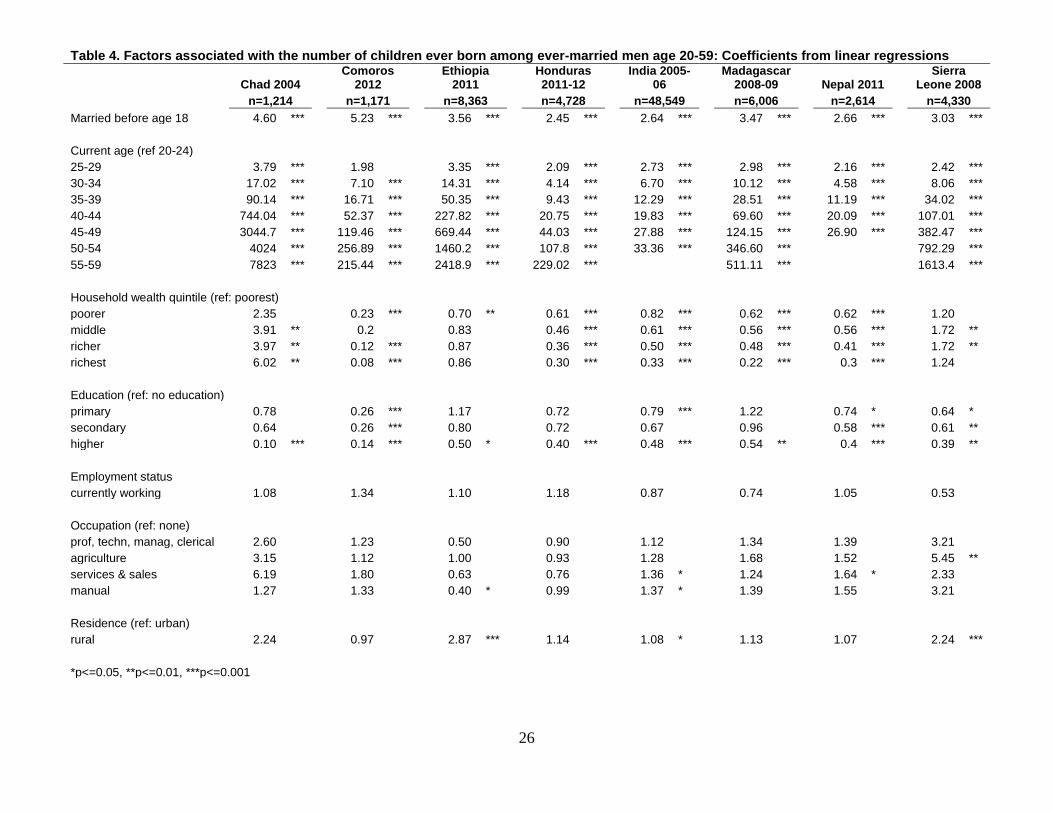
Early Marriage and Life Options Outcomes
Employment status
Table 5 presents the results of a logistic regression model for eight countries estimating the influence of
men’s early marriage and other factors on men’s current employment status (coded as ‘1’ for men who
report that they are currently working and ‘0’ if they are not currently working). The Dominican Republic
is again omitted due to lack of data on employment status.
28
Table 5. Factors associated with current employment status among ever-married men age 20-59: Odds ratios from logistic regressions
Chad 2004
Comoros 2012
Ethiopia 2011
Honduras 2011-12
India 2005-06
Madagascar 2008-09
Nepal 2011
Sierra Leone 2008
n=1,229
n=1,265
n=8,431
n=4,730
n=48,593
n=6,021
n=2,619
n=4,390
Married before age 18 1.95
0.61
1.11
0.82
0.89
0.78
1.08
1.11
Current age (ref 20-24) 25-29 2.74 *
1.19
1.31
2.38 *
1.92 ***
8.28 ***
1.65
1.89 30-34 3.56 *
2.57 *
1.31
2.04
2.06 ***
10.35 ***
1.28
2.95 **
35-39 3.9 *
2.56 *
1.47 *
1.72
2.19 ***
30.91 ***
1.49
3.49 ***
40-44 13.27 ***
2.02
1.40
3.23 **
2.17 ***
23.80 ***
1.69
3.67 **
45-49 8.63 ***
3.45 **
1.33
1.46
1.64 ***
24.73 ***
1.70
3.26 **
50-54 3.27
1.69
1.34
0.66
0.99
7.97 ***
3.03 *
55-59 9.98 **
1.64
1.78 *
0.75
2.82
1.38
Household wealth quintile (ref: poorest) poorer 1.09
1.56
0.87
1.07
1.61 ***
1.02
1.48
1.85 *
middle 13.68 *
1.83
0.79
1.15
1.9 ***
0.46
1.19
1.84 richer 4.33
1.52
0.85
0.80
1.86 ***
0.35
1.12
1.24
richest 0.61
1.43
0.93
1.52
2.15 ***
0.14 *
1.11
0.83
Education (ref: no education) primary 1.91
1.15
1.35 *
1.45
0.79
1.39
1.51
0.93
secondary 0.75
0.72
1.64
0.93
0.71 **
0.61
0.79
0.50 **
higher 0.43
0.80
2.15 **
1.07
0.60 **
0.31
0.69
0.59
Residence (ref: urban) rural 3.07
0.84
0.88
2.26 **
0.75 **
2.41
0.62 *
1.91 *
*p<=0.05, **p<=0.01, ***p<=0.001
29
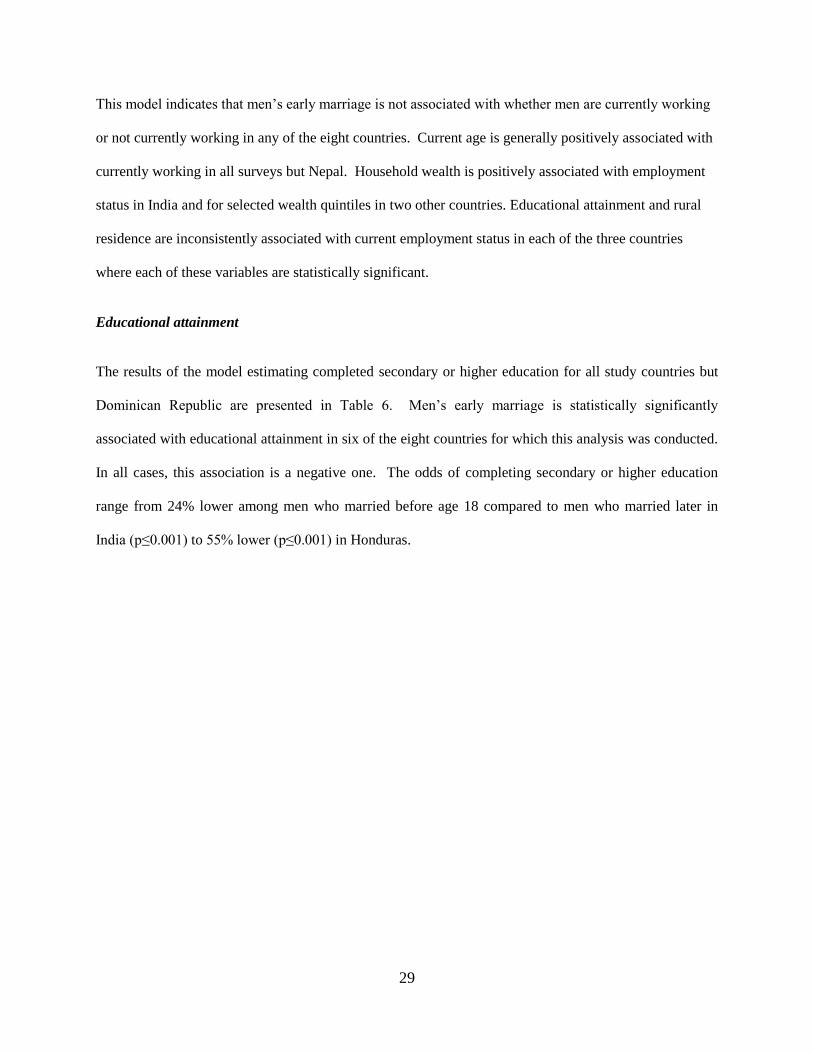
This model indicates that men’s early marriage is not associated with whether men are currently working
or not currently working in any of the eight countries. Current age is generally positively associated with
currently working in all surveys but Nepal. Household wealth is positively associated with employment
status in India and for selected wealth quintiles in two other countries. Educational attainment and rural
residence are inconsistently associated with current employment status in each of the three countries
where each of these variables are statistically significant.
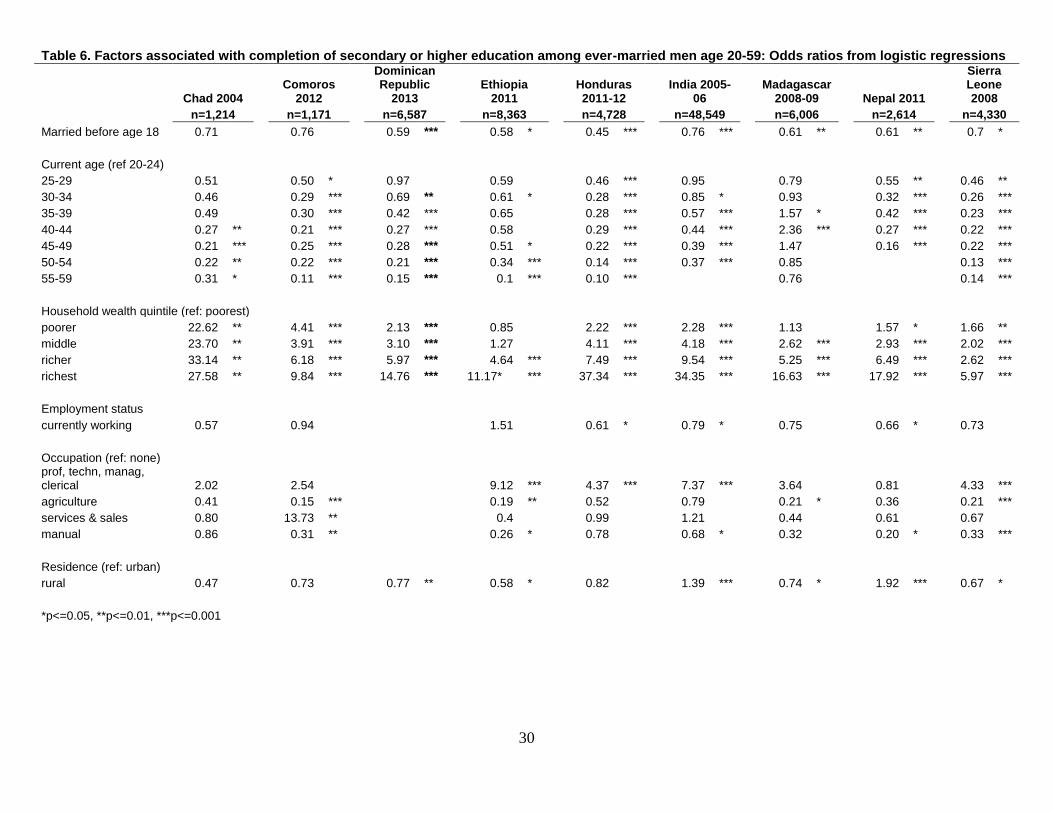
Educational attainment
The results of the model estimating completed secondary or higher education for all study countries but
Dominican Republic are presented in Table 6. Men’s early marriage is statistically significantly
associated with educational attainment in six of the eight countries for which this analysis was conducted.
In all cases, this association is a negative one. The odds of completing secondary or higher education
range from 24% lower among men who married before age 18 compared to men who married later in
India (p≤0.001) to 55% lower (p≤0.001) in Honduras.
30
Table 6. Factors associated with completion of secondary or higher education among ever-married men age 20-59: Odds ratios from logistic regressions
Chad 2004
Comoros 2012
Dominican Republic
2013
Ethiopia 2011
Honduras 2011-12
India 2005-06
Madagascar 2008-09
Nepal 2011
Sierra Leone 2008
n=1,214
n=1,171
n=6,587
n=8,363
n=4,728
n=48,549
n=6,006
n=2,614
n=4,330
Married before age 18 0.71
0.76
0.59 ***
0.58 *
0.45 ***
0.76 ***
0.61 **
0.61 **
0.7 *
Current age (ref 20-24) 25-29 0.51
0.50 *
0.97
0.59
0.46 ***
0.95
0.79
0.55 **
0.46 **
30-34 0.46
0.29 ***
0.69 **
0.61 *
0.28 ***
0.85 *
0.93
0.32 ***
0.26 ***
35-39 0.49
0.30 ***
0.42 ***
0.65
0.28 ***
0.57 ***
1.57 *
0.42 ***
0.23 ***
40-44 0.27 **
0.21 ***
0.27 ***
0.58
0.29 ***
0.44 ***
2.36 ***
0.27 ***
0.22 ***
45-49 0.21 ***
0.25 ***
0.28 ***
0.51 *
0.22 ***
0.39 ***
1.47
0.16 ***
0.22 ***
50-54 0.22 **
0.22 ***
0.21 ***
0.34 ***
0.14 ***
0.37 ***
0.85
0.13 ***
55-59 0.31 *
0.11 ***
0.15 ***
0.1 ***
0.10 ***
0.76
0.14 ***
Household wealth quintile (ref: poorest) poorer 22.62 **
4.41 ***
2.13 ***
0.85
2.22 ***
2.28 ***
1.13
1.57 *
1.66 **
middle 23.70 **
3.91 ***
3.10 ***
1.27
4.11 ***
4.18 ***
2.62 ***
2.93 ***
2.02 ***
richer 33.14 **
6.18 ***
5.97 ***
4.64 ***
7.49 ***
9.54 ***
5.25 ***
6.49 ***
2.62 ***
richest 27.58 **
9.84 ***
14.76 ***
11.17* ***
37.34 ***
34.35 ***
16.63 ***
17.92 ***
5.97 ***
Employment status currently working 0.57
0.94
1.51
0.61 *
0.79 *
0.75
0.66 *
0.73
Occupation (ref: none) prof, techn, manag,
clerical 2.02
2.54
9.12 ***
4.37 ***
7.37 ***
3.64
0.81
4.33 ***
agriculture 0.41
0.15 ***
0.19 **
0.52
0.79
0.21 *
0.36
0.21 ***
services & sales 0.80
13.73 **
0.4
0.99
1.21
0.44
0.61
0.67 manual 0.86
0.31 **
0.26 *
0.78
0.68 *
0.32
0.20 *
0.33 ***
Residence (ref: urban) rural 0.47
0.73
0.77 **
0.58 *
0.82
1.39 ***
0.74 *
1.92 ***
0.67 *
*p<=0.05, **p<=0.01, ***p<=0.001
31
Age is generally negatively associated with educational attainment and household wealth is usually
positively associated with completing secondary or higher education. Rural residence and selected
educational categories are also frequently significantly associated with educational attainment, though the
direction of the association is not consistent. Where current employment status is significantly associated
with completing secondary or higher education (Honduras, India, and Nepal), it is negatively so.
Discussion and Conclusions
These results provide some of the first insights into the extent of early marriage among boys at the global
level and the degree to which this phenomena is related to a range of factors that have been investigated
in relation to child marriage among girls. The results of the bivariate analyses suggest that many of the
same factors are related to very early marriage for both boys and girls. However, there are a number of
important differences that emerge between the two. As is the case for women, men who married as boys
are more likely to live in rural areas, be poorer than their peers who married later, and to not have
completed more than primary school. However, the strength of these relationships across the range of
countries examined here is less strong than is typically the case when examining early marriage among
girls, with early marriage among boys not significantly related to these factors in a number of countries.
Furthermore, in contrast to the global patterns of child marriage among girls, which have generally seen
declines in rates of early marriage over time, we find some evidence that early marriage rates are higher
for younger cohorts of men, suggesting at least a partial reversal of broader trends towards older age at
marriage. There are a number of potential reasons for this, including a greater convergence between the
sexes in ages at marriage that lowers the age at marriage among boys while simultaneously increasing it
among girls. Potential selection effects in which men are included in older age cohorts, possibly due to
differential mortality rates between those who marry early and those who do not; disproportionate degree
32
of misreporting of age and age at marriage at older ages; changes in the types of relationships that are
classified as ‘married or living together as if married’; or the disproportionate underreporting of informal
unions among older cohorts may misleadingly present as a trend toward increasing rates of early marriage
when no such trend exists. Alternatively, these data may be capturing a secular trend towards earlier
cohabiting unions, possibly as the result of greater economic uncertainty, increased migration, changing
social norms governing unions and romantic partnerships, or other macro processes influencing family
formation processes for boys and men.
The multivariate analyses find strong associations between early marriage and both total number of
children and educational attainment but a middling relationship with use of contraception and
employment status. In part this may be the result of life cycle effects – those marrying at earlier ages are
likely to have, at the time of the survey, been married longer and more completed families – which are not
fully controlled for in the models but likely influence contraceptive use and total number of children in
particular. Nonetheless, these results, in combination with the bivariate associations, do suggest that the
factors driving early marriage at the cross-national level among boys differ somewhat from those that
drive marriage among girls.
In conclusion, these results demonstrate that while much less common than among girls, significant
proportions of men are married as boys, with potentially significant implications for a range of
development, health and social outcomes. However, the analyses presented here also suggest significant
differences between both the associations and consequences of child marriage for boys and girls,
presenting challenges to both researchers and policy-makers interested in understanding and preventing
child marriage for both boys and girls. Further research is needed to fully understand both the degree to
which early marriage among boys shares common social or economic determinants and consequences
with that among girls, particularly in terms of understanding the role of gender norms in shaping family
formation patterns and expectations for both groups, the ‘process’ of marriage (particularly the degree of
agency involved), and the implications of these patterns for a broader range of outcomes.
33
References
Cooper, L. G., N.L. Leland, and G. Alexander. (1995) “Effect of maternal age on birth outcomes among
young adolescents.” Biodemography and Social Biology 42(1-2): 22-35.
Ezeh A.C., Mberu B. U., Emina O. J. (2009). “Analysis of Patterns, Determinants and Implications of the
Stall in Fertility Decline in Eastern African Countries: regional”, Phil. Trans. R. Soc. B, 364, doi:
10.1098/rstb.2009.0166.
Fall, S. and P. Ngom (2001). "Baisse de la fécondité en Afrique francophone : Tendances récentes et
futures". Communication présentée au séminaire organisé par la Division Population, Nations
unies sur les Perspectives de déclin de la fécondité dans les pays à forte fécondité, New-York, 9-
11 juillet 2001, 18 p.
Gage, Anastasia. 2000. "Female Empowerment and Adolescent Demographic Behaviour." Pp. 186-203 in
Women’s Empowerment and Demographic Processes: Moving Beyond Cairo, edited by Harriet
Presser and Gita Sen. Oxford: Oxford UP.
Goonewardene, I. M., and R.P. Deeyagaha Waduge. (2005) “Adverse effects of teenage pregnancy.”
Ceylon Med J 50(3): 116-120.
Haldre, K., K. Rahu, H. Karro, and M. Rahu. (2007) “Is a poor pregnancy outcome related to young
maternal age? A study of teenagers in Estonia during the period of major socio-economic changes
(from 1992 to 2002).” European Journal of Obstetrics & Gynecology and Reproductive Biology
131(1): 45-51.
Hirschman, C. (1985). "Premarital Socioeconomic Roles and the Timing of Family Formation: A
Comparative Study of Five Asian Societies." Demography 22(1): 35-59.
Hirschman, C. and R. Rindfuss (1980). "Social, Cultural and Economic Determinants of Age at Birth of
First Child in Peninsular Malaysia." Population Studies 34: 507-518.
MacQuarrie, Kerry L.D. (2009) “The Unfolding of Women’s Empowerment over the Life Course in
Madhya Pradesh, India: The Influence of Family Formation and Early Empowerment Resources.”
Paper for the XXVI IUSSP International Population Conference, September 2009, Marrakech,
Morocco.
Rutstein, Shea O. 2008. The DHS Wealth Index: Approaches for Rural and Urban Areas. DHS Working
Papers No. 60. Calverton, MD: Macro International.
Rutstein, Shea O. and Kiersten Johnson. 2004. The DHS Wealth Index. DHS Comparative Reports No. 6.
Calverton, MD: ORC Macro.
Timaeus, I. M. and T. A. Moultrie (2008). "On Postponement and Birth Intervals." Population and
Development Review 34(3): 483-510.
Tsui, A. O. (1982). "The Family Formation Process Among U.S. Marriage Cohorts." Demography 19(1):
1-27.

34
de Vienne, C. M., Creveuil, C., & Dreyfus, M. (2009). “Does young maternal age increase the risk of
adverse obstetric, fetal and neonatal outcomes: a cohort study.” European Journal of Obstetrics
& Gynecology and Reproductive Biology, 147(2): 151-156.
35
Appendix Tables
Prevalence of marriage before age 18 among ever-married men age 20-59 by religious affiliation
Confidence Interval
Confidence Interval
Percent
Lower Bound
Upper Bound
Weighted n
Percent
Lower Bound
Upper Bound
Weighted n
Chad 2004
India 2005-06 χ2 = 15.4741
χ2 = 101.2851
p = 0.288
p = 0.000 Catholic 15.2 10.1 22.1 292
Hindu 14.3 13.7 14.9 40,264
Protestant 11.3 6.4 19.2 208
Muslim 11.4 10.0 12.9 5,743 Muslim 17.5 13.7 22.0 664
Christian 7.9 6.1 10.3 1,080
No religion 6.3 0.7 39.0 28
Sikh 9.9 7.5 12.9 836 Total 15.4 12.5 18.7 1,230
Buddhist 9.2 6.5 12.9 366
Jain 2.3 0.5 10.3 149
Comoros 2012
Other 8.3 4.3 15.7 148 χ2 = 3.0764
Total 13.6 13.1 14.2 48,614
p = 0.246 Muslim 14.1 11.5 17.1 1,256
Madagascar 2008-09
Total 14.2 11.6 17.2 1,267
χ2 = 49.7754
p = 0.000
Dominican Republic 2013
Catholic 11.5 9.8 13.4 2,009 χ2 = 31.4707
Protestant 10.2 8.6 11.9 2,035
p = 0.001
Muslim 15.4 8.3 26.9 55 Catholic 9.9 8.5 11.4 3,118
Traditional religion 17.2 10.8 26.3 142
Evangelical 9.4 7.5 11.8 1,180
No religion 17.5 15.5 19.7 1,529 Adventist 11.4 5.5 22.2 118
Other 11.0 7.2 16.5 247
No religion 14.4 12.6 16.6 2,104
Total 12.7 11.7 13.8 6,021 Other 8.2 3.0 20.6 61
Total 11.3 10.2 12.4 6,587
Nepal 2011
χ2 = 12.0717
Ethiopia 2011
p = 0.099 χ2 = 27.0713
Hindu 21.4 19.1 23.9 2,213
p = 0.125
Buddhist 22.2 16.5 29.2 225 Orthodox 16.3 13.6 19.5 3,988
Muslim 14.3 7.7 25.0 80
Catholic 18.4 9.3 33.1 73
Kirat 4.2 0.7 21.8 48 Protestant 15.1 12.7 17.8 1,600
Christian 15.4 8.0 27.6 51
Muslim 14.3 11.8 17.2 2,534
Total 20.8 18.7 23.0 2,619 Traditional 28.5 13.2 51.0 77
Other 13.5 7.6 22.8 159
Sierra Leone 2008 Total 15.6 13.9 17.4 8,433
χ2 = 1.4536
p = 0.896 Honduras 2011-12
Christian 10.1 7.9 12.8 795
χ2 = 21.0956
Muslim 10.3 9.0 11.8 3,577 p = 0.016
Total 10.3 9.1 11.6 4,391
No religion 20.5 17.2 24.3 892 Catholic 14.3 12.5 16.2 2,078 Evangelical/Protestant 16.5 14.4 18.8 1,742 Total 16.237 14.934 17.629 4,730
Note: Categories with fewer than 25 unweighted cases are not reported. Total cases may not sum due to omitted categories/missing values.
36
Prevalence of marriage before age 18 among ever-married men age 20-59 by ethnicity
Confidence Interval
Confidence Interval
Percent Lower Bound
Upper Bound
Weighted n
Percent
Lower Bound
Upper Bound
Weighted n
Ethiopia 2011
India 2005-06 χ2 = 171.1835
χ2 = 590.1158
p = 0.000
p = 0.000 Affar 18.9 14.7 24.0 49
Scheduled caste 17.0 15.8 18.4 9,255
Agew-awi 35.2 17.8 57.7 118
Scheduled tribe 21.2 19.1 23.5 4,363 Agew hamyra 14.0 7.6 24.2 50
Other backward class (OBC) 14.4 13.5 15.3 19,199
Amhara 19.8 16.4 23.7 2,718
Other 8.6 7.9 9.4 14,295 Ari 11.3 4.3 26.6 27
Don't know/none reported 2.5 0.9 6.4 126
Bench 8.2 2.8 21.9 51
Total 13.6 13.1 14.2 48,614 Dawuro 12.0 5.7 23.8 38
Derashe 11.8 11.8 11.8 25
Nepal 2011 Gamo 8.5 5.2 13.6 121
χ2 = 95.7093
Gedeo 19.6 13.4 27.9 166
p = 0.000 Goffa 19.6 11.4 31.5 46
Hill brahmin 7.9 5.3 11.7 371
Guragie 8.5 5.3 13.2 193
Hill chhetri 20.0 16.3 24.2 504 Hadiya 4.3 1.4 12.1 100
Terai brahmin/chhetri 16.8 5.7 40.6 26
Kefficho 11.0 5.6 20.6 88
Other terai caste 27.4 19.1 37.8 244 Kembata 23.3 12.8 38.6 77
Hill dalit 30.5 24.3 37.6 237
Murle 7.3 1.0 37.2 25
Terai dalit 39.2 28.3 51.4 107 Oromo 14.3 11.8 17.3 2,954
Newar 12.5 6.8 22.0 113
Sidama 14.2 8.7 22.2 326
Hill janajati 19.6 15.9 23.8 615 Silte 15.4 8.6 26.2 93
Terai janajati 26.6 21.7 32.2 311
Somalie 13.4 10.2 17.3 155
Muslim 14.6 8.0 25.2 80 Tigrie 5.5 3.9 7.5 515
Total 20.8 18.7 23.0 2,619
Welaita 10.8 6.0 18.6 230 Yem 6.2 5.2 7.4 41
Sierra Leone 2008 Total 15.6 13.9 17.4 8,433
χ2 = 29.0688
p = 0.082 Honduras 2011-12
Creole 11.7 3.9 30.3 41
χ2 = 31.6881
Fullah 7.0 3.8 12.5 155 p = 0.025
Kono 14.2 9.1 21.6 176
Garifuna 16.7 9.9 26.9 116
Limba 6.2 3.5 10.7 263 Negro inglés 21.2 9.0 42.3 24
Loko 9.1 3.2 23.3 105
Misquito 18.5 12.0 27.5 55
Mandingo 3.3 1.2 8.6 92 Lenca 10.3 7.5 14.0 412
Mende 12.4 10.1 15.1 1,506
Maya chorti 13.6 8.5 21.1 200
Sherbro 10.9 6.1 18.6 140 Other 10.7 7.4 15.2 397
Temne 8.9 7.3 11.0 1,533
Don't know/none declared 17.7 16.1 19.3 3,486
Koranko 9.5 4.9 17.7 131 Total 16.2 14.9 17.6 4,730
Other Sierra Leone 13.3 9.6 18.2 219
Total 10.3 9.1 11.6 4,391
Note: Ethnicity data are not collected in Chad, Comoros, Dominican Republic, and Madagascar. Categories with fewer than 25 unweighted cases are not reported. Total cases may not sum due to omitted categories/missing values.

37