Embed Size (px)
Citation preview
Child Psychopathology
Dr. M.D. Rapport Professor, Clinical Child Psychology
Director, Children’s Learning Clinic-IV
ü Syllabus Review (handout) ü Presentation assignment [see schematics: PDD; ADHD] ü Overview of the course ü Child Disorder Template (Word File: make available on-line) ü Introduction to Child Psychopathology and Core Concepts ü Week 2 reading assignment
“He who loves practice without theory is like the sailor who boards ship without a rudder and compass and never knows where he may cast” Leonardo da Vinci (1452-1519)
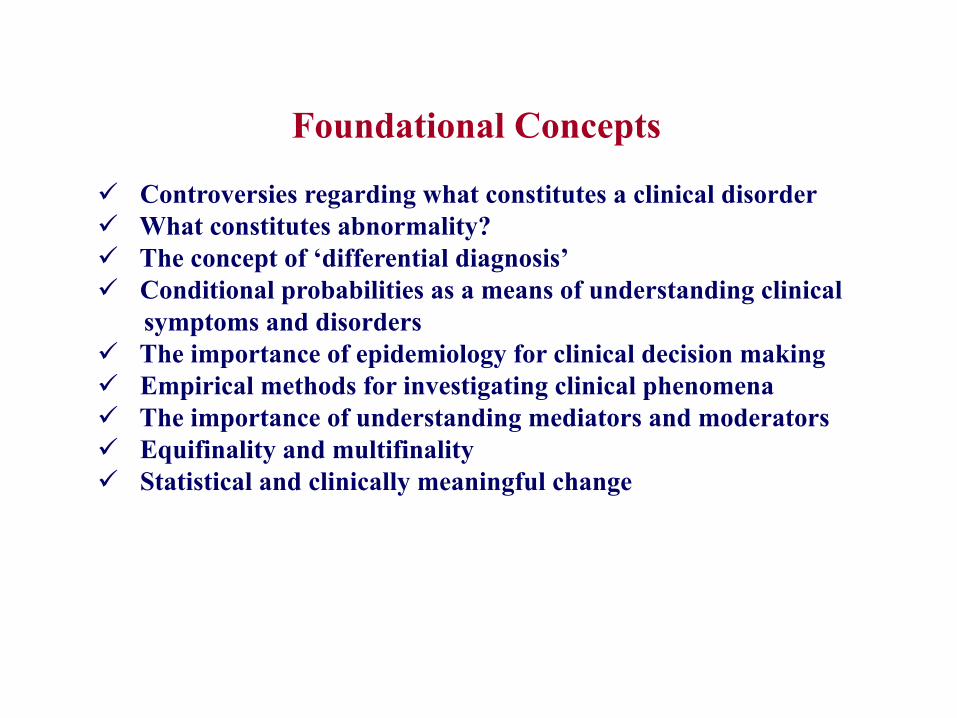
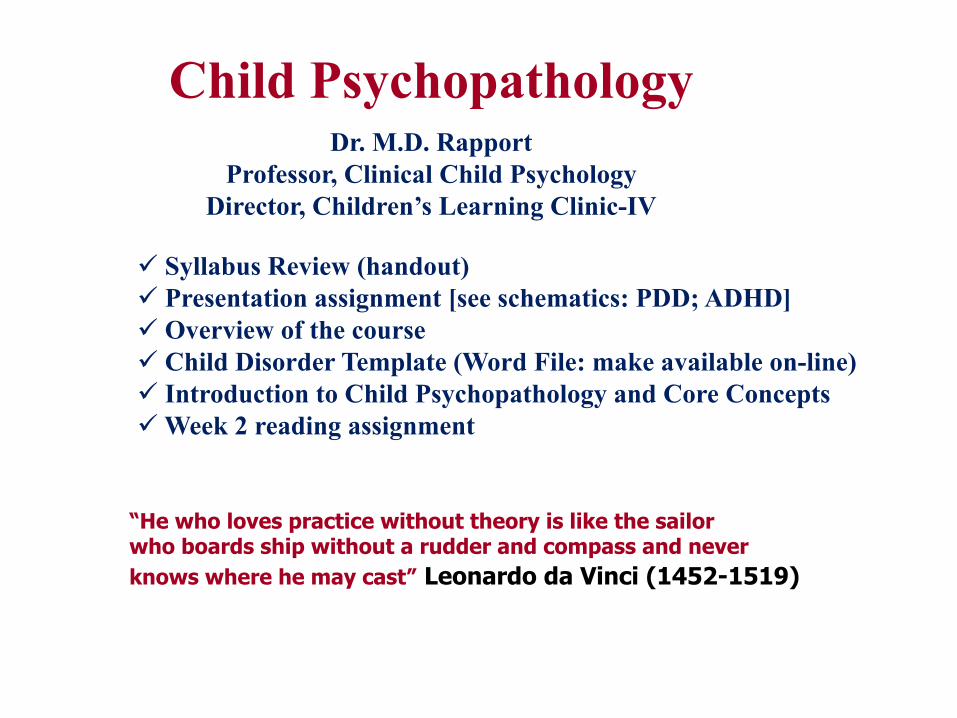
Foundational Concepts ü Controversies regarding what constitutes a clinical disorder ü What constitutes abnormality? ü The concept of ‘differential diagnosis’ ü Conditional probabilities as a means of understanding clinical symptoms and disorders ü The importance of epidemiology for clinical decision making ü Empirical methods for investigating clinical phenomena ü The importance of understanding mediators and moderators ü Equifinality and multifinality ü Statistical and clinically meaningful change

Psychopathology: the study of individual differences, deviant or maladaptive behaviors and processes. Scientific understanding is, in large measure, the ability to describe precisely the functional relations between entities or events. The ability to set apart such entities or events from one another and to describe their properties in terms of observable phenomena is a precursor to understanding the relations between them.
Child Psychopathology

Psychopathology The science dealing with diseases and abnormalities of the mind. Psycho From the Greek, “psyche”; soul or mind.
Pathology From the Greek, “patho”; that part of medicine that deals with the nature of diseases, their causes and symptoms, and especially the structure and functional changes caused by the disease. Disease Any departure from health. Ology The ‘study’ of any topic Disorder Irregularity, disturbance, or interruption of the normal functions, as in a mental disorder.

Defining and Iden+fying
• What is abnormal behavior? – Atypical – Harmful – Inappropriate – Depends of age, culture, gender, and situa+onal factors – Parents may differ on their views of what is acceptable – Society has changing views of abnormality
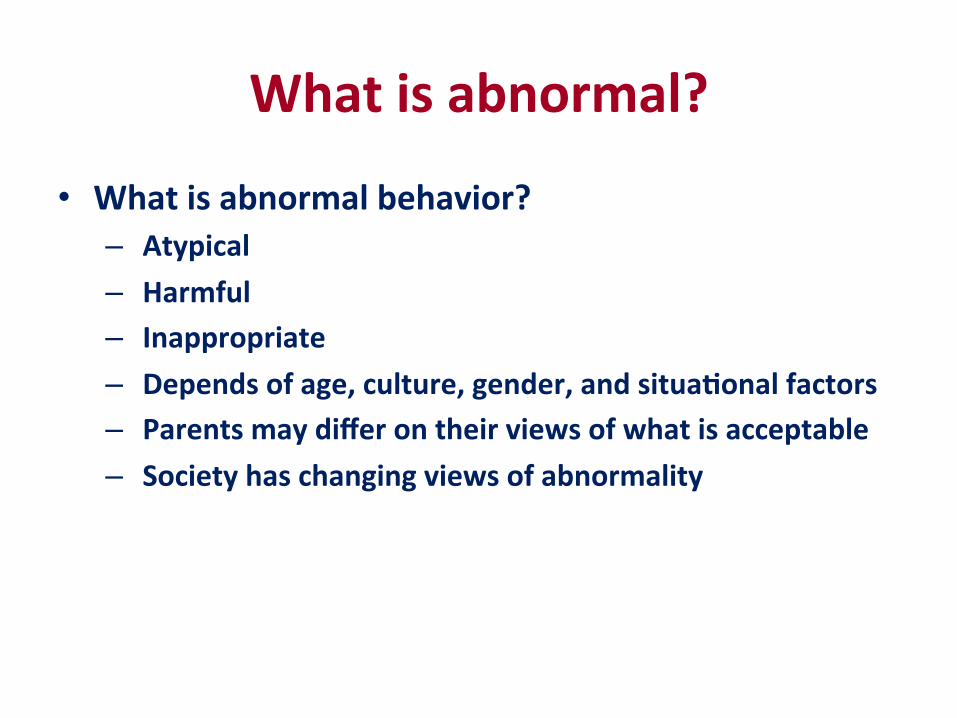
What is abnormal?
• What is abnormal behavior? – Atypical – Harmful – Inappropriate – Depends of age, culture, gender, and situa+onal factors – Parents may differ on their views of what is acceptable – Society has changing views of abnormality

How Common are Problems?
• Up to 35.5% of youth age 4-‐18 have mental health problems
• 15-‐20% have “clinic level” disorders** [this may be a gross underes+mate based on the Kessler et al. (2005) findings]
• Variability in rates due to – Different methods (e.g., ra+ng scales vs interviews)
– Different popula+ons (inpa+ent, outpa+ent, community-‐based epidemiology studies)
– Different defini+ons – Increasing stress

Foundational Knowledge


Working Definition of a Clinical Disorder: a constellation of symptoms that significantly impairs an individual’s ability to function, and is characterized by a particular symptom picture with a specifiable onset, course, duration, outcome, and response to treatment, and associated familial, psychosocial, and biological correlates.
Clinical Disorder
Onset: age of initial symptoms + insidious vs rapid Course: slowing worsening or improving; episodic vs chronic; waxing & waning vs continuous Duration: how long does a particular episode last? Outcome: do you fully recover?
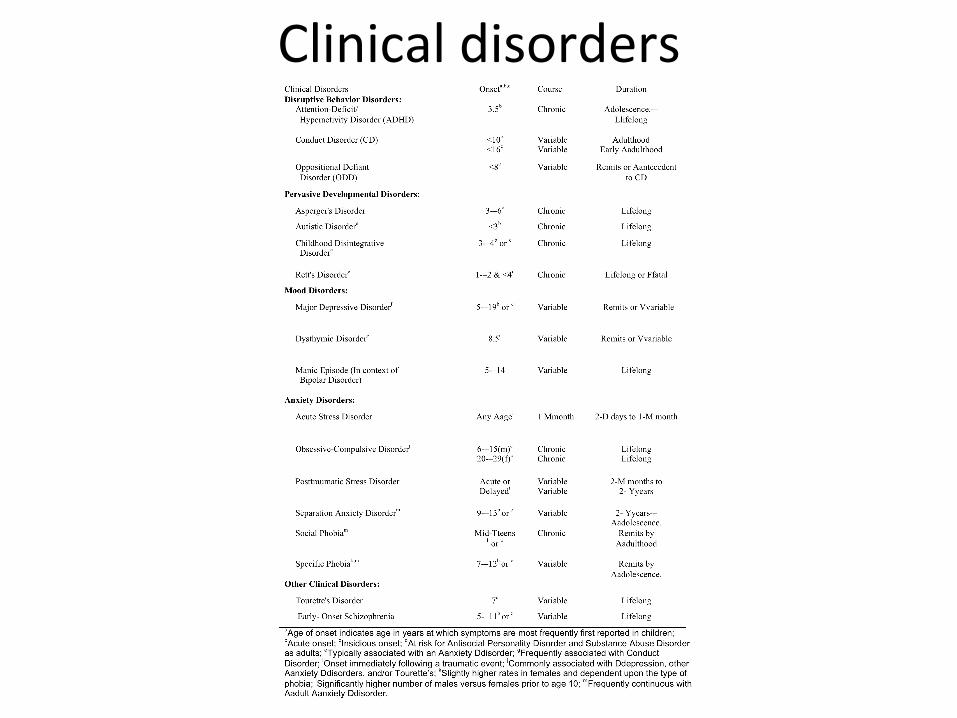
Clinical disorders
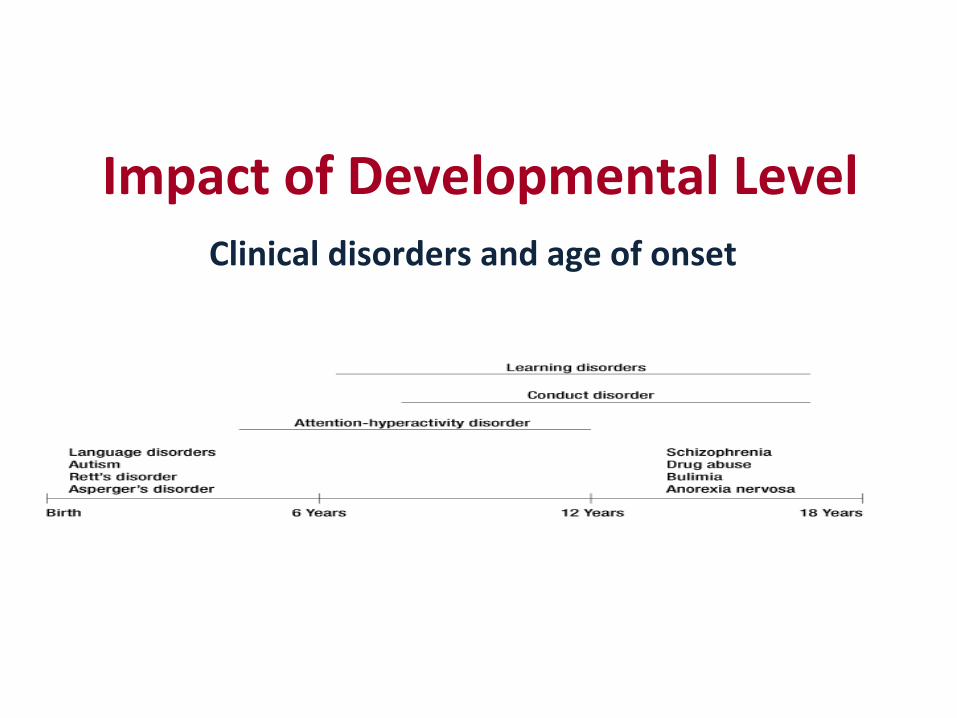
Impact of Developmental Level Clinical disorders and age of onset

Developmental norms

Developm
ental M
ileston
es Che
cklist
from
h;p://ecdc.syr.edu
/EC
DCpu
blicaB
ons.html

Differen+al Diagnosis
• The process of weighing the probability of one disease versus that of other diseases possibly accoun+ng for a pa+ent's symptom pa[ern.
• e.g., cold vs. flu

Cold versus the Flu
Colds Influenza
Gradual onset over days Sudden onset
Begins with scratchy throat, sneezing, and sniffles leading to congestion
Begins with fever, headache, and all over body aches (myalgia) – one feels exhausted or fatigued; can include stuffy nose, sneezing, sore-throat
Fever is mild or not present Fever develops quickly and is usually high (> 101 degrees)
Coughing is generally hacking and & can be moist due to congestion
Coughing is usually dry and hacking and can last after other symptoms are gone
Generally affects just the upper body Systemic illness – affects your entire body [more serious illness – can lead to complications

Equifinality – mulBple causes, one outcome
Classroom Ina;enBon
Physical/sexual abuse
Mental retardaBon
Learning disability
Unsafe environment
ADHD
Other psychiatric diagnosis Acute
stressors
Abrupt environmental
changes
UnrealisBc expectaBons
Working memory deficits
Vision/hearing problems

MulBfinality – one cause, mulBple outcomes
Maltreatment during
childhood
PTSD/Acute Stress
Depression Anxiety
Aggression
Resilience

The Role of Factor Analysis in Understanding Clinical Disorders

WORRY
POOR CONCENTRATION
NERVOUS
POOR APPETITE
IRRITABLE
TEARFULNESS
POOR ACADEMICS
INATTENTIVE
PEER RELATION DIFFICULTIES
IMPULSIVE
HIGH ACTIVITY LEVEL

WORRY
POOR CONCENTRATION
NERVOUS
IRRITABLE
TEARFULNESS
POOR ACADEMICS
INATTENTIVE
PEER RELATION DIFFICULTIES
IMPULSIVE
HIGH ACTIVITY LEVEL
SHARED SYMPTOMS
UNIQUE SYMPTOMS that correlate with one another
UNIQUE SYMPTOMS that correlate with one another

Quantitative vs Qualitative Differences in child disorders [excess/deficit vs qualitative difference in presentation] Externalizing vs Internalizing Disorders ADHD Conduct Disorder ODD
Affective Disorders Anxiety Disorders
Pathognomonic Symptoms

50#
55#
60#
65#
70#
75#
80#
85#
90#
95#
100#
Anxious/###############Depressed#
Withdrawn/#######Depressed#
Soma=c#############Complaints#
Social##################Problems#
Thought###############Problems#
AEen=on##############Problems#
RuleGBreaking###########Behavior#
Aggressive##############Behavior#
Parent#
Advanced#Math#Teacher#
Science#Teacher#
Child Behavior Checklist and Teacher Report Forms
Normal
Borderline
Clinical
Client: 12-y.o. Hispanic male

Conditional Probabilities as a means of understanding
Clinical Symptoms:
The Role of Sensitivity, Specificity, PPP, and NPP
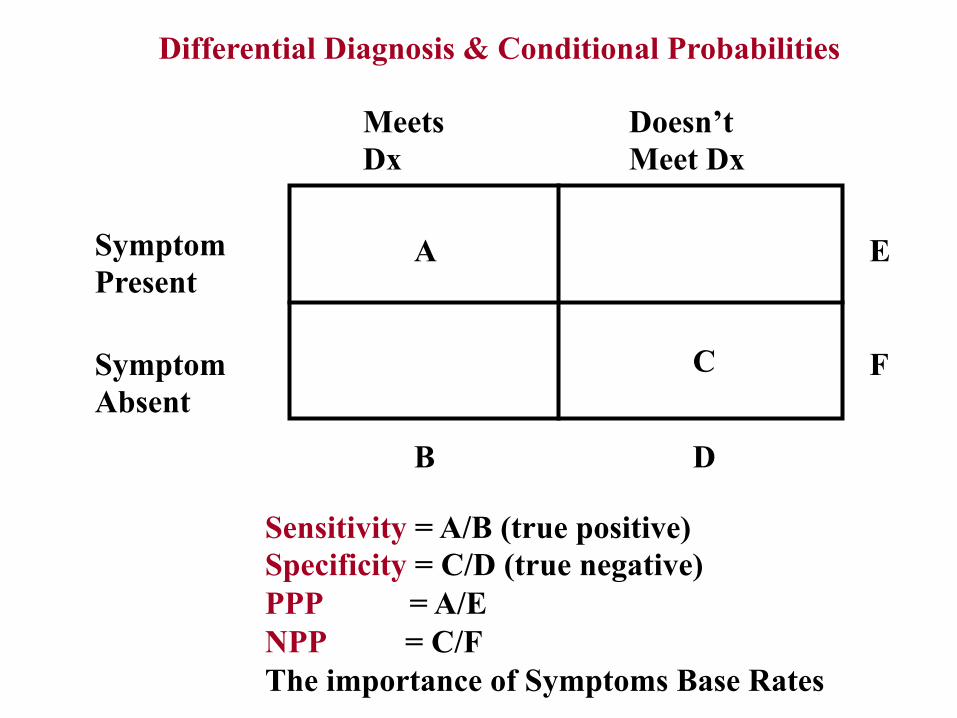
Sensitivity = A/B (true positive) Specificity = C/D (true negative) PPP = A/E NPP = C/F The importance of Symptoms Base Rates
Differential Diagnosis & Conditional Probabilities
Meets Dx
Doesn’t Meet Dx
Symptom Present
Symptom Absent
A
C
B D
E
F
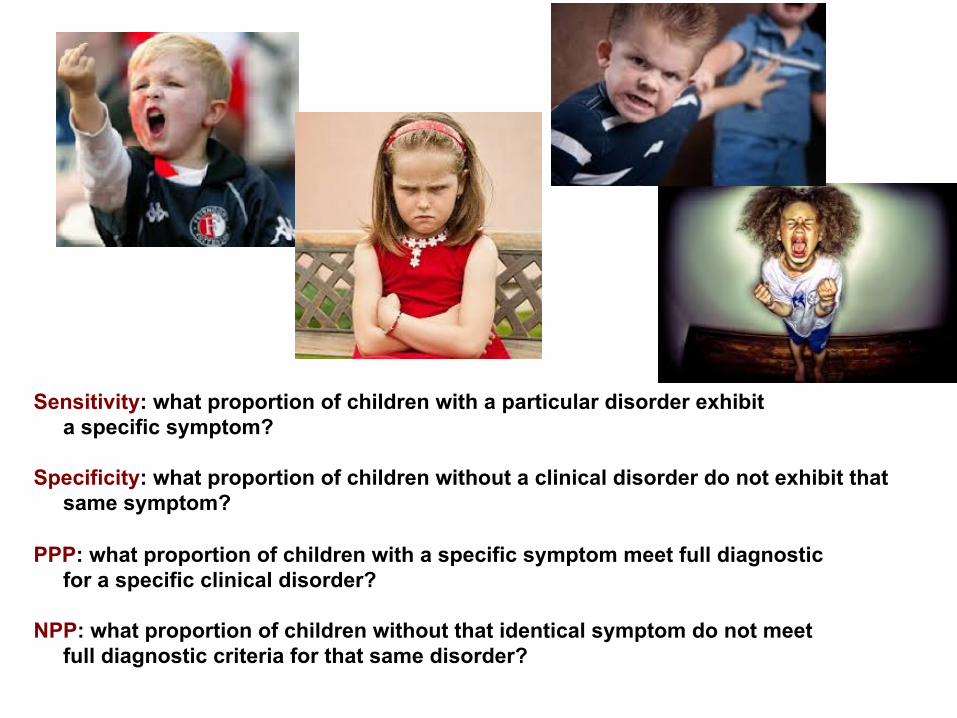
Sensitivity: what proportion of children with a particular disorder exhibit a specific symptom? Specificity: what proportion of children without a clinical disorder do not exhibit that same symptom? PPP: what proportion of children with a specific symptom meet full diagnostic for a specific clinical disorder? NPP: what proportion of children without that identical symptom do not meet full diagnostic criteria for that same disorder?
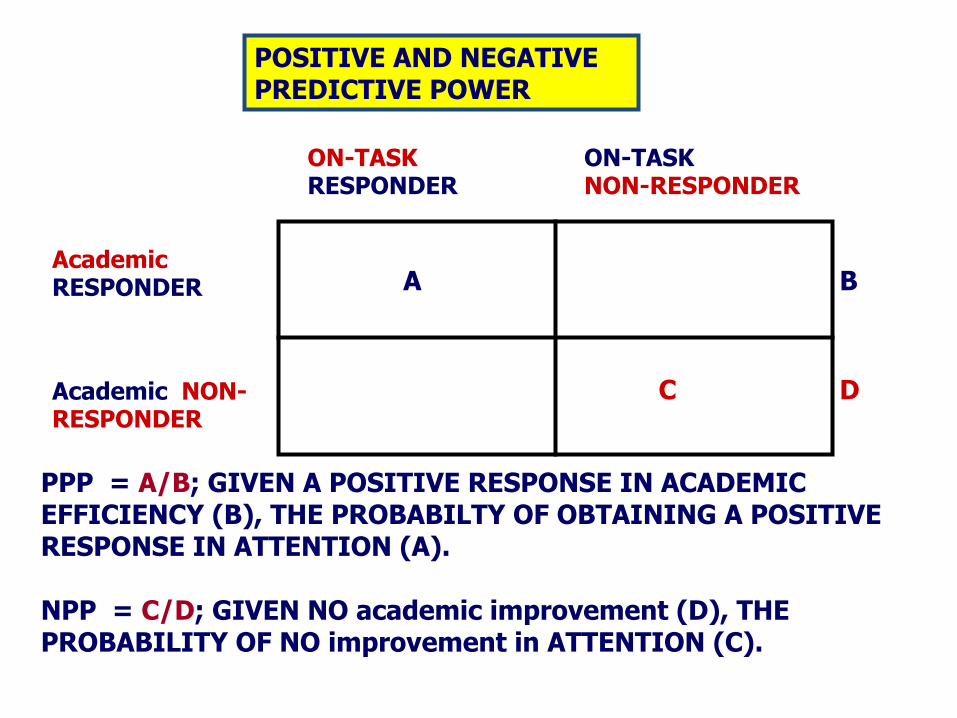
ON-TASK RESPONDER
ON-TASK NON-RESPONDER
Academic RESPONDER
Academic NON- RESPONDER
A
PPP = A/B; GIVEN A POSITIVE RESPONSE IN ACADEMIC EFFICIENCY (B), THE PROBABILTY OF OBTAINING A POSITIVE RESPONSE IN ATTENTION (A). NPP = C/D; GIVEN NO academic improvement (D), THE PROBABILITY OF NO improvement in ATTENTION (C).
POSITIVE AND NEGATIVE PREDICTIVE POWER
C
B
D

ACTRS
.98 (.11)
.90 (.28)
.80 (.45)
.55 (.80)
a Positive Predictive Power b Negative Predictive Power
Academic Performance
Attention To
Task
Self-Control

The Role of Epidemiology for Understanding Child Psychopathology

What is epidemiology?
Epidemiology is concerned with the ways in which clinical disorders and diseases occur in human populations, and with factors that influence these patterns of occurrence. Three interrelated components of epidemiological research involve: 1. Assessing the occurrence of new cases (incidence rate) or existing cases (prevalence rate) of the disorder at a given period of time or within a specific time period; [note: community vs clinic samples] 2. Assessing how the disorder is distributed in the population, which may include information concerning geographic location, gender, socioeconomic level, and race; and 3. Identifying factors associated with the variation and distribution of the disorder to enable etiological hypotheses to be generated.
The Role of Different Variables in Understanding Child Psychopathology

RELATIONSHIP AMONG VARIABLES?
CORRELATIONAL RESEARCH
TEMPORAL SEQUENCE UNKNOWN
IDENTIFYING RISK FACTORS
TEMPORAL SEQUENCE ESTABLISHED- POSSIBLY CAUSAL
FACTORS INFLUENCING THE RELATIONSHIP BETWEEN VARIABLES?
MEDIATORS
IDENTIFYING MARKERS
NON CAUSALLY RELATED
MODERATORS/ PROTECTIVE FACTORS
NON-CAUSAL, BUT INFORMATIVE
HOW DOES ANTECEDENT EXERT ITS INFLUENCE?
IDENTIFYING PROCESS/ MECHANISMS BY WHICH VARIABLES PRODUCE OUTCOMES/MODELS
CAN WE CONTROL OR ALTER THE OUTCOME?
PREVENTION/ TREATMENT
DECREASE PROBABILITY OF OCCURRENCE OR REDUCE CURRENT SYMPTOMS
WHAT EFFECT DOES IV HAVE ON DV?
EXPERIMENTAL RESEARCH
ESTABLISHING CAUSAL RELATIONSHIPS - MODELS

The Formula for the Percent of Regression to the Mean You can estimate exactly the percent of regression to the mean in any given situation. The formula is:
P rm = 100(1 - r) …..test/retest reliability or correlation between 2 variables where: Prm = the percent of regression to the mean r = the correlation between the two measures Consider the following four cases: if r = 1, there is no (i.e., 0%) regression to the mean if r = .5, there is 50% regression to the mean if r = .2, there is 80% regression to the mean if r = 0, there is 100% regression to the mean In the first case, the two variables are perfectly correlated and there is no regression to the mean. With a correlation of .5, the sampled group moves fifty percent of the distance from the no-regression point to the mean of the population. If the correlation is a small .20, the sample will regress 80% of the distance. And, if there is no correlation between the measures, the sample will "regress" all the way back to the population mean! It's worth thinking about what this last case means. With zero correlation, knowing a score on one measure gives you absolutely no information about the likely score for that person on the other measure. In that case, your best guess for how any person would perform on the second measure will be the mean of that second measure.
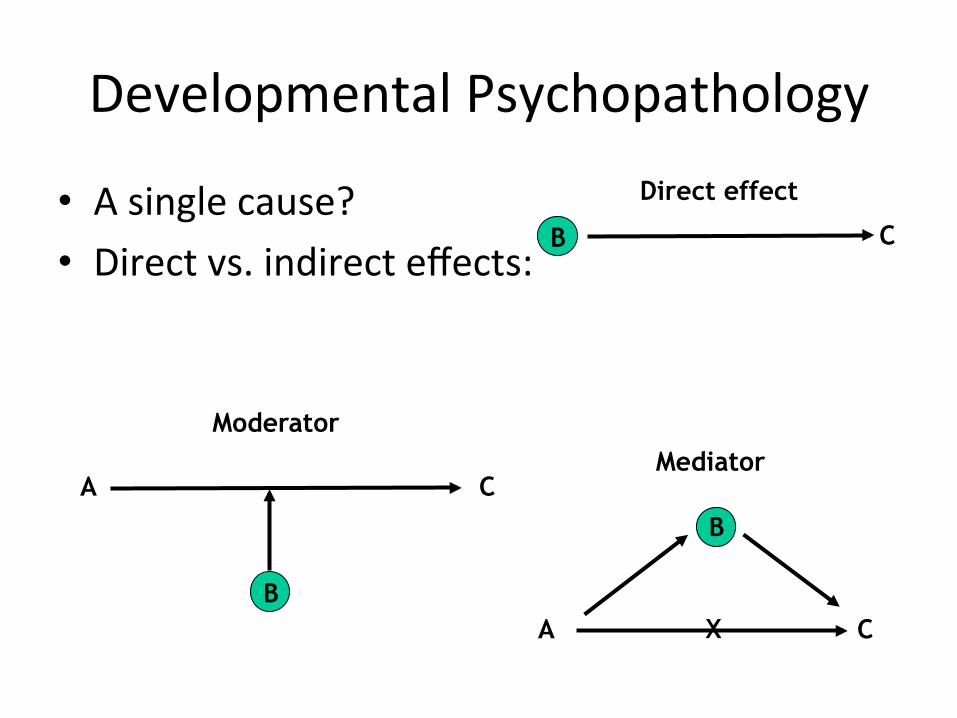
Developmental Psychopathology
• A single cause? • Direct vs. indirect effects:
A C
B
Moderator
A
B
C
Mediator
X
C B
Direct effect

Moderators Treatment Symptom reduction
Maternal depression
Moderator
Hinshaw (2007) – moderators of treatment response in ADHD
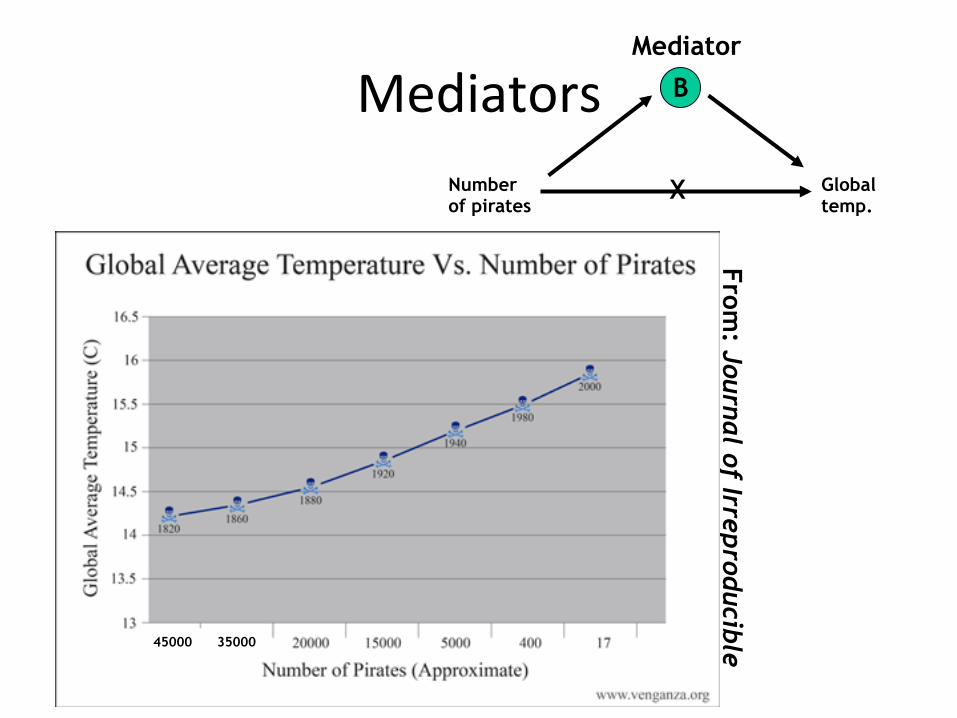
Mediators
From: Journal of Irreproducible
Results
Number of pirates
B
Global temp.
Mediator
X
45000 35000

E1
E2
E3
E4
E5
V1
V2
V3
F1 F2
V4
V5
D2
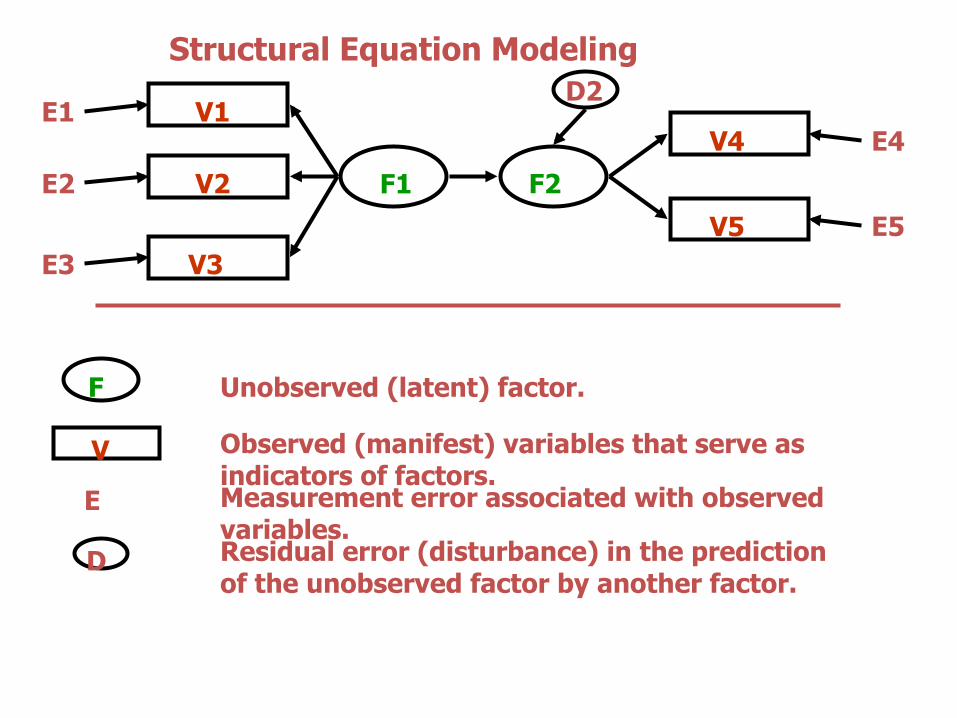
Structural Equation Modeling
F
V
E
D
Unobserved (latent) factor.
Observed (manifest) variables that serve as indicators of factors. Measurement error associated with observed variables. Residual error (disturbance) in the prediction of the unobserved factor by another factor.

FITTED STRUCTURAL EQUATION MODEL OF EARLY BEHAVIOR, EARLY IQ, AND LATER DELINQUENCY AND SCHOLASTIC ABILITY. [FERGUSSON & HORWOOD, 1995, J OF ABNORM CHILD PSYCHOLOGY, 23, 183-199]
.84
TOSCA = TEST OF SCHOLASTIC ABILITIES
LATER DELINQUENCY
15 YEARS
LATER SCHOOL
ACHIEVEMENT 13 YEARS
EARLY CONDUCT
PROBLEMS 8 YEARS
EARLY ATTENTION
DEFICIT 8 YEARS
EARLY IQ
8 YEARS
MOTHER SELF POLICE TOSCA-a TOSCA-b
ns
.68 -.27 .66
.68 .53 .95 .95
.78 -.41
-.38
MOTHER TEACHER MOTHER TEACHER TOSCA-a TOSCA-b
.54 .59 .55 .75
.94 .93
ADHD IQ E .42
E .50 Del
Agg
.87*
.91* CD .67* -.28*
-.23*
Scholastic Achievement
Language .50 E
E
E
.48
.42 Reading
Math .91 .88*
.87*
D
.83
-.26* .43* -.02 -.21(.716) 1.47(.186) -2.25(.598)
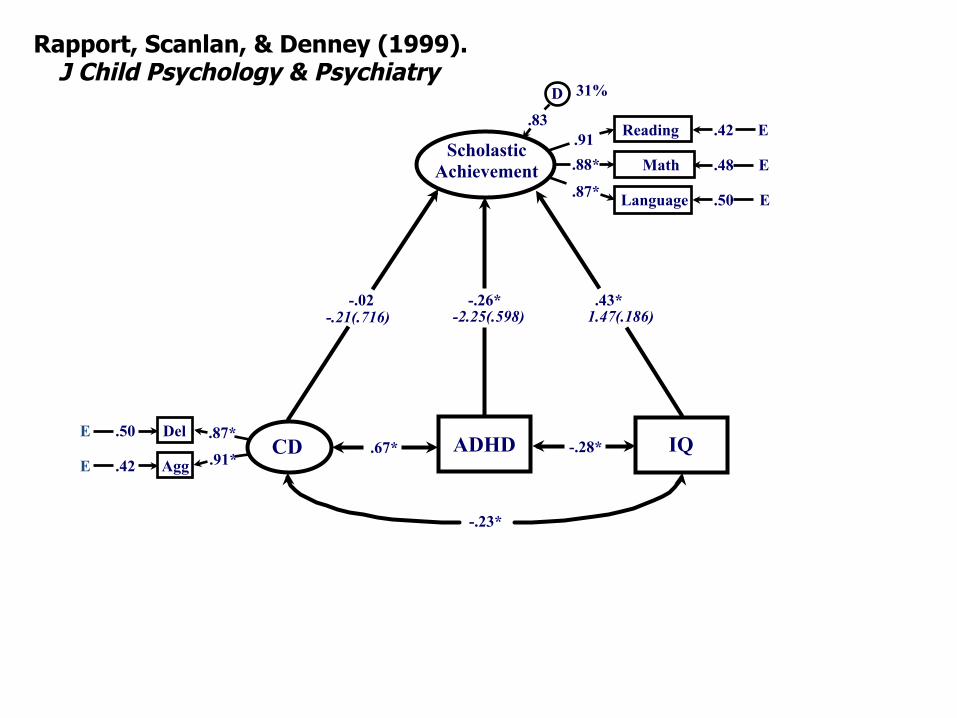
Rapport, Scanlan, & Denney (1999). J Child Psychology & Psychiatry
31%
AX .75 .97*
BX .89*
L .66
H .25
L .46
H .50
E
E
E
E .86
Vigilance .80*
.97
D
.60
.24
D
D .71
.40* Classroom Behavior
E
E
E
.36
.28
.42 AS
AP
AE
.91 .96*
.93*
D .55
-.20* -.67*
.33*
.16*
.31*
-.07
.72*
.19*
-.23*
Memory .54
.59
E
E
E .66 B12
B34
B56
.75
.81*
.84*
D .51
Scholastic Achievement
.52 E
E
E
Lang
.46
.41 Reading
Math .91 .89*
.85*
D .48
ADHD IQ E .42
E .50 Del
Agg
.87*
.91* CD .67* -.28*
14.27(1.095)
.05(.007)
-.63(.494)
1.66(.579)
.05(.009)
.13(.014)
-.66(.037)
.55(.162)
-.67(.153)
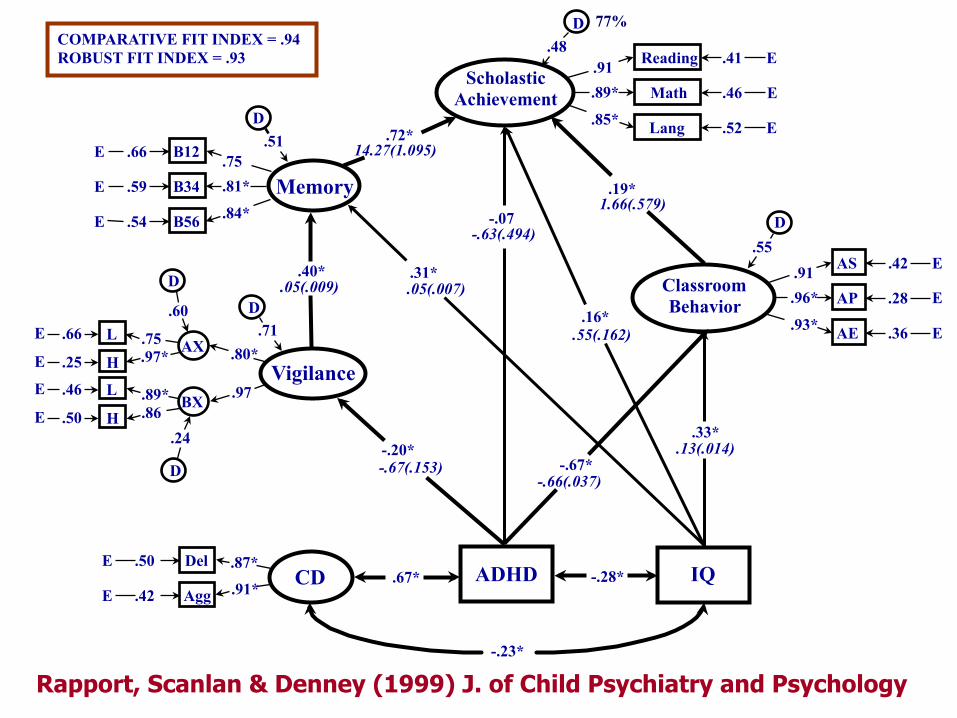
COMPARATIVE FIT INDEX = .94 ROBUST FIT INDEX = .93
77%
Rapport, Scanlan & Denney (1999) J. of Child Psychiatry and Psychology
Assessing Therapeutic Change: The Truax and Jacobson Model Statistically significant change vs Clinically meaningful change

StaBsBcal vs. clinical significance
• StaBsBcal significance: p< .05* – Power issues? – “The World is Round, p< .05” (Cohen)
• Clinical significance: so what?
• e.g., gender differences in IQ, achievement?

StaBsBcal vs. clinical significance
• Hynd (2005) review of gender differences
• StaBsBcal significance – Dependent on sample size
• Large enough sample almost always means significant differences
• Effect size: esBmate of the magnitude of group differences

StaBsBcal vs. clinical significance
• Clinical significance (Jacobson &Truax, 1991; Speer, 1992) – So what?
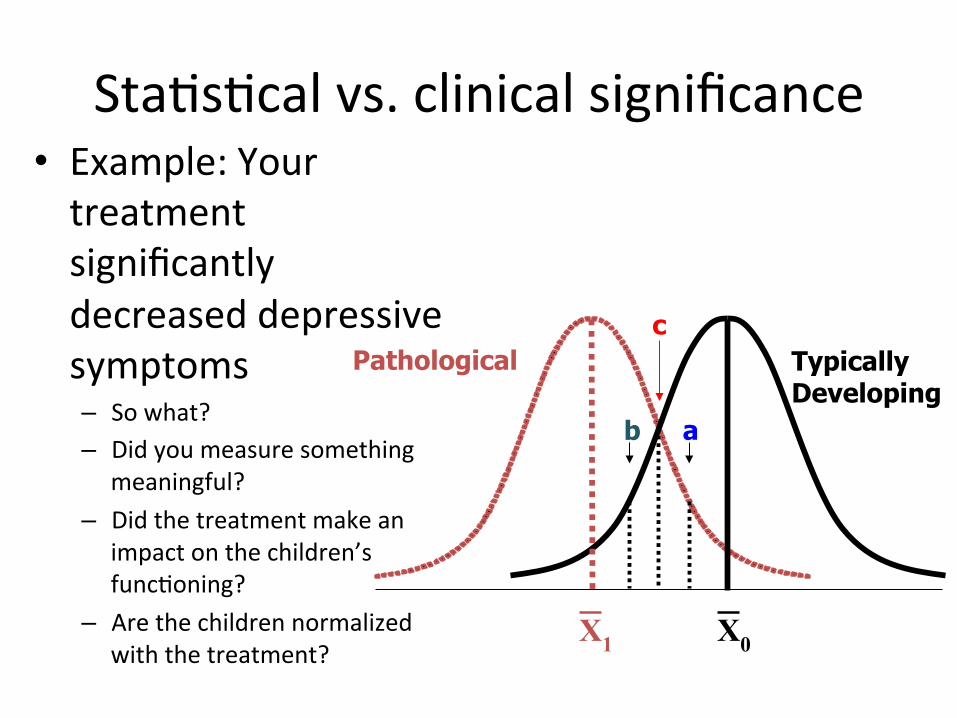
StaBsBcal vs. clinical significance • Example: Your treatment significantly decreased depressive symptoms – So what? – Did you measure something
meaningful? – Did the treatment make an
impact on the children’s funcBoning?
– Are the children normalized with the treatment?
X0
ab
c
X1
Pathological Typically Developing

Normalization Paradigm

Deteriorated
Improved
Normalization Paradigm
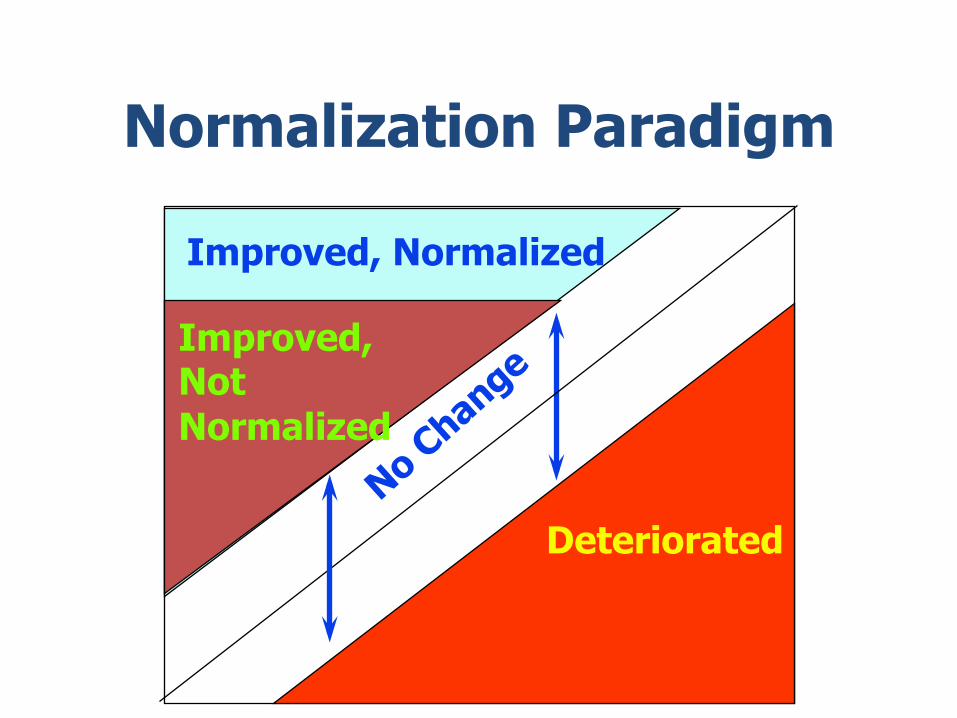
Normalization Paradigm
Improved, Normalized
Improved, Not Normalized
Deteriorated

X0
a b
c
X1
Pathological Typically Developing
Ra+ng Scales as Measures of Children’s Behavior

Ratings Scales as Measures of Behavior Positives: ü ease of administration and scoring ü appropriate for examining underlying factor structure ü cost efficiency
Negatives: ü not real quantitative measures in the physical sense ü rely on retrospective recall ü subject to rater expectation biases & halo effects ü rarely constructed according to measurement theory ü weak or non-significant correlations with objective measures of the same construct (e.g., 66%-91% not linearly related between rating scales and actigraph measures of activity level) ü most fail to account for symptom severity in scoring
Rating Scale Construction
50#
55#
60#
65#
70#
75#
80#
85#
90#
95#
100#
Anxious/###############Depressed#
Withdrawn/#######Depressed#
Soma=c#############Complaints#
Social##################Problems#
Thought###############Problems#
AEen=on##############Problems#
RuleGBreaking###########Behavior#
Aggressive##############Behavior#
Parent#
Advanced#Math#Teacher#
Science#Teacher#
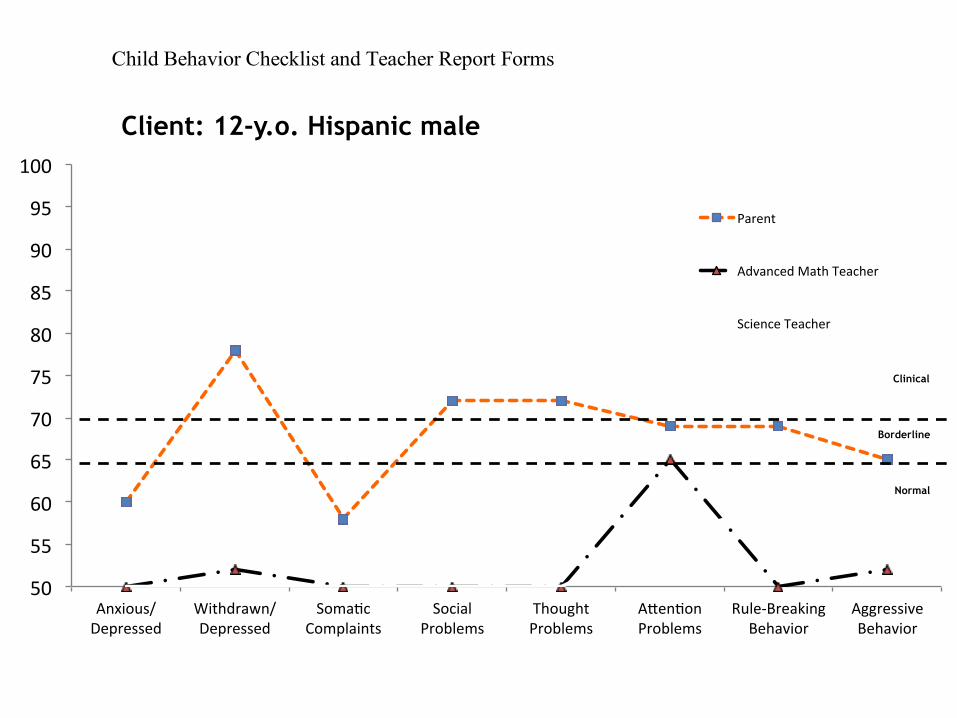
Child Behavior Checklist and Teacher Report Forms
Normal
Borderline
Clinical
Client: 12-y.o. Hispanic male

The Child Behavior Checklist
113 items coded as 0 = “Not True”, 1 = “Somewhat or sometimes true”, and 2 = “Very True or Often True” that load onto 8 problem subscales.
Rasche Modeling

The Child Behavior Checklist (cont.)
Adam Bobby

Item Response Theory
Item response theory is presently in widespread use in the development of intelligence and achievement tests.
Its use is specifically to help identify the hierarchy of
items ranging from the easiest (or most often endorsed) to the most difficult (or least endorsed).
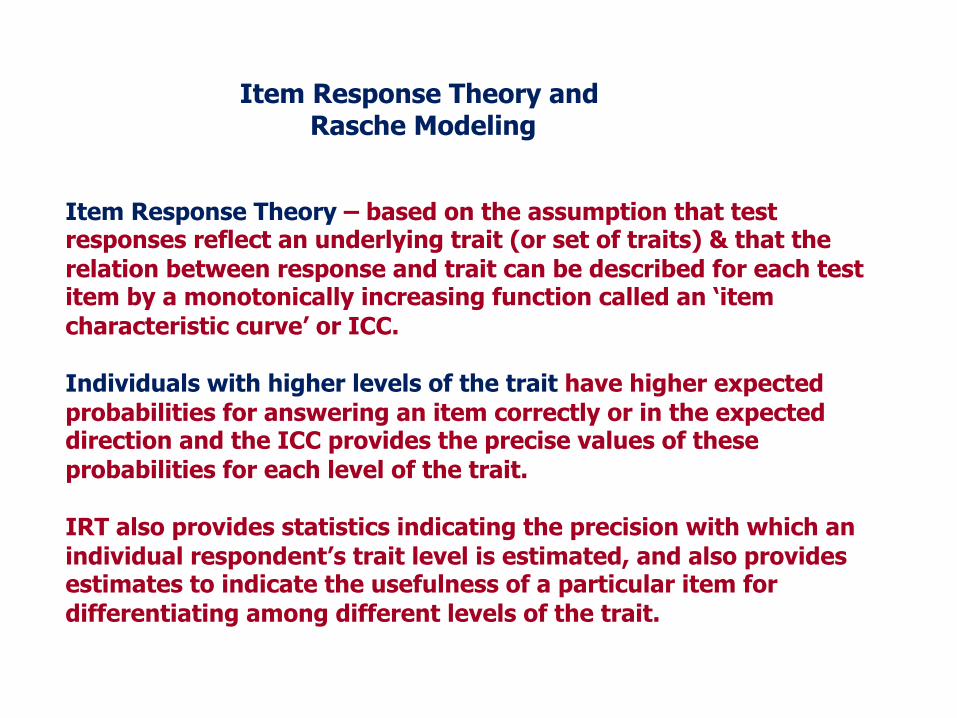
Item Response Theory and Rasche Modeling
Item Response Theory – based on the assumption that test responses reflect an underlying trait (or set of traits) & that the relation between response and trait can be described for each test item by a monotonically increasing function called an ‘item characteristic curve’ or ICC. Individuals with higher levels of the trait have higher expected probabilities for answering an item correctly or in the expected direction and the ICC provides the precise values of these probabilities for each level of the trait. IRT also provides statistics indicating the precision with which an individual respondent’s trait level is estimated, and also provides estimates to indicate the usefulness of a particular item for differentiating among different levels of the trait.

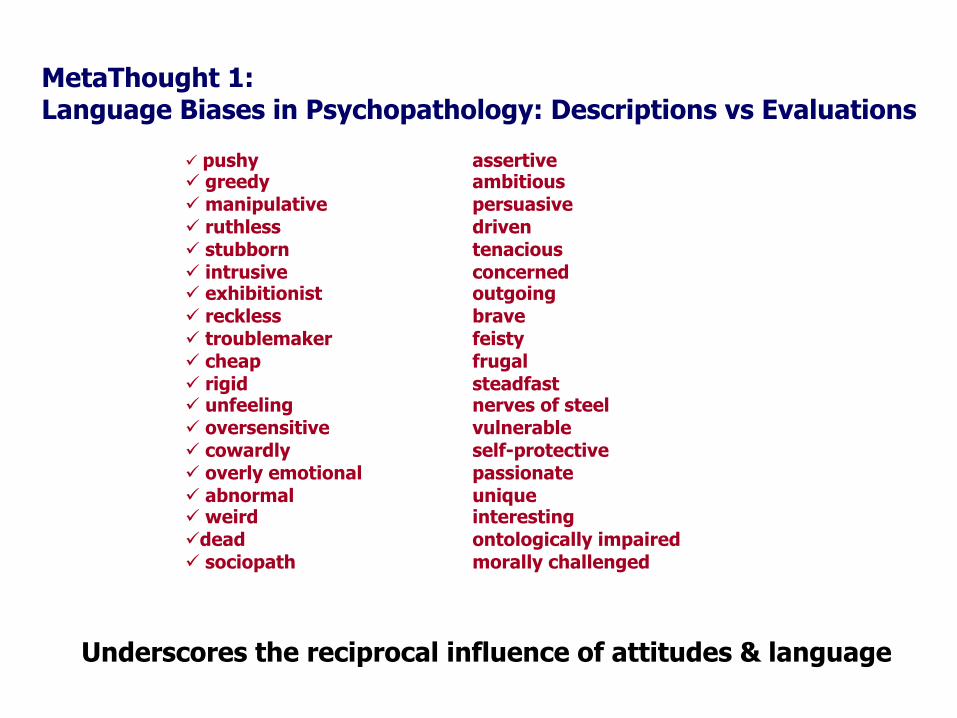
MetaThought 1: Language Biases in Psychopathology: Descriptions vs Evaluations
ü pushy assertive ü greedy ambitious ü manipulative persuasive ü ruthless driven ü stubborn tenacious ü intrusive concerned ü exhibitionist outgoing ü reckless brave ü troublemaker feisty ü cheap frugal ü rigid steadfast ü unfeeling nerves of steel ü oversensitive vulnerable ü cowardly self-protective ü overly emotional passionate ü abnormal unique ü weird interesting ü dead ontologically impaired ü sociopath morally challenged
Underscores the reciprocal influence of attitudes & language
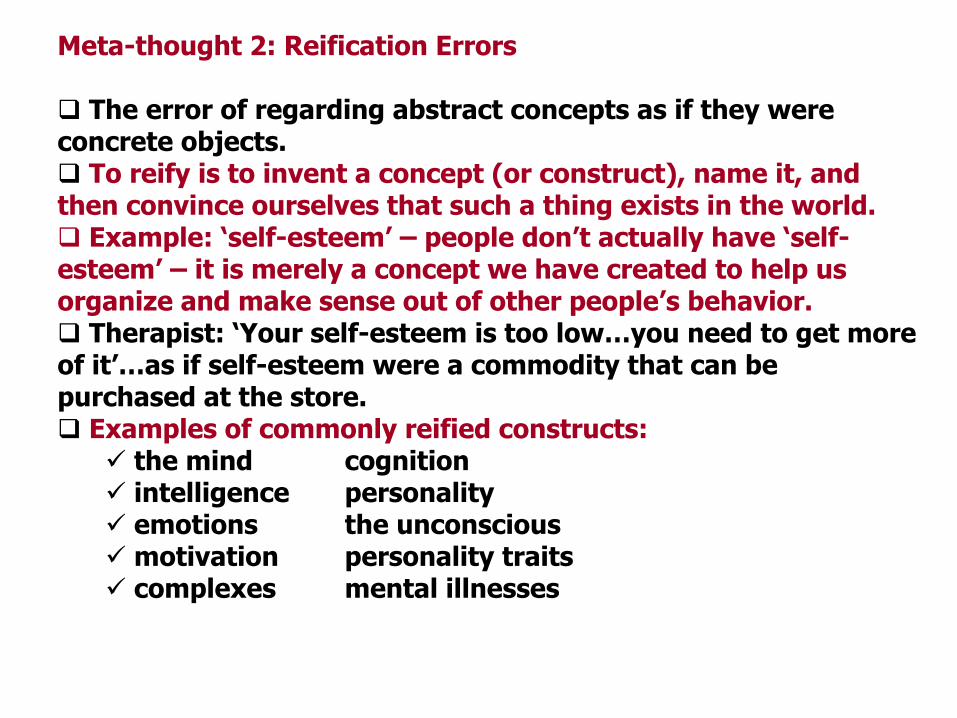
Meta-thought 2: Reification Errors q The error of regarding abstract concepts as if they were concrete objects. q To reify is to invent a concept (or construct), name it, and then convince ourselves that such a thing exists in the world. q Example: ‘self-esteem’ – people don’t actually have ‘self-esteem’ – it is merely a concept we have created to help us organize and make sense out of other people’s behavior. q Therapist: ‘Your self-esteem is too low…you need to get more of it’…as if self-esteem were a commodity that can be purchased at the store. q Examples of commonly reified constructs:
ü the mind cognition ü intelligence personality ü emotions the unconscious ü motivation personality traits ü complexes mental illnesses

Meta-Thought 3: The Reification of Theories ü Theory: a proposed explanation of observed phenomena ü Two types: Event Theory and Construct Theory
a. Event theory – theories that provide explanations that lend themselves to direct measurement…and under the right circumstances, can be proven or disproven…in the former case, it is no longer a theory (e.g., how the patient acquires an infection? Did humans evolve from apes?).
b. Construct theory – theories that provide explanations that, by their very nature, are not directly measurable. As a consequence, even under ideal conditions, a Construct Theory can never be proven because the explanations themselves are intangible abstractions (e.g., the phenomena under investigation may be observable, but the underlying explanation is not – gravity, motivation, personality, psychopathology).
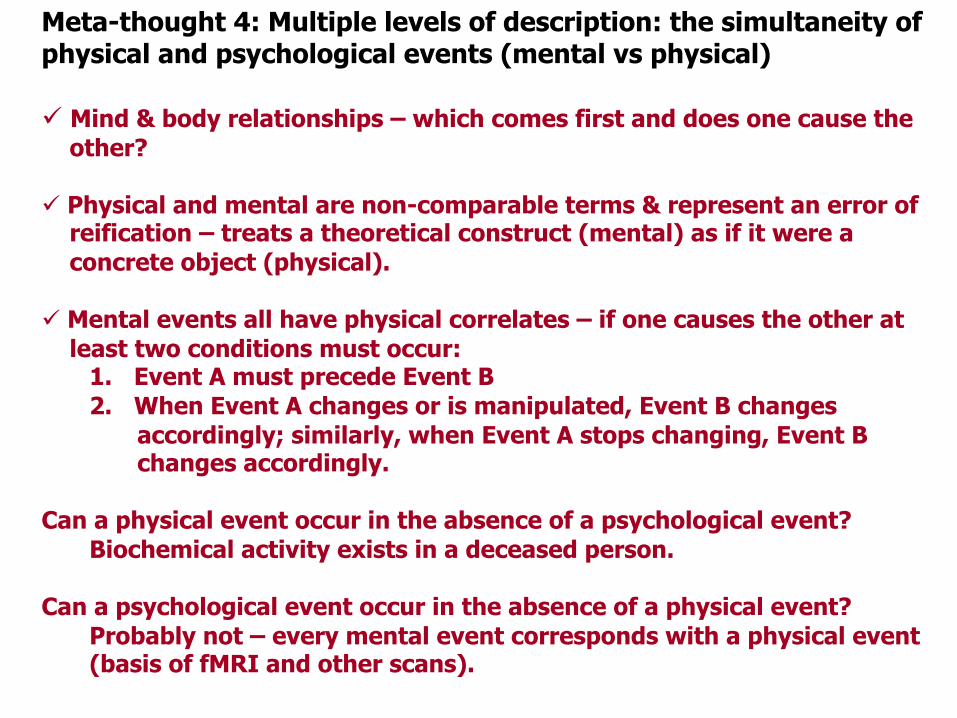
Meta-thought 4: Multiple levels of description: the simultaneity of physical and psychological events (mental vs physical) ü Mind & body relationships – which comes first and does one cause the other? ü Physical and mental are non-comparable terms & represent an error of reification – treats a theoretical construct (mental) as if it were a concrete object (physical). ü Mental events all have physical correlates – if one causes the other at least two conditions must occur:
1. Event A must precede Event B 2. When Event A changes or is manipulated, Event B changes
accordingly; similarly, when Event A stops changing, Event B changes accordingly.
Can a physical event occur in the absence of a psychological event?
Biochemical activity exists in a deceased person. Can a psychological event occur in the absence of a physical event?
Probably not – every mental event corresponds with a physical event (basis of fMRI and other scans).

Anxiety as an example At the biological level, anxiety involves specific neurochemical activity (viz., arousal of the sympathetic division of the autonomic nervous system along with other particular neurological configurations). Concurrently, at the psychological level, anxiety involves the subjective perception and experience of apprehension or fear. Thus, neurochemistry doesn’t cause fear, and fear doesn’t cause neurochemistry – they are equivalent and simultaneous phenomena, merely described in two different ways and at two different levels of analysis (i.e., they are a singular event). Implication: psychotherapy is no less biochemical than medication!

The Relevance of Historical Influences for Understanding Child Psychopathology
and Treatments

Historical Influences • Behaviorism and Social Learning Theory • Behavior is learned-‐caused by interac+ons with the
environment – Classical Condi+oning
• Pavlov • Watson
– Operant Learning • Skinner
– Modeling • Bandura
Outcome of Conditioning
Decrease Behavior Increase Behavior
Response Cost (remove stimulus)
Positive Reinforcement (add stimulus)
Positive Stimulus
Punishment (add stimulus)
Negative Reinforcement (remove stimulus)
Negative Stimulus
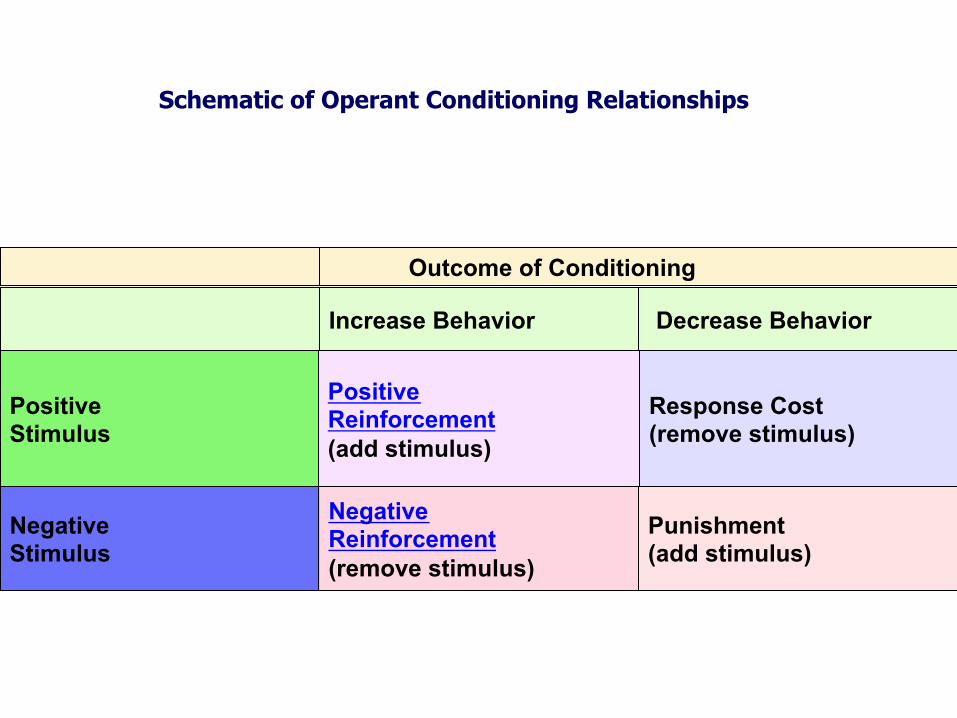
Schematic of Operant Conditioning Relationships

Positive Reinforcement – a positively viewed stimulus follows a particular behavior and strengthens or increases the behavior. Negative Reinforcement – a negatively viewed stimulus is removed or avoided and strengthens or increases the behavior (e.g., carrying an umbrella); 2 primary types: avoidance and escape behavior. Punishment – a negatively viewed stimulus is presented or occurs following a behavior and weakens or reduces future occurrences of the behavior (e.g., spanking). Response Cost – a positive stimulus is removed and strengthens or increases a particular behavior. Extinction – behavior is no longer followed by reinforcement and decreases and eventually ceases in frequency.

• S-‐d’s – discrimina+ve s+muli that indicate the likely occurrence of reinforcement.
• S-‐delta’s – s+muli that indicate the unlikely occurrence of reinforcement.

Basic Classical Conditioning Learning
No conditioning required
UCS: Food [unconditioned Stimulus]
UCR: Salivation [unconditioned response becomes a conditioned response]
Neutral Stimulus: Bell [becomes a CS or conditioned stimulus after pairing
Paired temporally
Conditioning required

Unconditioned Stimulus (e.g., Shock)
Unconditioned Response (pain response/anxiety/ escape behavior)
Neutral Stimulus Tone
Repeated pairings
NS becomes a conditioned stimulus (CS)
Now elicits a conditioned response (CR)
Conditioned stimulus is also associated with a memory representation of the US, which then leads to the production of the CR – the CS predicts the onset of the US and thus elicits a CR
Elicits UCR
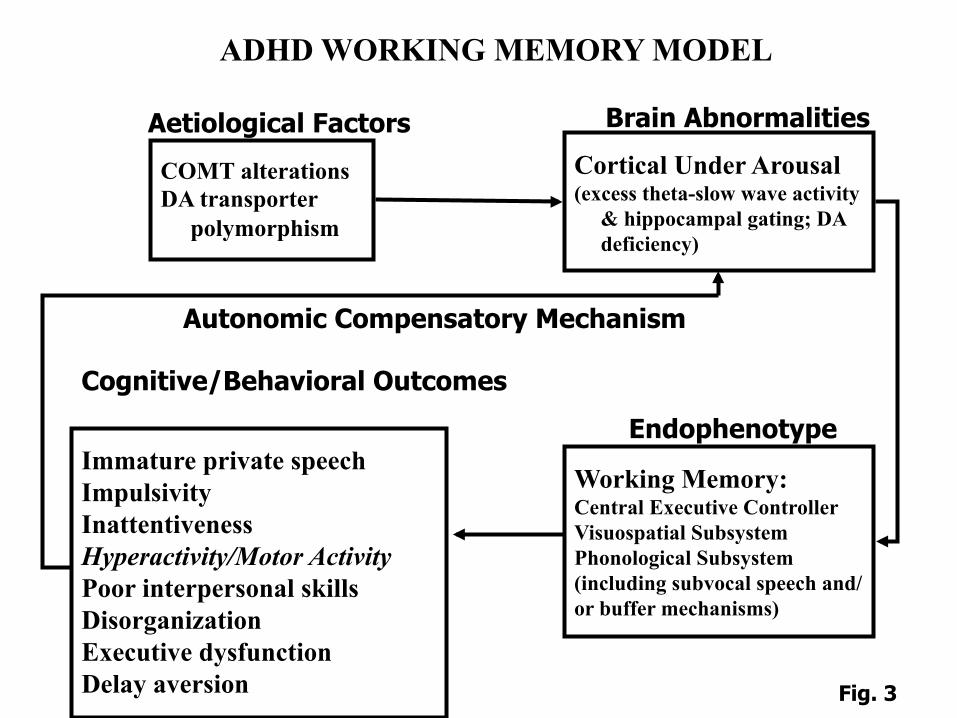
ADHD WORKING MEMORY MODEL
COMT alterations DA transporter polymorphism
Aetiological Factors
Cortical Under Arousal (excess theta-slow wave activity & hippocampal gating; DA deficiency)
Brain Abnormalities
Working Memory: Central Executive Controller Visuospatial Subsystem Phonological Subsystem (including subvocal speech and/or buffer mechanisms)
Endophenotype Immature private speech Impulsivity Inattentiveness Hyperactivity/Motor Activity Poor interpersonal skills Disorganization Executive dysfunction Delay aversion
Cognitive/Behavioral Outcomes
Autonomic Compensatory Mechanism
Fig. 3
CORE FEATURE: WORKING MEMORY
INATTENTION HYPERACTIVITY IMPULSIVITY
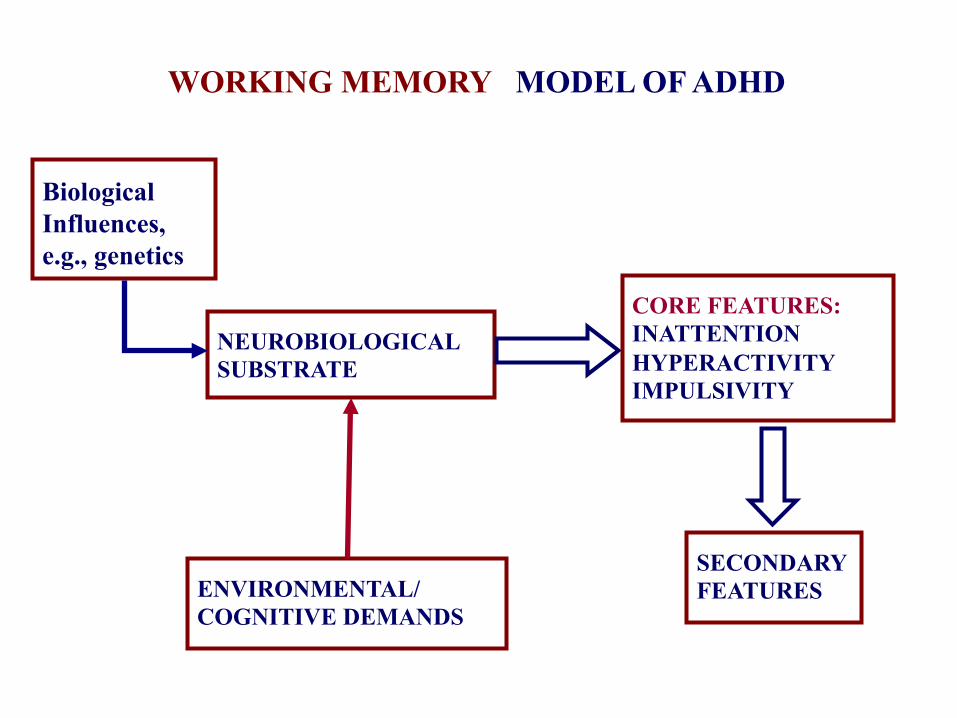
Biological Influences, e.g., genetics
NEUROBIOLOGICAL SUBSTRATE
CORE FEATURES: INATTENTION HYPERACTIVITY IMPULSIVITY
SECONDARY FEATURES
DSM-IV CLINICAL MODEL OF ADHD
ENVIRONMENTAL/ COGNITIVE DEMANDS
WORKING MEMORY

Biological Influences
(e.g., gene+cs)
Neurobiological Substrate
Environmental/ Cogni+ve Demands
(Core Feature) Working Memory
Deficits (Associated Features and Outcomes)
Impaired • Cogni+ve Test Performance • Academic Achievement • Social Skills • Organiza+onal Skills • Classroom Deportment • Delay Aversion
(Secondary Features)
Ina[en+veness Hyperac+vity Impulsivity
Working Memory Model of ADHD