Embed Size (px)
Citation preview
World Vision Senegal
Child Well-Being Report
2016 - 2017
World Vision Senegal ® January 2018
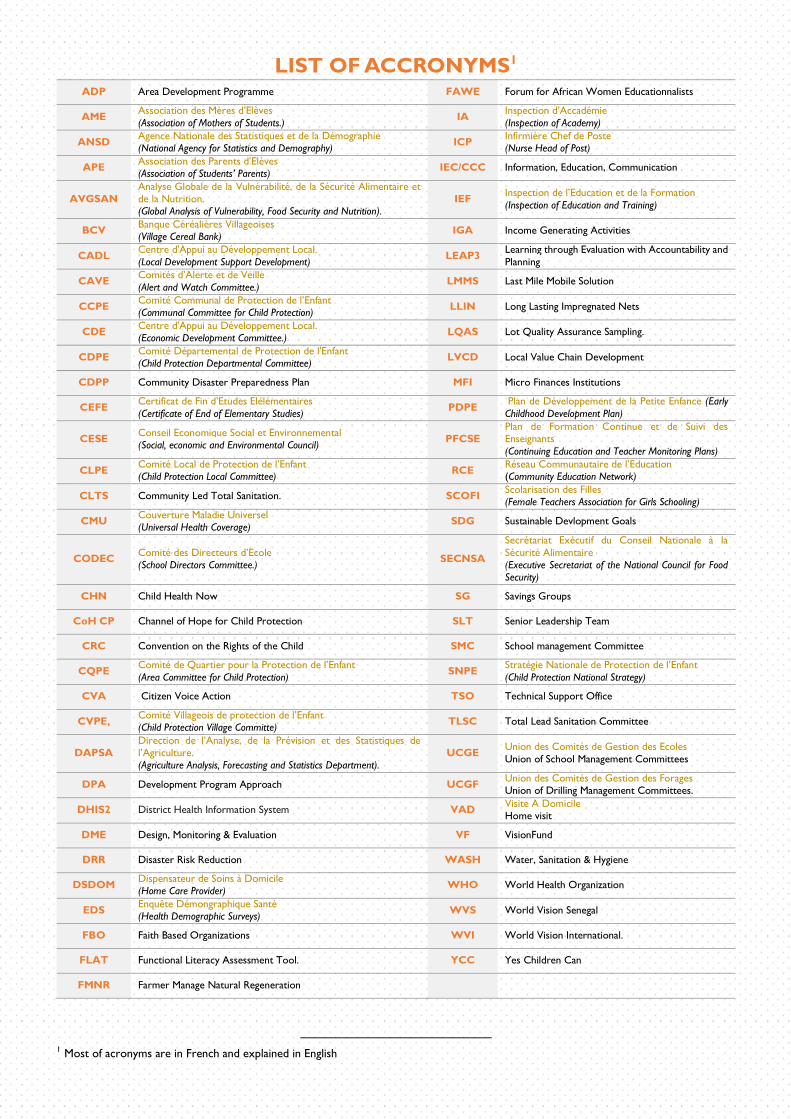
LIST OF ACCRONYMS1 ADP Area Development Programme FAWE Forum for African Women Educationnalists
AME Association des Mères d’Elèves
(Association of Mothers of Students.) IA
Inspection d’Accadémie
(Inspection of Academy)
ANSD Agence Nationale des Statistiques et de la Démographie (National Agency for Statistics and Demography)
ICP Infirmière Chef de Poste (Nurse Head of Post)
APE Association des Parents d’Elèves (Association of Students’ Parents)
IEC/CCC Information, Education, Communication
AVGSAN Analyse Globale de la Vulnérabilité, de la Sécurité Alimentaire et de la Nutrition. (Global Analysis of Vulnerability, Food Security and Nutrition).
IEF Inspection de l’Education et de la Formation
(Inspection of Education and Training)
BCV Banque Céréalières Villageoises (Village Cereal Bank)
IGA Income Generating Activities
CADL Centre d'Appui au Développement Local.
(Local Development Support Development) LEAP3
Learning through Evaluation with Accountability and
Planning
CAVE Comités d’Alerte et de Veille
(Alert and Watch Committee.) LMMS Last Mile Mobile Solution
CCPE Comité Communal de Protection de l’Enfant (Communal Committee for Child Protection)
LLIN Long Lasting Impregnated Nets
CDE Centre d'Appui au Développement Local. (Economic Development Committee.)
LQAS Lot Quality Assurance Sampling.
CDPE Comité Départemental de Protection de l'Enfant (Child Protection Departmental Committee)
LVCD Local Value Chain Development
CDPP Community Disaster Preparedness Plan MFI Micro Finances Institutions
CEFE Certificat de Fin d’Etudes Elélémentaires
(Certificate of End of Elementary Studies) PDPE
Plan de Développement de la Petite Enfance (Early
Childhood Development Plan)
CESE Conseil Economique Social et Environnemental (Social, economic and Environmental Council)
PFCSE Plan de Formation Continue et de Suivi des Enseignants
(Continuing Education and Teacher Monitoring Plans)
CLPE Comité Local de Protection de l’Enfant (Child Protection Local Committee)
RCE Réseau Communautaire de l’Education (Community Education Network)
CLTS Community Led Total Sanitation. SCOFI Scolarisation des Filles (Female Teachers Association for Girls Schooling)
CMU Couverture Maladie Universel (Universal Health Coverage)
SDG Sustainable Devlopment Goals
CODEC Comité des Directeurs d’Ecole (School Directors Committee.)
SECNSA
Secrétariat Exécutif du Conseil Nationale à la
Sécurité Alimentaire (Executive Secretariat of the National Council for Food Security)
CHN Child Health Now SG Savings Groups
CoH CP Channel of Hope for Child Protection SLT Senior Leadership Team
CRC Convention on the Rights of the Child SMC School management Committee
CQPE Comité de Quartier pour la Protection de l’Enfant
(Area Committee for Child Protection) SNPE
Stratégie Nationale de Protection de l’Enfant
(Child Protection National Strategy)
CVA Citizen Voice Action TSO Technical Support Office
CVPE, Comité Villageois de protection de l’Enfant (Child Protection Village Committe)
TLSC Total Lead Sanitation Committee
DAPSA
Direction de l’Analyse, de la Prévision et des Statistiques de
l’Agriculture. (Agriculture Analysis, Forecasting and Statistics Department).
UCGE Union des Comités de Gestion des Ecoles
Union of School Management Committees
DPA Development Program Approach UCGF Union des Comités de Gestion des Forages Union of Drilling Management Committees.
DHIS2 District Health Information System VAD Visite A Domicile Home visit
DME Design, Monitoring & Evaluation VF VisionFund
DRR Disaster Risk Reduction WASH Water, Sanitation & Hygiene
DSDOM Dispensateur de Soins à Domicile (Home Care Provider)
WHO World Health Organization
EDS Enquête Démongraphique Santé (Health Demographic Surveys)
WVS World Vision Senegal
FBO Faith Based Organizations WVI World Vision International.
FLAT Functional Literacy Assessment Tool. YCC Yes Children Can
FMNR Farmer Manage Natural Regeneration
1 Most of acronyms are in French and explained in English
_______ World Vision Senegal CWBT Report - FY17 Page 3 / 29
TABLE OF CONTENTS • List of charts and Tables ........................................................................................................................................... 4
1. EXECUTIVE SUMMARY .................................................................................................................................... 5
2. METHODOLOGY AND LIMITATIONS ....................................................................................................... 5
2.1. Methodology ............................................................................................................................................... 5
2.2. Accuracy margins of the indicators ....................................................................................................... 6
2.3. Limitations ................................................................................................................................................... 6
2.5. Changes made in relation to the recommendations from the previous report ......................... 7
3. STRATEGIC OBJECTIVES ................................................................................................................................ 8
3.1. All children under five and all women of child-bearing age enjoy better health and satisfactory nutrition. .............................................................................................................................................. 8
3.1.1. Introduction ....................................................................................................................................... 8
3.1.2. Key information ................................................................................................................................. 9
3.1.3. Results & Analysis ............................................................................................................................. 9
3.1.4. Situation of the Most Vulnerable Children ............................................................................... 10
3.1.5. Sustainability & Transition ............................................................................................................ 11
3.1.6. Key Lessons & Recommendations. ............................................................................................ 11
3.2. All children live in households that are protected from hunger and resilient to shocks....... 12
3.2.1. Introduction .................................................................................................................................... 12
3.2.2. Key information .............................................................................................................................. 13
3.2.3. Results & Analysis .......................................................................................................................... 13
3.2.4. Situation of the Most Vulnerable Children ............................................................................... 15
3.2.5. Sustainability .................................................................................................................................... 15
3.2.6. Key Lessons & Recommendations ............................................................................................. 16
3.3. All children have equitable access to quality education and training that will be useful to them throughout their lives ............................................................................................................................... 17
3.3.1. Introduction .................................................................................................................................... 17
3.3.2. Key information .............................................................................................................................. 18
3.3.3. Results and analysis ....................................................................................................................... 18
3.3.4. Situation of the Most Vulnerable Children ............................................................................... 19
3.3.5. Sustainability & Transition ............................................................................................................ 20
3.3.6. Key Lessons and Recommendations ......................................................................................... 20
3.4. All children are protected from violence, exploitation and abuse .............................................. 21
3.4.1. Introduction .................................................................................................................................... 21
3.4.2. Key information .............................................................................................................................. 22
3.4.3. Results & Analysis .......................................................................................................................... 22
3.4.4. Situation of the most vulnerable children ................................................................................ 24
3.4.5. Sustainability .................................................................................................................................... 24
3.4.6. Key Lessons & Recommendations ............................................................................................. 25
4. ADVOCACY (National and local) ............................................................................................................... 25
_______ World Vision Senegal CWBT Report - FY17 Page 4 / 29
4.1. Introduction .................................................................................................................................................. 25
4.2. Key Partners ............................................................................................................................................. 25
4.3. Flagship activities & advocacy results ................................................................................................. 26
5. Disaster management ...................................................................................................................................... 26
6. Development Programs Approach (DPA) .................................................................................................. 27
Conclusion & recommendations ........................................................................................................................... 29
• List of charts and Tables List of Figures Page
Figure 1: Strategic Objective 1 mapping 8
Figure 2: Percentage of women having completed the standard 4 PNCs (PNC completion rate) 9
Figure 3: Percentage of children aged 0-23 months suffering from being underweight. 10
Figure 4: Mapping of Strategic Objective 2 12
Figure 5: Proportion of households that experienced one or more lean months during the last 12 months. 13
Figure 6: Percentage of parents/guardians who have the means to save money 14
Figure 7: Proportion of households with a secondary source of income 15
Figure 8: Mapping the Strategic Objective 3 16
Figure 09: Proportion of boys and girls who passed the CEFE exam 18
Figure 10: Proportion of children functionally literate in 2017 19
Figure 11: Mapping the Strategic Objective 4 21
Figure 12: Proportion of young people who report having a birth certificate or another civil registration
document
22
Figure 13: Proportion of young people involved in decision-making that affects their lives 23
List of Tables Page
Table 1: Accuracy margins of the indicators 6
Table 2: Key indicators of the report 6
Table 3: Changes made to the recommendations 7
Table 4: Summary of the chain of logic for strategic objective 1 8
Table 5: Key information for Strategic Objective 1 9
Table 6: Percentage of children aged 0-23 months suffering from being underweight 10
Tableau 7: Percentage of children aged 0-23 months suffering from low weight 11
Table 6: Summary of the chain of logic for Strategic Objective 2 13
Table 7: Key Information for Strategic Objective 2 13
Table 8: Situation of the most vulnerable children, Strategic Objective 2 15
Table 9 : Key Lessons & Recommendations, Strategic Objective 2 16
Table 10: Summary of the chain of logic for Strategic Objective 3 18
Table 11: Key Information for Strategic Objective 3 18
Table 12: Situation of the most vulnerable children, Strategic Objective 3 19
Table 13 : Key Lessons & Recommendations, Strategic Objective 3 20
Table 14: Summary of the chain of logic for Strategic Objective 4 21
Table 15: Key information for Strategic Objective 4 22
Table 18: Situation of the most vulnerable children, Strategic Objective 4 24
Table 16 : Lessons learned and recommendations for Strategic Objective 4 25
Table 17: Lessons learned and emergency relief recommendations 27
_______ World Vision Senegal CWBT Report - FY17 Page 5 / 29
1. EXECUTIVE SUMMARY
World Vision is an international partnership of Christians working for child well-being through Transformational
Development, Advocacy and Humanitarian Affairs. Each year, World Vision Senegal produces a report that
illustrates its contribution to improving the well-being of children, including the most vulnerable. This report
presents the major achievements recorded during 2017 fiscal year, based on information drawn from 24 programs
and various special projects tracked by the monitoring and evaluation system. The process was guided by World
Vision Senegal’s commitment to work collaboratively with partners to improve children well-being of, especially
the most vulnerable.
FY 2017 is the second year of World Vision Senegal's new strategy whose aim is to increase the well-being of
8 million children by 2021 through four strategic objectives, which are:
1. All children under 5 and all women of childbearing age benefit from better health and nutrition.
2. All children live in households that are protected from hunger and are resilient to shocks.
3. All children have equitable access to quality education and
training that will be useful to them throughout their lives.
4. All children are protected from violence, exploitation and
abuse.
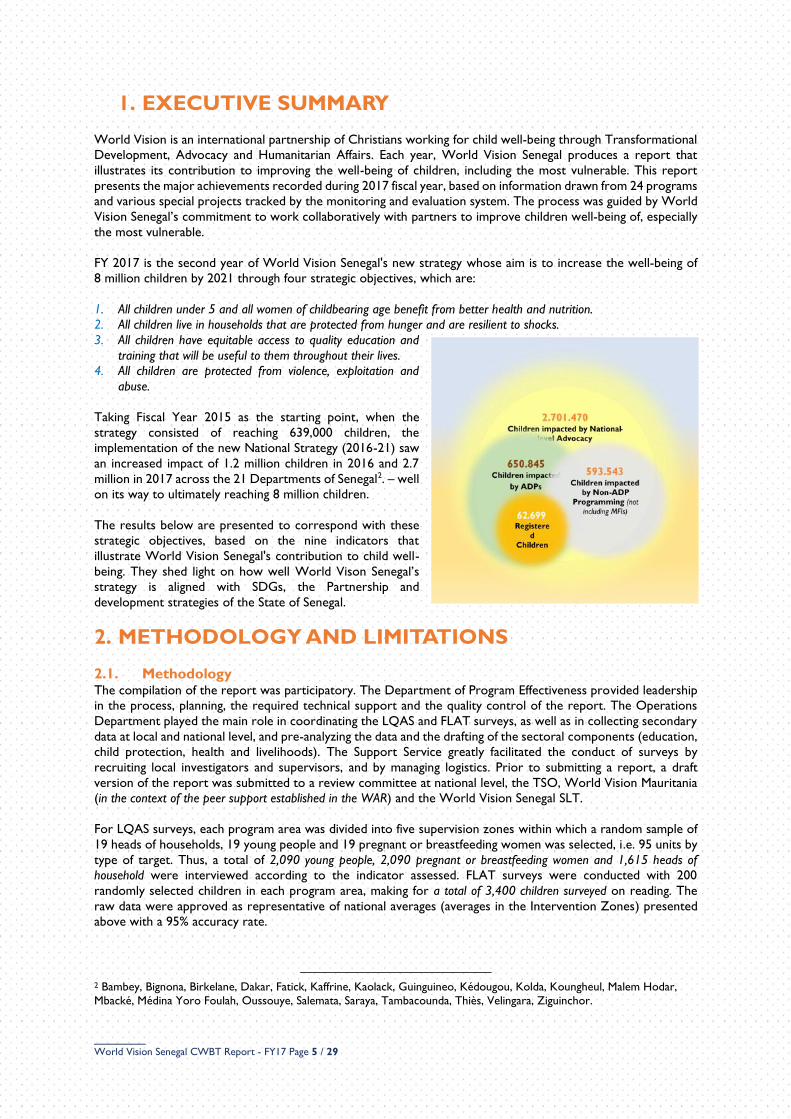
Taking Fiscal Year 2015 as the starting point, when the
strategy consisted of reaching 639,000 children, the
implementation of the new National Strategy (2016-21) saw
an increased impact of 1.2 million children in 2016 and 2.7
million in 2017 across the 21 Departments of Senegal2. – well
on its way to ultimately reaching 8 million children.
The results below are presented to correspond with these
strategic objectives, based on the nine indicators that
illustrate World Vision Senegal's contribution to child well-
being. They shed light on how well World Vison Senegal’s
strategy is aligned with SDGs, the Partnership and
development strategies of the State of Senegal.
2. METHODOLOGY AND LIMITATIONS
2.1. Methodology The compilation of the report was participatory. The Department of Program Effectiveness provided leadership
in the process, planning, the required technical support and the quality control of the report. The Operations
Department played the main role in coordinating the LQAS and FLAT surveys, as well as in collecting secondary
data at local and national level, and pre-analyzing the data and the drafting of the sectoral components (education,
child protection, health and livelihoods). The Support Service greatly facilitated the conduct of surveys by
recruiting local investigators and supervisors, and by managing logistics. Prior to submitting a report, a draft
version of the report was submitted to a review committee at national level, the TSO, World Vision Mauritania
(in the context of the peer support established in the WAR) and the World Vision Senegal SLT.
For LQAS surveys, each program area was divided into five supervision zones within which a random sample of
19 heads of households, 19 young people and 19 pregnant or breastfeeding women was selected, i.e. 95 units by
type of target. Thus, a total of 2,090 young people, 2,090 pregnant or breastfeeding women and 1,615 heads of
household were interviewed according to the indicator assessed. FLAT surveys were conducted with 200
randomly selected children in each program area, making for a total of 3,400 children surveyed on reading. The
raw data were approved as representative of national averages (averages in the Intervention Zones) presented
above with a 95% accuracy rate.
2 Bambey, Bignona, Birkelane, Dakar, Fatick, Kaffrine, Kaolack, Guinguineo, Kédougou, Kolda, Koungheul, Malem Hodar,
Mbacké, Médina Yoro Foulah, Oussouye, Salemata, Saraya, Tambacounda, Thiès, Velingara, Ziguinchor.
_______ World Vision Senegal CWBT Report - FY17 Page 6 / 29
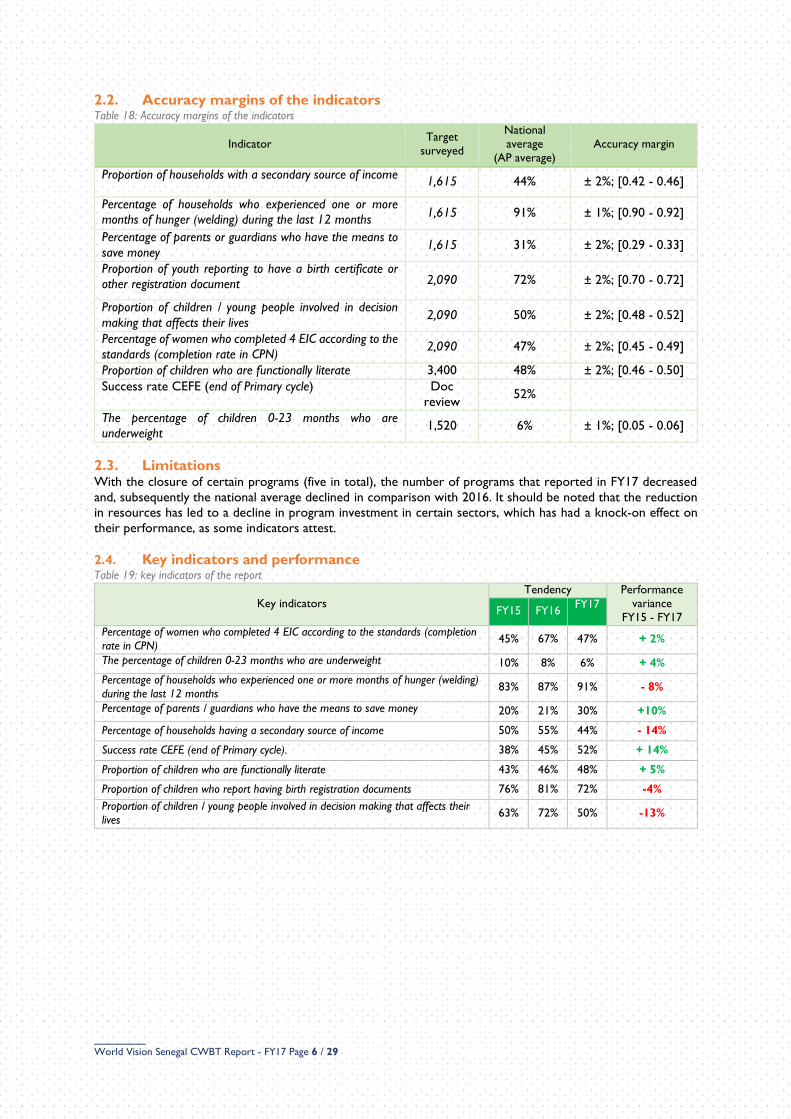
2.2. Accuracy margins of the indicators Table 18: Accuracy margins of the indicators
Indicator Target
surveyed
National
average
(AP average)
Accuracy margin
Proportion of households with a secondary source of income 1,615 44% ± 2%; [0.42 - 0.46]
Percentage of households who experienced one or more
months of hunger (welding) during the last 12 months 1,615 91% ± 1%; [0.90 - 0.92]
Percentage of parents or guardians who have the means to
save money 1,615 31% ± 2%; [0.29 - 0.33]
Proportion of youth reporting to have a birth certificate or
other registration document 2,090 72% ± 2%; [0.70 - 0.72]
Proportion of children / young people involved in decision
making that affects their lives 2,090 50% ± 2%; [0.48 - 0.52]
Percentage of women who completed 4 EIC according to the
standards (completion rate in CPN) 2,090 47% ± 2%; [0.45 - 0.49]
Proportion of children who are functionally literate 3,400 48% ± 2%; [0.46 - 0.50]
Success rate CEFE (end of Primary cycle) Doc
review 52%
The percentage of children 0-23 months who are
underweight 1,520 6% ± 1%; [0.05 - 0.06]
2.3. Limitations With the closure of certain programs (five in total), the number of programs that reported in FY17 decreased
and, subsequently the national average declined in comparison with 2016. It should be noted that the reduction
in resources has led to a decline in program investment in certain sectors, which has had a knock-on effect on
their performance, as some indicators attest.
2.4. Key indicators and performance Table 19: key indicators of the report
Key indicators
Tendency Performance
variance
FY15 - FY17 FY15 FY16
FY17
Percentage of women who completed 4 EIC according to the standards (completion
rate in CPN) 45% 67% 47% + 2%
The percentage of children 0-23 months who are underweight 10% 8% 6% + 4%
Percentage of households who experienced one or more months of hunger (welding)
during the last 12 months 83% 87% 91% - 8%
Percentage of parents / guardians who have the means to save money 20% 21% 30% +10%
Percentage of households having a secondary source of income 50% 55% 44% - 14%
Success rate CEFE (end of Primary cycle). 38% 45% 52% + 14%
Proportion of children who are functionally literate 43% 46% 48% + 5%
Proportion of children who report having birth registration documents 76% 81% 72% -4%
Proportion of children / young people involved in decision making that affects their
lives 63% 72% 50% -13%
_______ World Vision Senegal CWBT Report - FY17 Page 7 / 29
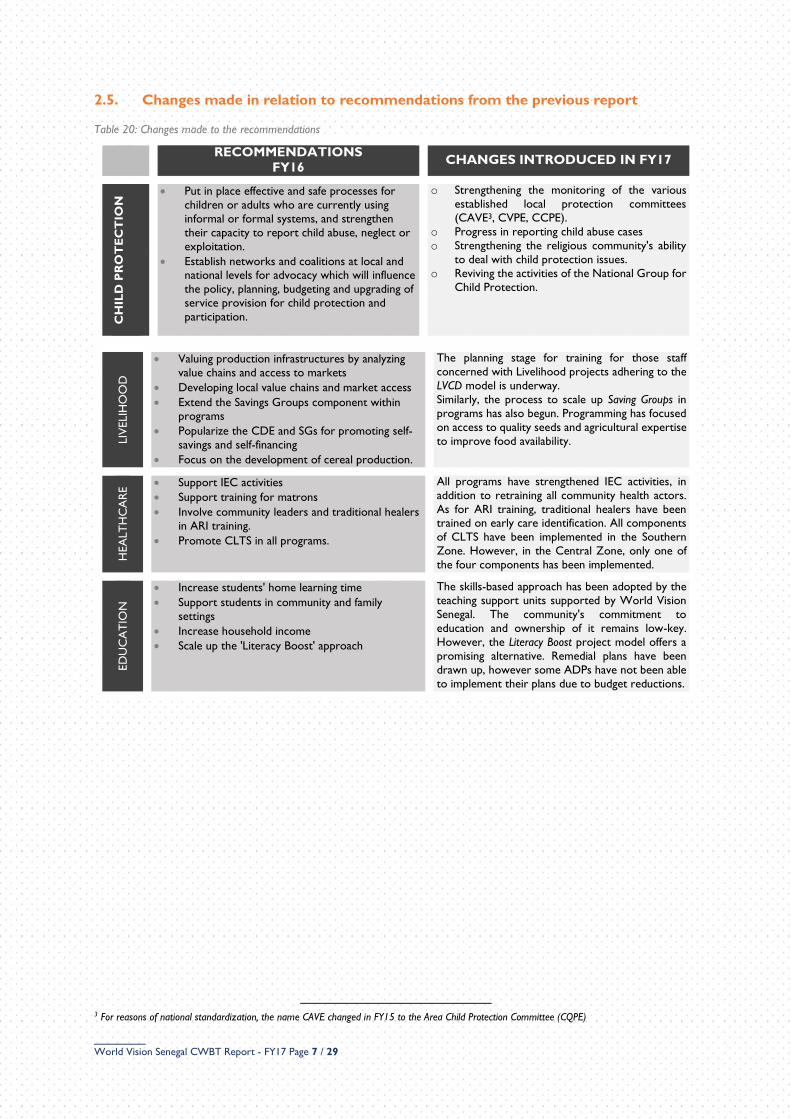
2.5. Changes made in relation to recommendations from the previous report
Table 20: Changes made to the recommendations RECOMMENDATIONS
FY16 CHANGES INTRODUCED IN FY17
CH
ILD
PR
OT
EC
TIO
N
Put in place effective and safe processes for
children or adults who are currently using
informal or formal systems, and strengthen
their capacity to report child abuse, neglect or
exploitation.
Establish networks and coalitions at local and national levels for advocacy which will influence
the policy, planning, budgeting and upgrading of
service provision for child protection and
participation.
o Strengthening the monitoring of the various
established local protection committees
(CAVE3, CVPE, CCPE).
o Progress in reporting child abuse cases
o Strengthening the religious community's ability
to deal with child protection issues.
o Reviving the activities of the National Group for
Child Protection.
LIV
ELIH
OO
D
Valuing production infrastructures by analyzing
value chains and access to markets
Developing local value chains and market access
Extend the Savings Groups component within programs
Popularize the CDE and SGs for promoting self-
savings and self-financing
Focus on the development of cereal production.
The planning stage for training for those staff
concerned with Livelihood projects adhering to the
LVCD model is underway.
Similarly, the process to scale up Saving Groups in
programs has also begun. Programming has focused
on access to quality seeds and agricultural expertise
to improve food availability.
HEA
LT
HC
AR
E Support IEC activities
Support training for matrons
Involve community leaders and traditional healers
in ARI training.
Promote CLTS in all programs.
All programs have strengthened IEC activities, in
addition to retraining all community health actors.
As for ARI training, traditional healers have been trained on early care identification. All components
of CLTS have been implemented in the Southern
Zone. However, in the Central Zone, only one of
the four components has been implemented.
ED
UC
AT
ION
Increase students' home learning time
Support students in community and family
settings
Increase household income
Scale up the 'Literacy Boost' approach
The skills-based approach has been adopted by the
teaching support units supported by World Vision
Senegal. The community's commitment to
education and ownership of it remains low-key.
However, the Literacy Boost project model offers a
promising alternative. Remedial plans have been
drawn up, however some ADPs have not been able
to implement their plans due to budget reductions.
3 For reasons of national standardization, the name CAVE changed in FY15 to the Area Child Protection Committee (CQPE)
_______ World Vision Senegal CWBT Report - FY17 Page 8 / 29
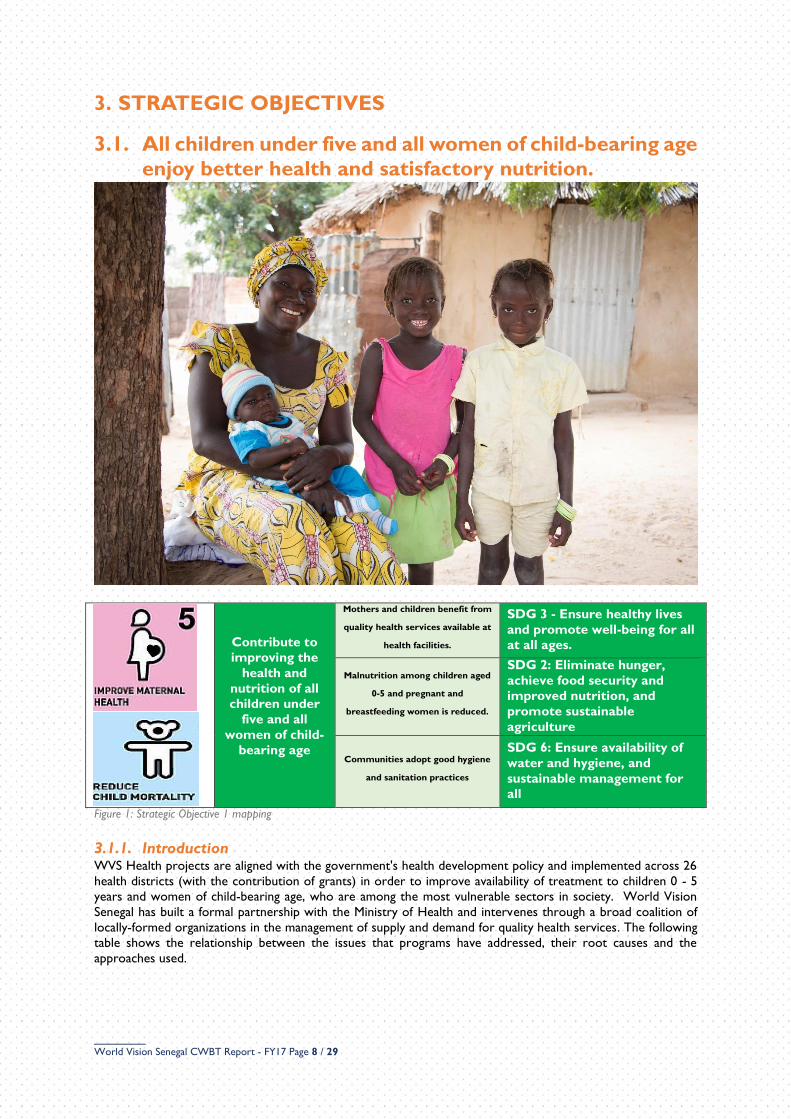
3. STRATEGIC OBJECTIVES
3.1. All children under five and all women of child-bearing age
enjoy better health and satisfactory nutrition.
Contribute to
improving the
health and
nutrition of all
children under
five and all
women of child-
bearing age
Mothers and children benefit from
quality health services available at
health facilities.
SDG 3 - Ensure healthy lives
and promote well-being for all
at all ages.
Malnutrition among children aged
0-5 and pregnant and
breastfeeding women is reduced.
SDG 2: Eliminate hunger,
achieve food security and
improved nutrition, and
promote sustainable
agriculture
Communities adopt good hygiene
and sanitation practices
SDG 6: Ensure availability of
water and hygiene, and
sustainable management for
all
Figure 1: Strategic Objective 1 mapping
3.1.1. Introduction WVS Health projects are aligned with the government's health development policy and implemented across 26
health districts (with the contribution of grants) in order to improve availability of treatment to children 0 - 5
years and women of child-bearing age, who are among the most vulnerable sectors in society. World Vision
Senegal has built a formal partnership with the Ministry of Health and intervenes through a broad coalition of
locally-formed organizations in the management of supply and demand for quality health services. The following
table shows the relationship between the issues that programs have addressed, their root causes and the
approaches used.
_______ World Vision Senegal CWBT Report - FY17 Page 9 / 29
Table 21: summary of the chain of logic for strategic objective 1
Issues Root causes Approaches
Persistence of low
weight in children
under 5
Ignorance of the proper diet for children and
pregnant women
Cultural barriers / limited involvement of religious leaders in nutrition programs
Lack of qualified health personnel
The PECIME / C4 (strategy
encompassing several promotional and
preventive interventions
Strengthening the community health system
Model projects and good practice
PSSC (Health Program, Community
Health Component)
Community attics strategy
Lack of access for
pregnant women to
quality prenatal
care throughout
the year
Inappropriate behaviors and attitudes shown
by pregnant women.
Low membership to Health Mutual, especially among the most vulnerable
3.1.2. Key information
Table 22: Key Information for Strategic Objective 1
# Projects contributing
Spend (USD)
% of funding
from different sources5
# technical staff
Key partners
collaborating in order to achieve this objective
Total direct participants
22 5,017,778
Government and multilateral 51%
PNS 10%
Sponsorship 39%
1National Health Advisor, Nutrition, EHA/Health, Nutrition
& WASH Advisor;
35 National Managers (Health/Nut, WASH,
PINKK);
13 Nutrition Supervisors (RSS+,
PINKK, TB, Malaria);
25 Health Specialists (PRN, ADP, PINKK,
Wash, RSS+)
Technical Services and
State Agencies;
NGOs & Consortia6;
Communes (i.e. Local
Government);
Community-Based Organizations and Local
Associations;
Community Health Volunteer Networks.
987,446
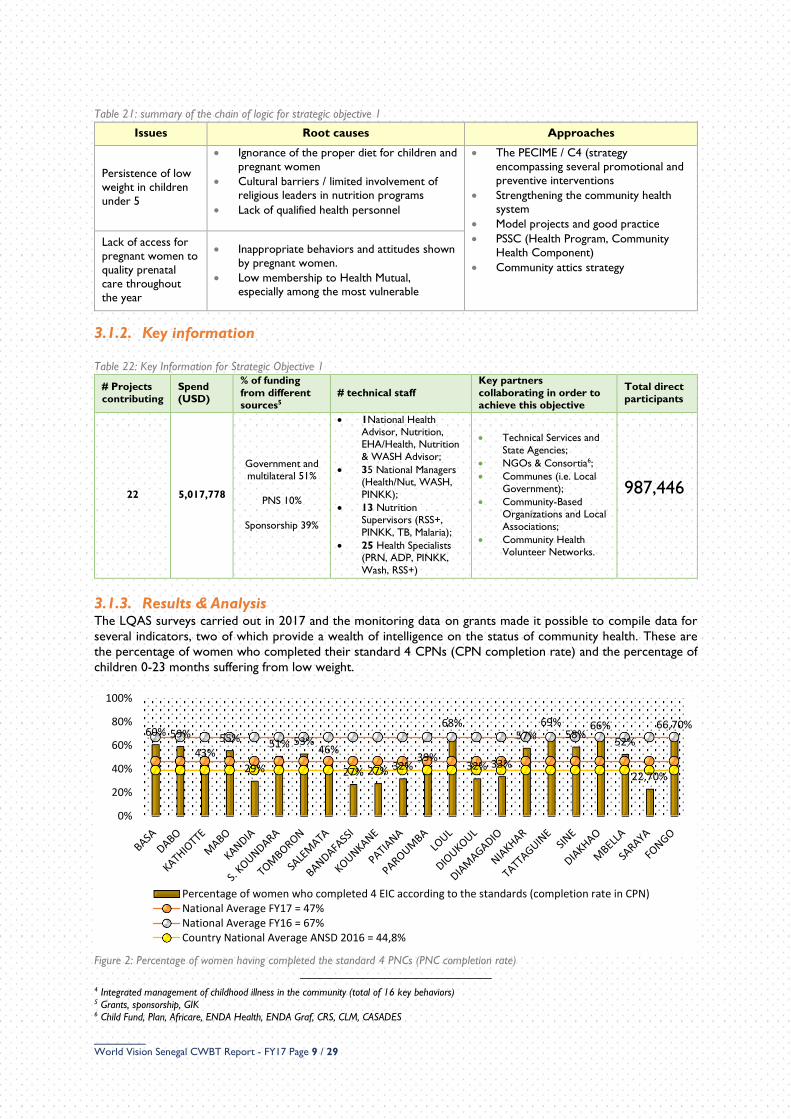
3.1.3. Results & Analysis The LQAS surveys carried out in 2017 and the monitoring data on grants made it possible to compile data for
several indicators, two of which provide a wealth of intelligence on the status of community health. These are
the percentage of women who completed their standard 4 CPNs (CPN completion rate) and the percentage of
children 0-23 months suffering from low weight.
Figure 2: Percentage of women having completed the standard 4 PNCs (PNC completion rate)
4 Integrated management of childhood illness in the community (total of 16 key behaviors) 5 Grants, sponsorship, GIK 6 Child Fund, Plan, Africare, ENDA Health, ENDA Graf, CRS, CLM, CASADES
60% 59%
43%55%
29%
51% 53%46%
27% 27% 32%39%
68%
32% 33%
57%69%
58%66%
52%
22,70%
66,70%
0%
20%
40%
60%
80%
100%
Percentage of women who completed 4 EIC according to the standards (completion rate in CPN)National Average FY17 = 47%National Average FY16 = 67%Country National Average ANSD 2016 = 44,8%

_______ World Vision Senegal CWBT Report - FY17 Page 10 / 29
The information was collected in 22 out of 23 ADPs, a completeness rate of 96%. One interpretation of the
performance suggests an increase of 22% between 2015 and 2016, which was negated by a decrease of 20%
between 2016 and 2017. This negative performance is due to several factors. The sponsorship budget invested
in this sector fell from 54% in 2015 to 39% in 2017 while we see the revitalization of grants that rose from 46%
in 2015 to 51% in 2017. However, it should be noted that grants also cover areas outside the programs that are
not taken into account here. In addition to this, the withdrawal of five programs has had an impact on the national
average.
However this reduction also hides some other promising trends. In fact, 14 programs exceeded the national
average which is a 44.8% completion rate in rural localities, according to the Government benchmark (ANSD),
meaning 64% of the programs achieved a satisfactory result. This result is linked to the implementation
of a range of interventions across the board, including specific logistical support for health facilities in order to
put advanced integrated strategies into effect. This further facilitated access to quality health care for pregnant
women. Additionally, events were held to promote the importance of the use of CPN services. These are carried
out by a taskforce of 1,308 community health actors comprising 928 women and 380 men, organized into self-
help groups such as pregnant women's solidarity circles, the grandmother strategy and the fathers' group, all
working towards an effective and quality series of four pre-natal consultations.
Figure 3: Percentage of children aged 0-23 months suffering from being underweight.
The 16 programs that have reported an underweight prevalence are below both the WHO benchmark and the
national target that is less than 10%. Growth Promotion Monitoring and PECMA-C are the key interventions that
contributed to these results. The prevention and management of malnutrition in the community is being
coordinated through a series of measures, in accordance with ministry's care protocol: capacity building for
community actors through ANJE, bringing new nutrition stations on-stream, holding talk sessions on the key
behaviors of the PCIME-C, promoting breastfeeding and adequate complementary feeding as well as supplements
and deworming for children.
Strategies are being put into effect to maintain these performances, such as the community attics which help
children cope with the lean season which is arriving early in some areas, and the involvement of BG (Badienou
Gokh) in community mobilization and follow-up support for pregnant women to abide by the PNCs, in order to
prevent chronic malnutrition in children. Joining health mutuals and promoting CMU is a strategy that aims to
guarantee good health for children 0-5 through free access to healthcare.
3.1.4. Situation of the Most Vulnerable Children
Table 6: Percentage of children aged 0-23 months suffering from being underweight
Child victims of
extreme deprivation
Children exposed
to abusive
relationships
Children
exposed to
discrimination
Children in
disaster
scenarios
Vulnerability
factors
Children living in very poor
households
Children who do not have
access to health care and services
Child victims of rape
Child victims of neglect
Children living
with a disability
Children living in
areas of declared food insecurity
0% 0%
6%
3% 3% 3%
0% 0% 0%
7%
0%
3%
1%
2%
9%
1%
3% 3% 3% 3%
6% 6%
Percentage of children 0-23 months who are underweight
National Average FY17 = 6%
National Average FY16 = 8%
WHO norms < 10%
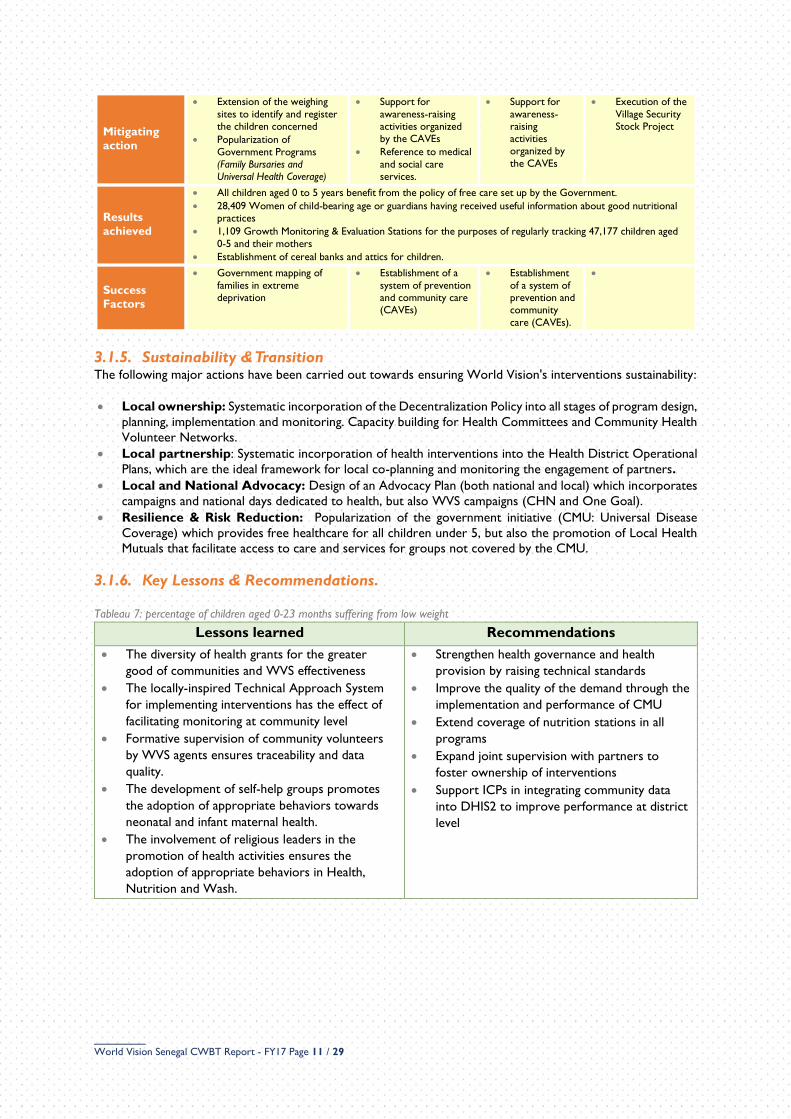
_______ World Vision Senegal CWBT Report - FY17 Page 11 / 29
Mitigating
action
Extension of the weighing
sites to identify and register the children concerned
Popularization of
Government Programs (Family Bursaries and Universal Health Coverage)
Support for
awareness-raising activities organized by the CAVEs
Reference to medical
and social care services.
Support for
awareness-raising activities organized by
the CAVEs
Execution of the
Village Security Stock Project
Results
achieved
All children aged 0 to 5 years benefit from the policy of free care set up by the Government.
28,409 Women of child-bearing age or guardians having received useful information about good nutritional practices
1,109 Growth Monitoring & Evaluation Stations for the purposes of regularly tracking 47,177 children aged
0-5 and their mothers
Establishment of cereal banks and attics for children.
Success
Factors
Government mapping of
families in extreme deprivation
Establishment of a
system of prevention and community care (CAVEs)
Establishment
of a system of prevention and community
care (CAVEs).
3.1.5. Sustainability & Transition The following major actions have been carried out towards ensuring World Vision's interventions sustainability:
Local ownership: Systematic incorporation of the Decentralization Policy into all stages of program design,
planning, implementation and monitoring. Capacity building for Health Committees and Community Health
Volunteer Networks.
Local partnership: Systematic incorporation of health interventions into the Health District Operational
Plans, which are the ideal framework for local co-planning and monitoring the engagement of partners.
Local and National Advocacy: Design of an Advocacy Plan (both national and local) which incorporates
campaigns and national days dedicated to health, but also WVS campaigns (CHN and One Goal).
Resilience & Risk Reduction: Popularization of the government initiative (CMU: Universal Disease
Coverage) which provides free healthcare for all children under 5, but also the promotion of Local Health
Mutuals that facilitate access to care and services for groups not covered by the CMU.
3.1.6. Key Lessons & Recommendations.
Tableau 7: percentage of children aged 0-23 months suffering from low weight
Lessons learned Recommendations
The diversity of health grants for the greater
good of communities and WVS effectiveness
The locally-inspired Technical Approach System
for implementing interventions has the effect of
facilitating monitoring at community level
Formative supervision of community volunteers
by WVS agents ensures traceability and data
quality.
The development of self-help groups promotes
the adoption of appropriate behaviors towards
neonatal and infant maternal health.
The involvement of religious leaders in the
promotion of health activities ensures the
adoption of appropriate behaviors in Health,
Nutrition and Wash.
Strengthen health governance and health
provision by raising technical standards
Improve the quality of the demand through the
implementation and performance of CMU
Extend coverage of nutrition stations in all
programs
Expand joint supervision with partners to
foster ownership of interventions
Support ICPs in integrating community data
into DHIS2 to improve performance at district
level
_______ World Vision Senegal CWBT Report - FY17 Page 12 / 29
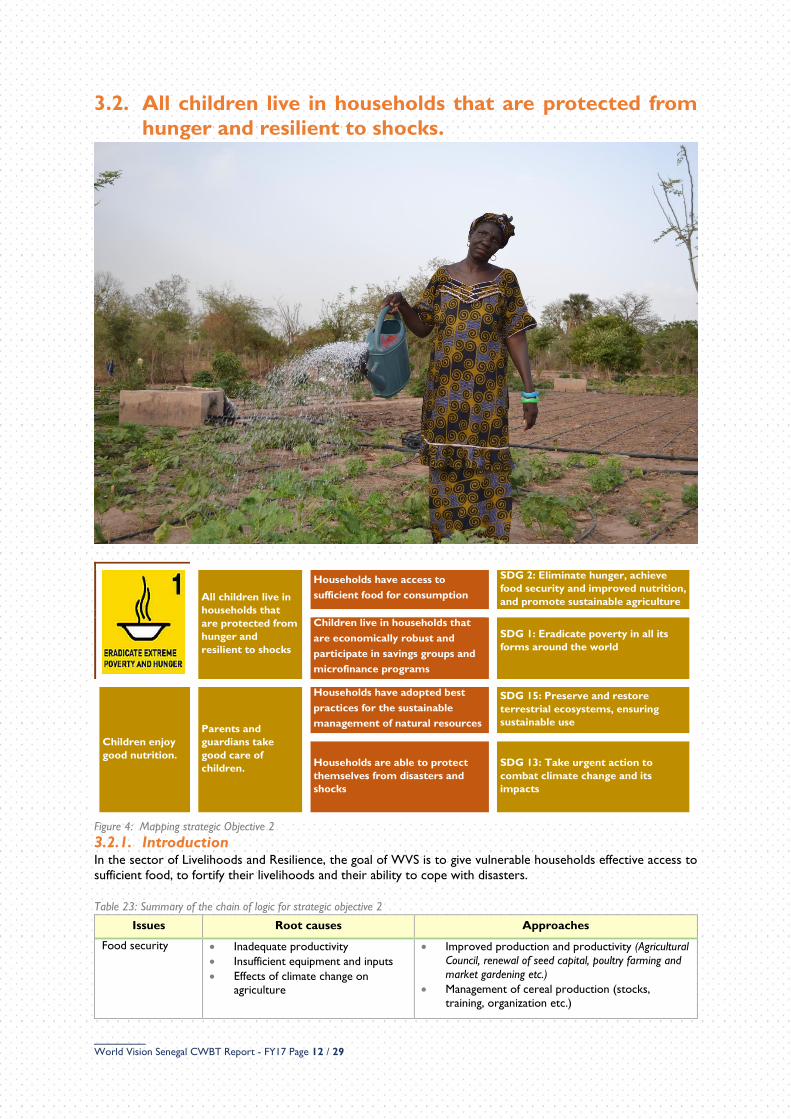
3.2. All children live in households that are protected from
hunger and resilient to shocks.
All children live in
households that
are protected from
hunger and
resilient to shocks
Households have access to
sufficient food for consumption
SDG 2: Eliminate hunger, achieve
food security and improved nutrition,
and promote sustainable agriculture
Children live in households that
are economically robust and
participate in savings groups and
microfinance programs
SDG 1: Eradicate poverty in all its
forms around the world
Children enjoy
good nutrition.
Parents and
guardians take
good care of
children.
Households have adopted best
practices for the sustainable
management of natural resources
SDG 15: Preserve and restore
terrestrial ecosystems, ensuring
sustainable use
Households are able to protect
themselves from disasters and
shocks
SDG 13: Take urgent action to
combat climate change and its
impacts
Figure 4: Mapping strategic Objective 2
3.2.1. Introduction In the sector of Livelihoods and Resilience, the goal of WVS is to give vulnerable households effective access to
sufficient food, to fortify their livelihoods and their ability to cope with disasters.
Table 23: Summary of the chain of logic for strategic objective 2
Issues Root causes Approaches
Food security Inadequate productivity
Insufficient equipment and inputs
Effects of climate change on agriculture
Improved production and productivity (Agricultural
Council, renewal of seed capital, poultry farming and
market gardening etc.)
Management of cereal production (stocks,
training, organization etc.)

_______ World Vision Senegal CWBT Report - FY17 Page 13 / 29
Food distribution (areas of food risk)
Low income Financing models that are
unsuitable for vulnerable
households
Lack of income diversification
Diversification and customization of the supply of
financial products and services (creation of savings
groups and financing of income-generating activities
through Vision Fund)
Degradation of
natural resources
and productive
bases
Inappropriate cultural practices
Sustained pressure on natural resources
Popularization of FMNR
Popularization of Local Agreements for the Protection of Natural Resources
High vulnerability
to external shocks Effects of climate change on
agriculture
Lack of preparedness and anticipation of the causes of
disaster.
Strengthening DRR strategies
Implementation of Community Disaster Preparedness Plans (CDPP)
3.2.2. Key information Table 24: Key Information for Strategic Objective 2
# Projects
contributing
Spend
(USD)7
% of funding from
different sources8
# Technical
staff
Key partners collaborating in
order to achieve this objective
Total direct
participants
26 2,738,054
Government and
multilateral 2%
PNS 1%
Sponsorship 97%
6 Specialists
1 National Advisor
59 VFS Agents
Technical Services and Government Agencies
Communes (i.e. Local Government)
Community-Based
Organizations and Local Associations
194,320
3.2.3. Results & Analysis
Figure 5: Proportion of households that experienced one or more lean months during the last 12 months.
7 Overall expenditure for the Livelihood and Economic Development Sectors. 8 Grants, sponsorship, GIK
95% 96%90%
84%
96% 93% 95% 95% 99%
63%
91% 88%
76%
93% 89%
72%
87%
Percentage of households who experienced one or more months of hunger (welding) during the last 12 monthsNational Average FY17 = 91%National Average FY16 = 87%National Average FY15 = 83%
_______ World Vision Senegal CWBT Report - FY17 Page 14 / 29
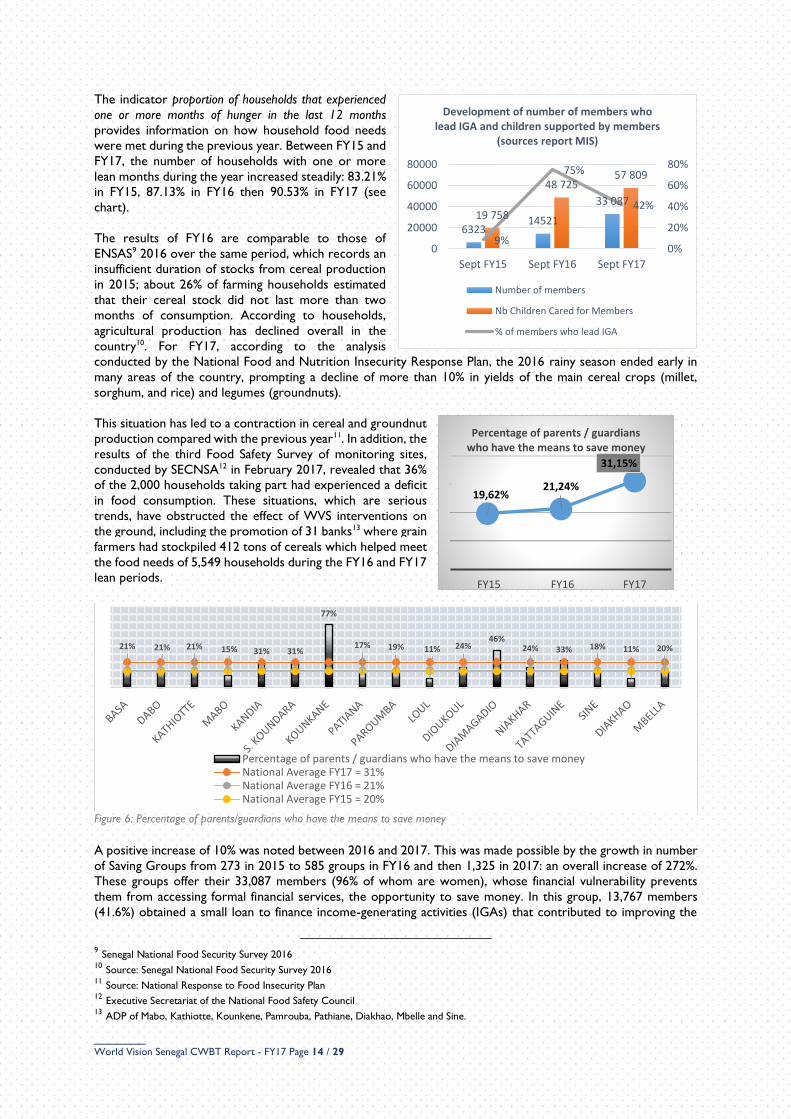
The indicator proportion of households that experienced
one or more months of hunger in the last 12 months
provides information on how household food needs
were met during the previous year. Between FY15 and
FY17, the number of households with one or more
lean months during the year increased steadily: 83.21%
in FY15, 87.13% in FY16 then 90.53% in FY17 (see
chart).
The results of FY16 are comparable to those of
ENSAS9 2016 over the same period, which records an
insufficient duration of stocks from cereal production
in 2015; about 26% of farming households estimated
that their cereal stock did not last more than two
months of consumption. According to households,
agricultural production has declined overall in the
country10. For FY17, according to the analysis
conducted by the National Food and Nutrition Insecurity Response Plan, the 2016 rainy season ended early in
many areas of the country, prompting a decline of more than 10% in yields of the main cereal crops (millet,
sorghum, and rice) and legumes (groundnuts).
This situation has led to a contraction in cereal and groundnut
production compared with the previous year11. In addition, the
results of the third Food Safety Survey of monitoring sites,
conducted by SECNSA12 in February 2017, revealed that 36%
of the 2,000 households taking part had experienced a deficit
in food consumption. These situations, which are serious
trends, have obstructed the effect of WVS interventions on
the ground, including the promotion of 31 banks13 where grain
farmers had stockpiled 412 tons of cereals which helped meet
the food needs of 5,549 households during the FY16 and FY17
lean periods.
Figure 6: Percentage of parents/guardians who have the means to save money
A positive increase of 10% was noted between 2016 and 2017. This was made possible by the growth in number
of Saving Groups from 273 in 2015 to 585 groups in FY16 and then 1,325 in 2017: an overall increase of 272%.
These groups offer their 33,087 members (96% of whom are women), whose financial vulnerability prevents
them from accessing formal financial services, the opportunity to save money. In this group, 13,767 members
(41.6%) obtained a small loan to finance income-generating activities (IGAs) that contributed to improving the
9 Senegal National Food Security Survey 2016 10 Source: Senegal National Food Security Survey 2016 11 Source: National Response to Food Insecurity Plan 12 Executive Secretariat of the National Food Safety Council 13 ADP of Mabo, Kathiotte, Kounkene, Pamrouba, Pathiane, Diakhao, Mbelle and Sine.
Percentage of parents / guardians who have the means to save moneyNational Average FY17 = 31%National Average FY16 = 21%National Average FY15 = 20%
19,62%21,24%
31,15%
FY15 FY16 FY17
Percentage of parents / guardians who have the means to save money
632314521
33 08719 758
48 72557 809
9%
75%
42%
0%
20%
40%
60%
80%
0
20000
40000
60000
80000
Sept FY15 Sept FY16 Sept FY17
Development of number of members who lead IGA and children supported by members
(sources report MIS)
Number of members
Nb Children Cared for Members
% of members who lead IGA
_______ World Vision Senegal CWBT Report - FY17 Page 15 / 29
well-being of 57,809 children. It should be noted that this scaling up of the savings and credit groups between
FY16 and FY17 was prioritized mainly for the benefit of the most vulnerable communities who are at a stage with
their savings that is too early to allow for the introduction of IGAs as an alternative source of income.
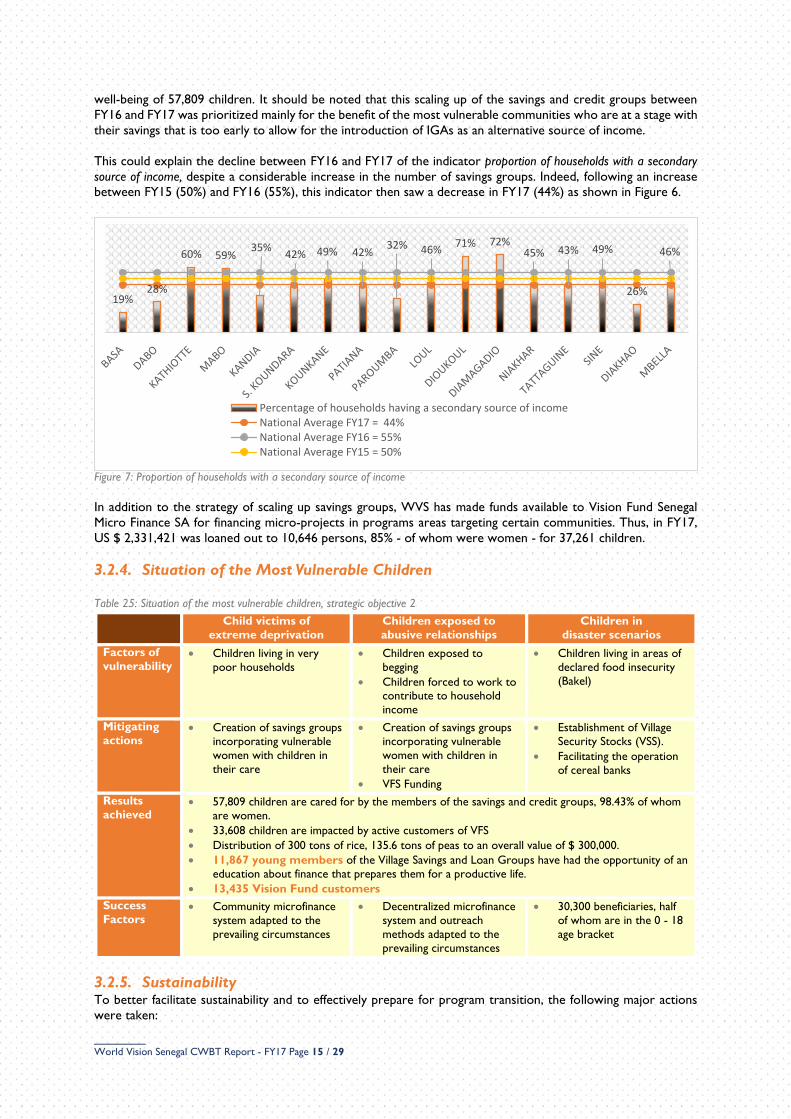
This could explain the decline between FY16 and FY17 of the indicator proportion of households with a secondary
source of income, despite a considerable increase in the number of savings groups. Indeed, following an increase
between FY15 (50%) and FY16 (55%), this indicator then saw a decrease in FY17 (44%) as shown in Figure 6.
Figure 7: Proportion of households with a secondary source of income
In addition to the strategy of scaling up savings groups, WVS has made funds available to Vision Fund Senegal
Micro Finance SA for financing micro-projects in programs areas targeting certain communities. Thus, in FY17,
US $ 2,331,421 was loaned out to 10,646 persons, 85% - of whom were women - for 37,261 children.
3.2.4. Situation of the Most Vulnerable Children Table 25: Situation of the most vulnerable children, strategic objective 2
Child victims of
extreme deprivation
Children exposed to
abusive relationships
Children in
disaster scenarios
Factors of
vulnerability Children living in very
poor households
Children exposed to
begging
Children forced to work to contribute to household
income
Children living in areas of
declared food insecurity
(Bakel)
Mitigating
actions Creation of savings groups
incorporating vulnerable
women with children in
their care
Creation of savings groups
incorporating vulnerable
women with children in
their care
VFS Funding
Establishment of Village
Security Stocks (VSS).
Facilitating the operation
of cereal banks
Results
achieved 57,809 children are cared for by the members of the savings and credit groups, 98.43% of whom
are women.
33,608 children are impacted by active customers of VFS
Distribution of 300 tons of rice, 135.6 tons of peas to an overall value of $ 300,000.
11,867 young members of the Village Savings and Loan Groups have had the opportunity of an
education about finance that prepares them for a productive life.
13,435 Vision Fund customers
Success
Factors Community microfinance
system adapted to the
prevailing circumstances
Decentralized microfinance
system and outreach
methods adapted to the
prevailing circumstances
30,300 beneficiaries, half
of whom are in the 0 - 18
age bracket
3.2.5. Sustainability To better facilitate sustainability and to effectively prepare for program transition, the following major actions
were taken:
19%28%
60% 59%35%
42% 49% 42%32% 46%
71% 72%45% 43% 49%
26%
46%
Percentage of households having a secondary source of incomeNational Average FY17 = 44%National Average FY16 = 55%National Average FY15 = 50%
_______ World Vision Senegal CWBT Report - FY17 Page 16 / 29
Local ownership: Organizational strengthening of producer associations and coordination around value
chains.
Local partnership: Systematic incorporation of decentralized state technical services, local authorities and
CBOs into the planning, implementation, monitoring and evaluation of interventions at community level,
through a system of local co-planning and monitoring of partner engagement.
Local and National Advocacy: Presence on the national platforms for Advocacy on Food Security and
Nutrition (National Food Security Group).
Resilience & Risk Reduction: Steering underprivileged families towards the social safety net system
initiated by the Government of Senegal (Family Safety Grants).
3.2.6. Key Lessons & Recommendations Table 26 : Key Lessons & Recommendations, Strategic Objective 2
Lessons learned Recommendations
Improving the coverage of household food needs involves
improving agricultural production but also improving household
incomes
Identify and develop local value chains
The Village Savings and Loans Group approach is an effective
way to enhance household resilience
Continue the SG scaling up strategy and
connect them with Vision Fund Senegal
once they are mature.
_______ World Vision Senegal CWBT Report - FY17 Page 17 / 29
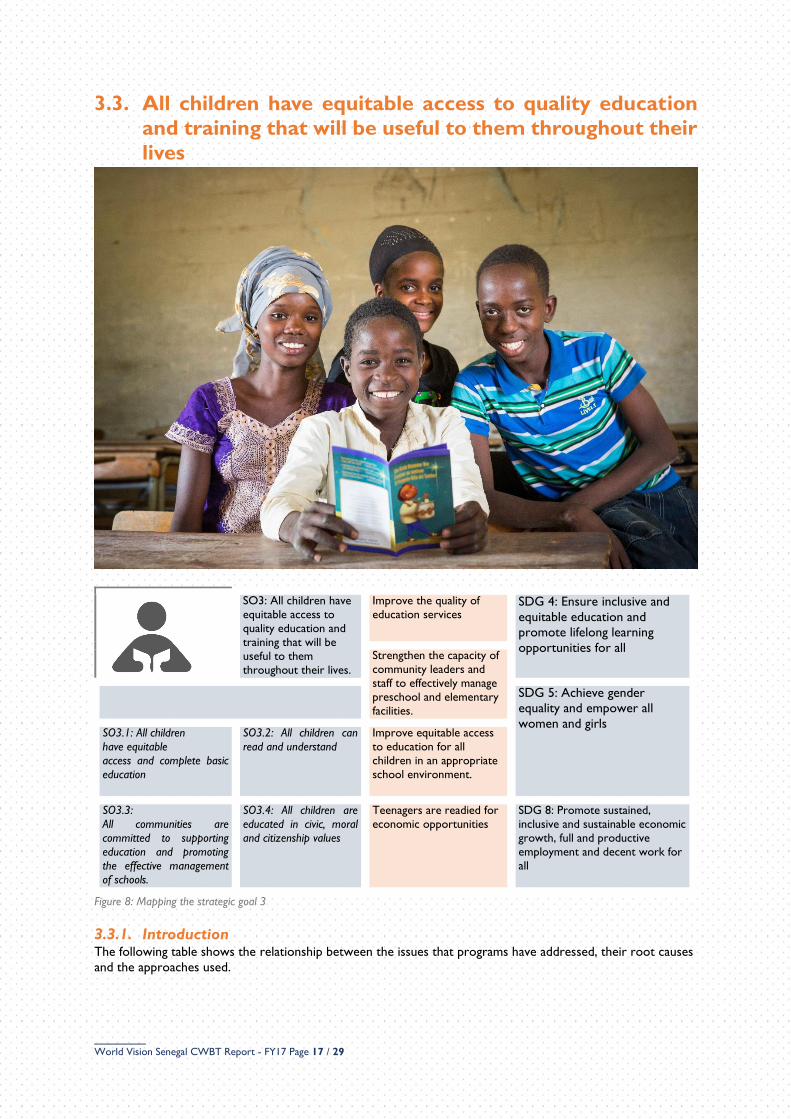
3.3. All children have equitable access to quality education
and training that will be useful to them throughout their
lives
SO3: All children have
equitable access to
quality education and
training that will be
useful to them
throughout their lives.
Improve the quality of
education services SDG 4: Ensure inclusive and
equitable education and
promote lifelong learning
opportunities for all
Strengthen the capacity of
community leaders and
staff to effectively manage
preschool and elementary
facilities.
SDG 5: Achieve gender
equality and empower all
women and girls SO3.1: All children
have equitable
access and complete basic
education
SO3.2: All children can
read and understand
Improve equitable access
to education for all
children in an appropriate
school environment.
SO3.3:
All communities are
committed to supporting
education and promoting
the effective management
of schools.
SO3.4: All children are
educated in civic, moral
and citizenship values
Teenagers are readied for
economic opportunities
SDG 8: Promote sustained,
inclusive and sustainable economic
growth, full and productive
employment and decent work for
all
Figure 8: Mapping the strategic goal 3
3.3.1. Introduction The following table shows the relationship between the issues that programs have addressed, their root causes
and the approaches used.
_______ World Vision Senegal CWBT Report - FY17 Page 18 / 29
Table 27: Summary of the chain of logic for strategic objective 3
Issues Root causes Approaches
Low ability to
read and
understand
• The required teaching hours are almost
never fulfilled.
• Non-differentiated teaching materials in
schools and homes.
• Monitoring & evaluation of teachers is not
effective.
• Poor control of taxonomic reading levels by
teachers.
• Teaching methodology for reading not found
engaging by children.
• Poor preparation for exams: neither practice
tests nor standardized assessments are systematized.
• Entry through results, FLAT assessment and
remedial plans
• Continuous professional development plan
and monitoring for teachers
• Literacy Boost approach
• Support for standardized exams and
assessments
• Provision of teaching materials in schools
• Local creation of reading material
• Support for preparing students for various
exams
Low pass rate on
CEFE exam
Low level of
community
involvement
• Poor literacy environment at home
• Reference to social models other than
school.
• Insufficient livelihoods for communities
Establishment of a pilot project
Awareness building and advocacy
Training for the School Management
Committees
3.3.2. Key information Table 28: Key Information of Strategic Objective 3
#
Contributing Projects
Spend14 (USD)
% of funding from
different sources15
# Technical staff
Key partners collaborating in order to achieve this objective
Total direct participants
22 2,672,360
Government and
multilateral 9%
PNS 11%
Sponsorship 80%
10 education
specialists
1 National
Advisor
Technical Services and State
Governmental Agencies
Communes (i.e. Local
Government)
Community-Based Organizations and Local
Associations (UCGE, CGE,
APE etc.)
72,524
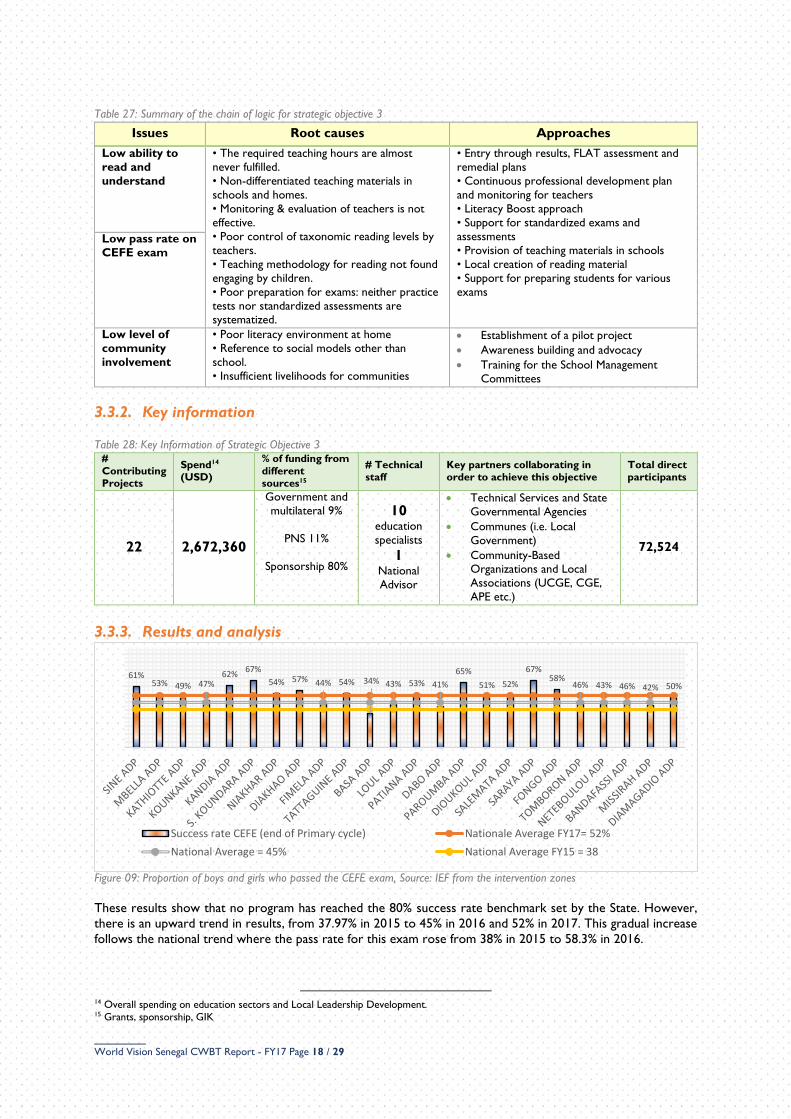
3.3.3. Results and analysis
Figure 09: Proportion of boys and girls who passed the CEFE exam, Source: IEF from the intervention zones
These results show that no program has reached the 80% success rate benchmark set by the State. However,
there is an upward trend in results, from 37.97% in 2015 to 45% in 2016 and 52% in 2017. This gradual increase
follows the national trend where the pass rate for this exam rose from 38% in 2015 to 58.3% in 2016.
14 Overall spending on education sectors and Local Leadership Development. 15 Grants, sponsorship, GIK
61%53% 49% 47%
62%67%
54% 57% 44% 54% 34% 43% 53% 41%
65%
51% 52%
67%58%
46% 43% 46% 42% 50%
Success rate CEFE (end of Primary cycle) Nationale Average FY17= 52%
National Average = 45% National Average FY15 = 38
_______ World Vision Senegal CWBT Report - FY17 Page 19 / 29
These good results may be attributed to a concerted mobilization on the part of education authorities and
communities under the banner of the Literacy Boost project, towards raising community awareness on the
importance of following up at home on schoolwork and also training teachers in accordance with the remedial
plans developed after the FLAT tool assessment.
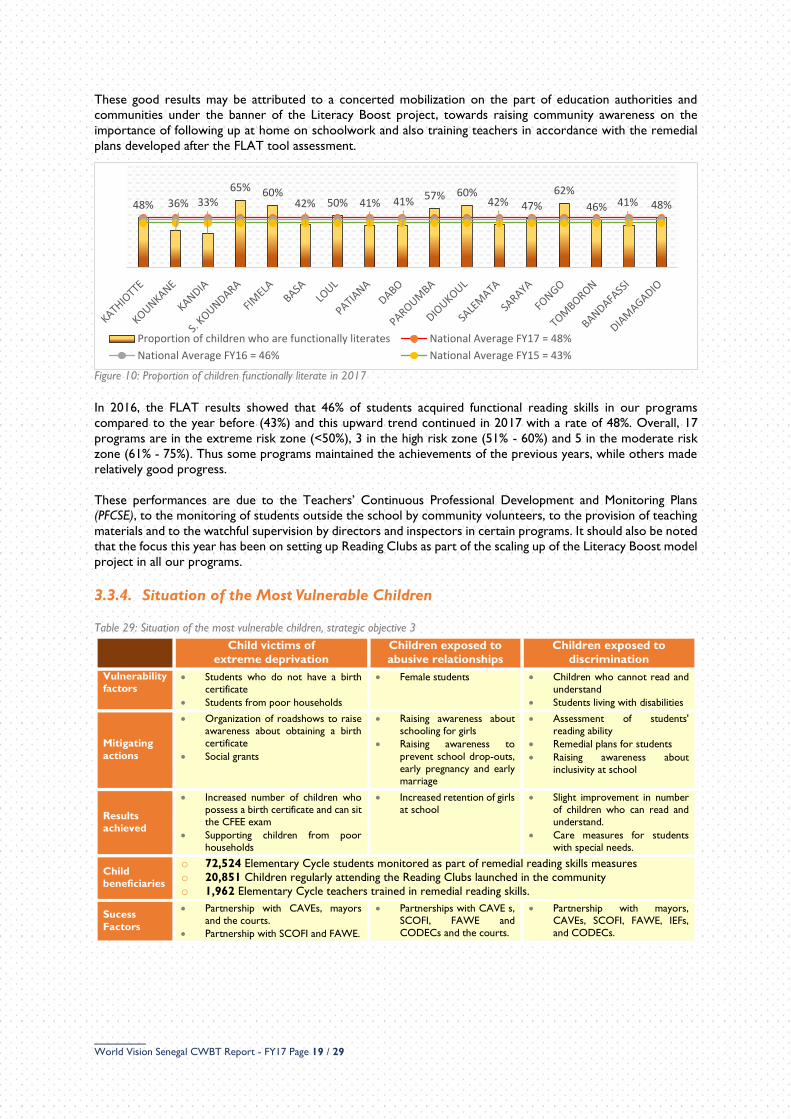
Figure 10: Proportion of children functionally literate in 2017
In 2016, the FLAT results showed that 46% of students acquired functional reading skills in our programs
compared to the year before (43%) and this upward trend continued in 2017 with a rate of 48%. Overall, 17
programs are in the extreme risk zone (<50%), 3 in the high risk zone (51% - 60%) and 5 in the moderate risk
zone (61% - 75%). Thus some programs maintained the achievements of the previous years, while others made
relatively good progress.
These performances are due to the Teachers’ Continuous Professional Development and Monitoring Plans
(PFCSE), to the monitoring of students outside the school by community volunteers, to the provision of teaching
materials and to the watchful supervision by directors and inspectors in certain programs. It should also be noted
that the focus this year has been on setting up Reading Clubs as part of the scaling up of the Literacy Boost model
project in all our programs.
3.3.4. Situation of the Most Vulnerable Children Table 29: Situation of the most vulnerable children, strategic objective 3
Child victims of
extreme deprivation
Children exposed to
abusive relationships
Children exposed to
discrimination
Vulnerability factors
Students who do not have a birth certificate
Students from poor households
Female students Children who cannot read and understand
Students living with disabilities
Mitigating
actions
Organization of roadshows to raise awareness about obtaining a birth certificate
Social grants
Raising awareness about schooling for girls
Raising awareness to
prevent school drop-outs, early pregnancy and early marriage
Assessment of students' reading ability
Remedial plans for students
Raising awareness about inclusivity at school
Results achieved
Increased number of children who possess a birth certificate and can sit the CFEE exam
Supporting children from poor households
Increased retention of girls at school
Slight improvement in number of children who can read and understand.
Care measures for students with special needs.
Child beneficiaries
o 72,524 Elementary Cycle students monitored as part of remedial reading skills measures
o 20,851 Children regularly attending the Reading Clubs launched in the community
o 1,962 Elementary Cycle teachers trained in remedial reading skills.
Sucess
Factors
Partnership with CAVEs, mayors and the courts.
Partnership with SCOFI and FAWE.
Partnerships with CAVE s, SCOFI, FAWE and CODECs and the courts.
Partnership with mayors, CAVEs, SCOFI, FAWE, IEFs, and CODECs.
48% 36% 33%65% 60%
42% 50% 41% 41%57% 60%
42% 47%
62%
46% 41% 48%
Proportion of children who are functionally literates National Average FY17 = 48%
National Average FY16 = 46% National Average FY15 = 43%
_______ World Vision Senegal CWBT Report - FY17 Page 20 / 29
3.3.5. Sustainability & Transition Local ownership: Systematic incorporation of the Decentralization Policy into all stages of program design,
planning, implementation and monitoring. Capacity building of SMCs / Students’ Parents’ Association and
Education Committees of the Communes (local government)
Local partnership: Incorporation of program interventions into Annual Work Plans of the Inspection of
Education and into action plans of the CBO implementing them.
Local and National Advocacy: Design of an Advocacy Plan (national and local) incorporating national
days dedicated to education and implementation of the CVA.
Resilience & Risk Reduction: Grants for students from poor households; training for members of school
governments, CAVE and SCOFI (Female Teachers Association) actions on various themes relating to
protection.
Transformed relationships: Reduction of socio-cultural prejudices against schooling for girls.
3.3.6. Key Lessons and Recommendations
Table 30 : Key Lessons & Recommendations, Strategic Objective 3
Lessons learned Recommendations
Continuous professional development for teachers
in reading didactics is essential to improve learners'
performance
School support for children at community level by
volunteers and at home by parents increases school
performance
Formative observation of teachers in class by the
authorities is necessary to improve the quality of
teaching and learning
The commitment of communities and technical
partners improves the environment for literacy and
contributes to the improvement of school
performance
Support the implementation of remedial plans
in reading comprehension and oral
communication
Support the supervision of children at home
by parents
Strengthen reading resources using locally-
created resources
_______ World Vision Senegal CWBT Report - FY17 Page 21 / 29
3.4. All children are protected from violence, exploitation
and abuse
4: All children are
protected against
violence, exploitation and abuse
Children are cared for in a family and
community environment that is loving
and safe where they can have fun in all security
Goal 1End poverty in all its forms
and everywhere
Children who are respected actors in the decision-making process concerning them
Goal 2 End hunger, ensure food security and improve nutrition and promote sustainable agriculture
S0.4.1: Children benefit from increased protection through the actions of community organizations committed to advocacy and participation in local
government
Children are full of hope and confidence in the future
Goal 3 Ensure healthy lives and promote well-being for all ages
S0.4.2: Children live in communities that give them a platform for expression and participation
Children have a positive relationship with their peers, family members and
communities
Goal 5 Achieve gender equality and empower all women and girls
SO.4.3: Children live in communities which respect
and enforce child protection laws and foster inter-faith dialogue and tolerance
SO.4.4: Children are protected in
emergency situations Children who grow up in their discovery of God's love in an environment that gives them this
freedom
Goal 16 Promote peaceful and inclusive societies for sustainable development, provide access to justice for all and build effective,
accountable and inclusive institutions at all levels
Figure 11: Mapping the strategic goal 3
3.4.1. Introduction The table below shows the relationship between the problems, their root causes and the approaches initiated to
provide appropriate responses to child protection problem.
Table 31: Summary of the chain of logic for strategic objective 4
Issues Root causes Approaches
Low participation of
children in decisions
affecting their lives
Socio-cultural practices that do not
favor the participation of children
Promote and strengthen dialogue by
involving children regarding their
participation issues
_______ World Vision Senegal CWBT Report - FY17 Page 22 / 29
Reluctance to popularize children's
right to participation
Scarcity of amenities for recreation and participation
Child protection sector funding that is
inadequate in relation to the real needs
of children.
Take into account the rights of the
child at all stages of the budgeting
process.
Diversify the offer by introducing socio-educational activities for children
Strengthen children's knowledge
Persistence of socio-
cultural barriers (beliefs
and practices) preventing
the development and
protection of the child
Harmful traditional cultural practices
Misinterpretations of religious texts
Lack of law enforcement
Lack of parental instruction
Sanction violations against children
Training for parents on texts and
regulations
Raising awareness for the adoption of
child welfare practices
Low birth registration
rate at birth
Distance to register offices
Poverty and neglect by parents
Births at homes
Reinforce awareness about the
existence of village ledgers
Valuing existing good practices
3.4.2. Key information Table 32: Key information of strategic objective 4
# Projects
contributing
Spend16
(USD)
% of funding from
different sources17
# Technical
staff
Key partners collaborating in
order to achieve this objective
Total direct
participants
22 2,996,243
Government and
Multilateral 17%
PNS 31%
Sponsorship 53%
10 specialists
1 National
Advisor
Government Technical
Services18.
Communes (i.e. Local Government).
Community-Based Organizations and Local Associations (CAVE, CDPE etc.)
513,146
3.4.3. Results & Analysis In this strategic objective, two indicators have been selected: the proportion of young people who report having
a birth certificate and the proportion of children involved in the decision-making process.
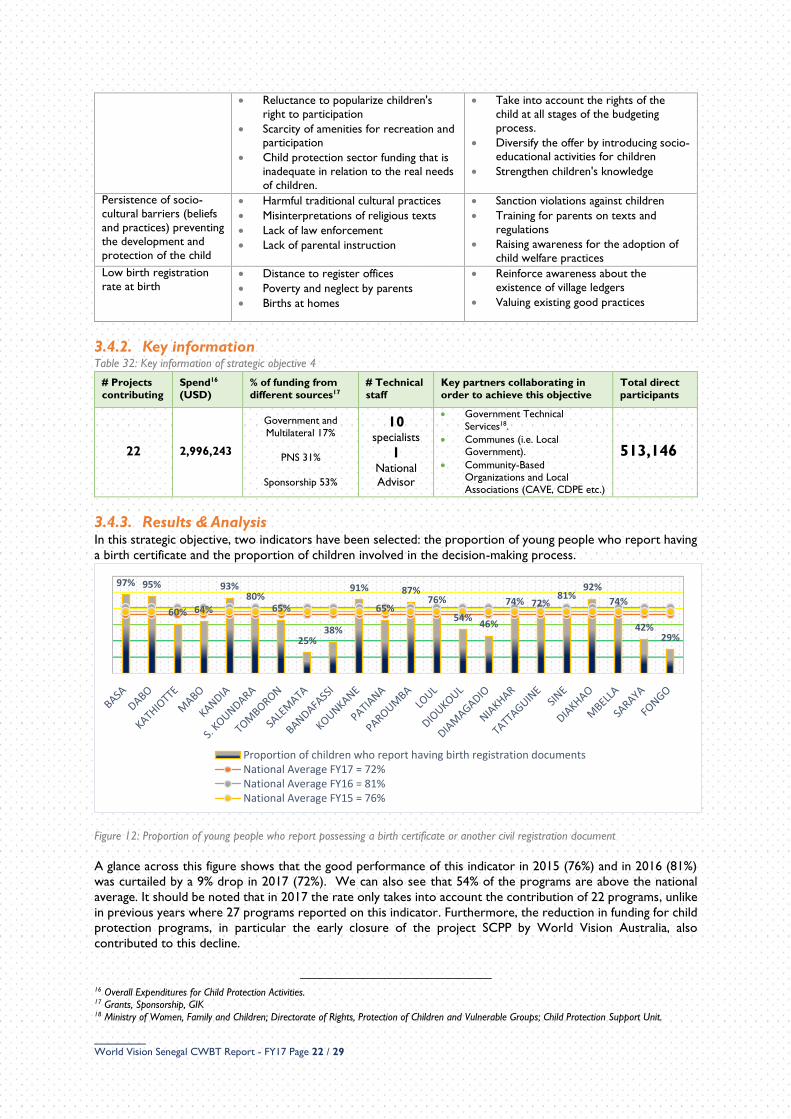
Figure 12: Proportion of young people who report possessing a birth certificate or another civil registration document
A glance across this figure shows that the good performance of this indicator in 2015 (76%) and in 2016 (81%)
was curtailed by a 9% drop in 2017 (72%). We can also see that 54% of the programs are above the national
average. It should be noted that in 2017 the rate only takes into account the contribution of 22 programs, unlike
in previous years where 27 programs reported on this indicator. Furthermore, the reduction in funding for child
protection programs, in particular the early closure of the project SCPP by World Vision Australia, also
contributed to this decline.
16 Overall Expenditures for Child Protection Activities. 17 Grants, Sponsorship, GIK 18 Ministry of Women, Family and Children; Directorate of Rights, Protection of Children and Vulnerable Groups; Child Protection Support Unit.
97% 95%
60% 64%
93%80%
65%
25%38%
91%
65%
87%76%
54%46%
74% 72%81%
92%
74%
42%29%
Proportion of children who report having birth registration documentsNational Average FY17 = 72%National Average FY16 = 81%National Average FY15 = 76%
_______ World Vision Senegal CWBT Report - FY17 Page 23 / 29
However, this 9% decrease must not be allowed to negate the efforts of programs in this area. This year, 521
Local Child Protection Committees were established at community level to prevent and respond to exploitation,
neglect, abuse and all other forms of violence against children. From 196 committees in 2015, the number
increased to 492 in 2016 and 521 in 2017, all in all benefitting 24,790 children. This performance is the result of
the actions carried out jointly by World Vision Senegal, the authorities and the communities. Actions centered
on capacity building, advocacy, social mobilization campaigns and support for the birth registration system.
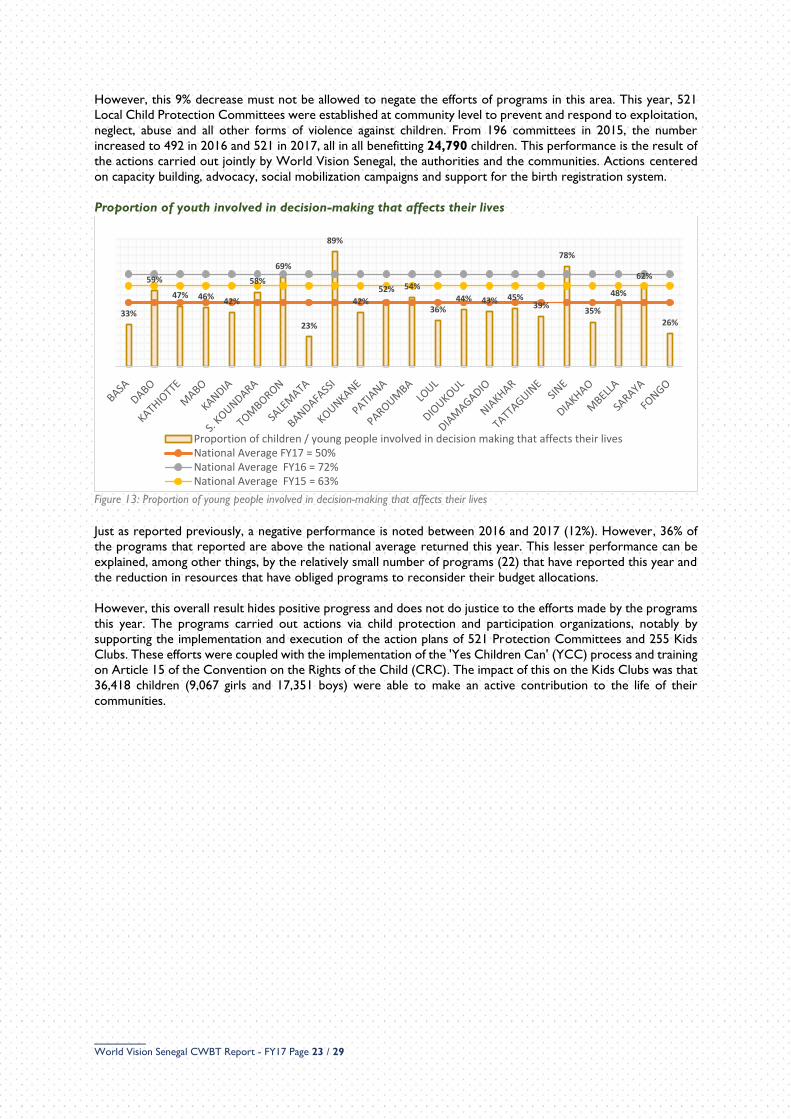
Proportion of youth involved in decision-making that affects their lives
Figure 13: Proportion of young people involved in decision-making that affects their lives Just as reported previously, a negative performance is noted between 2016 and 2017 (12%). However, 36% of
the programs that reported are above the national average returned this year. This lesser performance can be
explained, among other things, by the relatively small number of programs (22) that have reported this year and
the reduction in resources that have obliged programs to reconsider their budget allocations.
However, this overall result hides positive progress and does not do justice to the efforts made by the programs
this year. The programs carried out actions via child protection and participation organizations, notably by
supporting the implementation and execution of the action plans of 521 Protection Committees and 255 Kids
Clubs. These efforts were coupled with the implementation of the 'Yes Children Can' (YCC) process and training
on Article 15 of the Convention on the Rights of the Child (CRC). The impact of this on the Kids Clubs was that
36,418 children (9,067 girls and 17,351 boys) were able to make an active contribution to the life of their
communities.
33%
59%
47% 46%42%
58%
69%
23%
89%
42%
52% 54%
36%44% 43% 45%
39%
78%
35%
48%
62%
26%
Proportion of children / young people involved in decision making that affects their livesNational Average FY17 = 50%National Average FY16 = 72%National Average FY15 = 63%
_______ World Vision Senegal CWBT Report - FY17 Page 24 / 29
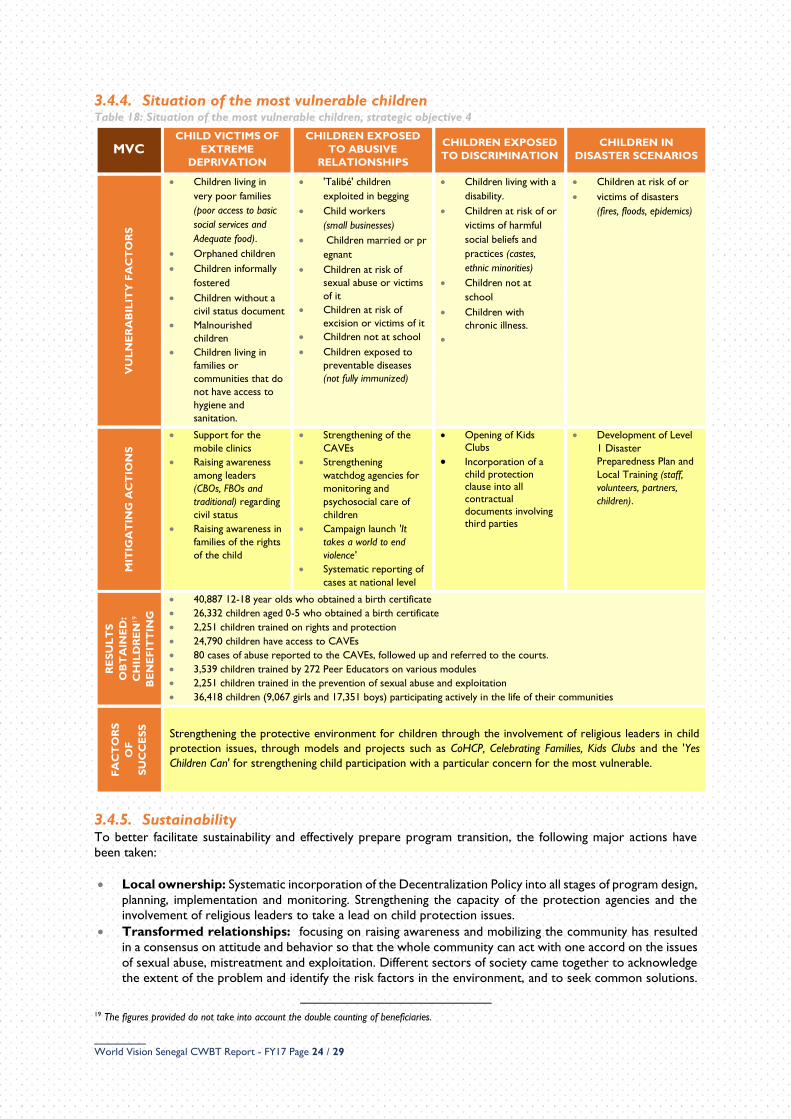
3.4.4. Situation of the most vulnerable children Table 18: Situation of the most vulnerable children, strategic objective 4
MVC
CHILD VICTIMS OF
EXTREME
DEPRIVATION
CHILDREN EXPOSED
TO ABUSIVE
RELATIONSHIPS
CHILDREN EXPOSED
TO DISCRIMINATION
CHILDREN IN
DISASTER SCENARIOS
VU
LN
ER
AB
ILIT
Y F
AC
TO
RS
Children living in
very poor families
(poor access to basic
social services and
Adequate food).
Orphaned children
Children informally
fostered
Children without a
civil status document
Malnourished
children
Children living in
families or
communities that do
not have access to
hygiene and
sanitation.
'Talibé' children
exploited in begging
Child workers
(small businesses)
Children married or pr
egnant
Children at risk of
sexual abuse or victims
of it
Children at risk of
excision or victims of it
Children not at school
Children exposed to
preventable diseases
(not fully immunized)
Children living with a
disability.
Children at risk of or
victims of harmful
social beliefs and
practices (castes,
ethnic minorities)
Children not at
school
Children with
chronic illness.
Children at risk of or
victims of disasters
(fires, floods, epidemics)
MIT
IGA
TIN
G A
CT
ION
S
Support for the
mobile clinics
Raising awareness
among leaders
(CBOs, FBOs and
traditional) regarding
civil status
Raising awareness in
families of the rights
of the child
Strengthening of the
CAVEs
Strengthening
watchdog agencies for
monitoring and
psychosocial care of
children
Campaign launch 'It
takes a world to end
violence'
Systematic reporting of
cases at national level
Opening of Kids
Clubs
Incorporation of a
child protection clause into all contractual
documents involving third parties
Development of Level
1 Disaster
Preparedness Plan and
Local Training (staff,
volunteers, partners,
children).
RE
SU
LT
S
OB
TA
INE
D:
CH
ILD
RE
N19
BE
NE
FIT
TIN
G
40,887 12-18 year olds who obtained a birth certificate
26,332 children aged 0-5 who obtained a birth certificate
2,251 children trained on rights and protection
24,790 children have access to CAVEs
80 cases of abuse reported to the CAVEs, followed up and referred to the courts.
3,539 children trained by 272 Peer Educators on various modules
2,251 children trained in the prevention of sexual abuse and exploitation
36,418 children (9,067 girls and 17,351 boys) participating actively in the life of their communities
FA
CT
OR
S
OF
SU
CC
ES
S
Strengthening the protective environment for children through the involvement of religious leaders in child
protection issues, through models and projects such as CoHCP, Celebrating Families, Kids Clubs and the 'Yes
Children Can' for strengthening child participation with a particular concern for the most vulnerable.
3.4.5. Sustainability To better facilitate sustainability and effectively prepare program transition, the following major actions have
been taken:
Local ownership: Systematic incorporation of the Decentralization Policy into all stages of program design,
planning, implementation and monitoring. Strengthening the capacity of the protection agencies and the
involvement of religious leaders to take a lead on child protection issues.
Transformed relationships: focusing on raising awareness and mobilizing the community has resulted
in a consensus on attitude and behavior so that the whole community can act with one accord on the issues
of sexual abuse, mistreatment and exploitation. Different sectors of society came together to acknowledge
the extent of the problem and identify the risk factors in the environment, and to seek common solutions.
19 The figures provided do not take into account the double counting of beneficiaries.
_______ World Vision Senegal CWBT Report - FY17 Page 25 / 29
As a result, 80 cases of abuse involving children have been pursued as far as the courts. This outlook was
reinforced by a community dialogue moderated by religious leaders through the CoH CP. It supports the
community members in the transformation of attitudes, questioning harmful social norms, strengthening of
positive action for children, taking action based on common solutions and using community resources.
Local partnership: Systematic incorporation of protection interventions into the system put in place by
the State (CDPE, CLPE; villagers Committee or neighborhood committees of Child Protection in
intervention zones) to contribute to the improvement of child protection services and the strengthening of
protection systems that aligns with the SNPE (Child Protection National Strategy) adopted in December
2013.
National and Local Advocacy: Design of an Advocacy Plan (national and local) incorporating campaigns
and national days dedicated to protection. Searching for synergistic and complimentary projects between
civil society organizations and the State. WV is a member of the national intersectoral committee for the
protection of the child and plays an active role in the coordination of civil society organizations in its capacity
of a supporter and influencer of the Government on issues of protection.
Resilience & Risk Reduction: Manifested in the implementation of the Disaster Preparedness Working
Plan Level 1 in child protection that enables all parties to know and understand their roles and
responsibilities in disaster-related child protection.
3.4.6. Key Lessons & Recommendations
Table 33 : Lessons learned and recommendations for Strategic Objective 4
Lessons learned Recommendations
Collaboration with research institutions on
systems and approaches reinforced by a
funding mechanism including donors and
public authorities significantly strengthens
progress in child protection.
Strengthening children's ability to protect
themselves and their peers is a guarantee of
the effectiveness and sustainability of
community-based child protection
mechanisms.
A proper diagnosis and awareness of informal
mechanisms is a prerequisite for the
functionality of the community child
protection system.
Prioritize action research on child protection
systems and mechanisms and document the impact
of innovative approaches that can be shared (CoH
CP)
Popularize YCC approaches and Article 15 of the
CRC in all programs
Scale up local child protection agencies (CVPE,
CQPE, CCPE, CDPE)
4. ADVOCACY (National and local) 4.1. Introduction Advocacy provides World Vision Senegal with the opportunity to ‘give voice to the most vulnerable children to make
their needs visible, and urge policymakers to take action’. The third imperative of 'Our Promise 2030' urges us to
collaborate and advocate for a broader impact. With the impact of advocacy - change brought about by policy
influence and citizen empowerment - programs will be sustainable and equipped to tackle the underlying causes
of poverty thereby enabling us to reach the target recipients of the strategy (8 million).
This year, advocacy led by World Vision Senegal focused on a national advocacy plan incorporating all key sectors:
health & nutrition, economic development, education, child protection and the national campaign ‘Together for a
Senegal Without Child Marriage’. At national level, thanks to the work carried out by the SUN platform to exert
an influence, in which World Vision Senegal plays a key role, the Government of Senegal has increased the budget
devoted to nutrition, bringing benefits to 2.7 million children. This result crowns the many efforts made by the
programs at local level through the CVAs.
4.2. Key Partners The achievements of World Vision Senegal in the field of advocacy could not have been possible without the
collaboration and support of the various partners that we meet with at national and local level. At national level,
partnerships are forged with the State, financial & technical partners, NGOs & national associations and in
_______ World Vision Senegal CWBT Report - FY17 Page 26 / 29
coalitions. At local level, the partnership is built with the decentralized technical services of the State, the town
halls and the Community-Based Organizations.
4.3. Flagship activities & advocacy results
Following lessons learned from the past year (2016), WVS has rolled out its national advocacy plan. Some high-
profile activities produced some rather gratifying results.
Flagship activities:
o WVS organized and participated in a televised debate on Senegal’s national TV channel on the subject of
ending violence against children and in particular ending child marriage in Senegal, while also advocating
strongly for the adoption of the new Children’s Code.
o Children from WVS programs had the chance to present their concerns to the President of the Republic
and to the Ministerial Advisor/global artist Youssou Ndour.
o Development of two collections on norms and standards for local advocacy: one on WASH and child
protection services and another on norms and standards of child protection endorsed by the Ministry of the
Family.
Some key results o 100% of programs implement advocacy at local level with the CVA approach;
o 2,113 World Vision advocacy supporters;
o More than 4 million people following World Vision's messages against child marriage through the popular
youth oriented TV show ‘Sen P'tit Galé’;
o CESE supporting World Vision to fight child marriages;
o 2,700,170 children benefit from a budget increase allocated to nutrition thanks to the advocacy carried out
by the SUN platform in which WVS plays a key role;
o Commitment of celebrities to join the campaign against violence against children, especially the fight against
child marriage and other child wellbeing causes: Youssou Ndour (superstar artist and Ministerial Advisor),
Daara J Family (International Rap Group), Coumba Gawlo Seck (internationally renowned artist), Sister Fa
(internationally acclaimed artist).
5. Disaster Management WVS managed two emergency cases during fiscal year 2016 and worked to build the capacity of its staff during
the 2017 fiscal year. For 2016, two major emergencies arose in the Central and South zones where WV Senegal
is active. The tables below show more details about WV Senegal's response in collaboration with local authorities
and beneficiaries.
Description of the disaster
Torrential rains caused terrible damage in Malem
Hoddar, located in the Kaffrine area. More than
10,000 people were severely affected by the floods,
cutting many families off from their homes and their
livelihoods and wiping out their food stocks and
crops. With funding from UK-based World Vision
Start Fund, local authorities and local residents
worked together to put in place an emergency plan
to support victims:
Prolonged drought conditions continued to affect
parts of Senegal. The dual purpose of this project
was to contribute to community resilience by
improving the management of grain banks and
strengthening their capacity to stockpile formidable
resources that would have an effective impact in
emergency scenarios. The project thus assisted
communities cope with the current drought
conditions they were facing, but also helped them to
become more resilient to future events.
Kaffrine / Malem Hoddar Intervention
zone
Mabo / Fimela / Dabo /
Guiré Yero Bocar
$ 191,000 Budget (USD) $ 63,453
10,000 people Beneficiaries 10,500 people
1,666 households received up to $ 76
to be able to feed themselves for a
month;
386 emergency hygiene kits handed
out (kettles, bucket, bleach, soap,
washing powder);
1,631 mats distributed.
WV Senegal
Response
1,200 households will benefit from
bolstering their village cereal bank through
these measures:
Supporting cereal banks to maintain
sufficient stockpiles, helping to cope
with food crises;
_______ World Vision Senegal CWBT Report - FY17 Page 27 / 29
Implementing long-term systems to
ensure the availability of grain stockpiles
in existing banks.
Notes: The criteria for granting loans have been set by Vision Fund Senegal for the eligibility of cereal bank
management committees. Eight such committees were put forward in the Central Zone and four in the Southern
Zone, operating on a full cost recovery basis through the 'Village Security Stocks' project. World Vision Senegal
staff have been equipped with powerful technology to improve their responsiveness to this project and the future
challenges of food insecurity. The Last Mile Mobile Solution (LMMS) software was the tool of choice for executing,
tracking and reporting all distribution efforts, as well as collecting data on recipient/target demographics.
For fiscal year 2017, three major activities were conducted in preparation for emergency response and resilience
activities relating to food security.
Strengthening the capacity of the National Office
An emergency simulation session (Simex) and a series of training exercises on international and global
humanitarian management were held. This activity is part of the process of raising the bar for disaster
management at the World Vision Senegal National Office. In this Simex scenario, the ‘slow onset’ scenario, such
as a food crisis situation following rainfall deficit over a given period, and the scenario of a ‘rapid onset’ such as
a flood, made it possible for participants to become acquainted with both the orthodox format of response
management and the rapid triggering of fast-track management of an emergency response.
Capacity building for conflict resolution
In view of the recent acts of terrorism in the sub region, World Vision Senegal has adopted a pre-emptive stance
by backing capacity building for religious leaders. Through workshops, religious leaders of various faiths have
been trained in the management and resolution of community conflicts.
Community Disaster Prevention Plans
The training of the WVS partner communities has enabled 31 municipalities to identify the disasters to which
they are exposed and to develop their prevention plan.
Table 34: Lessons learned and emergency relief recommendations
Lessons learned Recommendations
The participation of communities and
technical services in implementation has
contributed to project ownership and
transparency.
A complaints mechanism for local people
facilitated invaluable feedback on the orderly
conduct of projects.
The use of LMMS has significantly improved
distribution and reporting.
Training on community disaster prevention
plans has raised awareness among
communities.
Consolidate and reinforce the achievements
with the administrative and local authorities in
the sharing of information, documentation and
project monitoring of the responses.
Strengthen national capacities and systematize
the use of LMMS.
Encourage municipalities to earmark a budget
for their disaster prevention plan.
6. Development Programs Approach (DPA) Since 2014, WV Senegal has implemented a new operating model that gives more responsibility20 to communities
and local authorities21 supported by the State technical services. WV Senegal Sectorial Specialists staff (education,
health, economic development, child protection.) play a role of facilitation, coaching and technical support. However,
with the advent of LEAP 3, the operating model will be updated in light of the Partnership's overall strategy ‘Our
Promise 2030’.
20 Through the Community-Based Organizations that are responsible for implementing the programs. 21 Local government which is the delegator of powers transferred by the State of Senegal through the decentralization policy.
_______ World Vision Senegal CWBT Report - FY17 Page 28 / 29
6.1. Accountability in the community Under the Mayor's leadership and with the participation of all stakeholders, concerted planning is undertaken at
the beginning of each fiscal year. Once the action plan has been approved and the necessary recruitments made,
then agreements are signed relating to finance and contracts covering assignments, actions or companies
depending on the nature of the activity and the implementing partner. In terms of accountability to communities,
this endeavor is the subject of extensive consultation with the various stakeholders. Any change in programming
is also shared, discussed and agreed. In the follow-up phase, regular meetings (quarterly and monthly) are held
with the various actors to review implementation, draw lessons and make adjustments as needed. All our 24 APs
went through this process.
6.2. Participation of children in program design, monitoring and evaluation In all phases of conception and monitoring, the participation of children is accomplished through the various
forms of associations that are in place (School Government, Kids Clubs, Educational Communities etc.) where children
demonstrate a great capacity for adaptation and creativity.
6.3. Work with partners Programs implementation calls for the participation of all the actors (community and technical) under the leadership
of local government through consultations frameworks. At national level, the partnership is substantiated by the
agreements of the strategic sectors with the Ministries concerned, agreements with which are passed down to
the regions to ensure they are enacted effectively and produce a conscientious and coherent implementation of
our various undertakings. These agreements are evaluated annually and adjustments are made as needed.
6.4. Key lessons from the implementation of DPA The major lesson that can be learned from the DPA is that WVS cannot in any way promote transformational
development alone. The involvement of all the community partners, the decentralized technical services of the
State, and the technical and financial partners is imperative to ensure community ownership and sustain the
progress made. To achieve this, WVS has opted for a modus operandi devolving more responsibilities to local
collectives and CBOs. However, this route is not free of challenges, such as the mobilization of counterparts for
large projects, the procedures that condition the deliverables, the strictness of respect for commitments by the
various partners, etc.
6.5. Recommendations for improvement These few recommendations are identified to improve the approach:
Capacity building for all partners on various critical issues;
Development of reference documents and simplification of WVS procedures;
Ensure the implementing CBOs are fit for purpose in terms of sustainability and ownership;
Strengthen relations between technical services, local authorities and CBOs;
More generally, it will be necessary to revisit the modus operandi to improve it if necessary and allow it to fulfill
all its promises for an effective contribution to the increased well-being of children and their families, with
communities fully engaged in the development activities that affect them. This action is planned in the LEAP3
process.
_______ World Vision Senegal CWBT Report - FY17 Page 29 / 29
Conclusion & Recommendations In figures, here is how Word Vision Senegal’s interventions during this year have contributed to
improving the well-being of children:
In terms of health, the rate of completeness of the four PNCs has fluctuated from 39% in FY15 to 67% in
FY16 and 47% in FY17, which is still below the 65% benchmark set by the Government. Regarding the
proportion of children who are underweight, 81% of our programs have a rate above the national target of
10%.
With regard to livelihoods and resilience, the proportion of households with a secondary source of income
increased from 50% to 55% in FY16 and fell back to 44% in FY17. The percentage of households that
experienced one or more lean months (hunger) in the last 12 months increased from 83% in FY15 to 87%
in FY16 and 91% in FY17. The percentage of households with a secondary source of income increased
from 50% to 55% and fell back to 44% over the same period. However, consistent efforts have been made
in this area specifically in scaling up Saving Groups.
In the field of education, the CFEE success rate increased from 37.97% in 2015 to 45% in 2016 and 52%
in 2017, and the proportion of children able to read (as measured by the FLAT tool) has risen from 42.76%
to 45.81% and 48% during the same period.
Finally, in the area of child protection and participation, the proportion of young people who report having
a civil registration document went from 76% in 2015 to 81% in FY16 and back down to 72% in FY17. The
proportion of children/youth involved in decision-making that affects their lives fluctuated from 63% to 76%
to 50% over the same period.
To maintain and improve these achievements, recommendations for World Vision Senegal include:
Prioritize action research on child protection systems and mechanisms and document the impact of
innovative approaches that can be shared (CoH CP)
Extend coverage to nutrition sites in all programs and support IEC / BCC activities for the establishment
of handwashing points in households, schools and health facilities
Continue the SG Scaling Strategy
Support the implementation of remedial plans in reading comprehension and oral communication.
Support the supervision of children at home by parents
Strengthen reading materials using locally-created resources
World Vision Senegal has in place a strategy that covers the period 2016 -2021 which is aligned with
the new global strategy ‘Our Promise 2030’ for the current period. In addition, WVS has also just
commenced the implementation of the new programmatic approach (LEAP 3) that will be the
foundation on which the organization's interventions for the well-being of 8 million children in Senegal
will be based. Looking to the future, World Vision Senegal’s current Strategy will be need to be reviewed
before 2021 to both continue the direction already underway and also to implement additional
elements included in the 'Our Promise 2030' strategy to ensure alignment with this global strategy.