Embed Size (px)
Citation preview

Childhood ObesityChildhood Obesityis is
the Ultimate Health Disparitythe Ultimate Health Disparity
Robert Murray MDCenter for Healthy Weight & Nutrition
Columbus Children’s HospitalThe Ohio State University

So, How are we doing So, How are we doing with Obesity? with Obesity?
19961991
Obesity Trends* Among U.S. AdultsBRFSS, 1991, 1996, 2004
(*BMI 30, or about 30 lbs overweight for 5’4” person)
No Data <10% 10%–14% 15%–19% 20%–24% ≥25%
2004

Prevalence of ObesityPrevalence of Obesityin the U.S. (1999-2004)in the U.S. (1999-2004)
• Obese 32.2%• Overweight 66.3%• Kids
– 33.6% “at risk”– 17.1% “overweight”
All agesAll agesBoth sexesBoth sexesAll ethnic groupsAll ethnic groupsAll socioeconomic levelsAll socioeconomic levels
JAMA 2006; 295:1549

Extreme Obesity
BMI > 40
White African-American
Hispanic
1999-2000 4.0% 9.8% 3.9%
2001-2002 4.9% 8.1% 4.5%
2003-2004 4.3% 10.5% 4.5%
Ogden, JAMA 2006;295:1549Adult Population 20 yrs and olderAdult Population 20 yrs and older

Extreme Obesity
BMI > 40
White African-American
Hispanic
1999-2000 4.9% 15.0% 5.5%
2001-2002 6.0% 11.9% 5.8%
2003-2004 5.8% 14.7% 7.8%
Ogden, JAMA 2006;295:1549Adult Adult WomenWomen 20 years and older 20 years and older

Overweight in Americayoung adults 20-39 yrsyoung adults 20-39 yrs
BMI 25
BMI 30
BMI 40
2000 2004 2000 2004 2000 2004
All 57.6 57.1 26.0 28.5 4.5 5.4
Cauc 55.2 52.5 23.2 25.5 3.5 4.8
Af Am
62.2 69.7 36.8 41.9 8.7 11.7
Mex Am
64.9 71.2 30.5 34.0 3.4 4.7
Ogden et al JAMA 2006:295:1549

The Trend of Childhood Obesity
4 fold increase over 40 years

First, adults withmoderate obesity
Then extreme obesity
then young adults
then teens
then school aged
then pre-school& toddlers
and now --diabetes & metabolic syndrome
First, in adults
then teens…
a tsunami of risk

Overweight American ChildrenOverweight American Childrenpercent > 95% ile
2-5 yrs
6-11 yrs
12-19 yrs
2000 2004 2000 2004 2000 2004
White 8.7 11.5 11.7 17.1 11.4 17.3
Black 8.7 13.0 19.6 22.0 23.1 21.8
Mex Am
10.9 19.2 23.4 22.5 23.2 16.3
Ogden et al, JAMA 2006; 295:1549
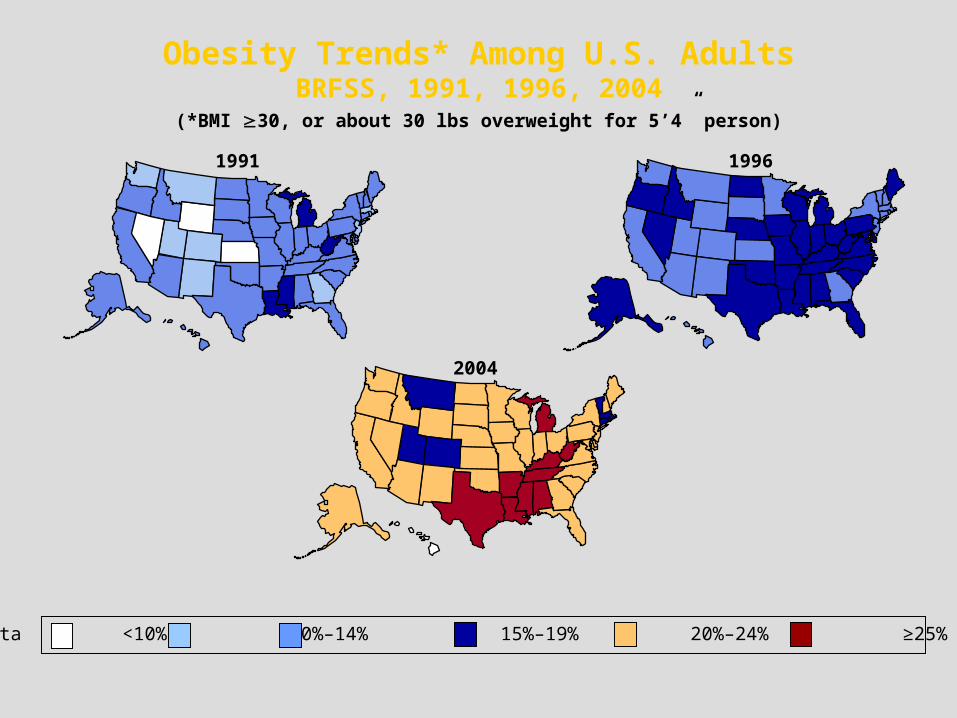
Medical Consequences of Obesity
Medical Consequences of Obesity
• Psychosocial• Cardiovascular
– Lipidemia– Diabetes
mellitus– Hypertension– Respiratory– Cardiac
• Psychosocial• Cardiovascular
– Lipidemia– Diabetes
mellitus– Hypertension– Respiratory– Cardiac
• Medical– Polycystic ovary
disease– Gall bladder disease– Osteoarthritis– Cancer– Steatohepatitis
• Mortality
• Medical– Polycystic ovary
disease– Gall bladder disease– Osteoarthritis– Cancer– Steatohepatitis
• Mortality
Diseases that begin in childhoodDiseases that begin in childhood amplify morbidity – and costs amplify morbidity – and costs

Overweight in AdolescenceOverweight in Adolescence-- -- Mortality in Middle AgeMortality in Middle Age
• Nurses Health Study II (n = 102,400)
• Followed 22-49 yr olds 1989 – 2001
• Non-smokers BMI at 18 yrs by recall
Adiposity in adolescenceis associated
with premature death in younger and middle-aged U.S. women
Van Dam, Ann Intern Med 2006; 145:91

The Relationship between BMI and Medical Complications

Risks for Metabolic SyndromeRisks for Metabolic SyndromeAfrican American ChildrenAfrican American Children
• obesity high blood glucose abdominal girth• hypertension high triglycerides
• Screened: 385 for BMI and 90 for metabolic syn
• MS in 3-6th grade in urban Chicago?– Total with risk factors for MS = 5.6%– In > 95th % BMI group = 13.8%
• 57% 1 risk factor• 33.3% 2 risk factors• 13.8% > 3 risk factors
* Used 110 mg/dL value for fasting glucose Braunschweig, Am J Clin Nutr 2005: 81:970

Co-morbidites & Co-morbidites & Extreme ObesityExtreme Obesity
• 75% have > 1 related medical comorbidity
• 7 times the normal risk of diabetes
• 6 times the risk of hypertension
• 4 times the risk of arthritis
• 3 times the risk of asthma
• 4 times the risk of only fair to poor health
• 2 times the risk of all-cause mortality
Hensrud, Mayo Clin Proc 2006:81:s5
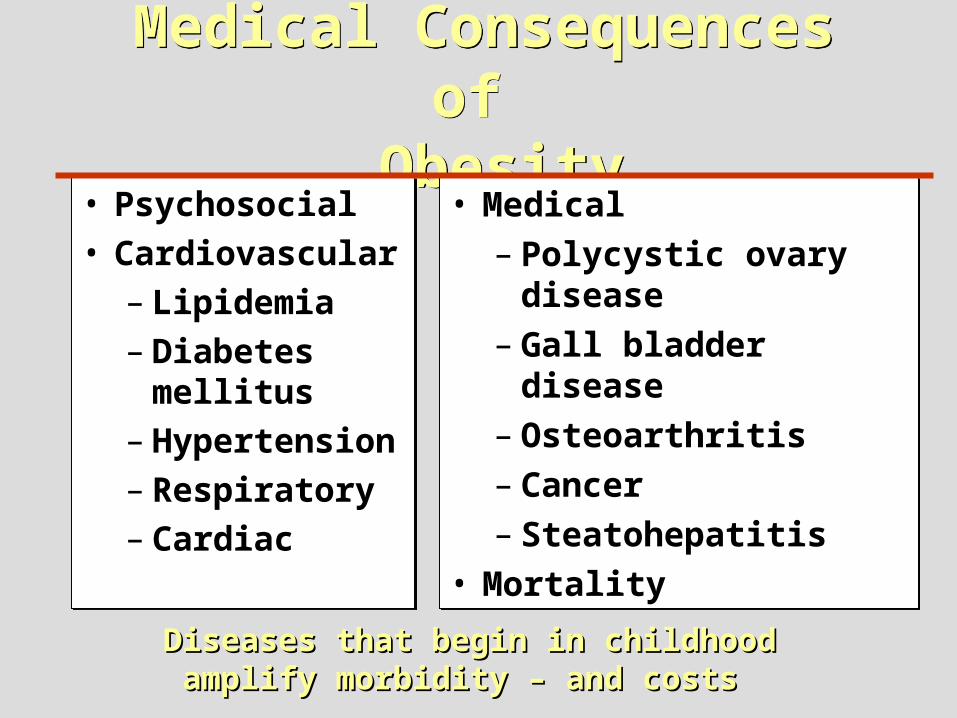
Health care CostsHealth care Costs & Extreme Obesity
• Obesity associated with more cost than any other medical condition
• 5-7% of total medical expenditures• $75 million direct; $139 billion total costs• 36-39% higher health care costs • Extreme obesity
– 81% higher costs – accounts for $11billion in direct costs– Among employed in U.S., the 3% with extreme
obesity account for 21% of costs
Hensrud, Mayo Clin Proc 2006:81:s5

Obesity & Psychological IssuesObesity & Psychological Issues
• Victimization/ bullying• Sense of alienation• Depression• Behavioral problems• Lifelong low quality of life• Low self-esteem
A cycle of food, depression and inactivity

Adolescents with Extreme ObesityAdolescents with Extreme ObesityMental HealthMental Health
• N = 33 for by-pass surgery• PedsQL and Beck Depression Inventory• Results:
– 52% minimally depressed (self report)– 33% clinically depressed– 45% clinically depressed (maternal report)– 21% were being treated– Depression spanned all domains of BDI
• Physical, emotional, social, school, psychosocial, and total
Zeller, Pediatrics 2006; 117:1159
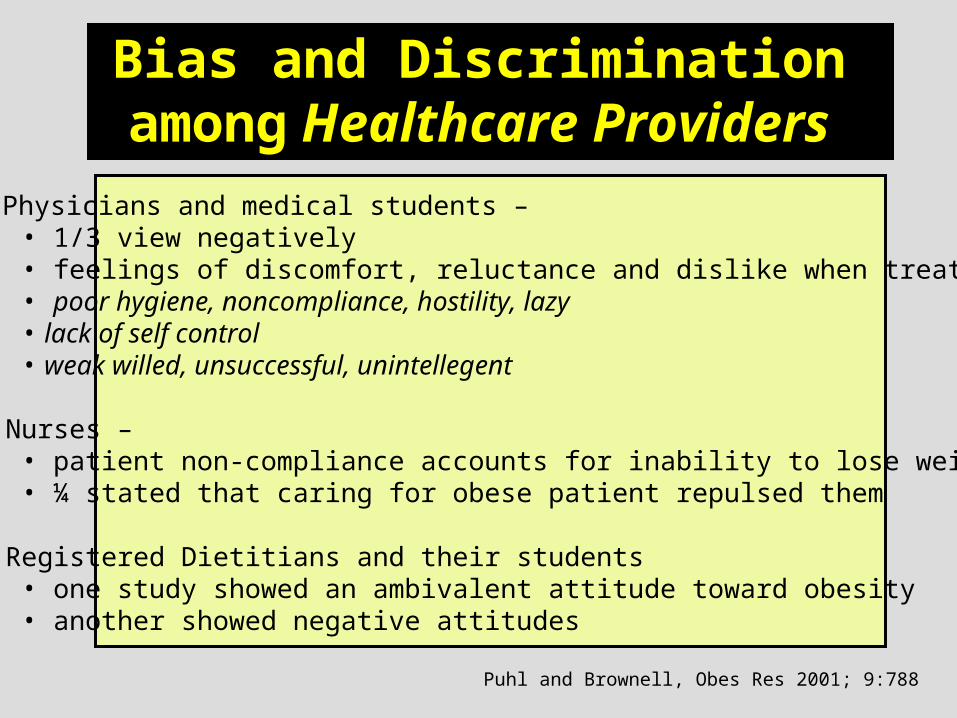
Bias and Discrimination Bias and Discrimination amongamong Healthcare Providers Healthcare Providers
• Physicians and medical students – • 1/3 view negatively• feelings of discomfort, reluctance and dislike when treating• poor hygiene, noncompliance, hostility, lazy • lack of self control• weak willed, unsuccessful, unintellegent
• Nurses – • patient non-compliance accounts for inability to lose weight• ¼ stated that caring for obese patient repulsed them
• Registered Dietitians and their students• one study showed an ambivalent attitude toward obesity• another showed negative attitudes
Puhl and Brownell, Obes Res 2001; 9:788

The Second WaveThe Second Wave
Diabetes &Diabetes &Metabolic SyndromeMetabolic Syndrome

Prevalence of Diabetes in U.S.–Prevalence of Diabetes in U.S.– 1990 to 20011990 to 2001
21 million people/ 7% of the population21 million people/ 7% of the population1 in 3 children born in 2000 face T2DM1 in 3 children born in 2000 face T2DM
Narayan, JAMA 2003; 290:1884

In New York City In New York City Diabetes is a Serious ThreatDiabetes is a Serious Threat
• 800,000 cases in NYC– 550,000 diagnosed– 250,000 undiagnosed
• Poverty rate 20.3%– National rate 12.7%
• Growing Hispanic and Asian populations
• High African-American population

Life-years Life-years lostlost to to Diabetes Diabetes
• If diagnosed at age 40 years– White male: 11 yrs female: 13.5
yrs– Hispanic male: 11.5 yrs female: 12.4 yrs – Black male: 13 yrs female: 17
yrs
• If diagnosed at age 10 years– White male: 16.5 yrs female: 18 yrs– Hispanic male: 19 yrs female: 16 yrs– Black male: 22 yrs female: 23 yrs
National Health Interview Survey -- Narayan, JAMA 2003; 290:1884