Embed Size (px)
Citation preview
CHILDREN AND FAMILIES FIRST COMMISSIONOF VENTURA COUNTY
A Component Unit of the County of Ventura
Financial Statements for the YearsEnded June 30, 2013 and 2012 and
Independent Auditors’ Report
Fanning & Karrh
Certified Public Accountants
A Professional Corporation
CHILDREN AND FAMILIES FIRST COMMISSION OF VENTURA COUNTYA Component Unit of the County of Ventura
Table of Contents
Financial Section Page
Independent Auditors' Report………………………………………………..….. 1 - 2
Management's Discussion and Analysis…………………………………..…… 3 - 9
Basic Financial Statements:Government-Wide Financial Statements:Statements of Net Position as of June 30, 2013 and 2012…………………. 10Statements of Activities for the Years Ended June 30, 2013 and 2012…. 11 - 12
Governmental Fund Financial Statements:Balance Sheet - Governmental Funds as of June 30, 2013.……………… 13Balance Sheet - Governmental Funds as of June 30, 2012.……………… 14Statement of Revenues, Expenditures and Changes in Fund BalanceFor the Year Ended June 30, 2013………………….……………………… 15 - 16
Statement of Revenues, Expenditures and Changes in Fund BalanceFor the Year Ended June 30, 2012……………………………….…….….. 17 - 18
Notes to the Basic Financial Statements…………….…………………………. 19 - 25
Required Supplementary Information
Budgetary Comparison Schedule - Operating Fund………………..….......… 26 - 27
Budgetary Comparison Schedule - Community Investment Loan Fund…… 28
Supplementary Information
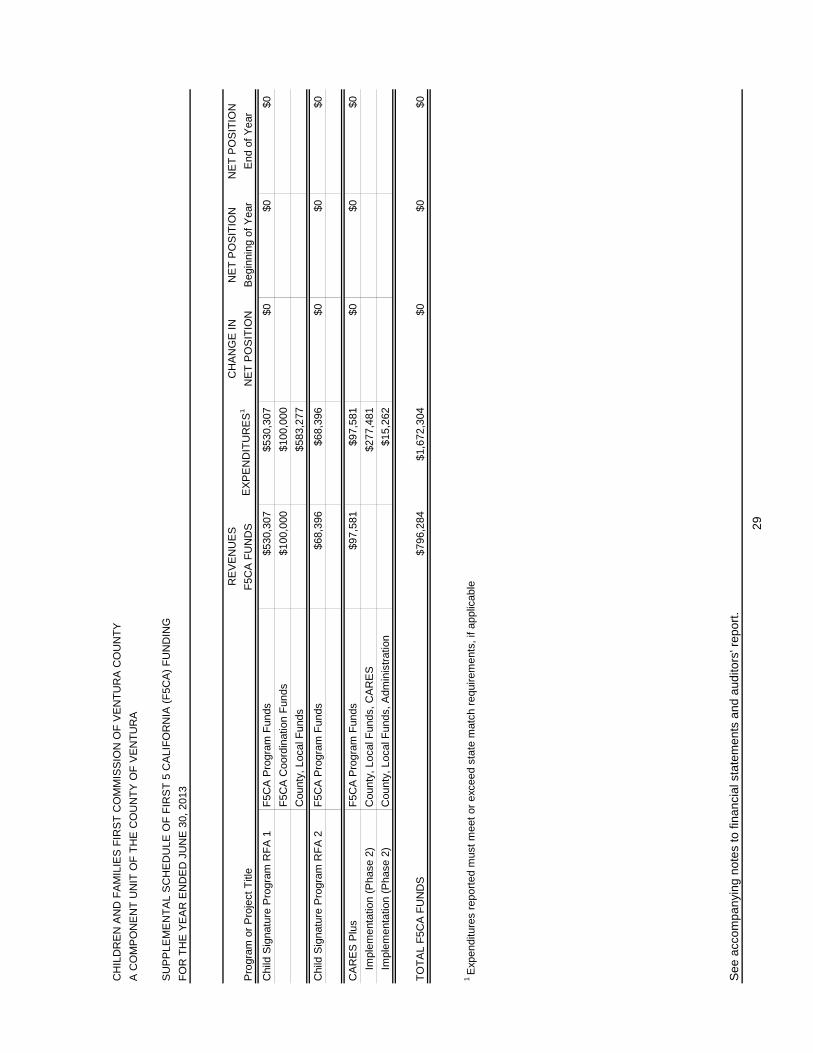
Supplemental Schedule of First 5 California (F5CA) FundingFor the Year Ended June 30, 2013………………….……………………… 29
Other Reports
Report on Internal Control over Financial Reporting and Compliance andOther Matters Based on an Audit of Financial Statements Performedin Accordance with Government Auditing Standards …………………….…. 30 - 31
Independent Auditors' Report on State Compliance………………………..… 32 - 33

FINANCIAL SECTION
3
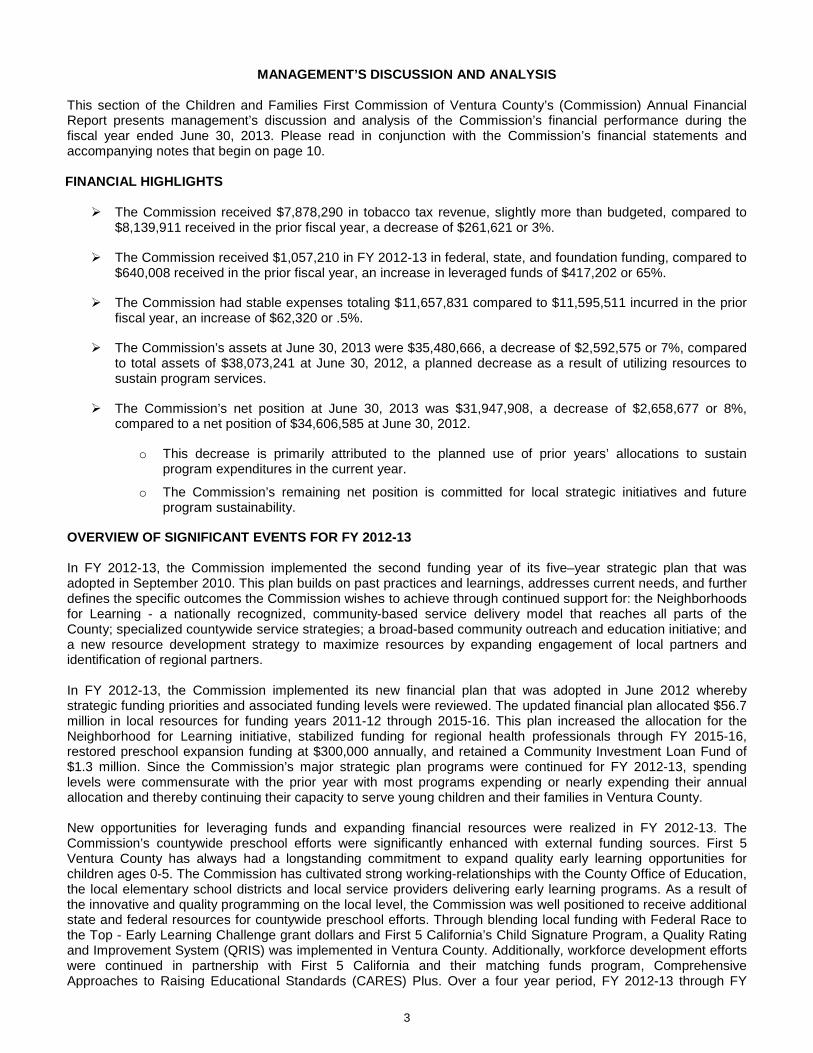
MANAGEMENT’S DISCUSSION AND ANALYSIS
This section of the Children and Families First Commission of Ventura County’s (Commission) Annual FinancialReport presents management’s discussion and analysis of the Commission’s financial performance during thefiscal year ended June 30, 2013. Please read in conjunction with the Commission’s financial statements andaccompanying notes that begin on page 10.
FINANCIAL HIGHLIGHTS
The Commission received $7,878,290 in tobacco tax revenue, slightly more than budgeted, compared to$8,139,911 received in the prior fiscal year, a decrease of $261,621 or 3%.
The Commission received $1,057,210 in FY 2012-13 in federal, state, and foundation funding, compared to$640,008 received in the prior fiscal year, an increase in leveraged funds of $417,202 or 65%.
The Commission had stable expenses totaling $11,657,831 compared to $11,595,511 incurred in the priorfiscal year, an increase of $62,320 or .5%.
The Commission’s assets at June 30, 2013 were $35,480,666, a decrease of $2,592,575 or 7%, comparedto total assets of $38,073,241 at June 30, 2012, a planned decrease as a result of utilizing resources tosustain program services.
The Commission’s net position at June 30, 2013 was $31,947,908, a decrease of $2,658,677 or 8%,compared to a net position of $34,606,585 at June 30, 2012.
o This decrease is primarily attributed to the planned use of prior years’ allocations to sustainprogram expenditures in the current year.
o The Commission’s remaining net position is committed for local strategic initiatives and futureprogram sustainability.
OVERVIEW OF SIGNIFICANT EVENTS FOR FY 2012-13
In FY 2012-13, the Commission implemented the second funding year of its five–year strategic plan that wasadopted in September 2010. This plan builds on past practices and learnings, addresses current needs, and furtherdefines the specific outcomes the Commission wishes to achieve through continued support for: the Neighborhoodsfor Learning - a nationally recognized, community-based service delivery model that reaches all parts of theCounty; specialized countywide service strategies; a broad-based community outreach and education initiative; anda new resource development strategy to maximize resources by expanding engagement of local partners andidentification of regional partners.
In FY 2012-13, the Commission implemented its new financial plan that was adopted in June 2012 wherebystrategic funding priorities and associated funding levels were reviewed. The updated financial plan allocated $56.7million in local resources for funding years 2011-12 through 2015-16. This plan increased the allocation for theNeighborhood for Learning initiative, stabilized funding for regional health professionals through FY 2015-16,restored preschool expansion funding at $300,000 annually, and retained a Community Investment Loan Fund of$1.3 million. Since the Commission’s major strategic plan programs were continued for FY 2012-13, spendinglevels were commensurate with the prior year with most programs expending or nearly expending their annualallocation and thereby continuing their capacity to serve young children and their families in Ventura County.
New opportunities for leveraging funds and expanding financial resources were realized in FY 2012-13. TheCommission’s countywide preschool efforts were significantly enhanced with external funding sources. First 5Ventura County has always had a longstanding commitment to expand quality early learning opportunities forchildren ages 0-5. The Commission has cultivated strong working-relationships with the County Office of Education,the local elementary school districts and local service providers delivering early learning programs. As a result ofthe innovative and quality programming on the local level, the Commission was well positioned to receive additionalstate and federal resources for countywide preschool efforts. Through blending local funding with Federal Race tothe Top - Early Learning Challenge grant dollars and First 5 California’s Child Signature Program, a Quality Ratingand Improvement System (QRIS) was implemented in Ventura County. Additionally, workforce development effortswere continued in partnership with First 5 California and their matching funds program, ComprehensiveApproaches to Raising Educational Standards (CARES) Plus. Over a four year period, FY 2012-13 through FY
4
2015-16, it is estimated that the Commission will receive over $4.8 million in federal and state grant revenue forpreschool quality efforts.
The Commission also realized enhanced funding in FY 2012-13 to expand obesity prevention strategies. TheCommission implemented a multi-faceted obesity prevention project that relies upon partnerships and collaborationto support change within various systems, including: promoting nutrition and physical activity and increasingbreastfeeding rates through partnerships and capacity building among: hospitals; clinics; employers; parents; andnurses/physicians. The Commission received over $40,000 for its obesity prevention efforts, representingpartnerships with the Kaiser Foundation, and the Scripps Howard Foundation, and the Public Health Departmentthrough two grant programs, including: the West Ventura Kaiser HEAL Zone grant and the Center for DiseaseControl and Prevention (CDC) Transforming Communities Capacity Building grant. The Commission will continue toleverage its obesity prevention efforts for the next three years through partnerships and grant funding.
The Commission has made great strides in leveraging additional resources through partnerships. The Commissionhas continually expanded collaborative partnerships with foundations, businesses, parents and local leaders forcommunity-wide efforts to make sound, lasting investments in children. The Commission has taken key leadershiproles in countywide obesity, oral health, developmental screening, preschool quality improvement, and basic needscollaboratives so public agencies, non-profits and business can work together to support children, families andcommunities.
OVERVIEW OF THE FINANCIAL STATEMENTS
This discussion and analysis is intended to serve as an introduction to the Commission’s basic financial statements.The Commission’s financial statements comprise three components:
1) Government-wide financial statements;2) Fund financial statements; and3) Notes to the financial statements.
The Commission’s financial statements offer key, high-level financial information about its activities.
Government-Wide Financial Statements. The government-wide financial statements are designed to providereaders with a broad overview of Commission finances in a manner similar to private-sector business.
The Statement of Net Position presents information on all Commission assets and liabilities, with differencesbetween the two reported as net position. Over time, increases or decreases in net position may serve as a usefulindicator of whether the financial position of the Commission is changing.
The Statement of Activities presents information on how net position changed during the most recent fiscal year.All changes in net position are reported as soon as the underlying event giving rise to the change occurs,regardless of the timing of related cash flows. Thus, revenues and expenses reported in this statement includesome items that will only result in cash flows in future fiscal periods (e.g., earned but unused vacation leave).
Fund Financial Statements. A fund is a grouping of related accounts that are used to maintain control overresources that have been segregated for specific activities or objectives. The Commission has established funds tocontrol and manage funding for a particular purpose (future years’ financing, community investment loan funds).The Commission reports all activities under governmental funds.
Governmental funds focus on how money flows into and out of those funds and the balances left at year-end thatare available for spending. These funds are used to account for essentially the same functions reported asgovernmental activities in the government-wide financial statements. However, unlike the government-widefinancial statements, governmental funds financial statements focus on near-term inflows and outflows ofspendable resources, as well as on balances of spendable resources available at the end of the fiscal year. TheCommission maintains three individual governmental funds.
Notes to the Financial Statements. The notes to the financial statements provide additional information that isessential to a full understanding of the data provided in the government-wide and fund financial statements.
The Commission is considered a legal public entity separate from the County of Ventura (County). However, forfinancial statement presentation purposes only, the Commission is a component unit of the County.
5
FINANCIAL STATEMENT ANALYSIS
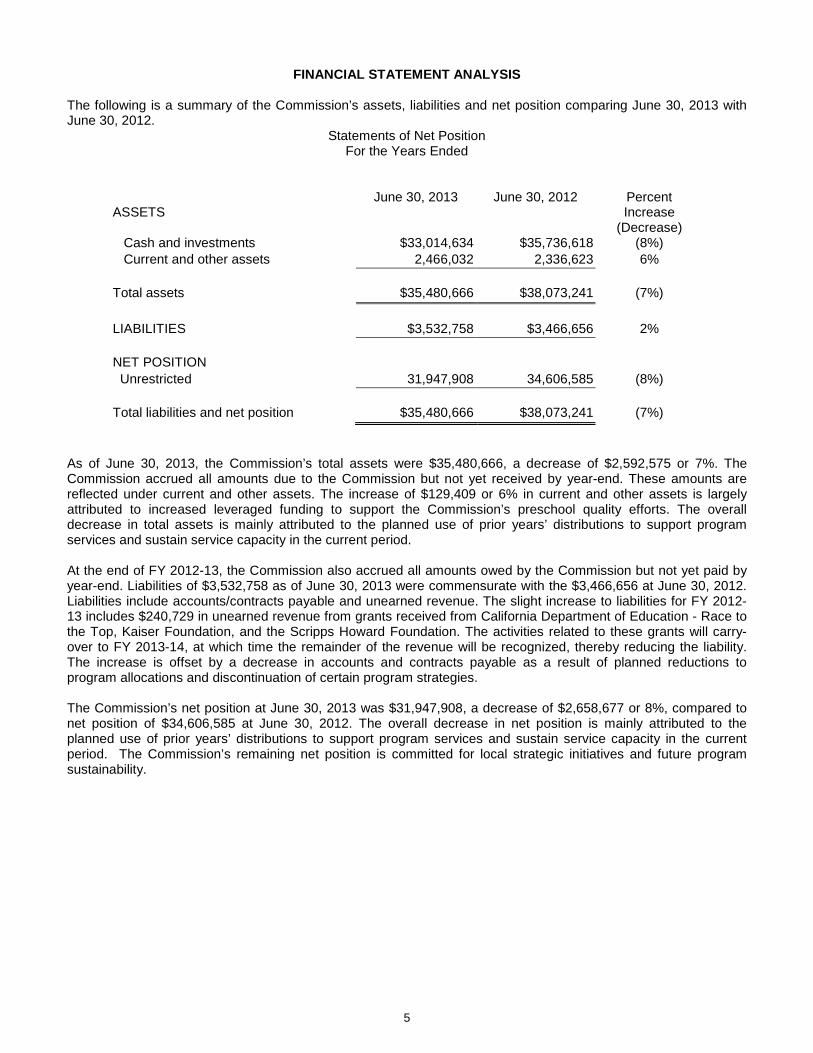
The following is a summary of the Commission’s assets, liabilities and net position comparing June 30, 2013 withJune 30, 2012.
Statements of Net PositionFor the Years Ended
ASSETSJune 30, 2013 June 30, 2012 Percent
Increase(Decrease)
Cash and investments $33,014,634 $35,736,618 (8%)Current and other assets 2,466,032 2,336,623 6%
Total assets $35,480,666 $38,073,241 (7%)
LIABILITIES $3,532,758 $3,466,656 2%
NET POSITION
Unrestricted 31,947,908 34,606,585 (8%)
Total liabilities and net position $35,480,666 $38,073,241 (7%)
As of June 30, 2013, the Commission’s total assets were $35,480,666, a decrease of $2,592,575 or 7%. TheCommission accrued all amounts due to the Commission but not yet received by year-end. These amounts arereflected under current and other assets. The increase of $129,409 or 6% in current and other assets is largelyattributed to increased leveraged funding to support the Commission’s preschool quality efforts. The overalldecrease in total assets is mainly attributed to the planned use of prior years’ distributions to support programservices and sustain service capacity in the current period.
At the end of FY 2012-13, the Commission also accrued all amounts owed by the Commission but not yet paid byyear-end. Liabilities of $3,532,758 as of June 30, 2013 were commensurate with the $3,466,656 at June 30, 2012.Liabilities include accounts/contracts payable and unearned revenue. The slight increase to liabilities for FY 2012-13 includes $240,729 in unearned revenue from grants received from California Department of Education - Race tothe Top, Kaiser Foundation, and the Scripps Howard Foundation. The activities related to these grants will carry-over to FY 2013-14, at which time the remainder of the revenue will be recognized, thereby reducing the liability.The increase is offset by a decrease in accounts and contracts payable as a result of planned reductions toprogram allocations and discontinuation of certain program strategies.
The Commission’s net position at June 30, 2013 was $31,947,908, a decrease of $2,658,677 or 8%, compared tonet position of $34,606,585 at June 30, 2012. The overall decrease in net position is mainly attributed to theplanned use of prior years’ distributions to support program services and sustain service capacity in the currentperiod. The Commission’s remaining net position is committed for local strategic initiatives and future programsustainability.
6
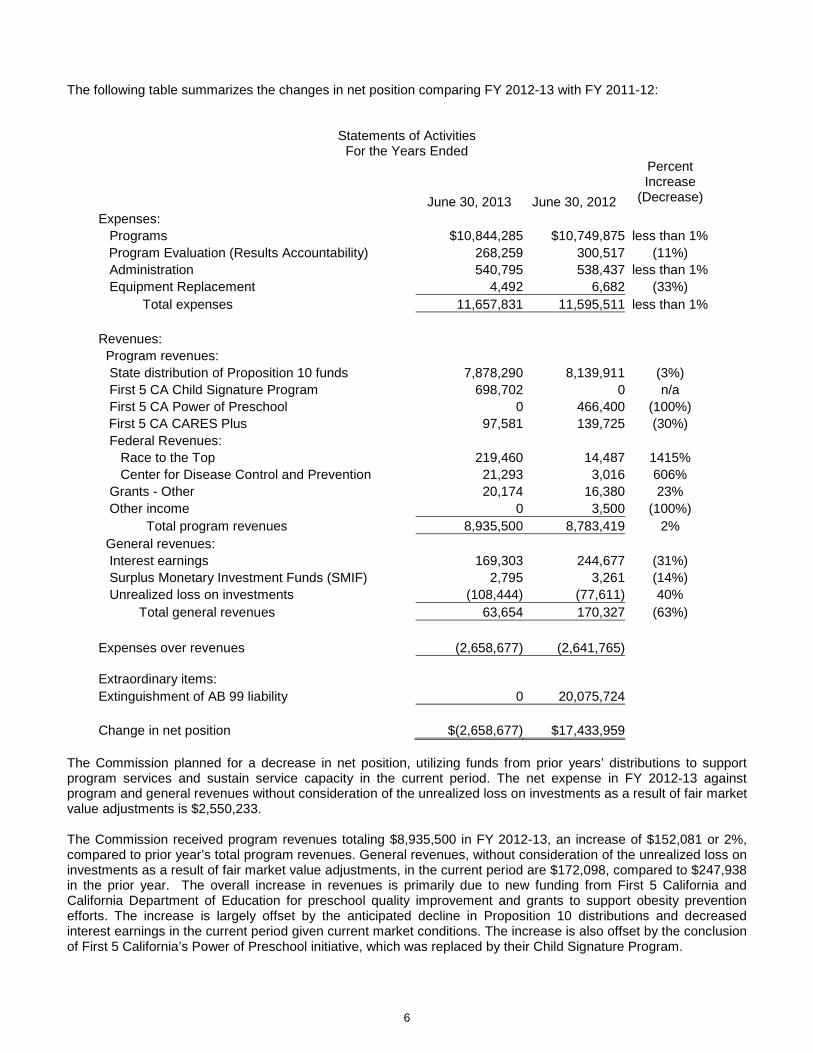
The following table summarizes the changes in net position comparing FY 2012-13 with FY 2011-12:
Statements of ActivitiesFor the Years Ended
PercentIncrease
(Decrease)June 30, 2013 June 30, 2012
Expenses:
Programs $10,844,285 $10,749,875 less than 1%
Program Evaluation (Results Accountability) 268,259 300,517 (11%)
Administration 540,795 538,437 less than 1%
Equipment Replacement 4,492 6,682 (33%)
Total expenses 11,657,831 11,595,511 less than 1%
Revenues:
Program revenues:
State distribution of Proposition 10 funds 7,878,290 8,139,911 (3%)
First 5 CA Child Signature Program 698,702 0 n/a
First 5 CA Power of Preschool 0 466,400 (100%)
First 5 CA CARES Plus 97,581 139,725 (30%)
Federal Revenues:
Race to the Top 219,460 14,487 1415%
Center for Disease Control and Prevention 21,293 3,016 606%
Grants - Other 20,174 16,380 23%
Other income 0 3,500 (100%)
Total program revenues 8,935,500 8,783,419 2%
General revenues:
Interest earnings 169,303 244,677 (31%)
Surplus Monetary Investment Funds (SMIF) 2,795 3,261 (14%)
Unrealized loss on investments (108,444) (77,611) 40%
Total general revenues 63,654 170,327 (63%)
Expenses over revenues (2,658,677) (2,641,765)
Extraordinary items:
Extinguishment of AB 99 liability 0 20,075,724
Change in net position $(2,658,677) $17,433,959
The Commission planned for a decrease in net position, utilizing funds from prior years’ distributions to supportprogram services and sustain service capacity in the current period. The net expense in FY 2012-13 againstprogram and general revenues without consideration of the unrealized loss on investments as a result of fair marketvalue adjustments is $2,550,233.
The Commission received program revenues totaling $8,935,500 in FY 2012-13, an increase of $152,081 or 2%,compared to prior year’s total program revenues. General revenues, without consideration of the unrealized loss oninvestments as a result of fair market value adjustments, in the current period are $172,098, compared to $247,938in the prior year. The overall increase in revenues is primarily due to new funding from First 5 California andCalifornia Department of Education for preschool quality improvement and grants to support obesity preventionefforts. The increase is largely offset by the anticipated decline in Proposition 10 distributions and decreasedinterest earnings in the current period given current market conditions. The increase is also offset by the conclusionof First 5 California’s Power of Preschool initiative, which was replaced by their Child Signature Program.
7
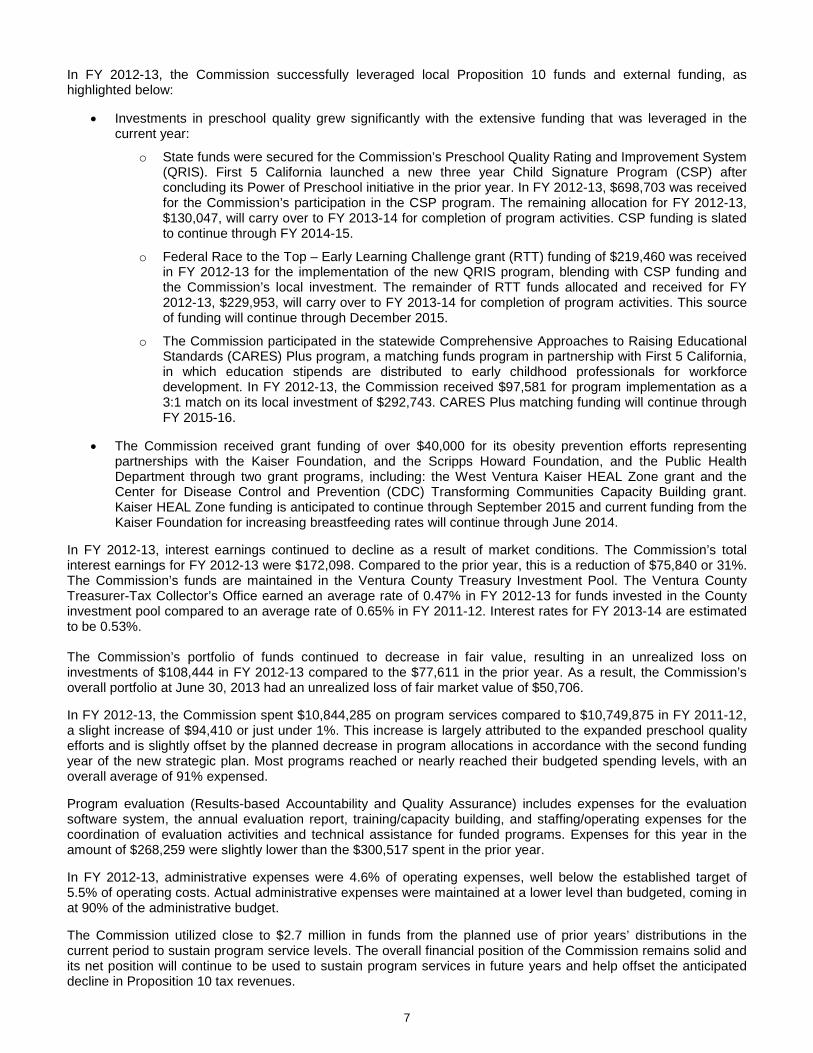
In FY 2012-13, the Commission successfully leveraged local Proposition 10 funds and external funding, ashighlighted below:
Investments in preschool quality grew significantly with the extensive funding that was leveraged in thecurrent year:
o State funds were secured for the Commission’s Preschool Quality Rating and Improvement System(QRIS). First 5 California launched a new three year Child Signature Program (CSP) afterconcluding its Power of Preschool initiative in the prior year. In FY 2012-13, $698,703 was receivedfor the Commission’s participation in the CSP program. The remaining allocation for FY 2012-13,$130,047, will carry over to FY 2013-14 for completion of program activities. CSP funding is slatedto continue through FY 2014-15.
o Federal Race to the Top – Early Learning Challenge grant (RTT) funding of $219,460 was receivedin FY 2012-13 for the implementation of the new QRIS program, blending with CSP funding andthe Commission’s local investment. The remainder of RTT funds allocated and received for FY2012-13, $229,953, will carry over to FY 2013-14 for completion of program activities. This sourceof funding will continue through December 2015.
o The Commission participated in the statewide Comprehensive Approaches to Raising EducationalStandards (CARES) Plus program, a matching funds program in partnership with First 5 California,in which education stipends are distributed to early childhood professionals for workforcedevelopment. In FY 2012-13, the Commission received $97,581 for program implementation as a3:1 match on its local investment of $292,743. CARES Plus matching funding will continue throughFY 2015-16.
The Commission received grant funding of over $40,000 for its obesity prevention efforts representingpartnerships with the Kaiser Foundation, and the Scripps Howard Foundation, and the Public HealthDepartment through two grant programs, including: the West Ventura Kaiser HEAL Zone grant and theCenter for Disease Control and Prevention (CDC) Transforming Communities Capacity Building grant.Kaiser HEAL Zone funding is anticipated to continue through September 2015 and current funding from theKaiser Foundation for increasing breastfeeding rates will continue through June 2014.
In FY 2012-13, interest earnings continued to decline as a result of market conditions. The Commission’s totalinterest earnings for FY 2012-13 were $172,098. Compared to the prior year, this is a reduction of $75,840 or 31%.The Commission’s funds are maintained in the Ventura County Treasury Investment Pool. The Ventura CountyTreasurer-Tax Collector’s Office earned an average rate of 0.47% in FY 2012-13 for funds invested in the Countyinvestment pool compared to an average rate of 0.65% in FY 2011-12. Interest rates for FY 2013-14 are estimatedto be 0.53%.
The Commission’s portfolio of funds continued to decrease in fair value, resulting in an unrealized loss oninvestments of $108,444 in FY 2012-13 compared to the $77,611 in the prior year. As a result, the Commission’soverall portfolio at June 30, 2013 had an unrealized loss of fair market value of $50,706.
In FY 2012-13, the Commission spent $10,844,285 on program services compared to $10,749,875 in FY 2011-12,a slight increase of $94,410 or just under 1%. This increase is largely attributed to the expanded preschool qualityefforts and is slightly offset by the planned decrease in program allocations in accordance with the second fundingyear of the new strategic plan. Most programs reached or nearly reached their budgeted spending levels, with anoverall average of 91% expensed.
Program evaluation (Results-based Accountability and Quality Assurance) includes expenses for the evaluationsoftware system, the annual evaluation report, training/capacity building, and staffing/operating expenses for thecoordination of evaluation activities and technical assistance for funded programs. Expenses for this year in theamount of $268,259 were slightly lower than the $300,517 spent in the prior year.
In FY 2012-13, administrative expenses were 4.6% of operating expenses, well below the established target of5.5% of operating costs. Actual administrative expenses were maintained at a lower level than budgeted, coming inat 90% of the administrative budget.
The Commission utilized close to $2.7 million in funds from the planned use of prior years’ distributions in thecurrent period to sustain program service levels. The overall financial position of the Commission remains solid andits net position will continue to be used to sustain program services in future years and help offset the anticipateddecline in Proposition 10 tax revenues.
8
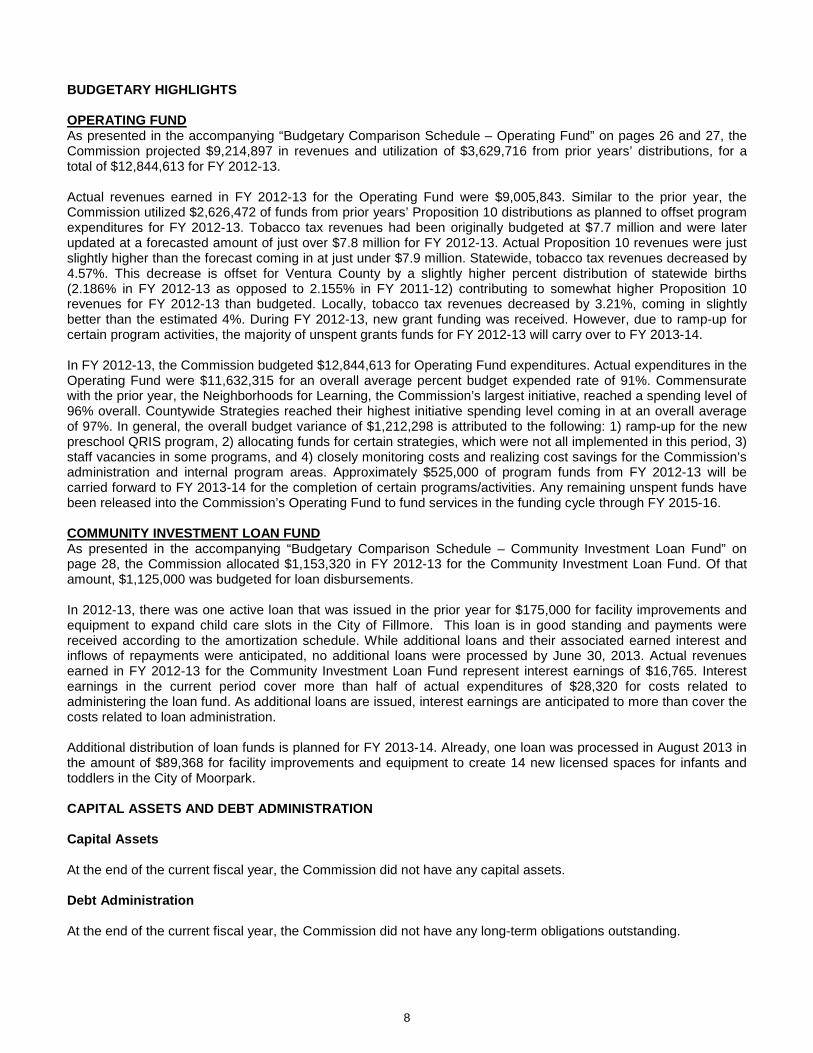
BUDGETARY HIGHLIGHTS
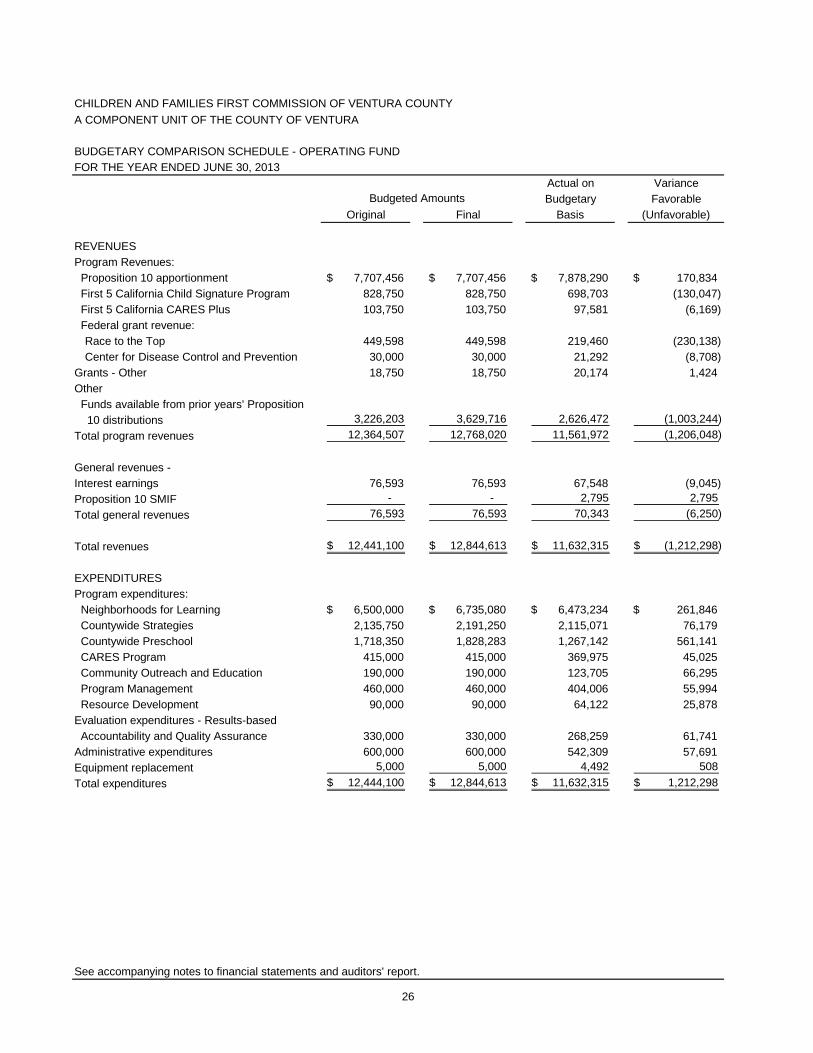
OPERATING FUNDAs presented in the accompanying “Budgetary Comparison Schedule – Operating Fund” on pages 26 and 27, theCommission projected $9,214,897 in revenues and utilization of $3,629,716 from prior years’ distributions, for atotal of $12,844,613 for FY 2012-13.
Actual revenues earned in FY 2012-13 for the Operating Fund were $9,005,843. Similar to the prior year, theCommission utilized $2,626,472 of funds from prior years’ Proposition 10 distributions as planned to offset programexpenditures for FY 2012-13. Tobacco tax revenues had been originally budgeted at $7.7 million and were laterupdated at a forecasted amount of just over $7.8 million for FY 2012-13. Actual Proposition 10 revenues were justslightly higher than the forecast coming in at just under $7.9 million. Statewide, tobacco tax revenues decreased by4.57%. This decrease is offset for Ventura County by a slightly higher percent distribution of statewide births(2.186% in FY 2012-13 as opposed to 2.155% in FY 2011-12) contributing to somewhat higher Proposition 10revenues for FY 2012-13 than budgeted. Locally, tobacco tax revenues decreased by 3.21%, coming in slightlybetter than the estimated 4%. During FY 2012-13, new grant funding was received. However, due to ramp-up forcertain program activities, the majority of unspent grants funds for FY 2012-13 will carry over to FY 2013-14.
In FY 2012-13, the Commission budgeted $12,844,613 for Operating Fund expenditures. Actual expenditures in theOperating Fund were $11,632,315 for an overall average percent budget expended rate of 91%. Commensuratewith the prior year, the Neighborhoods for Learning, the Commission’s largest initiative, reached a spending level of96% overall. Countywide Strategies reached their highest initiative spending level coming in at an overall averageof 97%. In general, the overall budget variance of $1,212,298 is attributed to the following: 1) ramp-up for the newpreschool QRIS program, 2) allocating funds for certain strategies, which were not all implemented in this period, 3)staff vacancies in some programs, and 4) closely monitoring costs and realizing cost savings for the Commission’sadministration and internal program areas. Approximately $525,000 of program funds from FY 2012-13 will becarried forward to FY 2013-14 for the completion of certain programs/activities. Any remaining unspent funds havebeen released into the Commission’s Operating Fund to fund services in the funding cycle through FY 2015-16.
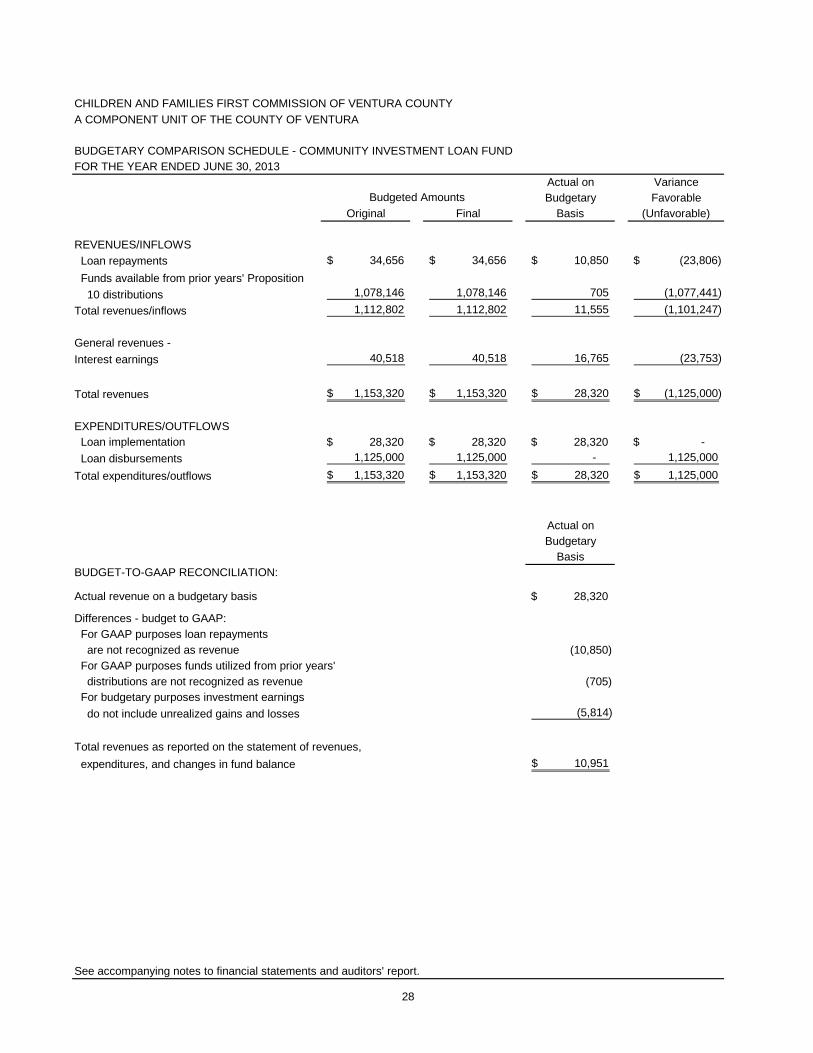
COMMUNITY INVESTMENT LOAN FUNDAs presented in the accompanying “Budgetary Comparison Schedule – Community Investment Loan Fund” onpage 28, the Commission allocated $1,153,320 in FY 2012-13 for the Community Investment Loan Fund. Of thatamount, $1,125,000 was budgeted for loan disbursements.
In 2012-13, there was one active loan that was issued in the prior year for $175,000 for facility improvements andequipment to expand child care slots in the City of Fillmore. This loan is in good standing and payments werereceived according to the amortization schedule. While additional loans and their associated earned interest andinflows of repayments were anticipated, no additional loans were processed by June 30, 2013. Actual revenuesearned in FY 2012-13 for the Community Investment Loan Fund represent interest earnings of $16,765. Interestearnings in the current period cover more than half of actual expenditures of $28,320 for costs related toadministering the loan fund. As additional loans are issued, interest earnings are anticipated to more than cover thecosts related to loan administration.
Additional distribution of loan funds is planned for FY 2013-14. Already, one loan was processed in August 2013 inthe amount of $89,368 for facility improvements and equipment to create 14 new licensed spaces for infants andtoddlers in the City of Moorpark.
CAPITAL ASSETS AND DEBT ADMINISTRATION
Capital Assets
At the end of the current fiscal year, the Commission did not have any capital assets.
Debt Administration
At the end of the current fiscal year, the Commission did not have any long-term obligations outstanding.
9
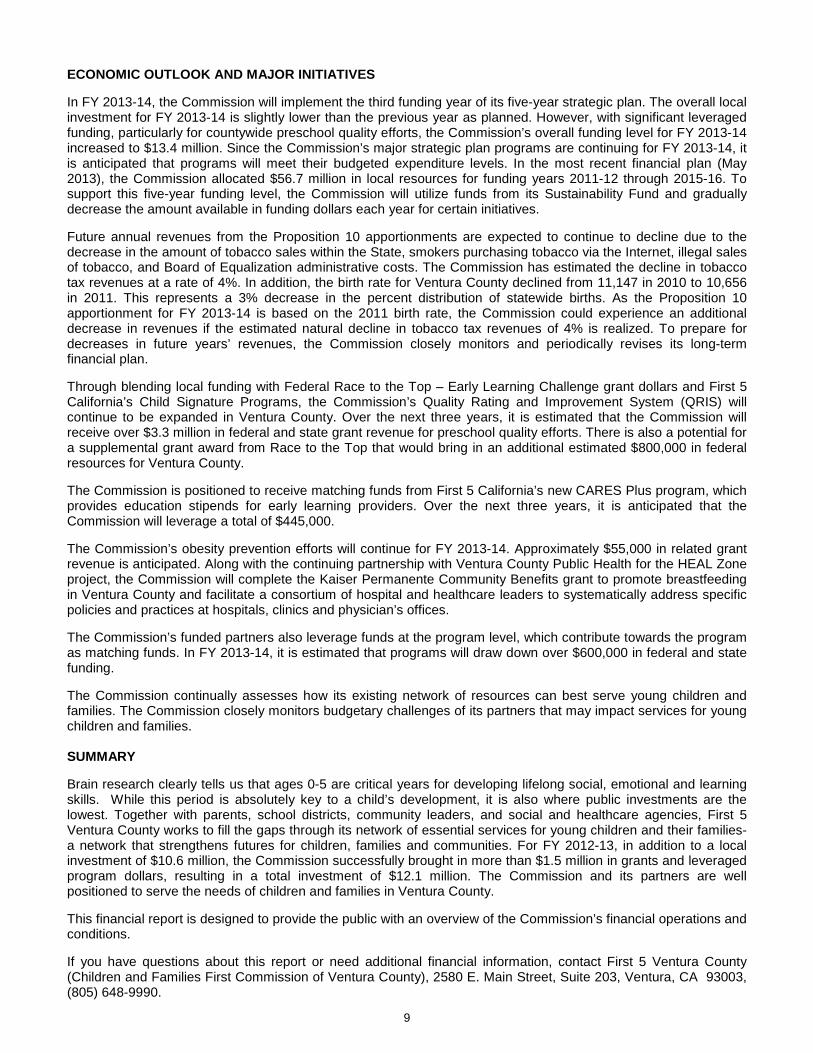
ECONOMIC OUTLOOK AND MAJOR INITIATIVES
In FY 2013-14, the Commission will implement the third funding year of its five-year strategic plan. The overall localinvestment for FY 2013-14 is slightly lower than the previous year as planned. However, with significant leveragedfunding, particularly for countywide preschool quality efforts, the Commission’s overall funding level for FY 2013-14increased to $13.4 million. Since the Commission’s major strategic plan programs are continuing for FY 2013-14, itis anticipated that programs will meet their budgeted expenditure levels. In the most recent financial plan (May2013), the Commission allocated $56.7 million in local resources for funding years 2011-12 through 2015-16. Tosupport this five-year funding level, the Commission will utilize funds from its Sustainability Fund and graduallydecrease the amount available in funding dollars each year for certain initiatives.
Future annual revenues from the Proposition 10 apportionments are expected to continue to decline due to thedecrease in the amount of tobacco sales within the State, smokers purchasing tobacco via the Internet, illegal salesof tobacco, and Board of Equalization administrative costs. The Commission has estimated the decline in tobaccotax revenues at a rate of 4%. In addition, the birth rate for Ventura County declined from 11,147 in 2010 to 10,656in 2011. This represents a 3% decrease in the percent distribution of statewide births. As the Proposition 10apportionment for FY 2013-14 is based on the 2011 birth rate, the Commission could experience an additionaldecrease in revenues if the estimated natural decline in tobacco tax revenues of 4% is realized. To prepare fordecreases in future years’ revenues, the Commission closely monitors and periodically revises its long-termfinancial plan.
Through blending local funding with Federal Race to the Top – Early Learning Challenge grant dollars and First 5California’s Child Signature Programs, the Commission’s Quality Rating and Improvement System (QRIS) willcontinue to be expanded in Ventura County. Over the next three years, it is estimated that the Commission willreceive over $3.3 million in federal and state grant revenue for preschool quality efforts. There is also a potential fora supplemental grant award from Race to the Top that would bring in an additional estimated $800,000 in federalresources for Ventura County.
The Commission is positioned to receive matching funds from First 5 California’s new CARES Plus program, whichprovides education stipends for early learning providers. Over the next three years, it is anticipated that theCommission will leverage a total of $445,000.
The Commission’s obesity prevention efforts will continue for FY 2013-14. Approximately $55,000 in related grantrevenue is anticipated. Along with the continuing partnership with Ventura County Public Health for the HEAL Zoneproject, the Commission will complete the Kaiser Permanente Community Benefits grant to promote breastfeedingin Ventura County and facilitate a consortium of hospital and healthcare leaders to systematically address specificpolicies and practices at hospitals, clinics and physician’s offices.
The Commission’s funded partners also leverage funds at the program level, which contribute towards the programas matching funds. In FY 2013-14, it is estimated that programs will draw down over $600,000 in federal and statefunding.
The Commission continually assesses how its existing network of resources can best serve young children andfamilies. The Commission closely monitors budgetary challenges of its partners that may impact services for youngchildren and families.
SUMMARY
Brain research clearly tells us that ages 0-5 are critical years for developing lifelong social, emotional and learningskills. While this period is absolutely key to a child’s development, it is also where public investments are thelowest. Together with parents, school districts, community leaders, and social and healthcare agencies, First 5Ventura County works to fill the gaps through its network of essential services for young children and their families-a network that strengthens futures for children, families and communities. For FY 2012-13, in addition to a localinvestment of $10.6 million, the Commission successfully brought in more than $1.5 million in grants and leveragedprogram dollars, resulting in a total investment of $12.1 million. The Commission and its partners are wellpositioned to serve the needs of children and families in Ventura County.
This financial report is designed to provide the public with an overview of the Commission’s financial operations andconditions.
If you have questions about this report or need additional financial information, contact First 5 Ventura County(Children and Families First Commission of Ventura County), 2580 E. Main Street, Suite 203, Ventura, CA 93003,(805) 648-9990.
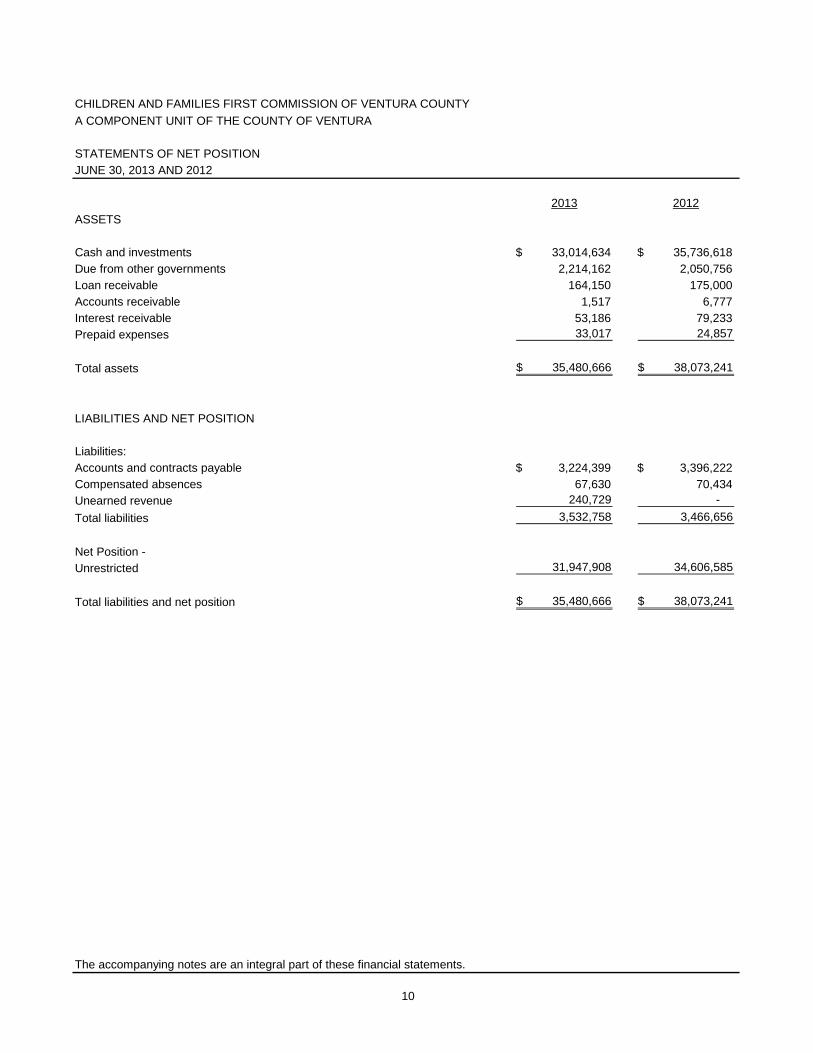
A COMPONENT UNIT OF THE COUNTY OF VENTURA
STATEMENTS OF NET POSITION
JUNE 30, 2013 AND 2012
2013 2012
ASSETS
Cash and investments 33,014,634$ 35,736,618$
Due from other governments 2,214,162 2,050,756
Loan receivable 164,150 175,000
Accounts receivable 1,517 6,777
Interest receivable 53,186 79,233
Prepaid expenses 33,017 24,857
Total assets 35,480,666$ 38,073,241$
LIABILITIES AND NET POSITION
Liabilities:
Accounts and contracts payable 3,224,399$ 3,396,222$
Compensated absences 67,630 70,434
Unearned revenue 240,729 -
Total liabilities 3,532,758 3,466,656
Net Position -
Unrestricted 31,947,908 34,606,585
Total liabilities and net position 35,480,666$ 38,073,241$
The accompanying notes are an integral part of these financial statements.
CHILDREN AND FAMILIES FIRST COMMISSION OF VENTURA COUNTY
10
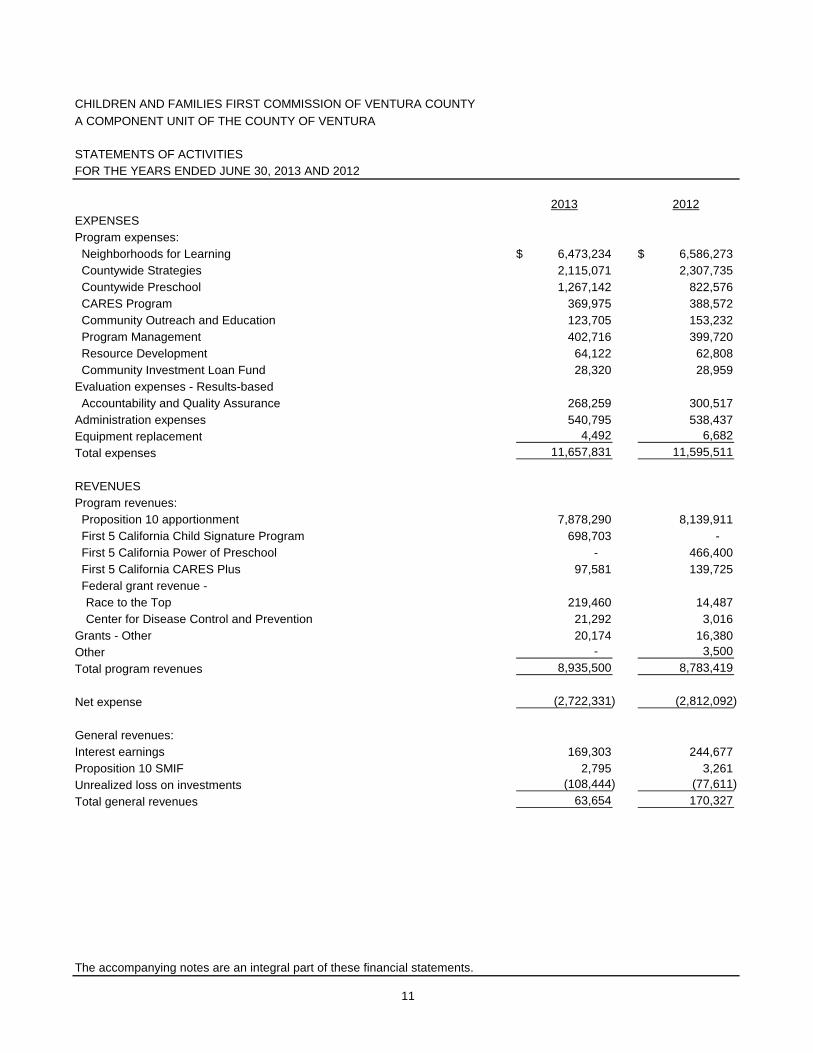
A COMPONENT UNIT OF THE COUNTY OF VENTURA
STATEMENTS OF ACTIVITIES
FOR THE YEARS ENDED JUNE 30, 2013 AND 2012
2013 2012
EXPENSES
Program expenses:
Neighborhoods for Learning 6,473,234$ 6,586,273$
Countywide Strategies 2,115,071 2,307,735
Countywide Preschool 1,267,142 822,576
CARES Program 369,975 388,572
Community Outreach and Education 123,705 153,232
Program Management 402,716 399,720
Resource Development 64,122 62,808
Community Investment Loan Fund 28,320 28,959
Evaluation expenses - Results-based
Accountability and Quality Assurance 268,259 300,517
Administration expenses 540,795 538,437
Equipment replacement 4,492 6,682
Total expenses 11,657,831 11,595,511
REVENUES
Program revenues:
Proposition 10 apportionment 7,878,290 8,139,911
First 5 California Child Signature Program 698,703 -
First 5 California Power of Preschool - 466,400
First 5 California CARES Plus 97,581 139,725
Federal grant revenue -
Race to the Top 219,460 14,487
Center for Disease Control and Prevention 21,292 3,016
Grants - Other 20,174 16,380
Other - 3,500
Total program revenues 8,935,500 8,783,419
Net expense (2,722,331) (2,812,092)
General revenues:
Interest earnings 169,303 244,677
Proposition 10 SMIF 2,795 3,261
Unrealized loss on investments (108,444) (77,611)
Total general revenues 63,654 170,327
The accompanying notes are an integral part of these financial statements.
CHILDREN AND FAMILIES FIRST COMMISSION OF VENTURA COUNTY
11
A COMPONENT UNIT OF THE COUNTY OF VENTURA
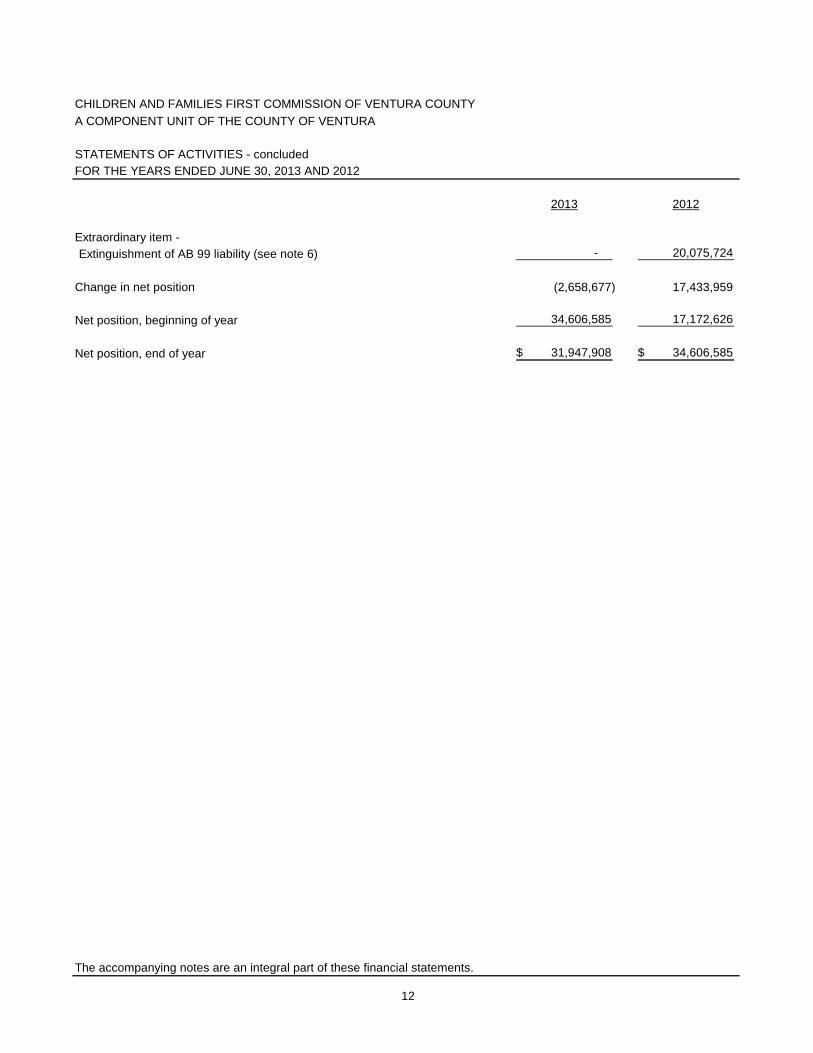
STATEMENTS OF ACTIVITIES - concluded
FOR THE YEARS ENDED JUNE 30, 2013 AND 2012
2013 2012
Extraordinary item -
Extinguishment of AB 99 liability (see note 6) - 20,075,724
Change in net position (2,658,677) 17,433,959
Net position, beginning of year 34,606,585 17,172,626
Net position, end of year 31,947,908$ 34,606,585$
The accompanying notes are an integral part of these financial statements.
CHILDREN AND FAMILIES FIRST COMMISSION OF VENTURA COUNTY
12
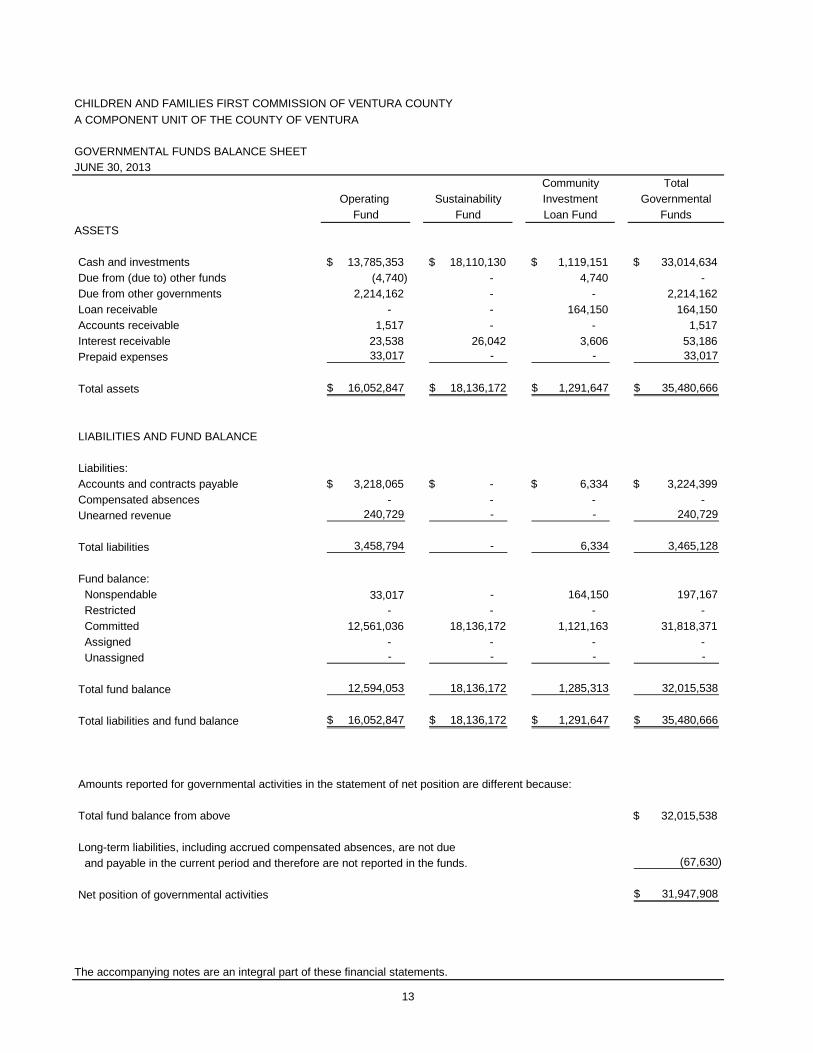
A COMPONENT UNIT OF THE COUNTY OF VENTURA
GOVERNMENTAL FUNDS BALANCE SHEET
JUNE 30, 2013
Community Total
Operating Sustainability Investment Governmental
Fund Fund Loan Fund Funds
ASSETS
Cash and investments 13,785,353$ 18,110,130$ 1,119,151$ 33,014,634$
Due from (due to) other funds (4,740) - 4,740 -
Due from other governments 2,214,162 - - 2,214,162
Loan receivable - - 164,150 164,150
Accounts receivable 1,517 - - 1,517
Interest receivable 23,538 26,042 3,606 53,186
Prepaid expenses 33,017 - - 33,017
Total assets 16,052,847$ 18,136,172$ 1,291,647$ 35,480,666$
LIABILITIES AND FUND BALANCE
Liabilities:
Accounts and contracts payable 3,218,065$ -$ 6,334$ 3,224,399$
Compensated absences - - - -
Unearned revenue 240,729 - - 240,729
Total liabilities 3,458,794 - 6,334 3,465,128
Fund balance:
Nonspendable 33,017 - 164,150 197,167
Restricted - - - -
Committed 12,561,036 18,136,172 1,121,163 31,818,371
Assigned - - - -
Unassigned - - - -
Total fund balance 12,594,053 18,136,172 1,285,313 32,015,538
Total liabilities and fund balance 16,052,847$ 18,136,172$ 1,291,647$ 35,480,666$
Amounts reported for governmental activities in the statement of net position are different because:
Total fund balance from above 32,015,538$
Long-term liabilities, including accrued compensated absences, are not due
and payable in the current period and therefore are not reported in the funds. (67,630)
Net position of governmental activities 31,947,908$
The accompanying notes are an integral part of these financial statements.
CHILDREN AND FAMILIES FIRST COMMISSION OF VENTURA COUNTY
13
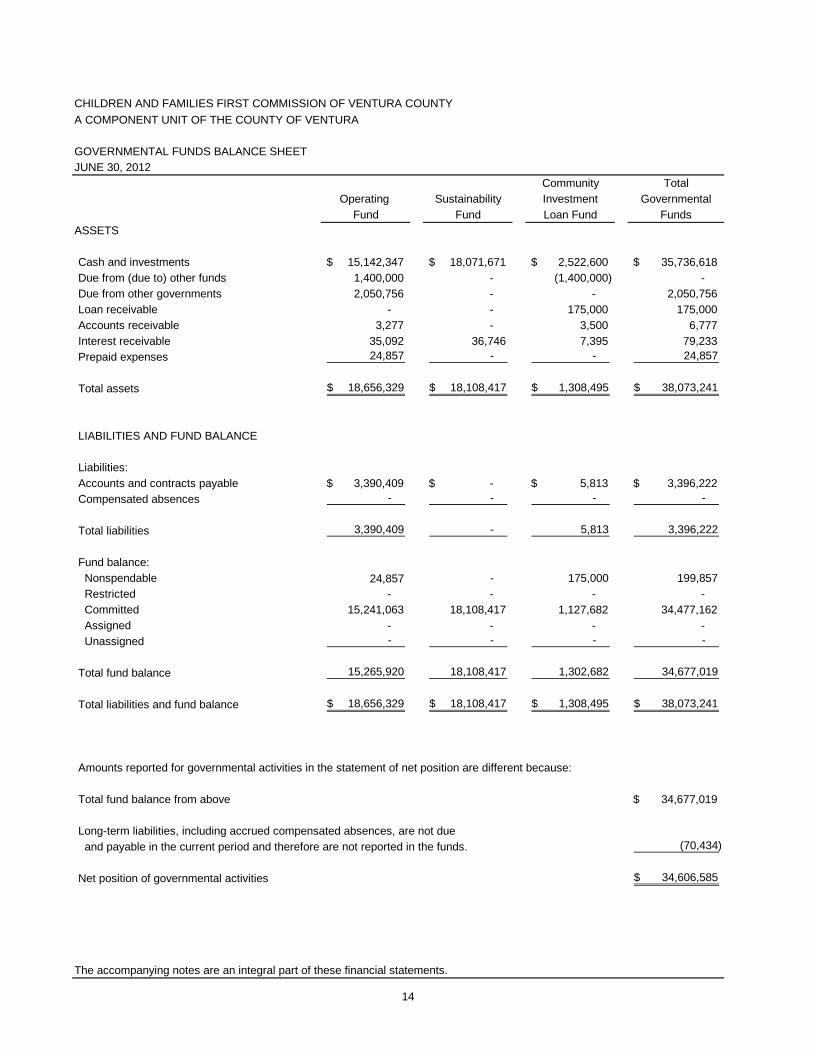
A COMPONENT UNIT OF THE COUNTY OF VENTURA
GOVERNMENTAL FUNDS BALANCE SHEET
JUNE 30, 2012
Community Total
Operating Sustainability Investment Governmental
Fund Fund Loan Fund Funds
ASSETS
Cash and investments 15,142,347$ 18,071,671$ 2,522,600$ 35,736,618$
Due from (due to) other funds 1,400,000 - (1,400,000) -
Due from other governments 2,050,756 - - 2,050,756
Loan receivable - - 175,000 175,000
Accounts receivable 3,277 - 3,500 6,777
Interest receivable 35,092 36,746 7,395 79,233
Prepaid expenses 24,857 - - 24,857
Total assets 18,656,329$ 18,108,417$ 1,308,495$ 38,073,241$
LIABILITIES AND FUND BALANCE
Liabilities:
Accounts and contracts payable 3,390,409$ -$ 5,813$ 3,396,222$
Compensated absences - - - -
Total liabilities 3,390,409 - 5,813 3,396,222
Fund balance:
Nonspendable 24,857 - 175,000 199,857
Restricted - - - -
Committed 15,241,063 18,108,417 1,127,682 34,477,162
Assigned - - - -
Unassigned - - - -
Total fund balance 15,265,920 18,108,417 1,302,682 34,677,019
Total liabilities and fund balance 18,656,329$ 18,108,417$ 1,308,495$ 38,073,241$
Amounts reported for governmental activities in the statement of net position are different because:
Total fund balance from above 34,677,019$
Long-term liabilities, including accrued compensated absences, are not due
and payable in the current period and therefore are not reported in the funds. (70,434)
Net position of governmental activities 34,606,585$
The accompanying notes are an integral part of these financial statements.
CHILDREN AND FAMILIES FIRST COMMISSION OF VENTURA COUNTY
14
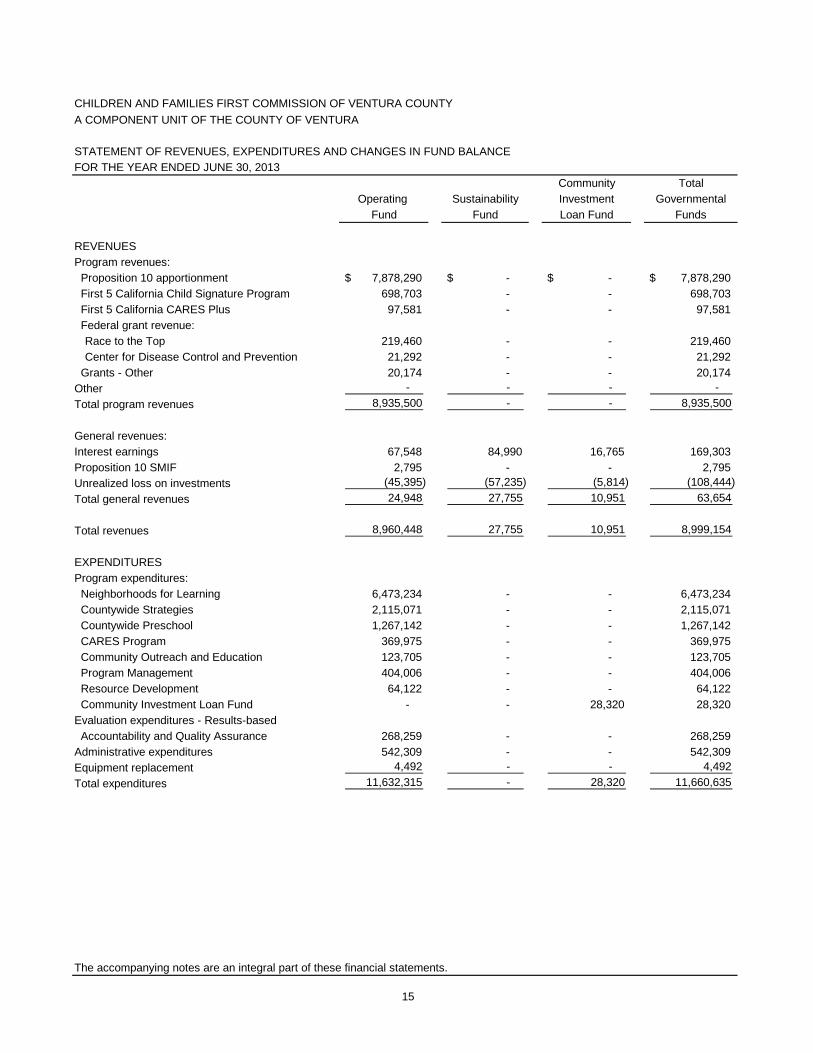
A COMPONENT UNIT OF THE COUNTY OF VENTURA
STATEMENT OF REVENUES, EXPENDITURES AND CHANGES IN FUND BALANCE
FOR THE YEAR ENDED JUNE 30, 2013
Community Total
Operating Sustainability Investment Governmental
Fund Fund Loan Fund Funds
REVENUES
Program revenues:
Proposition 10 apportionment 7,878,290$ -$ -$ 7,878,290$
First 5 California Child Signature Program 698,703 - - 698,703
First 5 California CARES Plus 97,581 - - 97,581
Federal grant revenue:
Race to the Top 219,460 - - 219,460
Center for Disease Control and Prevention 21,292 - - 21,292
Grants - Other 20,174 - - 20,174
Other - - - -
Total program revenues 8,935,500 - - 8,935,500
General revenues:
Interest earnings 67,548 84,990 16,765 169,303
Proposition 10 SMIF 2,795 - - 2,795
Unrealized loss on investments (45,395) (57,235) (5,814) (108,444)
Total general revenues 24,948 27,755 10,951 63,654
Total revenues 8,960,448 27,755 10,951 8,999,154
EXPENDITURES
Program expenditures:
Neighborhoods for Learning 6,473,234 - - 6,473,234
Countywide Strategies 2,115,071 - - 2,115,071
Countywide Preschool 1,267,142 - - 1,267,142
CARES Program 369,975 - - 369,975
Community Outreach and Education 123,705 - - 123,705
Program Management 404,006 - - 404,006
Resource Development 64,122 - - 64,122
Community Investment Loan Fund - - 28,320 28,320
Evaluation expenditures - Results-based
Accountability and Quality Assurance 268,259 - - 268,259
Administrative expenditures 542,309 - - 542,309
Equipment replacement 4,492 - - 4,492
Total expenditures 11,632,315 - 28,320 11,660,635
The accompanying notes are an integral part of these financial statements.
CHILDREN AND FAMILIES FIRST COMMISSION OF VENTURA COUNTY
15
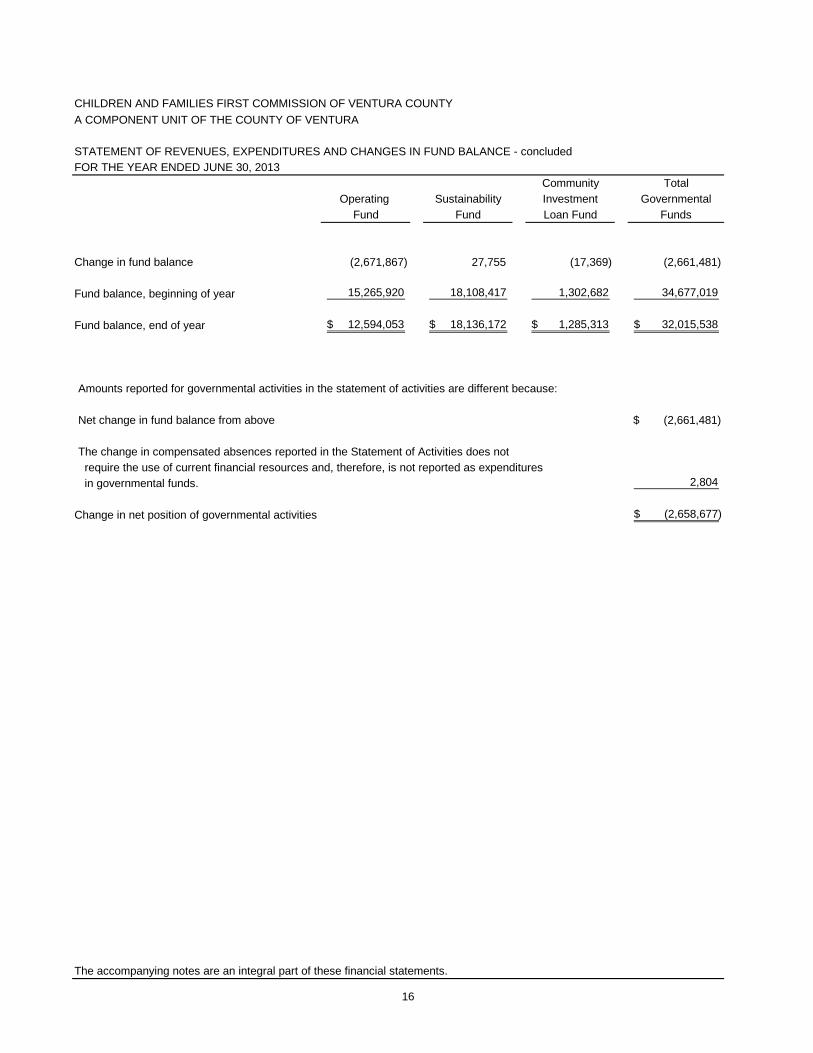
A COMPONENT UNIT OF THE COUNTY OF VENTURA
STATEMENT OF REVENUES, EXPENDITURES AND CHANGES IN FUND BALANCE - concluded
FOR THE YEAR ENDED JUNE 30, 2013
Community Total
Operating Sustainability Investment Governmental
Fund Fund Loan Fund Funds
Change in fund balance (2,671,867) 27,755 (17,369) (2,661,481)
Fund balance, beginning of year 15,265,920 18,108,417 1,302,682 34,677,019
Fund balance, end of year 12,594,053$ 18,136,172$ 1,285,313$ 32,015,538$
Amounts reported for governmental activities in the statement of activities are different because:
Net change in fund balance from above (2,661,481)$
The change in compensated absences reported in the Statement of Activities does not
require the use of current financial resources and, therefore, is not reported as expenditures
in governmental funds. 2,804
Change in net position of governmental activities (2,658,677)$
The accompanying notes are an integral part of these financial statements.
CHILDREN AND FAMILIES FIRST COMMISSION OF VENTURA COUNTY
16

A COMPONENT UNIT OF THE COUNTY OF VENTURA
STATEMENT OF REVENUES, EXPENDITURES AND CHANGES IN FUND BALANCE
FOR THE YEAR ENDED JUNE 30, 2012
Community Total
Operating Sustainability Investment Governmental
Fund Fund Loan Fund Funds
REVENUES
Program revenues:
Proposition 10 apportionment 8,139,911$ -$ -$ 8,139,911$
First 5 California Power of Preschool Bridge 466,400 - - 466,400
First 5 California CARES Plus 139,725 - - 139,725
Federal grant revenue:
Race to the Top - Planning 14,487 - - 14,487
Center for Disease Control and Prevention 3,016 - - 3,016
Grants - Other 16,380 - - 16,380
Other - - 3,500 3,500
Total program revenues 8,779,919 - 3,500 8,783,419
General revenues:
Interest earnings 107,592 117,563 19,522 244,677
Proposition 10 SMIF 3,261 - - 3,261
Unrealized loss on investments (38,267) (33,901) (5,443) (77,611)
Total general revenues 72,586 83,662 14,079 170,327
Total revenues 8,852,505 83,662 17,579 8,953,746
EXPENDITURES
Program expenditures:
Neighborhoods for Learning 6,586,273 - - 6,586,273
Countywide Strategies 2,307,735 - - 2,307,735
Countywide Preschool 822,576 - - 822,576
CARES Program 388,572 - - 388,572
Community Outreach and Education 153,232 - - 153,232
Program Management 397,334 - - 397,334
Resource Development 62,808 - - 62,808
Community Investment Loan Fund - - 28,959 28,959
Evaluation expenditures - Results-based
Accountability and Quality Assurance 300,517 - - 300,517
Administrative expenditures 535,637 - - 535,637
Equipment replacement 6,682 - - 6,682
Total expenditures 11,561,366 - 28,959 11,590,325
The accompanying notes are an integral part of these financial statements.
CHILDREN AND FAMILIES FIRST COMMISSION OF VENTURA COUNTY
17
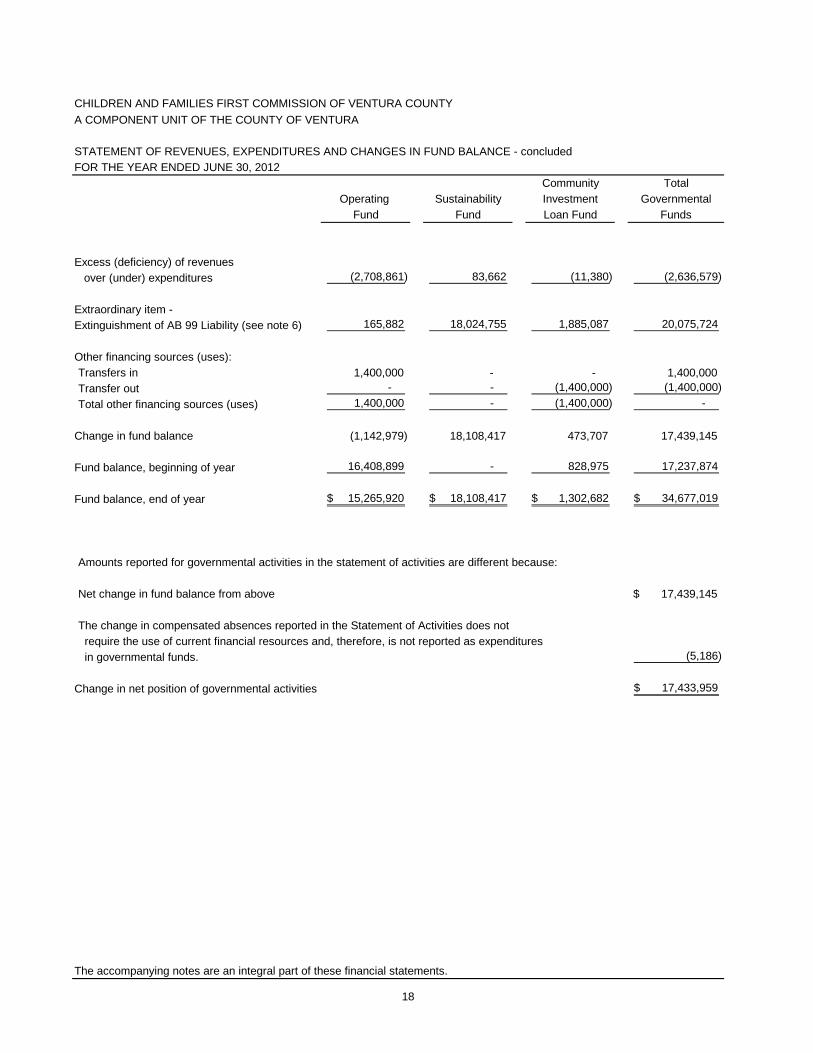
A COMPONENT UNIT OF THE COUNTY OF VENTURA
STATEMENT OF REVENUES, EXPENDITURES AND CHANGES IN FUND BALANCE - concluded
FOR THE YEAR ENDED JUNE 30, 2012
Community Total
Operating Sustainability Investment Governmental
Fund Fund Loan Fund Funds
Excess (deficiency) of revenues
over (under) expenditures (2,708,861) 83,662 (11,380) (2,636,579)
Extraordinary item -
Extinguishment of AB 99 Liability (see note 6) 165,882 18,024,755 1,885,087 20,075,724
Other financing sources (uses):
Transfers in 1,400,000 - - 1,400,000
Transfer out - - (1,400,000) (1,400,000)
Total other financing sources (uses) 1,400,000 - (1,400,000) -
Change in fund balance (1,142,979) 18,108,417 473,707 17,439,145
Fund balance, beginning of year 16,408,899 - 828,975 17,237,874
Fund balance, end of year 15,265,920$ 18,108,417$ 1,302,682$ 34,677,019$
Amounts reported for governmental activities in the statement of activities are different because:
Net change in fund balance from above 17,439,145$
The change in compensated absences reported in the Statement of Activities does not
require the use of current financial resources and, therefore, is not reported as expenditures
in governmental funds. (5,186)
Change in net position of governmental activities 17,433,959$
The accompanying notes are an integral part of these financial statements.
CHILDREN AND FAMILIES FIRST COMMISSION OF VENTURA COUNTY
18
19
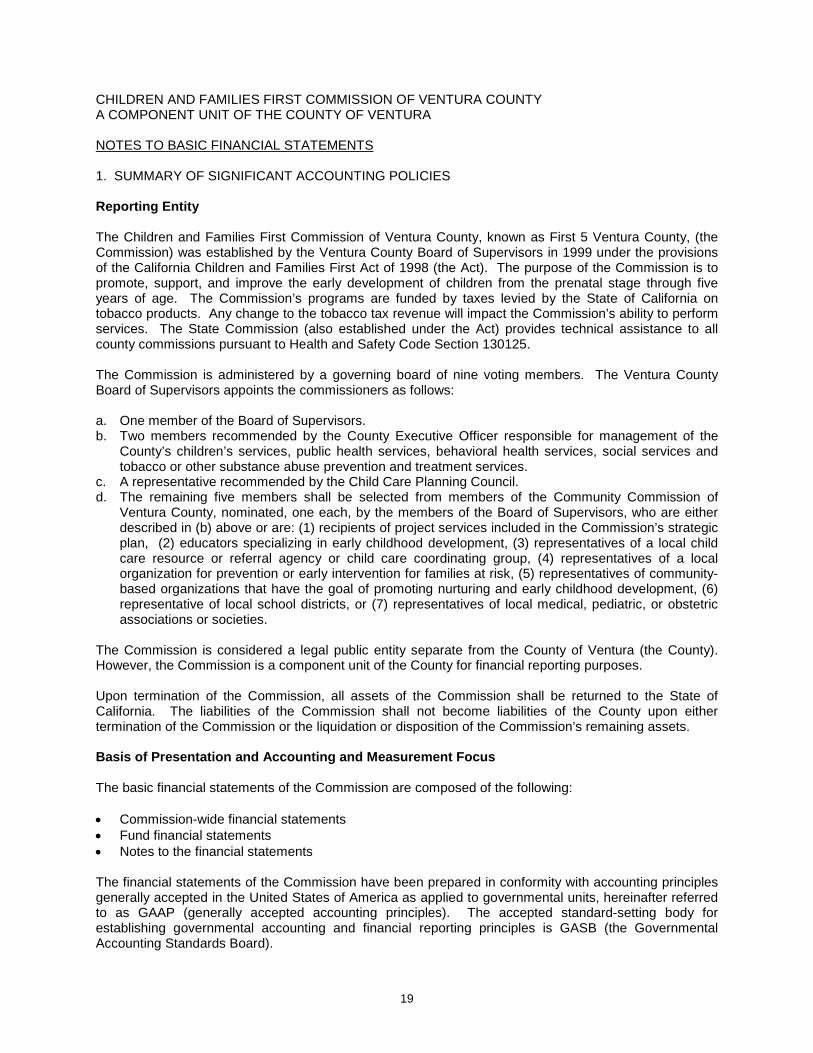
CHILDREN AND FAMILIES FIRST COMMISSION OF VENTURA COUNTYA COMPONENT UNIT OF THE COUNTY OF VENTURA
NOTES TO BASIC FINANCIAL STATEMENTS
1. SUMMARY OF SIGNIFICANT ACCOUNTING POLICIES
Reporting Entity
The Children and Families First Commission of Ventura County, known as First 5 Ventura County, (theCommission) was established by the Ventura County Board of Supervisors in 1999 under the provisionsof the California Children and Families First Act of 1998 (the Act). The purpose of the Commission is topromote, support, and improve the early development of children from the prenatal stage through fiveyears of age. The Commission’s programs are funded by taxes levied by the State of California ontobacco products. Any change to the tobacco tax revenue will impact the Commission’s ability to performservices. The State Commission (also established under the Act) provides technical assistance to allcounty commissions pursuant to Health and Safety Code Section 130125.
The Commission is administered by a governing board of nine voting members. The Ventura CountyBoard of Supervisors appoints the commissioners as follows:
a. One member of the Board of Supervisors.b. Two members recommended by the County Executive Officer responsible for management of the
County’s children’s services, public health services, behavioral health services, social services andtobacco or other substance abuse prevention and treatment services.
c. A representative recommended by the Child Care Planning Council.d. The remaining five members shall be selected from members of the Community Commission of
Ventura County, nominated, one each, by the members of the Board of Supervisors, who are eitherdescribed in (b) above or are: (1) recipients of project services included in the Commission’s strategicplan, (2) educators specializing in early childhood development, (3) representatives of a local childcare resource or referral agency or child care coordinating group, (4) representatives of a localorganization for prevention or early intervention for families at risk, (5) representatives of community-based organizations that have the goal of promoting nurturing and early childhood development, (6)representative of local school districts, or (7) representatives of local medical, pediatric, or obstetricassociations or societies.
The Commission is considered a legal public entity separate from the County of Ventura (the County).However, the Commission is a component unit of the County for financial reporting purposes.
Upon termination of the Commission, all assets of the Commission shall be returned to the State ofCalifornia. The liabilities of the Commission shall not become liabilities of the County upon eithertermination of the Commission or the liquidation or disposition of the Commission’s remaining assets.
Basis of Presentation and Accounting and Measurement Focus
The basic financial statements of the Commission are composed of the following:
Commission-wide financial statements Fund financial statements Notes to the financial statements
The financial statements of the Commission have been prepared in conformity with accounting principlesgenerally accepted in the United States of America as applied to governmental units, hereinafter referredto as GAAP (generally accepted accounting principles). The accepted standard-setting body forestablishing governmental accounting and financial reporting principles is GASB (the GovernmentalAccounting Standards Board).
20
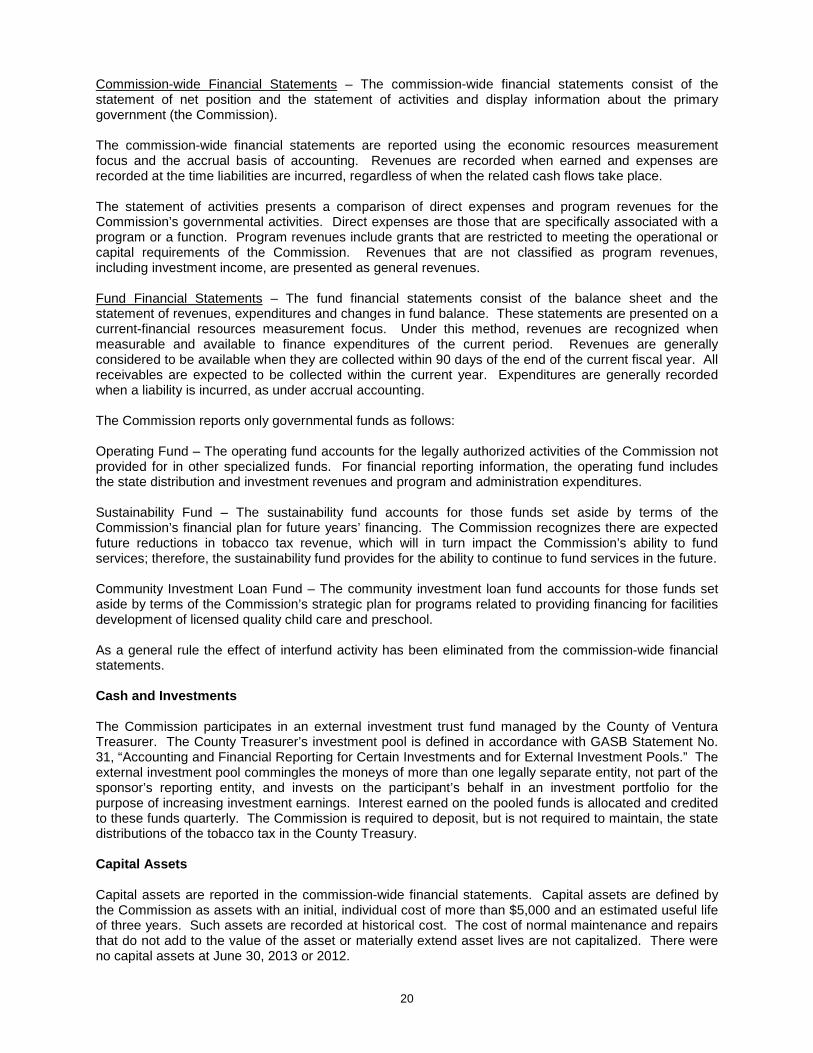
Commission-wide Financial Statements – The commission-wide financial statements consist of thestatement of net position and the statement of activities and display information about the primarygovernment (the Commission).
The commission-wide financial statements are reported using the economic resources measurementfocus and the accrual basis of accounting. Revenues are recorded when earned and expenses arerecorded at the time liabilities are incurred, regardless of when the related cash flows take place.
The statement of activities presents a comparison of direct expenses and program revenues for theCommission’s governmental activities. Direct expenses are those that are specifically associated with aprogram or a function. Program revenues include grants that are restricted to meeting the operational orcapital requirements of the Commission. Revenues that are not classified as program revenues,including investment income, are presented as general revenues.
Fund Financial Statements – The fund financial statements consist of the balance sheet and thestatement of revenues, expenditures and changes in fund balance. These statements are presented on acurrent-financial resources measurement focus. Under this method, revenues are recognized whenmeasurable and available to finance expenditures of the current period. Revenues are generallyconsidered to be available when they are collected within 90 days of the end of the current fiscal year. Allreceivables are expected to be collected within the current year. Expenditures are generally recordedwhen a liability is incurred, as under accrual accounting.
The Commission reports only governmental funds as follows:
Operating Fund – The operating fund accounts for the legally authorized activities of the Commission notprovided for in other specialized funds. For financial reporting information, the operating fund includesthe state distribution and investment revenues and program and administration expenditures.
Sustainability Fund – The sustainability fund accounts for those funds set aside by terms of theCommission’s financial plan for future years’ financing. The Commission recognizes there are expectedfuture reductions in tobacco tax revenue, which will in turn impact the Commission’s ability to fundservices; therefore, the sustainability fund provides for the ability to continue to fund services in the future.
Community Investment Loan Fund – The community investment loan fund accounts for those funds setaside by terms of the Commission’s strategic plan for programs related to providing financing for facilitiesdevelopment of licensed quality child care and preschool.
As a general rule the effect of interfund activity has been eliminated from the commission-wide financialstatements.
Cash and Investments
The Commission participates in an external investment trust fund managed by the County of VenturaTreasurer. The County Treasurer’s investment pool is defined in accordance with GASB Statement No.31, “Accounting and Financial Reporting for Certain Investments and for External Investment Pools.” Theexternal investment pool commingles the moneys of more than one legally separate entity, not part of thesponsor’s reporting entity, and invests on the participant’s behalf in an investment portfolio for thepurpose of increasing investment earnings. Interest earned on the pooled funds is allocated and creditedto these funds quarterly. The Commission is required to deposit, but is not required to maintain, the statedistributions of the tobacco tax in the County Treasury.
Capital Assets
Capital assets are reported in the commission-wide financial statements. Capital assets are defined bythe Commission as assets with an initial, individual cost of more than $5,000 and an estimated useful lifeof three years. Such assets are recorded at historical cost. The cost of normal maintenance and repairsthat do not add to the value of the asset or materially extend asset lives are not capitalized. There wereno capital assets at June 30, 2013 or 2012.
21
Compensated Absences
The Commission has estimated its liability for vested compensated absences to be $67,630 and $70,434at June 30, 2013 and 2012, respectively. Compensated absence obligations are reported in the fundfinancial statements as expenditures in the period paid. The estimated liabilities have been accrued inthe commission-wide financial statements and are included in accrued liabilities.
Unearned Revenue
Unearned revenue arises when assets are recognized before revenue recognition criteria have beensatisfied.
Equity Classifications
In the commission-wide financial statements, equity is classified as net position and displayed in threecomponents:
Net investment in capital assets – Consists of capital assets, net of accumulated depreciation andany outstanding debt related to the acquisition, construction or improvement of those assets. TheCommission did not have any of its net position invested in capital assets at June 30, 2013 and 2012.
Restricted net position – Consists of net position with legal limitations imposed on their use by Countyor State Ordinance, external restrictions by other governments, creditors or grantors. There were norestrictions of net position as of June 30, 2013 and 2012.
Unrestricted net position – All other net position that does not meet the definition of “restricted” or “netinvestment in capital assets”.
The Commission follows the provisions of GASB Statement No. 54 “Fund Balance Reporting andGovernmental Fund Type Definitions”. Accordingly, fund balance is divided into five classifications basedprimarily on the extent to which the Commission is bound to observe constraints imposed upon the use ofthe resources in the governmental funds. The classifications are as follows:
Nonspendable fund balance – includes amounts that cannot be spent because they are either (a) notin spendable form (e.g., prepaid expenses or inventory) or (b) legally or contractually required to bemaintained intact (e.g., resources that must be held intact pursuant to legal or contractualrequirements, such as revolving loan fund capital or the principal of an endowment).
Restricted fund balance - includes resources that are subject to constraints for which there areexternally enforceable legal restrictions (e.g., funding from the State Commission or foundations thatare legally restricted to specific uses; funds legally restricted by County, state, or federal legislature,or a government’s charter or constitution; amounts collected from non-spendable items, such as thelong-term portion of loan outstanding, if those amounts are also subject to legal constraints).
Committed fund balance - includes amounts that can only be used for specific purposes pursuant tolimitations imposed by the Board of Commissioners. Formal action is required by the Commission tocommit, to modify or remove the commitment. Committed fund balance also includes the minimumfund balance whereby up to six months of operating funds shall be maintained.
Assigned fund balance – includes amounts that are constrained by the Commission’s intent to beused for specific purposes, but are neither restricted nor committed. Unless formal authority isdelegated to another appointed body or official by the Board of Commissioners, the Board ofCommissioners shall be the level of authority to allocate resources to the assigned category.
Unassigned fund balance - includes fund balance that has not been classified into any of the othercategories.
When both restricted and unrestricted resources are available for use, it is the Commission’s policy to userestricted resources first, then unrestricted resources as they are needed.
22
Budgets and Budgetary Accounting
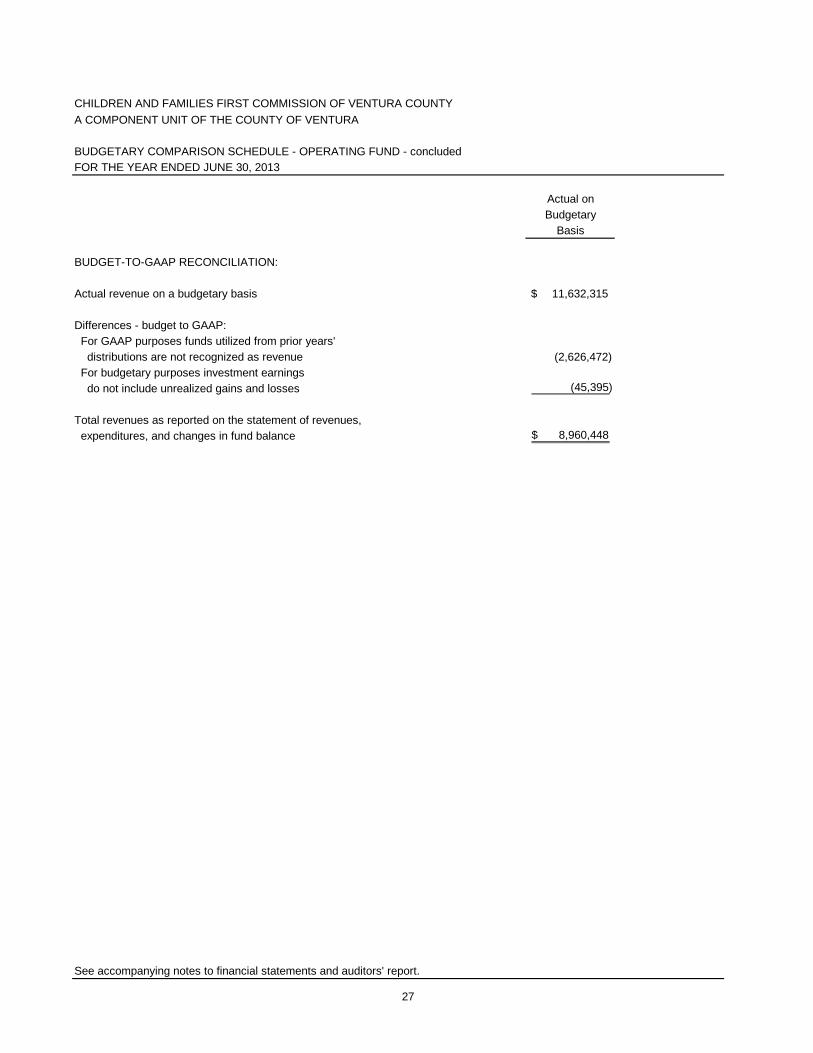
The Commission is legally required to prepare and submit a budget of expected expenditures to theVentura County Board of Supervisors and the Ventura County Children, Family, and CommunityCommission for their review. The Commission’s fiscal year 2012-13 budget was reviewed by the VenturaCounty Children, Family, and Community Commission (now known as the Community Commission forVentura County) and the Ventura County Board of Supervisors on June 10, 2012 and June 18, 2012,respectively. The budgetary basis of accounting is different from generally accepted accountingprinciples because for budgetary purposes investment earnings are recognized when earned. Undergenerally accepted accounting principles, investments and investment earnings include changes in fairvalues.
The accompanying Budgetary Comparison Schedule - Operating Fund and Budgetary ComparisonSchedule - Community Investment Loan Fund include the budgeted expenditures for the year, along withmanagement’s estimate of revenues for the year. Budgetary control is exercised at the fund level. Noexpenditures were planned for the Sustainability Fund.
Use of Estimates
The preparation of financial statements in conformity with generally accepted accounting principlesrequires management to make estimates and assumptions that affect certain reported amounts anddisclosures. Accordingly, actual results could differ from those estimates.
Subsequent Events
The Commission has evaluated subsequent events through October 8, 2013, the date which the financialstatements were available to be issued.
Reclassifications
Certain reclassifications have been made to the prior year financial statements in order to conform to thepresentation of the current year financial statements for comparative purposes.
2. CASH AND INVESTMENTS
The Commission’s carrying value of deposits with a bank was $168,143 and $97,065 at June 30, 2013and 2012, respectively. The corresponding bank balance was $261,362 and $555,228, respectively. Ofthe bank balance at June 30, 2013, $250,000 was covered by Federal deposit insurance. The remaininguninsured balance was covered by a written collateral agreement with its financial institution whereby anyuninsured deposits will be collateralized with eligible securities having a market value of at least 110% ofthe amount of the deposits.
At June 30, 2013 and 2012, the Commission had $32,846,391 and $35,639,454, respectively, held in anexternal investment pool in the County of Ventura. Investments are stated at fair value, per GASBStatement 31 requiring fair value reporting of all investments. The fair value of the County’s pooledinvestments was determined by the County’s investment advisory firm. The Commission’s investmentsinclude recognized but unrealized net losses of $(50,706) and unrealized net gain of $57,739 as of June30, 2013 and 2012, respectively. Because the County’s investment practice is to generally holdinvestments until maturity, the amount to be collected over the life of the security is known and the risk ofmarket losses is minimized. Therefore, while potential gains or losses are recognized and reportedbecause of the County’s investment policy, they are not anticipated to be realized.
The Commission is authorized under California Government Code to make direct investments. In January2009, the Commission adopted an investment policy to provide for the prudent investment of funds andthe effective management of investment activities, including short-term investments to meet daily cashflow requirements and long-term investments to meet future goals. A minimum of one (1) year ofoperating funds must be maintained in the Ventura County Treasury Investment Pool or the Local AgencyInvestment Fund (LAIF). Remaining funds beyond the minimum of 1 year operating funds may be

23
invested in the Ventura County Treasury Investment Pool or elsewhere as outlined in the Eligible,Authorized, and Suitable Investments section of the Policy. An investment plan is developed andapproved annually by the Commission. All funds are currently being invested in the Ventura CountyInvestment Pool. As of June 30, 2013, the County portfolio received a rating of AAAf by Standard &Poor’s (S&P), the highest possible rating given by the agency. The portfolio was rated S1+, also thehighest ranking given by S&P, for maintaining sufficient liquidity to meet cash flow needs.
The County Treasurer maintains a cash investment pool for all funds of the County and other agencies forwhich the County treasury is the depository. Interest earned on the pooled funds is allocated andcredited to these funds quarterly. Interest is apportioned to the Commission based on the average dailybalances on deposit with the County Treasurer. Investment earnings are accrued at year-end.
The County Treasurer invests Commission funds in accordance with the state statutes and the County’sinvestment policy as approved by the Treasury Oversight Committee and the County Board ofSupervisors. The policy emphasizes safety, liquidity, and yield and follows the “prudent investor rule.”The County Treasurer is authorized by Government Code Section 53635 to invest in U.S. GovernmentTreasury and Agency Securities, certain commercial paper, bankers’ acceptances, corporate bonds andnotes, repurchase agreements and the State Treasurer Local Agency Investment Fund.
3. DUE FROM OTHER GOVERNMENTS
The due from other governments primarily represents amounts due to the Commission from the CaliforniaChildren and Families Commission for Prop 10 related revenues.
4. LOAN RECEIVABLE
The Commission has a loan receivable from a preschool provider which was granted under the provisionsof the Community Investment Loan Fund. The loan has an interest rate of 4.25%, a maturity date ofSeptember 1, 2019 and is secured by all assets of the business and personal guarantees. Monthlyprinciple and interest payments of $2,412.23 are required through maturity of the loan. The loan isadministrated by the Economic Development Collaborative-Ventura County.
5. INTERFUND TRANSACTIONS
On June 21, 2012, the Commission approved, as part of its financial plan, the transfer of $1,400,000 fromthe Community Investment Loan Fund to the Operating Fund for sustaining program funding levels.
6. AB 99 LIABILITY
The State of California (State) passed Assembly Bill 99 (AB 99) in March 2011, which required First 5Commissions to deposit $1 billion to a newly established State Children and Families Health and HumanServices Fund ($950 million from county commissions and $50 million from the state commission). Allcounty commissions, except the smallest, were to pay the State of California one-half the amount of theirfund balance as of June 30, 2010. This amounted to $20,075,724 for Ventura County and was reflectedas a liability as of June 30, 2011. This amount was to be remitted to the State by June 30, 2012.
AB 99 was challenged in court on the basis that it violated fundamental premises of Proposition 10. InNovember 2011, a court ruling declared AB 99 invalid. The State did not appeal the decision. As a result,the liability of $20.1 million has been extinguished, which enables the Commission to continue with itslong-term financial plan and utilize its net position for local strategic initiatives and program sustainability.
The recognition of the AB 99 liability was recorded as an extraordinary item in FY 2010-11. Theextinguishment of the AB 99 liability was recorded in FY 2011-12 as an extraordinary item.
24
7. OPERATING LEASE
The Commission leases office space from a third party under a lease which expires in December 2015.The future minimum rental payments due under the lease are as follows:
Year ending June 30:2014 $ 65,5702015 67,5382016 34,268
$ 167,376
Rent expense totaled $65,178 and $63,893 for the years ended June 30, 2013 and 2012, respectively.
8. RETIREMENT PLAN
The Commission has established a SIMPLE (savings incentive plan for employees) IRA retirement plan inwhich employees can elect to contribute a percentage of their pre-tax salary towards. Under this plan, aseparate IRA account is established for each participant and each IRA account is self-directed; thus, theemployees control their investments. The Commission matches contributions up to 3% of an employee’sannual salary, subject to IRS limitation for maximum contributions. The contribution by the Commissionfor the fiscal year ended June 30, 2013 and 2012 was $24,843 and $23,952, respectively.
9. RISK MANAGEMENT
The Commission is exposed to various risks of loss related to general liability and workers’ compensation.The Commission has general liability insurance to $1,000,000 per occurrence. There have been noclaims or insurance settlements.
10. ECONOMIC DEPENDENCY
The Commission is largely dependent on Proposition 10 Tobacco funds for its revenue. Any reduction tothe tobacco tax revenue will impact the Commission’s ability to fund services.
11. RELATED PARTY TRANSACTIONS
Certain members of the Commission are contractors, directors, or employees of agencies that are fundedby the Commission and, accordingly, may receive payments or compensation from those agencies. Forfiscal year 2012-13, the Commission entered into contracts with these agencies to provide funding of$3,727,817. Amounts paid under these contracts amounted to $3,183,216. The Commission’s conflict ofinterest policy prohibits a commissioner from any decision making process that involves a related agency.
12. PROGRAM EVALUATION
The Commission spent $268,259 on program evaluation during the year ended June 30, 2013 whichincludes the evaluation software system, the annual evaluation report, training/capacity building,coordination of evaluation activities, and technical assistance for funded programs. The Commissionspent $300,517 on program evaluation for the year ended June 30, 2012.
13. FUNDING FOR PURCHASE OF FIXED ASSETS AND INFRASTRUCTURE PROJECTS
The Commission adopted a policy in 2000 to provide for the granting of funds for the acquisition of fixedassets. In February 2012, the Commission amended the policy and incorporated provisions forinfrastructure projects. In connection with this policy, any funds granted for the purchase of fixed assets orinfrastructure projects over $5,000 are structured as no-interest forgivable loans for each year that thegrant recipient remains in business and continues operation of the program for which the asset waspurchased or the infrastructure investment was made. The Commission recognizes the funding for theacquisition of fixed assets as program expenditures in the year granted. Grant recipients are expected tocontinue operations of the program for the determined length of time for which the asset was purchasedor the infrastructure project was made.

25
As of June 30, 2013, the Commission had granted funds totaling $2,021,671 for the purchase of fixedassets and infrastructure projects that are currently active with $494,933 remaining to be forgiven throughthe year ending June 30, 2020.
____________________________________________________________________________________
REQUIRED SUPPLEMENTARY INFORMATION
A COMPONENT UNIT OF THE COUNTY OF VENTURA
BUDGETARY COMPARISON SCHEDULE - OPERATING FUND
FOR THE YEAR ENDED JUNE 30, 2013
Actual on Variance
Budgetary Favorable
Original Final Basis (Unfavorable)
REVENUES
Program Revenues:
Proposition 10 apportionment 7,707,456$ 7,707,456$ 7,878,290$ 170,834$
First 5 California Child Signature Program 828,750 828,750 698,703 (130,047)
First 5 California CARES Plus 103,750 103,750 97,581 (6,169)
Federal grant revenue:
Race to the Top 449,598 449,598 219,460 (230,138)
Center for Disease Control and Prevention 30,000 30,000 21,292 (8,708)
Grants - Other 18,750 18,750 20,174 1,424
Other
Funds available from prior years' Proposition
10 distributions 3,226,203 3,629,716 2,626,472 (1,003,244)
Total program revenues 12,364,507 12,768,020 11,561,972 (1,206,048)
General revenues -
Interest earnings 76,593 76,593 67,548 (9,045)
Proposition 10 SMIF - - 2,795 2,795
Total general revenues 76,593 76,593 70,343 (6,250)
Total revenues 12,441,100$ 12,844,613$ 11,632,315$ (1,212,298)$
EXPENDITURES
Program expenditures:
Neighborhoods for Learning 6,500,000$ 6,735,080$ 6,473,234$ 261,846$
Countywide Strategies 2,135,750 2,191,250 2,115,071 76,179
Countywide Preschool 1,718,350 1,828,283 1,267,142 561,141
CARES Program 415,000 415,000 369,975 45,025
Community Outreach and Education 190,000 190,000 123,705 66,295
Program Management 460,000 460,000 404,006 55,994
Resource Development 90,000 90,000 64,122 25,878
Evaluation expenditures - Results-based
Accountability and Quality Assurance 330,000 330,000 268,259 61,741
Administrative expenditures 600,000 600,000 542,309 57,691
Equipment replacement 5,000 5,000 4,492 508
Total expenditures 12,444,100$ 12,844,613$ 11,632,315$ 1,212,298$
See accompanying notes to financial statements and auditors' report.
CHILDREN AND FAMILIES FIRST COMMISSION OF VENTURA COUNTY
Budgeted Amounts
26
A COMPONENT UNIT OF THE COUNTY OF VENTURA
BUDGETARY COMPARISON SCHEDULE - OPERATING FUND - concluded
FOR THE YEAR ENDED JUNE 30, 2013
Actual on
Budgetary
Basis
BUDGET-TO-GAAP RECONCILIATION:
Actual revenue on a budgetary basis 11,632,315$
Differences - budget to GAAP:
For GAAP purposes funds utilized from prior years'
distributions are not recognized as revenue (2,626,472)
For budgetary purposes investment earnings
do not include unrealized gains and losses (45,395)
Total revenues as reported on the statement of revenues,
expenditures, and changes in fund balance 8,960,448$
See accompanying notes to financial statements and auditors' report.
CHILDREN AND FAMILIES FIRST COMMISSION OF VENTURA COUNTY
27
A COMPONENT UNIT OF THE COUNTY OF VENTURA
BUDGETARY COMPARISON SCHEDULE - COMMUNITY INVESTMENT LOAN FUND
FOR THE YEAR ENDED JUNE 30, 2013
Actual on Variance
Budgetary Favorable
Original Final Basis (Unfavorable)
REVENUES/INFLOWS
Loan repayments 34,656$ 34,656$ 10,850$ (23,806)$
Funds available from prior years' Proposition
10 distributions 1,078,146 1,078,146 705 (1,077,441)
Total revenues/inflows 1,112,802 1,112,802 11,555 (1,101,247)
General revenues -
Interest earnings 40,518 40,518 16,765 (23,753)
Total revenues 1,153,320$ 1,153,320$ 28,320$ (1,125,000)$
EXPENDITURES/OUTFLOWS
Loan implementation 28,320$ 28,320$ 28,320$ -$
Loan disbursements 1,125,000 1,125,000 - 1,125,000
Total expenditures/outflows 1,153,320$ 1,153,320$ 28,320$ 1,125,000$
Actual on
Budgetary
Basis
BUDGET-TO-GAAP RECONCILIATION:
Actual revenue on a budgetary basis 28,320$
Differences - budget to GAAP:
For GAAP purposes loan repayments
are not recognized as revenue (10,850)
For GAAP purposes funds utilized from prior years'
distributions are not recognized as revenue (705)
For budgetary purposes investment earnings
do not include unrealized gains and losses (5,814)
Total revenues as reported on the statement of revenues,
expenditures, and changes in fund balance 10,951$
See accompanying notes to financial statements and auditors' report.
CHILDREN AND FAMILIES FIRST COMMISSION OF VENTURA COUNTY
Budgeted Amounts
28

SUPPLEMENTARY INFORMATION
CH
ILD
RE
NA
ND
FA
MIL
IES
FIR
ST
CO
MM
ISS
ION
OF
VE
NT
UR
AC
OU
NT
Y
AC
OM
PO
NE
NT
UN
ITO
FT
HE
CO
UN
TY
OF
VE
NT
UR
A
SU
PP
LE
ME
NT
AL
SC
HE
DU
LE
OF
FIR
ST
5C
ALIF
OR
NIA
(F5C
A)
FU
ND
ING
FO
RT
HE
YE
AR
EN
DE
DJU
NE
30,
2013
RE
VE
NU
ES
CH
AN
GE
INN
ET
PO
SIT
ION
NE
TP
OS
ITIO
N
Pro
gra
mor
Pro
ject
Title
F5C
AF
UN
DS
EX
PE
ND
ITU
RE
S1
NE
TP
OS
ITIO
NB
egin
nin
gof
Year
End
of
Year
Child
Sig
natu
reP
rogra
mR
FA
1F
5C
AP
rogra
mF
unds
$530,3
07
$530,3
07
$0
$0
$0
F5C
AC
oord
ination
Funds
$100,0
00
$100,0
00
County
,LocalF
unds
$583,2
77
Child
Sig
natu
reP
rogra
mR
FA
2F
5C
AP
rogra
mF
unds
$68,3
96
$68,3
96
$0
$0
$0
CA
RE
SP
lus
F5C
AP
rogra
mF
unds
$97,5
81
$97,5
81
$0
$0
$0
Imple
menta
tion
(Phase
2)
County
,LocalF
unds,
CA
RE
S$277,4
81
Imple
menta
tion
(Phase
2)
County
,LocalF
unds,
Adm
inis
tration
$15,2
62
TO
TA
LF
5C
AF
UN
DS
$796,2
84
$1,6
72,3
04
$0
$0
$0
1E
xpenditure
sre
port
ed
must
meet
or
exc
eed
sta
tem
atc
hre
quirem
ents
,if
applic
able
Se
ea
cco
mp
an
yin
gn
ote
sto
fin
an
cia
lsta
tem
en
tsa
nd
au
dito
rs'r
ep
ort
.
29

OTHER REPORTS