Embed Size (px)
Citation preview
CHILDREN’S MBENCHMARK
FOURTH YE
Janu
FUN
The Annie E. C
PREP
Dougherty Manage
ENTAL HEALTH ING PROJECT AR REPORT
ary 2005
DED BY:
asey Foundation
ARED BY:
ment Associates, Inc.
ACKNOWLEDGEMENTS SUPPORT FOR THIS PROJECT Dougherty Management Associates is pleased to acknowledge the support of The Annie E. Casey Foundation throughout the four years of the Children’s Mental Health Benchmarking Project, and especially in this fourth year. We are immensely grateful to Patrick McCarthy for his engagement with and support of our work, and for his patience with the lengthy process involved in gathering and analyzing these types of data. We are also grateful to the Center for Health Care Strategies, which has provided support to the project for two years, and to The Robert Wood Johnson Foundation which enabled us to present the Children’s Mental Health Benchmarking Institute in 2001. We are also most appreciative of those who have contributed data to the project, and particularly to those who have participated in Year Four by engaging in lengthy telephone conversations with us, clarifying our understanding of their systems and their data, and in some cases submitting additional data. We trust that, by enabling them to compare themselves with others in a more meaningful way, this report will compensate them for their efforts. Even while we thank our supporters and participants most sincerely for their invaluable contributions to this project, we take full responsibility for the analysis and interpretation of the data that we present in this report.
CHILDREN’S MENTAL HEALTH BENCHMARKING PROJECT
FOURTH YEAR REPORT
TABLE OF CONTENTS Acknowledgements
Executive Summary........................................................................................................... Executive Summary - 1
Methodology............................................................................................................Executive Summary - 2 Benchmarks..............................................................................................................Executive Summary - 2 Factors Related to Variation...................................................................................Executive Summary - 3 Recommendations...................................................................................................Executive Summary - 4 Conclusion................................................................................................................Executive Summary - 5
I. Introduction....................................................................................................................................................1 Four Year Project ............................................................................................................................................1 Organization of the Report ...........................................................................................................................3
II. Key Aspects of the Structure and Organization of Children’s Public Mental Health Systems .....4
Key Financial and Administrative Entities.................................................................................................4 Target Population...........................................................................................................................................5 Covered Mental Health Services..................................................................................................................6 Organizational Structure...............................................................................................................................7 Reporting Conventions .................................................................................................................................9 Conclusion.....................................................................................................................................................10
III. Analytic Framework ...................................................................................................................................11
Data Collection Process ...............................................................................................................................11 Key Variables for Analysis and Analytic Categories ..............................................................................12 Explanatory Factors .....................................................................................................................................13 Methodology.................................................................................................................................................19 Conclusion.....................................................................................................................................................19
IV. Summary of Benchmarks and Correlates of Variation ........................................................................20
Medicaid Benchmarks .................................................................................................................................20 Mental Health Authority Benchmarks ......................................................................................................23 Total MHA plus Medicaid Benchmarks ...................................................................................................25 Factors Related to Variation........................................................................................................................28 Limitations ....................................................................................................................................................30 Conclusions...................................................................................................................................................30 Recommendations........................................................................................................................................31
Dougherty Management Associates, Inc. Table of Contents -Page 1
Appendix A. Analyzing Mental Health Services for Medicaid Eligible Children .................................34 Introduction ..................................................................................................................................................34 State Policy and Demographic Factors affecting Medicaid Enrollment and Caseload ......................34 Medicaid Penetration...................................................................................................................................36 Correlates of Medicaid Penetration ...........................................................................................................38 Medicaid Patterns of Service Utilization...................................................................................................41 Medicaid Expenditures ...............................................................................................................................43 Correlates of Medicaid Expenditures Per Enrollee .................................................................................47 Conclusion.....................................................................................................................................................50
Appendix B. Mental Health Authority Services ............................................................................................51 Total Children Served..................................................................................................................................52 Factors Related to Access ............................................................................................................................55 Utilization......................................................................................................................................................60 Expenditures .................................................................................................................................................63 Factors Related to Expenditures.................................................................................................................67 Conclusion.....................................................................................................................................................73
Appendix C. Total Public Mental Health Services........................................................................................75 Introduction ..................................................................................................................................................75 Access: Total Children Served...................................................................................................................75 Utilization by Level of care .........................................................................................................................79 Factors Related to Variation in Children Served .....................................................................................80 Children’s Mental Health Service Expenditures......................................................................................85 Factors Relating to Variation in Expenditures .........................................................................................91 Conclusion.....................................................................................................................................................97
Dougherty Management Associates, Inc. Table of Contents -Page 2
CHILDREN’S MENTAL HEALTH BENCHMARKING PROJECT
FOURTH YEAR REPORT EXECUTIVE SUMMARY
The President’s New Freedom Commission on Mental Health emphasized the need to reduce the fragmentation in public mental health services resulting from the administration of those services by many separate state agencies. Nowhere is this fragmentation more of a problem than with children’s mental health services. While children’s “systems of care” projects have addressed this fragmentation through their financing and service strategies, progress has been limited beyond the boundaries of the grant sites. For the past four years, the Children’s Mental Health Benchmarking Project, sponsored by the Annie E. Casey Foundation with support from the Center for Health Care Strategies and the Robert Wood Johnson Foundation, has collected data from state Medicaid agencies and Mental Health Authorities on access to, utilization of and expenditures on children’s mental health services. While the principal goal of the project has been to provide states and counties with benchmarks for performance improvement, it has also documented the scope and impact of the fragmentation in the “system” of care for children with mental health needs.1
Medicaid and Mental Health Authority (MHA) systems constitute the primary sources of children’s mental health care and serve an overlapping clientele. Medicaid agencies are responsible for serving three primary groups of children: those who are eligible on the basis of low family income, those in state custody (primarily foster children), and those that meet criteria for disability. These three distinct subgroups have differing service needs, and in general foster and disabled children need the more intensive services. The State Children’s Health Insurance Program (SCHIP) also serves income eligible children, and many states administer it jointly with their Medicaid program. The priority population for MHAs is children with serious emotional disturbance (SED). Because most of these children meet at least one category of Medicaid eligibility, Medicaid finances many of the services they need. MHA resources and sliding fees generally cover most of the remaining children as well as services not covered by Medicaid or private insurance, although their total dollar amount is generally quite small relative to Medicaid expenditures and may not meet all the need. In the first three years of the Benchmarking Project our primary finding was one of dramatic variation among states, with 14 to 17 fold differences between the lowest and highest measures of children served per thousand and 20 to 30 fold differences in average expenditures per child served. This remarkable variation made us increasingly aware of the need to identify confounding factors that complicate between-state comparisons. Therefore, in the fourth and final year of the project we have identified and sought to account for such factors and to analyze their impact on variation. 1 It is important to acknowledge here that our study does not describe the services that all children with serious emotional disorders receive in every place where they receive them. We describe the services children receive through Medicaid and Mental Health Authority systems, but not those they receive through education, child welfare or juvenile justice systems, or under private insurance. Furthermore, we obviously do not discuss children who need but do not receive services, nor can we know how many such children there are.
Dougherty Management Associates, Inc. Executive Summary – Page 1
METHODOLOGY
The fourth year project studied Year 3 data from the 12 states and 3 county or multi-county programs that had submitted both MHA and Medicaid data, and others that had submitted the most extensive data. Our study sample consisted of 29 states and four counties. We conducted extensive interviews with these states to refine our understanding of their data and of the financing and organization of their mental health services for children. In some cases, states provided amended or additional data. We also tested demographic, environmental and structural factors to determine whether they were related to variation in access and expenditures, using t-tests to calculate the significance of difference between means of categorical variables and bi-variate correlation coefficients. Our methods could not account for all differences in state data and reporting conventions, and in some cases we estimated combined Medicaid and MHA counts of children served. However, given the magnitude of the variation between states, we believe that the remaining inconsistencies and estimation ranges would not appreciably change our overall conclusions.
BENCHMARKS
Our survey requested data in a way that should have resulted in an unduplicated and complete count of MHA services and Medicaid services, but states were not always able to give us what we had requested, resulting in partial data and duplications between Medicaid and MHA data.
Medicaid
For example, states did not always provide us with data for all Medicaid enrolled children. Distinguishing when a state’s data excluded a significant subset of services or enrollees was important in analyzing rates of penetration, utilization and cost within the enrolled population. Medicaid penetration rates for the 12 states with complete data on all enrollees and services exceeded those with partial data by 3%. The range of penetration rates was also somewhat reduced; the range for all programs reporting was 2% to 16% while the range of programs with complete data ranged from 6% to 16%. Expenditures per enrollee varied more widely than penetration in these states, with a range of $54 to $890, more than a fifteen-fold difference.
MHA
It was difficult to compare MHAs because their reporting differed considerably depending on whether they included capitated Medicaid services, whether they were responsible for all Medicaid enrollees, whether they administered child welfare or juvenile justice resources, and whether their providers reported services they billed to Medicaid or other payers. Some of these reporting conventions result in duplicate counts of Medicaid children served in the MHA community based provider network. In addition, most MHAs are unable to look at the utilization and costs of their priority population who receive Medicaid-paid residential, community, or private hospital care. Specifying whether MHA data included Medicaid services and costs reduced variation considerably. States reporting only those children served by MHA resources averaged 9 children served per thousand children in the population compared to an average of 24 per thousand for states that also counted children receiving Medicaid or privately paid services from MHA contracted community providers. (We excluded 6 states or counties whose data included all Medicaid services.) This difference demonstrates the significance of Medicaid funding in serving these children. MHA service expenditures averaged $34 per year per child in the population. The range was considerable because of a single outlier, with the remaining 14 data points falling between $10 and $61 dollars per child in the population, a range that still varies by a factor of 6 but is considerably less varied than the range of Medicaid expenditures.
Dougherty Management Associates, Inc. Executive Summary – Page 2
Total MHA plus Medicaid
Combining Medicaid and MHA data should provide fairer comparisons among states than analyzing Medicaid or MHA data alone because it eliminates the effects of states’ different choices about dividing responsibility between the Medicaid system and MHA networks. MHAs capitated for all Medicaid services provided unduplicated counts, while it was necessary to add Medicaid and MHA data for other states, and to account for any duplication. Some states administer SCHIP jointly with Medicaid and included SCHIP services with their Medicaid data, while others did not. States that included data on their SCHIP children averaged 39 children served per thousand compared to 27 in states that excluded SCHIP data. States including SCHIP averaged total combined expenditures of $233 per capita while those excluding SCHIP averaged $119. The range in expenditure rates was extraordinary, from a low of $49 to a high of $561 for those states including SCHIP expenditures.
In this sample, combining Medicaid and MHA access data resulted in considerably less variation than that found in access to MHA provider services, but somewhat more variation than in Medicaid penetration rates. Combined rates of expenditures had a 10-fold difference between highest and lowest rates, considerably exceeding the limited variation in MHA expenditure rates. Having accounted for some significant sources of variation, and derived a set of reasonably comparable data points, we were left with variations that continue to indicate considerable disparity among states in access to and provision of services. This result is consistent with Roland Sturm’s finding that between-state variations in access to mental health care were not explained by differences in the racial/ethnic or socio-economic makeup of states and, in fact, exceeded racial/ethnic and family income disparities. Further, Sturm found that such disparities were not related to other indications of need.2
FACTORS RELATED TO VARIATION
We tested over 30 demographic, environmental and structural factors, and found 18 that were significantly associated with access and expenditure measures. We used simple correlations and T-tests. The correlations do not indicate causality, nor account for multiple factors operating at the same time, and our findings were limited by the small sample size. However, the analysis suggests areas for further investigation.
Medicaid
• Medicaid penetration rates are negatively correlated with state income levels and the income eligibility standards for Medicaid. In contrast, Medicaid expenditure rates are positively correlated with the enrollment of two high need populations, children with disabilities and those in out of home care, and with the percentage of funding for community and residential services.
Mental Health Authority
• More expansive Medicaid eligibility was associated with higher access, while higher percentages of African-Americans in the state child population were correlated with lower rates of access.
• States with more psychiatrists per hundred thousand served more poor children and had higher rates of MHA mental health expenditures.
Dougherty Management Associates, Inc. Executive Summary – Page 3
2 Sturm, Roland; Ringel, Jeanne S.; Andreyeva, Tatiana, “Geographic Disparities in Children’s Mental Health Care”, Pediatrics, Volume 112, No. 4.
• States rated lower on the KidsCount composite measure of child well being and with higher rates of teen death by accident, suicide and homicide, had lower rates of MHA expenditures. Access was also lower in the states ranked lower on child well being.
• Higher inpatient and residential spending per child was correlated to higher overall expenditure rates.
• States with higher rates of general healthcare expenditures served fewer children per thousand. Those states with higher incomes, however, spent more on MHA services.
Combined Medicaid and MHA
• Lower inpatient utilization and higher rates of expenditures on community services were associated with higher total expenditures. Higher rates of expenditures on community services were also associated with higher rates of poor children served.
• States with more psychiatrists per hundred thousand served more children and had higher rates of combined mental health expenditures.
• States with low rates of child uninsurance had higher rates of mental health expenditures. Those spending more on all health and hospital services had lower rates of access for children.
Similar to Roland Sturm, we found that relatively little of the variation in access is spending was related to differences in income, ethnicity or ages of the states’ total populations or children served. While Medicaid penetration and MHA spending rates were correlated with state income levels and percentage of African-Americans in the population was negatively correlated with MHA access, other demographic variables showed non-significant correlations with access and expenditures. The number of psychiatrists per hundred thousand, however, stands out as an important factor in both access and expenditures. Strikingly, the KidsCount composite measure of child well-being is negatively correlated with access to MHA services and to the rate of MHA expenditures, suggesting several possible explanations: that states with lower levels of child well-being don’t or can’t address that need as well as other states address theirs, that investing in children’s mental health services helps to reduce teen deaths and increase child well-being (two of our indicators of need); or perhaps that there are some confounding factors in the KidsCount measure relating to state spending or budgetary levels that produce the result. Given the long-standing use and testing of the KidsCount measure, this is an important area for further investigation.
RECOMMENDATIONS Medicaid state plans, waivers and mental health block grants allow states to make a variety of policy choices to meet their own service needs, health delivery systems, and organizational structures. However, in a public mental health system in which a significant portion of the resources is federal, the degree of disparity our data describe seems excessive. While states’ flexibility in use of resources is important, we believe it is also a federal responsibility to minimize disparities where possible by ensuring that program parameters account appropriately for differences in states’ needs and resource bases, and by holding every state accountable for its performance. To monitor and reduce geographic disparities among states and to carry out the President’s New Freedom Commission’s recommendation for comprehensive planning of mental health services will require comprehensive, consistently defined system level measures on access, utilization and cost. The experience of the Children’s Mental Health Benchmarking project and similar projects provide important lessons for state and federal officials.
Dougherty Management Associates, Inc. Executive Summary – Page 4
Measurement of MHA Services
• States should develop methods for analyzing all services received by their priority populations of children with SED, regardless of payer; their analyses should combine clinical and outcome data with utilization and cost data.
Measurement of Medicaid Services
• Consistent definitions and reporting conventions are needed for mental health services. Stratification of major eligibility categories such as TANF, SSI and SCHIP is essential.
Comprehensive Planning Across Multiple Agencies
• States should track mental health services for children across not only their Medicaid and MHA systems, but also their child welfare, juvenile justice and education systems.
• In order to do so, states need to map their children’s mental health delivery and reporting systems to clearly identify duplications and gaps in reporting, and develop strategies to account for or eliminate them.
• States need to identify and define the populations served by their public mental health systems, consistently identify these groups across all relevant state agencies and capture all relevant clinical, service, and expenditure data for them.
• Performance measures similar to those collected in the benchmarking project should be used by states to review system performance and address regional variation and gaps in care.
Cross System Benchmarking and Quality Improvement
• To increase the return on investing in developing comparative measures among states, small sets of similarly organized states should commit to benchmarking to each other over time. They can function as learning communities with opportunities for evaluating natural experiments.
CONCLUSION
For two or more decades, the promise of comprehensive data for policy and decision making has been an elusive goal despite the dramatic expansion of information technology. In few places is this more evident and important than in children’s mental health. As the four years of the Children’s Mental Health Benchmarking Project have demonstrated, the field is incrementally moving toward a point where states and public mental health systems are able to consistently and reliably report on key administrative performance measures. While more progress and considerable technical assistance is certainly needed, we are encouraged by the efforts of states to participate in this project and hopefully to benefit from the results. We believe that the extremely wide variation in access, utilization and spending on children’s mental health services demonstrated by this and other studies, warrants a concerted, interagency effort by the federal government in concert with state administrators to identify the sources of variation and to identify approaches to reduce this variation in key areas. As the field moves toward more consistent reporting standards, and develops consensus on the factors that are necessary to stratify and explain the results, we hope that this project and the efforts that preceded it provide the foundation for a more effective and useful system for reporting on and benchmarking children’s public mental health services.
Dougherty Management Associates, Inc. Executive Summary – Page 5
CHILDREN’S MENTAL HEALTH BENCHMARKING PROJECT
FOURTH YEAR REPORT I. INTRODUCTION
For more than two decades, initiatives like the Mental Health Statistics Improvement Program and the National Committee for Quality Assurance Health Plan, Employer Data and Information Set have been formulating and refining performance measures to inform policy and decision-making. Performance measures from these efforts have been most successfully applied within mental health systems or to compare health plans. Comparisons among states offer important data for decision-making but needed data has not been available until recently and differences in structures and reporting make such comparisons difficult to interpret. The goal of the Children’s Mental Health Benchmarking Project has been to begin the benchmarking process among states by collecting and disseminating data on access, utilization and cost. The Annie E. Casey Foundation has supported the project since 1999. The Robert Wood Johnson Foundation and Center for Health Care Strategies, Inc. provided additional support. The Children’s Mental Health Benchmarking Project has recognized that state mental health and Medicaid agencies have distinct yet interrelated roles in financing and administering state mental health care for children. While the mental health authority (MHA) is generally the primary source of public mental health policies, comparisons across states, as well as intra-state planning, must include Medicaid information since Medicaid funds a significant portion of the children’s mental health system. This project therefore has collected data from both Medicaid and mental health agencies.
FOUR YEAR PROJECT
The current report represents the culmination of a four-year process, beginning with an exploratory study conducted in 2000 among thirteen states. In 2001 and 2002 we e-mailed or mailed Data Collection Instruments to the mental health authorities (MHAs) and Medicaid agencies of all 50 states, the District of Columbia and 6 counties. We followed up several times with potential respondents by e-mail, mail and telephone, encouraging them to submit data. We used the data we received and population data from the 2000 United States Census to develop a series of indicators in four domains: access, utilization, expenditures and intersystem involvement. Year Three Results
In Year Three, calendar 2002, we received data from 41 jurisdictions: 36 states, four counties and the District of Columbia. Fourteen of these jurisdictions submitted both Medicaid and MHA data. Our dataset included MHA data from 32 jurisdictions and Medicaid data from 23 jurisdictions. We compiled the indicators into a chart book, shared this with all participants, made many needed changes and disseminated the results to the public through our web site (www.doughertymanagement.com). While this work took the important step of analyzing both Medicaid and MHA funded children’s mental health services, it is important to note that it does not constitute a complete picture of states’ public mental health systems for children. We have not gathered data on mental health services delivered by state, county or local education, child welfare or juvenile justice agencies, many of which expend significant funds on mental health care for children.
Dougherty Management Associates, Inc. Chapter I – Page 1
Year Four
In the fourth year of the project, we did not conduct another round of data collection. Rather, we engaged in a detailed analysis of the data we had received in 2002. We reviewed a wide variety of reports, studies and Web sites for potential explanatory variables, and studied the Web sites of participating states in order to understand their systems of service provision and funding. Most importantly, we engaged in a dialogue with each state whose data we are presenting in the current report. We interviewed knowledgeable individuals in the state agencies, asking them to explain key aspects of their operations and funding systems. We also requested clarification of data and, in some cases, correction of apparent errors. Informants reviewed summaries of the structure of their Medicaid and Mental Health Authority financed children’s mental health services. Year Four Study Sample
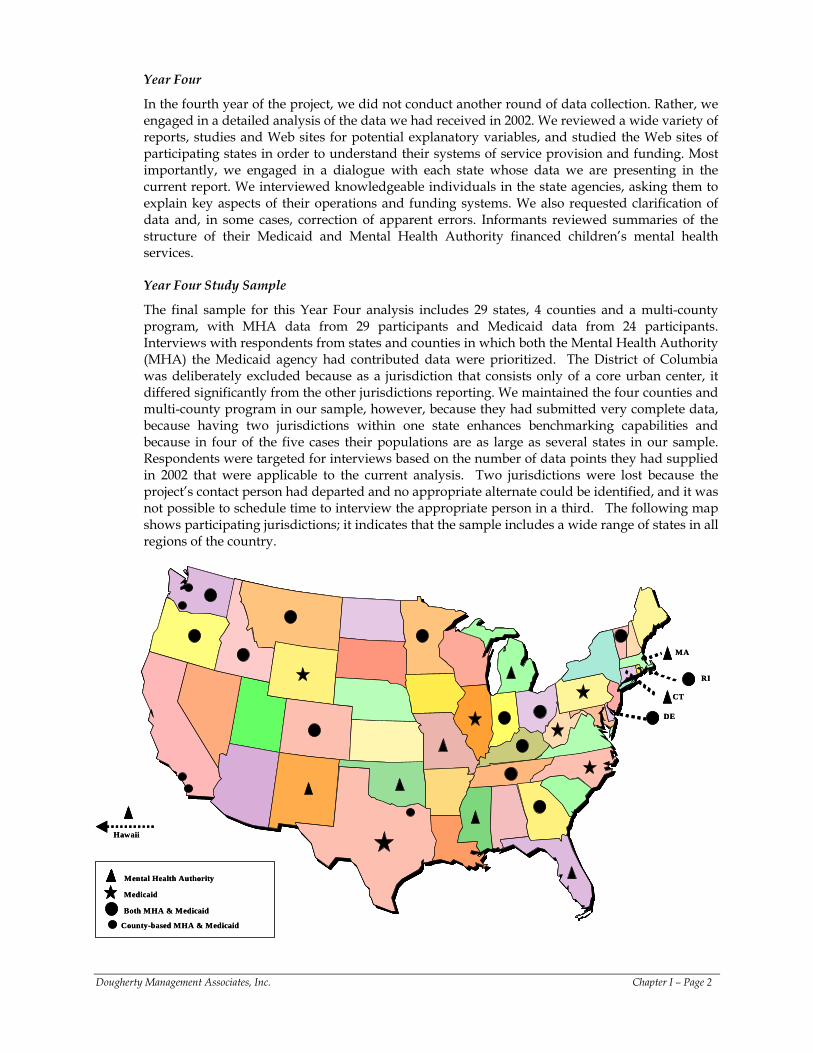
The final sample for this Year Four analysis includes 29 states, 4 counties and a multi-county program, with MHA data from 29 participants and Medicaid data from 24 participants. Interviews with respondents from states and counties in which both the Mental Health Authority (MHA) the Medicaid agency had contributed data were prioritized. The District of Columbia was deliberately excluded because as a jurisdiction that consists only of a core urban center, it differed significantly from the other jurisdictions reporting. We maintained the four counties and multi-county program in our sample, however, because they had submitted very complete data, because having two jurisdictions within one state enhances benchmarking capabilities and because in four of the five cases their populations are as large as several states in our sample. Respondents were targeted for interviews based on the number of data points they had supplied in 2002 that were applicable to the current analysis. Two jurisdictions were lost because the project’s contact person had departed and no appropriate alternate could be identified, and it was not possible to schedule time to interview the appropriate person in a third. The following map shows participating jurisdictions; it indicates that the sample includes a wide range of states in all regions of the country.
Medicaid
Both MHA & Medicaid
Mental Health Authority
Hawaii
RI
DE
MA
CT
County-based MHA & Medicaid
Medicaid
Both MHA & Medicaid
Mental Health Authority
Hawaii
RI
DE
MA
CT
County-based MHA & Medicaid
Dougherty Management Associates, Inc. Chapter I – Page 2
The reader may find it puzzling that a state may appear on one of our charts and not another. This situation arises because many agencies were not able to supply all the data we requested, making it impossible to include every jurisdiction in every analysis. This is a reflection of a generally fragmented system in which few states have developed information systems capable of measuring access, utilization and cost comprehensively.
ORGANIZATION OF THE REPORT
• Chapter II describes key aspects of the structure and organization of children’s public mental health systems that we have sought to account for in our analysis.
• Chapter III describes the analytic framework and methodology developed to analyze children’s mental health services.
• Chapter IV summarizes our benchmarks and correlates of access and expenditure rates, and makes recommendations for further work.
• Three appendices present the details of our analysis.
- Appendix A Medicaid Data - Appendix B Mental Health Authority Data - Appendix C Combined Medicaid and Mental Health Authority Data.
Dougherty Management Associates, Inc. Chapter I – Page 3
II. KEY ASPECTS OF THE STRUCTURE AND ORGANIZATION OF CHILDREN’S PUBLIC MENTAL HEALTH SYSTEMS
KEY FINANCIAL AND ADMINISTRATIVE ENTITIES
MedicaidSchools Juvenile Justice
Child Welfare
Mental Health
Authority
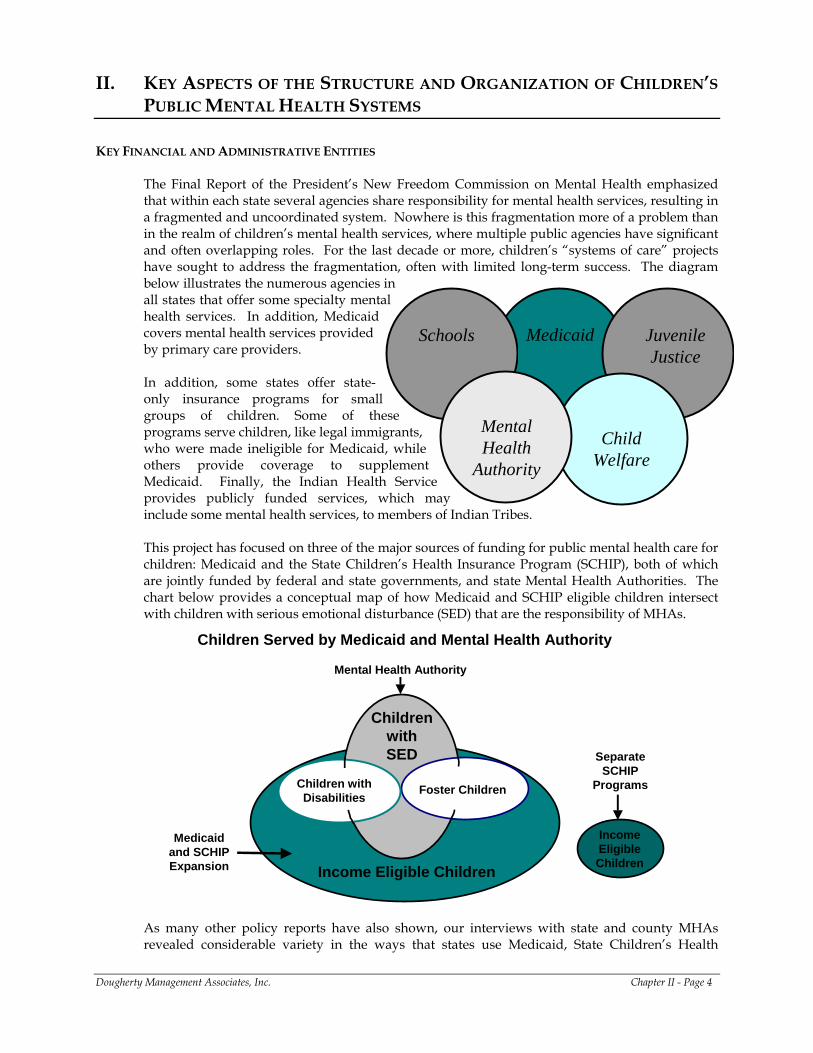
The Final Report of the President’s New Freedom Commission on Mental Health emphasized that within each state several agencies share responsibility for mental health services, resulting in a fragmented and uncoordinated system. Nowhere is this fragmentation more of a problem than in the realm of children’s mental health services, where multiple public agencies have significant and often overlapping roles. For the last decade or more, children’s “systems of care” projects have sought to address the fragmentation, often with limited long-term success. The diagram below illustrates the numerous agencies in all states that offer some specialty mental health services. In addition, Medicaid covers mental health services provided by primary care providers. In addition, some states offer state-only insurance programs for small groups of children. Some of these programs serve children, like legal immigrants, who were made ineligible for Medicaid, while others provide coverage to supplement Medicaid. Finally, the Indian Health Service provides publicly funded services, which may include some mental health services, to members of Indian Tribes. This project has focused on three of the major sources of funding for public mental health care for children: Medicaid and the State Children’s Health Insurance Program (SCHIP), both of which are jointly funded by federal and state governments, and state Mental Health Authorities. The chart below provides a conceptual map of how Medicaid and SCHIP eligible children intersect with children with serious emotional disturbance (SED) that are the responsibility of MHAs.
Children Served by Medicaid and Mental Health Authority
Medicaid and SCHIP Expansion
Income Eligible Children
Separate SCHIP
ProgramsChildren with Disabilities Foster Children
Income Eligible Children
Children with SED
Mental Health Authority
As many other policy reports have also shown, our interviews with state and county MHAs revealed considerable variety in the ways that states use Medicaid, State Children’s Health
Dougherty Management Associates, Inc. Chapter II - Page 4
Insurance Program (SCHIP) and MHA resources to structure service delivery systems and finance services. This chapter outlines the key structural and organizational aspects of children’s mental health services, including: their target populations, covered services, organizational structure and reporting conventions.
TARGET POPULATION
Children Served by Medicaid
Medicaid is responsible for a large group of income eligible children, plus a smaller group of children who meet income and disability criteria for SSI or a similar state disability category. A third distinct group, children in state custody (primarily foster children), is also eligible for Medicaid as long as they remain in state custody. States must provide Medicaid to children ages 6 to 18 with incomes at or below 100% of the federal poverty level (FPL) and may offer coverage to children with higher levels of income. Younger children have mandatory minimums that exceed 100% of FPL. The federal government covers at least 50% of the cost of Medicaid services, with the state providing the remainder. The federal share is set based on each state’s level of income, with lower income states receiving a higher rate of federal reimbursement.
Children Served by the State Children’s Health Insurance Program (SCHIP)
The SCHIP program, which is also jointly funded by the federal government and states, covers low-income children who are not eligible for Medicaid. The federal share in this program also varies among states based on their level of income, but the federal share is greater than for Medicaid. States have a number of options in designing their SCHIP programs. They can use SCHIP to expand Medicaid to higher income levels, they can create a separate Medicaid look-alike program with similar benefits and the same delivery system as Medicaid, and they can create a separately administered program with a less rich benefit than Medicaid as long as it is equivalent to their public employees’ coverage. States can exercise more than one of these options. Our data include services provided for SCHIP enrollees when they are in a Medicaid expansion or a Medicaid look-alike plan. Those in separately administered plans are not included, as most states were unable to provide us those data.
Children Served by Mental Health Authorities
State MHAs administer the federal Mental Health Block Grant and are responsible under the Block Grant for serving children with serious emotional disturbance (SED) as a priority population. In some states, counties or regional boards are designated as local mental health authorities with responsibility for administering services for children with SED. While states generally define SED similarly, they have the latitude to use relatively restrictive or relatively expansive definitions. Some MHAs are also responsible for providing mental health services to a wider population, such as people experiencing mental health crises, those in need of assessment and referral, or those needing education and prevention services. In addition, some states set financial eligibility criteria for MHA services. Many set, or allow their providers to set, sliding fee scales for services. The services financed by the federal mental health block grant may be augmented by state and/or county revenues. In addition, Medicaid is an important source of revenue for many of the services provided to Medicaid eligible children in the MHA’s contracted provider network. Some MHAs also have administrative and/or financial responsibility for certain Medicaid mental health services. In the course of this report, we will refer to children as, for example, “Medicaid,” “non-Medicaid” or “MHA” children, identifying the ways in which their services are funded. While these conceptual distinctions are crucial for our analysis, the same child may well fall into several or all of the categories during the course of one or more years. Furthermore, the child’s family may not know who is paying for the services the child receives. In other words, we wish to acknowledge
Dougherty Management Associates, Inc. Chapter II - Page 5
that we are talking about unique children and their families, and that their service needs do not necessarily differ because of their eligibility category at a given point in time. We note that our focus in this report excludes child welfare and juvenile justice which in many states devote considerable resources to residential psychiatric care.
COVERED MENTAL HEALTH SERVICES
Medicaid Mental Health Services
State Medicaid plans cover a wide range of mental health services that are needed by children with SED. Hospital and physician services (including psychiatry) are mandatory Medicaid services. So-called “optional” mental health services (i.e., those that the Medicaid program does not require states to support although they may be essential to the individual served) include:
• The clinic option, which covers outpatient mental health services provided by multi-disciplinary groups outside of hospitals, including Community Mental Health Centers (CMHCs);
• The rehabilitation option, which covers a range of supportive and rehabilitative mental health services;
• Targeted case management, which can be developed for children with SED; • Psychiatric under 21 benefit, which allows states to pay for services in state hospitals and
certain types of JCAHO accredited psychiatric residential programs for Medicaid eligibles under age 21; and
• The services of independent mental health practitioners like psychologists, masters level clinicians, and sometimes bachelor’s level clinicians.
SCHIP programs do not have the same requirements as Medicaid, but those included in our data offered benefits equivalent to the benefits offered by their states’ Medicaid programs. While residential treatment programs are generally not Medicaid covered services, those accredited by the Joint Commission on Accreditation of Healthcare Organizations (JCAHO) can qualify for the psychiatric under 21 option. Many states have chosen to do this. In addition, Medicaid can cover the clinical treatment portion of less intensive residential programs, such as group homes and treatment foster care. These programs are used predominantly by children in state custody; the child welfare agency is generally responsible for the room and board portion of costs with the local education agency responsible for the educational program. Mental Health Authority Services
Community Care MHAs most commonly use Community Mental Health Centers (CMHCs) as the primary providers of outpatient and community based services, though some states have networks of children’s providers that are not considered CMHCs. CMHCs may be publicly operated or private non-profit providers; their mission is to serve children with serious emotional disturbance and adults with severe and persistent mental illness. Hospital Care MHAs often operate state hospitals whose services are usually, but not always reimbursed, by Medicaid. State hospitals differ regarding the types of care they provide. Some, particularly in more rural states, may fill gaps in the private acute inpatient network, while others focus solely on long term care. However, eight of the states in our project have no state hospitals serving children.
Dougherty Management Associates, Inc. Chapter II - Page 6
Residential Care MHAs also make different choices about what kinds of residential programs to offer. Most operate or purchase residential care, while a few do not cover that level of care. In many states the bulk of residential care is funded by the child welfare, juvenile justice or education systems, but we did not attempt to collect data on these resources.
ORGANIZATIONAL STRUCTURE
All states have developed methods by which they use Medicaid resources to pay for eligible services for Medicaid eligible children and use MHA resources to pay for services not included in the state Medicaid plan and/or for children who do not have Medicaid coverage. Some MHAs draw upon the SCHIP program’s expanded eligibility to cover some children’s mental health services that were previously covered by the MHA. This has resulted in a number of different service delivery systems. This section describes some of the most common organizational structures and their variations.
Medicaid
Medicaid’s basic service delivery model is a fee for service system (FFS) where eligible enrollees can receive the services that the state has elected to include in its state plan from any provider who has been certified by the Medicaid system. Prior authorization may be required for hospitalization and other high intensity services. Many states employ managed care organiza-tions to manage their covered services. In classic managed care, the state shares risk with a managed care organization (MCO) or Health Maintenance Organization (HMO), paid on a capitated basis, which then contracts with a network of service providers and manages care through such mechanisms as a provider network, prior authorizations and referrals. The state may make the managed care organization responsible for specialty mental health services. Alternatively, the state may carve out its mental health benefit to have it managed by a specialized management entity, often referred to as a behavioral health organization (BHO). A single state may employ all three methods -- FFS, HMO and behavioral health carve-out -- for administering Medicaid mental health benefits.
Mental Health Authority
CMHC Based Systems In the most traditional organization structure, the MHA allocates funds to CMHCs or their equivalents that are each responsible for serving a catchment area. Allocations may be established based on need indicators, prior service levels, or history. The CMHCs bill Medicaid for any Medicaid covered services provided to Medicaid eligible children. They use MHA funds to cover the costs of services not covered under Medicaid and to serve children that meet MHA eligibility criteria and are not eligible for Medicaid. In most states, they may set a sliding fee scale for these services. Georgia, New Mexico and Vermont are examples of states with this kind of system. Counties or regional boards frequently have important roles in this type of system, functioning as local mental health authorities with discretion for service planning, resource allocation and contracting. In some cases, as in Oregon, counties may actually operate CMHCs. Some significant variations on this model include paying CMHCs on a fee-for-service basis or having state case management staff perform assessments and determine a child’s eligibility for MHA paid services.
Dougherty Management Associates, Inc. Chapter II - Page 7
MHAs Capitated for Medicaid A number of states carve out some or all Medicaid mental health services, with the MHA having an important role in administering them. In California, Tennessee, Colorado, Hawaii, and Texas NorthSTAR, virtually all children’s mental health services financed by Medicaid and the MHA are jointly administered by the MHA. (In the case of Tennessee, MHA financing was virtually eliminated while Medicaid was expanded to cover most uninsured children.) All these systems capitated these services. Counties in California, a seven county authority in Texas, and CMHCs in Colorado, are the capitated management entities. Hawaii and Texas both have expansive eligibility that does not require that children have SED in order to receive non-Medicaid services. Other states, including Delaware, Michigan, Oregon and Washington carve out a portion of their Medicaid mental health services to MHA entities. In each case, they provide limited outpatient mental health benefits in their Medicaid HMOs. Therefore, these MHAs serve children who need more than the standard outpatient care available through HMOs. These programs probably serve a set of children similar to those served in traditional CMHC systems, but the scope of services and the reporting responsibilities are greater. In Michigan and Washington, counties or county-based entities actually receive and manage the capitation funds. Comprehensive Children’s Agencies Some states have designated a comprehensive children’s agency as their MHA for children. In Delaware, Rhode Island and Connecticut, the children’s mental health agency is combined with the Child Welfare (CW) and Juvenile Justice (JJ) agencies. They are likely to provide more comprehensive mental health services to these CW and JJ youth than MHAs in other states and they definitely include the portion of the cost of these services covered by Title TVE and state resources for child welfare and juvenile justice in their expenditure data, which MHAs in other states do not.
County Administration Another major organizational dimension that can exist in any of the three forms of organization described above is that of county administration. From a federal and state legislative perspective, all final decision making resides at the state level. However, many states delegate significant authority to counties, or county or regional mental health boards. These boards are responsible for providing services within their catchment areas, making decisions on service planning, allocation of resources, contracting and oversight. In many cases, they constitute the boards of CMHCs or similar entities. Sometimes counties are financially responsible for a share of the cost of mental health services, whereas the contributions of others are optional. Where county contributions are optional, states report considerable variation among their counties in the amounts they contribute. Ohio, Kentucky, Minnesota and Georgia, among others, delegate significant responsibility to counties or other regional entities. Other Other states fit none of these patterns. For example, Montana combined MHA and SCHIP resources to serve children with SED in the year reported. However, they were not able to provide us data on the services provided by SCHIP. The Massachusetts MHA serves a very small number of high need children with SED; that is, MHA resources are used only to serve children with intensive needs for continuing care. The state relies on a comprehensive Medicaid mental health benefit provided by a carve-out and on HMOs with expansive eligibility for both acute care and ongoing community care to melt other needs for children with SED. Unlike most states, Massachusetts reports wraparound services in its residential category when provided as an alternative to residential care, and the vast majority of residential services are funded by the child welfare agency.
Dougherty Management Associates, Inc. Chapter II - Page 8
REPORTING CONVENTIONS
As might be expected from the variation in forms of organization, there is also considerable variation in reporting between states. This variation relates both to which agency counts which children, and to how mental health services are categorized.
Medicaid
Medicaid agencies most commonly generate encounter data on the services they purchase, tying together a client, a service and its cost. However, there are some exceptions. Medicaid managed care programs are most commonly paid on a total or partial capitation basis. Depending on how the state requires MCOs to report encounter data, the state may or may not have data on the specific services utilized and on their cost. Generally the reporting for children’s mental health services is more detailed in states where there are carve-out mental health programs than in states where the mental health services are included in an HMO benefit. MHAs
MHAs most commonly use client-oriented data systems for reporting on community-based services that are separate from residential and state hospital care. They focus on collecting demographic and clinical data on children with SED receiving community services. A few states use payment systems that generate encounter data tying a specific client to a unit of service and its cost. However, most MHAs use community-based service reporting systems that do not connect clients to the specific services they receive or to the cost of those services, perhaps with the notable exception of state or county operated services. They may have a client registry in which their providers report client characteristics when a new case is opened, and quarterly reports on the number of units of each type of service delivered. Thus the agency knows quite a bit about the clients served and the services they receive, without necessarily knowing the specific utilization of each client or the cost of a specific client’s services. The MHA will have some type of financial data about the providers’ use of the funds they receive, but this accounting is not necessarily tied to specific units of service or clients. They operate this way because, in many states, grants or allocations from the MHA are designated to support provider administration, operations, and other costs not covered by Medicaid or other revenues.
MHAs typically maintain separate data systems for the residential services and state hospital care they support that are separate from reporting on community care. Some states can combine their community client counts with their residential and inpatient client counts to produce an unduplicated total number of children served. Other states appeared not to do so, since the total number of children served that they reported was identical to the total served in community-based services. This probably does not distort the number of children served appreciably because most children receiving inpatient or residential care also receive some kind of community service. However, when information systems cannot be combined, it is difficult to analyze the process of care and to see whether type or intensity of community services affects risk of hospitalization, or vice versa.
MHAs typically report a relatively small proportion of inpatient care provided to children with SED, namely, the care provided in state hospitals. State hospital care can be reimbursed by Medicaid when a state has elected the psychiatric under 21 option. We found that even when Medicaid paid for the state hospital bed, the MHA was likely to report the care provided since it operated the facility and had comprehensive data on utilization. When there is a state hospital, the MHA is not likely to fund placements into private or community hospitals for those youth not eligible for Medicaid. Some MHAs pay for virtually no inpatient care, making use of mechanisms that allow children in inpatient care to become eligible for Medicaid. Since state
Dougherty Management Associates, Inc. Chapter II - Page 9
hospitals are operated by MHAs, their cost data are most likely to be based on the actual annual costs of the operation rather than the net cost to the MHA, which would reflect any offsetting revenue from Medicaid and other third party payers.
CONCLUSION
This discussion has described the many structures of state Medicaid and Mental Health Authority systems to provide children’s mental health services. Our analysis takes these into account in order to make useful and fair cross-system comparisons. This discussion also highlights the significant limitations of the data available on children with SED in most states. While most MHAs have data on the services provided to their priority population in their community provider networks or state hospitals, most lack data on the inpatient and residential services these children receive if they are paid for by Medicaid or some other state agency. Medicaid records generally do not permit identification of children with SED, meaning that no agency has a complete picture of the service utilization of these most vulnerable children. The lack of match between service and cost data constitutes another limitation of data for some MHAs. Some collect data collected on services provided in their service networks and funded by both Medicaid and the MHA, but have only their own financial contribution to theses services. They may not track any financial information to specific clients. Many MHAs are not able to determine the costs of the specific services provided in their networks since they may contract with community providers on a cost-reimbursement or grant basis and costs are not discretely allocated to different services. Finally, we note once again that we have not collected data on states’ education, juvenile justice or child welfare systems, and therefore do not know how much they contribute to the cost of services for children with mental health needs.
Dougherty Management Associates, Inc. Chapter II - Page 10
III. ANALYTIC FRAMEWORK This chapter describes our data collection process, the variables on which this analysis is focused, our analytic categories, and the factors we tested for relationships to variation in access and expenditures. DATA COLLECTION PROCESS
During the first three years of this project, Dougherty Management Associates, Inc. (DMA), developed and refined a Data Collection Instrument to collect data on core indicators in four domains: access, utilization, expenditures and intersystem involvement. (This survey is included in our third-year report available on our website, www.doughertymanagement.com.) We e-mailed or mailed the instrument to the mental health authorities (MHAs) and Medicaid agencies of all 50 states, the District of Columbia and 6 counties in June of 2002. Most of the indicators are based on ones recommended by other national organizations involved with performance measures, including the Mental Health Statistics Improvement Program, a program of the Center for Mental Health Services; the National Committee for Quality Assurance; the National Association of State Mental Health Program Directors; and the American College of Mental Health Administration. These data were released in July 2003 in the Children's Mental Health Benchmarking Project, Third Year Report.
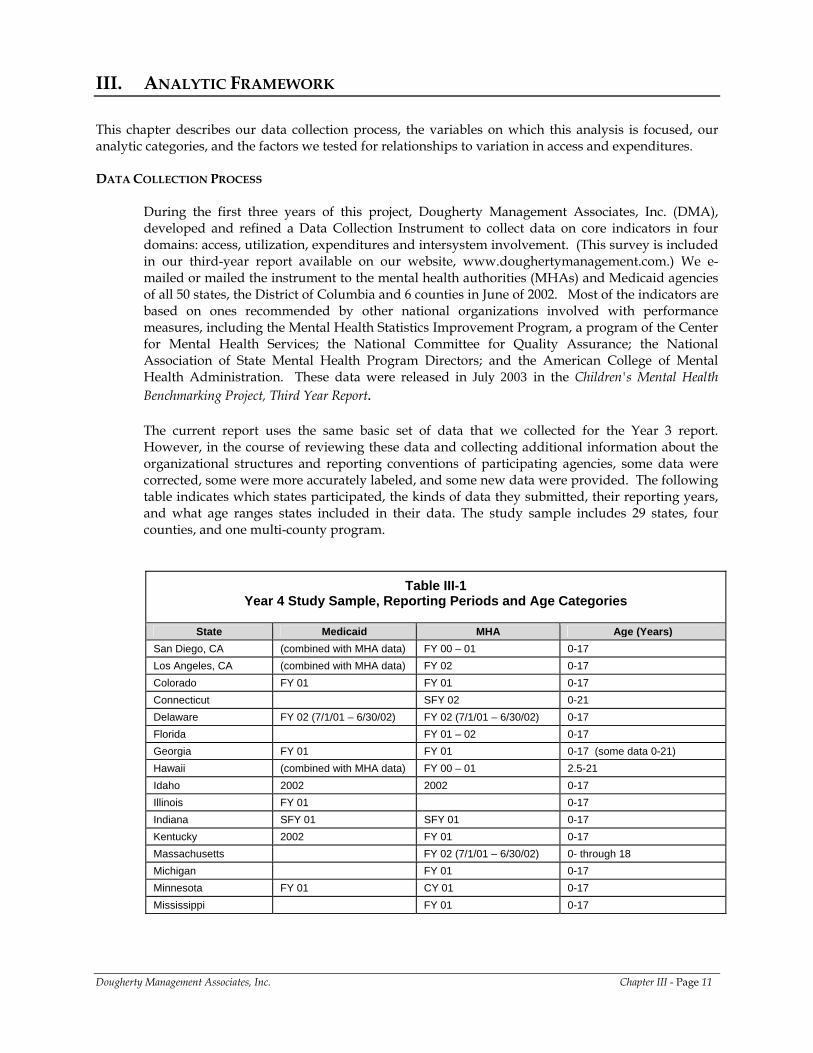
The current report uses the same basic set of data that we collected for the Year 3 report. However, in the course of reviewing these data and collecting additional information about the organizational structures and reporting conventions of participating agencies, some data were corrected, some were more accurately labeled, and some new data were provided. The following table indicates which states participated, the kinds of data they submitted, their reporting years, and what age ranges states included in their data. The study sample includes 29 states, four counties, and one multi-county program.
Table III-1 Year 4 Study Sample, Reporting Periods and Age Categories
State Medicaid MHA Age (Years)
San Diego, CA (combined with MHA data) FY 00 – 01 0-17 Los Angeles, CA (combined with MHA data) FY 02 0-17 Colorado FY 01 FY 01 0-17 Connecticut SFY 02 0-21 Delaware FY 02 (7/1/01 – 6/30/02) FY 02 (7/1/01 – 6/30/02) 0-17 Florida FY 01 – 02 0-17 Georgia FY 01 FY 01 0-17 (some data 0-21) Hawaii (combined with MHA data) FY 00 – 01 2.5-21 Idaho 2002 2002 0-17 Illinois FY 01 0-17 Indiana SFY 01 SFY 01 0-17 Kentucky 2002 FY 01 0-17 Massachusetts FY 02 (7/1/01 – 6/30/02) 0- through 18 Michigan FY 01 0-17 Minnesota FY 01 CY 01 0-17 Mississippi FY 01 0-17
Dougherty Management Associates, Inc. Chapter III - Page 11
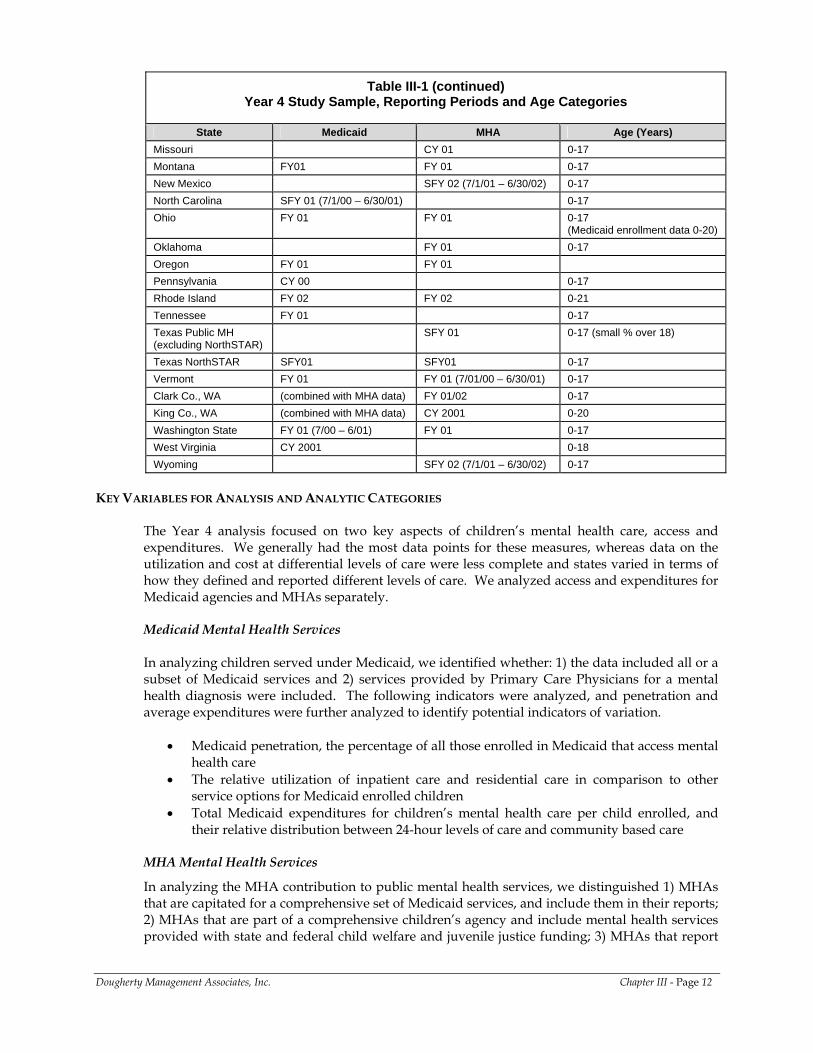
Table III-1 (continued) Year 4 Study Sample, Reporting Periods and Age Categories
State Medicaid MHA Age (Years)
Missouri CY 01 0-17 Montana FY01 FY 01 0-17 New Mexico SFY 02 (7/1/01 – 6/30/02) 0-17 North Carolina SFY 01 (7/1/00 – 6/30/01) 0-17 Ohio FY 01 FY 01 0-17
(Medicaid enrollment data 0-20) Oklahoma FY 01 0-17 Oregon FY 01 FY 01 Pennsylvania CY 00 0-17 Rhode Island FY 02 FY 02 0-21 Tennessee FY 01 0-17 Texas Public MH (excluding NorthSTAR)
SFY 01 0-17 (small % over 18)
Texas NorthSTAR SFY01 SFY01 0-17 Vermont FY 01 FY 01 (7/01/00 – 6/30/01) 0-17 Clark Co., WA (combined with MHA data) FY 01/02 0-17 King Co., WA (combined with MHA data) CY 2001 0-20 Washington State FY 01 (7/00 – 6/01) FY 01 0-17 West Virginia CY 2001 0-18 Wyoming SFY 02 (7/1/01 – 6/30/02) 0-17
KEY VARIABLES FOR ANALYSIS AND ANALYTIC CATEGORIES
The Year 4 analysis focused on two key aspects of children’s mental health care, access and expenditures. We generally had the most data points for these measures, whereas data on the utilization and cost at differential levels of care were less complete and states varied in terms of how they defined and reported different levels of care. We analyzed access and expenditures for Medicaid agencies and MHAs separately. Medicaid Mental Health Services
In analyzing children served under Medicaid, we identified whether: 1) the data included all or a subset of Medicaid services and 2) services provided by Primary Care Physicians for a mental health diagnosis were included. The following indicators were analyzed, and penetration and average expenditures were further analyzed to identify potential indicators of variation.
• Medicaid penetration, the percentage of all those enrolled in Medicaid that access mental
health care • The relative utilization of inpatient care and residential care in comparison to other
service options for Medicaid enrolled children • Total Medicaid expenditures for children’s mental health care per child enrolled, and
their relative distribution between 24-hour levels of care and community based care
MHA Mental Health Services
In analyzing the MHA contribution to public mental health services, we distinguished 1) MHAs that are capitated for a comprehensive set of Medicaid services, and include them in their reports; 2) MHAs that are part of a comprehensive children’s agency and include mental health services provided with state and federal child welfare and juvenile justice funding; 3) MHAs that report
Dougherty Management Associates, Inc. Chapter III - Page 12
on MHA paid residential and inpatient services plus all services provided in their community service networks, whether paid by Medicaid or the MHA; and 4) those MHAs that reported only on children whose services were paid by MHA resources. Six MHAs capitated for all Medicaid specialty mental health services were excluded from this analysis and were included in the analysis of total public mental health services described below. Our measures included:
• Children served in MHA provider networks per thousand children in the population
funded by either Medicaid or the MHA • Children served per thousand in MHA provider networks funded by the MHA only • Utilization in MHA provider networks • MHA expenditures per thousand population and the relative contribution of the MHA to
hospital and residential levels of care
We also identified correlates of variation for children served per thousand under Medicaid and the MHA and for MHA expenditures per thousand. It is important to note that our measure of MHA access includes children whose services were paid by Medicaid while our analysis of expenditures excluded Medicaid funds. The need to have an adequate number of data points dictated this selection of variables for analysis. Total Public Mental Health Services
Because a number of the structural variations we categorized for MHAs had to do with the ways in which Medicaid costs and services were counted, we decided to combine Medicaid and MHA data and look at the total services provided by the two agencies. The six MHAs capitated for all Medicaid specialty mental health services provided unduplicated counts of all children receiving Medicaid and MHA services. To calculate total mental health services for other states, the services provided through the MHA and Medicaid within a state are combined, taking into account its reporting methods, acknowledging important missing pieces (e.g., SCHIP or state funded insurance programs when they are not included with Medicaid data) and eliminating any duplication between the Medicaid and MHA counts. Children served and expenditures per thousand were analyzed to identify correlates of variation. Combining Medicaid and MHA required making adjustments to eliminate children counted by both agencies. Given MHAs’ low confidence in their ability to identify Medicaid eligible children in their service networks, these adjustments are more in the nature of estimates than exact counts. It was necessary to distinguish 1) states that included SCHIP and those that did not, as well as 2) states that counted services provided by primary care providers (PCPs) and those that did not. Our measures included:
• Medicaid plus MHA children served per thousand population • Medicaid plus MHA utilization - states’ relative balance between out-of home care and
community based care in terms of children served • Medicaid plus MHA expenditures per thousand population and relative resources used
for out-of-home and community based care EXPLANATORY FACTORS
In addition to developing more accurate comparisons between state systems, our goal has been to identify and test factors that might help to explain variation between states. To do so, the project team reviewed relevant literature and drew upon what we learned about differences among state mental health systems to develop a list of possible demographic, structural, and environmental factors that may begin to explain some of the variation between states. The remainder of this
Dougherty Management Associates, Inc. Chapter III - Page 13
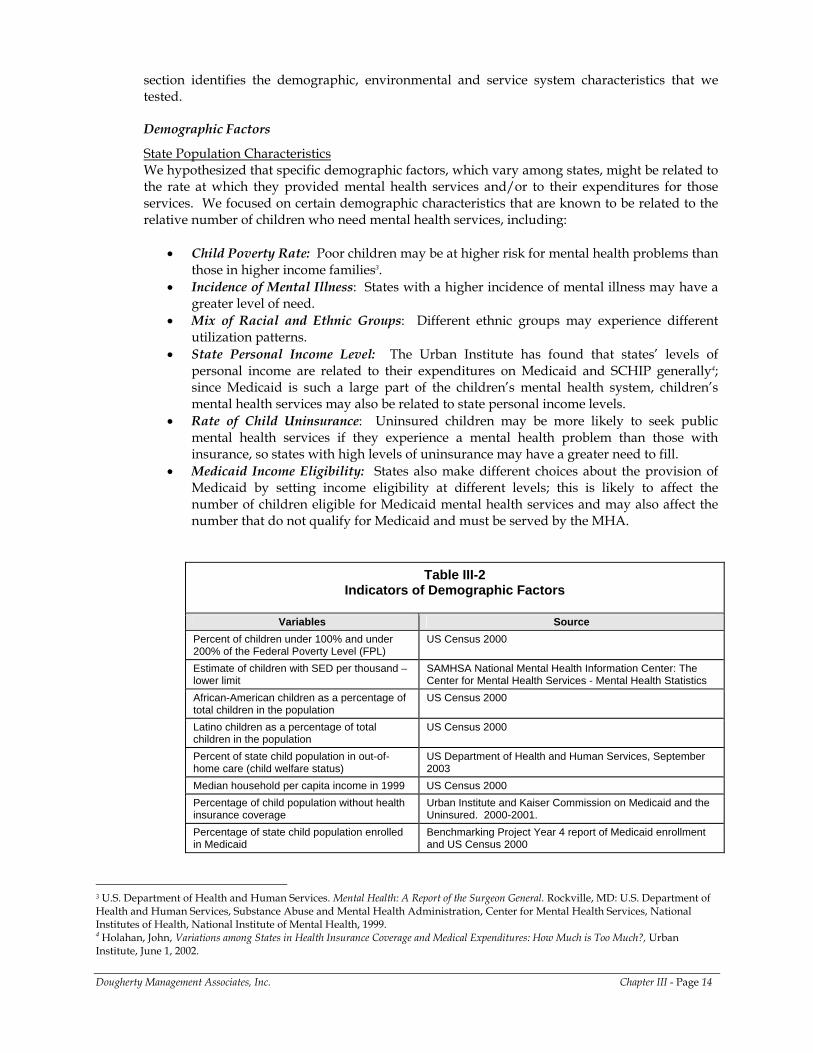
section identifies the demographic, environmental and service system characteristics that we tested. Demographic Factors
State Population Characteristics We hypothesized that specific demographic factors, which vary among states, might be related to the rate at which they provided mental health services and/or to their expenditures for those services. We focused on certain demographic characteristics that are known to be related to the relative number of children who need mental health services, including:
• Child Poverty Rate: Poor children may be at higher risk for mental health problems than
those in higher income families3. • Incidence of Mental Illness: States with a higher incidence of mental illness may have a
greater level of need. • Mix of Racial and Ethnic Groups: Different ethnic groups may experience different
utilization patterns. • State Personal Income Level: The Urban Institute has found that states’ levels of
personal income are related to their expenditures on Medicaid and SCHIP generally4; since Medicaid is such a large part of the children’s mental health system, children’s mental health services may also be related to state personal income levels.
• Rate of Child Uninsurance: Uninsured children may be more likely to seek public mental health services if they experience a mental health problem than those with insurance, so states with high levels of uninsurance may have a greater need to fill.
• Medicaid Income Eligibility: States also make different choices about the provision of Medicaid by setting income eligibility at different levels; this is likely to affect the number of children eligible for Medicaid mental health services and may also affect the number that do not qualify for Medicaid and must be served by the MHA.
Table III-2 Indicators of Demographic Factors
Variables Source
Percent of children under 100% and under 200% of the Federal Poverty Level (FPL)
US Census 2000
Estimate of children with SED per thousand – lower limit
SAMHSA National Mental Health Information Center: The Center for Mental Health Services - Mental Health Statistics
African-American children as a percentage of total children in the population
US Census 2000
Latino children as a percentage of total children in the population
US Census 2000
Percent of state child population in out-of-home care (child welfare status)
US Department of Health and Human Services, September 2003
Median household per capita income in 1999 US Census 2000 Percentage of child population without health insurance coverage
Urban Institute and Kaiser Commission on Medicaid and the Uninsured. 2000-2001.
Percentage of state child population enrolled in Medicaid
Benchmarking Project Year 4 report of Medicaid enrollment and US Census 2000
3 U.S. Department of Health and Human Services. Mental Health: A Report of the Surgeon General. Rockville, MD: U.S. Department of Health and Human Services, Substance Abuse and Mental Health Administration, Center for Mental Health Services, National Institutes of Health, National Institute of Mental Health, 1999.
Dougherty Management Associates, Inc. Chapter III - Page 14
4 Holahan, John, Variations among States in Health Insurance Coverage and Medical Expenditures: How Much is Too Much?, Urban Institute, June 1, 2002.
We failed to find a measure of the percentage of immigrants (either legal or illegal) in state populations that would allow us to reflect the effects of this group’s differential access to Medicaid and private insurance.
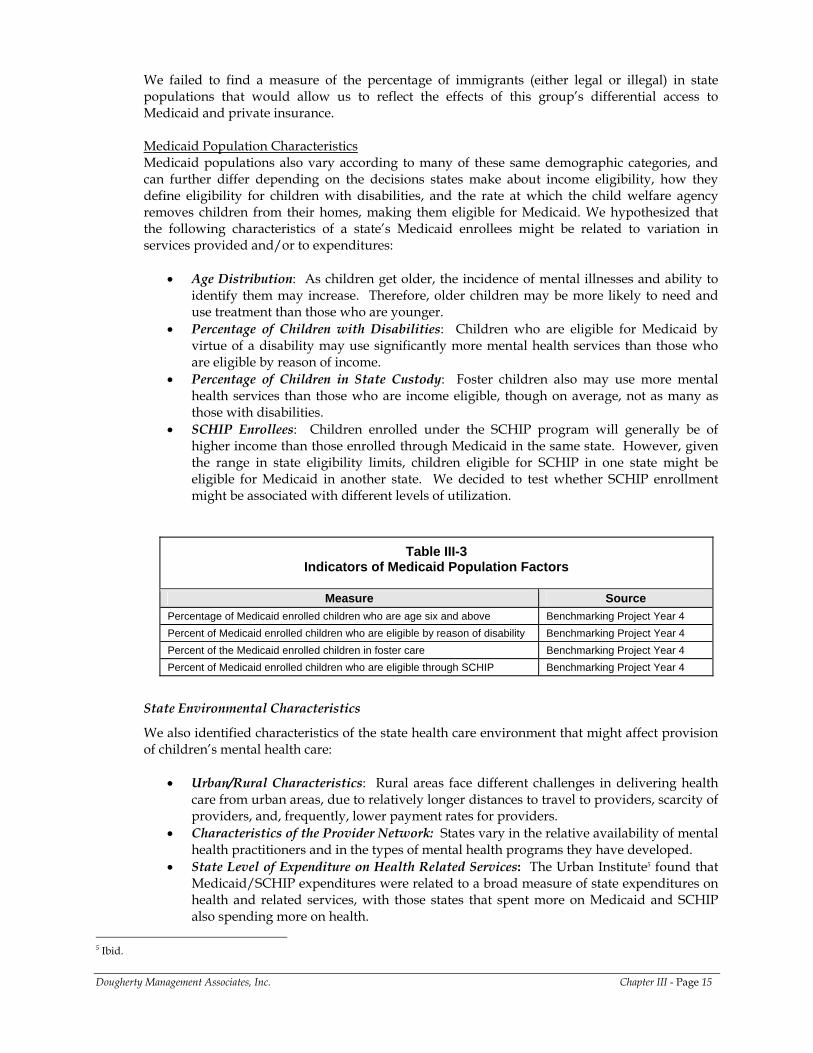
Medicaid Population Characteristics Medicaid populations also vary according to many of these same demographic categories, and can further differ depending on the decisions states make about income eligibility, how they define eligibility for children with disabilities, and the rate at which the child welfare agency removes children from their homes, making them eligible for Medicaid. We hypothesized that the following characteristics of a state’s Medicaid enrollees might be related to variation in services provided and/or to expenditures:
• Age Distribution: As children get older, the incidence of mental illnesses and ability to identify them may increase. Therefore, older children may be more likely to need and use treatment than those who are younger.
• Percentage of Children with Disabilities: Children who are eligible for Medicaid by virtue of a disability may use significantly more mental health services than those who are eligible by reason of income.
• Percentage of Children in State Custody: Foster children also may use more mental health services than those who are income eligible, though on average, not as many as those with disabilities.
• SCHIP Enrollees: Children enrolled under the SCHIP program will generally be of higher income than those enrolled through Medicaid in the same state. However, given the range in state eligibility limits, children eligible for SCHIP in one state might be eligible for Medicaid in another state. We decided to test whether SCHIP enrollment might be associated with different levels of utilization.
Table III-3 Indicators of Medicaid Population Factors
Measure Source
Percentage of Medicaid enrolled children who are age six and above Benchmarking Project Year 4 Percent of Medicaid enrolled children who are eligible by reason of disability Benchmarking Project Year 4 Percent of the Medicaid enrolled children in foster care Benchmarking Project Year 4 Percent of Medicaid enrolled children who are eligible through SCHIP Benchmarking Project Year 4
State Environmental Characteristics
We also identified characteristics of the state health care environment that might affect provision of children’s mental health care:
• Urban/Rural Characteristics: Rural areas face different challenges in delivering health care from urban areas, due to relatively longer distances to travel to providers, scarcity of providers, and, frequently, lower payment rates for providers.
• Characteristics of the Provider Network: States vary in the relative availability of mental health practitioners and in the types of mental health programs they have developed.
• State Level of Expenditure on Health Related Services: The Urban Institute5 found that Medicaid/SCHIP expenditures were related to a broad measure of state expenditures on health and related services, with those states that spent more on Medicaid and SCHIP also spending more on health.
Dougherty Management Associates, Inc. Chapter III - Page 15
5 Ibid.
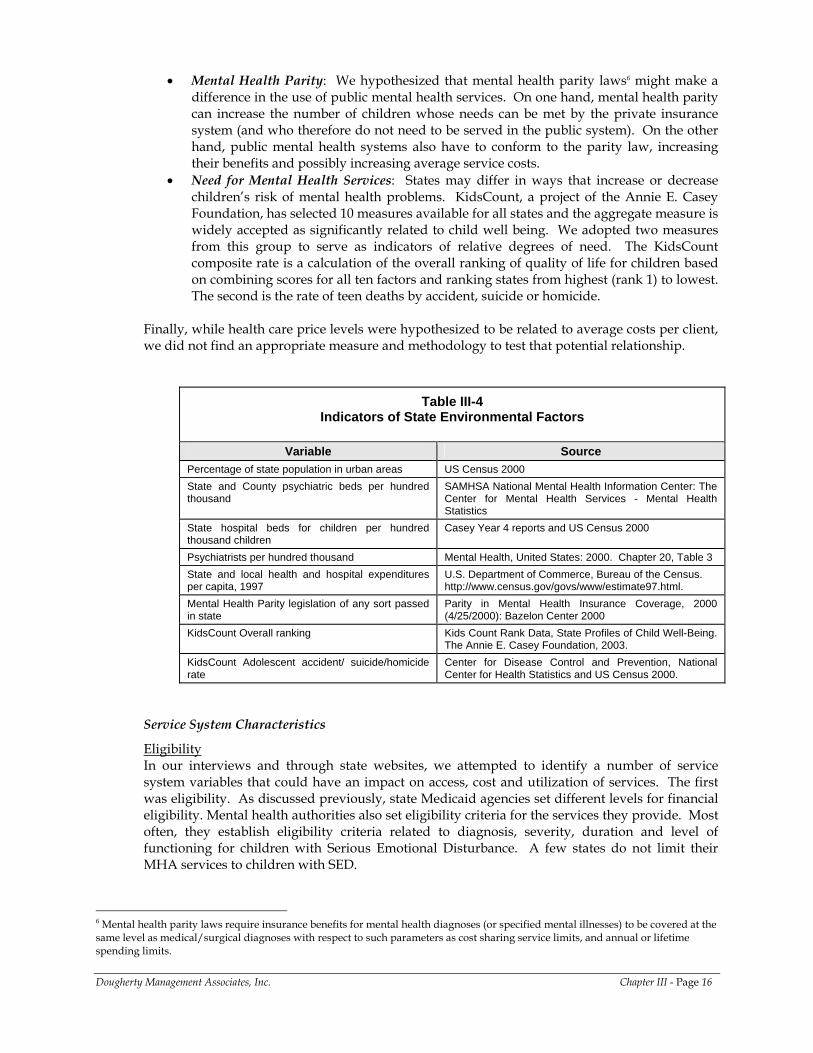
• Mental Health Parity: We hypothesized that mental health parity laws6 might make a difference in the use of public mental health services. On one hand, mental health parity can increase the number of children whose needs can be met by the private insurance system (and who therefore do not need to be served in the public system). On the other hand, public mental health systems also have to conform to the parity law, increasing their benefits and possibly increasing average service costs.
• Need for Mental Health Services: States may differ in ways that increase or decrease children’s risk of mental health problems. KidsCount, a project of the Annie E. Casey Foundation, has selected 10 measures available for all states and the aggregate measure is widely accepted as significantly related to child well being. We adopted two measures from this group to serve as indicators of relative degrees of need. The KidsCount composite rate is a calculation of the overall ranking of quality of life for children based on combining scores for all ten factors and ranking states from highest (rank 1) to lowest. The second is the rate of teen deaths by accident, suicide or homicide.
Finally, while health care price levels were hypothesized to be related to average costs per client, we did not find an appropriate measure and methodology to test that potential relationship.
Table III-4 Indicators of State Environmental Factors
Variable Source
Percentage of state population in urban areas US Census 2000 State and County psychiatric beds per hundred thousand
SAMHSA National Mental Health Information Center: The Center for Mental Health Services - Mental Health Statistics
State hospital beds for children per hundred thousand children
Casey Year 4 reports and US Census 2000
Psychiatrists per hundred thousand Mental Health, United States: 2000. Chapter 20, Table 3 State and local health and hospital expenditures per capita, 1997
U.S. Department of Commerce, Bureau of the Census. http://www.census.gov/govs/www/estimate97.html.
Mental Health Parity legislation of any sort passed in state
Parity in Mental Health Insurance Coverage, 2000 (4/25/2000): Bazelon Center 2000
KidsCount Overall ranking Kids Count Rank Data, State Profiles of Child Well-Being. The Annie E. Casey Foundation, 2003.
KidsCount Adolescent accident/ suicide/homicide rate
Center for Disease Control and Prevention, National Center for Health Statistics and US Census 2000.
Service System Characteristics
Eligibility In our interviews and through state websites, we attempted to identify a number of service system variables that could have an impact on access, cost and utilization of services. The first was eligibility. As discussed previously, state Medicaid agencies set different levels for financial eligibility. Mental health authorities also set eligibility criteria for the services they provide. Most often, they establish eligibility criteria related to diagnosis, severity, duration and level of functioning for children with Serious Emotional Disturbance. A few states do not limit their MHA services to children with SED.
Dougherty Management Associates, Inc. Chapter III - Page 16
6 Mental health parity laws require insurance benefits for mental health diagnoses (or specified mental illnesses) to be covered at the same level as medical/surgical diagnoses with respect to such parameters as cost sharing service limits, and annual or lifetime spending limits.
• Medicaid Financial Eligibility: We used the eligibility levels the states set for ages 6 through 18, since this age group is more likely to use mental health services than children that are younger. When SCHIP data were included, we used the eligibility level for that program.
• Definition of Serious Emotional Disturbance: We assigned states to a category (restrictive, moderate, or expansive) based on review of their SED criteria, and asked them if they agreed with our assessment.
• MHA Financial Eligibility: In addition, some states set income eligibility criteria for MHA services, while others do not set income limits, but do use sliding fee scales to charge those with higher income for services. A few states have neither income limits nor fees.
State Operated Services Many state MHAs operate state hospital services or specialized children’s residential facilities and several have state or county operated CMHCs. We wondered whether government operated systems differ from those operated by private non-profit CMHCs or provider networks. Government operated services generally have weaker incentives to generate revenue than free standing organizations since their basic operating expenses are usually covered by allocation and any revenues they generate may not be captured and available to support expansion or improvement of the program. In addition, government programs may be slower to respond to changes in demand for services. Downsizing adjustments are more likely to be made in regard to an annual budget cycle than to the time at which decreased need is identified.
• State Hospitals: We looked at children’s state hospital or residential beds per hundred thousand.
• State Operated CMHCs: We also looked at whether the state had any state operated CMHCs.
Methods of Payment and Administration As described below, the methods that states use to pay and otherwise administer their mental health systems establish incentives that can impact provision of services and costs.
• Medicaid Managed Care: The most significant variation in management of Medicaid is
the degree to which it is administered under a managed care arrangement. While it may be important to distinguish whether the managed care arrangement is integrated with medical care or part of a behavioral health carve-out, we had only enough data points to compare Medicaid that was fully fee for service to Medicaid with some form of managed behavioral healthcare. Managed care establishes incentives for provision of care in lower cost settings, and generally promotes flexible use of funds and provision of different types of services. There is also concern that these incentives can lead to pressures for cost shifting to other sources of public care and to underservice.
• MHA Managed Care: Managed care is not limited to Medicaid. A number of MHAs have adopted managed care practices in the administration of their own resources. Many MHAs using managed care have combined MHA resources with capitated Medicaid resources. However, a few other states have adopted managed care for MHA resources alone. We compared states using managed care practices to administer their own resources (even if they did not have a capitated payment arrangement) to those without a managed care approach.
• Overall Managed Care: When analyzing Medicaid and MHA services together, we compared states in which both Medicaid and the MHA used managed care practices to those in which managed care was used by one agency or not at all. We also compared states in which one or both agencies used managed care practices to those in which neither agency used such practices.
Dougherty Management Associates, Inc. Chapter III - Page 17
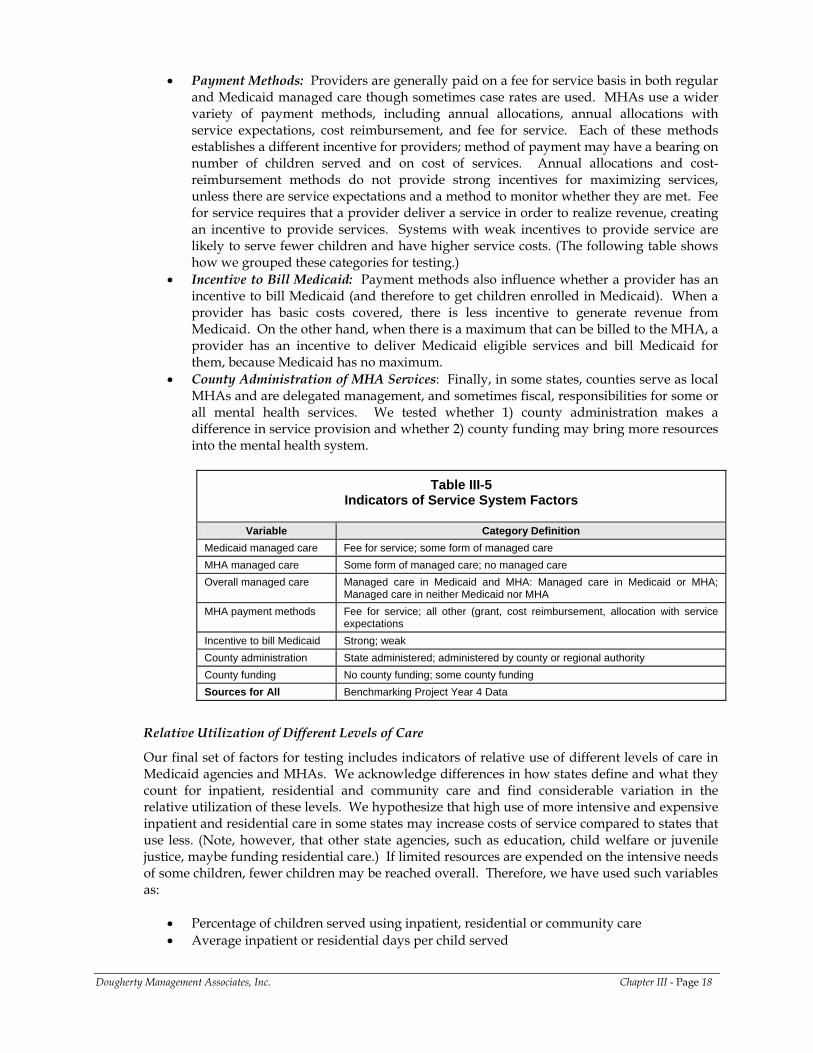
• Payment Methods: Providers are generally paid on a fee for service basis in both regular and Medicaid managed care though sometimes case rates are used. MHAs use a wider variety of payment methods, including annual allocations, annual allocations with service expectations, cost reimbursement, and fee for service. Each of these methods establishes a different incentive for providers; method of payment may have a bearing on number of children served and on cost of services. Annual allocations and cost-reimbursement methods do not provide strong incentives for maximizing services, unless there are service expectations and a method to monitor whether they are met. Fee for service requires that a provider deliver a service in order to realize revenue, creating an incentive to provide services. Systems with weak incentives to provide service are likely to serve fewer children and have higher service costs. (The following table shows how we grouped these categories for testing.)
• Incentive to Bill Medicaid: Payment methods also influence whether a provider has an incentive to bill Medicaid (and therefore to get children enrolled in Medicaid). When a provider has basic costs covered, there is less incentive to generate revenue from Medicaid. On the other hand, when there is a maximum that can be billed to the MHA, a provider has an incentive to deliver Medicaid eligible services and bill Medicaid for them, because Medicaid has no maximum.
• County Administration of MHA Services: Finally, in some states, counties serve as local MHAs and are delegated management, and sometimes fiscal, responsibilities for some or all mental health services. We tested whether 1) county administration makes a difference in service provision and whether 2) county funding may bring more resources into the mental health system.
Table III-5 Indicators of Service System Factors
Variable Category Definition
Medicaid managed care Fee for service; some form of managed care MHA managed care Some form of managed care; no managed care Overall managed care Managed care in Medicaid and MHA: Managed care in Medicaid or MHA;
Managed care in neither Medicaid nor MHA MHA payment methods Fee for service; all other (grant, cost reimbursement, allocation with service
expectations Incentive to bill Medicaid Strong; weak County administration State administered; administered by county or regional authority County funding No county funding; some county funding Sources for All Benchmarking Project Year 4 Data
Relative Utilization of Different Levels of Care
Our final set of factors for testing includes indicators of relative use of different levels of care in Medicaid agencies and MHAs. We acknowledge differences in how states define and what they count for inpatient, residential and community care and find considerable variation in the relative utilization of these levels. We hypothesize that high use of more intensive and expensive inpatient and residential care in some states may increase costs of service compared to states that use less. (Note, however, that other state agencies, such as education, child welfare or juvenile justice, maybe funding residential care.) If limited resources are expended on the intensive needs of some children, fewer children may be reached overall. Therefore, we have used such variables as:
• Percentage of children served using inpatient, residential or community care • Average inpatient or residential days per child served
Dougherty Management Associates, Inc. Chapter III - Page 18
• Percentage of total costs for inpatient, residential or community care • Average cost per child served overall, and for inpatient, residential or community care
We generated these variables in the course of our analysis based on data submitted.
METHODOLOGY
In testing the relationship between each of these factors and our indicators of access and expenditures we used two different methods. Continuous variables were tested for degree and significance of correlations, using a two-tailed Pearson test. For categorical variables, we compared the means of states falling into different categories and subjected them to a t-test for significance. Our small sample size affected these categorical tests more than our correlations and we found no categories whose effects of means reached significance.
CONCLUSION
Our interviews and research generated a considerable number of variables that could conceivably influence variations between states in children’s access to public mental health care and to the costs of that care. The following chapter summarizes the benchmarks we generated on access and expenditures, and identifies those explanatory factors found to be significantly correlated to variation in rates of access or expenditures. A complete presentation of benchmarks and our analyses of explanatory factors are contained in Appendices A through C.
Dougherty Management Associates, Inc. Chapter III - Page 19
IV. SUMMARY OF BENCHMARKS AND CORRELATES OF VARIATION
The collection and aggregation of children’s mental health access, utilization and cost data from so many state and county agencies has been an ambitious undertaking. Many have argued that the variations in organization and financing of mental health services for children and youth are so great that the results are not comparable. From a public health perspective, however, it seems critically important for state planners and advocates to have a clear sense of how their children’s mental health systems compare to other systems on some of these critical measures, and the factors that influence the differences. Clearly, these are the same kinds of questions that managed care organizations would ask if they were proposing to provide services to these same states. In this paper we have tried to collect, analyze, and report on these data in as much detail as possible because, in our view, only by trying to synthesize this vast array of material can the field identify critical factors and opportunities for improvement at a health plan, state and national level.
There are limitations in our approach and in the field’s capabilities for reporting that are important to consider. For instance, though our survey requested data in a way that should have resulted in our receiving unduplicated and complete counts of MHA services and Medicaid services, many states were unable to provide us the data in the way that we had requested. In addition, our interviews revealed that we had received partial data or duplicated data from a number of states. We encountered these problems despite considerable communication and sharing of data and reports with state staff in prior years. We found that any given state agency staff person may not necessarily fully understand how his or her agency is financed, how it relates to other state agencies, or how these factors are reflected in reporting systems. They may therefore have no way to know if their data exclude important parts of the system or overlap with those of a sister agency. MEDICAID BENCHMARKS
Medicaid data were generally based on claims and encounter data that are collected and reported to meet requirements for federal reimbursement, providing a degree of consistency among states. However, states did not always provide us with data for all Medicaid enrolled children. This often occurred because the state MHA submitted the Medicaid data and only had access to certain Medicaid databases; it therefore does not necessarily signify a limitation in Medicaid reporting systems. Distinguishing whether Medicaid data included all services and enrollees or excluded a significant subset of either was important in analyzing rates of penetration, utilization and cost among the enrolled population. Two other important sources of variation among states were: (a) the inclusion or exclusion of services provided by primary care providers under mental health diagnoses and (b) whether residential treatment services were reported within the inpatient, residential or even outpatient level of care. Medicaid penetration rates for states with all inclusive data exceeded those for states providing only partial measures by 3%. (See Chart IV-1.) The range of penetration rates, though still large, was also reduced; the overall range was 2% to 16% while the range of programs with all inclusive reporting ranged from 6% to 16%.
Dougherty Management Associates, Inc. Chapter IV - Page 20
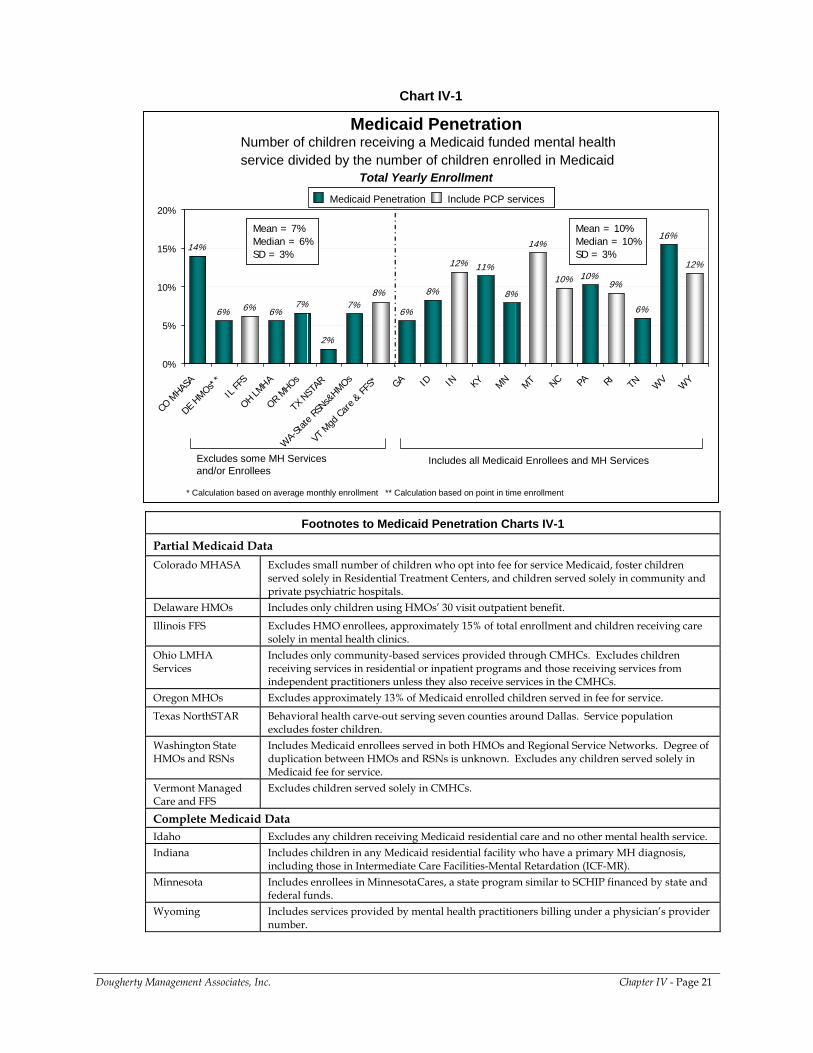
Chart IV-1
Number of children receiving a Medicaid funded mental health service divided by the number of children enrolled in Medicaid
Medicaid Penetration
14%
6% 6% 6%7%
2%
7%6%
8%
12% 11%
8%
14%
10% 10%9%
6%
16%
12%
8%
0%
5%
10%
15%
20%
CO M
HASA
DE HMOs*
*
IL FF
S
OH LMHA
OR MHOs
TX N
STAR
WA-
State
RSNs&
HMOs
VT M
gd Ca
re & FF
S* GA ID IN KY MN MT NC PA RI TN WV
WY
Medicaid Penetration Include PCP servicesMedicaid Penetration Include PCP services
Excludes some MH Services and/or Enrollees
Includes all Medicaid Enrollees and MH Services
Mean = 7%Median = 6% SD = 3%
Mean = 7%Median = 6% SD = 3%
Mean = 10%Median = 10% SD = 3%
Mean = 10%Median = 10% SD = 3%
Total Yearly Enrollment
* Calculation based on average monthly enrollment ** Calculation based on point in time enrollment
Footnotes to Medicaid Penetration Charts IV-1
Partial Medicaid Data Colorado MHASA Excludes small number of children who opt into fee for service Medicaid, foster children
served solely in Residential Treatment Centers, and children served solely in community and private psychiatric hospitals.
Delaware HMOs Includes only children using HMOs’ 30 visit outpatient benefit.
Illinois FFS Excludes HMO enrollees, approximately 15% of total enrollment and children receiving care solely in mental health clinics.
Ohio LMHA Services
Includes only community-based services provided through CMHCs. Excludes children receiving services in residential or inpatient programs and those receiving services from independent practitioners unless they also receive services in the CMHCs.
Oregon MHOs Excludes approximately 13% of Medicaid enrolled children served in fee for service.
Texas NorthSTAR Behavioral health carve-out serving seven counties around Dallas. Service population excludes foster children.
Washington State HMOs and RSNs
Includes Medicaid enrollees served in both HMOs and Regional Service Networks. Degree of duplication between HMOs and RSNs is unknown. Excludes any children served solely in Medicaid fee for service.
Vermont Managed Care and FFS
Excludes children served solely in CMHCs.
Complete Medicaid Data Idaho Excludes any children receiving Medicaid residential care and no other mental health service. Indiana Includes children in any Medicaid residential facility who have a primary MH diagnosis,
including those in Intermediate Care Facilities-Mental Retardation (ICF-MR). Minnesota Includes enrollees in MinnesotaCares, a state program similar to SCHIP financed by state and
federal funds. Wyoming Includes services provided by mental health practitioners billing under a physician’s provider
number.
Dougherty Management Associates, Inc. Chapter IV - Page 21
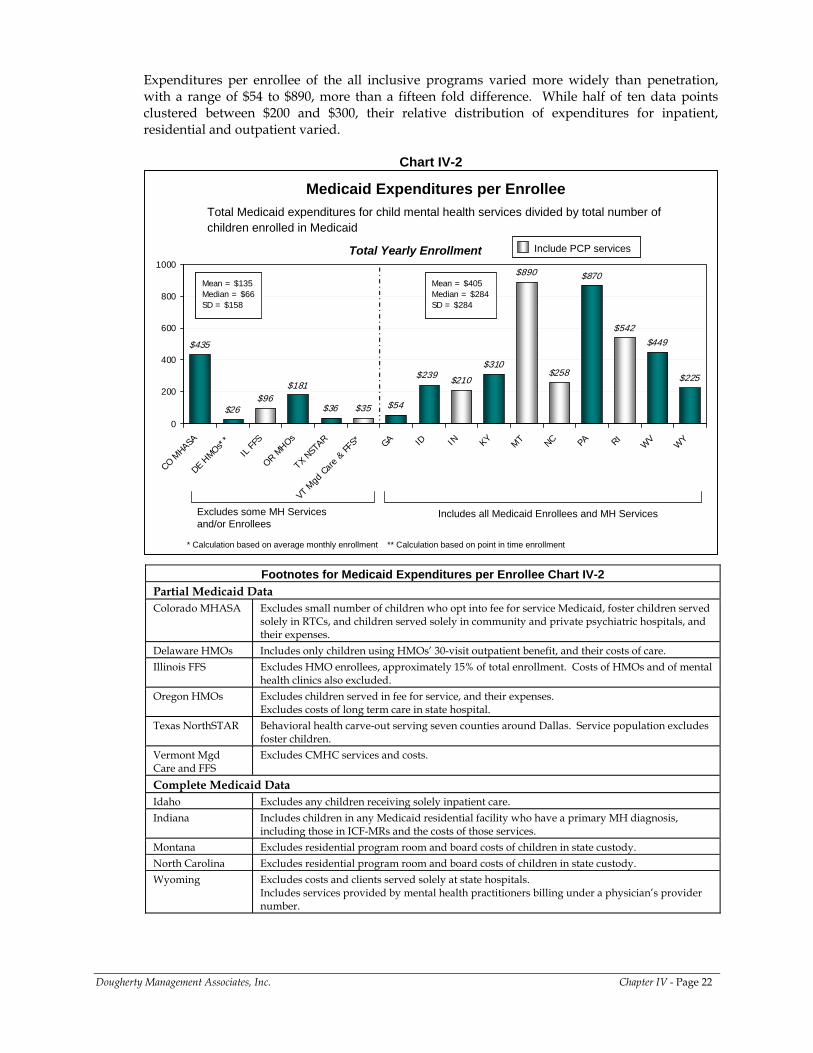
Expenditures per enrollee of the all inclusive programs varied more widely than penetration, with a range of $54 to $890, more than a fifteen fold difference. While half of ten data points clustered between $200 and $300, their relative distribution of expenditures for inpatient, residential and outpatient varied.
Chart IV-2
$435
$26$96
$181
$36 $35 $54
$210
$310
$890
$258
$870
$542$449
$225$239
0
200
400
600
800
1000
CO MHA
SA
DE HMOs*
*
IL FF
S
OR MHOs
TX N
STAR
VT M
gd C
are
& FF
S* GA ID IN KYMT NC PA RI
WV
WY
Total Medicaid expenditures for child mental health services divided by total number of children enrolled in Medicaid
Medicaid Expenditures per Enrollee
Include PCP servicesInclude PCP services
Excludes some MH Services and/or Enrollees
Includes all Medicaid Enrollees and MH Services
Mean = $135Median = $66SD = $158
Mean = $135Median = $66SD = $158
Mean = $405Median = $284SD = $284
Mean = $405Median = $284SD = $284
Total Yearly Enrollment
* Calculation based on average monthly enrollment ** Calculation based on point in time enrollment
Footnotes for Medicaid Expenditures per Enrollee Chart IV-2 Partial Medicaid Data Colorado MHASA Excludes small number of children who opt into fee for service Medicaid, foster children served
solely in RTCs, and children served solely in community and private psychiatric hospitals, and their expenses.
Delaware HMOs Includes only children using HMOs’ 30-visit outpatient benefit, and their costs of care. Illinois FFS Excludes HMO enrollees, approximately 15% of total enrollment. Costs of HMOs and of mental
health clinics also excluded. Oregon HMOs Excludes children served in fee for service, and their expenses.
Excludes costs of long term care in state hospital. Texas NorthSTAR Behavioral health carve-out serving seven counties around Dallas. Service population excludes
foster children. Vermont Mgd Care and FFS
Excludes CMHC services and costs.
Complete Medicaid Data Idaho Excludes any children receiving solely inpatient care. Indiana Includes children in any Medicaid residential facility who have a primary MH diagnosis,
including those in ICF-MRs and the costs of those services. Montana Excludes residential program room and board costs of children in state custody. North Carolina Excludes residential program room and board costs of children in state custody. Wyoming Excludes costs and clients served solely at state hospitals.
Includes services provided by mental health practitioners billing under a physician’s provider number.
Dougherty Management Associates, Inc. Chapter IV - Page 22
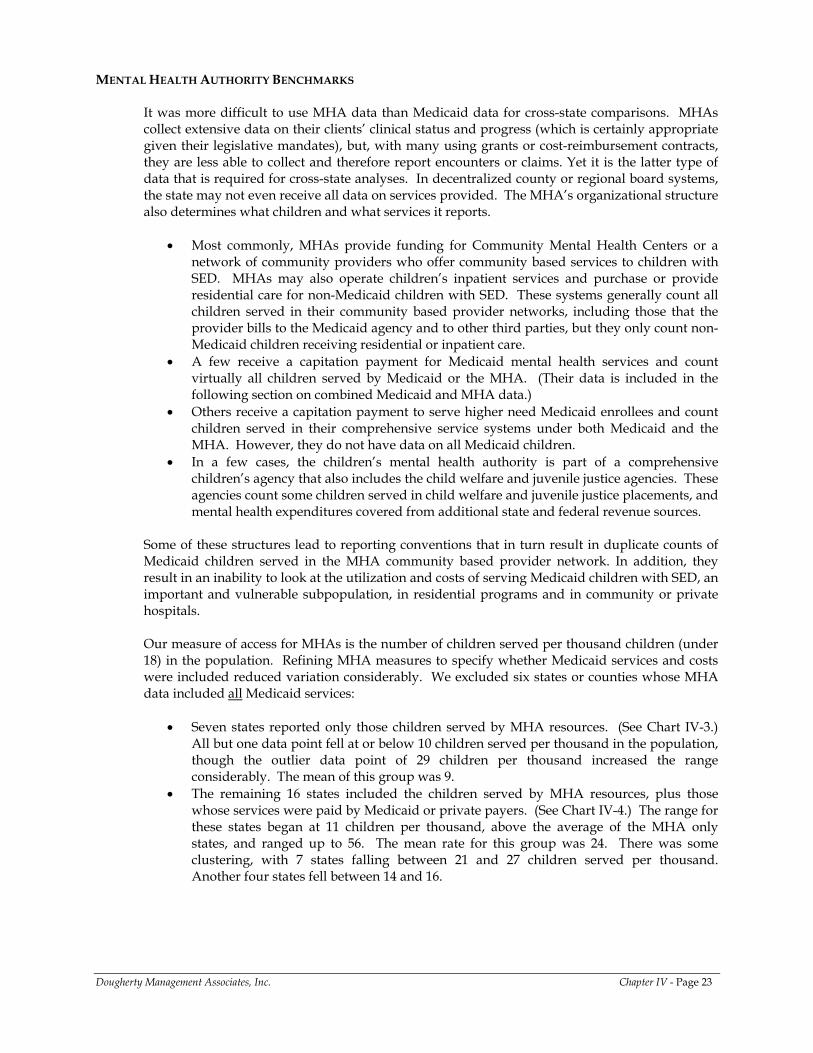
MENTAL HEALTH AUTHORITY BENCHMARKS
It was more difficult to use MHA data than Medicaid data for cross-state comparisons. MHAs collect extensive data on their clients’ clinical status and progress (which is certainly appropriate given their legislative mandates), but, with many using grants or cost-reimbursement contracts, they are less able to collect and therefore report encounters or claims. Yet it is the latter type of data that is required for cross-state analyses. In decentralized county or regional board systems, the state may not even receive all data on services provided. The MHA’s organizational structure also determines what children and what services it reports.
• Most commonly, MHAs provide funding for Community Mental Health Centers or a network of community providers who offer community based services to children with SED. MHAs may also operate children’s inpatient services and purchase or provide residential care for non-Medicaid children with SED. These systems generally count all children served in their community based provider networks, including those that the provider bills to the Medicaid agency and to other third parties, but they only count non-Medicaid children receiving residential or inpatient care.
• A few receive a capitation payment for Medicaid mental health services and count virtually all children served by Medicaid or the MHA. (Their data is included in the following section on combined Medicaid and MHA data.)
• Others receive a capitation payment to serve higher need Medicaid enrollees and count children served in their comprehensive service systems under both Medicaid and the MHA. However, they do not have data on all Medicaid children.
• In a few cases, the children’s mental health authority is part of a comprehensive children’s agency that also includes the child welfare and juvenile justice agencies. These agencies count some children served in child welfare and juvenile justice placements, and mental health expenditures covered from additional state and federal revenue sources.
Some of these structures lead to reporting conventions that in turn result in duplicate counts of Medicaid children served in the MHA community based provider network. In addition, they result in an inability to look at the utilization and costs of serving Medicaid children with SED, an important and vulnerable subpopulation, in residential programs and in community or private hospitals. Our measure of access for MHAs is the number of children served per thousand children (under 18) in the population. Refining MHA measures to specify whether Medicaid services and costs were included reduced variation considerably. We excluded six states or counties whose MHA data included all Medicaid services:
• Seven states reported only those children served by MHA resources. (See Chart IV-3.) All but one data point fell at or below 10 children served per thousand in the population, though the outlier data point of 29 children per thousand increased the range considerably. The mean of this group was 9.
• The remaining 16 states included the children served by MHA resources, plus those whose services were paid by Medicaid or private payers. (See Chart IV-4.) The range for these states began at 11 children per thousand, above the average of the MHA only states, and ranged up to 56. The mean rate for this group was 24. There was some clustering, with 7 states falling between 21 and 27 children served per thousand. Another four states fell between 14 and 16.
Dougherty Management Associates, Inc. Chapter IV - Page 23
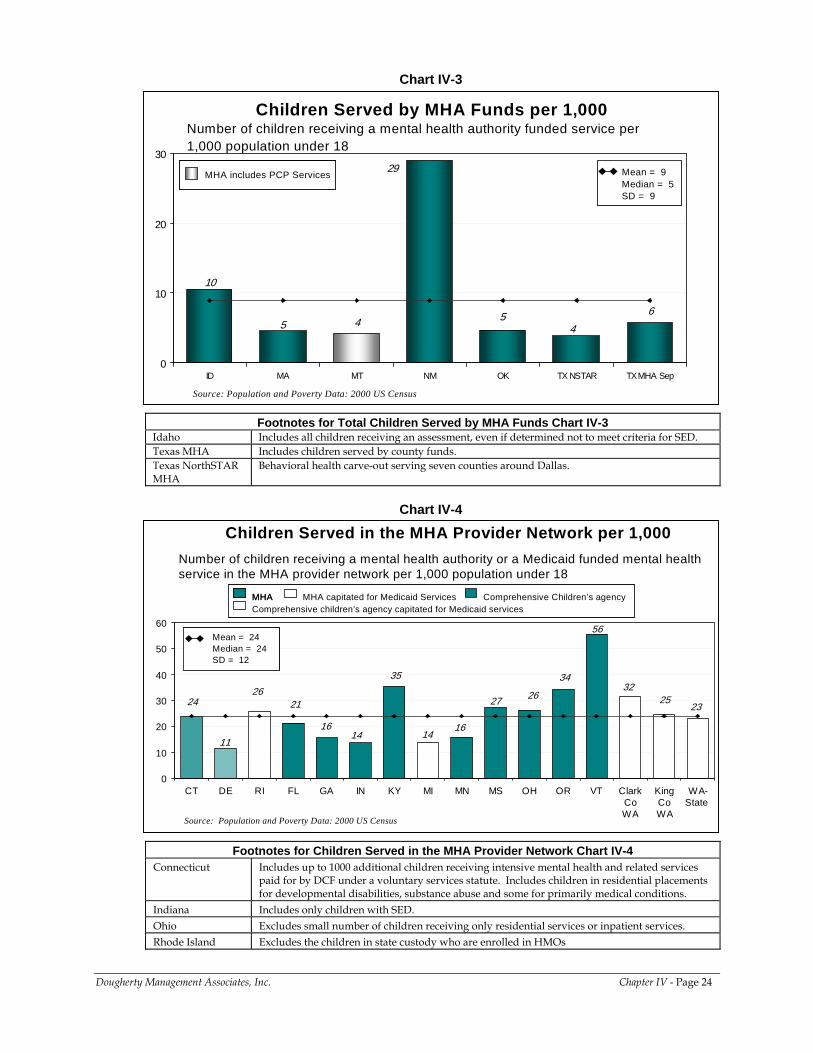
Chart IV-3
Number of children receiving a mental health authority funded service per 1,000 population under 18
Children Served by MHA Funds per 1,000
Source: Population and Poverty Data: 2000 US Census
5 4 5
10
6
4
29
0
10
20
30
ID MA MT NM OK TX NSTAR TX MHA Sep
Mean = 9Median = 5 SD = 9
Mean = 9Median = 5 SD = 9
MHA includes PCP ServicesMHA includes PCP Services
Footnotes for Total Children Served by MHA Funds Chart IV-3 Idaho Includes all children receiving an assessment, even if determined not to meet criteria for SED. Texas MHA Includes children served by county funds. Texas NorthSTAR MHA
Behavioral health carve-out serving seven counties around Dallas.
Chart IV-4
Number of children receiving a mental health authority or a Medicaid funded mental health service in the MHA provider network per 1,000 population under 18
Children Served in the MHA Provider Network per 1,000
Source: Population and Poverty Data: 2000 US Census
11
262625
34
16
24
1416
3235
27
56
23
14
21
0
10
20
30
40
50
60
CT DE RI FL GA IN KY MI MN MS OH OR VT ClarkCoWA
KingCoWA
WA-State
Mean = 24Median = 24 SD = 12
Mean = 24Median = 24 SD = 12
MHA capitated for Medicaid Services Comprehensive Children’s agencyMHAComprehensive children’s agency capitated for Medicaid services
MHA capitated for Medicaid Services Comprehensive Children’s agencyMHAMHAComprehensive children’s agency capitated for Medicaid services
Footnotes for Children Served in the MHA Provider Network Chart IV-4 Connecticut Includes up to 1000 additional children receiving intensive mental health and related services
paid for by DCF under a voluntary services statute. Includes children in residential placements for developmental disabilities, substance abuse and some for primarily medical conditions.
Indiana Includes only children with SED. Ohio Excludes small number of children receiving only residential services or inpatient services. Rhode Island Excludes the children in state custody who are enrolled in HMOs
Dougherty Management Associates, Inc. Chapter IV - Page 24
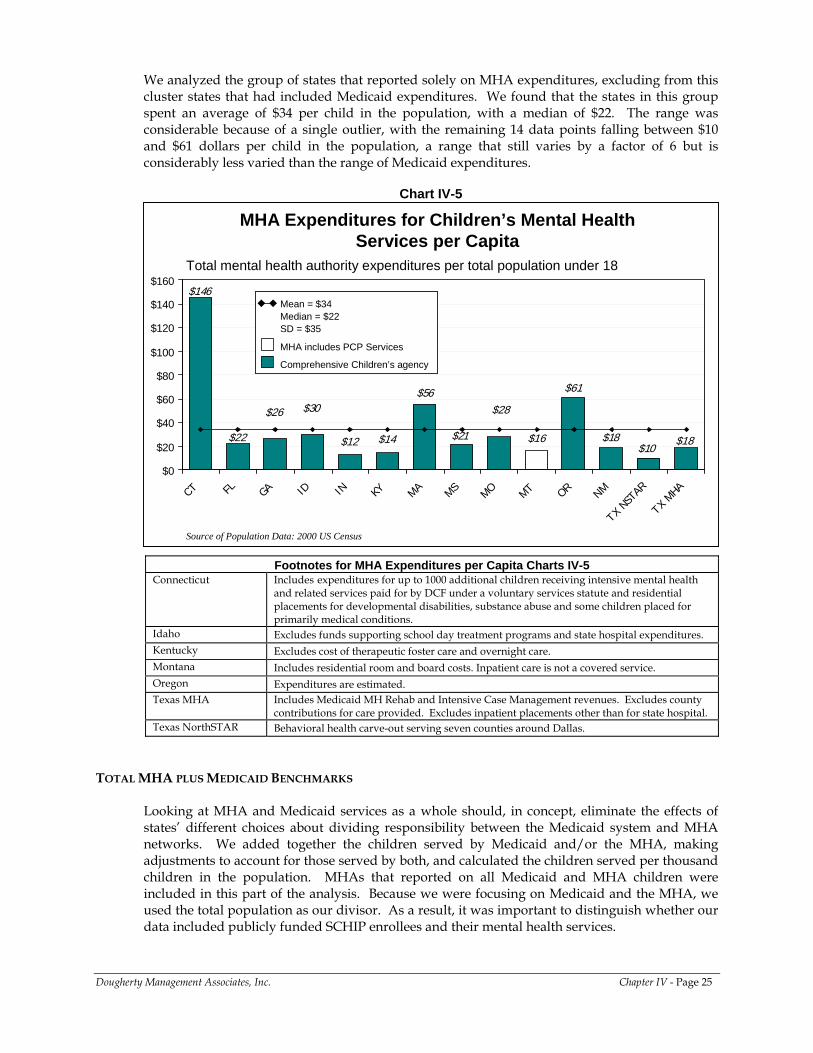
We analyzed the group of states that reported solely on MHA expenditures, excluding from this cluster states that had included Medicaid expenditures. We found that the states in this group spent an average of $34 per child in the population, with a median of $22. The range was considerable because of a single outlier, with the remaining 14 data points falling between $10 and $61 dollars per child in the population, a range that still varies by a factor of 6 but is considerably less varied than the range of Medicaid expenditures.
Chart IV-5
MHA Expenditures for Children’s Mental Health Services per Capita
$12
$61
$16 $18
$28$56
$18$10
$21
$26
$22 $14
$146
$30
$0
$20
$40
$60
$80
$100
$120
$140
$160
CT FL GA ID IN KY MA MSMO MT OR NM
TX NS
TAR
TX MHA
Source of Population Data: 2000 US Census
Total mental health authority expenditures per total population under 18
Mean = $34Median = $22SD = $35
MHA includes PCP Services
Comprehensive Children’s agency
Mean = $34Median = $22SD = $35
MHA includes PCP Services
Comprehensive Children’s agency
Footnotes for MHA Expenditures per Capita Charts IV-5 Connecticut Includes expenditures for up to 1000 additional children receiving intensive mental health
and related services paid for by DCF under a voluntary services statute and residential placements for developmental disabilities, substance abuse and some children placed for primarily medical conditions.
Idaho Excludes funds supporting school day treatment programs and state hospital expenditures. Kentucky Excludes cost of therapeutic foster care and overnight care. Montana Includes residential room and board costs. Inpatient care is not a covered service. Oregon Expenditures are estimated. Texas MHA Includes Medicaid MH Rehab and Intensive Case Management revenues. Excludes county
contributions for care provided. Excludes inpatient placements other than for state hospital. Texas NorthSTAR Behavioral health carve-out serving seven counties around Dallas.
TOTAL MHA PLUS MEDICAID BENCHMARKS
Looking at MHA and Medicaid services as a whole should, in concept, eliminate the effects of states’ different choices about dividing responsibility between the Medicaid system and MHA networks. We added together the children served by Medicaid and/or the MHA, making adjustments to account for those served by both, and calculated the children served per thousand children in the population. MHAs that reported on all Medicaid and MHA children were included in this part of the analysis. Because we were focusing on Medicaid and the MHA, we used the total population as our divisor. As a result, it was important to distinguish whether our data included publicly funded SCHIP enrollees and their mental health services.
Dougherty Management Associates, Inc. Chapter IV - Page 25
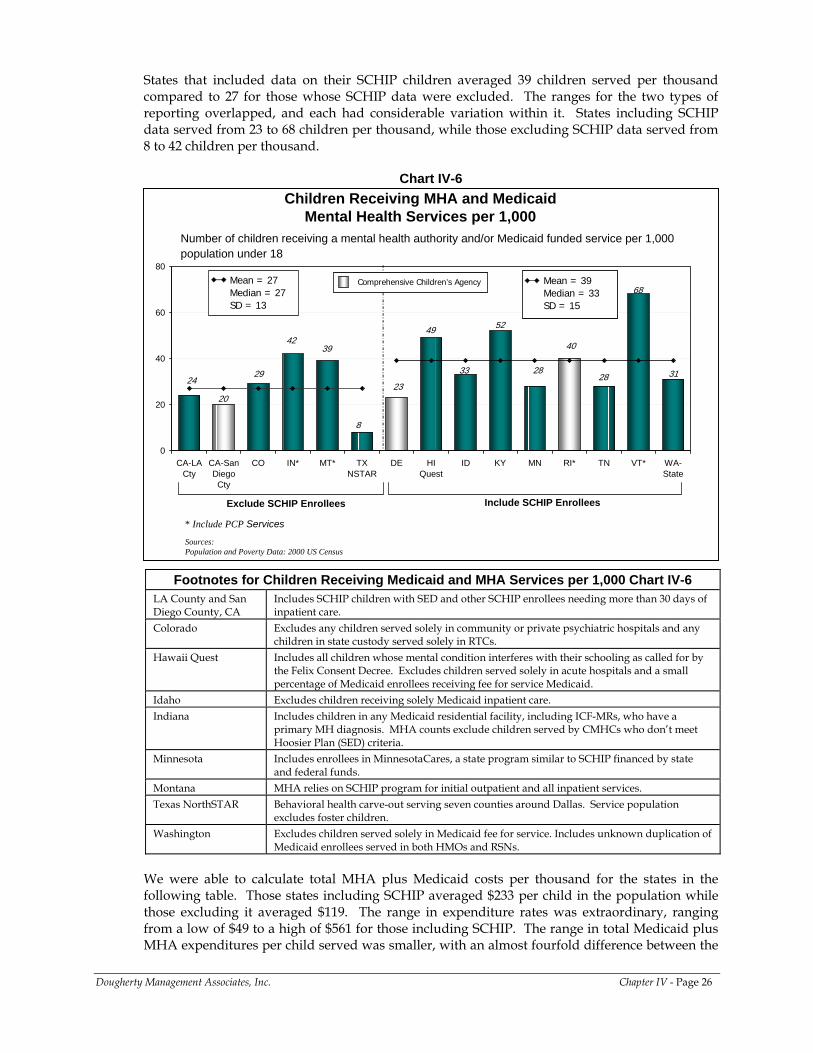
States that included data on their SCHIP children averaged 39 children served per thousand compared to 27 for those whose SCHIP data were excluded. The ranges for the two types of reporting overlapped, and each had considerable variation within it. States including SCHIP data served from 23 to 68 children per thousand, while those excluding SCHIP data served from 8 to 42 children per thousand.
Chart IV-6
Number of children receiving a mental health authority and/or Medicaid funded service per 1,000 population under 18
Children Receiving MHA and Medicaid Mental Health Services per 1,000
Sources:Population and Poverty Data: 2000 US Census
20
2829 31
4039
24
49
33
68
23
52
28
8
42
0
20
40
60
80
CA-LACty
CA-SanDiegoCty
CO IN* MT* TXNSTAR
DE HIQuest
ID KY MN RI* TN VT* WA-State
Exclude SCHIP Enrollees Include SCHIP Enrollees
Mean = 27Median = 27SD = 13
Mean = 39Median = 33SD = 15
Mean = 39Median = 33SD = 15
Comprehensive Children’s Agency Comprehensive Children’s Agency
* Include PCP Services
Footnotes for Children Receiving Medicaid and MHA Services per 1,000 Chart IV-6
LA County and San Diego County, CA
Includes SCHIP children with SED and other SCHIP enrollees needing more than 30 days of inpatient care.
Colorado Excludes any children served solely in community or private psychiatric hospitals and any children in state custody served solely in RTCs.
Hawaii Quest Includes all children whose mental condition interferes with their schooling as called for by the Felix Consent Decree. Excludes children served solely in acute hospitals and a small percentage of Medicaid enrollees receiving fee for service Medicaid.
Idaho Excludes children receiving solely Medicaid inpatient care. Indiana Includes children in any Medicaid residential facility, including ICF-MRs, who have a
primary MH diagnosis. MHA counts exclude children served by CMHCs who don’t meet Hoosier Plan (SED) criteria.
Minnesota Includes enrollees in MinnesotaCares, a state program similar to SCHIP financed by state and federal funds.
Montana MHA relies on SCHIP program for initial outpatient and all inpatient services. Texas NorthSTAR Behavioral health carve-out serving seven counties around Dallas. Service population
excludes foster children. Washington Excludes children served solely in Medicaid fee for service. Includes unknown duplication of
Medicaid enrollees served in both HMOs and RSNs.
We were able to calculate total MHA plus Medicaid costs per thousand for the states in the following table. Those states including SCHIP averaged $233 per child in the population while those excluding it averaged $119. The range in expenditure rates was extraordinary, ranging from a low of $49 to a high of $561 for those including SCHIP. The range in total Medicaid plus MHA expenditures per child served was smaller, with an almost fourfold difference between the
Dougherty Management Associates, Inc. Chapter IV - Page 26
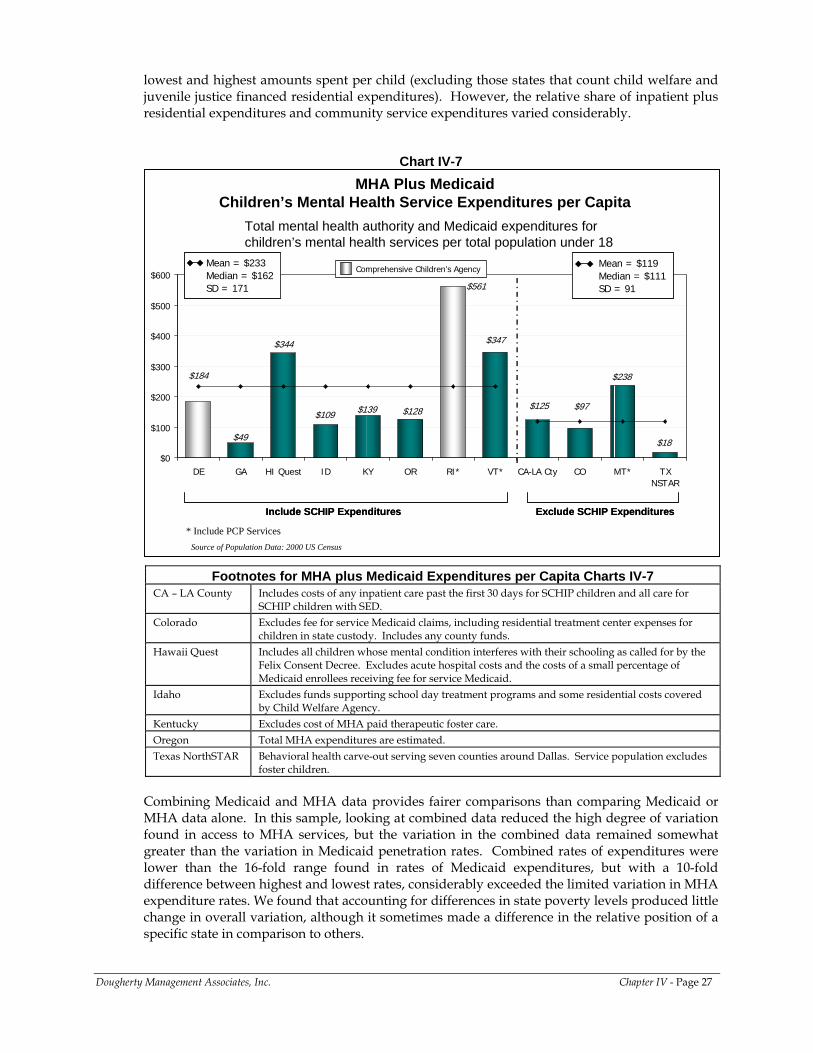
lowest and highest amounts spent per child (excluding those states that count child welfare and juvenile justice financed residential expenditures). However, the relative share of inpatient plus residential expenditures and community service expenditures varied considerably.
Chart IV-7 MHA Plus Medicaid
Children’s Mental Health Service Expenditures per Capita
$139
$238
$97
$18
$125
$561
$347$344
$49
$128
$184
$109
$0
$100
$200
$300
$400
$500
$600
DE GA HI Quest ID KY OR RI* VT* CA-LA Cty CO MT* TXNSTAR
Mean = $233Median = $162SD = 171
Mean = $233Median = $162SD = 171
Mean = $119Median = $111 SD = 91
Mean = $119Median = $111 SD = 91
Include SCHIP Expenditures Exclude SCHIP ExpendituresInclude SCHIP Expenditures Exclude SCHIP Expenditures
Source of Population Data: 2000 US Census
Total mental health authority and Medicaid expenditures for children’s mental health services per total population under 18
* Include PCP Services
Comprehensive Children’s Agency
Footnotes for MHA plus Medicaid Expenditures per Capita Charts IV-7 CA – LA County Includes costs of any inpatient care past the first 30 days for SCHIP children and all care for
SCHIP children with SED. Colorado Excludes fee for service Medicaid claims, including residential treatment center expenses for
children in state custody. Includes any county funds. Hawaii Quest Includes all children whose mental condition interferes with their schooling as called for by the
Felix Consent Decree. Excludes acute hospital costs and the costs of a small percentage of Medicaid enrollees receiving fee for service Medicaid.
Idaho Excludes funds supporting school day treatment programs and some residential costs covered by Child Welfare Agency.
Kentucky Excludes cost of MHA paid therapeutic foster care. Oregon Total MHA expenditures are estimated. Texas NorthSTAR Behavioral health carve-out serving seven counties around Dallas. Service population excludes
foster children.
Combining Medicaid and MHA data provides fairer comparisons than comparing Medicaid or MHA data alone. In this sample, looking at combined data reduced the high degree of variation found in access to MHA services, but the variation in the combined data remained somewhat greater than the variation in Medicaid penetration rates. Combined rates of expenditures were lower than the 16-fold range found in rates of Medicaid expenditures, but with a 10-fold difference between highest and lowest rates, considerably exceeded the limited variation in MHA expenditure rates. We found that accounting for differences in state poverty levels produced little change in overall variation, although it sometimes made a difference in the relative position of a specific state in comparison to others.
Dougherty Management Associates, Inc. Chapter IV - Page 27
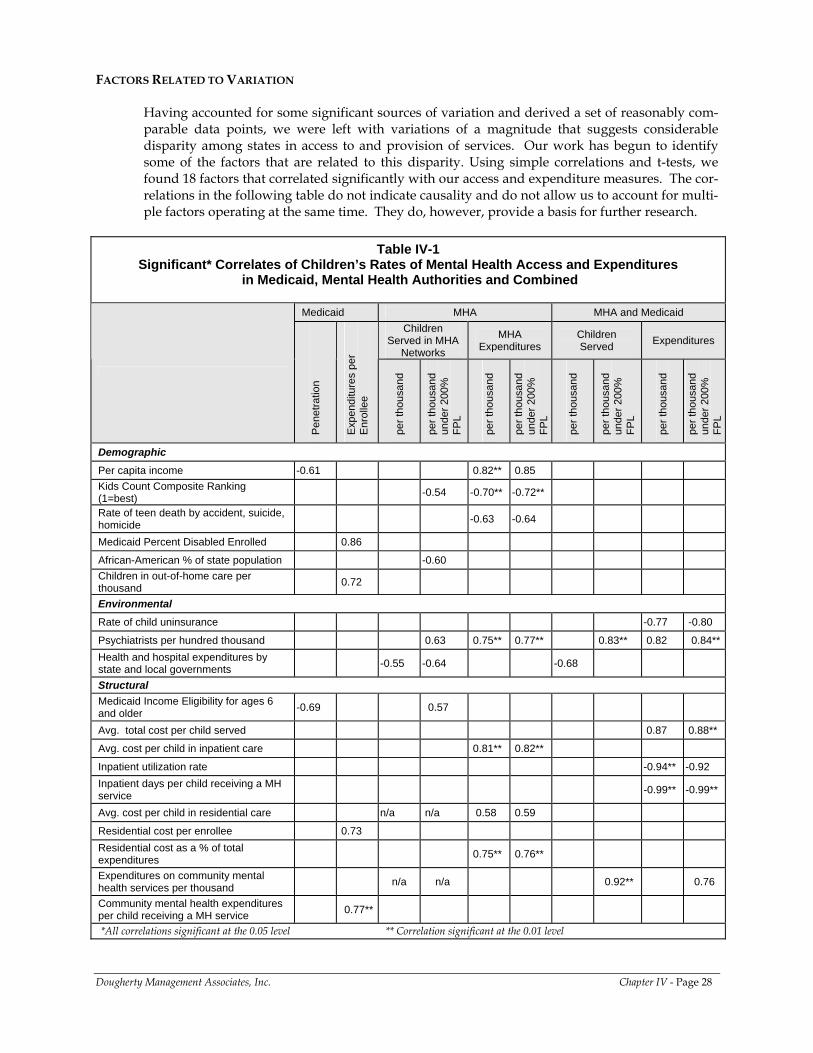
FACTORS RELATED TO VARIATION
Having accounted for some significant sources of variation and derived a set of reasonably com-parable data points, we were left with variations of a magnitude that suggests considerable disparity among states in access to and provision of services. Our work has begun to identify some of the factors that are related to this disparity. Using simple correlations and t-tests, we found 18 factors that correlated significantly with our access and expenditure measures. The cor-relations in the following table do not indicate causality and do not allow us to account for multi-ple factors operating at the same time. They do, however, provide a basis for further research.
Table IV-1
Significant* Correlates of Children’s Rates of Mental Health Access and Expenditures in Medicaid, Mental Health Authorities and Combined
Medicaid MHA MHA and Medicaid
Children Served in MHA
Networks
MHA Expenditures
Children Served Expenditures
Pene
tratio
n
Expe
nditu
res
per
Enro
llee
per t
hous
and
per t
hous
and
unde
r 200
%
FPL
per t
hous
and
per t
hous
and
unde
r 200
%
FPL
per t
hous
and
per t
hous
and
unde
r 200
%
FPL
per t
hous
and
per t
hous
and
unde
r 200
%
FPL
Demographic Per capita income -0.61 0.82** 0.85 Kids Count Composite Ranking (1=best) -0.54 -0.70** -0.72**
Rate of teen death by accident, suicide, homicide -0.63 -0.64
Medicaid Percent Disabled Enrolled 0.86
African-American % of state population -0.60 Children in out-of-home care per thousand 0.72
Environmental Rate of child uninsurance -0.77 -0.80
Psychiatrists per hundred thousand 0.63 0.75** 0.77** 0.83** 0.82 0.84**Health and hospital expenditures by state and local governments -0.55 -0.64 -0.68
Structural Medicaid Income Eligibility for ages 6 and older -0.69 0.57
Avg. total cost per child served 0.87 0.88**
Avg. cost per child in inpatient care 0.81** 0.82**
Inpatient utilization rate -0.94** -0.92 Inpatient days per child receiving a MH service -0.99** -0.99**
Avg. cost per child in residential care n/a n/a 0.58 0.59
Residential cost per enrollee 0.73 Residential cost as a % of total expenditures 0.75** 0.76**
Expenditures on community mental health services per thousand n/a n/a 0.92** 0.76
Community mental health expenditures per child receiving a MH service 0.77**
*All correlations significant at the 0.05 level ** Correlation significant at the 0.01 level
Dougherty Management Associates, Inc. Chapter IV - Page 28
Medicaid
• Medicaid penetration rates are negatively correlated with state income levels and the income eligibility standards for Medicaid. In contrast, Medicaid expenditure rates are positively correlated with the enrollment of two high need populations, children with disabilities and those in out of home care, and with the percentage of funding for community and residential services.
Mental Health Authority
• More expansive Medicaid eligibility was correlated with higher access, while higher percentages of African-Americans in the state child population were correlated with lower rates of access.
• States with more psychiatrists per hundred thousand served more poor children and had higher rates of MHA mental health expenditures.
• States rated lower on the KidsCount composite measure of child well being and with higher rates of teen death by accident, suicide and homicide, had lower rates of MHA expenditures. Access was also lower in the states ranked lower on child well being.
• Higher inpatient and residential spending per child was correlated to higher overall expenditure rates.
• States with higher rates of general healthcare expenditures served fewer children per thousand. Those states with higher incomes, however, spent more on MHA services.
Combined Medicaid and MHA
• Lower inpatient utilization and higher rates of expenditures on community services were associated with higher total expenditures. Higher rates of expenditures on community services were also associated with higher rates of poor children served.
• States with more psychiatrists per hundred thousand served more children and had higher rates of combined mental health expenditures.
• States with low rates of child uninsurance had higher rates of mental health expenditures. Those spending more on all health and hospital services had lower rates of access for children.
Testing of categorical measures was affected by our small sample size, and none resulted in statistically significant differences between means. Though not significant, these findings suggest some important areas for further investigation:
• Managed care variables appeared to have the most impact, with less managed care associated with higher rates of access in the MHA, Medicaid and combined domains. The effect on expenditure rates was less clear. MHAs with less managed care had higher expenditure rates. In contracts, those with managed Medicaid mental health services or with some form of managed care in their MHA, their Medicaid agency, or both, had higher expenditure rates.
• MHAs’ methods of paying their CMHCs or community service providers showed a consistent effect: Fee for service payment methods were associated with higher access in MHA provider networks and with higher rates of expenditures in Medicaid and in MHAs.
• State administered MHAs were associated with higher access to MHA provider services and with higher Medicaid expenditure rates and higher combined Medicaid and MHA expenditure rates than county administered systems.
• We found somewhat higher MHA per capita expenditure rates for states with more restrictive clinical eligibility criteria and higher combined MHA and Medicaid access for those not restricting MHA services to children with SED.
Dougherty Management Associates, Inc. Chapter IV - Page 29
• MHAs using sliding fee scales had higher rates of expenditures than those setting an income limit for MHA services.
• Finally, states with mental health parity laws showed higher rates of MHA expenditures than those without such legislation.
LIMITATIONS
Despite our attempts to eliminate differences in state data and reporting conventions, we identified and footnoted many additional unique aspects of various states’ data. In addition, some of our combined Medicaid and MHA counts of children served were estimates, which we discussed with state staff, but which remain estimates nevertheless. However, given the magnitude of the variation among states, we believe that the remaining inconsistencies and estimation ranges would not appreciably change our overall conclusions.
CONCLUSIONS
Despite our efforts to identify factors that might explain the variation we found in Medicaid and MHA children’s mental health care across 29 states, 4 counties, and a multi-county program, considerable variation remains. Our findings are consistent with Roland Sturm’s analysis of the Survey of America’s Families; he found that between state variations in access to mental health care were not explained by differences in the racial/ ethnic or socio-economic makeup of states and, in fact, exceeded racial/ethnic and family income disparities. Further, he found that disparities in access were not related to other indications of need.7
Similar to Roland Sturm, we found that relatively little of the variation in access is spending was related to differences in income, ethnicity or ages of the states’ total populations or children served. While Medicaid penetration and MHA spending rates were correlated with state income levels and percentage of African-Americans in the population was negatively correlated with MHA access, other demographic variables showed non-significant correlations with access and expenditures. The number of psychiatrists per hundred thousand stands out as an important factor related to both access and expenditures, correlated to both the MHA’s priority population and the combined group of children served by Medicaid and the MHA. Strikingly, for our KidsCount measures of child well-being and teen death rates, indications of higher need were negatively correlated with access to MHA services and to the rate of MHA expenditures. This suggests several possible explanations: that states with lower levels of child well-being and higher rates of teen death don’t or can’t address their need as well as other states; that investing in children’s mental health services helps to reduce teen deaths and increase child well-being; or perhaps that there are some confounding factors in the KidsCount measure relating to state spending or budgetary levels that produce the result. Given the long-standing use and testing of the KidsCount measure, this is an important area for further investigation. A number of other factors, including eligibility standards, expansion of child insurance options, utilization and provision of different levels of care, are determined by state policy and management choices. Better understanding of how these factors are related to access and cost might enable states to modify their service systems in ways that would achieve desirable goals. Even after identifying these factors, there remains (and we believe that, under our current federal financing mechanisms, there will always remain) considerable variation due to the unique historical evolution of different states’ public mental health systems for children. Medicaid and mental health block grant regulations have allowed states to make different policy choices, so that they can tailor their resources to their own service needs, health delivery systems, and
Dougherty Management Associates, Inc. Chapter IV - Page 30
7 Sturm, Roland; Ringel, Jeanne S.; Andreyeva, Tatiana, “Geographic Disparities in Children’s Mental Health Care”, Pediatrics, Volume 112, No. 4.
organizational structures. In some states, lawsuits have had a major influence on the design and functioning of services, while in others a concerted strategy to cover uninsured children has expanded access to mental health services. Medicaid policy also gives states wide discretion in the design of their benefits.
Less dramatically, factors such as the nature of state provider systems, the availability of providers and their role in their communities influence the evolution of mental health systems and create ongoing political influences. Policies independent of mental health may also expand or constrain the options available for provision of mental health care. However, in a public mental health system in which a significant portion of the resources are federal, the degree of disparity our data describes seems excessive. While states’ flexibility in use of resources is important, we believe it is also a federal responsibility to minimize disparities where possible by ensuring that program parameters account appropriately for differences in states’ needs and resource bases, and by holding every state accountable for its performance.
RECOMMENDATIONS
In 1999, the Surgeon General’s report on Mental Health identified the imperative to address disparities in access to mental health care. More recently, the President’s New Freedom Commission has emphasized the need to reduce fragmentation in the mental health system and has recommended moving toward comprehensive planning of mental health services across funding sources and administrative agencies. This type of planning would better define the geographic disparities within and between states, and provide a basis for addressing them. To produce the kind of plan the President’s New Freedom Commission suggests will require comprehensive, consistently defined, system-level measures of access, utilization and cost. A valid nationwide database should eventually provide a foundation for measuring treatment outcomes and analysis of how they are related to treatment inputs, organizational structure, and treatment process. It should also provide a basis for monitoring and reducing the most significant disparities among states. The National Committee for Quality Assurance (NCQA) and the Forum on Performance Measures are developing, specifying and refining methodologically sound indicators that eliminate many of the confounding factors that prevent fair comparisons among health plans and health systems. However, most of those measures involve a subset of the population served; they tend, appropriately, to focus on aspects of care important to large subpopulations and focus on engagement and early treatment. Their measures do not necessarily capture important indicators of access to and quality of ongoing care for children with SED. Systems of Care that merge funding to care for such children more efficiently and responsively will create the unified treatment data necessary to achieve this goal. However, at this time, reporting on Systems of Care still tends to be based on demographics and outcomes, and contains little of the type of utilization and cost data we detail in this report. Furthermore, existing Systems of Care are generally small or limited in scope and reporting does not encompass all children in the state.
The experience of this project and similar projects provide important lessons for state and federal officials. These include: Measurement of MHA Services
• States should develop methods for analyzing all services to their priority population of children with SED, whether they are paid for by Medicaid, the MHA or both, or by child welfare, juvenile justice or education agencies. Rich repositories of clinical and outcome data should be combined with utilization and cost data to promote learning and effective management.
Dougherty Management Associates, Inc. Chapter IV - Page 31
• States should track CMHCs’ use of MHA resources, and children served by them, and develop methods to separate them from Medicaid eligible children and Medicaid paid services. Doing so will permit a better understanding of how eligibility changes affect access to services for those children who need it.
• States should develop reporting systems capable of monitoring how well CMHCs enroll children into Medicaid and bill Medicaid for their services.
• MHAs that pay community providers on a deficit funding basis should ensure that they establish appropriate accountability for use of resources, and incentives for efficient and effective service delivery.
Measurement of Medicaid Services
• It is important for every state to evaluate the performance of its Medicaid program as a whole, not only its separate HMO, PCCM and fee for service programs. Similarly, Medicaid agencies need to account for services where another state agency is responsible for the state match.
• Consistent definitions and reporting conventions are needed for mental health services provided by primary care physicians.
• Stratification of major eligibility categories, including income eligible children, children in state custody, and children with disabilities, is necessary when comparing Medicaid programs with differing caseloads in different states.
• SCHIP is an overlooked source of mental health service, accounting for a significant share of public mental health care, and it should be included in analyses.
• In comparing Medicaid data, states need to develop consistent methods to account for how the following services are counted and/or categorized:
- Community Mental Health Center services (included or excluded) - Residential services (counted as inpatient, residential, outpatient) - Residential room and board (included or excluded) - Therapeutic foster care (counted as residential or outpatient) - State hospital services (if applicable)
Comprehensive Measures from Multiple Agencies
• States need to map their children’s mental health delivery and reporting systems to clearly identify duplications between agencies and gaps in reporting, and develop strategies to account for or eliminate duplications and fill the gaps. A variety of methods exist for calculating or eliminating duplications. These range from probabilistic population estimates, which can be done using current databases, to merging records on a common identifier, to building an integrated database. We believe the place to begin is with the MHA and Medicaid.
• States need to define and identify the significant subpopulations of children their public mental health systems serve and develop ways to consistently track them across all relevant state agencies, capturing all relevant clinical, service, and expenditure data on them. Policy makers need to recognize administrative categories (such as foster care status, Medicaid eligibility, and IDEA category) necessary for managing categorical resources, and they also need to distinguish clinical/ programmatic subpopulations (such as children with SED and children with less serious mental illnesses) in order to appropriately manage their treatment needs.
Cross System Benchmarking
• States are hungry for relevant comparative data to help them evaluate their own performance. However, as we have seen, considerable resources are necessary to
Dougherty Management Associates, Inc. Chapter IV - Page 32
develop fair and accurate comparisons among states. The return on such investments will be greater if each state works closely with a small set of states that share similar organizational structures. States committed to benchmarking to each other over time can invest the resources necessary to produce reports using common methodology. Such groups of states can also function as learning communities with opportunities for evaluating natural experiments.
For two or more decades, the promise of comprehensive data for policy and decision making has been an elusive goal despite the dramatic expansion of information technology. Nowhere is this more evident and important than in children’s mental health. As the four years of the Children’s Mental Health Benchmarking Project have demonstrated, the field is incrementally moving toward a point where states and public mental health systems are able to consistently and reliably report on key administrative performance measures. While more progress and considerable technical assistance is certainly needed, we are encouraged by the efforts of states to participate in this project and hopefully to benefit from the results. We believe that the extremely wide variation in access, utilization and spending on children’s mental health services demonstrated by this and other studies, warrants a concerted, interagency effort by the federal government in concert with state administrators to identify the sources of variation and to identify approaches to reduce this variation in key areas. As the field moves toward more consistent reporting standards and develops consensus on the factors that are necessary to stratify and explain the results, we hope that this project and the efforts that preceded it provide the foundation for a more effective and useful system for reporting on and benchmarking children’s public mental health services. We express our thanks to the considerable support of the Annie E. Casey Foundation, the Center for Health Care Strategies and The Robert Wood Johnson Foundation for making this work possible.
Dougherty Management Associates, Inc. Chapter IV - Page 33
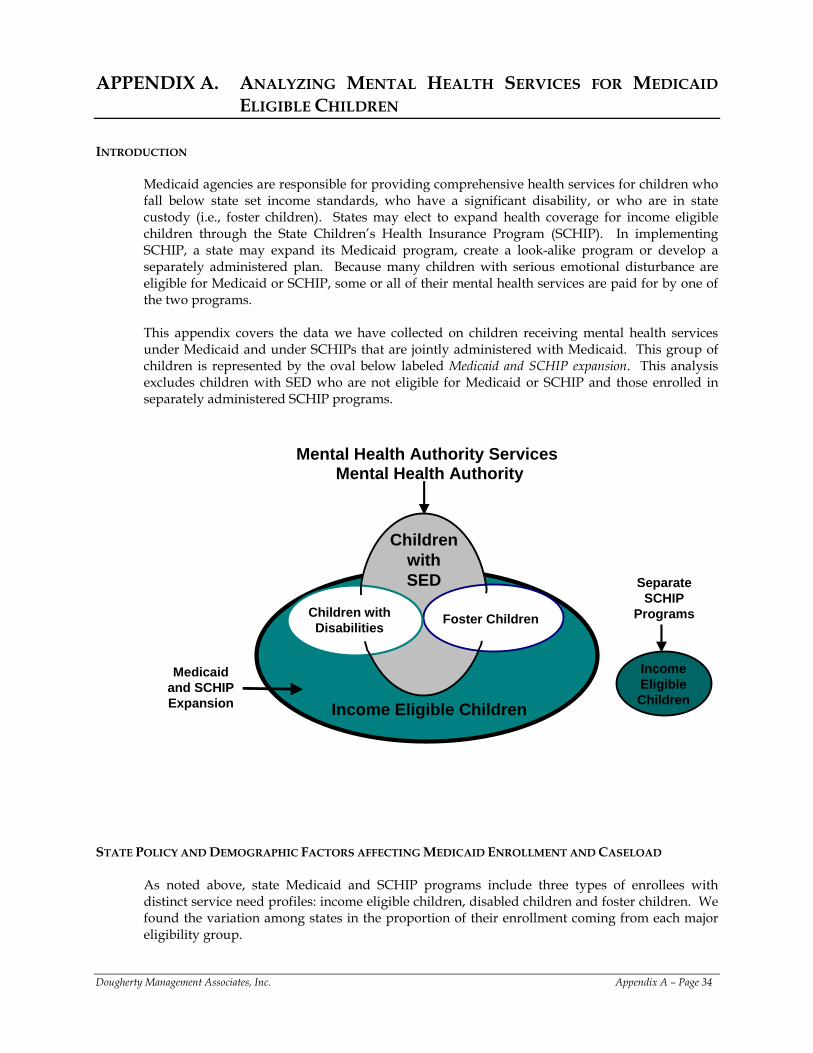
APPENDIX A. ANALYZING MENTAL HEALTH SERVICES FOR MEDICAID ELIGIBLE CHILDREN
INTRODUCTION
Medicaid agencies are responsible for providing comprehensive health services for children who fall below state set income standards, who have a significant disability, or who are in state custody (i.e., foster children). States may elect to expand health coverage for income eligible children through the State Children’s Health Insurance Program (SCHIP). In implementing SCHIP, a state may expand its Medicaid program, create a look-alike program or develop a separately administered plan. Because many children with serious emotional disturbance are eligible for Medicaid or SCHIP, some or all of their mental health services are paid for by one of the two programs. This appendix covers the data we have collected on children receiving mental health services under Medicaid and under SCHIPs that are jointly administered with Medicaid. This group of children is represented by the oval below labeled Medicaid and SCHIP expansion. This analysis excludes children with SED who are not eligible for Medicaid or SCHIP and those enrolled in separately administered SCHIP programs.
Mental Health Authority Services
Medicaid and SCHIP Expansion
Income Eligible Children
Separate SCHIP
Programs
Mental Health Authority
Children with Disabilities Foster Children
Income Eligible Children
Children with SED
STATE POLICY AND DEMOGRAPHIC FACTORS AFFECTING MEDICAID ENROLLMENT AND CASELOAD
As noted above, state Medicaid and SCHIP programs include three types of enrollees with distinct service need profiles: income eligible children, disabled children and foster children. We found the variation among states in the proportion of their enrollment coming from each major eligibility group.
Dougherty Management Associates, Inc. Appendix A – Page 34
Poor Children in Medicaid Caseloads
By far the largest group of enrollees are those eligible on the basis of income. States set income standards for Medicaid and SCHIP eligibility within federally established guidelines. At a minimum, states must cover children age 6 to 18 with family incomes up to 100% of the federal poverty level, but a number of states have set their levels higher or expanded them through SCHIP. In our sample, for instance, Minnesota has set its level at 275% of poverty and Vermont’s is at 300%. By definition, these differences in eligibility affect the proportion of all children in any given state who are eligible for services. In addition, however, states vary considerably with regard to their percentages of children who are poor. The percentage of all children under 18 whose family income is less than 200% of poverty varies twofold within our sample of states and counties that submitted Medicaid data: LA County had the highest percentage, with half of its children falling under 200% of poverty, while King County in Washington State had only 23%, less than half of LA’s rate. These two dimensions can make a considerable difference in the numbers of children covered. Finally, states also vary in terms of the percentage of children meeting eligibility standards who are enrolled in Medicaid. Age Differences in Medicaid Caseloads
Minimum income eligibility requirements set by the federal government are highest for infants, somewhat lower for children ages 2 though 6 and at 100% of poverty for children over 6. While these requirements are intended to assure physical health care for the youngest children, they have an impact on need for mental health services, since many mental health conditions are not identified or do not manifest at younger ages. Therefore, states with a greater proportion of infants and preschoolers would – all other things being equal -- be expected to show lower use of mental health services. In our dataset, Vermont’s Medicaid caseload in FY01 was almost two-thirds older children, while Texas’ caseload was not quite half older children. Children with Disabilities in Medicaid Caseloads
States also set both income and disability standards (within federal limits) for children’s eligibility for Supplemental Security Income (SSI), which simultaneously establishes Medicaid eligibility. Children on SSI typically have significantly higher utilization rates for mental health services than their non-disabled counterparts due to the high incidence of mental illness as a disabling condition and as a co-occurring disorder with other disabilities. While the number of children on SSI constitutes a relatively small proportion of all eligible children, the high incidence and seriousness of their needs can significantly affect the intensity of service utilization and its cost. In our sample, we found variations in the percentage of total children enrolled who were covered under SSI and related categories. Percentages ranged from less than 1% in Indiana to 10% in Pennsylvania, a state that sets no income criterion for SSI eligibility for children; those who meet disability criteria are enrolled in SSI and Medicaid. While we were not able to estimate differential penetration rates for disabled children and those eligible for other reasons, the Medicaid Managed Behavioral Health Care Benchmarking study DMA completed for SAMHSA found that SSI penetration for all ages exceeded TANF penetration for all programs measured, often by three to four times.8
Dougherty Management Associates, Inc. Appendix A – Page 35
8 Dougherty Management Associates, Inc., Medicaid Behavioral Health Benchmarking Project Report. DHHS Pub. No (SMA) 03-3844, Rockville, MD: Substance Abuse and Mental Health Services Administration, 2002.
Children in State Custody in Medicaid Caseloads
Finally, foster children and other children in state custody are an important subpopulation of Medicaid enrollees. Children become eligible for Medicaid when they are removed from their families and enter state custody. As a group, foster children generally have higher levels of need and higher utilization than children eligible for Medicaid on the basis of income. Reasons for the differences vary, but among those study participants who reported the number of foster children enrolled in Medicaid, the proportions in their caseloads varied from a low of 1% in Washington State to a high of 12% in Colorado. Given the differences in the service needs of children in different groups, it would be ideal to stratify our data by eligibility category. However, our data do not allow for this. Therefore, it is important to recognize that one state’s Medicaid caseload may differ somewhat from that of another state.
MEDICAID PENETRATION
The classic measure of access to care within health insurance plans is penetration: the percentage of enrollees who actually use a particular type of service during a specified period. Many states were able to give us a full count of children served in Medicaid, but others gave us a count that pertained to some subpart of their Medicaid program, either only counting certain enrollees, like those enrolled in managed care programs, or excluding certain services, or excluding both some enrollees and some services. We have distinguished those states that excluded a significant portion of their Medicaid program from those whose data were substantially complete. We have also identified how states defined mental health services. Most states limited mental health services to those provided by specialty mental health providers. However, some states included all claims with mental health diagnosis codes, thereby including services provided by primary care physicians that may have diagnosed, or prescribed medications for, a mental health condition. A final distinction is how states counted Medicaid enrollment. All but two counted all children enrolled in Medicaid at some time during the year; Vermont provided an average monthly enrollment figure, and Delaware provided a point in time enrollment figure. Both methods understate enrollment and overstate penetration in comparison to states using total enrollment methodology. The chart on the following page shows that penetration ranged from 6% to 16% for states that were able to provide a complete count of their Medicaid children’s mental health services. The mean and median were the same for these states, falling at 10%. Programs that counted children receiving services from primary care physicians were at the higher end of the range, falling between 9% and 14%. Not surprisingly, penetration is lower, on average, for those states that did not report all enrollees or all services, averaging 7%. This difference in means has face validity, but with this small sample size, it did not reach statistical significance on a T-test. The footnotes define what each state included in its data. In some cases, the exclusions are significant, while in others, like Colorado, the exclusions will affect relatively few children.
Dougherty Management Associates, Inc. Appendix A – Page 36
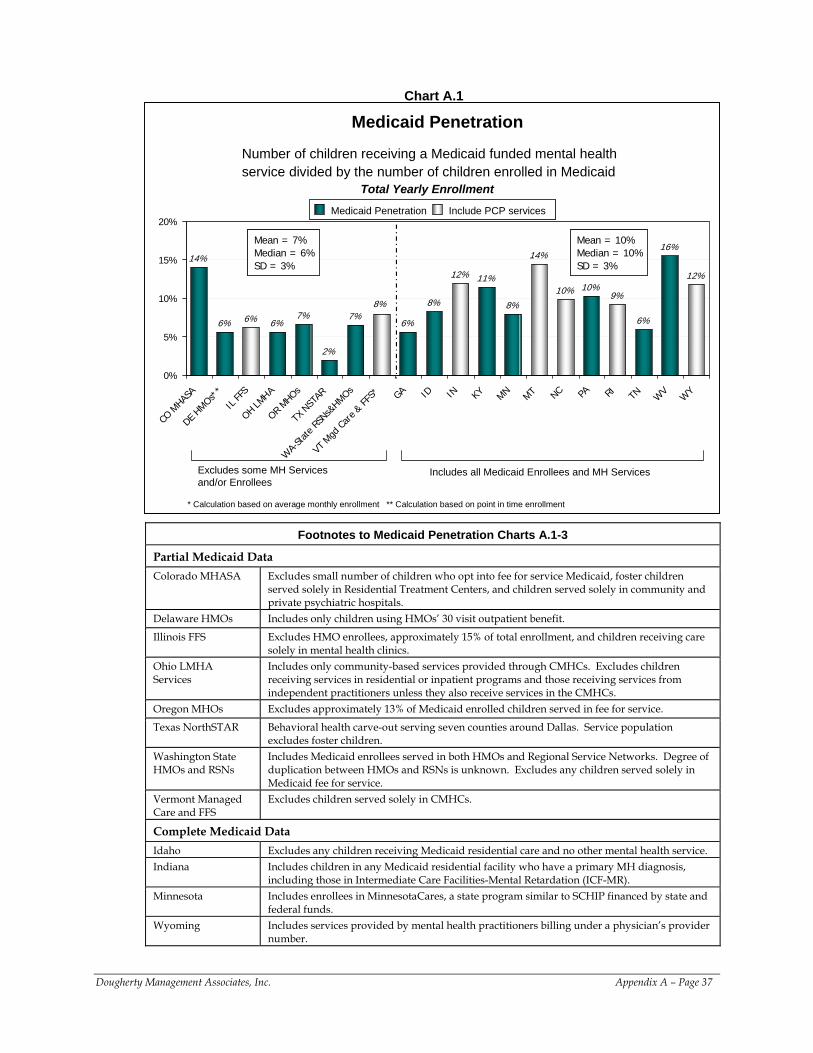
Chart A.1
Number of children receiving a Medicaid funded mental health service divided by the number of children enrolled in Medicaid
Medicaid Penetration
14%
6% 6% 6%7%
2%
7%6%
8%
12% 11%
8%
14%
10% 10%9%
6%
16%
12%
8%
0%
5%
10%
15%
20%
CO M
HASA
DE HMOs*
*
IL FF
S
OH LMHA
OR MHOs
TX N
STAR
WA-
State
RSNs&
HMOs
VT M
gd Ca
re & FF
S* GA ID IN KY MN MT NC PA RI TN WV
WY
Medicaid Penetration Include PCP servicesMedicaid Penetration Include PCP services
Excludes some MH Services and/or Enrollees
Includes all Medicaid Enrollees and MH Services
Mean = 7%Median = 6% SD = 3%
Mean = 7%Median = 6% SD = 3%
Mean = 10%Median = 10% SD = 3%
Mean = 10%Median = 10% SD = 3%
Total Yearly Enrollment
* Calculation based on average monthly enrollment ** Calculation based on point in time enrollment
Footnotes to Medicaid Penetration Charts A.1-3
Partial Medicaid Data Colorado MHASA Excludes small number of children who opt into fee for service Medicaid, foster children
served solely in Residential Treatment Centers, and children served solely in community and private psychiatric hospitals.
Delaware HMOs Includes only children using HMOs’ 30 visit outpatient benefit.
Illinois FFS Excludes HMO enrollees, approximately 15% of total enrollment, and children receiving care solely in mental health clinics.
Ohio LMHA Services
Includes only community-based services provided through CMHCs. Excludes children receiving services in residential or inpatient programs and those receiving services from independent practitioners unless they also receive services in the CMHCs.
Oregon MHOs Excludes approximately 13% of Medicaid enrolled children served in fee for service.
Texas NorthSTAR Behavioral health carve-out serving seven counties around Dallas. Service population excludes foster children.
Washington State HMOs and RSNs
Includes Medicaid enrollees served in both HMOs and Regional Service Networks. Degree of duplication between HMOs and RSNs is unknown. Excludes any children served solely in Medicaid fee for service.
Vermont Managed Care and FFS
Excludes children served solely in CMHCs.
Complete Medicaid Data Idaho Excludes any children receiving Medicaid residential care and no other mental health service. Indiana Includes children in any Medicaid residential facility who have a primary MH diagnosis,
including those in Intermediate Care Facilities-Mental Retardation (ICF-MR). Minnesota Includes enrollees in MinnesotaCares, a state program similar to SCHIP financed by state and
federal funds. Wyoming Includes services provided by mental health practitioners billing under a physician’s provider
number.
Dougherty Management Associates, Inc. Appendix A – Page 37
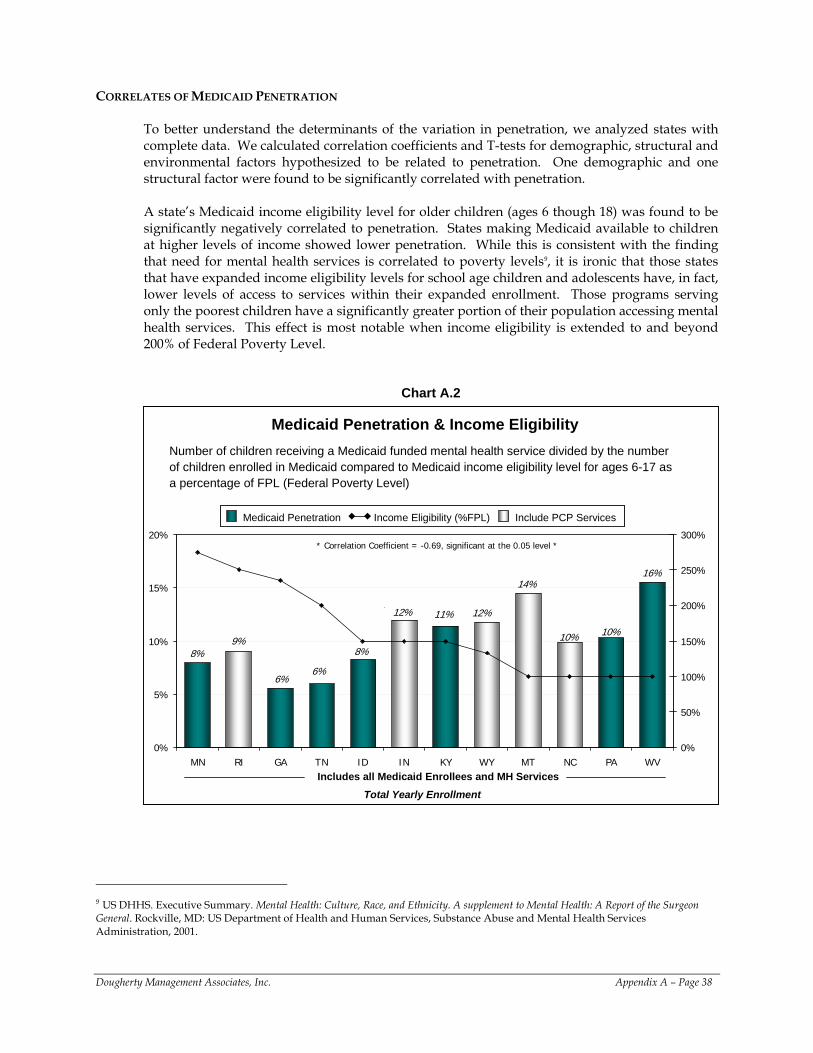
CORRELATES OF MEDICAID PENETRATION
To better understand the determinants of the variation in penetration, we analyzed states with complete data. We calculated correlation coefficients and T-tests for demographic, structural and environmental factors hypothesized to be related to penetration. One demographic and one structural factor were found to be significantly correlated with penetration. A state’s Medicaid income eligibility level for older children (ages 6 though 18) was found to be significantly negatively correlated to penetration. States making Medicaid available to children at higher levels of income showed lower penetration. While this is consistent with the finding that need for mental health services is correlated to poverty levels9, it is ironic that those states that have expanded income eligibility levels for school age children and adolescents have, in fact, lower levels of access to services within their expanded enrollment. Those programs serving only the poorest children have a significantly greater portion of their population accessing mental health services. This effect is most notable when income eligibility is extended to and beyond 200% of Federal Poverty Level.
Chart A.2
9%10%
6%
16%
8%8%
12%
14%
11%
10%
12%
6%
0%
5%
10%
15%
20%
MN RI GA TN ID IN KY WY MT NC PA WV0%
50%
100%
150%
200%
250%
300%
Medicaid Penetration & Income EligibilityNumber of children receiving a Medicaid funded mental health service divided by the number of children enrolled in Medicaid compared to Medicaid income eligibility level for ages 6-17 as a percentage of FPL (Federal Poverty Level)
Includes all Medicaid Enrollees and MH Services
Medicaid Penetration Income Eligibility (%FPL) Include PCP Services Medicaid Penetration Income Eligibility (%FPL) Include PCP Services
Total Yearly Enrollment
* Correlation Coefficient = -0.69, significant at the 0.05 level *
9 US DHHS. Executive Summary. Mental Health: Culture, Race, and Ethnicity. A supplement to Mental Health: A Report of the Surgeon General. Rockville, MD: US Department of Health and Human Services, Substance Abuse and Mental Health Services Administration, 2001.
Dougherty Management Associates, Inc. Appendix A – Page 38
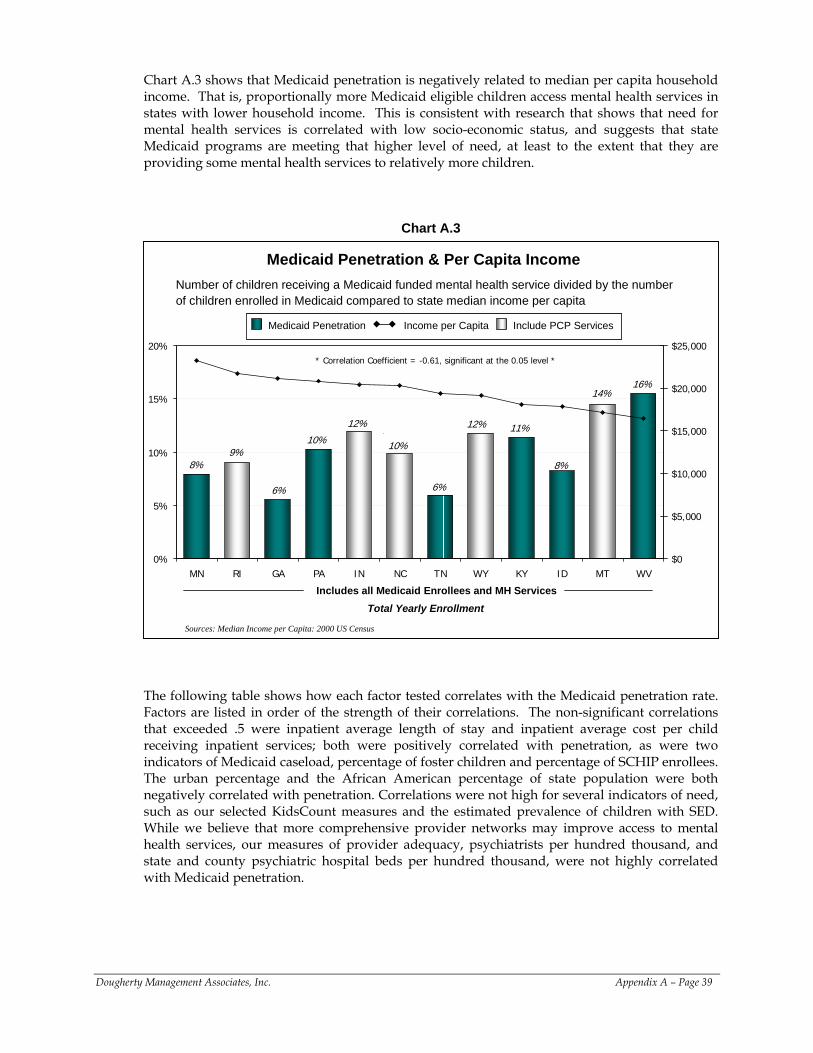
Chart A.3 shows that Medicaid penetration is negatively related to median per capita household income. That is, proportionally more Medicaid eligible children access mental health services in states with lower household income. This is consistent with research that shows that need for mental health services is correlated with low socio-economic status, and suggests that state Medicaid programs are meeting that higher level of need, at least to the extent that they are providing some mental health services to relatively more children.
Chart A.3
10% 10%
8%
6%
11%12%
8%
12%
16%
6%
14%
9%
0%
5%
10%
15%
20%
MN RI GA PA IN NC TN WY KY ID MT WV$0
$5,000
$10,000
$15,000
$20,000
$25,000
Medicaid Penetration & Per Capita Income Number of children receiving a Medicaid funded mental health service divided by the number of children enrolled in Medicaid compared to state median income per capita
Includes all Medicaid Enrollees and MH Services
Medicaid Penetration Income per Capita Include PCP Services Medicaid Penetration Income per Capita Include PCP Services
* Correlation Coefficient = -0.61, significant at the 0.05 level *
Sources: Median Income per Capita: 2000 US Census
Total Yearly Enrollment
The following table shows how each factor tested correlates with the Medicaid penetration rate. Factors are listed in order of the strength of their correlations. The non-significant correlations that exceeded .5 were inpatient average length of stay and inpatient average cost per child receiving inpatient services; both were positively correlated with penetration, as were two indicators of Medicaid caseload, percentage of foster children and percentage of SCHIP enrollees. The urban percentage and the African American percentage of state population were both negatively correlated with penetration. Correlations were not high for several indicators of need, such as our selected KidsCount measures and the estimated prevalence of children with SED. While we believe that more comprehensive provider networks may improve access to mental health services, our measures of provider adequacy, psychiatrists per hundred thousand, and state and county psychiatric hospital beds per hundred thousand, were not highly correlated with Medicaid penetration.
Dougherty Management Associates, Inc. Appendix A – Page 39
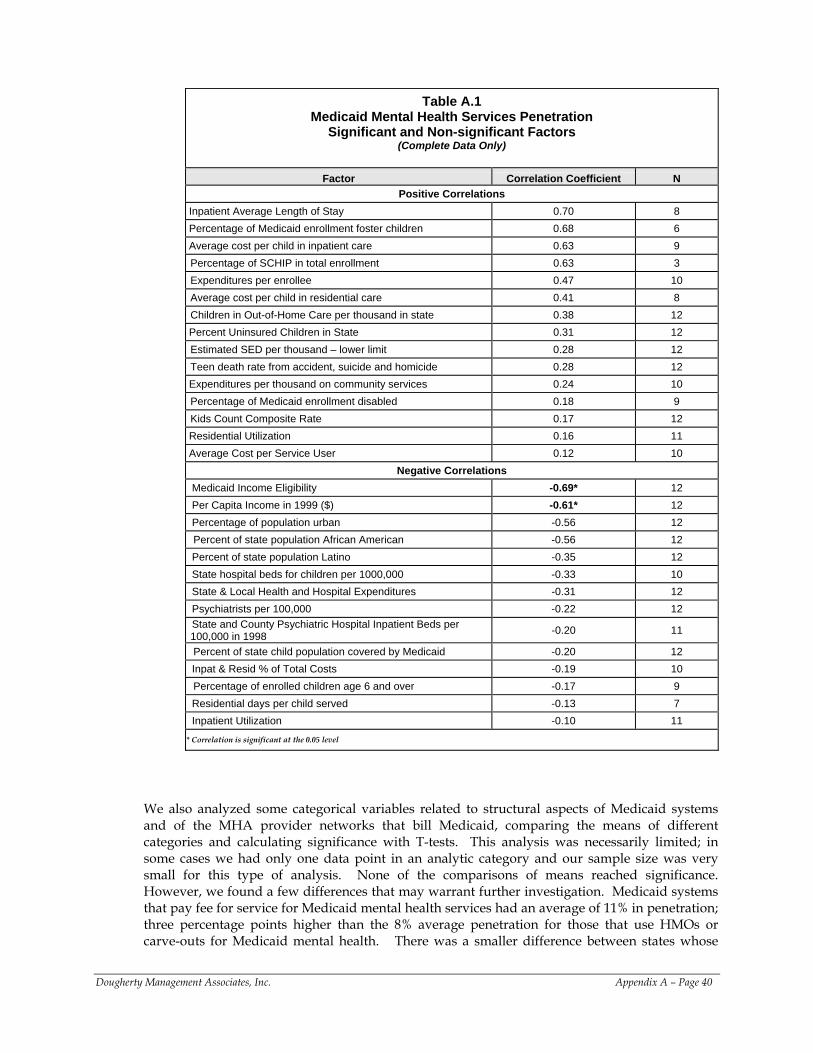
Table A.1
Medicaid Mental Health Services Penetration Significant and Non-significant Factors
(Complete Data Only)
Factor Correlation Coefficient N Positive Correlations
Inpatient Average Length of Stay 0.70 8 Percentage of Medicaid enrollment foster children 0.68 6 Average cost per child in inpatient care 0.63 9 Percentage of SCHIP in total enrollment 0.63 3 Expenditures per enrollee 0.47 10 Average cost per child in residential care 0.41 8 Children in Out-of-Home Care per thousand in state 0.38 12
Percent Uninsured Children in State 0.31 12 Estimated SED per thousand – lower limit 0.28 12 Teen death rate from accident, suicide and homicide 0.28 12
Expenditures per thousand on community services 0.24 10 Percentage of Medicaid enrollment disabled 0.18 9 Kids Count Composite Rate 0.17 12
Residential Utilization 0.16 11 Average Cost per Service User 0.12 10
Negative Correlations Medicaid Income Eligibility -0.69* 12 Per Capita Income in 1999 ($) -0.61* 12 Percentage of population urban -0.56 12 Percent of state population African American -0.56 12
Percent of state population Latino -0.35 12 State hospital beds for children per 1000,000 -0.33 10 State & Local Health and Hospital Expenditures -0.31 12 Psychiatrists per 100,000 -0.22 12 State and County Psychiatric Hospital Inpatient Beds per 100,000 in 1998 -0.20 11
Percent of state child population covered by Medicaid -0.20 12 Inpat & Resid % of Total Costs -0.19 10 Percentage of enrolled children age 6 and over -0.17 9
Residential days per child served -0.13 7 Inpatient Utilization -0.10 11 * Correlation is significant at the 0.05 level
We also analyzed some categorical variables related to structural aspects of Medicaid systems and of the MHA provider networks that bill Medicaid, comparing the means of different categories and calculating significance with T-tests. This analysis was necessarily limited; in some cases we had only one data point in an analytic category and our sample size was very small for this type of analysis. None of the comparisons of means reached significance. However, we found a few differences that may warrant further investigation. Medicaid systems that pay fee for service for Medicaid mental health services had an average of 11% in penetration; three percentage points higher than the 8% average penetration for those that use HMOs or carve-outs for Medicaid mental health. There was a smaller difference between states whose
Dougherty Management Associates, Inc. Appendix A – Page 40
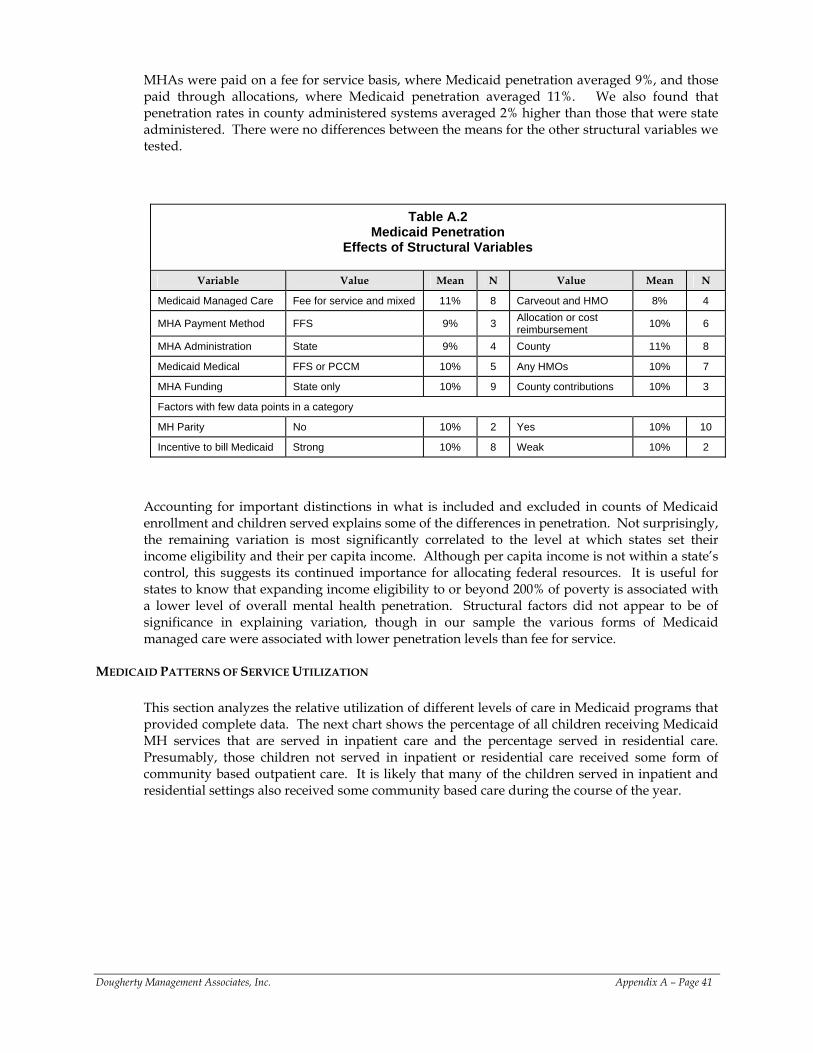
MHAs were paid on a fee for service basis, where Medicaid penetration averaged 9%, and those paid through allocations, where Medicaid penetration averaged 11%. We also found that penetration rates in county administered systems averaged 2% higher than those that were state administered. There were no differences between the means for the other structural variables we tested.
Table A.2 Medicaid Penetration
Effects of Structural Variables
Variable Value Mean N Value Mean N
Medicaid Managed Care Fee for service and mixed 11% 8 Carveout and HMO 8% 4
MHA Payment Method FFS 9% 3 Allocation or cost reimbursement 10% 6
MHA Administration State 9% 4 County 11% 8
Medicaid Medical FFS or PCCM 10% 5 Any HMOs 10% 7
MHA Funding State only 10% 9 County contributions 10% 3
Factors with few data points in a category
MH Parity No 10% 2 Yes 10% 10
Incentive to bill Medicaid Strong 10% 8 Weak 10% 2
Accounting for important distinctions in what is included and excluded in counts of Medicaid enrollment and children served explains some of the differences in penetration. Not surprisingly, the remaining variation is most significantly correlated to the level at which states set their income eligibility and their per capita income. Although per capita income is not within a state’s control, this suggests its continued importance for allocating federal resources. It is useful for states to know that expanding income eligibility to or beyond 200% of poverty is associated with a lower level of overall mental health penetration. Structural factors did not appear to be of significance in explaining variation, though in our sample the various forms of Medicaid managed care were associated with lower penetration levels than fee for service.
MEDICAID PATTERNS OF SERVICE UTILIZATION
This section analyzes the relative utilization of different levels of care in Medicaid programs that provided complete data. The next chart shows the percentage of all children receiving Medicaid MH services that are served in inpatient care and the percentage served in residential care. Presumably, those children not served in inpatient or residential care received some form of community based outpatient care. It is likely that many of the children served in inpatient and residential settings also received some community based care during the course of the year.
Dougherty Management Associates, Inc. Appendix A – Page 41
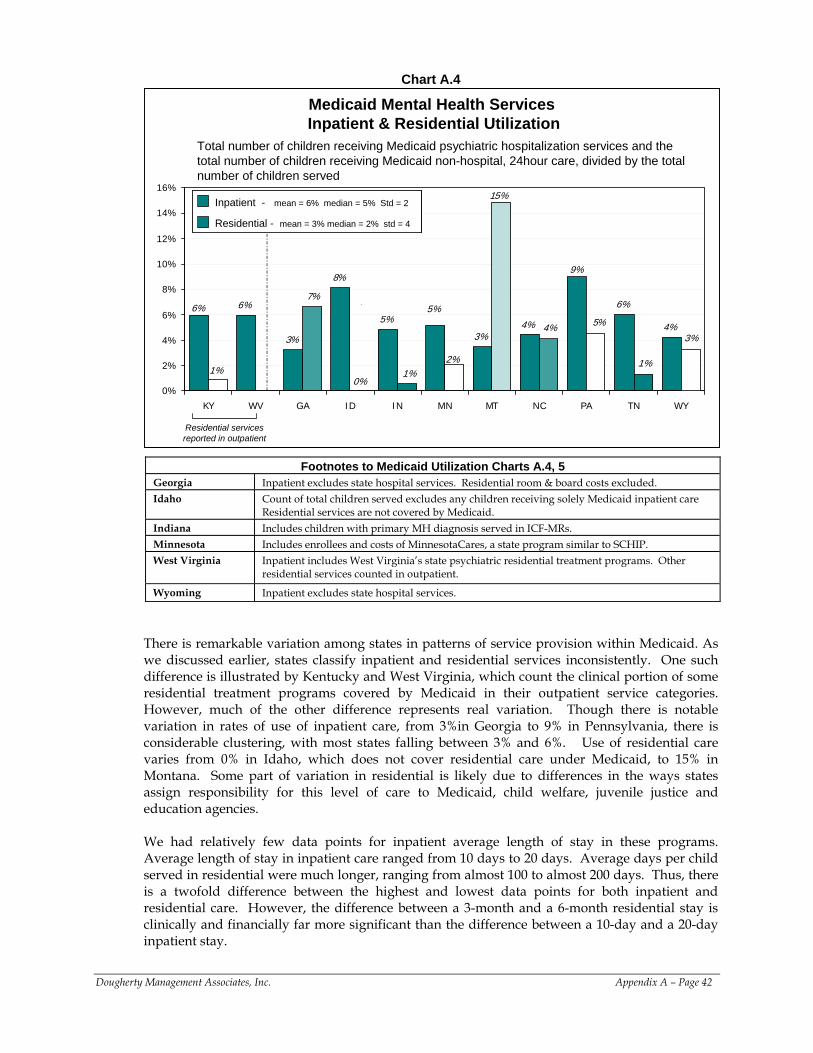
Chart A.4
6%
3%
8%
5% 4%
6%
4%
1%
9%
3%
5%6%
15%
2%
3%
1%
5%4%
1%0%
7%
0%
2%
4%
6%
8%
10%
12%
14%
16%
KY WV GA ID IN MN MT NC PA TN WY
Medicaid Mental Health Services Inpatient & Residential Utilization
Residential - mean = 3% median = 2% std = 4
Inpatient - mean = 6% median = 5% Std = 2
Residential - mean = 3% median = 2% std = 4Residential - mean = 3% median = 2% std = 4
Inpatient - mean = 6% median = 5% Std = 2
Total number of children receiving Medicaid psychiatric hospitalization services and the total number of children receiving Medicaid non-hospital, 24hour care, divided by the total number of children served
Residential services reported in outpatient
Footnotes to Medicaid Utilization Charts A.4, 5 Georgia Inpatient excludes state hospital services. Residential room & board costs excluded. Idaho Count of total children served excludes any children receiving solely Medicaid inpatient care
Residential services are not covered by Medicaid. Indiana Includes children with primary MH diagnosis served in ICF-MRs. Minnesota Includes enrollees and costs of MinnesotaCares, a state program similar to SCHIP. West Virginia Inpatient includes West Virginia’s state psychiatric residential treatment programs. Other
residential services counted in outpatient.
Wyoming Inpatient excludes state hospital services.
There is remarkable variation among states in patterns of service provision within Medicaid. As we discussed earlier, states classify inpatient and residential services inconsistently. One such difference is illustrated by Kentucky and West Virginia, which count the clinical portion of some residential treatment programs covered by Medicaid in their outpatient service categories. However, much of the other difference represents real variation. Though there is notable variation in rates of use of inpatient care, from 3%in Georgia to 9% in Pennsylvania, there is considerable clustering, with most states falling between 3% and 6%. Use of residential care varies from 0% in Idaho, which does not cover residential care under Medicaid, to 15% in Montana. Some part of variation in residential is likely due to differences in the ways states assign responsibility for this level of care to Medicaid, child welfare, juvenile justice and education agencies. We had relatively few data points for inpatient average length of stay in these programs. Average length of stay in inpatient care ranged from 10 days to 20 days. Average days per child served in residential were much longer, ranging from almost 100 to almost 200 days. Thus, there is a twofold difference between the highest and lowest data points for both inpatient and residential care. However, the difference between a 3-month and a 6-month residential stay is clinically and financially far more significant than the difference between a 10-day and a 20-day inpatient stay.
Dougherty Management Associates, Inc. Appendix A – Page 42
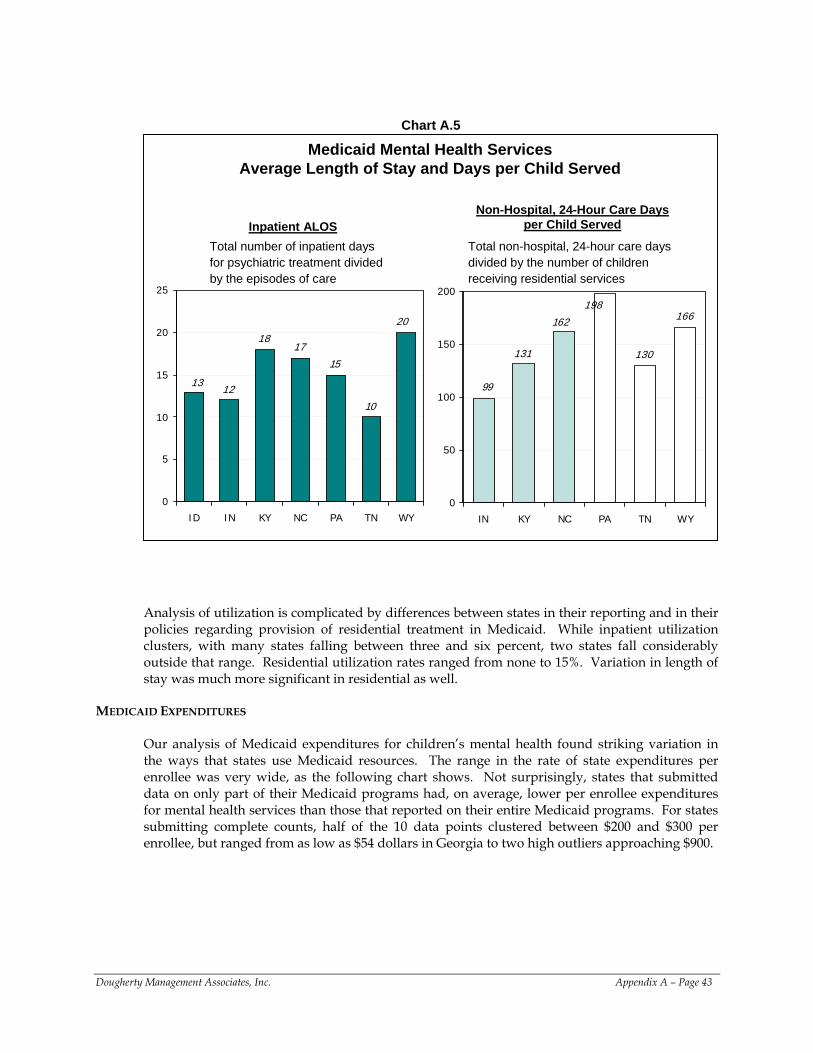
Chart A.5
Medicaid Mental Health Services Average Length of Stay and Days per Child Served
Total number of inpatient days for psychiatric treatment divided by the episodes of care
12
1817
15
10
13
20
0
5
10
15
20
25
ID IN KY NC PA TN WY
131 130
166198
162
99
0
50
100
150
200
IN KY NC PA TN WY
Inpatient ALOSNon-Hospital, 24-Hour Care Days
per Child ServedTotal non-hospital, 24-hour care days divided by the number of children receiving residential services
Analysis of utilization is complicated by differences between states in their reporting and in their policies regarding provision of residential treatment in Medicaid. While inpatient utilization clusters, with many states falling between three and six percent, two states fall considerably outside that range. Residential utilization rates ranged from none to 15%. Variation in length of stay was much more significant in residential as well.
MEDICAID EXPENDITURES
Our analysis of Medicaid expenditures for children’s mental health found striking variation in the ways that states use Medicaid resources. The range in the rate of state expenditures per enrollee was very wide, as the following chart shows. Not surprisingly, states that submitted data on only part of their Medicaid programs had, on average, lower per enrollee expenditures for mental health services than those that reported on their entire Medicaid programs. For states submitting complete counts, half of the 10 data points clustered between $200 and $300 per enrollee, but ranged from as low as $54 dollars in Georgia to two high outliers approaching $900.
Dougherty Management Associates, Inc. Appendix A – Page 43
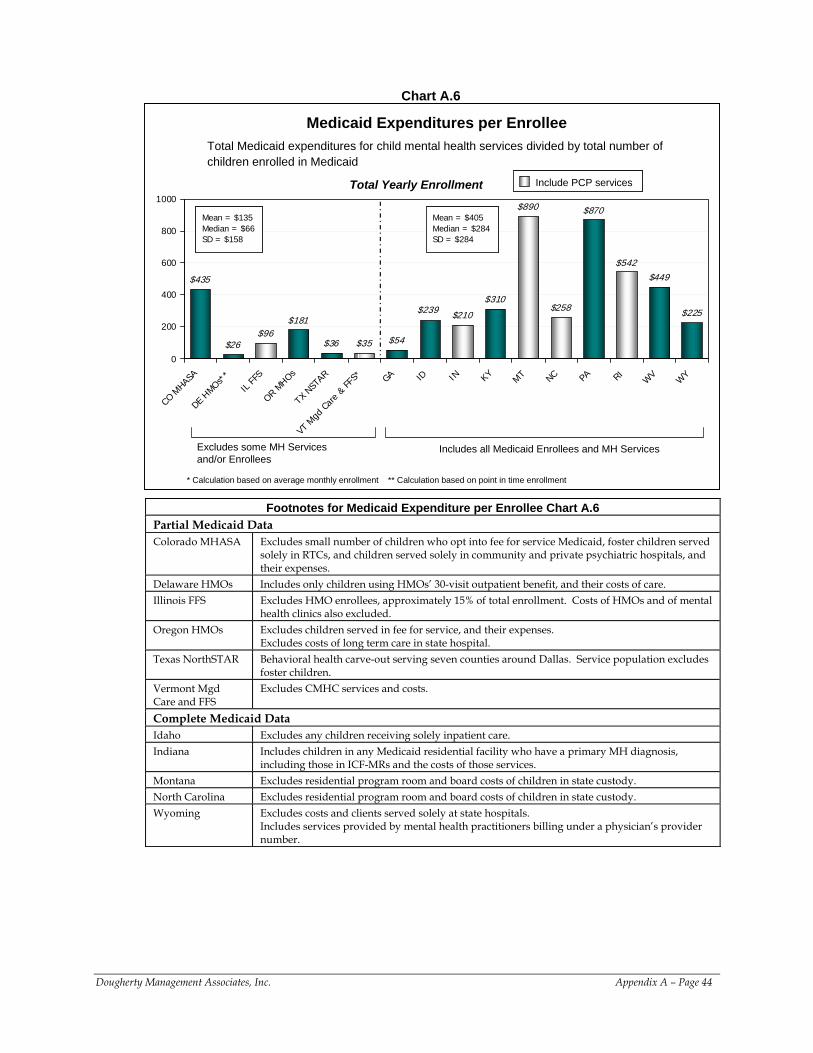
Chart A.6
$435
$26$96
$181
$36 $35 $54
$210
$310
$890
$258
$870
$542$449
$225$239
0
200
400
600
800
1000
CO M
HASA
DE HMOs*
*
IL FF
S
OR MHOs
TX N
STAR
VT M
gd C
are
& FF
S* GA ID IN KY MT NC PA RIW
VW
Y
Total Medicaid expenditures for child mental health services divided by total number of children enrolled in Medicaid
Medicaid Expenditures per Enrollee
Include PCP servicesInclude PCP services
Excludes some MH Services and/or Enrollees
Includes all Medicaid Enrollees and MH Services
Mean = $135Median = $66SD = $158
Mean = $135Median = $66SD = $158
Mean = $405Median = $284SD = $284
Mean = $405Median = $284SD = $284
Total Yearly Enrollment
* Calculation based on average monthly enrollment ** Calculation based on point in time enrollment
Footnotes for Medicaid Expenditure per Enrollee Chart A.6 Partial Medicaid Data Colorado MHASA Excludes small number of children who opt into fee for service Medicaid, foster children served
solely in RTCs, and children served solely in community and private psychiatric hospitals, and their expenses.
Delaware HMOs Includes only children using HMOs’ 30-visit outpatient benefit, and their costs of care. Illinois FFS Excludes HMO enrollees, approximately 15% of total enrollment. Costs of HMOs and of mental
health clinics also excluded. Oregon HMOs Excludes children served in fee for service, and their expenses.
Excludes costs of long term care in state hospital. Texas NorthSTAR Behavioral health carve-out serving seven counties around Dallas. Service population excludes
foster children. Vermont Mgd Care and FFS
Excludes CMHC services and costs.
Complete Medicaid Data Idaho Excludes any children receiving solely inpatient care. Indiana Includes children in any Medicaid residential facility who have a primary MH diagnosis,
including those in ICF-MRs and the costs of those services. Montana Excludes residential program room and board costs of children in state custody. North Carolina Excludes residential program room and board costs of children in state custody. Wyoming Excludes costs and clients served solely at state hospitals.
Includes services provided by mental health practitioners billing under a physician’s provider number.
Dougherty Management Associates, Inc. Appendix A – Page 44
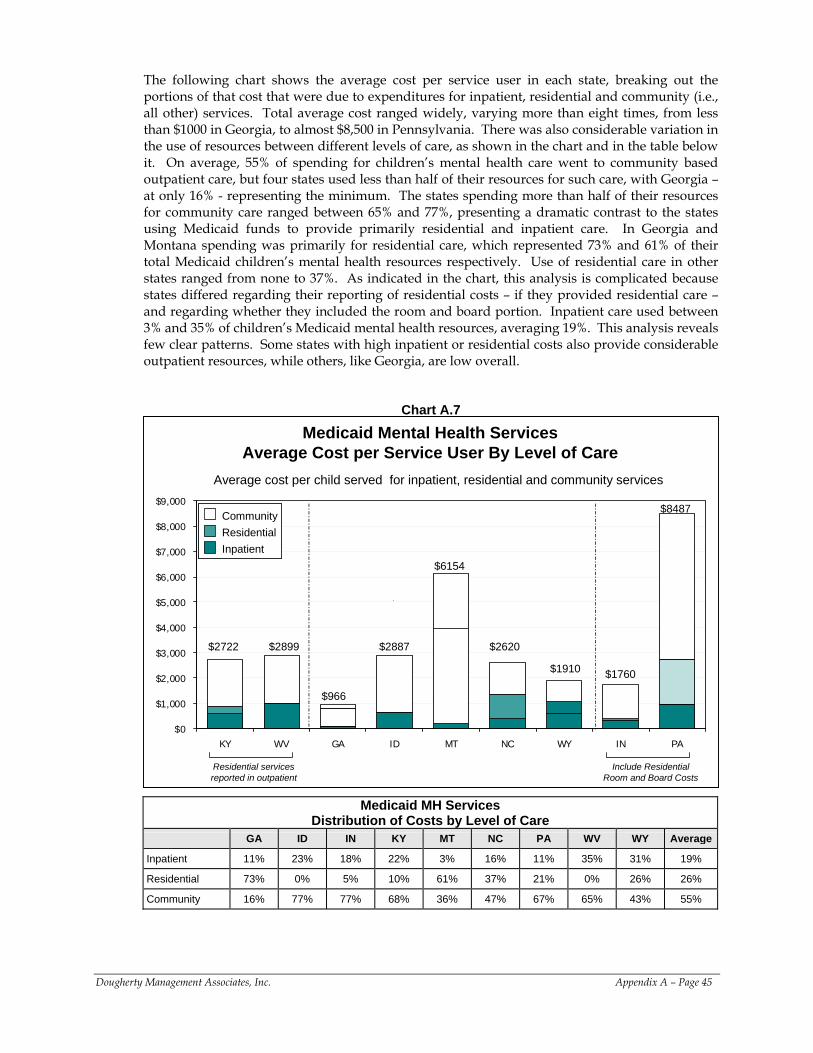
The following chart shows the average cost per service user in each state, breaking out the portions of that cost that were due to expenditures for inpatient, residential and community (i.e., all other) services. Total average cost ranged widely, varying more than eight times, from less than $1000 in Georgia, to almost $8,500 in Pennsylvania. There was also considerable variation in the use of resources between different levels of care, as shown in the chart and in the table below it. On average, 55% of spending for children’s mental health care went to community based outpatient care, but four states used less than half of their resources for such care, with Georgia – at only 16% - representing the minimum. The states spending more than half of their resources for community care ranged between 65% and 77%, presenting a dramatic contrast to the states using Medicaid funds to provide primarily residential and inpatient care. In Georgia and Montana spending was primarily for residential care, which represented 73% and 61% of their total Medicaid children’s mental health resources respectively. Use of residential care in other states ranged from none to 37%. As indicated in the chart, this analysis is complicated because states differed regarding their reporting of residential costs – if they provided residential care – and regarding whether they included the room and board portion. Inpatient care used between 3% and 35% of children’s Medicaid mental health resources, averaging 19%. This analysis reveals few clear patterns. Some states with high inpatient or residential costs also provide considerable outpatient resources, while others, like Georgia, are low overall.
Chart A.7
Medicaid Mental Health Services Average Cost per Service User By Level of Care
$0
$1,000
$2,000
$3,000
$4,000
$5,000
$6,000
$7,000
$8,000
$9,000
KY WV GA ID MT NC WY IN PA
CommunityResidentialInpatient
CommunityResidentialInpatient
$966
$2887
$1760
$2722
$6154
$8487
$2620$2899
$1910
Average cost per child served for inpatient, residential and community services
Residential services reported in outpatient
Include Residential Room and Board Costs
Medicaid MH Services Distribution of Costs by Level of Care
GA ID IN KY MT NC PA WV WY Average
Inpatient 11% 23% 18% 22% 3% 16% 11% 35% 31% 19%
Residential 73% 0% 5% 10% 61% 37% 21% 0% 26% 26%
Community 16% 77% 77% 68% 36% 47% 67% 65% 43% 55%
Dougherty Management Associates, Inc. Appendix A – Page 45
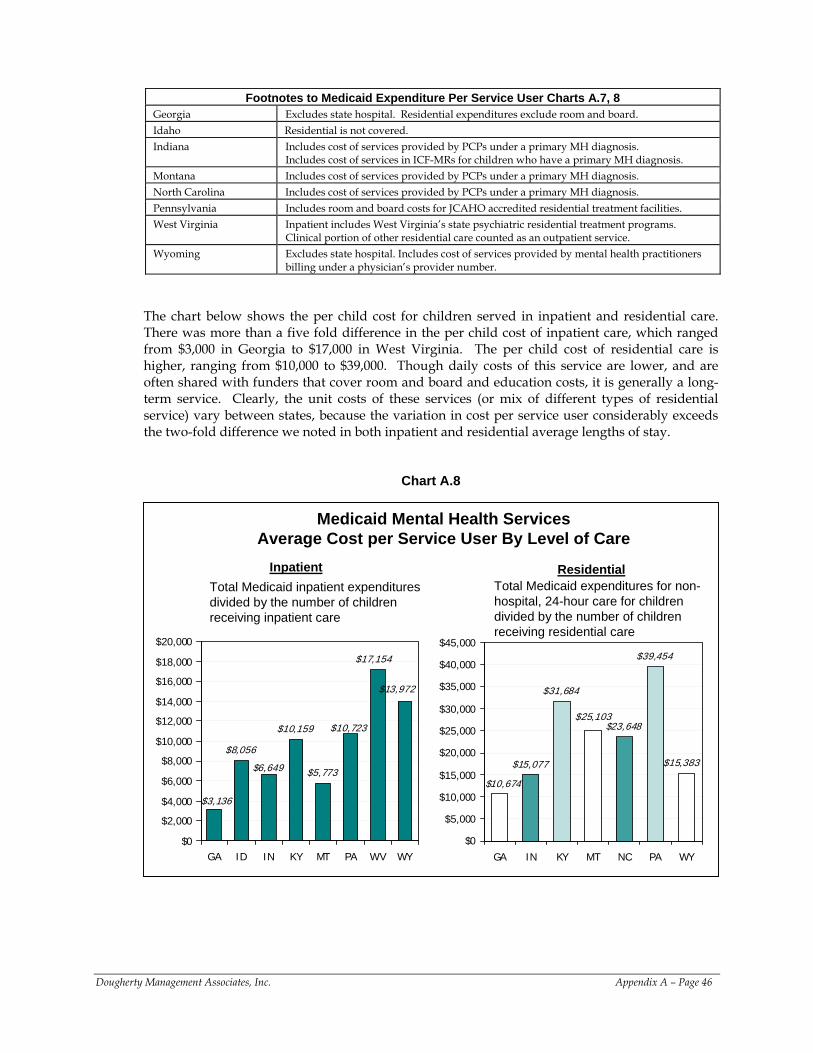
Footnotes to Medicaid Expenditure Per Service User Charts A.7, 8
Georgia Excludes state hospital. Residential expenditures exclude room and board. Idaho Residential is not covered. Indiana Includes cost of services provided by PCPs under a primary MH diagnosis.
Includes cost of services in ICF-MRs for children who have a primary MH diagnosis. Montana Includes cost of services provided by PCPs under a primary MH diagnosis. North Carolina Includes cost of services provided by PCPs under a primary MH diagnosis. Pennsylvania Includes room and board costs for JCAHO accredited residential treatment facilities. West Virginia Inpatient includes West Virginia’s state psychiatric residential treatment programs.
Clinical portion of other residential care counted as an outpatient service. Wyoming Excludes state hospital. Includes cost of services provided by mental health practitioners
billing under a physician’s provider number.
The chart below shows the per child cost for children served in inpatient and residential care. There was more than a five fold difference in the per child cost of inpatient care, which ranged from $3,000 in Georgia to $17,000 in West Virginia. The per child cost of residential care is higher, ranging from $10,000 to $39,000. Though daily costs of this service are lower, and are often shared with funders that cover room and board and education costs, it is generally a long-term service. Clearly, the unit costs of these services (or mix of different types of residential service) vary between states, because the variation in cost per service user considerably exceeds the two-fold difference we noted in both inpatient and residential average lengths of stay.
Chart A.8
Medicaid Mental Health Services Average Cost per Service User By Level of Care
$8,056
$10,159
$5,773$6,649
$10,723
$13,972
$3,136
$17,154
$0
$2,000
$4,000
$6,000
$8,000
$10,000
$12,000
$14,000
$16,000
$18,000
$20,000
GA ID IN KY MT PA WV WY
$15,077
$31,684
$23,648
$39,454
$15,383
$25,103
$10,674
$0
$5,000
$10,000
$15,000
$20,000
$25,000
$30,000
$35,000
$40,000
$45,000
GA IN KY MT NC PA WY
Inpatient ResidentialTotal Medicaid inpatient expenditures divided by the number of children receiving inpatient care
Total Medicaid expenditures for non-hospital, 24-hour care for children divided by the number of children receiving residential care
Dougherty Management Associates, Inc. Appendix A – Page 46
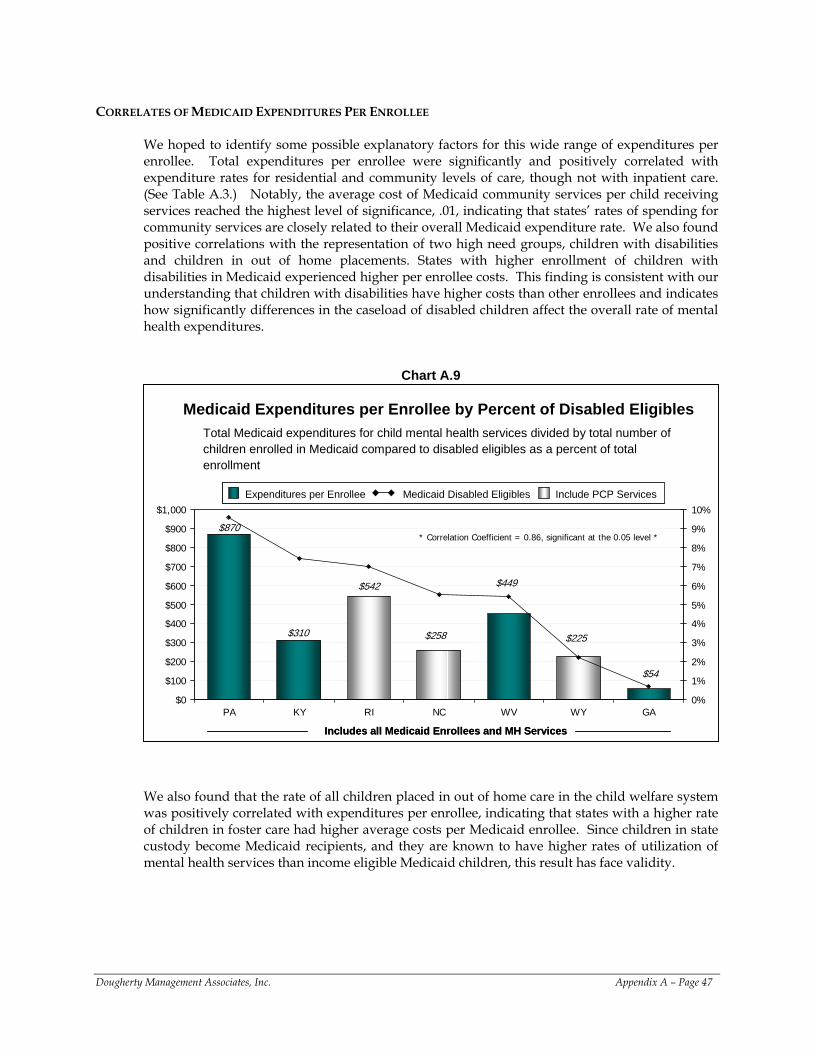
CORRELATES OF MEDICAID EXPENDITURES PER ENROLLEE
We hoped to identify some possible explanatory factors for this wide range of expenditures per enrollee. Total expenditures per enrollee were significantly and positively correlated with expenditure rates for residential and community levels of care, though not with inpatient care. (See Table A.3.) Notably, the average cost of Medicaid community services per child receiving services reached the highest level of significance, .01, indicating that states’ rates of spending for community services are closely related to their overall Medicaid expenditure rate. We also found positive correlations with the representation of two high need groups, children with disabilities and children in out of home placements. States with higher enrollment of children with disabilities in Medicaid experienced higher per enrollee costs. This finding is consistent with our understanding that children with disabilities have higher costs than other enrollees and indicates how significantly differences in the caseload of disabled children affect the overall rate of mental health expenditures.
Chart A.9
Medicaid Expenditures per Enrollee by Percent of Disabled EligiblesTotal Medicaid expenditures for child mental health services divided by total number of children enrolled in Medicaid compared to disabled eligibles as a percent of total enrollment
$310
$542 $449
$870
$54
$225$258
$0
$100
$200
$300
$400
$500
$600
$700
$800
$900
$1,000
PA KY RI NC WV WY GA0%
1%
2%
3%
4%
5%
6%
7%
8%
9%
10%
Expenditures per Enrollee Medicaid Disabled Eligibles Include PCP ServicesExpenditures per Enrollee Medicaid Disabled Eligibles Include PCP Services
Includes all Medicaid Enrollees and MH ServicesIncludes all Medicaid Enrollees and MH Services
* Correlation Coefficient = 0.86, significant at the 0.05 level *
We also found that the rate of all children placed in out of home care in the child welfare system was positively correlated with expenditures per enrollee, indicating that states with a higher rate of children in foster care had higher average costs per Medicaid enrollee. Since children in state custody become Medicaid recipients, and they are known to have higher rates of utilization of mental health services than income eligible Medicaid children, this result has face validity.
Dougherty Management Associates, Inc. Appendix A – Page 47
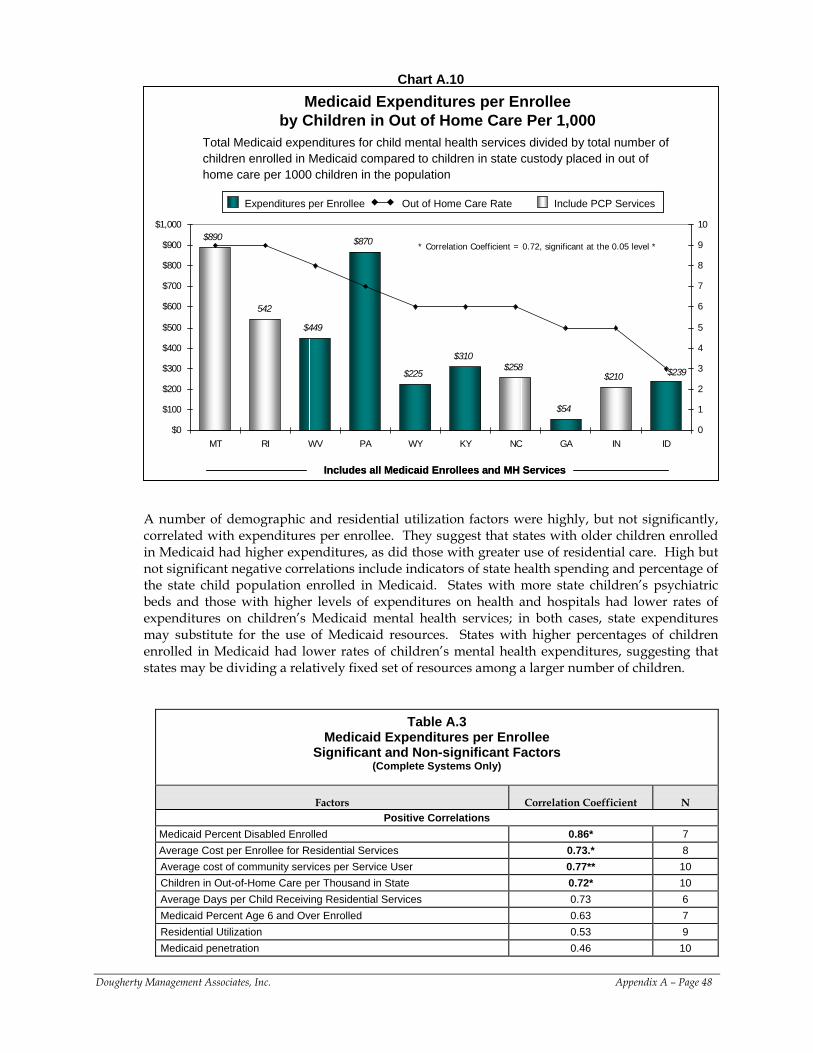
Chart A.10
Medicaid Expenditures per Enrollee by Children in Out of Home Care Per 1,000
Total Medicaid expenditures for child mental health services divided by total number of children enrolled in Medicaid compared to children in state custody placed in out of home care per 1000 children in the population
$890
542
$449
$870
$225
$310$258
$54
$210 $239
$0
$100
$200
$300
$400
$500
$600
$700
$800
$900
$1,000
MT RI WV PA WY KY NC GA IN ID0
1
2
3
4
5
6
7
8
9
10
Expenditures per Enrollee Out of Home Care Rate Include PCP ServicesExpenditures per Enrollee Out of Home Care Rate Include PCP Services
Includes all Medicaid Enrollees and MH ServicesIncludes all Medicaid Enrollees and MH Services
* Correlation Coefficient = 0.72, significant at the 0.05 level *
A number of demographic and residential utilization factors were highly, but not significantly, correlated with expenditures per enrollee. They suggest that states with older children enrolled in Medicaid had higher expenditures, as did those with greater use of residential care. High but not significant negative correlations include indicators of state health spending and percentage of the state child population enrolled in Medicaid. States with more state children’s psychiatric beds and those with higher levels of expenditures on health and hospitals had lower rates of expenditures on children’s Medicaid mental health services; in both cases, state expenditures may substitute for the use of Medicaid resources. States with higher percentages of children enrolled in Medicaid had lower rates of children’s mental health expenditures, suggesting that states may be dividing a relatively fixed set of resources among a larger number of children.
Table A.3 Medicaid Expenditures per Enrollee
Significant and Non-significant Factors (Complete Systems Only)
Factors Correlation Coefficient N Positive Correlations
Medicaid Percent Disabled Enrolled 0.86* 7 Average Cost per Enrollee for Residential Services 0.73.* 8 Average cost of community services per Service User 0.77** 10 Children in Out-of-Home Care per Thousand in State 0.72* 10 Average Days per Child Receiving Residential Services 0.73 6 Medicaid Percent Age 6 and Over Enrolled 0.63 7 Residential Utilization 0.53 9 Medicaid penetration 0.46 10
Dougherty Management Associates, Inc. Appendix A – Page 48
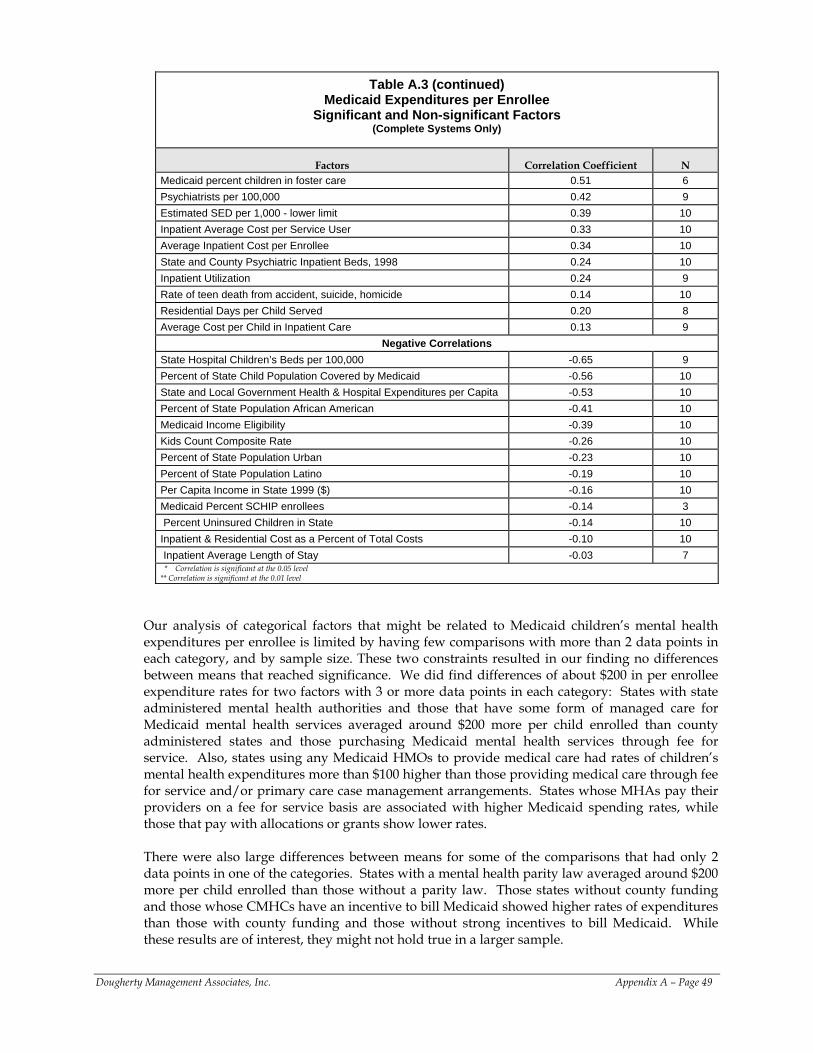
Table A.3 (continued) Medicaid Expenditures per Enrollee
Significant and Non-significant Factors (Complete Systems Only)
Factors Correlation Coefficient N Medicaid percent children in foster care 0.51 6 Psychiatrists per 100,000 0.42 9 Estimated SED per 1,000 - lower limit 0.39 10 Inpatient Average Cost per Service User 0.33 10 Average Inpatient Cost per Enrollee 0.34 10 State and County Psychiatric Inpatient Beds, 1998 0.24 10 Inpatient Utilization 0.24 9 Rate of teen death from accident, suicide, homicide 0.14 10 Residential Days per Child Served 0.20 8 Average Cost per Child in Inpatient Care 0.13 9
Negative Correlations State Hospital Children’s Beds per 100,000 -0.65 9 Percent of State Child Population Covered by Medicaid -0.56 10 State and Local Government Health & Hospital Expenditures per Capita -0.53 10 Percent of State Population African American -0.41 10 Medicaid Income Eligibility -0.39 10 Kids Count Composite Rate -0.26 10 Percent of State Population Urban -0.23 10 Percent of State Population Latino -0.19 10 Per Capita Income in State 1999 ($) -0.16 10 Medicaid Percent SCHIP enrollees -0.14 3 Percent Uninsured Children in State -0.14 10 Inpatient & Residential Cost as a Percent of Total Costs -0.10 10 Inpatient Average Length of Stay -0.03 7 * Correlation is significant at the 0.05 level
** Correlation is significant at the 0.01 level Our analysis of categorical factors that might be related to Medicaid children’s mental health expenditures per enrollee is limited by having few comparisons with more than 2 data points in each category, and by sample size. These two constraints resulted in our finding no differences between means that reached significance. We did find differences of about $200 in per enrollee expenditure rates for two factors with 3 or more data points in each category: States with state administered mental health authorities and those that have some form of managed care for Medicaid mental health services averaged around $200 more per child enrolled than county administered states and those purchasing Medicaid mental health services through fee for service. Also, states using any Medicaid HMOs to provide medical care had rates of children’s mental health expenditures more than $100 higher than those providing medical care through fee for service and/or primary care case management arrangements. States whose MHAs pay their providers on a fee for service basis are associated with higher Medicaid spending rates, while those that pay with allocations or grants show lower rates. There were also large differences between means for some of the comparisons that had only 2 data points in one of the categories. States with a mental health parity law averaged around $200 more per child enrolled than those without a parity law. Those states without county funding and those whose CMHCs have an incentive to bill Medicaid showed higher rates of expenditures than those with county funding and those without strong incentives to bill Medicaid. While these results are of interest, they might not hold true in a larger sample.
Dougherty Management Associates, Inc. Appendix A – Page 49
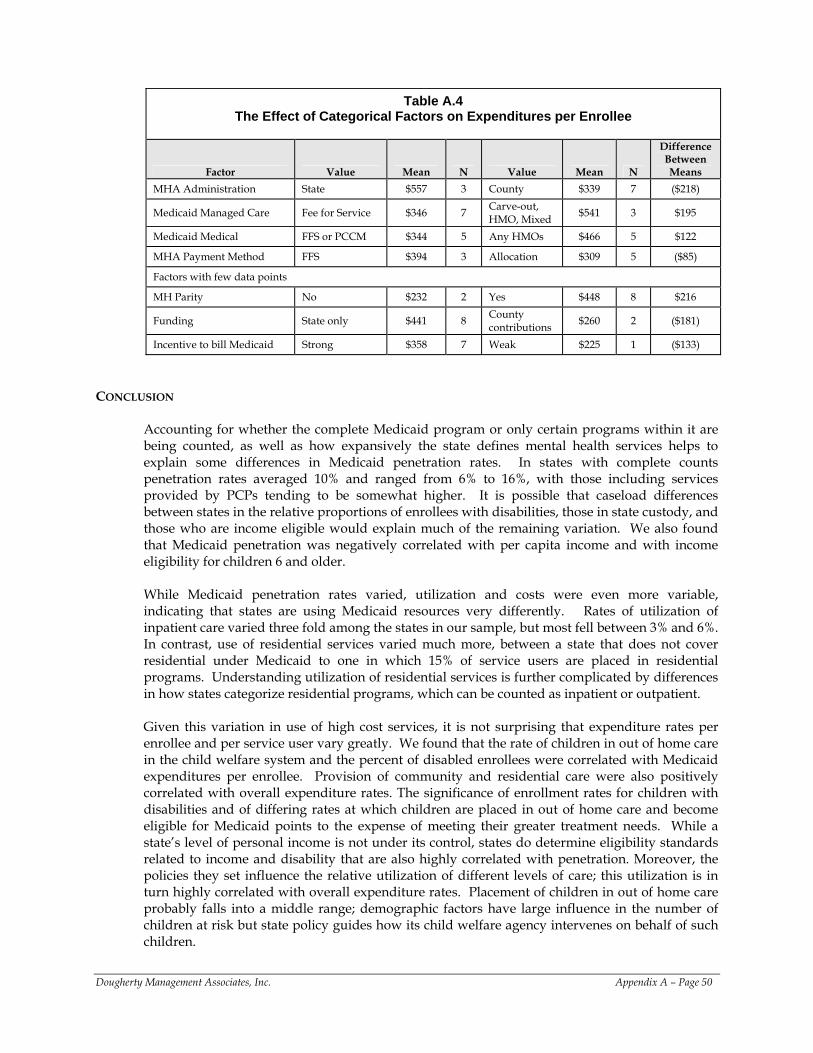
Table A.4
The Effect of Categorical Factors on Expenditures per Enrollee
Factor Value Mean N Value Mean N
Difference Between Means
MHA Administration State $557 3 County $339 7 ($218)
Medicaid Managed Care Fee for Service $346 7 Carve-out, HMO, Mixed $541 3 $195
Medicaid Medical FFS or PCCM $344 5 Any HMOs $466 5 $122
MHA Payment Method FFS $394 3 Allocation $309 5 ($85)
Factors with few data points
MH Parity No $232 2 Yes $448 8 $216
Funding State only $441 8 County contributions $260 2 ($181)
Incentive to bill Medicaid Strong $358 7 Weak $225 1 ($133)
CONCLUSION
Accounting for whether the complete Medicaid program or only certain programs within it are being counted, as well as how expansively the state defines mental health services helps to explain some differences in Medicaid penetration rates. In states with complete counts penetration rates averaged 10% and ranged from 6% to 16%, with those including services provided by PCPs tending to be somewhat higher. It is possible that caseload differences between states in the relative proportions of enrollees with disabilities, those in state custody, and those who are income eligible would explain much of the remaining variation. We also found that Medicaid penetration was negatively correlated with per capita income and with income eligibility for children 6 and older. While Medicaid penetration rates varied, utilization and costs were even more variable, indicating that states are using Medicaid resources very differently. Rates of utilization of inpatient care varied three fold among the states in our sample, but most fell between 3% and 6%. In contrast, use of residential services varied much more, between a state that does not cover residential under Medicaid to one in which 15% of service users are placed in residential programs. Understanding utilization of residential services is further complicated by differences in how states categorize residential programs, which can be counted as inpatient or outpatient.
Given this variation in use of high cost services, it is not surprising that expenditure rates per enrollee and per service user vary greatly. We found that the rate of children in out of home care in the child welfare system and the percent of disabled enrollees were correlated with Medicaid expenditures per enrollee. Provision of community and residential care were also positively correlated with overall expenditure rates. The significance of enrollment rates for children with disabilities and of differing rates at which children are placed in out of home care and become eligible for Medicaid points to the expense of meeting their greater treatment needs. While a state’s level of personal income is not under its control, states do determine eligibility standards related to income and disability that are also highly correlated with penetration. Moreover, the policies they set influence the relative utilization of different levels of care; this utilization is in turn highly correlated with overall expenditure rates. Placement of children in out of home care probably falls into a middle range; demographic factors have large influence in the number of children at risk but state policy guides how its child welfare agency intervenes on behalf of such children.
Dougherty Management Associates, Inc. Appendix A – Page 50
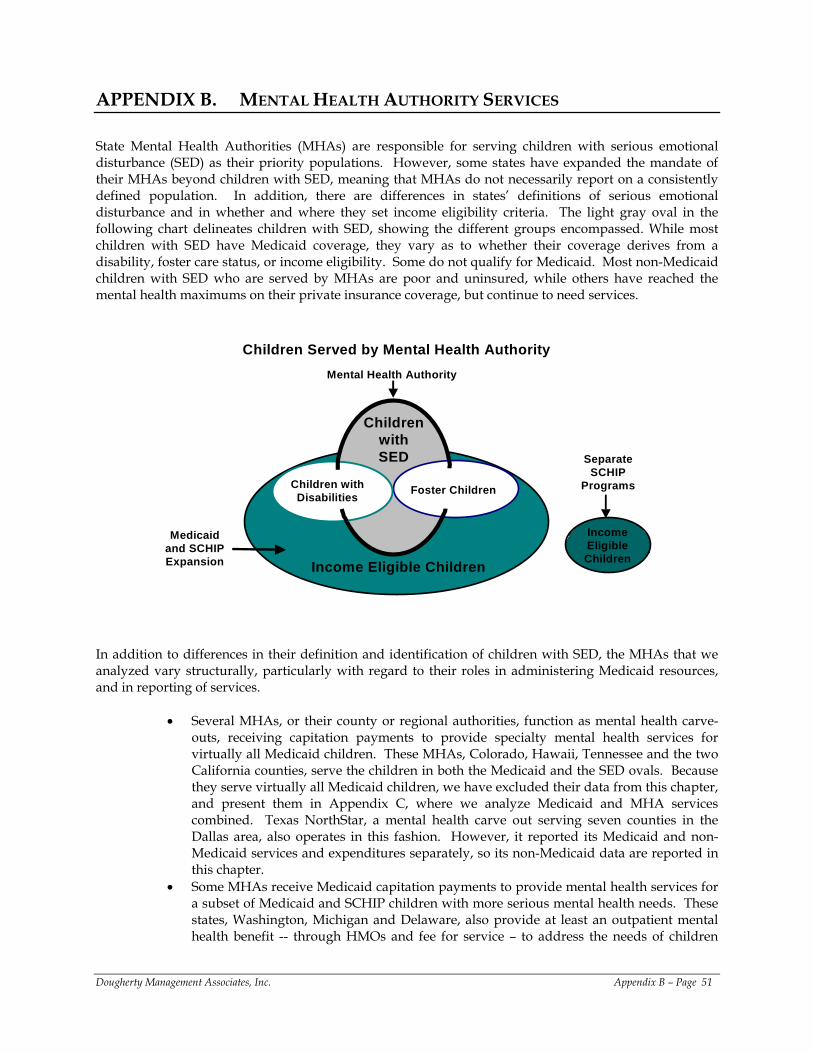
APPENDIX B. MENTAL HEALTH AUTHORITY SERVICES
State Mental Health Authorities (MHAs) are responsible for serving children with serious emotional disturbance (SED) as their priority populations. However, some states have expanded the mandate of their MHAs beyond children with SED, meaning that MHAs do not necessarily report on a consistently defined population. In addition, there are differences in states’ definitions of serious emotional disturbance and in whether and where they set income eligibility criteria. The light gray oval in the following chart delineates children with SED, showing the different groups encompassed. While most children with SED have Medicaid coverage, they vary as to whether their coverage derives from a disability, foster care status, or income eligibility. Some do not qualify for Medicaid. Most non-Medicaid children with SED who are served by MHAs are poor and uninsured, while others have reached the mental health maximums on their private insurance coverage, but continue to need services.
Children Served by Mental Health Authority
Medicaid and SCHIP Expansion
Income Eligible Children
Separate SCHIP
Programs
Mental Health Authority
Children with Disabilities Foster Children
Income Eligible Children
Children with SED
In addition to differences in their definition and identification of children with SED, the MHAs that we analyzed vary structurally, particularly with regard to their roles in administering Medicaid resources, and in reporting of services.
• Several MHAs, or their county or regional authorities, function as mental health carve-
outs, receiving capitation payments to provide specialty mental health services for virtually all Medicaid children. These MHAs, Colorado, Hawaii, Tennessee and the two California counties, serve the children in both the Medicaid and the SED ovals. Because they serve virtually all Medicaid children, we have excluded their data from this chapter, and present them in Appendix C, where we analyze Medicaid and MHA services combined. Texas NorthStar, a mental health carve out serving seven counties in the Dallas area, also operates in this fashion. However, it reported its Medicaid and non-Medicaid services and expenditures separately, so its non-Medicaid data are reported in this chapter.
• Some MHAs receive Medicaid capitation payments to provide mental health services for a subset of Medicaid and SCHIP children with more serious mental health needs. These states, Washington, Michigan and Delaware, also provide at least an outpatient mental health benefit -- through HMOs and fee for service – to address the needs of children
Dougherty Management Associates, Inc. Appendix B – Page 51
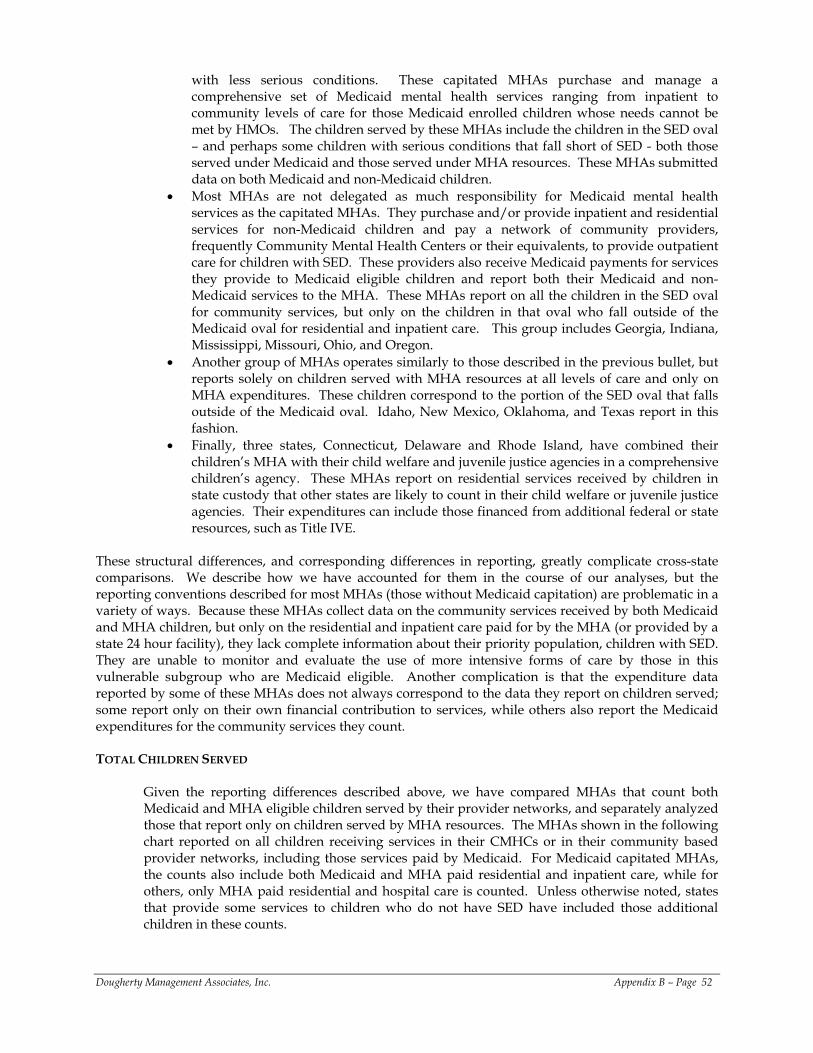
with less serious conditions. These capitated MHAs purchase and manage a comprehensive set of Medicaid mental health services ranging from inpatient to community levels of care for those Medicaid enrolled children whose needs cannot be met by HMOs. The children served by these MHAs include the children in the SED oval – and perhaps some children with serious conditions that fall short of SED - both those served under Medicaid and those served under MHA resources. These MHAs submitted data on both Medicaid and non-Medicaid children.
• Most MHAs are not delegated as much responsibility for Medicaid mental health services as the capitated MHAs. They purchase and/or provide inpatient and residential services for non-Medicaid children and pay a network of community providers, frequently Community Mental Health Centers or their equivalents, to provide outpatient care for children with SED. These providers also receive Medicaid payments for services they provide to Medicaid eligible children and report both their Medicaid and non-Medicaid services to the MHA. These MHAs report on all the children in the SED oval for community services, but only on the children in that oval who fall outside of the Medicaid oval for residential and inpatient care. This group includes Georgia, Indiana, Mississippi, Missouri, Ohio, and Oregon.
• Another group of MHAs operates similarly to those described in the previous bullet, but reports solely on children served with MHA resources at all levels of care and only on MHA expenditures. These children correspond to the portion of the SED oval that falls outside of the Medicaid oval. Idaho, New Mexico, Oklahoma, and Texas report in this fashion.
• Finally, three states, Connecticut, Delaware and Rhode Island, have combined their children’s MHA with their child welfare and juvenile justice agencies in a comprehensive children’s agency. These MHAs report on residential services received by children in state custody that other states are likely to count in their child welfare or juvenile justice agencies. Their expenditures can include those financed from additional federal or state resources, such as Title IVE.
These structural differences, and corresponding differences in reporting, greatly complicate cross-state comparisons. We describe how we have accounted for them in the course of our analyses, but the reporting conventions described for most MHAs (those without Medicaid capitation) are problematic in a variety of ways. Because these MHAs collect data on the community services received by both Medicaid and MHA children, but only on the residential and inpatient care paid for by the MHA (or provided by a state 24 hour facility), they lack complete information about their priority population, children with SED. They are unable to monitor and evaluate the use of more intensive forms of care by those in this vulnerable subgroup who are Medicaid eligible. Another complication is that the expenditure data reported by some of these MHAs does not always correspond to the data they report on children served; some report only on their own financial contribution to services, while others also report the Medicaid expenditures for the community services they count.
TOTAL CHILDREN SERVED
Given the reporting differences described above, we have compared MHAs that count both Medicaid and MHA eligible children served by their provider networks, and separately analyzed those that report only on children served by MHA resources. The MHAs shown in the following chart reported on all children receiving services in their CMHCs or in their community based provider networks, including those services paid by Medicaid. For Medicaid capitated MHAs, the counts also include both Medicaid and MHA paid residential and inpatient care, while for others, only MHA paid residential and hospital care is counted. Unless otherwise noted, states that provide some services to children who do not have SED have included those additional children in these counts.
Dougherty Management Associates, Inc. Appendix B – Page 52
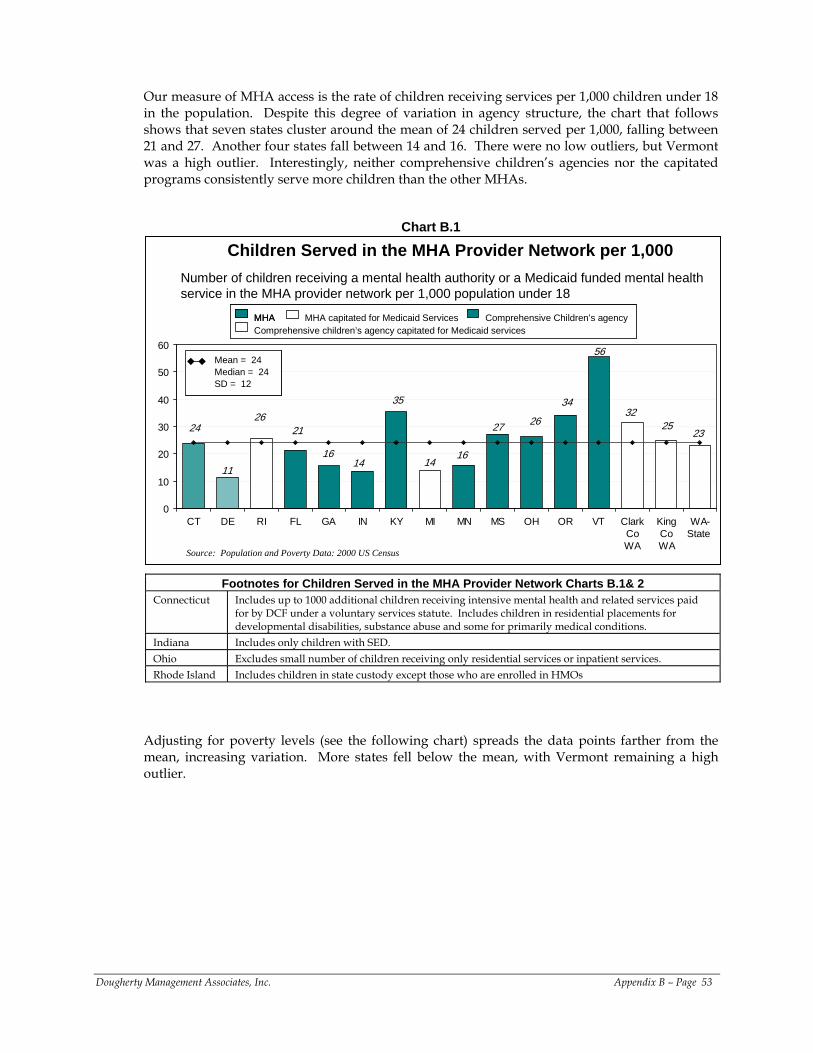
Our measure of MHA access is the rate of children receiving services per 1,000 children under 18 in the population. Despite this degree of variation in agency structure, the chart that follows shows that seven states cluster around the mean of 24 children served per 1,000, falling between 21 and 27. Another four states fall between 14 and 16. There were no low outliers, but Vermont was a high outlier. Interestingly, neither comprehensive children’s agencies nor the capitated programs consistently serve more children than the other MHAs.
Chart B.1
Number of children receiving a mental health authority or a Medicaid funded mental health service in the MHA provider network per 1,000 population under 18
Children Served in the MHA Provider Network per 1,000
Source: Population and Poverty Data: 2000 US Census
11
262625
34
16
24
1416
3235
27
56
23
14
21
0
10
20
30
40
50
60
CT DE RI FL GA IN KY MI MN MS OH OR VT ClarkCoWA
KingCoWA
WA-State
Mean = 24Median = 24 SD = 12
Mean = 24Median = 24 SD = 12
MHA capitated for Medicaid Services Comprehensive Children’s agencyMHAComprehensive children’s agency capitated for Medicaid services
MHA capitated for Medicaid Services Comprehensive Children’s agencyMHAMHAComprehensive children’s agency capitated for Medicaid services
Footnotes for Children Served in the MHA Provider Network Charts B.1& 2 Connecticut Includes up to 1000 additional children receiving intensive mental health and related services paid
for by DCF under a voluntary services statute. Includes children in residential placements for developmental disabilities, substance abuse and some for primarily medical conditions.
Indiana Includes only children with SED. Ohio Excludes small number of children receiving only residential services or inpatient services. Rhode Island Includes children in state custody except those who are enrolled in HMOs
Adjusting for poverty levels (see the following chart) spreads the data points farther from the mean, increasing variation. More states fell below the mean, with Vermont remaining a high outlier.
Dougherty Management Associates, Inc. Appendix B – Page 53
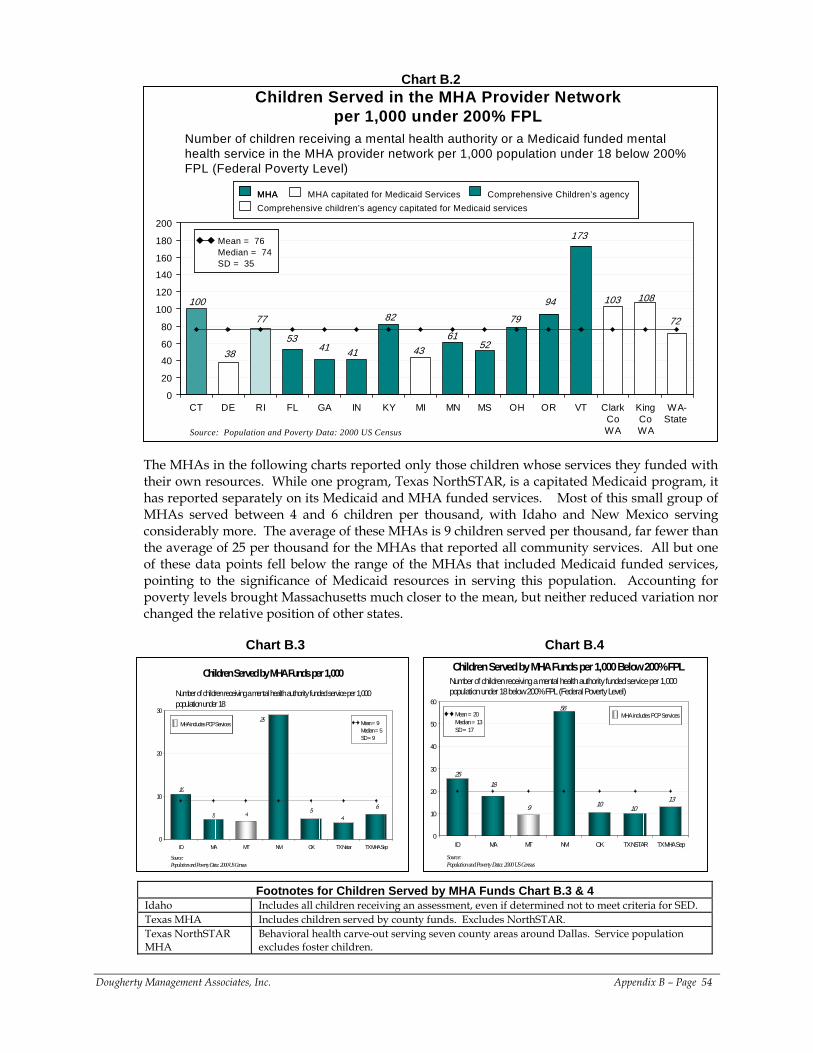
Chart B.2
Number of children receiving a mental health authority or a Medicaid funded mental health service in the MHA provider network per 1,000 population under 18 below 200% FPL (Federal Poverty Level)
Source: Population and Poverty Data: 2000 US Census
Children Served in the MHA Provider Network per 1,000 under 200% FPL
38
7977
10894
41
100
4361
103
82
52
173
72
4153
0
20
40
60
80
100
120
140
160
180
200
CT DE RI FL GA IN KY MI MN MS OH OR VT ClarkCoWA
KingCoWA
WA-State
Mean = 76Median = 74SD = 35
Mean = 76Median = 74SD = 35
MHA capitated for Medicaid Services Comprehensive Children’s agencyMHAComprehensive children’s agency capitated for Medicaid services
MHA capitated for Medicaid Services Comprehensive Children’s agencyMHAMHAComprehensive children’s agency capitated for Medicaid services
The MHAs in the following charts reported only those children whose services they funded with their own resources. While one program, Texas NorthSTAR, is a capitated Medicaid program, it has reported separately on its Medicaid and MHA funded services. Most of this small group of MHAs served between 4 and 6 children per thousand, with Idaho and New Mexico serving considerably more. The average of these MHAs is 9 children served per thousand, far fewer than the average of 25 per thousand for the MHAs that reported all community services. All but one of these data points fell below the range of the MHAs that included Medicaid funded services, pointing to the significance of Medicaid resources in serving this population. Accounting for poverty levels brought Massachusetts much closer to the mean, but neither reduced variation nor changed the relative position of other states.
Chart B.3 Chart B.4
Number of children receiving a mental health authority funded service per 1,000 population under 18
Children Served by MHA Funds per 1,000
Source:Population and Poverty Data: 2000 US Census
5 4 5
10
6
4
29
0
10
20
30
ID MA MT NM OK TX Nstar TX MHA Sep
Mean = 9Median = 5 SD = 9
Mean = 9Median = 5 SD = 9
MHA includes PCP ServicesMHA includes PCP Services
Number of children receiving a mental health authority funded service per 1,000 population under 18 below 200% FPL (Federal Poverty Level)
Children Served by MHA Funds per 1,000 Below 200% FPL
Source:Population and Poverty Data: 2000 US Census
18
9 10
25
1310
56
0
10
20
30
40
50
60
ID MA MT NM OK TX NSTAR TX MHA Sep
Mean = 20Median = 13SD = 17
Mean = 20Median = 13SD = 17
MHA includes PCP ServicesMHA includes PCP Services
Footnotes for Children Served by MHA Funds Chart B.3 & 4 Idaho Includes all children receiving an assessment, even if determined not to meet criteria for SED. Texas MHA Includes children served by county funds. Excludes NorthSTAR. Texas NorthSTAR MHA
Behavioral health carve-out serving seven county areas around Dallas. Service population excludes foster children.
Dougherty Management Associates, Inc. Appendix B – Page 54
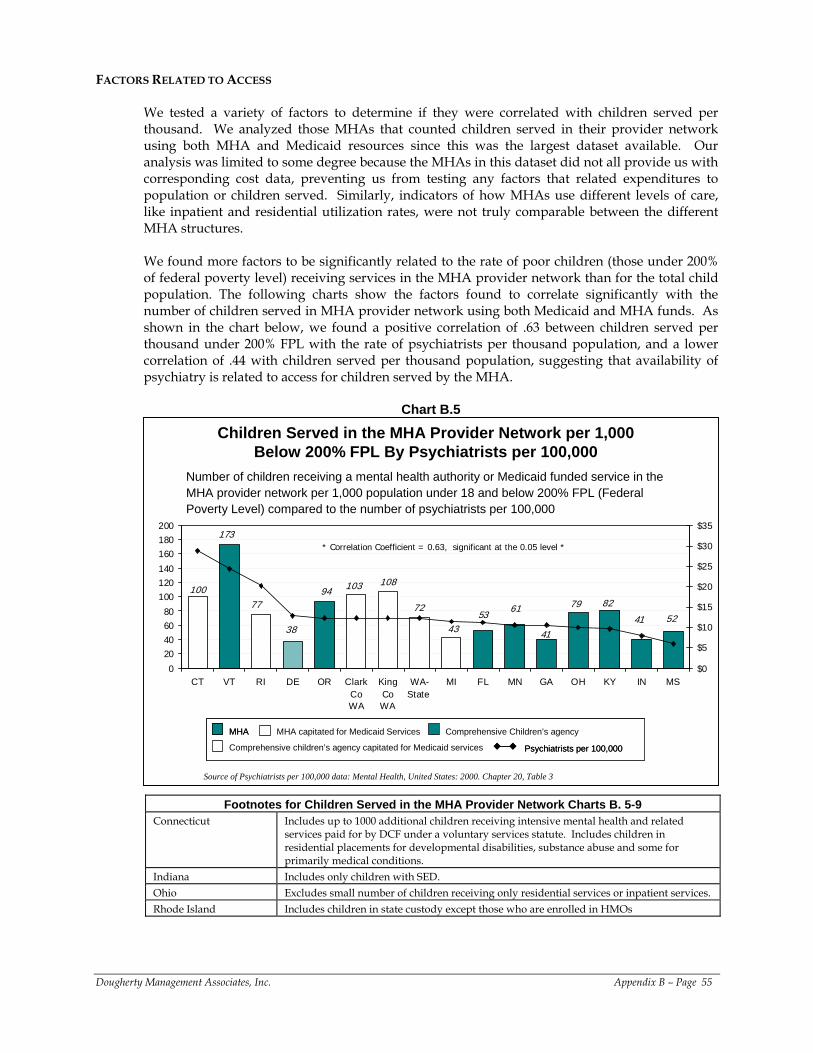
FACTORS RELATED TO ACCESS We tested a variety of factors to determine if they were correlated with children served per thousand. We analyzed those MHAs that counted children served in their provider network using both MHA and Medicaid resources since this was the largest dataset available. Our analysis was limited to some degree because the MHAs in this dataset did not all provide us with corresponding cost data, preventing us from testing any factors that related expenditures to population or children served. Similarly, indicators of how MHAs use different levels of care, like inpatient and residential utilization rates, were not truly comparable between the different MHA structures. We found more factors to be significantly related to the rate of poor children (those under 200% of federal poverty level) receiving services in the MHA provider network than for the total child population. The following charts show the factors found to correlate significantly with the number of children served in MHA provider network using both Medicaid and MHA funds. As shown in the chart below, we found a positive correlation of .63 between children served per thousand under 200% FPL with the rate of psychiatrists per thousand population, and a lower correlation of .44 with children served per thousand population, suggesting that availability of psychiatry is related to access for children served by the MHA.
Chart B.5
173
617741
41
94100
72
43
82
108
5379
52
103
38
0
20406080
100120140
160180200
CT VT RI DE OR ClarkCoWA
KingCoWA
WA-State
MI FL MN GA OH KY IN MS$0
$5
$10
$15
$20
$25
$30
$35
Children Served in the MHA Provider Network per 1,000 Below 200% FPL By Psychiatrists per 100,000
* Correlation Coefficient = 0.63, significant at the 0.05 level *
Number of children receiving a mental health authority or Medicaid funded service in the MHA provider network per 1,000 population under 18 and below 200% FPL (Federal Poverty Level) compared to the number of psychiatrists per 100,000
Psychiatrists per 100,000
MHA capitated for Medicaid Services Comprehensive Children’s agencyMHA
Comprehensive children’s agency capitated for Medicaid services Psychiatrists per 100,000Psychiatrists per 100,000
MHA capitated for Medicaid Services Comprehensive Children’s agencyMHAMHA
Comprehensive children’s agency capitated for Medicaid services
Source of Psychiatrists per 100,000 data: Mental Health, United States: 2000. Chapter 20, Table 3
Footnotes for Children Served in the MHA Provider Network Charts B. 5-9 Connecticut Includes up to 1000 additional children receiving intensive mental health and related
services paid for by DCF under a voluntary services statute. Includes children in residential placements for developmental disabilities, substance abuse and some for primarily medical conditions.
Indiana Includes only children with SED. Ohio Excludes small number of children receiving only residential services or inpatient services. Rhode Island Includes children in state custody except those who are enrolled in HMOs
Dougherty Management Associates, Inc. Appendix B – Page 55
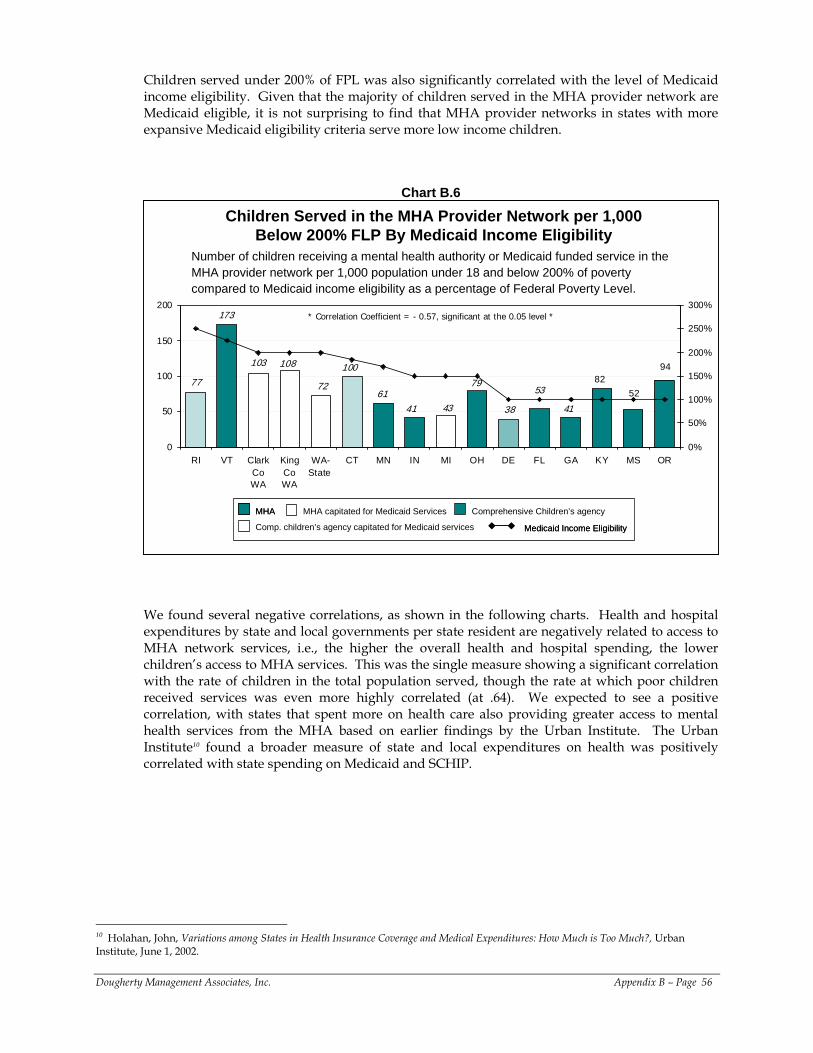
Children served under 200% of FPL was also significantly correlated with the level of Medicaid income eligibility. Given that the majority of children served in the MHA provider network are Medicaid eligible, it is not surprising to find that MHA provider networks in states with more expansive Medicaid eligibility criteria serve more low income children.
Chart B.6
Children Served in the MHA Provider Network per 1,000 Below 200% FLP By Medicaid Income Eligibility
108 100 94
41
7961
82
4341
77 72 53 52
103
38
173
0
50
100
150
200
RI VT ClarkCoWA
KingCoWA
WA-State
CT MN IN MI OH DE FL GA KY MS OR0%
50%
100%
150%
200%
250%
300%* Correlation Coefficient = - 0.57, significant at the 0.05 level *
Number of children receiving a mental health authority or Medicaid funded service in the MHA provider network per 1,000 population under 18 and below 200% of poverty compared to Medicaid income eligibility as a percentage of Federal Poverty Level.
Medicaid Income EligibilityMedicaid Income Eligibility
MHA capitated for Medicaid Services Comprehensive Children’s agencyMHAMHA
Comp. children’s agency capitated for Medicaid services
We found several negative correlations, as shown in the following charts. Health and hospital expenditures by state and local governments per state resident are negatively related to access to MHA network services, i.e., the higher the overall health and hospital spending, the lower children’s access to MHA services. This was the single measure showing a significant correlation with the rate of children in the total population served, though the rate at which poor children received services was even more highly correlated (at .64). We expected to see a positive correlation, with states that spent more on health care also providing greater access to mental health services from the MHA based on earlier findings by the Urban Institute. The Urban Institute10 found a broader measure of state and local expenditures on health was positively correlated with state spending on Medicaid and SCHIP.
Dougherty Management Associates, Inc. Appendix B – Page 56
10 Holahan, John, Variations among States in Health Insurance Coverage and Medical Expenditures: How Much is Too Much?, Urban Institute, June 1, 2002.
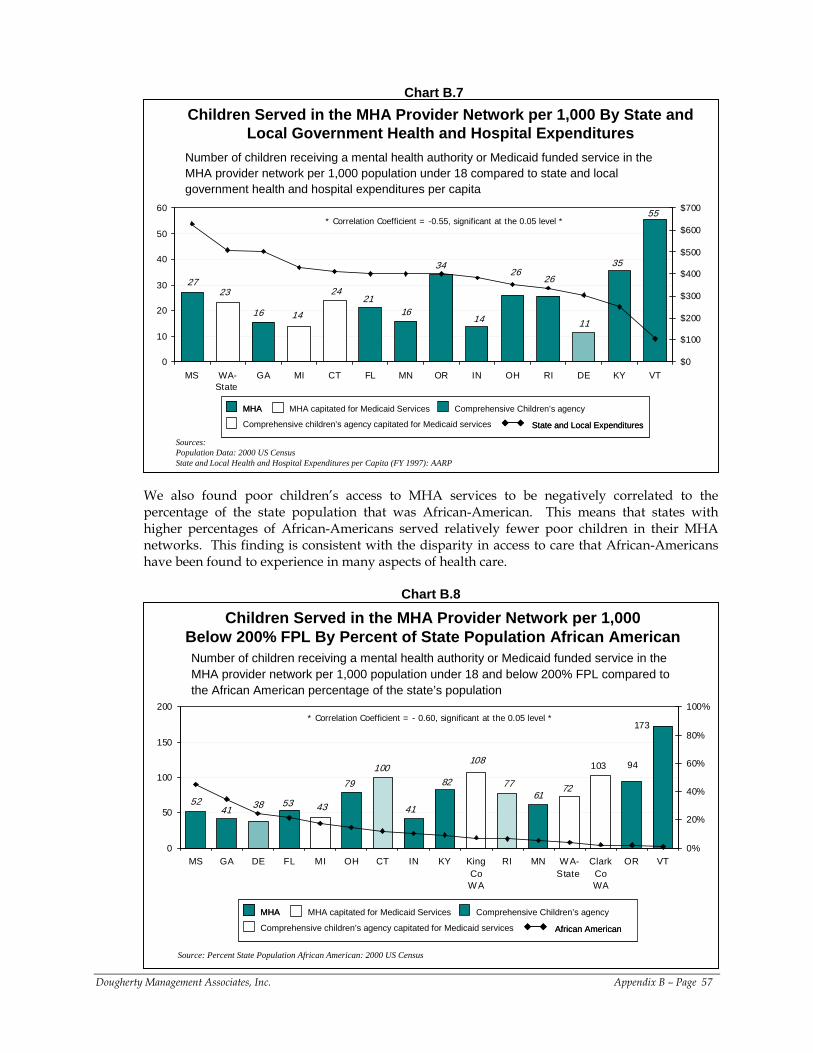
Chart B.7
14
21
3526
16
55
14
34
2724
1116
2623
0
10
20
30
40
50
60
MS WA-State
GA MI CT FL MN OR IN OH RI DE KY VT$0
$100
$200
$300
$400
$500
$600
$700
Children Served in the MHA Provider Network per 1,000 By State and Local Government Health and Hospital Expenditures
Sources:Population Data: 2000 US CensusState and Local Health and Hospital Expenditures per Capita (FY 1997): AARP
* Correlation Coefficient = -0.55, significant at the 0.05 level *
Number of children receiving a mental health authority or Medicaid funded service in the MHA provider network per 1,000 population under 18 compared to state and local government health and hospital expenditures per capita
State and Local Expenditures
MHA capitated for Medicaid Services Comprehensive Children’s agencyMHA
Comprehensive children’s agency capitated for Medicaid services State and Local ExpendituresState and Local Expenditures
MHA capitated for Medicaid Services Comprehensive Children’s agencyMHAMHA
Comprehensive children’s agency capitated for Medicaid services
We also found poor children’s access to MHA services to be negatively correlated to the percentage of the state population that was African-American. This means that states with higher percentages of African-Americans served relatively fewer poor children in their MHA networks. This finding is consistent with the disparity in access to care that African-Americans have been found to experience in many aspects of health care.
Chart B.8
Children Served in the MHA Provider Network per 1,000 Below 200% FPL By Percent of State Population African American
Source: Percent State Population African American: 2000 US Census
41
77
38
94
614352
41
82
103100108
72
173
79
53
0
50
100
150
200
MS GA DE FL MI OH CT IN KY KingCoWA
RI MN W A-State
ClarkCoWA
OR VT0%
20%
40%
60%
80%
100%* Correlation Coefficient = - 0.60, significant at the 0.05 level *
Number of children receiving a mental health authority or Medicaid funded service in the MHA provider network per 1,000 population under 18 and below 200% FPL compared to the African American percentage of the state’s population
African American
MHA capitated for Medicaid Services Comprehensive Children’s agencyMHA
Comprehensive children’s agency capitated for Medicaid services African AmericanAfrican American
MHA capitated for Medicaid Services Comprehensive Children’s agencyMHAMHA
Comprehensive children’s agency capitated for Medicaid services
Dougherty Management Associates, Inc. Appendix B – Page 57
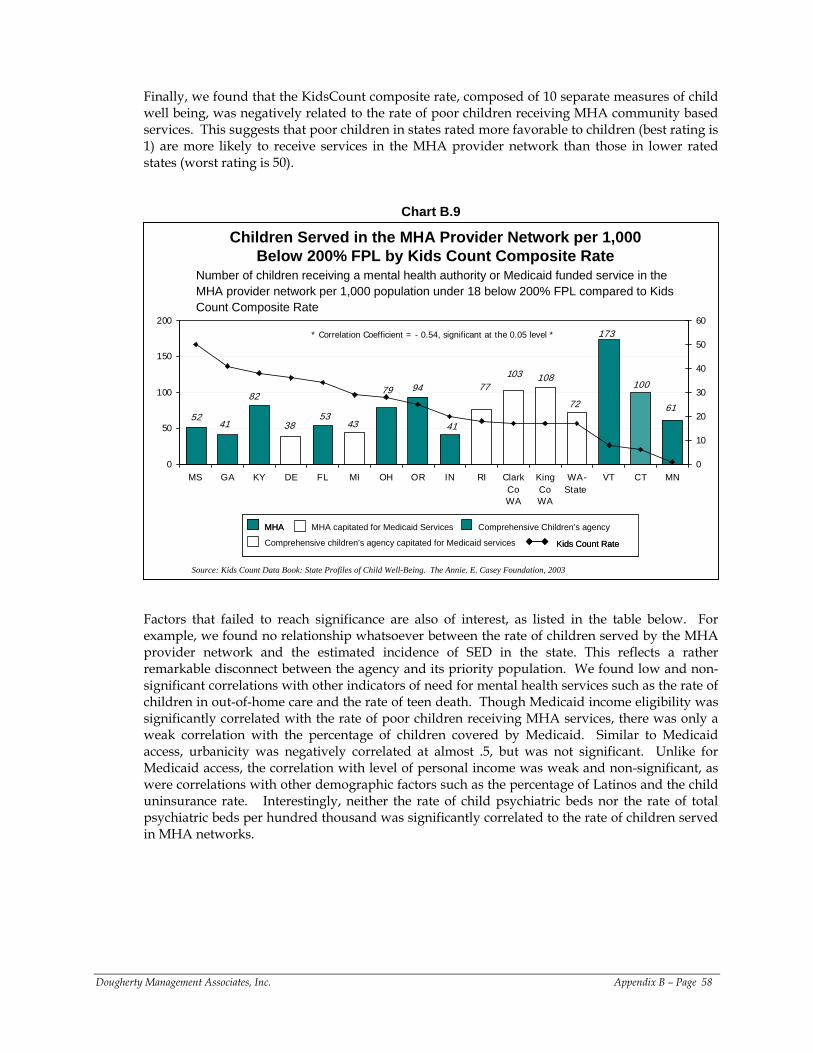
Finally, we found that the KidsCount composite rate, composed of 10 separate measures of child well being, was negatively related to the rate of poor children receiving MHA community based services. This suggests that poor children in states rated more favorable to children (best rating is 1) are more likely to receive services in the MHA provider network than those in lower rated states (worst rating is 50).
Chart B.9
Children Served in the MHA Provider Network per 1,000 Below 200% FPL by Kids Count Composite Rate
* Correlation Coefficient = - 0.54, significant at the 0.05 level *
Number of children receiving a mental health authority or Medicaid funded service in the MHA provider network per 1,000 population under 18 below 200% FPL compared to Kids Count Composite Rate
Kids Count Rate
MHA capitated for Medicaid Services Comprehensive Children’s agencyMHA
Comprehensive children’s agency capitated for Medicaid services Kids Count RateKids Count Rate
MHA capitated for Medicaid Services Comprehensive Children’s agencyMHAMHA
Comprehensive children’s agency capitated for Medicaid services
41
103
82100
108
5352
94
41
173
79 77
72 61
4338
0
50
100
150
200
MS GA KY DE FL MI OH OR IN RI ClarkCoWA
KingCoWA
WA-State
VT CT MN0
10
20
30
40
50
60
Source: Kids Count Data Book: State Profiles of Child Well-Being. The Annie. E. Casey Foundation, 2003
Factors that failed to reach significance are also of interest, as listed in the table below. For example, we found no relationship whatsoever between the rate of children served by the MHA provider network and the estimated incidence of SED in the state. This reflects a rather remarkable disconnect between the agency and its priority population. We found low and non-significant correlations with other indicators of need for mental health services such as the rate of children in out-of-home care and the rate of teen death. Though Medicaid income eligibility was significantly correlated with the rate of poor children receiving MHA services, there was only a weak correlation with the percentage of children covered by Medicaid. Similar to Medicaid access, urbanicity was negatively correlated at almost .5, but was not significant. Unlike for Medicaid access, the correlation with level of personal income was weak and non-significant, as were correlations with other demographic factors such as the percentage of Latinos and the child uninsurance rate. Interestingly, neither the rate of child psychiatric beds nor the rate of total psychiatric beds per hundred thousand was significantly correlated to the rate of children served in MHA networks.
Dougherty Management Associates, Inc. Appendix B – Page 58
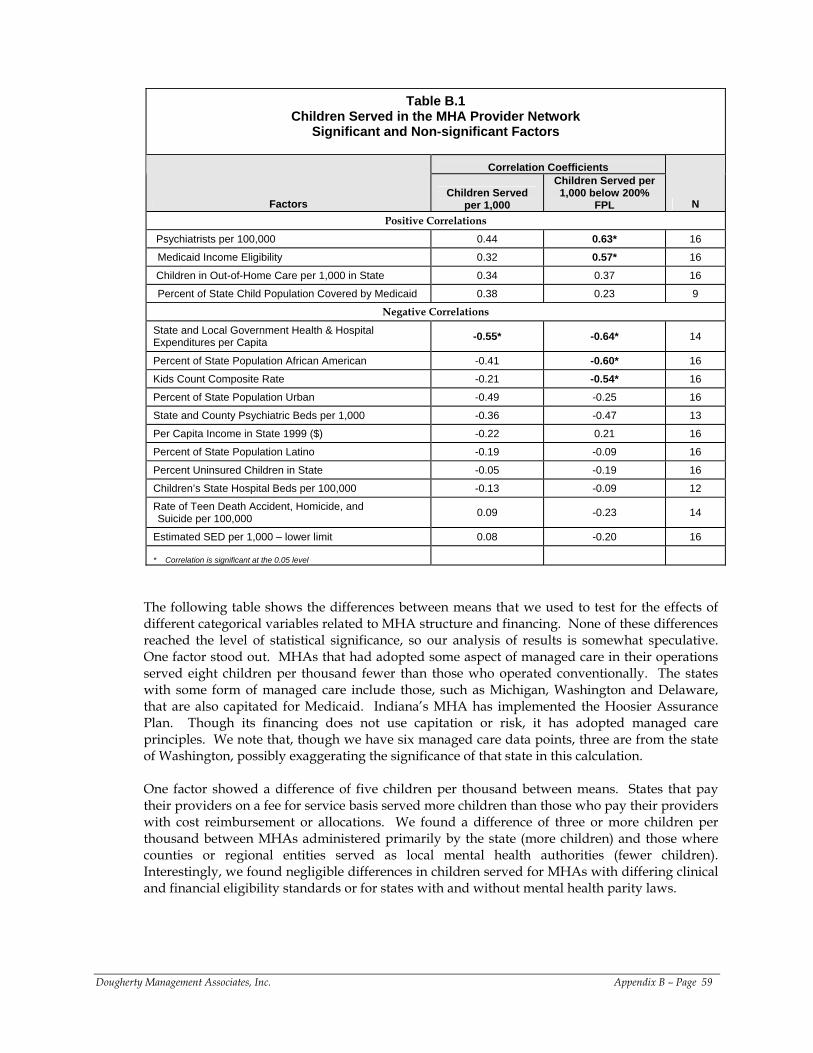
Table B.1
Children Served in the MHA Provider Network Significant and Non-significant Factors
Correlation Coefficients
Factors Children Served
per 1,000
Children Served per 1,000 below 200%
FPL N Positive Correlations
Psychiatrists per 100,000 0.44 0.63* 16
Medicaid Income Eligibility 0.32 0.57* 16
Children in Out-of-Home Care per 1,000 in State 0.34 0.37 16
Percent of State Child Population Covered by Medicaid 0.38 0.23 9 Negative Correlations
State and Local Government Health & Hospital Expenditures per Capita -0.55* -0.64* 14
Percent of State Population African American -0.41 -0.60* 16
Kids Count Composite Rate -0.21 -0.54* 16
Percent of State Population Urban -0.49 -0.25 16
State and County Psychiatric Beds per 1,000 -0.36 -0.47 13
Per Capita Income in State 1999 ($) -0.22 0.21 16
Percent of State Population Latino -0.19 -0.09 16
Percent Uninsured Children in State -0.05 -0.19 16
Children’s State Hospital Beds per 100,000 -0.13 -0.09 12 Rate of Teen Death Accident, Homicide, and Suicide per 100,000 0.09 -0.23 14
Estimated SED per 1,000 – lower limit 0.08 -0.20 16 * Correlation is significant at the 0.05 level
The following table shows the differences between means that we used to test for the effects of different categorical variables related to MHA structure and financing. None of these differences reached the level of statistical significance, so our analysis of results is somewhat speculative. One factor stood out. MHAs that had adopted some aspect of managed care in their operations served eight children per thousand fewer than those who operated conventionally. The states with some form of managed care include those, such as Michigan, Washington and Delaware, that are also capitated for Medicaid. Indiana’s MHA has implemented the Hoosier Assurance Plan. Though its financing does not use capitation or risk, it has adopted managed care principles. We note that, though we have six managed care data points, three are from the state of Washington, possibly exaggerating the significance of that state in this calculation. One factor showed a difference of five children per thousand between means. States that pay their providers on a fee for service basis served more children than those who pay their providers with cost reimbursement or allocations. We found a difference of three or more children per thousand between MHAs administered primarily by the state (more children) and those where counties or regional entities served as local mental health authorities (fewer children). Interestingly, we found negligible differences in children served for MHAs with differing clinical and financial eligibility standards or for states with and without mental health parity laws.
Dougherty Management Associates, Inc. Appendix B – Page 59
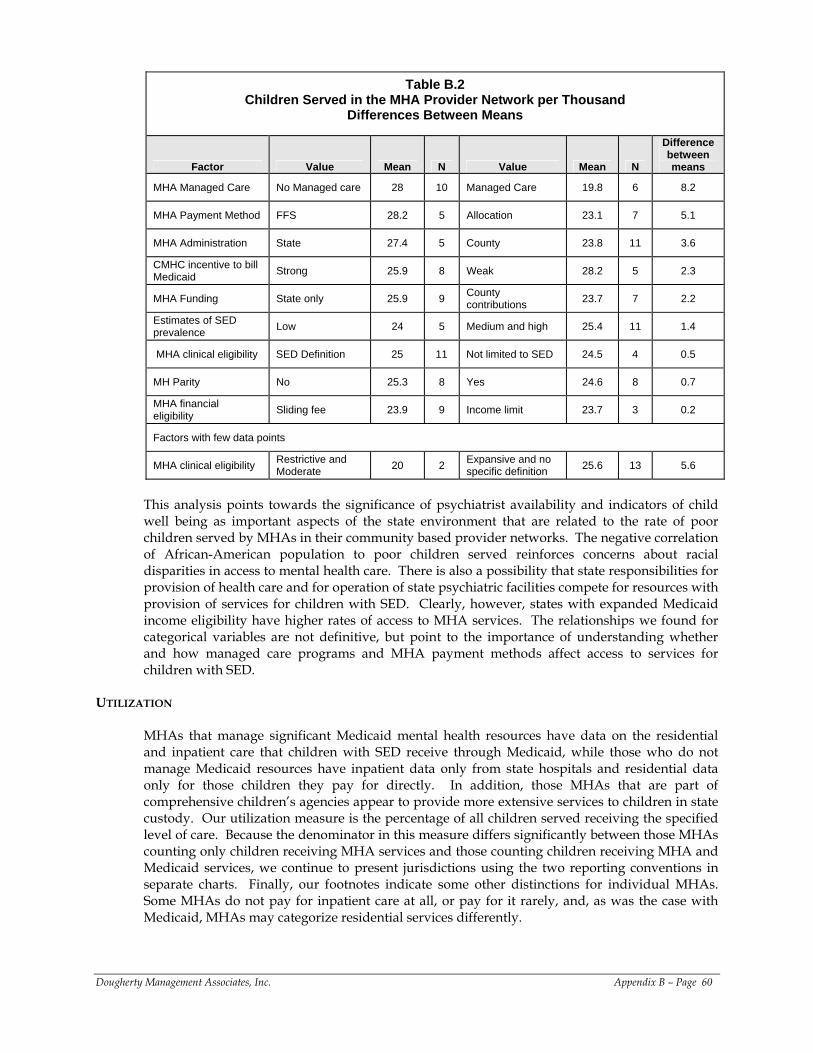
Table B.2 Children Served in the MHA Provider Network per Thousand
Differences Between Means
Factor Value Mean N Value Mean N
Difference between means
MHA Managed Care No Managed care 28 10 Managed Care 19.8 6 8.2
MHA Payment Method FFS 28.2 5 Allocation 23.1 7 5.1
MHA Administration State 27.4 5 County 23.8 11 3.6
CMHC incentive to bill Medicaid Strong 25.9 8 Weak 28.2 5 2.3
MHA Funding State only 25.9 9 County contributions 23.7 7 2.2
Estimates of SED prevalence Low 24 5 Medium and high 25.4 11 1.4
MHA clinical eligibility SED Definition 25 11 Not limited to SED 24.5 4 0.5
MH Parity No 25.3 8 Yes 24.6 8 0.7
MHA financial eligibility Sliding fee 23.9 9 Income limit 23.7 3 0.2
Factors with few data points
MHA clinical eligibility Restrictive and Moderate 20 2 Expansive and no
specific definition 25.6 13 5.6
This analysis points towards the significance of psychiatrist availability and indicators of child well being as important aspects of the state environment that are related to the rate of poor children served by MHAs in their community based provider networks. The negative correlation of African-American population to poor children served reinforces concerns about racial disparities in access to mental health care. There is also a possibility that state responsibilities for provision of health care and for operation of state psychiatric facilities compete for resources with provision of services for children with SED. Clearly, however, states with expanded Medicaid income eligibility have higher rates of access to MHA services. The relationships we found for categorical variables are not definitive, but point to the importance of understanding whether and how managed care programs and MHA payment methods affect access to services for children with SED.
UTILIZATION
MHAs that manage significant Medicaid mental health resources have data on the residential and inpatient care that children with SED receive through Medicaid, while those who do not manage Medicaid resources have inpatient data only from state hospitals and residential data only for those children they pay for directly. In addition, those MHAs that are part of comprehensive children’s agencies appear to provide more extensive services to children in state custody. Our utilization measure is the percentage of all children served receiving the specified level of care. Because the denominator in this measure differs significantly between those MHAs counting only children receiving MHA services and those counting children receiving MHA and Medicaid services, we continue to present jurisdictions using the two reporting conventions in separate charts. Finally, our footnotes indicate some other distinctions for individual MHAs. Some MHAs do not pay for inpatient care at all, or pay for it rarely, and, as was the case with Medicaid, MHAs may categorize residential services differently.
Dougherty Management Associates, Inc. Appendix B – Page 60
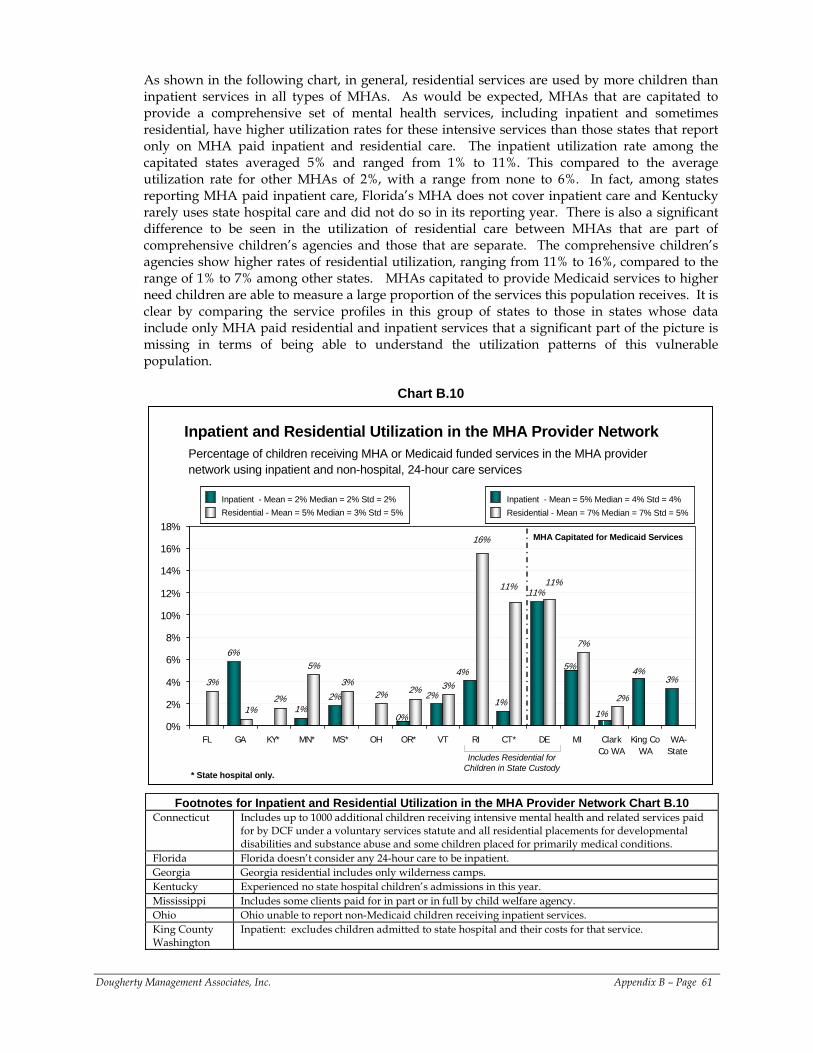
As shown in the following chart, in general, residential services are used by more children than inpatient services in all types of MHAs. As would be expected, MHAs that are capitated to provide a comprehensive set of mental health services, including inpatient and sometimes residential, have higher utilization rates for these intensive services than those states that report only on MHA paid inpatient and residential care. The inpatient utilization rate among the capitated states averaged 5% and ranged from 1% to 11%. This compared to the average utilization rate for other MHAs of 2%, with a range from none to 6%. In fact, among states reporting MHA paid inpatient care, Florida’s MHA does not cover inpatient care and Kentucky rarely uses state hospital care and did not do so in its reporting year. There is also a significant difference to be seen in the utilization of residential care between MHAs that are part of comprehensive children’s agencies and those that are separate. The comprehensive children’s agencies show higher rates of residential utilization, ranging from 11% to 16%, compared to the range of 1% to 7% among other states. MHAs capitated to provide Medicaid services to higher need children are able to measure a large proportion of the services this population receives. It is clear by comparing the service profiles in this group of states to those in states whose data include only MHA paid residential and inpatient services that a significant part of the picture is missing in terms of being able to understand the utilization patterns of this vulnerable population.
Chart B.10
Percentage of children receiving MHA or Medicaid funded services in the MHA provider network using inpatient and non-hospital, 24-hour care services
Inpatient and Residential Utilization in the MHA Provider Network
6%
1%2%
11%
3%3%
2%
5%
3%2% 2% 3%
7%
4% 4%
0%
2%1%
5%
1%
11%
16%
11%
2%1%
0%
2%
4%
6%
8%
10%
12%
14%
16%
18%
FL GA KY* MN* MS* OH OR* VT RI CT* DE MI ClarkCo WA
King CoWA
WA-State
Inpatient - Mean = 2% Median = 2% Std = 2% Residential - Mean = 5% Median = 3% Std = 5%Inpatient - Mean = 2% Median = 2% Std = 2% Residential - Mean = 5% Median = 3% Std = 5%
MHA Capitated for Medicaid Services
Includes Residential for Children in State Custody
Inpatient - Mean = 5% Median = 4% Std = 4% Residential - Mean = 7% Median = 7% Std = 5%Inpatient - Mean = 5% Median = 4% Std = 4% Residential - Mean = 7% Median = 7% Std = 5%
* State hospital only.
Footnotes for Inpatient and Residential Utilization in the MHA Provider Network Chart B.10 Connecticut Includes up to 1000 additional children receiving intensive mental health and related services paid
for by DCF under a voluntary services statute and all residential placements for developmental disabilities and substance abuse and some children placed for primarily medical conditions.
Florida Florida doesn’t consider any 24-hour care to be inpatient. Georgia Georgia residential includes only wilderness camps. Kentucky Experienced no state hospital children’s admissions in this year. Mississippi Includes some clients paid for in part or in full by child welfare agency. Ohio Ohio unable to report non-Medicaid children receiving inpatient services. King County Washington
Inpatient: excludes children admitted to state hospital and their costs for that service.
Dougherty Management Associates, Inc. Appendix B – Page 61
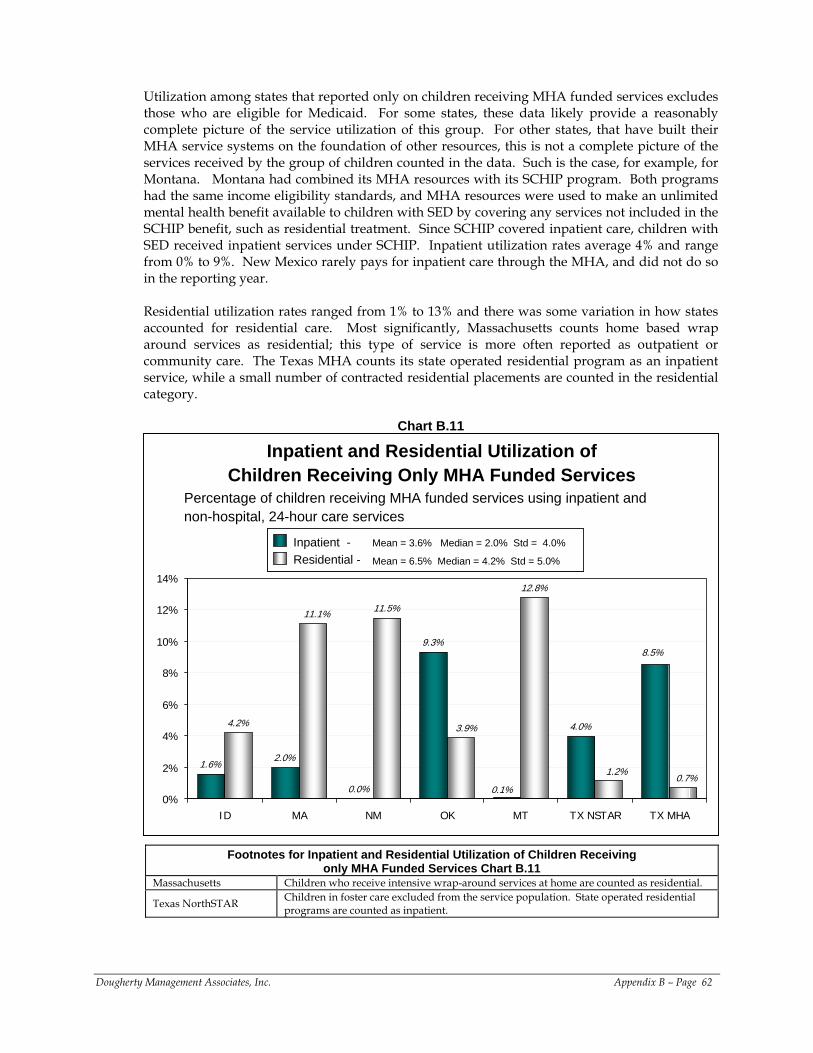
Utilization among states that reported only on children receiving MHA funded services excludes those who are eligible for Medicaid. For some states, these data likely provide a reasonably complete picture of the service utilization of this group. For other states, that have built their MHA service systems on the foundation of other resources, this is not a complete picture of the services received by the group of children counted in the data. Such is the case, for example, for Montana. Montana had combined its MHA resources with its SCHIP program. Both programs had the same income eligibility standards, and MHA resources were used to make an unlimited mental health benefit available to children with SED by covering any services not included in the SCHIP benefit, such as residential treatment. Since SCHIP covered inpatient care, children with SED received inpatient services under SCHIP. Inpatient utilization rates average 4% and range from 0% to 9%. New Mexico rarely pays for inpatient care through the MHA, and did not do so in the reporting year. Residential utilization rates ranged from 1% to 13% and there was some variation in how states accounted for residential care. Most significantly, Massachusetts counts home based wrap around services as residential; this type of service is more often reported as outpatient or community care. The Texas MHA counts its state operated residential program as an inpatient service, while a small number of contracted residential placements are counted in the residential category.
Chart B.11
1.6%2.0%
0.0%
9.3%
4.0%4.2%
11.5%
12.8%
8.5%
0.1%0.7%
1.2%
11.1%
3.9%
0%
2%
4%
6%
8%
10%
12%
14%
ID MA NM OK MT TX NSTAR TX MHA
Inpatient -Residential - Mean = 6.5% Median = 4.2% Std = 5.0%
Mean = 3.6% Median = 2.0% Std = 4.0%Inpatient -Residential - Mean = 6.5% Median = 4.2% Std = 5.0%
Mean = 3.6% Median = 2.0% Std = 4.0%
Percentage of children receiving MHA funded services using inpatient and non-hospital, 24-hour care services
Inpatient and Residential Utilization of Children Receiving Only MHA Funded Services
Footnotes for Inpatient and Residential Utilization of Children Receiving only MHA Funded Services Chart B.11
Massachusetts Children who receive intensive wrap-around services at home are counted as residential.
Texas NorthSTAR Children in foster care excluded from the service population. State operated residential programs are counted as inpatient.
Dougherty Management Associates, Inc. Appendix B – Page 62
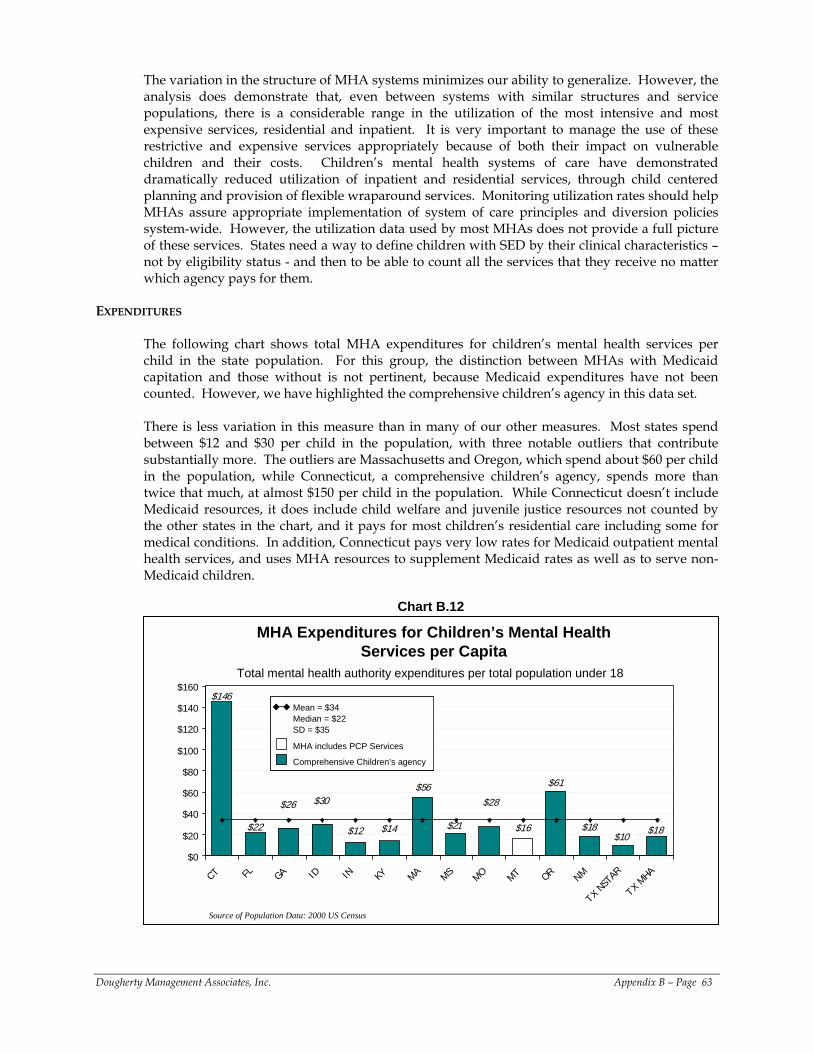
The variation in the structure of MHA systems minimizes our ability to generalize. However, the analysis does demonstrate that, even between systems with similar structures and service populations, there is a considerable range in the utilization of the most intensive and most expensive services, residential and inpatient. It is very important to manage the use of these restrictive and expensive services appropriately because of both their impact on vulnerable children and their costs. Children’s mental health systems of care have demonstrated dramatically reduced utilization of inpatient and residential services, through child centered planning and provision of flexible wraparound services. Monitoring utilization rates should help MHAs assure appropriate implementation of system of care principles and diversion policies system-wide. However, the utilization data used by most MHAs does not provide a full picture of these services. States need a way to define children with SED by their clinical characteristics – not by eligibility status - and then to be able to count all the services that they receive no matter which agency pays for them.
EXPENDITURES
The following chart shows total MHA expenditures for children’s mental health services per child in the state population. For this group, the distinction between MHAs with Medicaid capitation and those without is not pertinent, because Medicaid expenditures have not been counted. However, we have highlighted the comprehensive children’s agency in this data set. There is less variation in this measure than in many of our other measures. Most states spend between $12 and $30 per child in the population, with three notable outliers that contribute substantially more. The outliers are Massachusetts and Oregon, which spend about $60 per child in the population, while Connecticut, a comprehensive children’s agency, spends more than twice that much, at almost $150 per child in the population. While Connecticut doesn’t include Medicaid resources, it does include child welfare and juvenile justice resources not counted by the other states in the chart, and it pays for most children’s residential care including some for medical conditions. In addition, Connecticut pays very low rates for Medicaid outpatient mental health services, and uses MHA resources to supplement Medicaid rates as well as to serve non-Medicaid children.
Chart B.12
MHA Expenditures for Children’s Mental Health Services per Capita
$12
$61
$16 $18
$28$56
$18$10
$21
$26
$22 $14
$146
$30
$0
$20
$40
$60
$80
$100
$120
$140
$160
CT FL GA ID IN KY MA MS MO MT OR NM
TX NS
TAR
TX MHA
Source of Population Data: 2000 US Census
Total mental health authority expenditures per total population under 18
Mean = $34Median = $22SD = $35
MHA includes PCP Services
Comprehensive Children’s agency
Mean = $34Median = $22SD = $35
MHA includes PCP Services
Comprehensive Children’s agency
Dougherty Management Associates, Inc. Appendix B – Page 63
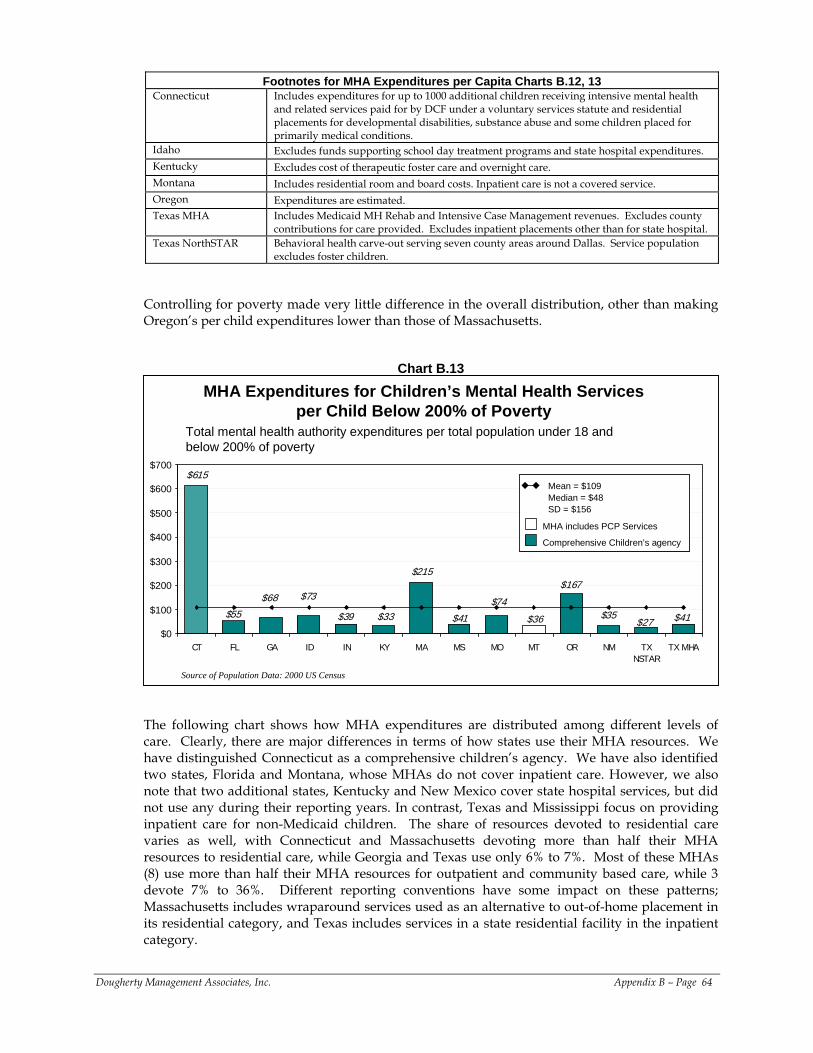
Footnotes for MHA Expenditures per Capita Charts B.12, 13 Connecticut Includes expenditures for up to 1000 additional children receiving intensive mental health
and related services paid for by DCF under a voluntary services statute and residential placements for developmental disabilities, substance abuse and some children placed for primarily medical conditions.
Idaho Excludes funds supporting school day treatment programs and state hospital expenditures. Kentucky Excludes cost of therapeutic foster care and overnight care. Montana Includes residential room and board costs. Inpatient care is not a covered service. Oregon Expenditures are estimated. Texas MHA Includes Medicaid MH Rehab and Intensive Case Management revenues. Excludes county
contributions for care provided. Excludes inpatient placements other than for state hospital. Texas NorthSTAR Behavioral health carve-out serving seven county areas around Dallas. Service population
excludes foster children.
Controlling for poverty made very little difference in the overall distribution, other than making Oregon’s per child expenditures lower than those of Massachusetts.
Chart B.13
$39
$167
$36 $35$74
$215
$41$27$41
$68
$55 $33
$615
$73
$0
$100
$200
$300
$400
$500
$600
$700
CT FL GA ID IN KY MA MS MO MT OR NM TXNSTAR
TX MHA
MHA Expenditures for Children’s Mental Health Services per Child Below 200% of Poverty
MHA includes PCP Services
Comprehensive Children’s agency
Mean = $109Median = $48SD = $156
MHA includes PCP Services
Comprehensive Children’s agency
Mean = $109Median = $48SD = $156
Source of Population Data: 2000 US Census
Total mental health authority expenditures per total population under 18 and below 200% of poverty
The following chart shows how MHA expenditures are distributed among different levels of care. Clearly, there are major differences in terms of how states use their MHA resources. We have distinguished Connecticut as a comprehensive children’s agency. We have also identified two states, Florida and Montana, whose MHAs do not cover inpatient care. However, we also note that two additional states, Kentucky and New Mexico cover state hospital services, but did not use any during their reporting years. In contrast, Texas and Mississippi focus on providing inpatient care for non-Medicaid children. The share of resources devoted to residential care varies as well, with Connecticut and Massachusetts devoting more than half their MHA resources to residential care, while Georgia and Texas use only 6% to 7%. Most of these MHAs (8) use more than half their MHA resources for outpatient and community based care, while 3 devote 7% to 36%. Different reporting conventions have some impact on these patterns; Massachusetts includes wraparound services used as an alternative to out-of-home placement in its residential category, and Texas includes services in a state residential facility in the inpatient category.
Dougherty Management Associates, Inc. Appendix B – Page 64
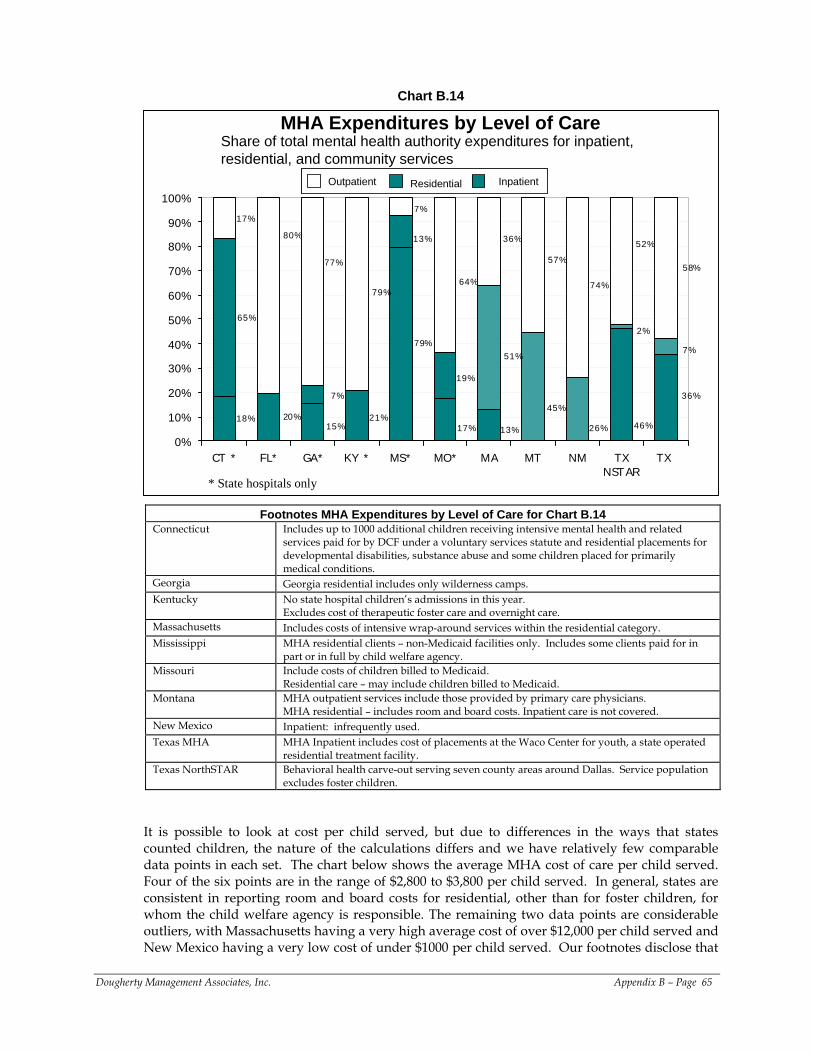
Chart B.14
MHA Expenditures by Level of Care
15%
36%
46%13%17%
79%
18%
7%
2%
26%
45%
51%
19%
13%
21%
7%
20%
65%
58%
52%
74%
57%
36%
64%
7%
79%
77%
80%
17%
0%
10%
20%
30%
40%
50%
60%
70%
80%
90%
100%
CT * FL* GA* KY * MS* MO* MA MT NM TXNSTAR
TX
Inpatient Residential Outpatient Inpatient Residential Outpatient
Share of total mental health authority expenditures for inpatient, residential, and community services
* State hospitals only
Footnotes MHA Expenditures by Level of Care for Chart B.14 Connecticut Includes up to 1000 additional children receiving intensive mental health and related
services paid for by DCF under a voluntary services statute and residential placements for developmental disabilities, substance abuse and some children placed for primarily medical conditions.
Georgia Georgia residential includes only wilderness camps. Kentucky No state hospital children’s admissions in this year.
Excludes cost of therapeutic foster care and overnight care. Massachusetts Includes costs of intensive wrap-around services within the residential category. Mississippi MHA residential clients – non-Medicaid facilities only. Includes some clients paid for in
part or in full by child welfare agency. Missouri Include costs of children billed to Medicaid.
Residential care – may include children billed to Medicaid. Montana MHA outpatient services include those provided by primary care physicians.
MHA residential – includes room and board costs. Inpatient care is not covered. New Mexico Inpatient: infrequently used. Texas MHA MHA Inpatient includes cost of placements at the Waco Center for youth, a state operated
residential treatment facility. Texas NorthSTAR Behavioral health carve-out serving seven county areas around Dallas. Service population
excludes foster children. It is possible to look at cost per child served, but due to differences in the ways that states counted children, the nature of the calculations differs and we have relatively few comparable data points in each set. The chart below shows the average MHA cost of care per child served. Four of the six points are in the range of $2,800 to $3,800 per child served. In general, states are consistent in reporting room and board costs for residential, other than for foster children, for whom the child welfare agency is responsible. The remaining two data points are considerable outliers, with Massachusetts having a very high average cost of over $12,000 per child served and New Mexico having a very low cost of under $1000 per child served. Our footnotes disclose that
Dougherty Management Associates, Inc. Appendix B – Page 65
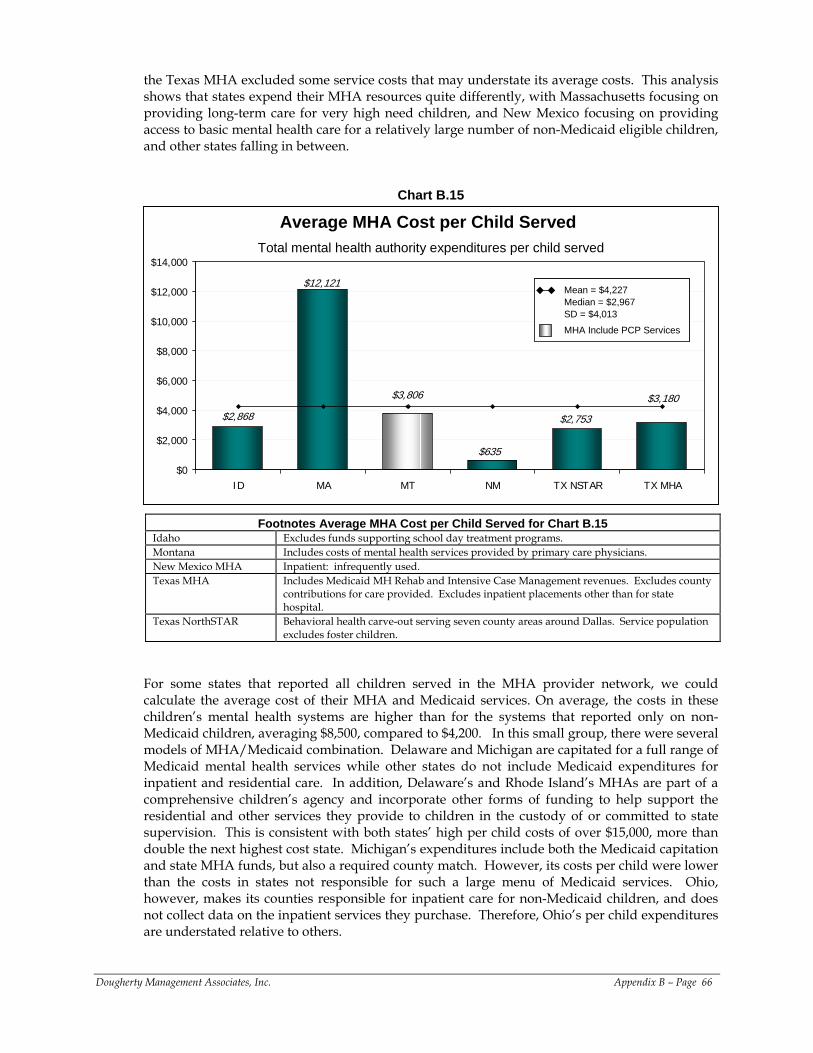
the Texas MHA excluded some service costs that may understate its average costs. This analysis shows that states expend their MHA resources quite differently, with Massachusetts focusing on providing long-term care for very high need children, and New Mexico focusing on providing access to basic mental health care for a relatively large number of non-Medicaid eligible children, and other states falling in between.
Chart B.15
Average MHA Cost per Child Served
$2,753
$3,806
$12,121
$3,180
$2,868
$635
$0
$2,000
$4,000
$6,000
$8,000
$10,000
$12,000
$14,000
ID MA MT NM TX NSTAR TX MHA
Mean = $4,227Median = $2,967SD = $4,013MHA Include PCP Services
Mean = $4,227Median = $2,967SD = $4,013MHA Include PCP Services
Total mental health authority expenditures per child served
Footnotes Average MHA Cost per Child Served for Chart B.15 Idaho Excludes funds supporting school day treatment programs. Montana Includes costs of mental health services provided by primary care physicians. New Mexico MHA Inpatient: infrequently used. Texas MHA Includes Medicaid MH Rehab and Intensive Case Management revenues. Excludes county
contributions for care provided. Excludes inpatient placements other than for state hospital.
Texas NorthSTAR Behavioral health carve-out serving seven county areas around Dallas. Service population excludes foster children.
For some states that reported all children served in the MHA provider network, we could calculate the average cost of their MHA and Medicaid services. On average, the costs in these children’s mental health systems are higher than for the systems that reported only on non-Medicaid children, averaging $8,500, compared to $4,200. In this small group, there were several models of MHA/Medicaid combination. Delaware and Michigan are capitated for a full range of Medicaid mental health services while other states do not include Medicaid expenditures for inpatient and residential care. In addition, Delaware’s and Rhode Island’s MHAs are part of a comprehensive children’s agency and incorporate other forms of funding to help support the residential and other services they provide to children in the custody of or committed to state supervision. This is consistent with both states’ high per child costs of over $15,000, more than double the next highest cost state. Michigan’s expenditures include both the Medicaid capitation and state MHA funds, but also a required county match. However, its costs per child were lower than the costs in states not responsible for such a large menu of Medicaid services. Ohio, however, makes its counties responsible for inpatient care for non-Medicaid children, and does not collect data on the inpatient services they purchase. Therefore, Ohio’s per child expenditures are understated relative to others.
Dougherty Management Associates, Inc. Appendix B – Page 66
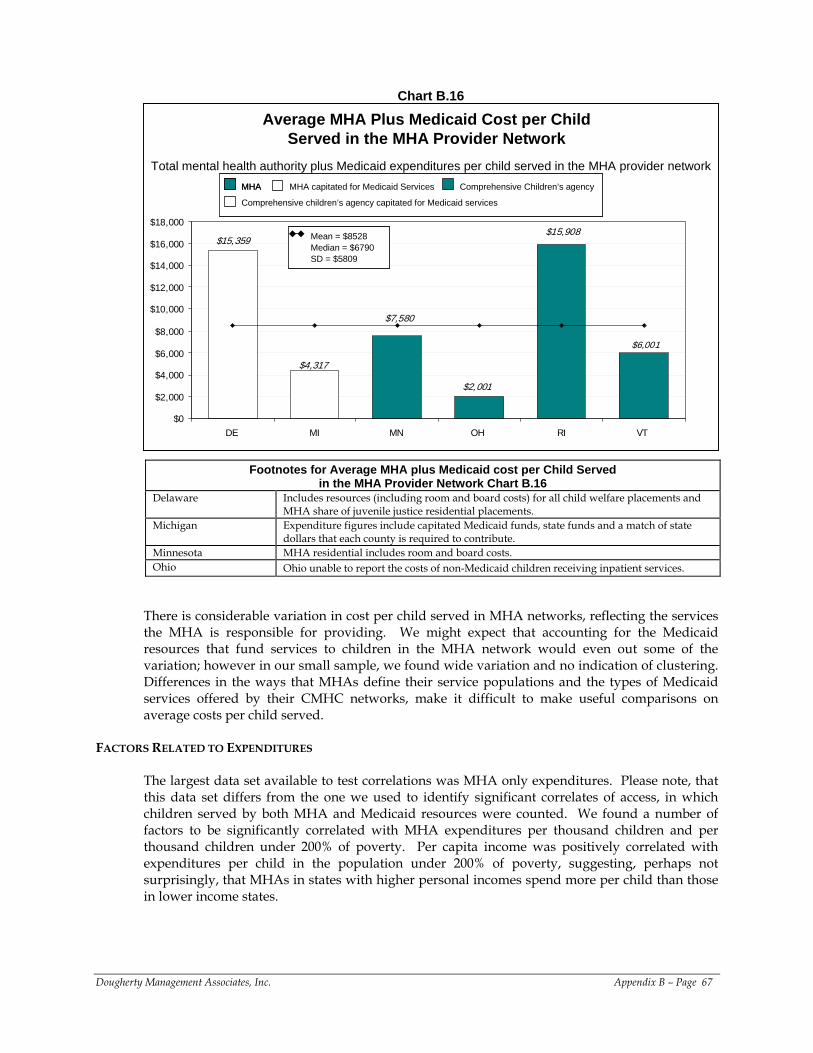
Chart B.16
Average MHA Plus Medicaid Cost per Child Served in the MHA Provider Network
$2,001
$15,359
$6,001
$4,317
$7,580
$15,908
$0
$2,000
$4,000
$6,000
$8,000
$10,000
$12,000
$14,000
$16,000
$18,000
DE MI MN OH RI VT
Mean = $8528Median = $6790SD = $5809
Mean = $8528Median = $6790SD = $5809
Total mental health authority plus Medicaid expenditures per child served in the MHA provider networkMHA capitated for Medicaid Services Comprehensive Children’s agencyMHA
Comprehensive children’s agency capitated for Medicaid services
MHA capitated for Medicaid Services Comprehensive Children’s agencyMHAMHA
Comprehensive children’s agency capitated for Medicaid services
Footnotes for Average MHA plus Medicaid cost per Child Served in the MHA Provider Network Chart B.16
Delaware Includes resources (including room and board costs) for all child welfare placements and MHA share of juvenile justice residential placements.
Michigan Expenditure figures include capitated Medicaid funds, state funds and a match of state dollars that each county is required to contribute.
Minnesota MHA residential includes room and board costs. Ohio Ohio unable to report the costs of non-Medicaid children receiving inpatient services.
There is considerable variation in cost per child served in MHA networks, reflecting the services the MHA is responsible for providing. We might expect that accounting for the Medicaid resources that fund services to children in the MHA network would even out some of the variation; however in our small sample, we found wide variation and no indication of clustering. Differences in the ways that MHAs define their service populations and the types of Medicaid services offered by their CMHC networks, make it difficult to make useful comparisons on average costs per child served.
FACTORS RELATED TO EXPENDITURES
The largest data set available to test correlations was MHA only expenditures. Please note, that this data set differs from the one we used to identify significant correlates of access, in which children served by both MHA and Medicaid resources were counted. We found a number of factors to be significantly correlated with MHA expenditures per thousand children and per thousand children under 200% of poverty. Per capita income was positively correlated with expenditures per child in the population under 200% of poverty, suggesting, perhaps not surprisingly, that MHAs in states with higher personal incomes spend more per child than those in lower income states.
Dougherty Management Associates, Inc. Appendix B – Page 67
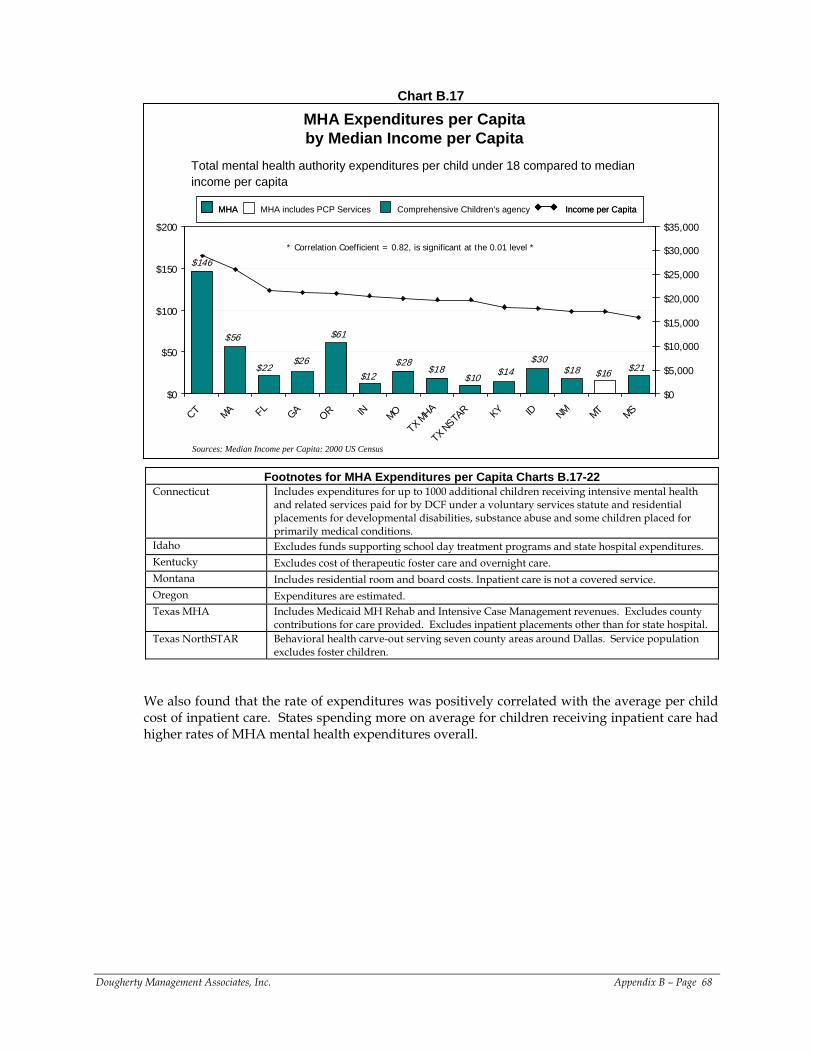
Chart B.17
$26
$12 $16$14$28 $21
$10$18
$146
$61
$18$22$30
$56
$0
$50
$100
$150
$200
CT MA FL GA OR IN MO
TX MHA
TX NSTAR KY ID NM MT MS
$0
$5,000
$10,000
$15,000
$20,000
$25,000
$30,000
$35,000
MHA Expenditures per Capita by Median Income per Capita
* Correlation Coefficient = 0.82, is significant at the 0.01 level *
Sources: Median Income per Capita: 2000 US Census
Income per CapitaMHA includes PCP Services Comprehensive Children’s agencyMHA Income per CapitaIncome per CapitaMHA includes PCP Services Comprehensive Children’s agencyMHAMHA
Total mental health authority expenditures per child under 18 compared to median income per capita
Footnotes for MHA Expenditures per Capita Charts B.17-22 Connecticut Includes expenditures for up to 1000 additional children receiving intensive mental health
and related services paid for by DCF under a voluntary services statute and residential placements for developmental disabilities, substance abuse and some children placed for primarily medical conditions.
Idaho Excludes funds supporting school day treatment programs and state hospital expenditures. Kentucky Excludes cost of therapeutic foster care and overnight care. Montana Includes residential room and board costs. Inpatient care is not a covered service. Oregon Expenditures are estimated. Texas MHA Includes Medicaid MH Rehab and Intensive Case Management revenues. Excludes county
contributions for care provided. Excludes inpatient placements other than for state hospital. Texas NorthSTAR Behavioral health carve-out serving seven county areas around Dallas. Service population
excludes foster children.
We also found that the rate of expenditures was positively correlated with the average per child cost of inpatient care. States spending more on average for children receiving inpatient care had higher rates of MHA mental health expenditures overall.
Dougherty Management Associates, Inc. Appendix B – Page 68
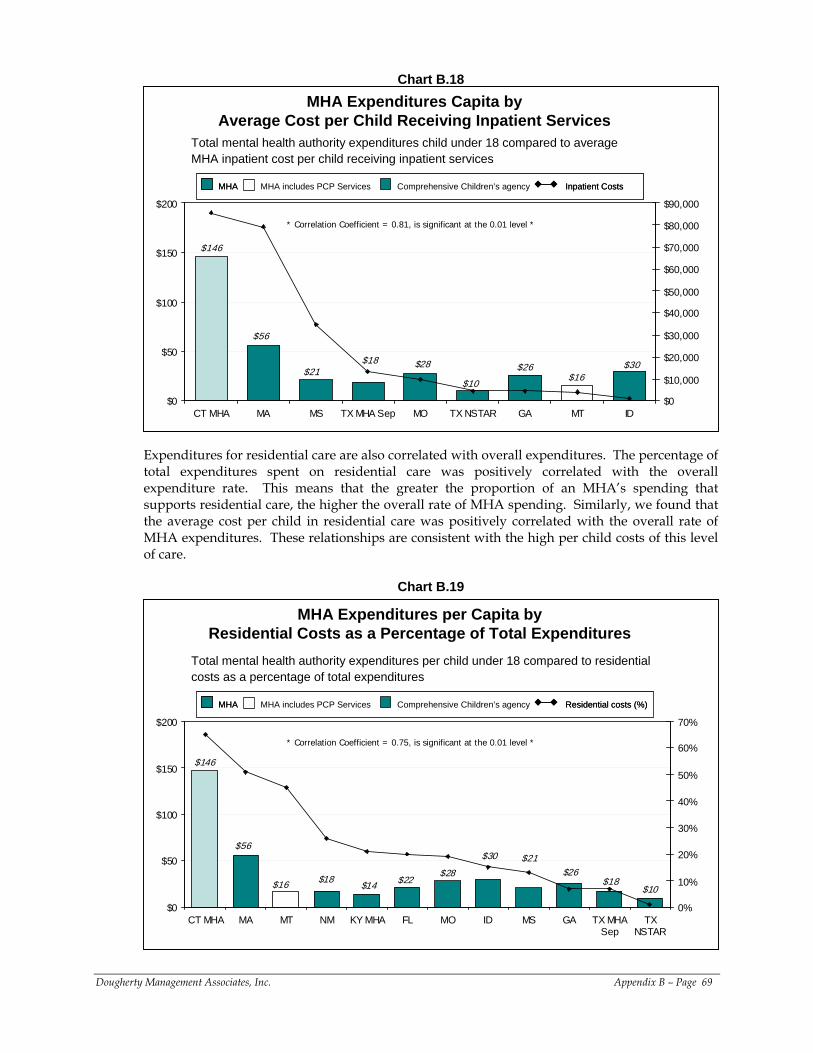
Chart B.18
$56
$21$28
$146
$16$30$26
$10
$18
$0
$50
$100
$150
$200
CT MHA MA MS TX MHA Sep MO TX NSTAR GA MT ID$0
$10,000
$20,000
$30,000
$40,000
$50,000
$60,000
$70,000
$80,000
$90,000
MHA Expenditures Capita by Average Cost per Child Receiving Inpatient Services
* Correlation Coefficient = 0.81, is significant at the 0.01 level *
Inpatient CostsMHA includes PCP Services Comprehensive Children’s agencyMHA Inpatient CostsInpatient CostsMHA includes PCP Services Comprehensive Children’s agencyMHAMHA
Total mental health authority expenditures child under 18 compared to average MHA inpatient cost per child receiving inpatient services
Expenditures for residential care are also correlated with overall expenditures. The percentage of total expenditures spent on residential care was positively correlated with the overall expenditure rate. This means that the greater the proportion of an MHA’s spending that supports residential care, the higher the overall rate of MHA spending. Similarly, we found that the average cost per child in residential care was positively correlated with the overall rate of MHA expenditures. These relationships are consistent with the high per child costs of this level of care.
Chart B.19
$18 $22$26$28
$21$30
$146
$14 $10$16 $18
$56
$0
$50
$100
$150
$200
CT MHA MA MT NM KY MHA FL MO ID MS GA TX MHASep
TXNSTAR
0%
10%
20%
30%
40%
50%
60%
70%
MHA Expenditures per Capita byResidential Costs as a Percentage of Total Expenditures
* Correlation Coefficient = 0.75, is significant at the 0.01 level *
Residential costs (%)MHA includes PCP Services Comprehensive Children’s agencyMHA Residential costs (%)Residential costs (%)MHA includes PCP Services Comprehensive Children’s agencyMHAMHA
Total mental health authority expenditures per child under 18 compared to residential costs as a percentage of total expenditures
Dougherty Management Associates, Inc. Appendix B – Page 69
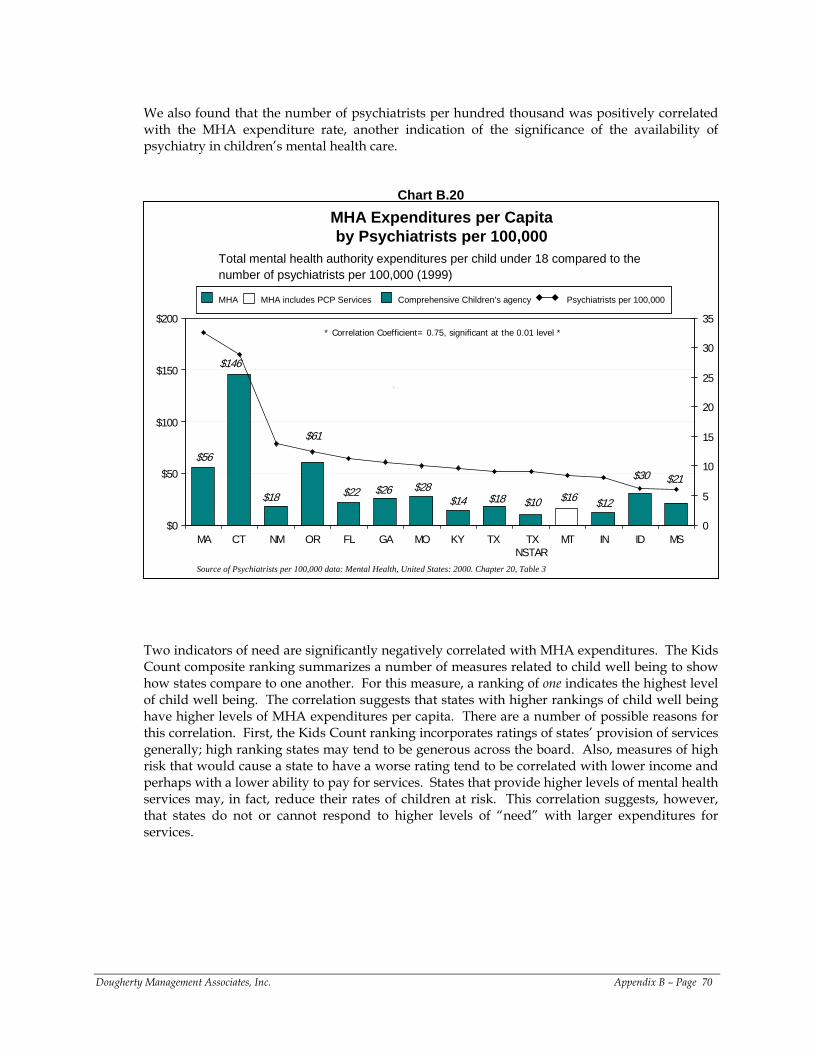
We also found that the number of psychiatrists per hundred thousand was positively correlated with the MHA expenditure rate, another indication of the significance of the availability of psychiatry in children’s mental health care.
Chart B.20
$61
$26$30
$10$28
$21
$18$14
$56
$22$12$18 $16
$146
$0
$50
$100
$150
$200
MA CT NM OR FL GA MO KY TX TXNSTAR
MT IN ID MS0
5
10
15
20
25
30
35
MHA Expenditures per Capitaby Psychiatrists per 100,000
* Correlation Coefficient= 0.75, significant at the 0.01 level *
Psychiatrists per 100,000MHA includes PCP Services Comprehensive Children’s agencyMHA Psychiatrists per 100,000MHA includes PCP Services Comprehensive Children’s agencyMHA
Total mental health authority expenditures per child under 18 compared to the number of psychiatrists per 100,000 (1999)
Source of Psychiatrists per 100,000 data: Mental Health, United States: 2000. Chapter 20, Table 3
Two indicators of need are significantly negatively correlated with MHA expenditures. The Kids Count composite ranking summarizes a number of measures related to child well being to show how states compare to one another. For this measure, a ranking of one indicates the highest level of child well being. The correlation suggests that states with higher rankings of child well being have higher levels of MHA expenditures per capita. There are a number of possible reasons for this correlation. First, the Kids Count ranking incorporates ratings of states’ provision of services generally; high ranking states may tend to be generous across the board. Also, measures of high risk that would cause a state to have a worse rating tend to be correlated with lower income and perhaps with a lower ability to pay for services. States that provide higher levels of mental health services may, in fact, reduce their rates of children at risk. This correlation suggests, however, that states do not or cannot respond to higher levels of “need” with larger expenditures for services.
Dougherty Management Associates, Inc. Appendix B – Page 70
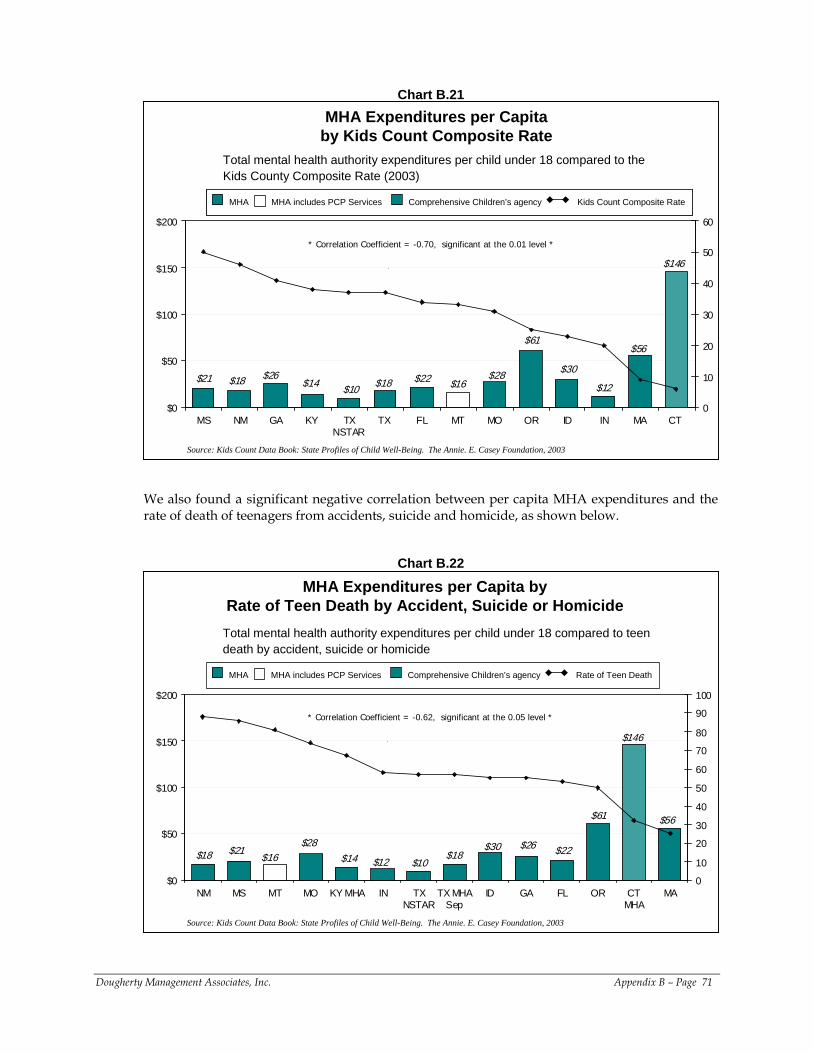
Chart B.21
$14 $18
$56$61
$22
$146
$28$16$21
$10 $12$26 $30
$18
$0
$50
$100
$150
$200
MS NM GA KY TXNSTAR
TX FL MT MO OR ID IN MA CT 0
10
20
30
40
50
60
MHA Expenditures per Capita by Kids Count Composite Rate
* Correlation Coefficient = -0.70, significant at the 0.01 level *
Source: Kids Count Data Book: State Profiles of Child Well-Being. The Annie. E. Casey Foundation, 2003
Total mental health authority expenditures per child under 18 compared to the Kids County Composite Rate (2003)
Kids Count Composite RateMHA includes PCP Services Comprehensive Children’s agencyMHA Kids Count Composite RateMHA includes PCP Services Comprehensive Children’s agencyMHA
We also found a significant negative correlation between per capita MHA expenditures and the rate of death of teenagers from accidents, suicide and homicide, as shown below.
Chart B.22
$28
$12
$146
$26
$10
$56
$30$18$18 $14
$61
$16$22$21
$0
$50
$100
$150
$200
NM MS MT MO KY MHA IN TXNSTAR
TX MHASep
ID GA FL OR CTMHA
MA0
10
20
30
40
50
60
70
80
90
100
MHA Expenditures per Capita by Rate of Teen Death by Accident, Suicide or Homicide
* Correlation Coefficient = -0.62, significant at the 0.05 level *
Source: Kids Count Data Book: State Profiles of Child Well-Being. The Annie. E. Casey Foundation, 2003
Total mental health authority expenditures per child under 18 compared to teen death by accident, suicide or homicide
Rate of Teen DeathMHA includes PCP Services Comprehensive Children’s agencyMHA
Dougherty Management Associates, Inc. Appendix B – Page 71
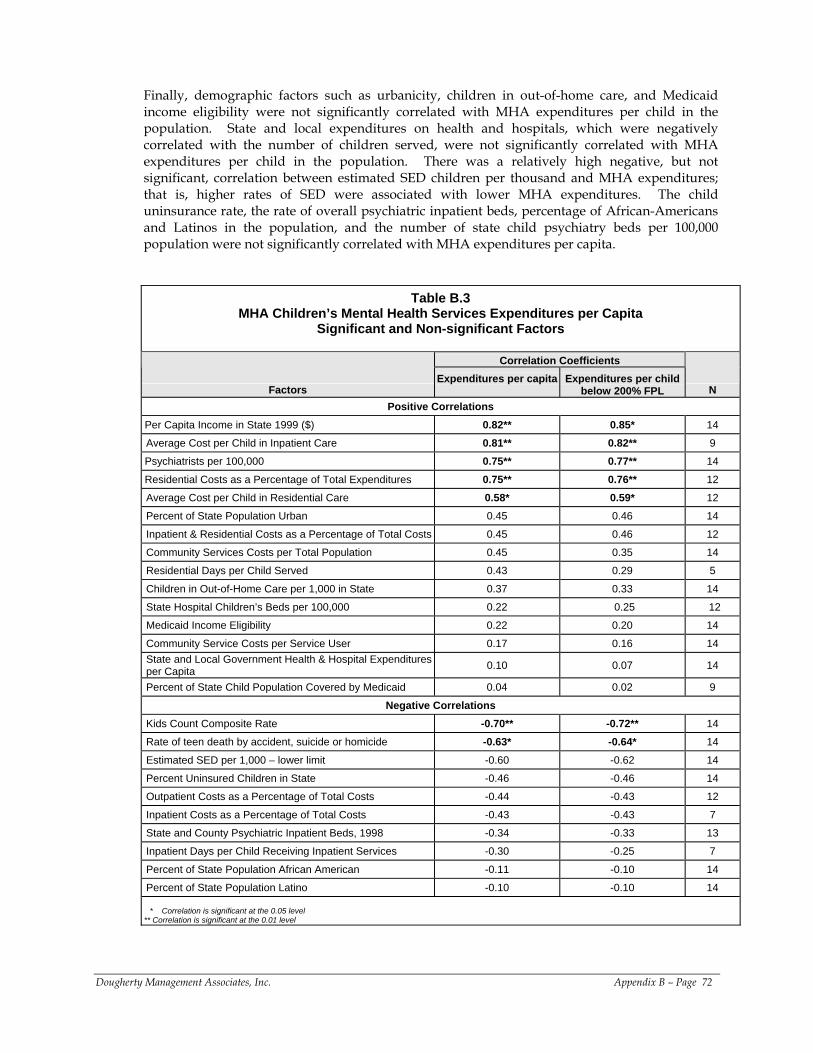
Finally, demographic factors such as urbanicity, children in out-of-home care, and Medicaid income eligibility were not significantly correlated with MHA expenditures per child in the population. State and local expenditures on health and hospitals, which were negatively correlated with the number of children served, were not significantly correlated with MHA expenditures per child in the population. There was a relatively high negative, but not significant, correlation between estimated SED children per thousand and MHA expenditures; that is, higher rates of SED were associated with lower MHA expenditures. The child uninsurance rate, the rate of overall psychiatric inpatient beds, percentage of African-Americans and Latinos in the population, and the number of state child psychiatry beds per 100,000 population were not significantly correlated with MHA expenditures per capita.
Dougherty Management Associates, Inc. Appendix B – Page 72
Table B.3 MHA Children’s Mental Health Services Expenditures per Capita
Significant and Non-significant Factors
Correlation Coefficients
Factors Expenditures per capita
Expenditures per child
below 200% FPL N Positive Correlations
Per Capita Income in State 1999 ($) 0.82** 0.85* 14
Average Cost per Child in Inpatient Care 0.81** 0.82** 9
Psychiatrists per 100,000 0.75** 0.77** 14
Residential Costs as a Percentage of Total Expenditures 0.75** 0.76** 12
Average Cost per Child in Residential Care 0.58* 0.59* 12
Percent of State Population Urban 0.45 0.46 14
Inpatient & Residential Costs as a Percentage of Total Costs 0.45 0.46 12
Community Services Costs per Total Population 0.45 0.35 14
Residential Days per Child Served 0.43 0.29 5
Children in Out-of-Home Care per 1,000 in State 0.37 0.33 14
State Hospital Children’s Beds per 100,000 0.22 0.25 12
Medicaid Income Eligibility 0.22 0.20 14
Community Service Costs per Service User 0.17 0.16 14 State and Local Government Health & Hospital Expenditures per Capita 0.10 0.07 14
Percent of State Child Population Covered by Medicaid 0.04 0.02 9
Negative Correlations Kids Count Composite Rate -0.70** -0.72** 14
Rate of teen death by accident, suicide or homicide -0.63* -0.64* 14
Estimated SED per 1,000 – lower limit -0.60 -0.62 14
Percent Uninsured Children in State -0.46 -0.46 14
Outpatient Costs as a Percentage of Total Costs -0.44 -0.43 12
Inpatient Costs as a Percentage of Total Costs -0.43 -0.43 7
State and County Psychiatric Inpatient Beds, 1998 -0.34 -0.33 13
Inpatient Days per Child Receiving Inpatient Services -0.30 -0.25 7
Percent of State Population African American -0.11 -0.10 14
Percent of State Population Latino -0.10 -0.10 14
* Correlation is significant at the 0.05 level ** Correlation is significant at the 0.01 level
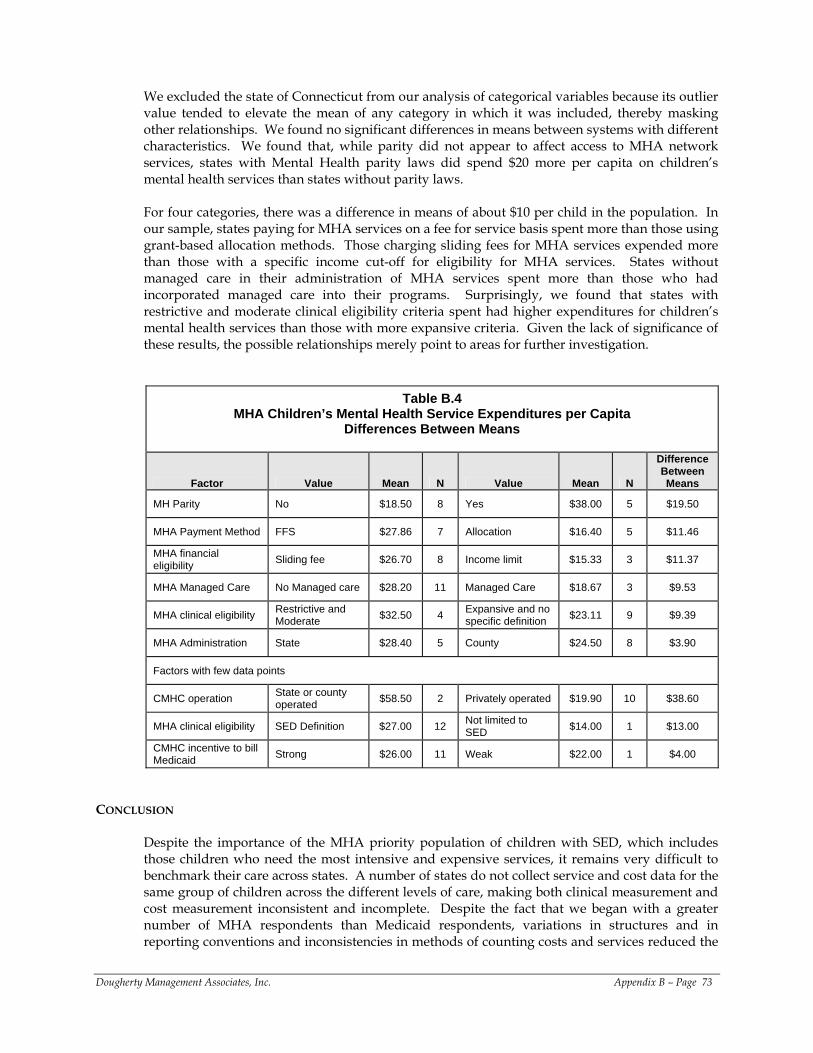
We excluded the state of Connecticut from our analysis of categorical variables because its outlier value tended to elevate the mean of any category in which it was included, thereby masking other relationships. We found no significant differences in means between systems with different characteristics. We found that, while parity did not appear to affect access to MHA network services, states with Mental Health parity laws did spend $20 more per capita on children’s mental health services than states without parity laws. For four categories, there was a difference in means of about $10 per child in the population. In our sample, states paying for MHA services on a fee for service basis spent more than those using grant-based allocation methods. Those charging sliding fees for MHA services expended more than those with a specific income cut-off for eligibility for MHA services. States without managed care in their administration of MHA services spent more than those who had incorporated managed care into their programs. Surprisingly, we found that states with restrictive and moderate clinical eligibility criteria spent had higher expenditures for children’s mental health services than those with more expansive criteria. Given the lack of significance of these results, the possible relationships merely point to areas for further investigation.
Table B.4 MHA Children’s Mental Health Service Expenditures per Capita
Differences Between Means
Factor Value Mean N Value Mean N
Difference Between Means
MH Parity No $18.50 8 Yes $38.00 5 $19.50
MHA Payment Method FFS $27.86 7 Allocation $16.40 5 $11.46
MHA financial eligibility Sliding fee $26.70 8 Income limit $15.33 3 $11.37
MHA Managed Care No Managed care $28.20 11 Managed Care $18.67 3 $9.53
MHA clinical eligibility Restrictive and Moderate $32.50 4 Expansive and no
specific definition $23.11 9 $9.39
MHA Administration State $28.40 5 County $24.50 8 $3.90
Factors with few data points
CMHC operation State or county operated $58.50 2 Privately operated $19.90 10 $38.60
MHA clinical eligibility SED Definition $27.00 12 Not limited to SED $14.00 1 $13.00
CMHC incentive to bill Medicaid Strong $26.00 11 Weak $22.00 1 $4.00
CONCLUSION
Despite the importance of the MHA priority population of children with SED, which includes those children who need the most intensive and expensive services, it remains very difficult to benchmark their care across states. A number of states do not collect service and cost data for the same group of children across the different levels of care, making both clinical measurement and cost measurement inconsistent and incomplete. Despite the fact that we began with a greater number of MHA respondents than Medicaid respondents, variations in structures and in reporting conventions and inconsistencies in methods of counting costs and services reduced the
Dougherty Management Associates, Inc. Appendix B – Page 73
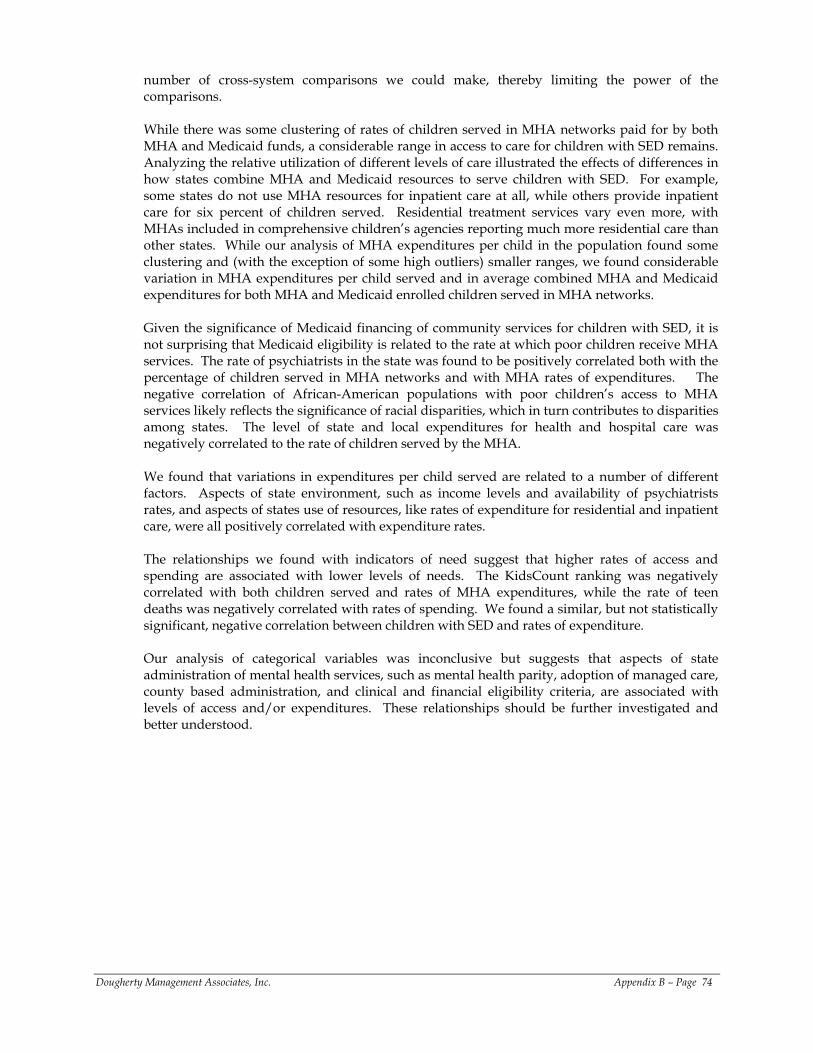
number of cross-system comparisons we could make, thereby limiting the power of the comparisons. While there was some clustering of rates of children served in MHA networks paid for by both MHA and Medicaid funds, a considerable range in access to care for children with SED remains. Analyzing the relative utilization of different levels of care illustrated the effects of differences in how states combine MHA and Medicaid resources to serve children with SED. For example, some states do not use MHA resources for inpatient care at all, while others provide inpatient care for six percent of children served. Residential treatment services vary even more, with MHAs included in comprehensive children’s agencies reporting much more residential care than other states. While our analysis of MHA expenditures per child in the population found some clustering and (with the exception of some high outliers) smaller ranges, we found considerable variation in MHA expenditures per child served and in average combined MHA and Medicaid expenditures for both MHA and Medicaid enrolled children served in MHA networks. Given the significance of Medicaid financing of community services for children with SED, it is not surprising that Medicaid eligibility is related to the rate at which poor children receive MHA services. The rate of psychiatrists in the state was found to be positively correlated both with the percentage of children served in MHA networks and with MHA rates of expenditures. The negative correlation of African-American populations with poor children’s access to MHA services likely reflects the significance of racial disparities, which in turn contributes to disparities among states. The level of state and local expenditures for health and hospital care was negatively correlated to the rate of children served by the MHA. We found that variations in expenditures per child served are related to a number of different factors. Aspects of state environment, such as income levels and availability of psychiatrists rates, and aspects of states use of resources, like rates of expenditure for residential and inpatient care, were all positively correlated with expenditure rates. The relationships we found with indicators of need suggest that higher rates of access and spending are associated with lower levels of needs. The KidsCount ranking was negatively correlated with both children served and rates of MHA expenditures, while the rate of teen deaths was negatively correlated with rates of spending. We found a similar, but not statistically significant, negative correlation between children with SED and rates of expenditure. Our analysis of categorical variables was inconclusive but suggests that aspects of state administration of mental health services, such as mental health parity, adoption of managed care, county based administration, and clinical and financial eligibility criteria, are associated with levels of access and/or expenditures. These relationships should be further investigated and better understood.
Dougherty Management Associates, Inc. Appendix B – Page 74
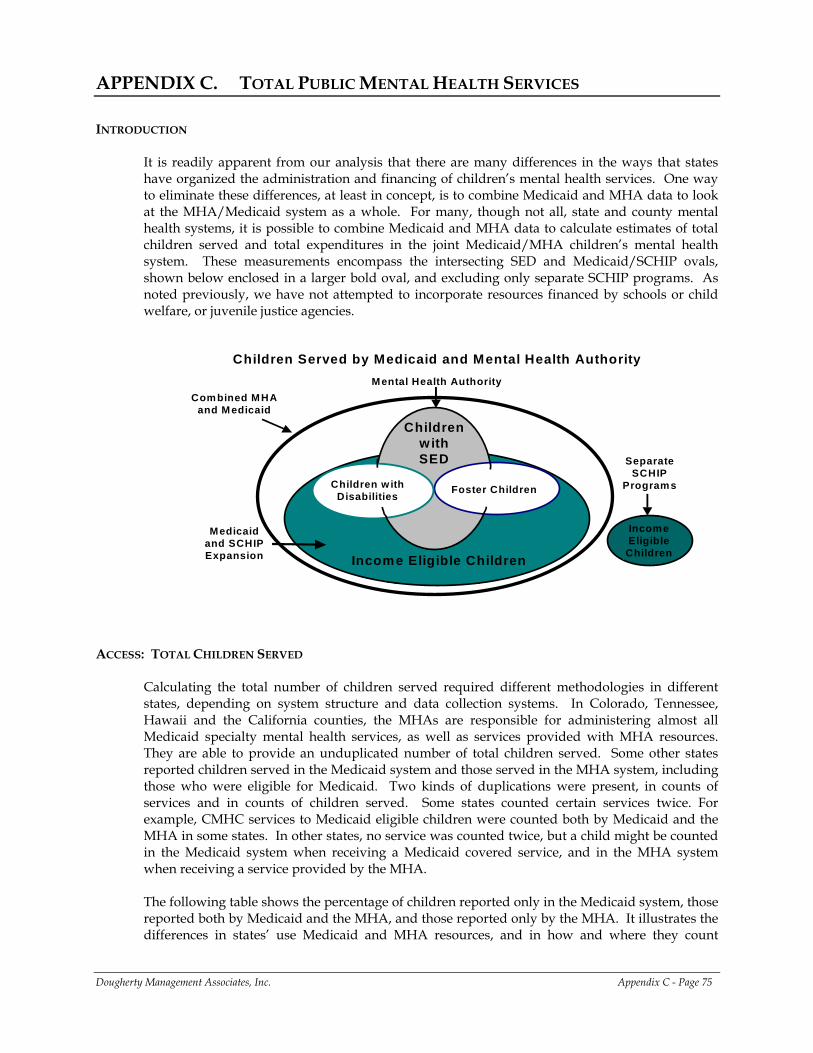
APPENDIX C. TOTAL PUBLIC MENTAL HEALTH SERVICES INTRODUCTION
It is readily apparent from our analysis that there are many differences in the ways that states have organized the administration and financing of children’s mental health services. One way to eliminate these differences, at least in concept, is to combine Medicaid and MHA data to look at the MHA/Medicaid system as a whole. For many, though not all, state and county mental health systems, it is possible to combine Medicaid and MHA data to calculate estimates of total children served and total expenditures in the joint Medicaid/MHA children’s mental health system. These measurements encompass the intersecting SED and Medicaid/SCHIP ovals, shown below enclosed in a larger bold oval, and excluding only separate SCHIP programs. As noted previously, we have not attempted to incorporate resources financed by schools or child welfare, or juvenile justice agencies.
Children Served by Medicaid and Mental Health Authority
Medicaid and SCHIP Expansion
Income Eligible
Children
Separate SCHIP
Programs
Mental Health Authority
Children w ith Disabilities Foster Children
Income Eligible Children
Children with SED
Combined MHA and Medicaid
ACCESS: TOTAL CHILDREN SERVED
Calculating the total number of children served required different methodologies in different states, depending on system structure and data collection systems. In Colorado, Tennessee, Hawaii and the California counties, the MHAs are responsible for administering almost all Medicaid specialty mental health services, as well as services provided with MHA resources. They are able to provide an unduplicated number of total children served. Some other states reported children served in the Medicaid system and those served in the MHA system, including those who were eligible for Medicaid. Two kinds of duplications were present, in counts of services and in counts of children served. Some states counted certain services twice. For example, CMHC services to Medicaid eligible children were counted both by Medicaid and the MHA in some states. In other states, no service was counted twice, but a child might be counted in the Medicaid system when receiving a Medicaid covered service, and in the MHA system when receiving a service provided by the MHA. The following table shows the percentage of children reported only in the Medicaid system, those reported both by Medicaid and the MHA, and those reported only by the MHA. It illustrates the differences in states’ use Medicaid and MHA resources, and in how and where they count
Dougherty Management Associates, Inc. Appendix C - Page 75
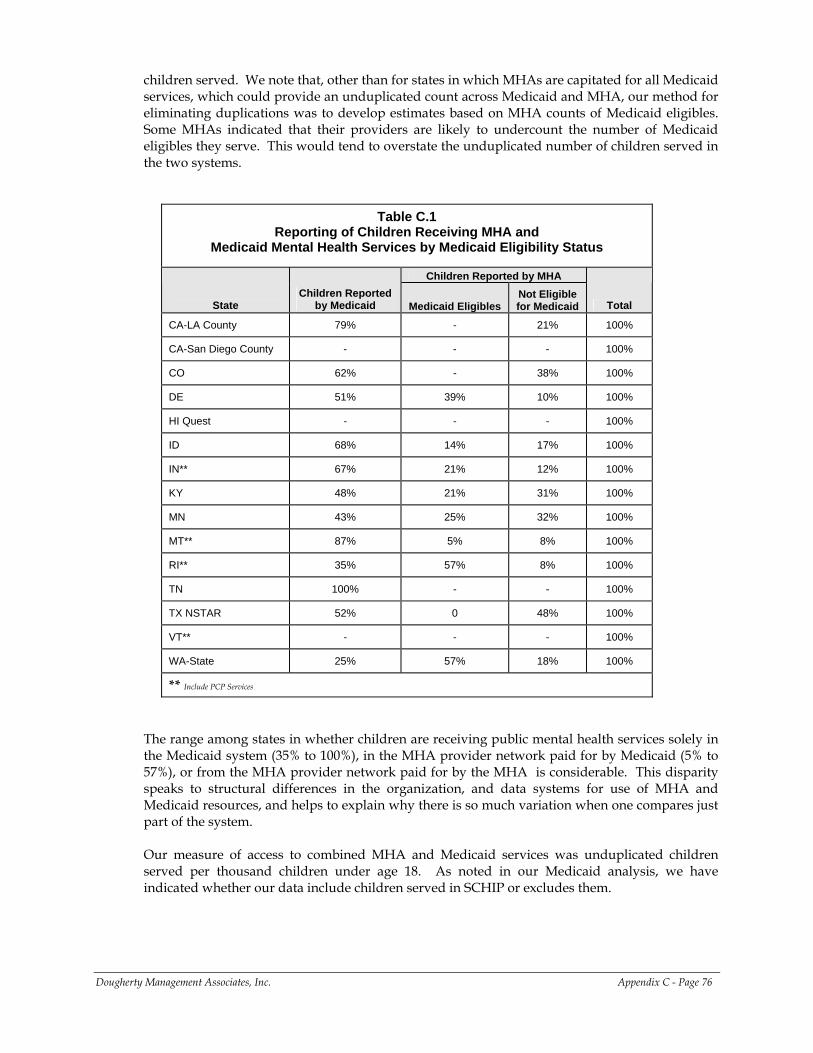
children served. We note that, other than for states in which MHAs are capitated for all Medicaid services, which could provide an unduplicated count across Medicaid and MHA, our method for eliminating duplications was to develop estimates based on MHA counts of Medicaid eligibles. Some MHAs indicated that their providers are likely to undercount the number of Medicaid eligibles they serve. This would tend to overstate the unduplicated number of children served in the two systems.
Table C.1 Reporting of Children Receiving MHA and
Medicaid Mental Health Services by Medicaid Eligibility Status
Children Reported by MHA
State Children Reported
by Medicaid Medicaid Eligibles Not Eligible for Medicaid Total
CA-LA County 79% - 21% 100%
CA-San Diego County - - - 100%
CO 62% - 38% 100%
DE 51% 39% 10% 100%
HI Quest - - - 100%
ID 68% 14% 17% 100%
IN** 67% 21% 12% 100%
KY 48% 21% 31% 100%
MN 43% 25% 32% 100%
MT** 87% 5% 8% 100%
RI** 35% 57% 8% 100%
TN 100% - - 100%
TX NSTAR 52% 0 48% 100%
VT** - - - 100%
WA-State 25% 57% 18% 100%
** Include PCP Services
The range among states in whether children are receiving public mental health services solely in the Medicaid system (35% to 100%), in the MHA provider network paid for by Medicaid (5% to 57%), or from the MHA provider network paid for by the MHA is considerable. This disparity speaks to structural differences in the organization, and data systems for use of MHA and Medicaid resources, and helps to explain why there is so much variation when one compares just part of the system. Our measure of access to combined MHA and Medicaid services was unduplicated children served per thousand children under age 18. As noted in our Medicaid analysis, we have indicated whether our data include children served in SCHIP or excludes them.
Dougherty Management Associates, Inc. Appendix C - Page 76
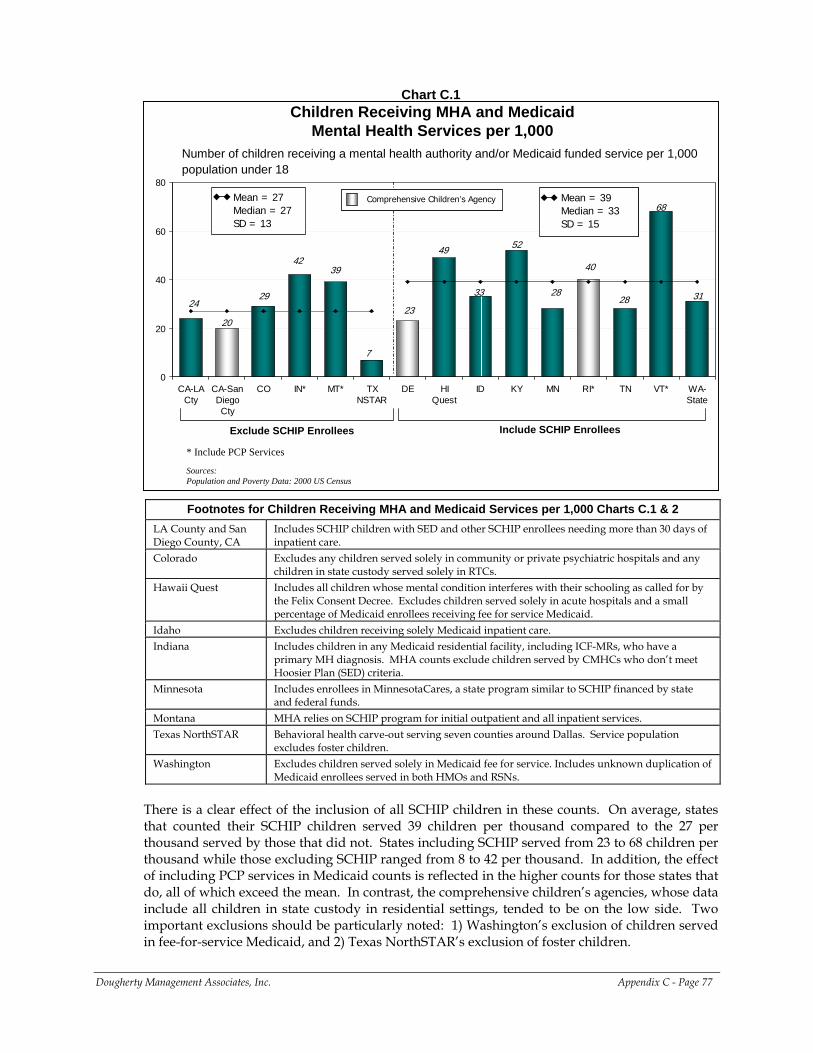
Chart C.1
Number of children receiving a mental health authority and/or Medicaid funded service per 1,000 population under 18
Children Receiving MHA and Medicaid Mental Health Services per 1,000
Sources:Population and Poverty Data: 2000 US Census
20
2829 31
4039
24
49
33
68
23
52
28
7
42
0
20
40
60
80
CA-LACty
CA-SanDiegoCty
CO IN* MT* TXNSTAR
DE HIQuest
ID KY MN RI* TN VT* WA-State
Exclude SCHIP Enrollees Include SCHIP Enrollees
Mean = 27Median = 27SD = 13
Mean = 39Median = 33SD = 15
Mean = 39Median = 33SD = 15
Comprehensive Children’s Agency Comprehensive Children’s Agency
* Include PCP Services
Footnotes for Children Receiving MHA and Medicaid Services per 1,000 Charts C.1 & 2 LA County and San Diego County, CA
Includes SCHIP children with SED and other SCHIP enrollees needing more than 30 days of inpatient care.
Colorado Excludes any children served solely in community or private psychiatric hospitals and any children in state custody served solely in RTCs.
Hawaii Quest Includes all children whose mental condition interferes with their schooling as called for by the Felix Consent Decree. Excludes children served solely in acute hospitals and a small percentage of Medicaid enrollees receiving fee for service Medicaid.
Idaho Excludes children receiving solely Medicaid inpatient care. Indiana Includes children in any Medicaid residential facility, including ICF-MRs, who have a
primary MH diagnosis. MHA counts exclude children served by CMHCs who don’t meet Hoosier Plan (SED) criteria.
Minnesota Includes enrollees in MinnesotaCares, a state program similar to SCHIP financed by state and federal funds.
Montana MHA relies on SCHIP program for initial outpatient and all inpatient services. Texas NorthSTAR Behavioral health carve-out serving seven counties around Dallas. Service population
excludes foster children. Washington Excludes children served solely in Medicaid fee for service. Includes unknown duplication of
Medicaid enrollees served in both HMOs and RSNs. There is a clear effect of the inclusion of all SCHIP children in these counts. On average, states that counted their SCHIP children served 39 children per thousand compared to the 27 per thousand served by those that did not. States including SCHIP served from 23 to 68 children per thousand while those excluding SCHIP ranged from 8 to 42 per thousand. In addition, the effect of including PCP services in Medicaid counts is reflected in the higher counts for those states that do, all of which exceed the mean. In contrast, the comprehensive children’s agencies, whose data include all children in state custody in residential settings, tended to be on the low side. Two important exclusions should be particularly noted: 1) Washington’s exclusion of children served in fee-for-service Medicaid, and 2) Texas NorthSTAR’s exclusion of foster children.
Dougherty Management Associates, Inc. Appendix C - Page 77

For the most part, systems in which both Medicaid and MHA resources are managed by the MHA (the CA counties, Colorado and Tennessee), report somewhat lower levels of children served. Hawaii is an exception, perhaps because it is serving a broad class of children under a consent decree. This finding may reflect, at least in part, the inability to truly eliminate duplicate counting of the same child. While we have tried to eliminate double counting of children by the MHA and Medicaid when the children are served by both systems, there may be some remaining duplication when children are counted by the MHA for a period prior to or after they had Medicaid eligibility (during which time they were reported by Medicaid). This can be a frequent occurrence for Medicaid eligible children. Systems like those in California, Colorado and Tennessee, with a single MIS, can do a better job of following the same child when s/he is Medicaid eligible and when s/he is not. Some of the differences in the proportion of children served may be due to differences in the number of children in poverty in the state. In order to control for this, we have also computed the number of children served per thousand children in the state whose family incomes are under 200% of poverty.
Chart C.2
Number of children receiving a mental health authority and/or Medicaid funded service per 1,000 population under 18 below 200% FPL (Federal Poverty Level)
Children Receiving MHA and Medicaid Mental Health Services per 1,000 Below 200% FPL
Sources:Population and Poverty Data: 2000 US Census
52
10799
96
120
85
49
146
81
212
78
120
68
18
130
0
50
100
150
200
250
CA-LACty
CA-SanDiegoCty
CO IN* MT* TXNSTAR
DE HIQuest
ID KY MN RI* TN VT* WA-State
Exclude SCHIP Enrollees Include SCHIP Enrollees
Mean = 72Median = 69SD = 40
Mean = 72Median = 69SD = 40
Mean = 114Median = 107SD = 44
Mean = 114Median = 107SD = 44
Comprehensive Children’s Agency Comprehensive Children’s Agency
* Include PCP Services
Controlling for poverty rates does not reduce variation, but it does change the relative order of some states. Those like Delaware and Minnesota, which are relatively wealthy, move from the bottom of the range toward the mean, while those like Tennessee and Idaho, with relatively more poor children, move from near the mean toward the bottom of the range. Combining Medicaid and MHA data provides a fairer comparison among states than looking at either system alone.
Dougherty Management Associates, Inc. Appendix C - Page 78
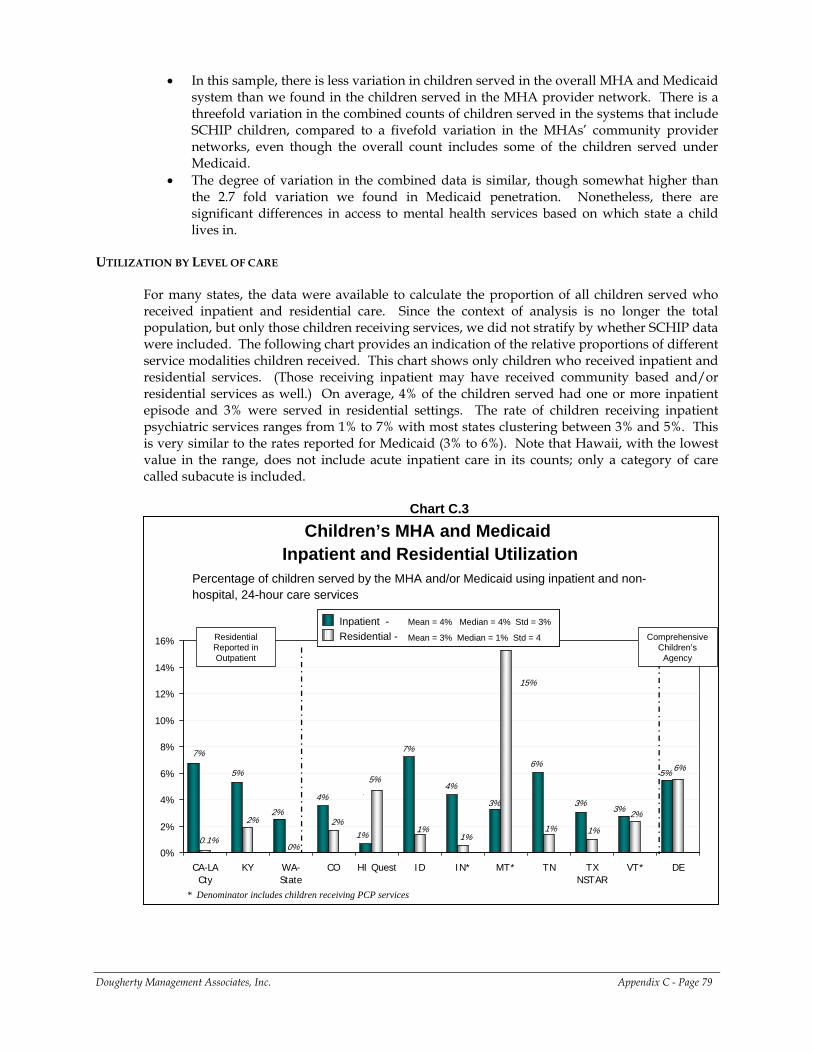
• In this sample, there is less variation in children served in the overall MHA and Medicaid system than we found in the children served in the MHA provider network. There is a threefold variation in the combined counts of children served in the systems that include SCHIP children, compared to a fivefold variation in the MHAs’ community provider networks, even though the overall count includes some of the children served under Medicaid.
• The degree of variation in the combined data is similar, though somewhat higher than the 2.7 fold variation we found in Medicaid penetration. Nonetheless, there are significant differences in access to mental health services based on which state a child lives in.
UTILIZATION BY LEVEL OF CARE
For many states, the data were available to calculate the proportion of all children served who received inpatient and residential care. Since the context of analysis is no longer the total population, but only those children receiving services, we did not stratify by whether SCHIP data were included. The following chart provides an indication of the relative proportions of different service modalities children received. This chart shows only children who received inpatient and residential services. (Those receiving inpatient may have received community based and/or residential services as well.) On average, 4% of the children served had one or more inpatient episode and 3% were served in residential settings. The rate of children receiving inpatient psychiatric services ranges from 1% to 7% with most states clustering between 3% and 5%. This is very similar to the rates reported for Medicaid (3% to 6%). Note that Hawaii, with the lowest value in the range, does not include acute inpatient care in its counts; only a category of care called subacute is included.
Chart C.3
Percentage of children served by the MHA and/or Medicaid using inpatient and non-hospital, 24-hour care services
Children’s MHA and MedicaidInpatient and Residential Utilization
4%3%2%
5%
7%7%
4%5%
6%
3%
1%
3%
6%
1%1%
15%
1%
0%0.1%
2%
5%
2%2%
1%
0%
2%
4%
6%
8%
10%
12%
14%
16%
CA-LACty
KY WA-State
CO HI Quest ID IN* MT* TN TXNSTAR
VT* DE
Residential Reported in Outpatient
Comprehensive Children’s
Agency
Inpatient -Residential - Mean = 3% Median = 1% Std = 4
Mean = 4% Median = 4% Std = 3%Inpatient -Residential - Mean = 3% Median = 1% Std = 4
Inpatient -Residential - Mean = 3% Median = 1% Std = 4
Mean = 4% Median = 4% Std = 3%
* Denominator includes children receiving PCP services
Dougherty Management Associates, Inc. Appendix C - Page 79
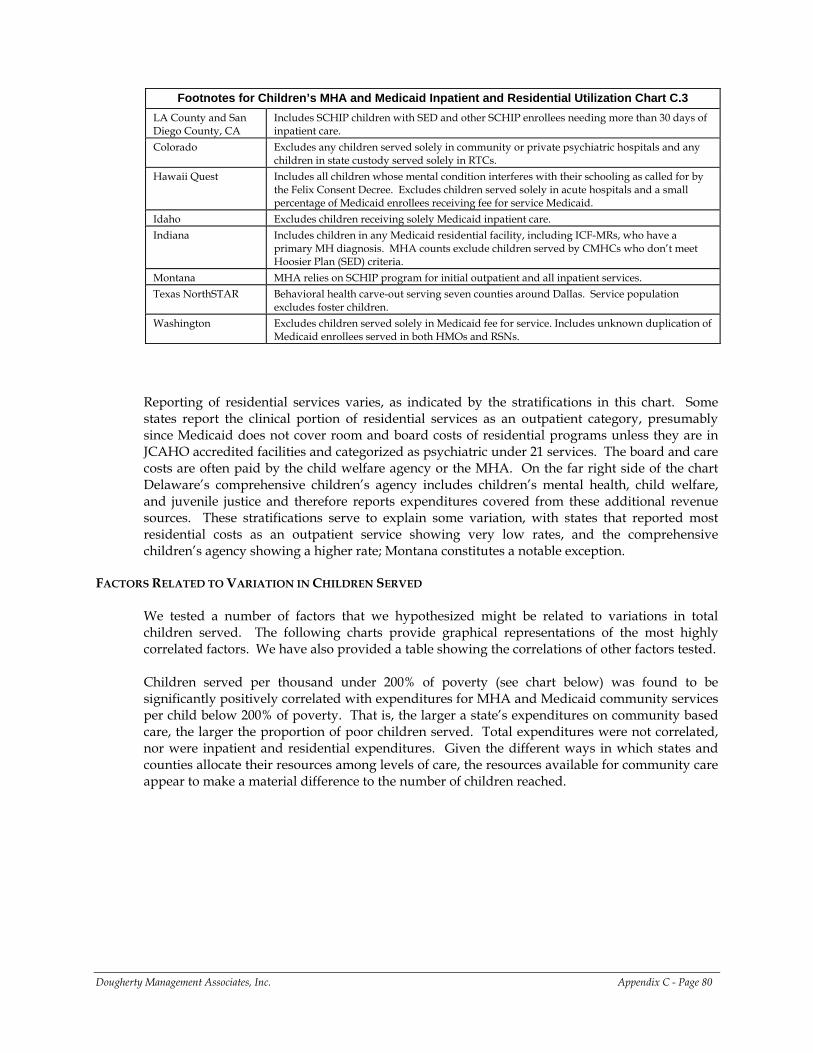
Footnotes for Children’s MHA and Medicaid Inpatient and Residential Utilization Chart C.3
LA County and San Diego County, CA
Includes SCHIP children with SED and other SCHIP enrollees needing more than 30 days of inpatient care.
Colorado Excludes any children served solely in community or private psychiatric hospitals and any children in state custody served solely in RTCs.
Hawaii Quest Includes all children whose mental condition interferes with their schooling as called for by the Felix Consent Decree. Excludes children served solely in acute hospitals and a small percentage of Medicaid enrollees receiving fee for service Medicaid.
Idaho Excludes children receiving solely Medicaid inpatient care. Indiana Includes children in any Medicaid residential facility, including ICF-MRs, who have a
primary MH diagnosis. MHA counts exclude children served by CMHCs who don’t meet Hoosier Plan (SED) criteria.
Montana MHA relies on SCHIP program for initial outpatient and all inpatient services. Texas NorthSTAR Behavioral health carve-out serving seven counties around Dallas. Service population
excludes foster children. Washington Excludes children served solely in Medicaid fee for service. Includes unknown duplication of
Medicaid enrollees served in both HMOs and RSNs. Reporting of residential services varies, as indicated by the stratifications in this chart. Some states report the clinical portion of residential services as an outpatient category, presumably since Medicaid does not cover room and board costs of residential programs unless they are in JCAHO accredited facilities and categorized as psychiatric under 21 services. The board and care costs are often paid by the child welfare agency or the MHA. On the far right side of the chart Delaware’s comprehensive children’s agency includes children’s mental health, child welfare, and juvenile justice and therefore reports expenditures covered from these additional revenue sources. These stratifications serve to explain some variation, with states that reported most residential costs as an outpatient service showing very low rates, and the comprehensive children’s agency showing a higher rate; Montana constitutes a notable exception.
FACTORS RELATED TO VARIATION IN CHILDREN SERVED
We tested a number of factors that we hypothesized might be related to variations in total children served. The following charts provide graphical representations of the most highly correlated factors. We have also provided a table showing the correlations of other factors tested. Children served per thousand under 200% of poverty (see chart below) was found to be significantly positively correlated with expenditures for MHA and Medicaid community services per child below 200% of poverty. That is, the larger a state’s expenditures on community based care, the larger the proportion of poor children served. Total expenditures were not correlated, nor were inpatient and residential expenditures. Given the different ways in which states and counties allocate their resources among levels of care, the resources available for community care appear to make a material difference to the number of children reached.
Dougherty Management Associates, Inc. Appendix C - Page 80
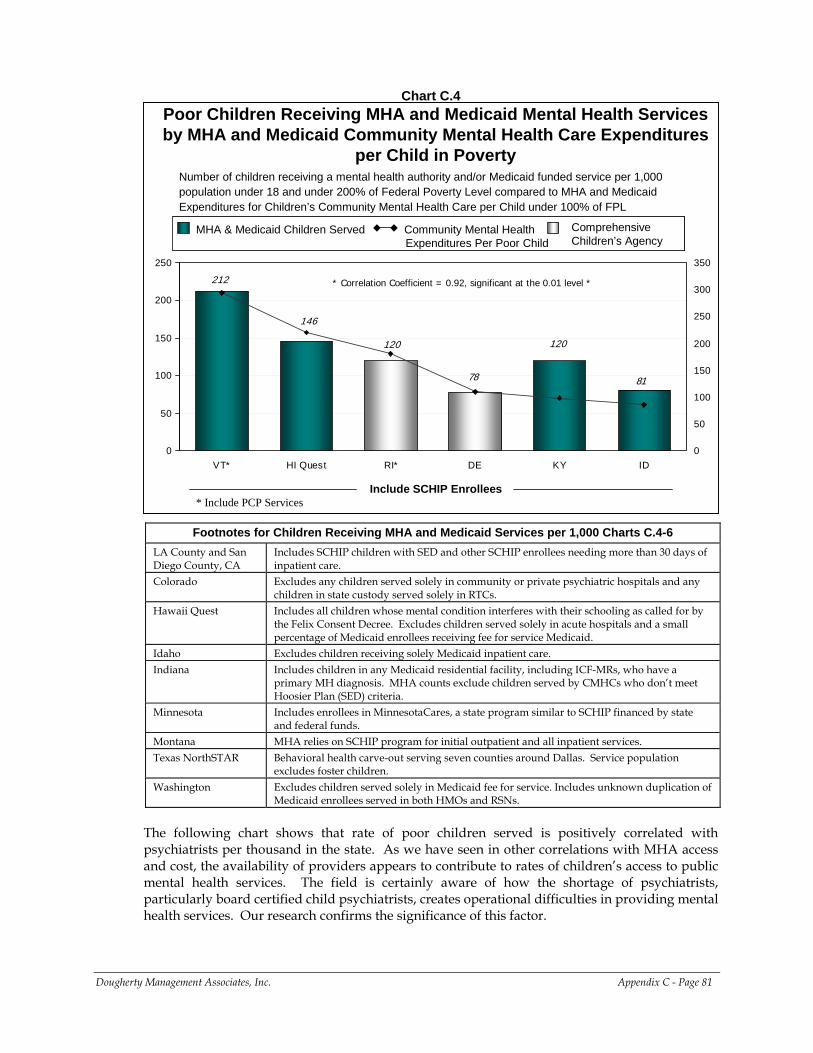
Chart C.4
Number of children receiving a mental health authority and/or Medicaid funded service per 1,000 population under 18 and under 200% of Federal Poverty Level compared to MHA and Medicaid Expenditures for Children’s Community Mental Health Care per Child under 100% of FPL
Poor Children Receiving MHA and Medicaid Mental Health Services by MHA and Medicaid Community Mental Health Care Expenditures
per Child in Poverty
78 81
212
120120
146
0
50
100
150
200
250
VT* HI Quest RI* DE KY ID0
50
100
150
200
250
300
350
Include SCHIP Enrollees
MHA & Medicaid Children Served Community Mental Health Expenditures Per Poor Child
Comprehensive Children’s Agency
MHA & Medicaid Children Served Community Mental Health Expenditures Per Poor Child
Comprehensive Children’s Agency
* Correlation Coefficient = 0.92, significant at the 0.01 level *
* Include PCP Services
Footnotes for Children Receiving MHA and Medicaid Services per 1,000 Charts C.4-6 LA County and San Diego County, CA
Includes SCHIP children with SED and other SCHIP enrollees needing more than 30 days of inpatient care.
Colorado Excludes any children served solely in community or private psychiatric hospitals and any children in state custody served solely in RTCs.
Hawaii Quest Includes all children whose mental condition interferes with their schooling as called for by the Felix Consent Decree. Excludes children served solely in acute hospitals and a small percentage of Medicaid enrollees receiving fee for service Medicaid.
Idaho Excludes children receiving solely Medicaid inpatient care. Indiana Includes children in any Medicaid residential facility, including ICF-MRs, who have a
primary MH diagnosis. MHA counts exclude children served by CMHCs who don’t meet Hoosier Plan (SED) criteria.
Minnesota Includes enrollees in MinnesotaCares, a state program similar to SCHIP financed by state and federal funds.
Montana MHA relies on SCHIP program for initial outpatient and all inpatient services. Texas NorthSTAR Behavioral health carve-out serving seven counties around Dallas. Service population
excludes foster children. Washington Excludes children served solely in Medicaid fee for service. Includes unknown duplication of
Medicaid enrollees served in both HMOs and RSNs. The following chart shows that rate of poor children served is positively correlated with psychiatrists per thousand in the state. As we have seen in other correlations with MHA access and cost, the availability of providers appears to contribute to rates of children’s access to public mental health services. The field is certainly aware of how the shortage of psychiatrists, particularly board certified child psychiatrists, creates operational difficulties in providing mental health services. Our research confirms the significance of this factor.
Dougherty Management Associates, Inc. Appendix C - Page 81
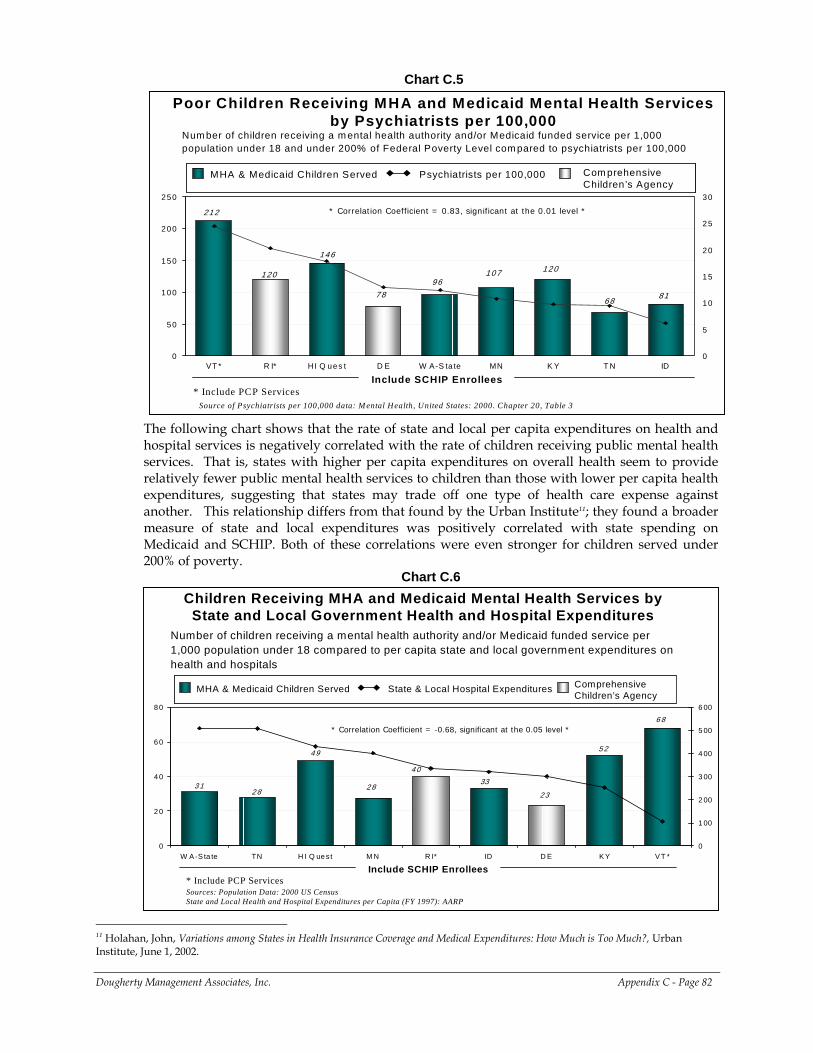
Chart C.5
Num ber of children receiving a m ental health authority and/or Medicaid funded service per 1,000 population under 18 and under 200% of Federal Poverty Level com pared to psychiatrists per 100,000
Poor Children Receiving MHA and Medicaid Mental Health Services by Psychiatrists per 100,000
120
146
96
212
6881
120107
78
0
50
100
150
200
250
VT * R I* H I Q ues t D E W A-S ta te MN K Y T N ID0
5
10
15
20
25
30
Include SCHIP Enrollees
MHA & Medicaid Children Served Psychiatrists per 100,000 Com prehensive Children’s Agency
MHA & Medicaid Children Served Psychiatrists per 100,000 Com prehensive Children’s Agency
Source of Psychiatrists per 100,000 data: M ental Health, United States: 2000. Chapter 20, Table 3
* Correlation Coefficient = 0.83, significant at the 0.01 level *
* Include PCP Services
The following chart shows that the rate of state and local per capita expenditures on health and hospital services is negatively correlated with the rate of children receiving public mental health services. That is, states with higher per capita expenditures on overall health seem to provide relatively fewer public mental health services to children than those with lower per capita health expenditures, suggesting that states may trade off one type of health care expense against another. This relationship differs from that found by the Urban Institute11; they found a broader measure of state and local expenditures was positively correlated with state spending on Medicaid and SCHIP. Both of these correlations were even stronger for children served under 200% of poverty.
Chart C.6
Number of children receiving a mental health authority and/or Medicaid funded service per 1,000 population under 18 compared to per capita state and local government expenditures on health and hospitals
2833
23
6 8
5 2
3 1
4 0
49
2 8
0
20
40
60
80
W A -S ta te TN H I Q ue st M N R I* ID D E K Y V T *0
1 00
2 00
3 00
4 00
5 00
6 00
Include SCHIP Enrollees
MHA & Medicaid Children Served State & Local Hospital Expenditures Comprehensive Children’s Agency
MHA & Medicaid Children Served State & Local Hospital Expenditures Comprehensive Children’s Agency
Sources: Population Data: 2000 US CensusState and Local Health and Hospital Expenditures per Capita (FY 1997): AARP
Children Receiving MHA and Medicaid Mental Health Services by State and Local Government Health and Hospital Expenditures
* Correlation Coefficient = -0.68, significant at the 0.05 level *
* Include PCP Services
Dougherty Management Associates, Inc. Appendix C - Page 82
11 Holahan, John, Variations among States in Health Insurance Coverage and Medical Expenditures: How Much is Too Much?, Urban Institute, June 1, 2002.
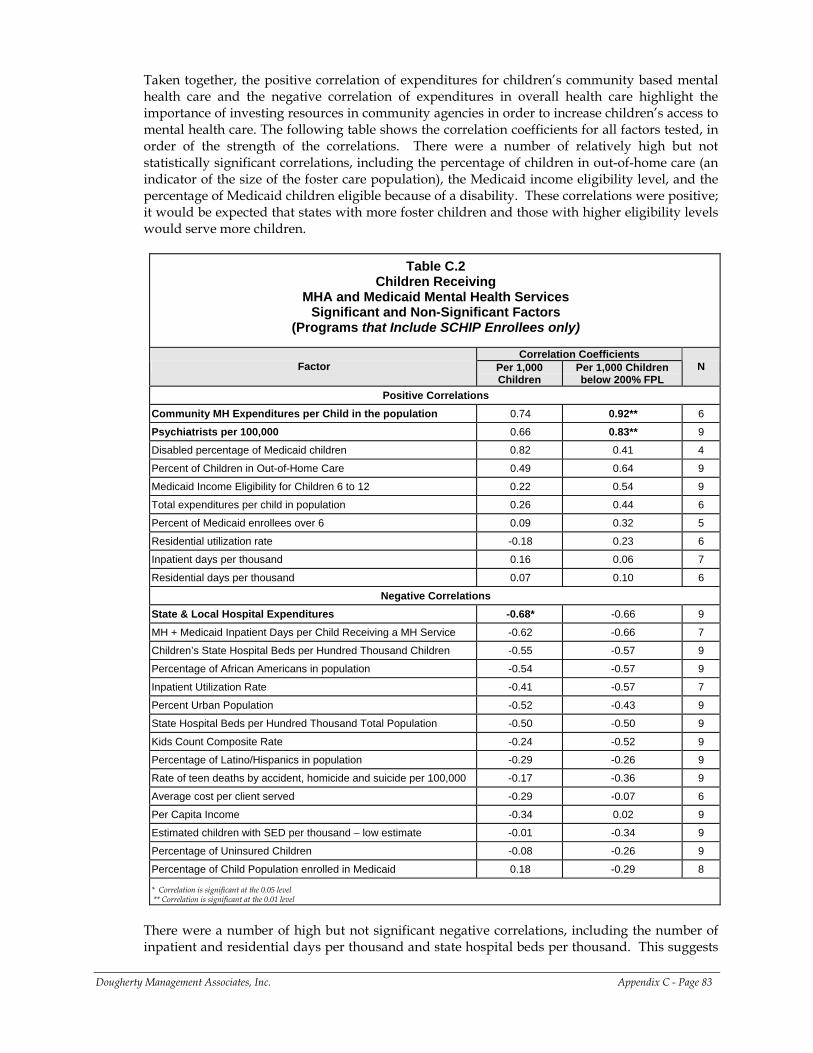
Taken together, the positive correlation of expenditures for children’s community based mental health care and the negative correlation of expenditures in overall health care highlight the importance of investing resources in community agencies in order to increase children’s access to mental health care. The following table shows the correlation coefficients for all factors tested, in order of the strength of the correlations. There were a number of relatively high but not statistically significant correlations, including the percentage of children in out-of-home care (an indicator of the size of the foster care population), the Medicaid income eligibility level, and the percentage of Medicaid children eligible because of a disability. These correlations were positive; it would be expected that states with more foster children and those with higher eligibility levels would serve more children.
Table C.2 Children Receiving
MHA and Medicaid Mental Health Services Significant and Non-Significant Factors
(Programs that Include SCHIP Enrollees only)
Correlation Coefficients Factor Per 1,000
Children Per 1,000 Children below 200% FPL
N
Positive Correlations Community MH Expenditures per Child in the population 0.74 0.92** 6
Psychiatrists per 100,000 0.66 0.83** 9
Disabled percentage of Medicaid children 0.82 0.41 4
Percent of Children in Out-of-Home Care 0.49 0.64 9
Medicaid Income Eligibility for Children 6 to 12 0.22 0.54 9
Total expenditures per child in population 0.26 0.44 6
Percent of Medicaid enrollees over 6 0.09 0.32 5
Residential utilization rate -0.18 0.23 6
Inpatient days per thousand 0.16 0.06 7
Residential days per thousand 0.07 0.10 6
Negative Correlations State & Local Hospital Expenditures -0.68* -0.66 9
MH + Medicaid Inpatient Days per Child Receiving a MH Service -0.62 -0.66 7
Children’s State Hospital Beds per Hundred Thousand Children -0.55 -0.57 9
Percentage of African Americans in population -0.54 -0.57 9
Inpatient Utilization Rate -0.41 -0.57 7
Percent Urban Population -0.52 -0.43 9
State Hospital Beds per Hundred Thousand Total Population -0.50 -0.50 9
Kids Count Composite Rate -0.24 -0.52 9
Percentage of Latino/Hispanics in population -0.29 -0.26 9
Rate of teen deaths by accident, homicide and suicide per 100,000 -0.17 -0.36 9
Average cost per client served -0.29 -0.07 6
Per Capita Income -0.34 0.02 9
Estimated children with SED per thousand – low estimate -0.01 -0.34 9
Percentage of Uninsured Children -0.08 -0.26 9
Percentage of Child Population enrolled in Medicaid 0.18 -0.29 8 * Correlation is significant at the 0.05 level ** Correlation is significant at the 0.01 level
There were a number of high but not significant negative correlations, including the number of inpatient and residential days per thousand and state hospital beds per thousand. This suggests
Dougherty Management Associates, Inc. Appendix C - Page 83
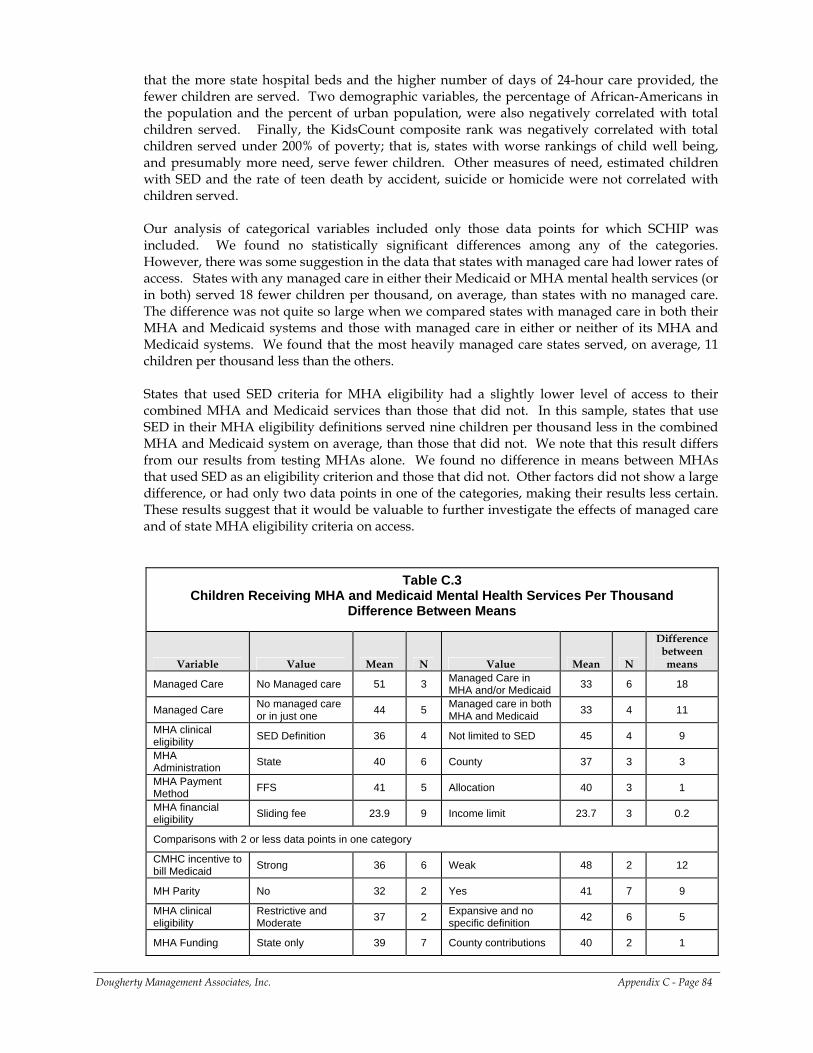
that the more state hospital beds and the higher number of days of 24-hour care provided, the fewer children are served. Two demographic variables, the percentage of African-Americans in the population and the percent of urban population, were also negatively correlated with total children served. Finally, the KidsCount composite rank was negatively correlated with total children served under 200% of poverty; that is, states with worse rankings of child well being, and presumably more need, serve fewer children. Other measures of need, estimated children with SED and the rate of teen death by accident, suicide or homicide were not correlated with children served. Our analysis of categorical variables included only those data points for which SCHIP was included. We found no statistically significant differences among any of the categories. However, there was some suggestion in the data that states with managed care had lower rates of access. States with any managed care in either their Medicaid or MHA mental health services (or in both) served 18 fewer children per thousand, on average, than states with no managed care. The difference was not quite so large when we compared states with managed care in both their MHA and Medicaid systems and those with managed care in either or neither of its MHA and Medicaid systems. We found that the most heavily managed care states served, on average, 11 children per thousand less than the others. States that used SED criteria for MHA eligibility had a slightly lower level of access to their combined MHA and Medicaid services than those that did not. In this sample, states that use SED in their MHA eligibility definitions served nine children per thousand less in the combined MHA and Medicaid system on average, than those that did not. We note that this result differs from our results from testing MHAs alone. We found no difference in means between MHAs that used SED as an eligibility criterion and those that did not. Other factors did not show a large difference, or had only two data points in one of the categories, making their results less certain. These results suggest that it would be valuable to further investigate the effects of managed care and of state MHA eligibility criteria on access.
Table C.3 Children Receiving MHA and Medicaid Mental Health Services Per Thousand
Difference Between Means
Variable Value Mean N Value Mean N
Difference between means
Managed Care No Managed care 51 3 Managed Care in MHA and/or Medicaid 33 6 18
Managed Care No managed care or in just one 44 5 Managed care in both
MHA and Medicaid 33 4 11
MHA clinical eligibility SED Definition 36 4 Not limited to SED 45 4 9
MHA Administration State 40 6 County 37 3 3
MHA Payment Method FFS 41 5 Allocation 40 3 1
MHA financial eligibility Sliding fee 23.9 9 Income limit 23.7 3 0.2
Comparisons with 2 or less data points in one category
CMHC incentive to bill Medicaid Strong 36 6 Weak 48 2 12
MH Parity No 32 2 Yes 41 7 9
MHA clinical eligibility
Restrictive and Moderate 37 2 Expansive and no
specific definition 42 6 5
MHA Funding State only 39 7 County contributions 40 2 1
Dougherty Management Associates, Inc. Appendix C - Page 84
Looking at both the MHA and Medicaid children’s mental health service system requires adjustment to eliminate double counting of children served in both systems. This is not an easy exercise. It does, however, provide a more complete picture of children’s mental health services than looking at the MHA or Medicaid systems alone even though important segments of the children’s mental health system – namely residential services for children in state custody and services provided by schools – are differentially included. In addition, we sought to eliminate a number of between state differences in how MHA and Medicaid resources are combined, such as the inclusion of SCHIP and PCP services, providing a fairer comparison. However, the comparisons continue to show three-fold differences between the bottom and top of the range of children served. We conclude that there are significant disparities in access to children’s mental health services based on geography. We identified three factors significantly related to differences in access among those states that include SCHIP children. These include the availability of psychiatry, state and local expenditures on health and hospitals and the rate of community mental health expenditures per child. .
CHILDREN’S MENTAL HEALTH SERVICE EXPENDITURES
We calculated total combined Medicaid plus MHA service expenditures for children’s mental health services. The amount spent per child in the population was calculated, providing an indication of the relative resources available per child in the population. We have again distinguished between states in which our data include all Medicaid, SCHIP and MHA resources, and those in which data from a separate SCHIP program have not been included.
• Not surprisingly, the average spent by states that include SCHIP resources is higher than the average expenditures by the states or counties that do not.
• It is also important to note the three programs that include mental health services provided by PCPs are the highest in their respective categories, reflecting the fact that a greater number of services have been included.
• We also note that Hawaii Quest, in the year reported, was mandated to serve a broad class of children under the Felix Consent decree. Serving more children, they also increased the relative resources used.
• Finally, as noted above, both Rhode Island’s and Delaware’s MHAs are components of comprehensive children’s agencies. Their expenditures therefore include the costs of residential placements for children in state custody, including those costs covered by Title IVE and state child welfare funds. In most states, the contributions of the child welfare agency and Title IVE are not reported by the MHA or Medicaid, but instead would be shown in the budget of a separate child welfare agency.
Dougherty Management Associates, Inc. Appendix C - Page 85
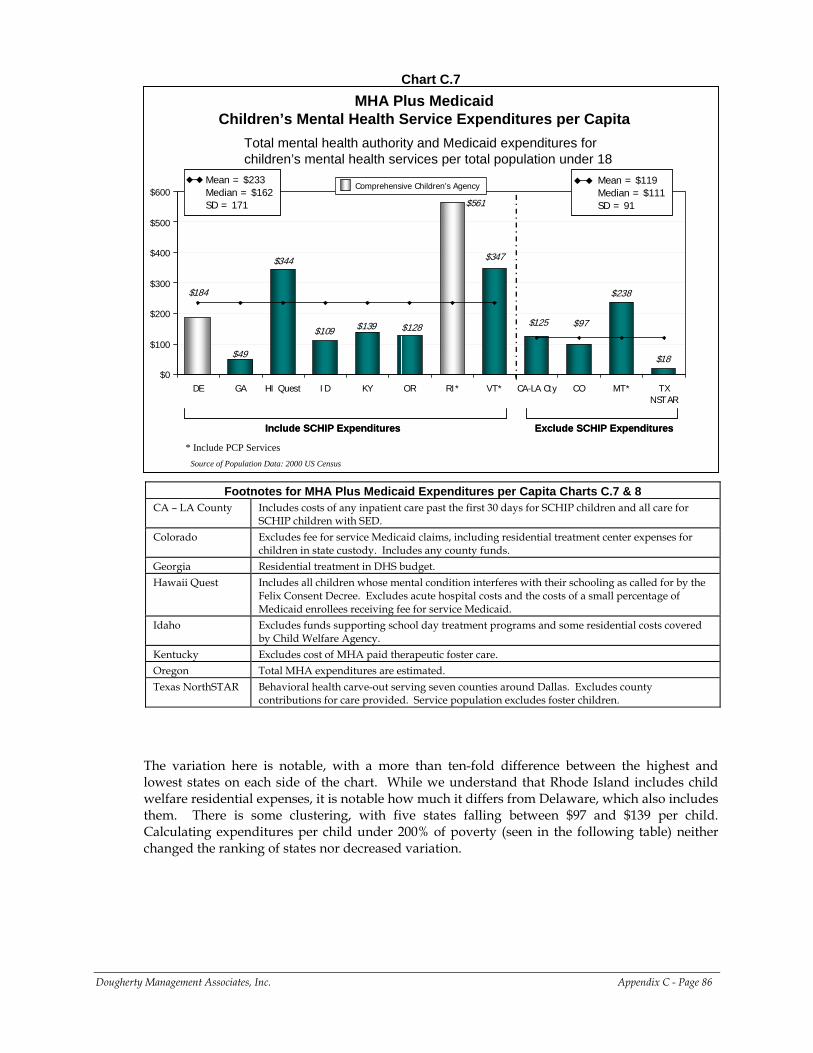
Chart C.7
MHA Plus Medicaid Children’s Mental Health Service Expenditures per Capita
$139
$238
$97
$18
$125
$561
$347$344
$49
$128
$184
$109
$0
$100
$200
$300
$400
$500
$600
DE GA HI Quest ID KY OR RI* VT* CA-LA Cty CO MT* TXNSTAR
Mean = $233Median = $162SD = 171
Mean = $233Median = $162SD = 171
Mean = $119Median = $111 SD = 91
Mean = $119Median = $111 SD = 91
Include SCHIP Expenditures Exclude SCHIP ExpendituresInclude SCHIP Expenditures Exclude SCHIP Expenditures
Source of Population Data: 2000 US Census
Total mental health authority and Medicaid expenditures for children’s mental health services per total population under 18
* Include PCP Services
Comprehensive Children’s Agency
Footnotes for MHA Plus Medicaid Expenditures per Capita Charts C.7 & 8 CA – LA County Includes costs of any inpatient care past the first 30 days for SCHIP children and all care for
SCHIP children with SED. Colorado Excludes fee for service Medicaid claims, including residential treatment center expenses for
children in state custody. Includes any county funds. Georgia Residential treatment in DHS budget. Hawaii Quest Includes all children whose mental condition interferes with their schooling as called for by the
Felix Consent Decree. Excludes acute hospital costs and the costs of a small percentage of Medicaid enrollees receiving fee for service Medicaid.
Idaho Excludes funds supporting school day treatment programs and some residential costs covered by Child Welfare Agency.
Kentucky Excludes cost of MHA paid therapeutic foster care. Oregon Total MHA expenditures are estimated. Texas NorthSTAR Behavioral health carve-out serving seven counties around Dallas. Excludes county
contributions for care provided. Service population excludes foster children.
The variation here is notable, with a more than ten-fold difference between the highest and lowest states on each side of the chart. While we understand that Rhode Island includes child welfare residential expenses, it is notable how much it differs from Delaware, which also includes them. There is some clustering, with five states falling between $97 and $139 per child. Calculating expenditures per child under 200% of poverty (seen in the following table) neither changed the ranking of states nor decreased variation.
Dougherty Management Associates, Inc. Appendix C - Page 86
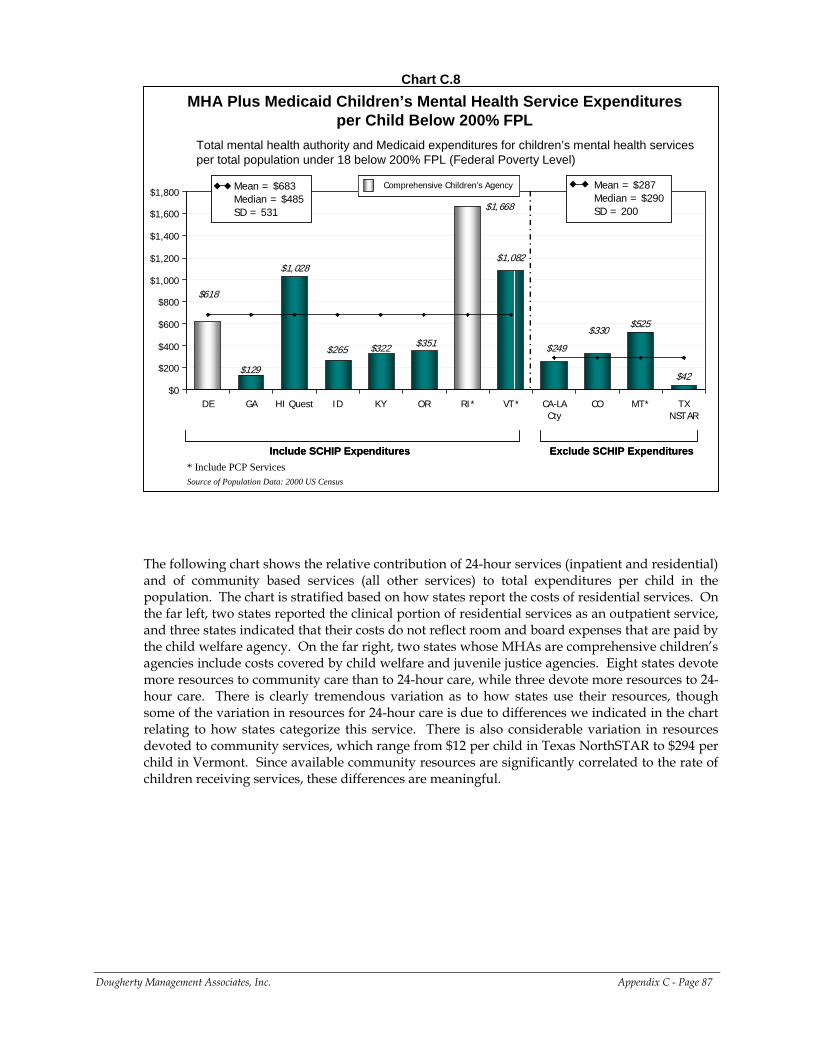
Chart C.8
MHA Plus Medicaid Children’s Mental Health Service Expenditures per Child Below 200% FPL
$322
$525$330
$42
$249
$1,668
$1,082$1,028
$129
$351
$618
$265
$0
$200
$400
$600
$800
$1,000
$1,200
$1,400
$1,600
$1,800
DE GA HI Quest ID KY OR RI* VT* CA-LACty
CO MT* TXNSTAR
Mean = $683Median = $485SD = 531
Mean = $683Median = $485SD = 531
Mean = $287Median = $290SD = 200
Mean = $287Median = $290SD = 200
Include SCHIP Expenditures Exclude SCHIP ExpendituresInclude SCHIP Expenditures Exclude SCHIP Expenditures
Source of Population Data: 2000 US Census
Total mental health authority and Medicaid expenditures for children’s mental health services per total population under 18 below 200% FPL (Federal Poverty Level)
* Include PCP Services
Comprehensive Children’s Agency Comprehensive Children’s Agency
The following chart shows the relative contribution of 24-hour services (inpatient and residential) and of community based services (all other services) to total expenditures per child in the population. The chart is stratified based on how states report the costs of residential services. On the far left, two states reported the clinical portion of residential services as an outpatient service, and three states indicated that their costs do not reflect room and board expenses that are paid by the child welfare agency. On the far right, two states whose MHAs are comprehensive children’s agencies include costs covered by child welfare and juvenile justice agencies. Eight states devote more resources to community care than to 24-hour care, while three devote more resources to 24-hour care. There is clearly tremendous variation as to how states use their resources, though some of the variation in resources for 24-hour care is due to differences we indicated in the chart relating to how states categorize this service. There is also considerable variation in resources devoted to community services, which range from $12 per child in Texas NorthSTAR to $294 per child in Vermont. Since available community resources are significantly correlated to the rate of children receiving services, these differences are meaningful.
Dougherty Management Associates, Inc. Appendix C - Page 87
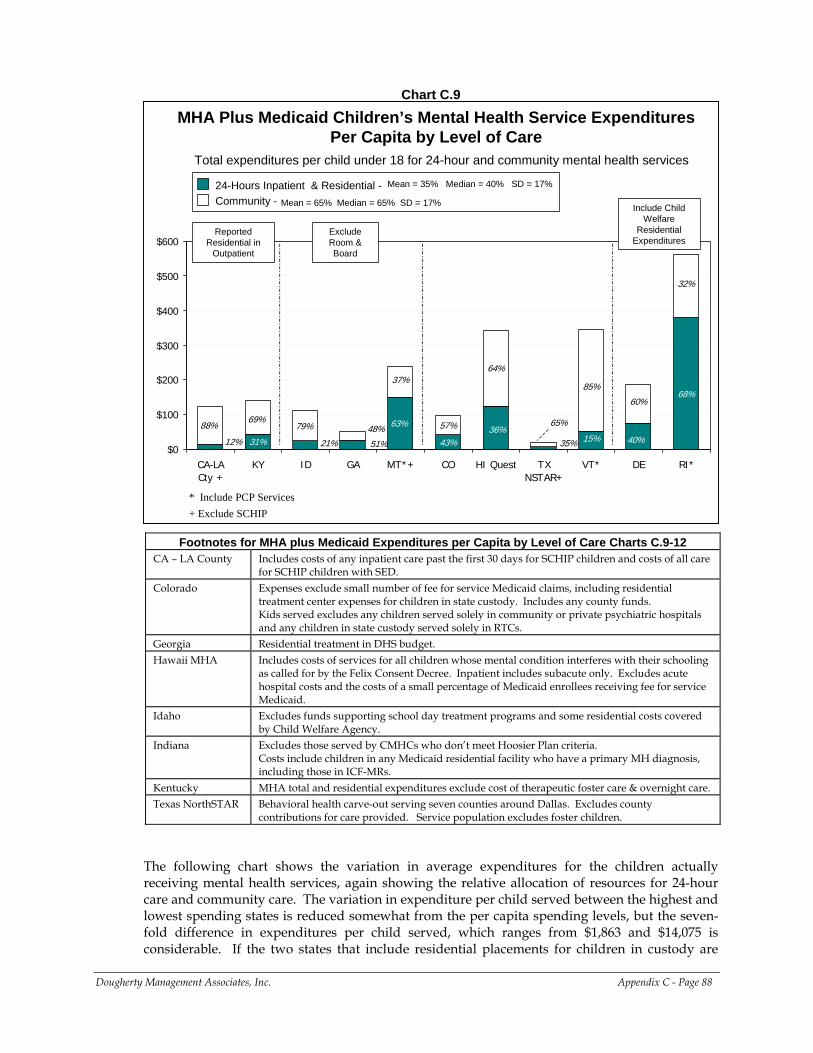
Chart C.9
Total expenditures per child under 18 for 24-hour and community mental health services
MHA Plus Medicaid Children’s Mental Health Service Expenditures Per Capita by Level of Care
63% 65%
21% 51% 40%15%31%
68%
43%12%36%
35%
79%88%
64%
69%48%
37%
32%
57%
60%
85%
$0
$100
$200
$300
$400
$500
$600
CA-LACty +
KY ID GA MT*+ CO HI Quest TXNSTAR+
VT* DE RI*
Reported Residential in
Outpatient
Exclude Room & Board
Include Child Welfare
Residential Expenditures
24-Hours Inpatient & Residential -Community - Mean = 65% Median = 65% SD = 17%
Mean = 35% Median = 40% SD = 17%
* Include PCP Services+ Exclude SCHIP
Footnotes for MHA plus Medicaid Expenditures per Capita by Level of Care Charts C.9-12 CA – LA County Includes costs of any inpatient care past the first 30 days for SCHIP children and costs of all care
for SCHIP children with SED. Colorado Expenses exclude small number of fee for service Medicaid claims, including residential
treatment center expenses for children in state custody. Includes any county funds. Kids served excludes any children served solely in community or private psychiatric hospitals and any children in state custody served solely in RTCs.
Georgia Residential treatment in DHS budget. Hawaii MHA Includes costs of services for all children whose mental condition interferes with their schooling
as called for by the Felix Consent Decree. Inpatient includes subacute only. Excludes acute hospital costs and the costs of a small percentage of Medicaid enrollees receiving fee for service Medicaid.
Idaho Excludes funds supporting school day treatment programs and some residential costs covered by Child Welfare Agency.
Indiana Excludes those served by CMHCs who don’t meet Hoosier Plan criteria. Costs include children in any Medicaid residential facility who have a primary MH diagnosis, including those in ICF-MRs.
Kentucky MHA total and residential expenditures exclude cost of therapeutic foster care & overnight care. Texas NorthSTAR Behavioral health carve-out serving seven counties around Dallas. Excludes county
contributions for care provided. Service population excludes foster children.
Dougherty Management Associates, Inc. Appendix C - Page 88
The following chart shows the variation in average expenditures for the children actually receiving mental health services, again showing the relative allocation of resources for 24-hour care and community care. The variation in expenditure per child served between the highest and lowest spending states is reduced somewhat from the per capita spending levels, but the seven-fold difference in expenditures per child served, which ranges from $1,863 and $14,075 is considerable. If the two states that include residential placements for children in custody are
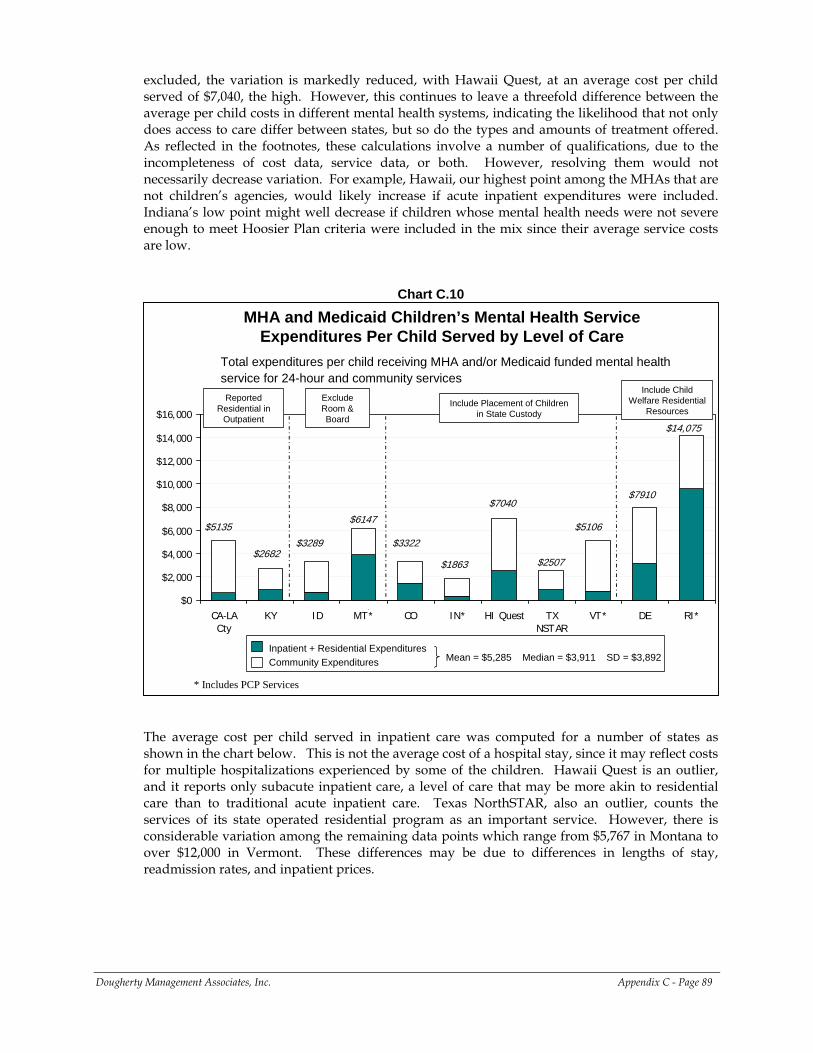
excluded, the variation is markedly reduced, with Hawaii Quest, at an average cost per child served of $7,040, the high. However, this continues to leave a threefold difference between the average per child costs in different mental health systems, indicating the likelihood that not only does access to care differ between states, but so do the types and amounts of treatment offered. As reflected in the footnotes, these calculations involve a number of qualifications, due to the incompleteness of cost data, service data, or both. However, resolving them would not necessarily decrease variation. For example, Hawaii, our highest point among the MHAs that are not children’s agencies, would likely increase if acute inpatient expenditures were included. Indiana’s low point might well decrease if children whose mental health needs were not severe enough to meet Hoosier Plan criteria were included in the mix since their average service costs are low.
Chart C.10
MHA and Medicaid Children’s Mental Health Service Expenditures Per Child Served by Level of Care
Total expenditures per child receiving MHA and/or Medicaid funded mental health service for 24-hour and community services
$0
$2,000
$4,000
$6,000
$8,000
$10,000
$12,000
$14,000
$16,000
CA-LACty
KY ID MT* CO IN* HI Quest TXNSTAR
VT* DE RI*
Reported Residential in
Outpatient
Exclude Room & Board
Include Child Welfare Residential
Resources
$5135
$2682$3289
$6147
$7910$7040
$2507
$5106$3322
$1863
$14,075
Include Placement of Children in State Custody
Inpatient + Residential ExpendituresCommunity Expenditures Mean = $5,285 Median = $3,911 SD = $3,892
* Includes PCP Services
The average cost per child served in inpatient care was computed for a number of states as shown in the chart below. This is not the average cost of a hospital stay, since it may reflect costs for multiple hospitalizations experienced by some of the children. Hawaii Quest is an outlier, and it reports only subacute inpatient care, a level of care that may be more akin to residential care than to traditional acute inpatient care. Texas NorthSTAR, also an outlier, counts the services of its state operated residential program as an important service. However, there is considerable variation among the remaining data points which range from $5,767 in Montana to over $12,000 in Vermont. These differences may be due to differences in lengths of stay, readmission rates, and inpatient prices.
Dougherty Management Associates, Inc. Appendix C - Page 89
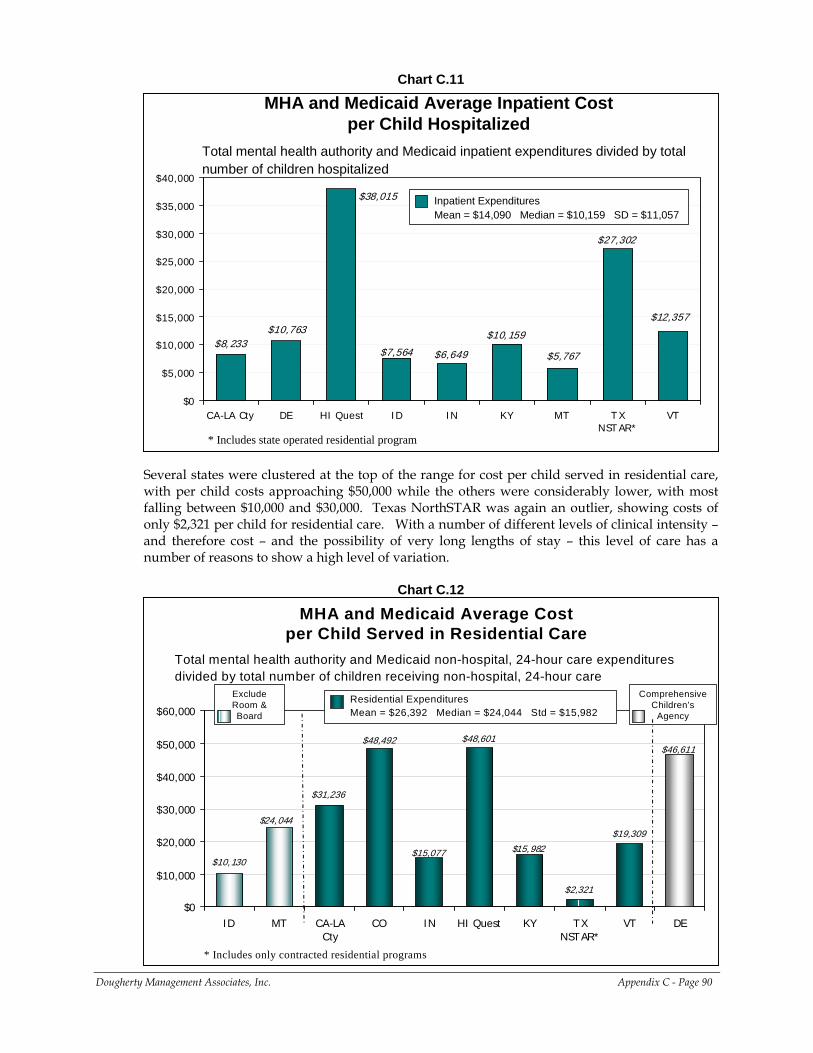
Chart C.11
MHA and Medicaid Average Inpatient Cost per Child Hospitalized
Total mental health authority and Medicaid inpatient expenditures divided by total number of children hospitalized
$6,649
$10,159
$27,302
$12,357
$7,564
$38,015
$10,763
$5,767$8,233
$0
$5,000
$10,000
$15,000
$20,000
$25,000
$30,000
$35,000
$40,000
CA-LA Cty DE HI Quest ID IN KY MT T XNST AR*
VT
Inpatient ExpendituresMean = $14,090 Median = $10,159 SD = $11,057
* Includes state operated residential program
Several states were clustered at the top of the range for cost per child served in residential care, with per child costs approaching $50,000 while the others were considerably lower, with most falling between $10,000 and $30,000. Texas NorthSTAR was again an outlier, showing costs of only $2,321 per child for residential care. With a number of different levels of clinical intensity – and therefore cost – and the possibility of very long lengths of stay – this level of care has a number of reasons to show a high level of variation.
Chart C.12
MHA and Medicaid Average Cost per Child Served in Residential Care
Total mental health authority and Medicaid non-hospital, 24-hour care expenditures divided by total number of children receiving non-hospital, 24-hour care
$48,601
$2,321
$10,130$15,982
$24,044
$31,236
$48,492
$19,309
$46,611
$15,077
$0
$10,000
$20,000
$30,000
$40,000
$50,000
$60,000
ID MT CA-LACty
CO IN HI Quest KY TXNSTAR*
VT DE
Exclude Room & Board
Comprehensive Children’s
Agency
Residential ExpendituresMean = $26,392 Median = $24,044 Std = $15,982
* Includes only contracted residential programs
Dougherty Management Associates, Inc. Appendix C - Page 90
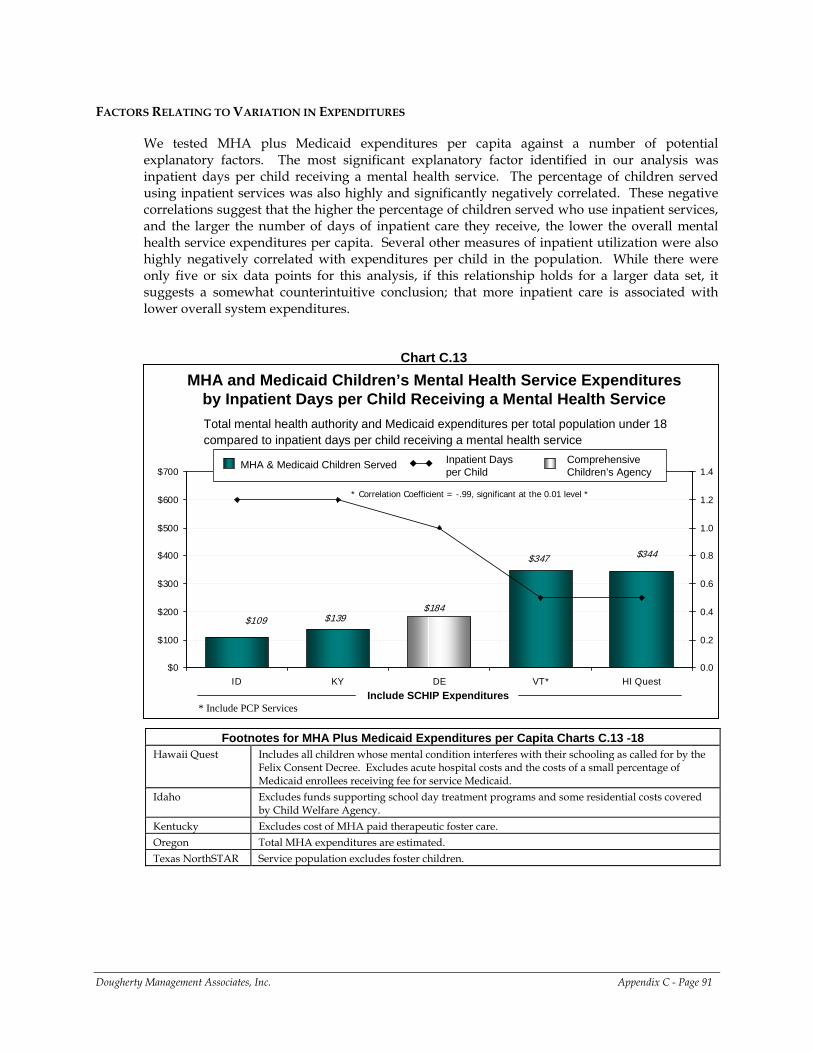
FACTORS RELATING TO VARIATION IN EXPENDITURES
We tested MHA plus Medicaid expenditures per capita against a number of potential explanatory factors. The most significant explanatory factor identified in our analysis was inpatient days per child receiving a mental health service. The percentage of children served using inpatient services was also highly and significantly negatively correlated. These negative correlations suggest that the higher the percentage of children served who use inpatient services, and the larger the number of days of inpatient care they receive, the lower the overall mental health service expenditures per capita. Several other measures of inpatient utilization were also highly negatively correlated with expenditures per child in the population. While there were only five or six data points for this analysis, if this relationship holds for a larger data set, it suggests a somewhat counterintuitive conclusion; that more inpatient care is associated with lower overall system expenditures.
Chart C.13
MHA and Medicaid Children’s Mental Health Service Expenditures by Inpatient Days per Child Receiving a Mental Health Service
$139$184
$344
$109
$347
$0
$100
$200
$300
$400
$500
$600
$700
ID KY DE VT* HI Quest0.0
0.2
0.4
0.6
0.8
1.0
1.2
1.4
Include SCHIP Expenditures
Total mental health authority and Medicaid expenditures per total population under 18 compared to inpatient days per child receiving a mental health service
* Correlation Coefficient = -.99, significant at the 0.01 level *
MHA & Medicaid Children Served Inpatient Days per Child
Comprehensive Children’s Agency
* Include PCP Services
Footnotes for MHA Plus Medicaid Expenditures per Capita Charts C.13 -18 Hawaii Quest Includes all children whose mental condition interferes with their schooling as called for by the
Felix Consent Decree. Excludes acute hospital costs and the costs of a small percentage of Medicaid enrollees receiving fee for service Medicaid.
Idaho Excludes funds supporting school day treatment programs and some residential costs covered by Child Welfare Agency.
Kentucky Excludes cost of MHA paid therapeutic foster care. Oregon Total MHA expenditures are estimated. Texas NorthSTAR Service population excludes foster children.
Dougherty Management Associates, Inc. Appendix C - Page 91
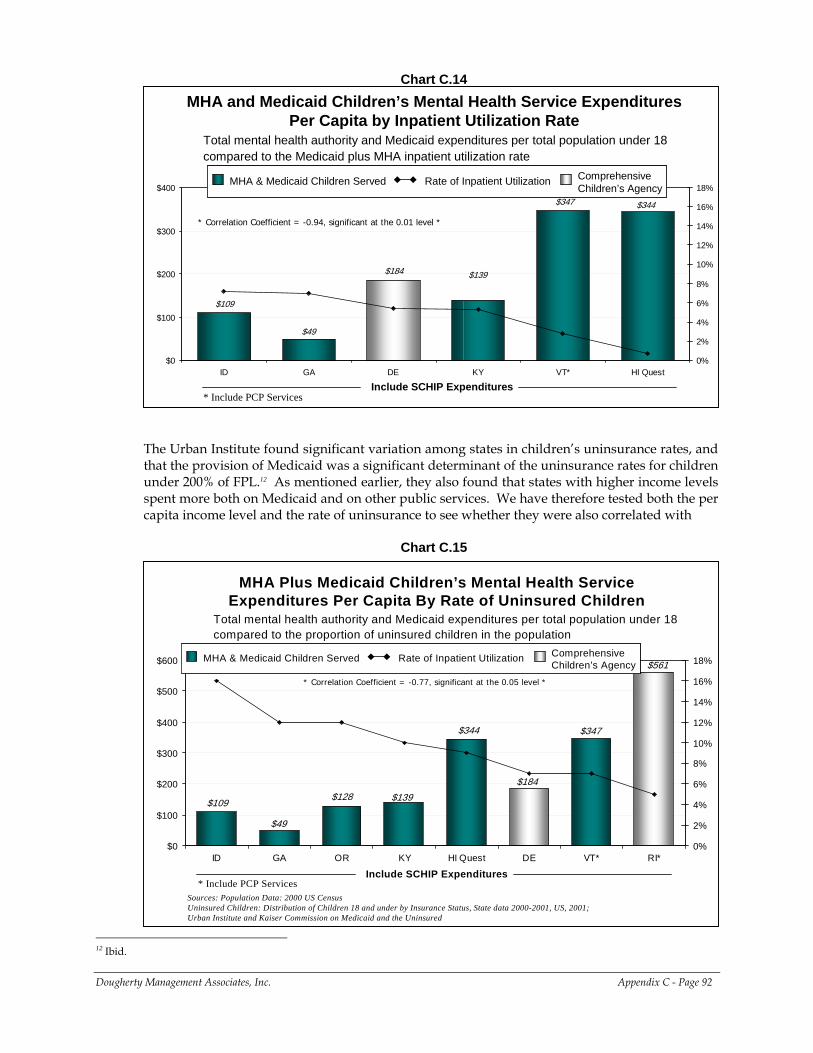
Chart C.14
MHA and Medicaid Children’s Mental Health Service Expenditures Per Capita by Inpatient Utilization Rate
Total mental health authority and Medicaid expenditures per total population under 18 compared to the Medicaid plus MHA inpatient utilization rate
$139
$344
$109
$347
$184
$49
$0
$100
$200
$300
$400
ID GA DE KY VT* HI Quest0%
2%
4%
6%
8%
10%
12%
14%
16%
18%
Include SCHIP Expenditures
* Correlation Coefficient = -0.94, significant at the 0.01 level *
MHA & Medicaid Children Served Rate of Inpatient Utilization Comprehensive Children’s Agency
MHA & Medicaid Children Served Rate of Inpatient Utilization Comprehensive Children’s Agency
* Include PCP Services
The Urban Institute found significant variation among states in children’s uninsurance rates, and that the provision of Medicaid was a significant determinant of the uninsurance rates for children under 200% of FPL.12 As mentioned earlier, they also found that states with higher income levels spent more both on Medicaid and on other public services. We have therefore tested both the per capita income level and the rate of uninsurance to see whether they were also correlated with
Chart C.15
MHA Plus Medicaid Children’s Mental Health Service Expenditures Per Capita By Rate of Uninsured Children
Sources: Population Data: 2000 US Census Uninsured Children: Distribution of Children 18 and under by Insurance Status, State data 2000-2001, US, 2001; Urban Institute and Kaiser Commission on Medicaid and the Uninsured
Total mental health authority and Medicaid expenditures per total population under 18 compared to the proportion of uninsured children in the population
$49
$128
$344
$109
$561
$347
$184
$139
$0
$100
$200
$300
$400
$500
$600
ID GA OR KY HI Quest DE VT* RI*0%
2%
4%
6%
8%
10%
12%
14%
16%
18%
Include SCHIP Expenditures
* Correlation Coefficient = -0.77, significant at the 0.05 level *
* Include PCP Services
MHA & Medicaid Children Served Rate of Inpatient Utilization Comprehensive Children’s Agency
MHA & Medicaid Children Served Rate of Inpatient Utilization Comprehensive Children’s Agency
Dougherty Management Associates, Inc. Appendix C - Page 92
12 Ibid.
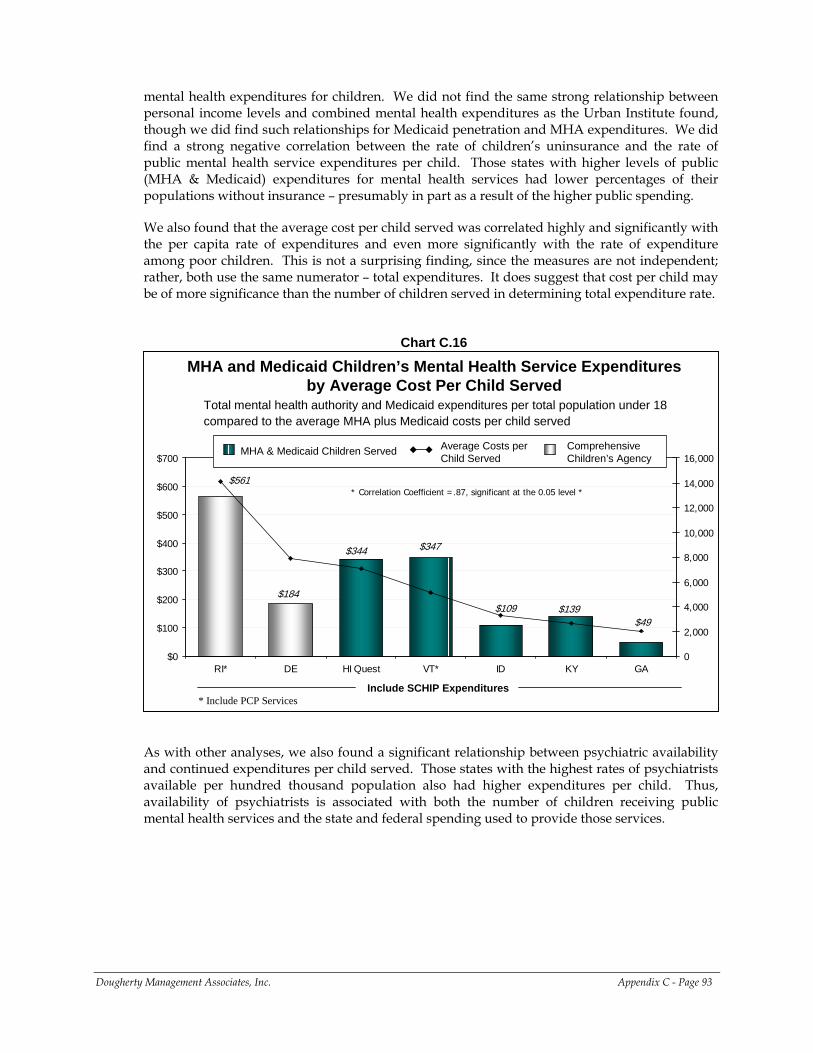
mental health expenditures for children. We did not find the same strong relationship between personal income levels and combined mental health expenditures as the Urban Institute found, though we did find such relationships for Medicaid penetration and MHA expenditures. We did find a strong negative correlation between the rate of children’s uninsurance and the rate of public mental health service expenditures per child. Those states with higher levels of public (MHA & Medicaid) expenditures for mental health services had lower percentages of their populations without insurance – presumably in part as a result of the higher public spending.
We also found that the average cost per child served was correlated highly and significantly with the per capita rate of expenditures and even more significantly with the rate of expenditure among poor children. This is not a surprising finding, since the measures are not independent; rather, both use the same numerator – total expenditures. It does suggest that cost per child may be of more significance than the number of children served in determining total expenditure rate.
Chart C.16
MHA and Medicaid Children’s Mental Health Service Expenditures by Average Cost Per Child Served
$184
$344
$109
$561
$49$139
$347
$0
$100
$200
$300
$400
$500
$600
$700
RI* DE HI Quest VT* ID KY GA0
2,000
4,000
6,000
8,000
10,000
12,000
14,000
16,000
Include SCHIP Expenditures
Total mental health authority and Medicaid expenditures per total population under 18 compared to the average MHA plus Medicaid costs per child served
* Correlation Coefficient =.87, significant at the 0.05 level *
MHA & Medicaid Children Served Average Costs per Child Served
Comprehensive Children’s Agency
* Include PCP Services
As with other analyses, we also found a significant relationship between psychiatric availability and continued expenditures per child served. Those states with the highest rates of psychiatrists available per hundred thousand population also had higher expenditures per child. Thus, availability of psychiatrists is associated with both the number of children receiving public mental health services and the state and federal spending used to provide those services.
Dougherty Management Associates, Inc. Appendix C - Page 93
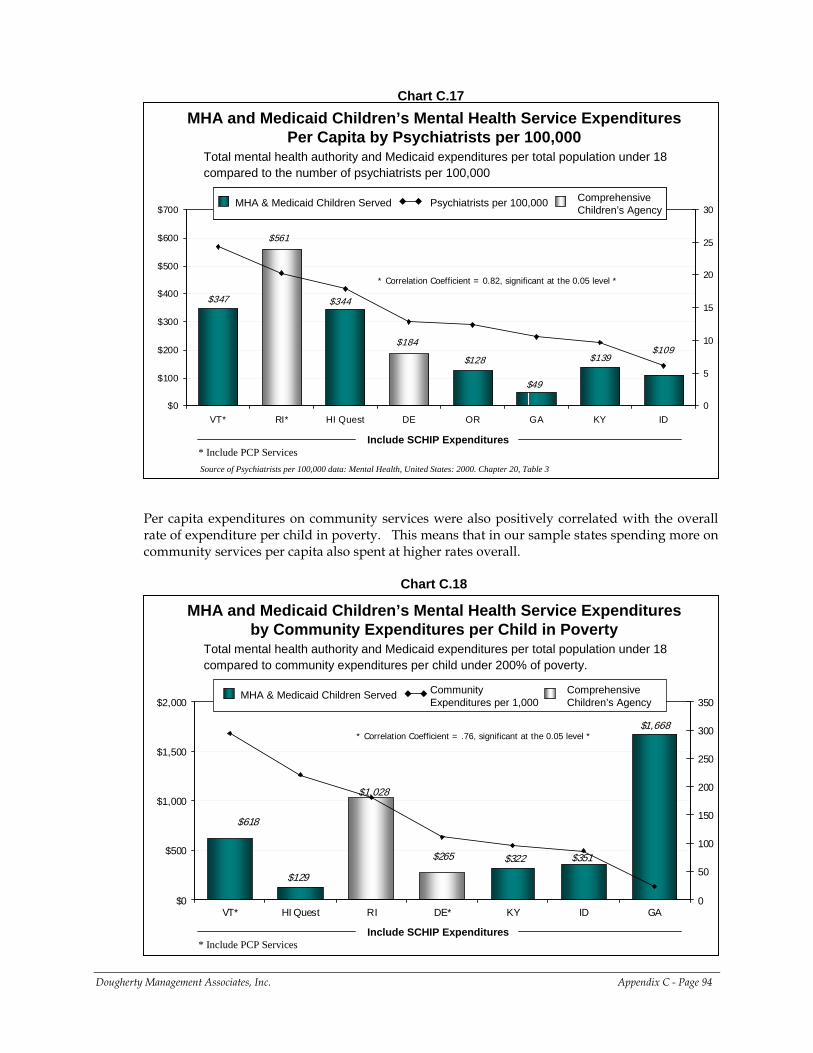
Chart C.17
MHA and Medicaid Children’s Mental Health Service Expenditures Per Capita by Psychiatrists per 100,000
Source of Psychiatrists per 100,000 data: Mental Health, United States: 2000. Chapter 20, Table 3
$184
$49
$139$109
$347
$128
$344
$561
$0
$100
$200
$300
$400
$500
$600
$700
VT* RI* HI Quest DE OR GA KY ID0
5
10
15
20
25
30
Include SCHIP Expenditures
Total mental health authority and Medicaid expenditures per total population under 18 compared to the number of psychiatrists per 100,000
* Correlation Coefficient = 0.82, significant at the 0.05 level *
MHA & Medicaid Children Served Psychiatrists per 100,000 Comprehensive Children’s Agency
MHA & Medicaid Children Served Psychiatrists per 100,000 Comprehensive Children’s Agency
* Include PCP Services
Per capita expenditures on community services were also positively correlated with the overall rate of expenditure per child in poverty. This means that in our sample states spending more on community services per capita also spent at higher rates overall.
Chart C.18
MHA and Medicaid Children’s Mental Health Service Expenditures by Community Expenditures per Child in Poverty
$265 $351
$1,668
$618
$322
$1,028
$129
$0
$500
$1,000
$1,500
$2,000
VT* HI Quest RI DE* KY ID GA0
50
100
150
200
250
300
350
Include SCHIP Expenditures
Total mental health authority and Medicaid expenditures per total population under 18 compared to community expenditures per child under 200% of poverty.
* Correlation Coefficient = .76, significant at the 0.05 level *
MHA & Medicaid Children Served Community Expenditures per 1,000
Comprehensive Children’s Agency
* Include PCP Services
Dougherty Management Associates, Inc. Appendix C - Page 94
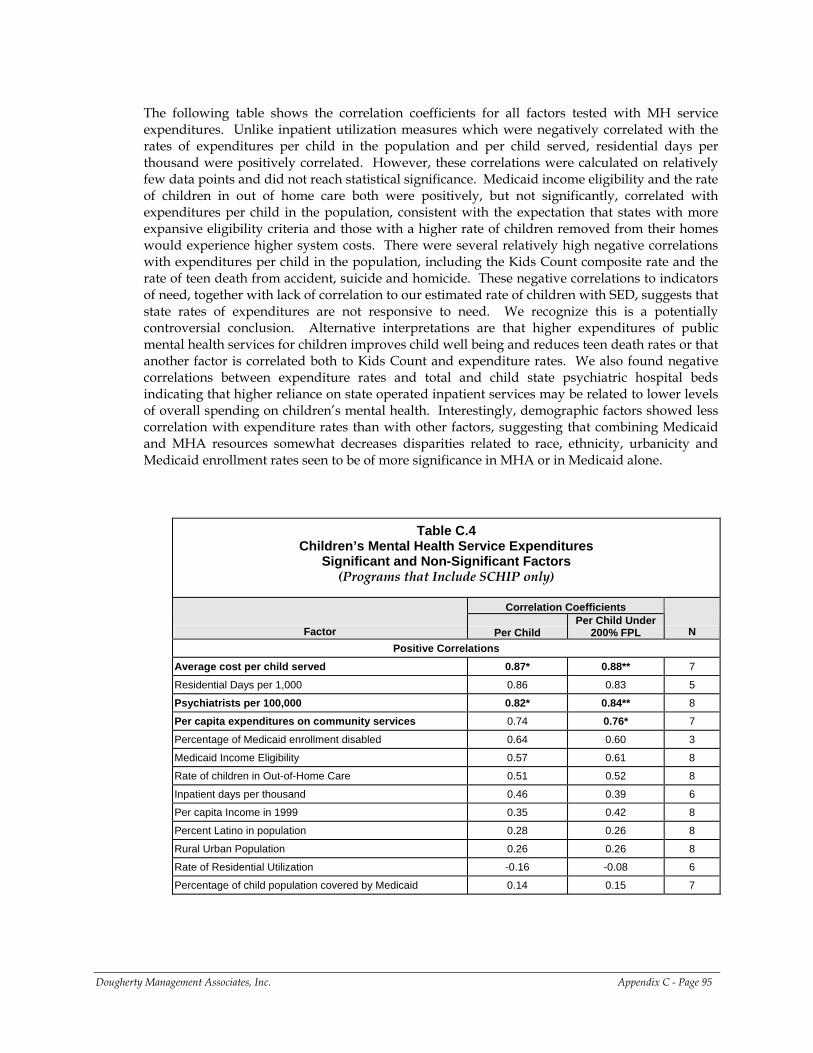
The following table shows the correlation coefficients for all factors tested with MH service expenditures. Unlike inpatient utilization measures which were negatively correlated with the rates of expenditures per child in the population and per child served, residential days per thousand were positively correlated. However, these correlations were calculated on relatively few data points and did not reach statistical significance. Medicaid income eligibility and the rate of children in out of home care both were positively, but not significantly, correlated with expenditures per child in the population, consistent with the expectation that states with more expansive eligibility criteria and those with a higher rate of children removed from their homes would experience higher system costs. There were several relatively high negative correlations with expenditures per child in the population, including the Kids Count composite rate and the rate of teen death from accident, suicide and homicide. These negative correlations to indicators of need, together with lack of correlation to our estimated rate of children with SED, suggests that state rates of expenditures are not responsive to need. We recognize this is a potentially controversial conclusion. Alternative interpretations are that higher expenditures of public mental health services for children improves child well being and reduces teen death rates or that another factor is correlated both to Kids Count and expenditure rates. We also found negative correlations between expenditure rates and total and child state psychiatric hospital beds indicating that higher reliance on state operated inpatient services may be related to lower levels of overall spending on children’s mental health. Interestingly, demographic factors showed less correlation with expenditure rates than with other factors, suggesting that combining Medicaid and MHA resources somewhat decreases disparities related to race, ethnicity, urbanicity and Medicaid enrollment rates seen to be of more significance in MHA or in Medicaid alone.
Table C.4 Children’s Mental Health Service Expenditures
Significant and Non-Significant Factors (Programs that Include SCHIP only)
Correlation Coefficients
Factor Per Child Per Child Under
200% FPL N Positive Correlations
Average cost per child served 0.87* 0.88** 7
Residential Days per 1,000 0.86 0.83 5
Psychiatrists per 100,000 0.82* 0.84** 8
Per capita expenditures on community services 0.74 0.76* 7
Percentage of Medicaid enrollment disabled 0.64 0.60 3
Medicaid Income Eligibility 0.57 0.61 8
Rate of children in Out-of-Home Care 0.51 0.52 8
Inpatient days per thousand 0.46 0.39 6
Per capita Income in 1999 0.35 0.42 8
Percent Latino in population 0.28 0.26 8
Rural Urban Population 0.26 0.26 8
Rate of Residential Utilization -0.16 -0.08 6
Percentage of child population covered by Medicaid 0.14 0.15 7
Dougherty Management Associates, Inc. Appendix C - Page 95
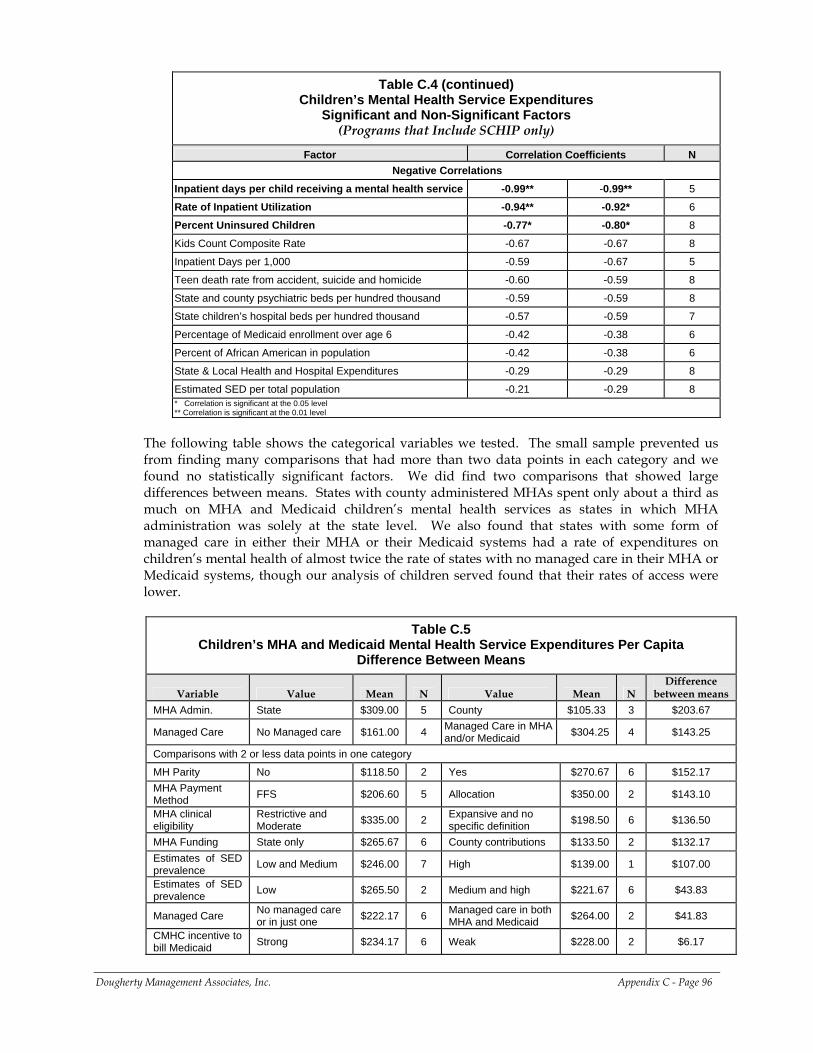
Table C.4 (continued) Children’s Mental Health Service Expenditures
Significant and Non-Significant Factors (Programs that Include SCHIP only)
Factor Correlation Coefficients N Negative Correlations
Inpatient days per child receiving a mental health service -0.99** -0.99** 5
Rate of Inpatient Utilization -0.94** -0.92* 6
Percent Uninsured Children -0.77* -0.80* 8
Kids Count Composite Rate -0.67 -0.67 8
Inpatient Days per 1,000 -0.59 -0.67 5
Teen death rate from accident, suicide and homicide -0.60 -0.59 8
State and county psychiatric beds per hundred thousand -0.59 -0.59 8
State children’s hospital beds per hundred thousand -0.57 -0.59 7
Percentage of Medicaid enrollment over age 6 -0.42 -0.38 6
Percent of African American in population -0.42 -0.38 6
State & Local Health and Hospital Expenditures -0.29 -0.29 8
Estimated SED per total population -0.21 -0.29 8 * Correlation is significant at the 0.05 level ** Correlation is significant at the 0.01 level
The following table shows the categorical variables we tested. The small sample prevented us from finding many comparisons that had more than two data points in each category and we found no statistically significant factors. We did find two comparisons that showed large differences between means. States with county administered MHAs spent only about a third as much on MHA and Medicaid children’s mental health services as states in which MHA administration was solely at the state level. We also found that states with some form of managed care in either their MHA or their Medicaid systems had a rate of expenditures on children’s mental health of almost twice the rate of states with no managed care in their MHA or Medicaid systems, though our analysis of children served found that their rates of access were lower.
Table C.5
Children’s MHA and Medicaid Mental Health Service Expenditures Per Capita Difference Between Means
Variable Value Mean N Value Mean N Difference
between means MHA Admin. State $309.00 5 County $105.33 3 $203.67
Managed Care No Managed care $161.00 4 Managed Care in MHA and/or Medicaid $304.25 4 $143.25
Comparisons with 2 or less data points in one category
MH Parity No $118.50 2 Yes $270.67 6 $152.17 MHA Payment Method FFS $206.60 5 Allocation $350.00 2 $143.10
MHA clinical eligibility
Restrictive and Moderate $335.00 2 Expansive and no
specific definition $198.50 6 $136.50
MHA Funding State only $265.67 6 County contributions $133.50 2 $132.17 Estimates of SED prevalence Low and Medium $246.00 7 High $139.00 1 $107.00
Estimates of SED prevalence Low $265.50 2 Medium and high $221.67 6 $43.83
Managed Care No managed care or in just one $222.17 6 Managed care in both
MHA and Medicaid $264.00 2 $41.83
CMHC incentive to bill Medicaid Strong $234.17 6 Weak $228.00 2 $6.17
Dougherty Management Associates, Inc. Appendix C - Page 96
CONCLUSION
Looking at Medicaid and MHA together eliminates the effect of differences in how states combine these resources and count services, as compared with analysis of data from Medicaid agencies or MHAs alone. It does not, however, account for differences in how states count services financed by child welfare, juvenile justice and school resources. Nonetheless, looking at the combination of Medicaid and MHA resources is a means of comparing most mental health services available to low income children and children with SED, plus most of the non-residential care provided to children in state custody. Even accounting for the presence or absence of children in SCHIP, and accounting for differences in poverty rates, three fold differences across states remain in children’s access to public mental health services, and ten fold differences in expenditures for mental health services per capita. Eliminating the remaining reporting differences would not necessarily reduce variation. These differences indicate real geographic disparities in access to public mental health care and resources available for such care. In other words, there are great differences in the likelihood of a child receiving care, and in the amount of care she or he receives, based solely on where in this country she or he lives. While this is perhaps not a surprising conclusion, the scope of the disparity in a system that receives significant levels of federal support is alarming. Looking at utilization and expenditures for different levels of mental health care is challenging because of different reporting conventions, especially related to how residential services are counted and whether the room and board portions of residential care are included. However, even allowing for the effects of these differences, it is evident that states use the levels of care in different proportions. Most states use inpatient care for between 4% and 7% of the children they serve under the MHA or Medicaid, though some use less and one uses dramatically more. Utilization of residential care is very difficult to analyze because it is not all counted within the same category. It ranges between 1% and 6% for most states, but has a high outlier. Expenditures for the different levels of care vary substantially, since price, type of service and days of service received can vary. Most states spent more on community than on 24-hour services, but four spent more on 24-hour inpatient and residential services. This suggests that there are geographic disparities in the types of services that children receive as well as their overall rates of access. Investigating the factors related to variations in access and expenditures for the combined MHA and Medicaid system of mental health services revealed no significant demographic variables. Most factors are either determined by state policies or can be influenced by the state. The most frequently occurring significant factor was the rate of psychiatrists per hundred thousand, which was positively correlated with both access and rate of expenditures. The rate of spending on community services was also correlated with both access and expenditure rates for children in poverty. Other factors related to states’ use of different levels of care. States with lower rates of child uninsurance tended to spend more on children’s mental health per capita, likely the results of investment in public health coverage for children. However, overall rates of state and local spending on health and hospital services were negatively correlated with spending on children’s mental health care, possibly indicating that children’s mental health services must compete for resources with other types of health services. Finally, expenditure rates were positively correlated with average expenditures per child receiving services and negatively correlated with inpatient utilization. Aspects of mental health administration, like state or county level administration of MHA services and relative extent of managed care, should be further investigated to better understand how they may affect access and expenditure rates.
Dougherty Management Associates, Inc. Appendix C - Page 97