Embed Size (px)
DESCRIPTION
Children’s Religious Attendance and Child Well-Being. Findings from the 2004 SIPP Jane Lawler Dye, U.S. Census Bureau. For presentation at the American Sociological Association Annual Meeting in Boston, MA August 1-4, 2008. - PowerPoint PPT Presentation
Citation preview
Children’s Religious Attendance and Child Well-Being
Findings from the 2004 SIPPJane Lawler Dye, U.S. Census Bureau
For presentation at the American Sociological Association Annual Meeting in Boston, MA
August 1-4, 2008.
This report is released to inform interested parties of ongoing research and to encourage discussion. The views expressed on statistical, methodological, technical, or operational issues are those of the authors and not
necessarily those of the U.S. Census Bureau.
Purpose• Research suggests a positive association between religious
activities and child well-being.[1] • However, the relationship has not been investigated in much
depth, especially for young children. • The well-being of children can be affected by parental
behaviors and many circumstances inside and outside the home.
• This analysis will explore the role of religious attendance in relationship to parental support, school attachment and academic achievement among children.
[1] Bridges, Lisa J. and Moore, Kristin A. “Religious Involvement and Children’s Well-Being: What Research Tells Us (And What It Doesn’t)” Child Trends Research Brief. Washington, DC. 2002.
Data Source• 2004 Survey of Income and Program Participation
(SIPP)• The SIPP provides a large, nationally representative
sample of the civilian noninstitutionalized population age 15 and over with data on income, labor force participation, and participation in government assistance programs, as well as other characteristics.– Data in this presentation are from a sample, and therefore are subject to sampling
and nonsampling error. For more information about the source and accuracy of the data go to http://www.bls.census.gov/sipp/source.html
– All statements in this presentation have been statistically tested at the 10 percent level of significance.
– For more information about the SIPP go to www.sipp.census.gov/sippSource: U.S. Census Bureau, Survey of Income and Program Participation, Child Well-Being Topical Module (Wave 3), 2004.
Child Well-Being Topical Module• The Child Well-Being Topical Module was administered to
parents of children under age 18 from October 2004 to January 2005 in wave 3 of the SIPP 2004 panel.
• Specifically, a designated parent* with one or more children between the ages of 6 to 17 was asked the question: “How often does [child] go to a religious service, a religious social event, or to religious education such as Sunday School?” The categorical answers were: never, several times a year, about once a month, about once a week, everyday or almost everyday.
• This is the first time data from this question from the SIPP have been presented.
*The mother was selected as the designated parent unless absent – then the father or guardian was selected.
Frequency of Children’s Religious Attendance
• 45 percent of children ages 6 to 17 attended religious activities about once per week.
• One out of five children never attended religious activities.
• Older children, those 12 to 17 were less likely to attend once a month or more, compared to children 6 to 11 years old (61 and 68 percent, respectively).
• Boys were more likely than girls to attend religious activities once a month or more, regardless of age.
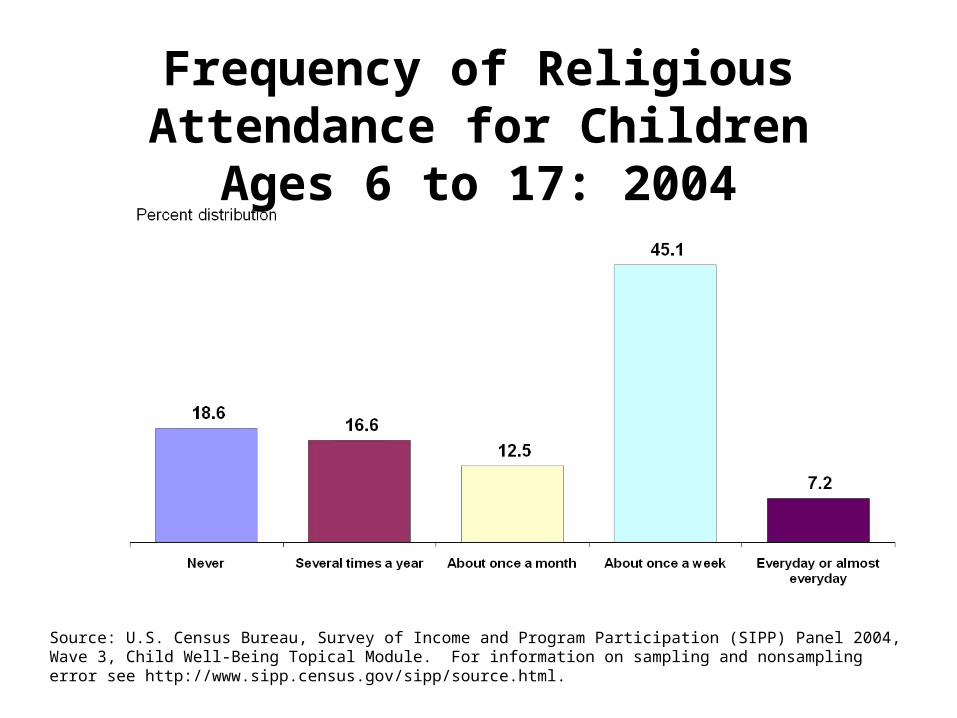
Frequency of Religious Attendance for Children Ages 6 to 17: 2004
Source: U.S. Census Bureau, Survey of Income and Program Participation (SIPP) Panel 2004, Wave 3, Child Well-Being Topical Module. For information on sampling and nonsampling error see http://www.sipp.census.gov/sipp/source.html.
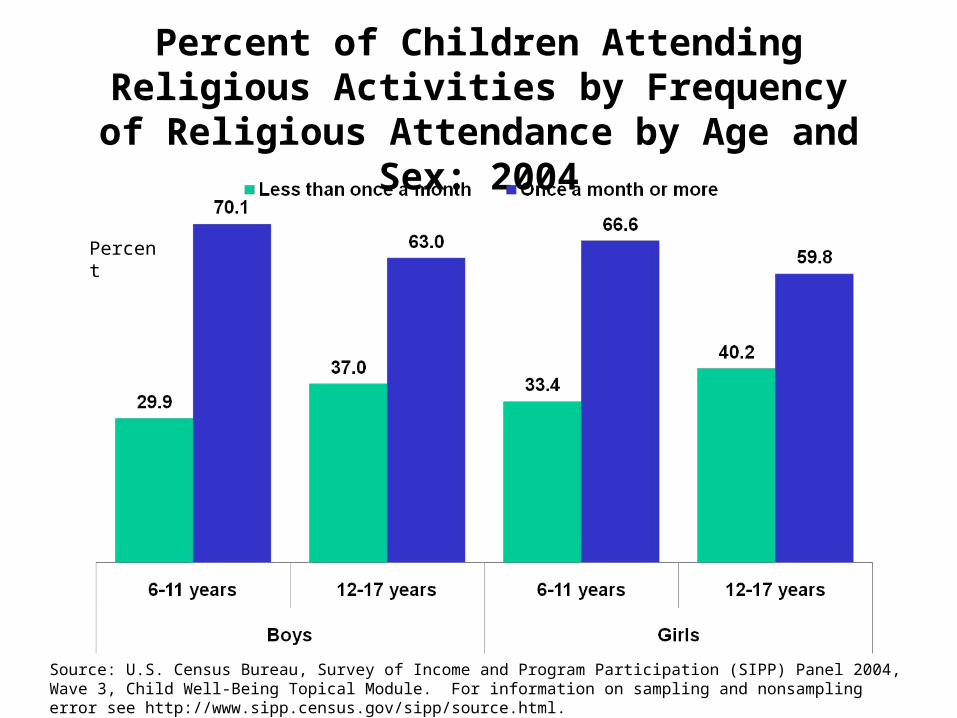
Percent of Children Attending Religious Activities by Frequency of Religious Attendance
by Age and Sex: 2004
Percent
Source: U.S. Census Bureau, Survey of Income and Program Participation (SIPP) Panel 2004, Wave 3, Child Well-Being Topical Module. For information on sampling and nonsampling error see http://www.sipp.census.gov/sipp/source.html.
Characteristics of Children by Frequency of Attendance
• Children with the following characteristics were more likely than their counterparts to attend religious activities once a month or more:
− Black children − Children living in nonmetropolitan area− Children with a married designated parent− Children with a monthly family income of $6,000 or more− Children with a designated parent who has a Bachelor’s
degree.
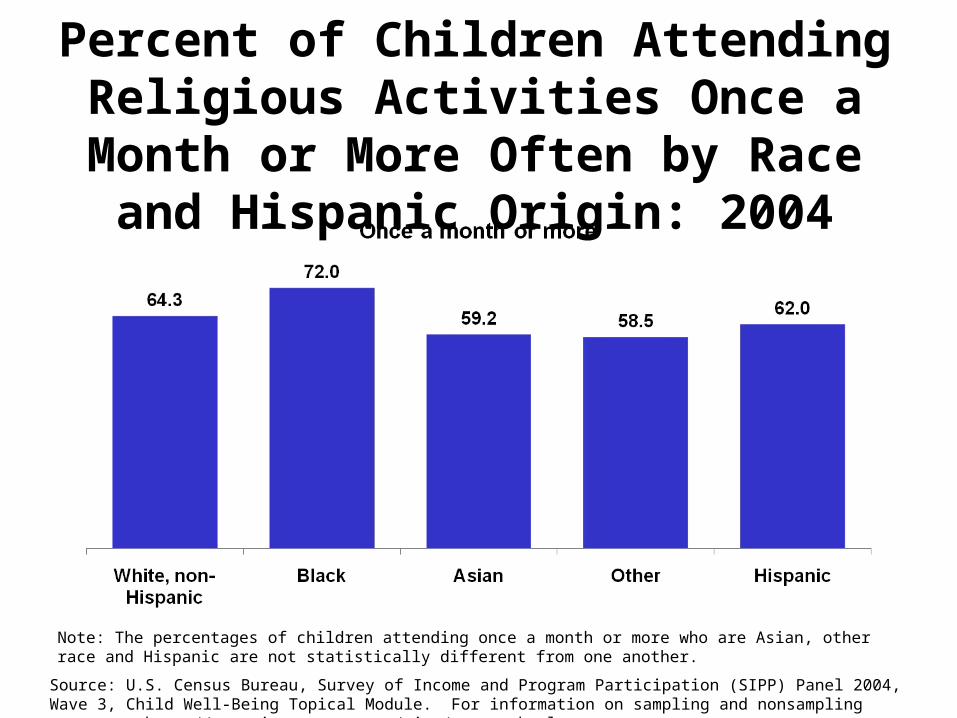
Percent of Children Attending Religious Activities Once a Month or More Often
by Race and Hispanic Origin: 2004
Source: U.S. Census Bureau, Survey of Income and Program Participation (SIPP) Panel 2004, Wave 3, Child Well-Being Topical Module. For information on sampling and nonsampling error see http://www.sipp.census.gov/sipp/source.html.
Note: The percentages of children attending once a month or more who are Asian, other race and Hispanic are not statistically different from one another.
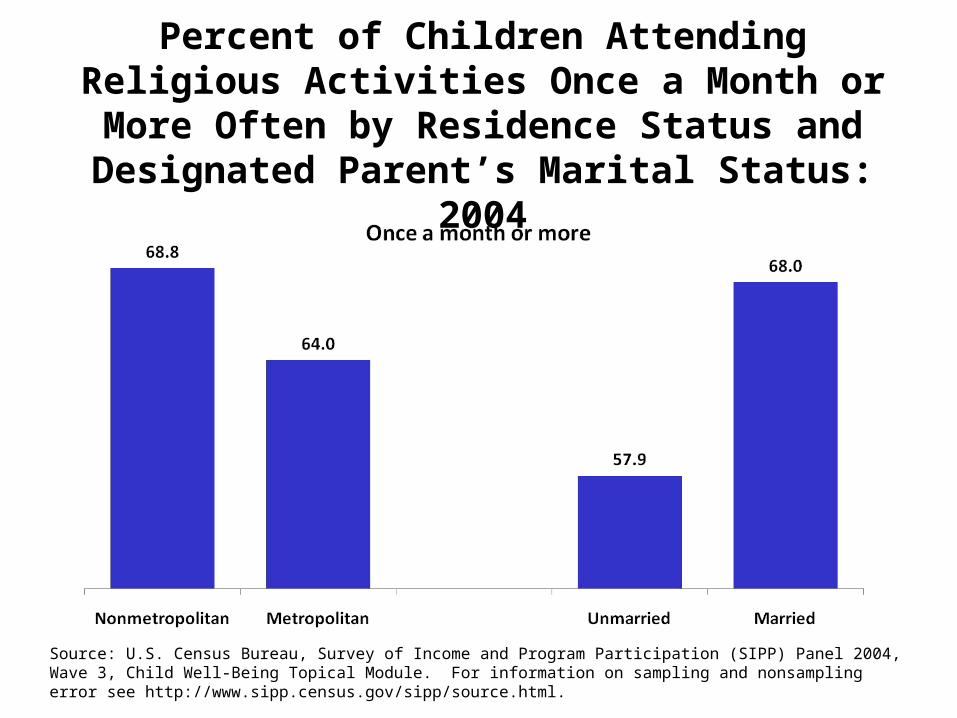
Percent of Children Attending Religious Activities Once a Month or More Often by Residence Status
and Designated Parent’s Marital Status: 2004
Source: U.S. Census Bureau, Survey of Income and Program Participation (SIPP) Panel 2004, Wave 3, Child Well-Being Topical Module. For information on sampling and nonsampling error see http://www.sipp.census.gov/sipp/source.html.
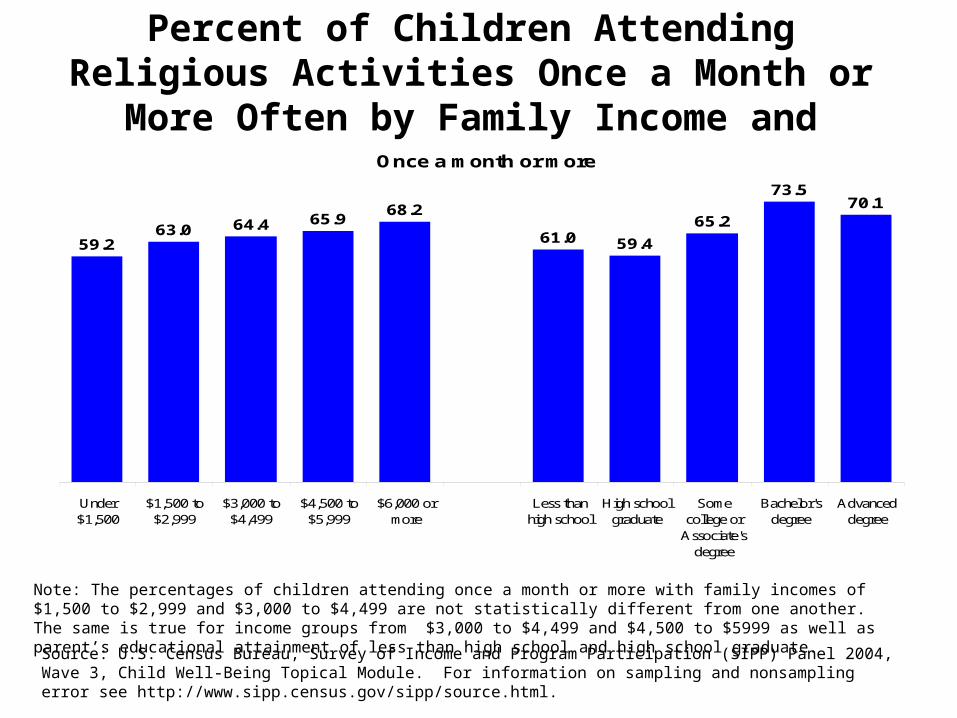
Percent of Children Attending Religious Activities Once a Month or More Often by Family Income and Designated Parent’s Educational Attainment: 2004
Source: U.S. Census Bureau, Survey of Income and Program Participation (SIPP) Panel 2004, Wave 3, Child Well-Being Topical Module. For information on sampling and nonsampling error see http://www.sipp.census.gov/sipp/source.html.
Note: The percentages of children attending once a month or more with family incomes of $1,500 to $2,999 and $3,000 to $4,499 are not statistically different from one another. The same is true for income groups from $3,000 to $4,499 and $4,500 to $5999 as well as parent’s educational attainment of less than high school and high school graduate.
Once a month or more
59.263.0 64.4 65.9 68.2
61.0 59.465.2
73.570.1
Under$1,500
$1,500 to$2,999
$3,000 to$4,499
$4,500 to$5,999
$6,000 ormore
Less thanhigh school
High schoolgraduate
Somecollege or
Associate'sdegree
Bachelor'sdegree
Advanceddegree
Bivariate analysis
• Child well-being can be estimated by evaluating:– Parental support– School attachment– Academic performance
The bivariate analysis examines the relationship between the frequency of children’s attendance at religious activities and child well-being as measured by these concepts.
Parental Support• Research shows that parental support leads to healthy adjustment
in children, better grades in school, fewer behavior problems, and higher self-esteem among children.[1]
• The SIPP measures parental support by asking parents the extent to which they have the following interactions with their children: – Praising their child three or more times per day, – spending time together or playing for 5 minutes or more, – going on outings, and – eating together.
[1] Amato, Paul R. and Frieda Fowler. 2002. “Parenting Practices, Child Adjustment, and Family Diversity.” Journal of Marriage and Family, 64, 703-716.
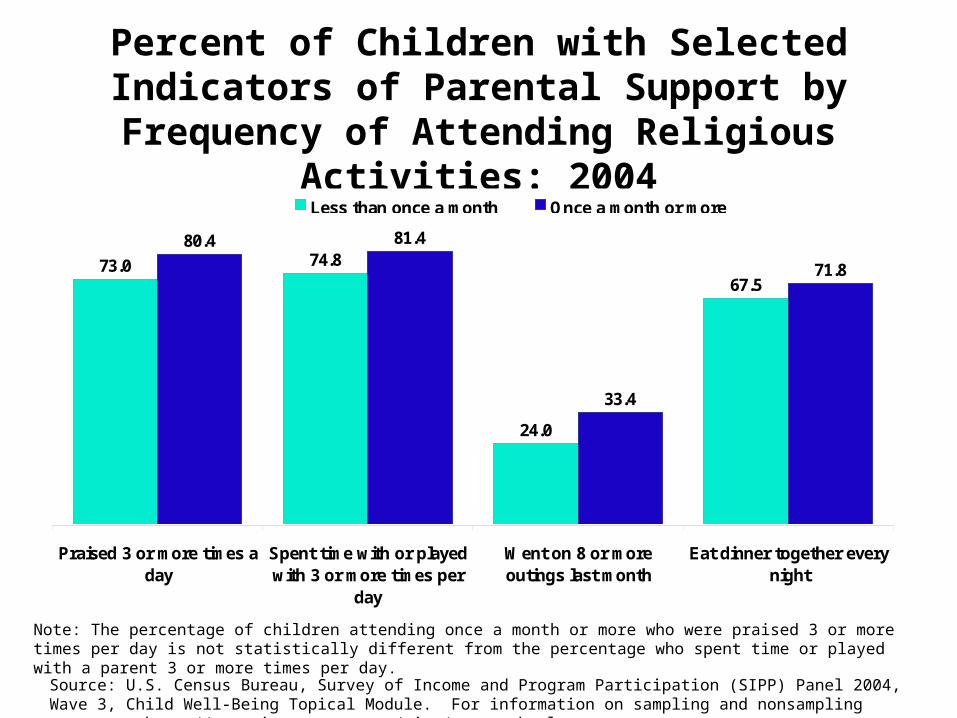
Percent of Children with Selected Indicators of Parental Support by Frequency of Attending
Religious Activities: 2004
73.0 74.867.5
80.4 81.4
33.4
71.8
24.0
Praised 3 or more times aday
Spent time with or playedwith 3 or more times per
day
Went on 8 or moreoutings last month
Eat dinner together everynight
Less than once a month Once a month or more
Source: U.S. Census Bureau, Survey of Income and Program Participation (SIPP) Panel 2004, Wave 3, Child Well-Being Topical Module. For information on sampling and nonsampling error see http://www.sipp.census.gov/sipp/source.html.
Note: The percentage of children attending once a month or more who were praised 3 or more times per day is not statistically different from the percentage who spent time or played with a parent 3 or more times per day.
School Attachment
• School attachment is measured by parental reports of whether or not their child: – likes school, – works hard in school and – is interested in schoolwork.
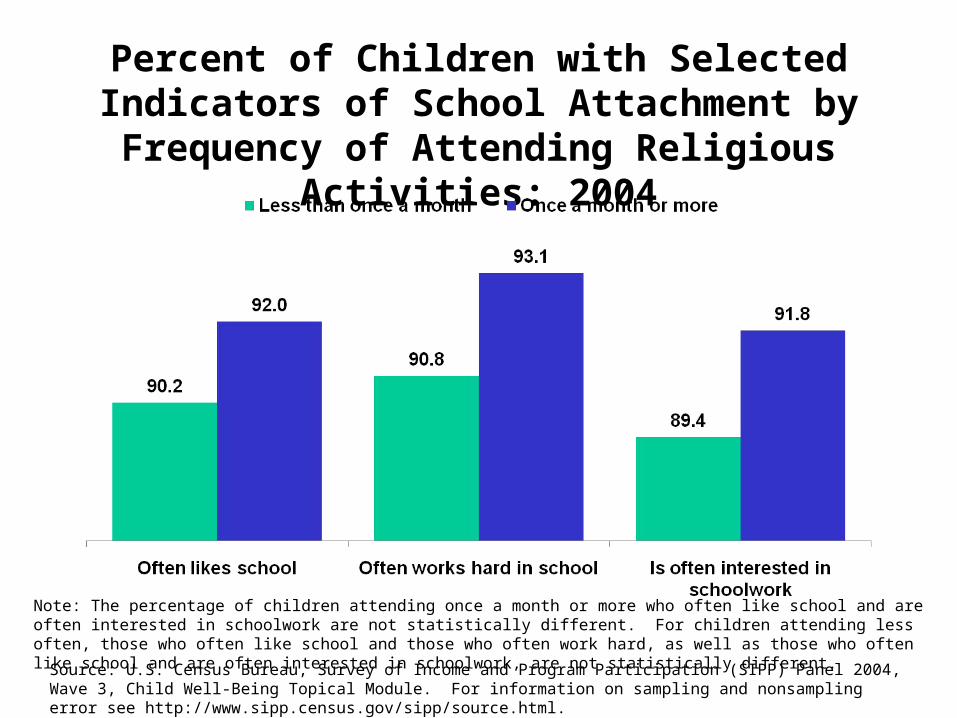
Percent of Children with Selected Indicators of School Attachment by Frequency of Attending
Religious Activities: 2004
Source: U.S. Census Bureau, Survey of Income and Program Participation (SIPP) Panel 2004, Wave 3, Child Well-Being Topical Module. For information on sampling and nonsampling error see http://www.sipp.census.gov/sipp/source.html.
Note: The percentage of children attending once a month or more who often like school and are often interested in schoolwork are not statistically different. For children attending less often, those who often like school and those who often work hard, as well as those who often like school and are often interested in schoolwork, are not statistically different.
Academic Performance
• Academic performance is measured by whether or not: – children were in any gifted classes, – had ever repeated a grade, or – had ever been expelled or suspended from
school.
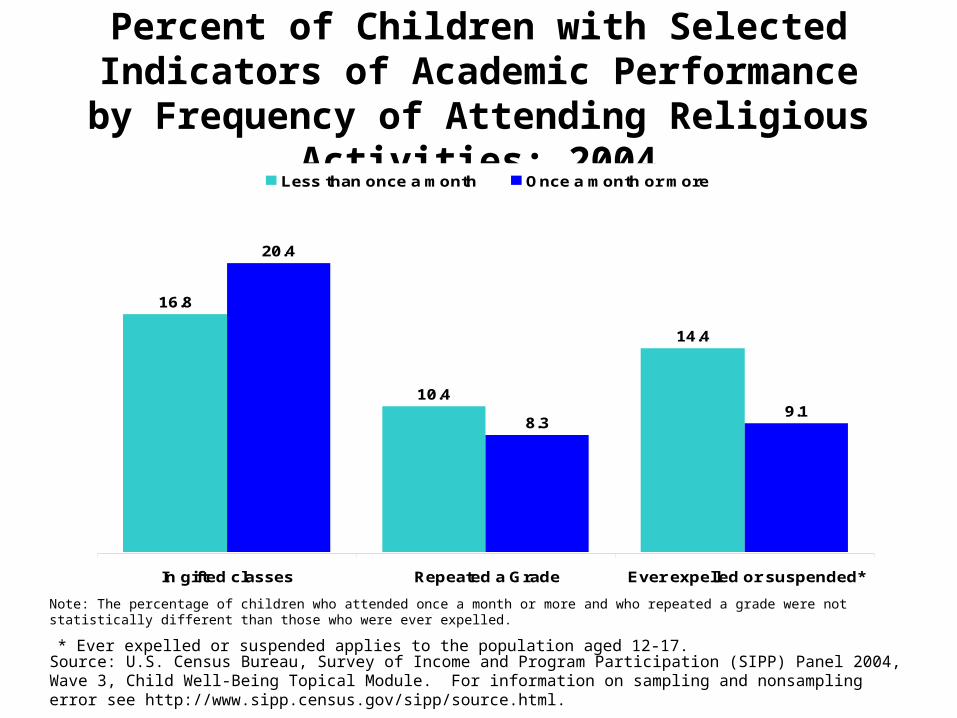
Percent of Children with Selected Indicators of Academic Performance by Frequency of
Attending Religious Activities: 2004
Source: U.S. Census Bureau, Survey of Income and Program Participation (SIPP) Panel 2004, Wave 3, Child Well-Being Topical Module. For information on sampling and nonsampling error see http://www.sipp.census.gov/sipp/source.html.
16.8
10.4
14.4
20.4
8.39.1
In gifted classes Repeated a Grade Ever expelled or suspended*
Less than once a month Once a month or more
* Ever expelled or suspended applies to the population aged 12-17.
Note: The percentage of children who attended once a month or more and who repeated a grade were not statistically different than those who were ever expelled.
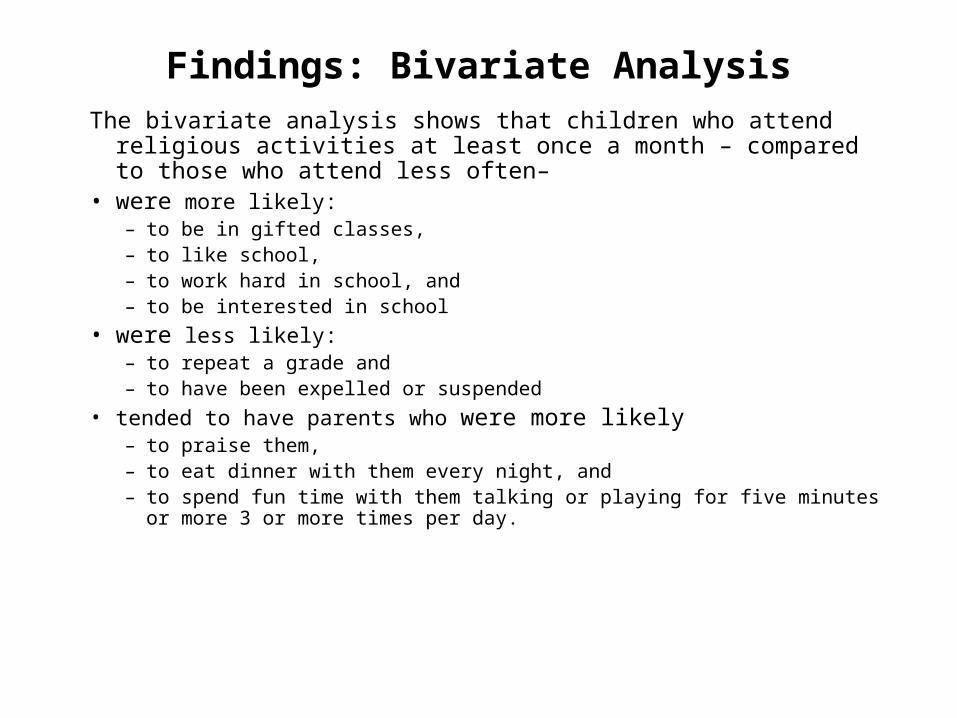
Findings: Bivariate AnalysisThe bivariate analysis shows that children who attend religious activities at least
once a month – compared to those who attend less often– • were more likely:
– to be in gifted classes, – to like school, – to work hard in school, and – to be interested in school
• were less likely: – to repeat a grade and – to have been expelled or suspended
• tended to have parents who were more likely – to praise them, – to eat dinner with them every night, and – to spend fun time with them talking or playing for five minutes or more 3 or more times
per day.
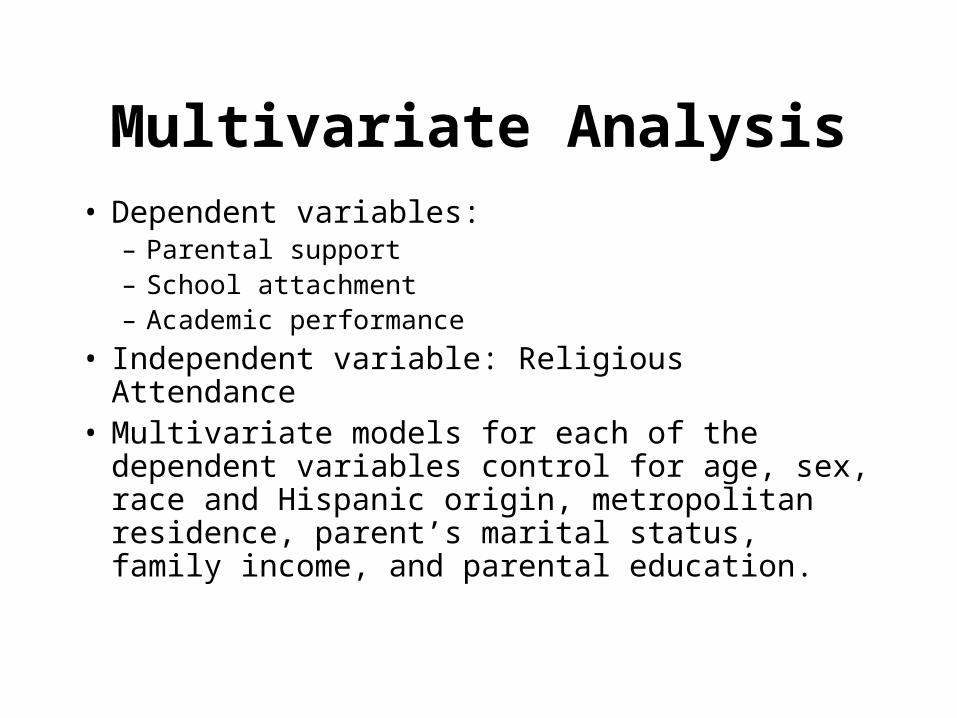
• Dependent variables:– Parental support– School attachment– Academic performance
• Independent variable: Religious Attendance• Multivariate models for each of the dependent
variables control for age, sex, race and Hispanic origin, metropolitan residence, parent’s marital status, family income, and parental education.
Multivariate Analysis
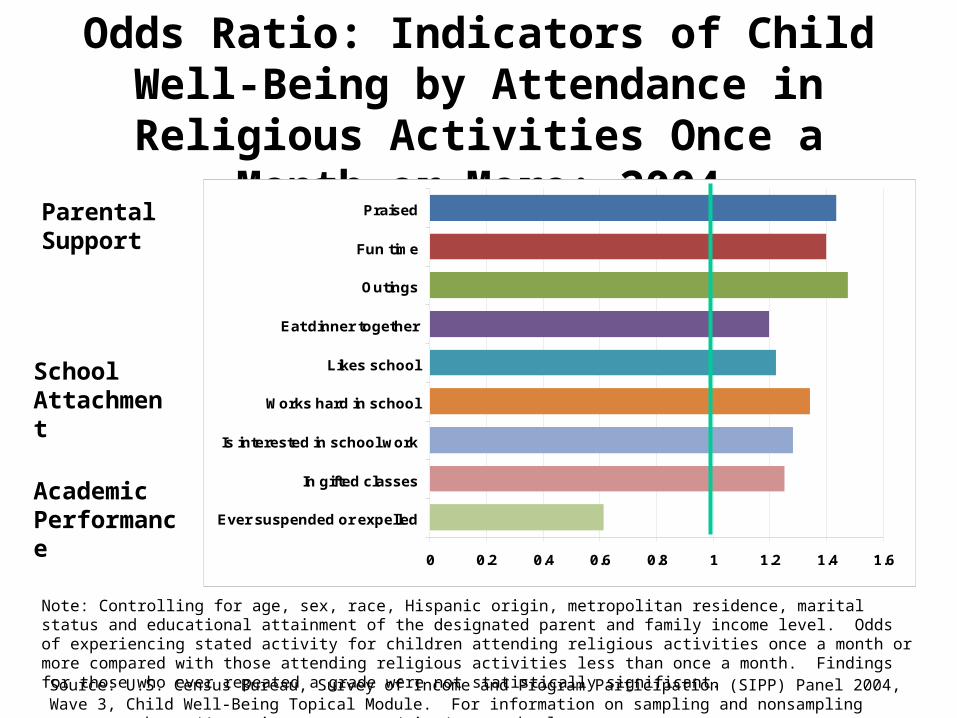
Odds Ratio: Indicators of Child Well-Being by Attendance in Religious Activities Once
a Month or More: 2004
School Attachment
Parental Support
Note: Controlling for age, sex, race, Hispanic origin, metropolitan residence, marital status and educational attainment of the designated parent and family income level. Odds of experiencing stated activity for children attending religious activities once a month or more compared with those attending religious activities less than once a month. Findings for those who ever repeated a grade were not statistically significant.
Academic Performance
Source: U.S. Census Bureau, Survey of Income and Program Participation (SIPP) Panel 2004, Wave 3, Child Well-Being Topical Module. For information on sampling and nonsampling error see http://www.sipp.census.gov/sipp/source.html.
0 0.2 0.4 0.6 0.8 1 1.2 1.4 1.6
Praised
Fun time
Outings
Eat dinner together
Likes school
Works hard in school
Is interested in school work
In gifted classes
Ever suspended or expelled
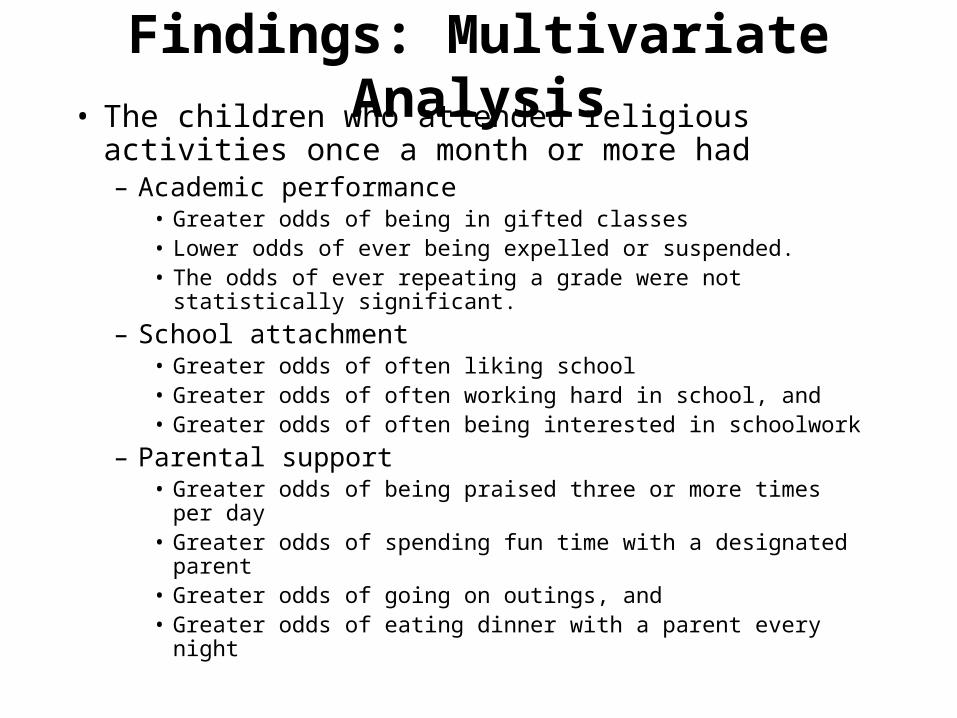
• The children who attended religious activities once a month or more had– Academic performance
• Greater odds of being in gifted classes• Lower odds of ever being expelled or suspended.• The odds of ever repeating a grade were not statistically
significant.– School attachment
• Greater odds of often liking school• Greater odds of often working hard in school, and• Greater odds of often being interested in schoolwork
– Parental support• Greater odds of being praised three or more times per day• Greater odds of spending fun time with a designated parent• Greater odds of going on outings, and• Greater odds of eating dinner with a parent every night
Findings: Multivariate Analysis
• Overall, while controlling for other factors, attendance at religious activities at least once a month is associated with positive indicators of child well-being both at home and at school.
• While this analysis shows an association between religious participation and child well-being it is not possible from these data to determine causality, or to identify the possibility of another unmeasured factor mediating or controlling this association.– For more information contact:
Jane Lawler [email protected]
Conclusion