Embed Size (px)
Citation preview
Children’s UniversityEvaluation report and executive summaryDecember 2017
Independent evaluators:Stephen Gorard, Nadia Siddiqui, Beng Huat See, Emma Smith, Patrick White

The Education Endowment Foundation (EEF) is an independent grant-making charity dedicated to breaking the link between family income and educational achievement, ensuring that children from all
backgrounds can fulfil their potential and make the most of their talents.
The EEF aims to raise the attainment of children facing disadvantage by:
identifying promising educational innovations that address the needs of disadvantaged
children in primary and secondary schools in England;
evaluating these innovations to extend and secure the evidence on what works and can be
made to work at scale; and
encouraging schools, government, charities, and others to apply evidence and adopt
innovations found to be effective.
The EEF was established in 2011 by the Sutton Trust as lead charity in partnership with Impetus Trust (now part of Impetus - Private Equity Foundation) and received a founding £125m grant from the Department for Education.
Together, the EEF and Sutton Trust are the government-designated What Works Centre for improving education outcomes for school-aged children.
This project is one of two ‘youth social action’ projects jointly funded by the Education Endowment Foundation, and the U.K. Cabinet Office.
For more information about the EEF or this report please contact:
Danielle Mason Head of Research
p: 020 7802 1679
w: www.educationendowmentfoundation.org.uk

Children’s University
Education Endowment Foundation
2
About the evaluator
The project was independently evaluated by a team from Durham University:
Stephen Gorard, Nadia Siddiqui, Beng Huat See, Emma Smith and Patrick White
The lead evaluator was Professor Stephen Gorard.
Contact details:
Professor Stephen Gorard
School of Education
Durham University
Leazes Road
Durham
DH1 1TA
Email: [email protected]
Tel: 0191 334 8419

Children’s University
Education Endowment Foundation
3
Contents
About the evaluator ......................................................................................... 2
Contents ........................................................................................................... 3
Executive summary ......................................................................................... 4
Introduction ..................................................................................................... 6
Methods .......................................................................................................... 11
Impact evaluation .......................................................................................... 20
Impact evaluation .......................................................................................... 25
Process evaluation ........................................................................................ 35
Conclusions ................................................................................................... 45
References ..................................................................................................... 48
Appendix A: Further analyses ..................................................................... 51
Appendix B: Padlock security ratings......................................................... 60
Appendix C: Parental Consent Letter.......................................................... 68
Appendix D: The survey ............................................................................... 69
Appendix E: Photos ...................................................................................... 73
Appendix F: Cost rating ................................................................................ 75

Children’s University
Education Endowment Foundation
4
Executive summary
The project
Children’s University (CU) aims to improve the aspirations, attainment, and skills of pupils aged 5–14
by providing learning activities beyond the normal school day. This trial focused on pupils in Years 5
and 6 (aged 9–11), and activities included after-school clubs, visits to universities, museums, and
libraries, and ‘social action’ opportunities such as volunteering in the community. Local CU teams
worked with schools to identify opportunities, and organise and monitor the activities. Children
volunteered to take part and selected the activities they wished to attend, with the target of completing
at least 30 hours of activity per year. Participation in activities was rewarded through credits, certificates,
and a ‘graduation’ event attended by parents.
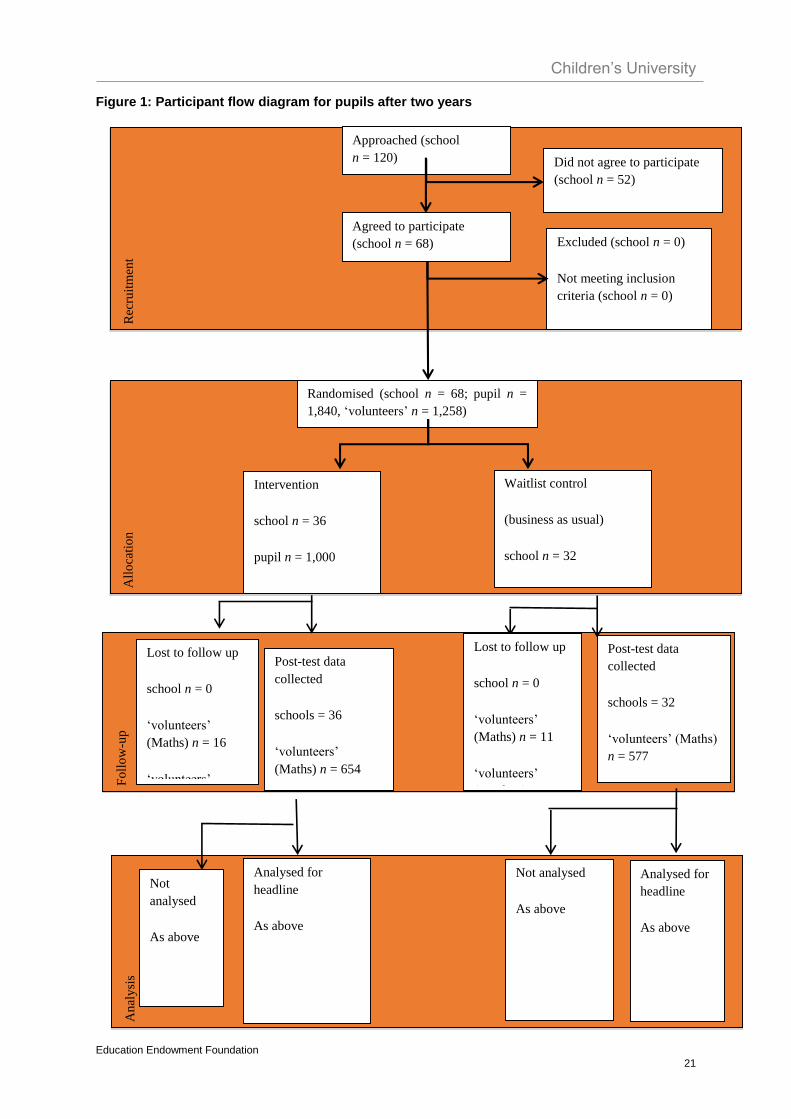
68 primary schools participated in this efficacy trial from March 2014 until July 2016. 2,603 pupils
reported in an initial survey that they would like to take part in the kinds of activities offered, and these
‘volunteer’ pupils formed the main comparison groups. 1,452 of these pupils were in the 36 schools
randomly allocated to receive the CU intervention, and 1,151 were in the 32 schools randomised to the
control group. This project evaluated the impact of CU on pupils’ reading and maths in Key Stage 2
tests, and on non-cognitive outcomes such as ‘teamwork’ and ‘social responsibility’ measured through
an attitude survey. Results were obtained for Year 6 pupils after one year and for Year 5 pupils after
two years. The headline findings below are based on the results for the 1,258 Year 5 pupils after two
years. Surveys and interviews were conducted to explore other aspects of the intervention such as:
participants’ feedback, challenges of implementation, and control group activity. This trial was jointly
funded by the Cabinet Office.
EEF security rating
The findings for maths and social responsibility have moderate security. The findings for reading and
teamwork have low to moderate security. This was an efficacy trial, which tested whether the
intervention can work under developer-led conditions. It was a randomised controlled trial conducted at
a reasonably large scale. The number of pupils with missing data is low: no school dropped out of the
trial, and only 2% of volunteer pupils in the initial survey are missing KS2 scores. Before the trial started,
there was reasonable balance of the school background characteristics between the group receiving
Key conclusions
1. Children in the CU schools made 2 additional months’ progress in reading and maths compared to children in the other schools. The finding for maths has moderate security, and the finding for reading has low to moderate security.
2. Children in CU schools made small gains in ‘teamwork’ and ‘social responsibility’ compared to children in the other schools. The finding for social responsibility has moderate security and the finding for teamwork has low to moderate security.
3. Children ever eligible for Free School Meals (FSM) made 1 additional month’s progress in maths, no additional progress in reading, and small gains in ‘teamwork’ and ‘social responsibility’ compared to ever FSM children in the other schools. The smaller number of ever FSM pupils means these results are less secure than the results for all pupils.
4. Compared to pupils in the control group, those in the treatment group were more likely to select professional occupations as their future aspiration, and to report higher levels of communication, empathy, self-confidence, resilience, and happiness, after the intervention.
5. The intervention was feasible to run with support from school leaders. However, 7 schools decided not to implement the intervention despite receiving the training because of pressures to meet performance targets, and limited time.

Children’s University
Education Endowment Foundation
5
CU and those in the comparison group. The treatment group had more ‘Outstanding’ schools, and the
control had more schools with higher proportions of FSM-eligible pupils. However, there was some
imbalance in terms of attainment and attitudes – with the treatment group clearly ahead on most
measures at the outset, particularly for the reading outcomes. This reduces the security of the findings,
particularly for reading. This is also the reason why all headline findings are presented as progress
scores pre- to post-intervention.
The pupil surveys were conducted three times over two years, and all schools participated in each
round. 9% of responses from the first and second, and first and third, surveys could not be matched,
which adds some caution to those results. The surveys were conducted by the research team members
and therefore the process was independent of the developer’s involvement. The survey was piloted in
schools before the trial period started. Although it is a bespoke instrument, the items were carefully and
systematically selected from other standardised instruments that have a track record of use in large-
scale studies.
Additional findings
CU activities were reported as attractive to pupils. Children receiving CU for one year (those in Year 6)
made a small gain in maths, but less progress in reading, compared to children in control schools. The
smaller size of these effects compared to the results for the Year 5 cohort (that received CU for two
years) suggests that children may benefit from longer involvement in CU.
Further analyses suggested that all Year 5 children in schools doing CU made better average progress
than children in control schools, regardless of their actual level of participation in CU activities. This
could be seen as adding further caution to the headline results as to the extent to which gains were due
to direct involvement in CU activities. However, one of the original research questions was whether the
availability of CU activities could affect the whole cohort. For the non-participating group this may be
evidence of such a cohort ‘effect’.
Table 1: Summary of impact on primary outcome for ‘volunteers’ after 2 years
Group / outcome ‘Effect’
size
Estimated months’ progress
No of pupils
EEF security rating
EEF cost rating
KS2 reading 0.12 2 1,224
£ £ £ £ £
KS2 maths 0.15 2 1,231
£ £ £ £ £
‘Teamwork’ 0.04 n/a 1,154
£ £ £ £ £
‘Social responsibility’ 0.08 n/a 1,156
£ £ £ £ £
EverFSM KS2 reading 0.03 0 493
EverFSM KS2 maths 0.05 1 494
EverFSM ‘Teamwork’ 0.17 n/a 453
EverFSM ‘Social responsibility’
0.10 n/a 453
Cost
Overall, the total additional cost of participation for schools is around £45 per pupil per year. In addition
to this, schools had to appoint a CU Coordinator who attended an initial induction, and spent 1 or 2
hours per week organising activities and supporting teachers to run after-school clubs. Class teachers
spent time running after-school clubs. Costs vary according to the kind of activities schools choose, and
resources already available.

Children’s University
Education Endowment Foundation
6
Introduction
The intervention
Children’s University (CU) Trust is a charity that works across the UK through a network of local CU
centres. There are also CU pilot projects in Australia, China, and Malaysia. Through this UK network,
CU works with children in schools and in some areas directly with families. Participation in CU-validated
activities is intended to impact on pupils’ learning and attainment, and a range of wider non-attainment
outcomes such as aspiration, motivation, and self-confidence.
The Children’s University works with pupils aged 7 to 14, and with 5–7 year olds with family support.
There are 90 CU centres in the UK working with schools, and using local communities, local authorities,
and national partnerships to encourage innovative ways of learning and connecting out-of-school
learning opportunities with classroom learning. The intervention offers a range of different learning
opportunities such as environmental projects, after-school clubs and enrichment activities leading to
attainments of credit and ‘graduation certificates’. For the purposes of this evaluation, schools were
supported to develop a range of activities with a social action outcome. The concept behind this
intervention is to take pupils’ learning beyond the boundaries of the classroom, giving pupils more
control of their learning aims through experience and action, rather than being taught in a classroom.
The standard programme provides a toolkit for signposting and encouraging children to participate in a
range of learning activities outside school hours, such as in lunch breaks, after school, during holidays,
and at weekends. There is no targeted syllabus content or outline of the activities to be followed.
However, the CU approves and validates activities that have structured learning aims and are
conducted in out-of-school hours.
The programme intends to motivate pupils’ informal learning and participation in learning beyond school
through reward-based strategies. An important feature of the CU intervention is each pupil’s ‘Passport
to Learning’, used to record each activity and hours spent on the activities. The hours spent on approved
learning activities are rewarded by the collection of credits that ultimately lead to the achievement of
certificates. Children make their own choice of activities and receive a stamp in their CU Passport to
Learning upon completion. They must attend for a specified time in order to gain CU credits and work
towards CU Certificates of Achievement (from Bronze Undergraduate Award level (30 hours) to Gold
Fellowship level (1,000 hours) and various grades in between). Each participating pupil must complete
30 hours of learning activities in order to achieve CU certification and participate in a graduation
ceremony.
There is a wide range of CU-validated activities in the form of after-school clubs such as arts and crafts,
sports activities, book reading and maths, gardening, cookery, and youth clubs. There are also validated
learning activities in approved ‘Learning Destinations’. These are various sites and organisations where
pupils have opportunities to learn and receive information through experience, observations, attending
talks and public lectures, and science festivals (see Appendix E). Schools often arrange these visits to
complement the curriculum and class lessons. The common Learning Destinations validated by CU are
museums, wildlife centres, historic places and monuments, theatres, and libraries. Pupils’ completion
of learning activities during visits to Learning Destinations are awarded with credits in their Passports
to Learning.
CU has now included a set of social action modules where the idea is to promote volunteering,
charitable work, and networking within and across the communities. In 30 hours of learning, pupils are
expected to devote 15 hours to social action activities where the focus is volunteering, participation in
active citizenship or community service. The social action activities are aligned with the aims of CU
where the purpose is raising pupils’ aspiration, self-esteem and confidence, resilience, and social skills

Children’s University
Education Endowment Foundation
7
development. The CU centres provide support and ideas to schools in planning social action activities.
Pupils’ participation is monitored, guided, and credited in the Passports to Learning by teachers and
CU staff members. There are several social action activities and projects validated by CU. Validation
criteria include conditions such as that the activity should have structured learning aims and the activity
takes place under supervision of at least one staff member and must be in out-of-school hours. The
range includes activities at the school level, local area level, regional, and national level. A few are
described below to introduce the kind of social actions that have been validated by CU.
Charity and fundraising activities
CU has validated various charity and fundraising activities. A general idea is to introduce the concept
of charity through school assemblies and raise pupils’ awareness about different social causes,
involving pupils in ideas for fundraising activities. The schools take up these activities as small projects.
This involves organising events for pupils’ participation in walks for awareness, selling products made
by pupils in school, participating in art and craft works for raising funds (see Appendix E for photos), or
making food packs for homeless people.
Community work
Community work involves social actions that target problems in the community such as litter, graffiti,
vandalism, and bullying. The CU local managers provide support and information to schools in
organising regular events where pupils get the opportunity to discuss problems in their local
communities and engage in social actions. Sometimes local partnerships are also involved to facilitate
events, awareness talks, campaigns, litter picking activities, and information and awareness on
recycling and disposal. Schools are encouraged to organise activities as national events in order to
maximise the awareness. This involves pupils’ engagement with the local community during the time of
festivals and events such as World Environment Day, Black History Month and so on.
Volunteering
CU validates several volunteering activities and schemes that allow pupils to volunteer in social action,
personal development skills, and life skills. Participation in schemes such as the Duke of Edinburgh
Award, Brownies, Beavers, and Cubs are acknowledged by CU as volunteering activities and pupil
participation in such activities is given reward credits. Participation in learning skills that can support a
social action are also given credits. Schools offer training courses in first-aid and fire-safety courses
(see Appendix E). Other volunteering opportunities for pupils include being part of a team running a
summer project, or supporting school staff or a local library in out-of-school hours.
CU managers ensure that all activities are aligned with the aims of learning in out-of-school hours
according to which pupils learn through experience, action, and involvement rather than being taught
in classroom settings. The schools are fully engaged in organising activities and monitoring pupils’
participation. The main focus of the programme is to facilitate schools in developing ideas for activities
and, wherever possible, provide support to schools by linking with related organisations, local
authorities, and partnerships.
In this trial the CU introductory training was given to the treatment schools in all four regions in which
the trial was being conducted. The training included information about the process of validating existing
activities and creating new after-school clubs. It also provided information on using the Passport to
Learning (booklet and Online version: see Appendix E for a photo of the Passport to Learning) as a
logbook, and how CU staff could extend their support in execution of these activities. The support
provided by CU involves working with school leaders and other staff members who are responsible for
developing and monitoring after-school activities. The CU monitoring procedure is embedded in the
credit reward system. Teachers log pupils’ participation and number of hours in the pupils’ Passports

Children’s University
Education Endowment Foundation
8
to Learning after receiving the training from CU regarding the reward credit systems. The final credits
and certification depend on the records of pupils’ Passports to Learning. The CU managers closely
monitor the execution of activities through regular visits. Schools have flexibility to tailor the CU activities
according to their local community needs, their access to provisions and the available resources.
Background evidence
While academic achievements may help determine access to pathways of success in life, there are
underlying attitudes and behaviour related to academic attainment that also play an important and
independent role in an individual’s life and well-being (Heckman and Rubenstein 2001, Chowdry et al.
2010, Gupta and Simonsen 2010, Brunello and Schlotter 2011, Kautz et al. 2014). These behaviours
or attitudes include social and communication skills, resilience, determination, motivation, confidence,
self-esteem, and self-efficacy. The list of such personal qualities is long and is known by various terms
in the literature such as non-cognitive skills, soft skills, personal characteristics, personality traits, life
skills, social and emotional skills, and wider educational outcomes. Little is known about whether these
behaviours, attitudes, skills, or traits can be improved and whether any improvement can lead to gains
in academic attainment, non-cognitive development, or later achievement in life (Algan et al. 2014,
Siddiqui et al. 2017).
Children from disadvantaged backgrounds are less likely to participate in activities such as after-school
clubs, arts and cultural events (Arts and Council 2016), volunteering, and community-based projects
(Southby and South 2016). If participation in these activities really matters in terms of young people’s
academic success and life-long achievement outcomes then these concerns need investment and
effective interventions. The cost for participation in activities that are deemed important for children’s
non-cognitive development is a major concern. Although school itself is free, disadvantaged children
and parents can still experience difficulties in paying the cost for some provision such as sports activities
and after-school clubs (Farthing 2014), and this reduces the options for enrichment activities for children
living below and on the threshold of poverty (Holloway et al. 2014).
Children’s mental health and well-being is on the government’s education agenda and schools in
England are given financial incentives to encourage physical education (PE) and sports activities in
order to promote children’s health and well-being (ONS 2015, DfE September 2016). Schools offer non-
academic activities for pupils in order to provide opportunities for improvement in non-cognitive
outcomes such as well-being. The activities are organised and conducted by schools, can be in
participation with external providers and do not necessarily take place on school campuses. Schools
also provide various participation opportunities in activities such as sports, arts, volunteering,
community work, and out-of-school visits. The government has promised £21 million in initiatives for
youth social action engagement, wanting all mainstream schools to increase resources for the provision
of such activities
(https://www.gov.uk/government/uploads/system/uploads/attachment_data/file/262771/290106
2_SocialAction_acc.pdf).
A nationwide survey study reported that there is wide variation in provision of out-of-school activities
(Power et al. 2009). The major determinants of the provisions were school geography (urban/rural),
proportion of disadvantaged pupils, and type of school. Smaller schools or those in urban areas or with
fewer disadvantaged pupils were found to implement out-of-schools activities more actively than those
in rural areas, of larger size and with higher proportions of disadvantaged pupils. The study also
identified that those who miss out from out-of-school activities are more likely to be children from
traveller communities, girls from Muslim ethnic minority groups and asylum seekers. These patterns of
out-of-school activities and provision are relevant for an evaluation study such as ours because we are
interested in assessing the efficacy of an intervention for schools with high proportions of disadvantaged
pupils. The current trial involves schools in the North of England where the schools tend to have higher

Children’s University
Education Endowment Foundation
9
proportions of disadvantaged children and attainment is also lower than the national average (DfE
2017).
A recent study suggested that there were academic benefits from out-of-school activities (breakfast
clubs, after-school clubs, sports activities, music and art lessons, tuition, religious services) on children’s
KS2 attainment (Chanfreau et al. 2016). These results are based on a national longitudinal birth cohort
study (Millennium Cohort). The study included 11,762 pupils and systematically recorded details of their
home and school life. Records of children’s out-of-school activities were taken at three instances during
their primary education. The out-of-school activities participation rate increased from age 5 to age 11.
However, the findings confirm a large gap between social groups in the take-up of after-school activities.
The KS2 results showed a positive association with attending out-of-school activities. However, there
is no clear evidence that these activities have a direct impact on academic attainment (Garcia 2014,
Tanner 2015). There are also indications that children’s social and emotional development during
childhood and adolescence can be improved by school-based non-academic activities (Gutman and
Schoon 2013, Clarke et al. 2015).
Social action activities are largely defined as out-of-school hours spent by pupils in practical and
volunteer engagement in the service of others. According to the National Youth Social Action Survey,
40% of young people aged 10 to 20 years old participate in social action for communities (Pye and
Michelmore 2016). The government plans to increase this participation to 60% by 2020. There has been
some evidence of the impact of school-based social action programmes on children’s non-cognitive
outcomes such as increased confidence and social communication skills, and awareness of the needs
of others (Clarke et al. 2015, Kirkman et al. 2015). Some large-scale survey-based studies have also
reported the benefits of youth social action engagement in the form of community cohesion and
employability (Birdwell and Bani 2014, Pye and Michelmore 2016). There are positive associations
between pupils’ social background, their commitment and participation rate in volunteering for social
actions and their academic attainment. However, there are no robust evaluations of social action
programmes at primary school level that show pupils’ participation in youth social action in general has
an impact on raising pupils’ academic attainment. In the current evaluation study, social action activities
were introduced as a compulsory component in CU, allowing us to assess the impact on pupils’
academic attainment at Key Stage 2.
The feasibility of the Children’s University programme is suggested by various self-evaluations by CU
in conjunction with Cambridge University (MacBeath and Waterhouse 2008, MacBeath 2012).
Volunteers with parents able to pay for the programme reported high levels of satisfaction, higher than
average levels of attendance at school, and higher levels of subsequent attainment (literacy and
numeracy) than those who did not volunteer, or otherwise could not attend (MacBeath 2011). However,
the programme was not assessed in relation to a randomised control group. For attendance and
attainment outcomes, children who volunteered to take part in CU activities were compared with those
who did not volunteer to take part. These are not comparable groups of children because participation
in volunteering and after-school club activities is related to children’s social background, family
characteristics, and income group. Children who are more likely to attend these activities are from
families in a higher socioeconomic group and so are more likely to have higher attainment at school
(Wikeley et al. 2007, Pye et al. 2014, Cheung 2016).
There is, therefore, promise from youth social action both for non-cognitive changes and for improved
attainment but neither outcome has been properly tested before in primary schools. This evaluation of
youth social action programmes has been funded by Education Endowment Foundation and the
Cabinet Office. The current evaluation of Children’s University is a part of several other youth social
action programmes and their evaluations for providing the necessary evidence on their feasibility and
impact.

Children’s University
Education Endowment Foundation
10
Evaluation objectives
This evaluation answers the following main research questions:
1. What is the impact of an opportunity to participate in Children’s University on pupils’ attainment in
English and maths measured at KS2?
2. What is the impact of an opportunity to participate in Children’s University on pupils’ non-cognitive
outcomes, particularly ‘teamwork’ and ‘social responsibility’?
3. What is the impact of an opportunity to participate in Children’s University on disadvantaged pupils,
defined as those eligible for free school meals (EverFSM)?
Ethical review
Ethical approval was provided by the Durham University Ethics Committee. The project was conducted
in accordance with the School of Education Code of Practice on Research Ethics and in line with the
British Educational Research Association’s ‘Revised Ethical Guidelines for Educational Research’
(2004). There was assured anonymity and confidentiality for all participants. No individual pupil or
school is identified or identifiable. Schools and individual organisations obtained opt-out parental
consent for activities, and to be part of the evaluation.
Project team
The intervention programme was managed by the Children’s University Trust led by Debbie Bird and
Lynne Upton. The regional CU centres were managed by Laura Grigsby, Sacha Koster, Vikki Cameron-
Hall, Julie Whalley, and Sara Casey. The evaluation was led by Dr Nadia Siddiqui, Professor Stephen
Gorard, and Dr Beng Huat See of Durham University with the co-operation of a team from Leicester
University led by Professor Emma Smith and Dr Patrick White.
Trial registration
The trial was not registered in advance. The protocol was published at the start of the trial, the report
will be published in its entirety on the EEF website, the findings will be in the public domain, and the
datasets will be archived with Family Fisher Trust.

Children’s University
Education Endowment Foundation
11
Methods
Trial design
This is a school-level randomised control trial with two arms. Prior to randomisation, pupils entering
Years 5 and 6 in September 2014 across all schools were asked if they wanted to take part in CU or
similar activities. Those who said they would volunteer became the main comparators for the headline
findings – for Year 5 after two years (and for Year 6 after one year). The interim results after one year
were reported to the funders, but made no difference to the ongoing intervention or evaluation. The
funders were not able to pay for CU activities for all pupils in the relevant years in the treatment schools.
Therefore, after schools were randomised to treatment, a minimum of 20 pupils in each treatment school
were selected by schools to participate. CU were able to fund a maximum of 20 pupils per school to
take part in the intervention and consequently some treatment schools used their own funds so that all
pupils took part. The potential for spill over within schools meant that neither pupil nor class-level
randomisation was possible. Treatment schools received the Children’s University intervention in the
school years 2014/15 and 2015/16, and the control schools were able to receive Children’s University
after July 2016 when the evaluation was complete. This waiting-list approach is fair, and should reduce
any post-allocation demoralisation or dropout.
Participant selection
Schools
The funders, evaluator, and CU agreed that recruitment would target 80 schools in the north of England,
with a particular focus on Lancashire and Middlesbrough, that had been identified as areas with low
levels of existing provision. The schools were recruited by CU regional offices in Lancashire,
Middlesbrough, Blackpool, Blackburn and Darwen. The participating cohorts were Years 5 and 6, with
the former involved for two years and the latter for one year until they left primary school. The invitation
calls to schools were sent through CU centres, local authorities and publicised through CU websites.
The final invitation was accepted by 68 schools who signed the Memorandum of Understanding (MoU)
to take part in the programme, subject to the decision of blind randomisation, as well as agreeing to
take part in the evaluation process. Parental opt-out consent letters (Appendix C) were sent out by all
schools informing parents about the evaluation project and encouraging them to allow participation of
their child.
CU introduction training was provided for schools after randomisation of schools and allocation to
treatment and control groups. Seven of the treatment schools withdrew from the intervention after
training, pre-test, and starting to recruit participants. According to the MoU signed by the schools, they
continued being part of the evaluation, cooperated in sharing the data, and conducted the pupil survey.
The reasons for school drop-out are discussed later in this report.
Pupils
The funding for intervention was allocated to the developer (CU) in order to provide free places in CU
for 20 pupils per school, which they were encouraged to select from the pool of pre-identified
‘volunteers’ at random, but could use other means as appropriate. This is far from ideal from the
evaluators’ point of view. In practice, 14 of 36 intervention schools offered CU to the entire age cohort
and subsidised the extra cost themselves, 16 schools asked children to volunteer to take part, and the
other 6 initially tried to maximise participation by the most disadvantaged pupils – offering places first
to FSM-eligible pupils. Irrespective of the strategies used by schools to encourage participation, the
main analysis remained on the pre-specified group of ‘volunteer’ pupils identified prior to randomisation.

Children’s University
Education Endowment Foundation
12
Comparing all pupils in treatment schools with all pupils in control schools risked ‘diluting’ the observed
impact of the intervention because the intention was that only a subset of pupils in each school (20 per
school) would actually take part in the intervention. Instead, pupils in both treatment and control schools
were surveyed to identify those who would be willing to take part in the intervention (referred to as
‘volunteers’). The headline findings are based on all pupils in both groups who reported in the pre-test
survey before randomisation that they would like to be involved in something like CU (henceforth the
‘volunteers’). A comparison is also made between all pupils in all schools in both groups, although this
would tend to mute the apparent ‘effect’ size further.
We also compared the results for those who actually participated in CU with those in treatment schools
who did not participate (perhaps because of shortage of places). See impact evaluation section for
further details.
Outcome measures
This evaluation measures the impact of pupil participation in the social action and out-of-school hours
activities offered by Children’s University. The impact is measured for pupils’ academic attainment and
wider non-cognitive outcomes. The two primary attainment outcomes used are Key Stage 2 reading
and maths scores. The two primary non-attainment outcomes are self-reports of ‘teamwork’ and ‘social
responsibility’ (as measured by pupil survey after the intervention). The non-cognitive measures were
pre-selected by CU (and agreed with the evaluators and the EEF), from a larger list provided in the
protocol once the survey instrument had been developed and piloted.
The academic attainment measures
The attainment outcomes were measured using KS1 reading and maths results as the pre-intervention
attainment measure and KS2 reading and maths results as the post-intervention attainment measure.
These results were the scale scores for maths and reading. The use of KS2 reading as an outcome is
a change from the protocol that had specified KS2 English. However, in 2016 there were changes to
how English was assessed at KS2. Reading remained an independently marked test with raw scores,
while writing became teacher assessed with one of 3 descriptors as the outcome (i.e. no raw scores).
Owing to the teacher-assessed nature of the writing, the lack of raw scores, and evidence that the
writing is poorly correlated to reading outcomes,1 the decision was made by the EEF and the evaluator
to focus on KS2 reading outcomes only.
The rationale for using KS results is their high external validity, and also because it reduces the burden
of additional testing for both schools and pupils. It also means that it does not matter if pupils change
schools in the interim as long as they move to another maintained school in England. We obtained the
results from the National Pupil Database (NPD) by providing the Department for Education with the
Unique Pupil Numbers (UPN) and Unique School Reference Number of the participating pupils and
schools. Individual pupils’ results for each subject were extracted and sent to the evaluation team to be
matched by UPN with the survey results. There were two cohorts, and NPD provided fine point scores
for the original Year 6 and scaled scores for the original Year 5 (used for the headlines findings). The
original plan had included testing the initial Year 5 after one year but this was dropped during the
recruitment phase to reduce testing burden.
1 https://educationdatalab.org.uk/2016/09/consistency-in-key-stage-2-writing-across-local-authorities-appears-to-
be-poor/

Children’s University
Education Endowment Foundation
13
Non-attainment measures
Impact assessment of the intervention on young people’s wider outcomes was via a bespoke pupil
survey instrument developed especially for use in trials such as this (Appendix D). The instrument was
developed by the evaluators in co-operation with the CU, the EEF, and the Cabinet Office. This
instrument was piloted in two schools from areas not participating in this trial, and has been used in at
least four other evaluations to measure outcomes related to pupil’s non-cognitive skills, including the
two reported as headline outcomes here.
The instrument comprised basic questions about whether respondents had previously participated in
any activities similar to those offered by the CU, and how keen they were to undertake such activities
in the future. The pre-test results from these items were to help identify ‘volunteers’ in all schools,
regardless of whether those schools or pupils were going to be offered the intervention.
In addition, the instrument contained a set of single-item questions scored on a scale of 1–10, covering
a range of wider outcomes covering concepts including teamwork, communication, motivation, self-
esteem, confidence, resilience, civic mindedness, and future intentions. These items were taken from
validated instruments, or provided by the Office for National Statistics, reviews of the literature, prior
studies by the evaluators, or professional advice. The items are similar to the survey developed by the
Behavioural Insights Team who evaluated other youth social action programmes funded by the Cabinet
Office. This linkage was deliberate and aimed to make the results comparable with other evaluation
studies in this area. All items in the survey have clear audit trails leading to their derivation. For example,
the item on self-esteem is the one recommended for single-item use by Rosenberg (1965). All questions
are single items either, as with self-esteem, the one item recommended by the developer or, in most
cases, the item with the highest loading on the purported underlying construct (with correlations of 0.9
or greater). The widely held belief that measurement error can be reduced by making respondents
repeatedly answer the same question is an error (Gorard 2010).
The key consideration was that the items were measurable, malleable in individuals,2 and deemed
important by stakeholders – either in their own right or because they are linked to behavioural outcomes
including attendance and participation at school. The instrument was also tested for suitability (such
that all pupils could respond with minimal assistance), and as appropriate for the range of reading ages
of Year 4 and 5 pupils (the year groups of the children at pre-test). The questionnaire was designed
with mostly pre-coded tick-boxes for ease of completion. Some items were reverse coded to try and
encourage pupils to focus on the meaning of each one. Two items were based on short stories
(vignettes) in which the socially desirable responses were not as clear as in the scaled tick-box
questions. One item asked respondents about the type of occupation they might like in the future,
offering a list of possible jobs.
This trial period lasted for 24 months. After 12 months of the trial, we conducted an interim survey with
all pupils, now ending their Years 5 and 6 (June). After one further year, again in June, we conducted
a final survey with what were then Year 6 pupils; the original Year 6 had by that time moved to secondary
school. For this reason, the interim survey has around twice as many respondents, but the two-year
results are interesting because, like the attainment outcomes, they allow for a longer-term impact.
Administration of the pupil survey
The pupil survey forms were individualised with pupils’ names and UPNs printed on them. The survey
was conducted three times, once per year in three consecutive Junes (the pre-test was in the prior
2 https://educationendowmentfoundation.org.uk/public/files/Publications/EEF_Lit_Review_Non-CognitiveSkills.pdf

Children’s University
Education Endowment Foundation
14
school year). The pre-intervention survey was conducted with all pupils in the relevant year groups prior
to randomisation of schools. We observed the process of conducting the survey in all schools in order
to collect information on any challenges and barriers faced by schools staff members and pupils in
completing the surveys.
The forms were delivered by couriers to schools two weeks before the surveys were to be conducted
to allow teachers time to sort them out by classes. The survey packs included a survey administration
protocol and all of the necessary information regarding completion of the survey form, return procedure,
and allowing missing pupils a chance to complete their survey on their return. Members of the evaluation
team went to all of the schools to supervise the administration of the survey and to collect the forms.
This helped to ensure maximum return of the surveys, that the survey was conducted consistently
across all schools and also to allow any intentional or incidental biases in the way the survey was
conducted to be noted.
The printing and electronic scanning of the questionnaires were commissioned to TRAX, a commercial
company. Once the surveys were electronically marked, the data files and scanned images of the
surveys were returned to us. We re-checked the machine coding by matching each case with the
scanned images of the surveys. This process was followed in order to ensure that the coding
represented pupils’ responses properly, where they used the open comments space and so provided
important supplementary information.
Sample size
CU were funded to recruit 80 primary schools from the north of England. 68 primary schools accepted
the invitation to participate in the trial. The initial survey included all pupils in the Years 4 and 5 cohorts
– a total of 3,840 (2,166 in 36 treatment schools and 1,674 in 32 control schools). Because 68, rather
than 80, schools were recruited the developers wanted slightly more schools to work with in the first
stage, and this unequal division of the 68 was agreed with the evaluators and funders. See Figure 1 for
the participant flow diagram, which shows the Year 5 cohort. The 68 schools recruited could be
considered a small sample (in terms of degrees of freedom to allocate to two groups). However, the
ability to detect any impact will be considerably enhanced by the large number of observations (pupils)
taken for each school estimate, and the high correlation between pre- and post-test outcome scores.
Also, the trial involved non-cognitive outcomes that are generally less structurally and
socioeconomically stratified than attainment, and the effect sizes possible for wider outcomes are likely
to be higher than for attainment (Gorard and Smith 2010).
Although the results are presented for all pupils as well (see Appendix B), the headline findings compare
only those pupils in each group who had indicated on the baseline survey that they would be keen to
volunteer to take part in CU or similar before randomisation. This aimed to improve the estimate of the
effect on the outcomes since only some pupils in treatment schools actually participated and we cannot
know which pupils in the control schools would have done so if given the chance. There were 1,452
‘volunteers’ in treatment schools and 1,151 in control schools at the outset based on the pre-
randomisation survey response.

Children’s University
Education Endowment Foundation
15
Table 2: Number of pupils by treatment group, year, volunteer status, and whether actually took
part in CU
Treatment Control
Year 5 volunteers 670 588
CU participants 370 0
Year 5 non-volunteers 330 252
CU participants 154 0
Year 6 volunteers 782 563
CU participants 377 0
Year 6 non-volunteers 394 257
CU participants 157 0
Note: A further 168 pupils completed the initial survey and their results for the survey are included. However, their year group is
unclear and they have no KS1 or KS2 results in the NPD.
Randomisation
Schools were recruited by the developer (CU) and then randomised to treatment group or waiting list
control by the evaluators. Four regions participated in the study and in order to have school
representation in the sample from all four regions, randomisation was conducted for Lancashire,
Middlesbrough, Blackpool, and Blackburn with Darwen. The randomisation for all regions was
conducted at the same time.
The procedure involved a set of playing cards with a number of odd and even cards, and one card per
school. The cards were mechanically shuffled, and then dealt in turn to represent each school in that
order in the list of 68 schools. Odd cards represented Phase 1, and even cards Phase 2. The names of
schools with their allocated group were then sent to the CU lead managers who informed the schools
about the outcomes of random allocation. The order of the cards was retained for a short time in case
of queries. Randomisation was conducted in the presence of an independent staff member who
observed the process for fairness. There were 28 treatment and 26 control schools in Lancashire, 5
treatment and 3 control schools in Middlesbrough, 1 control school in Blackpool, and 3 treatment and 2
control schools in Blackburn.
Analysis
All analyses are conducted only with those pupils in the treatment and control schools at the time of the
first survey (pre-randomisation).
Primary analysis
The pre-agreed primary attainment outcomes were Key Stage 2 English and maths results for the initial
‘volunteers’ after 24 months of receiving the treatment (i.e. the original Year 5 cohort). This was
subsequently changed to Key Stage 2 Reading and Maths (see discussion in section on Outcome
measures above). The ‘volunteers’ are those who responded with interest to participating in something
like CU in the first survey. The primary non-cognitive outcomes are similarly ‘teamwork’ and ‘social
responsibility’ as assessed by pupil survey conducted after two years. The pre-intervention scores are
always presented for comparison. All analysis was undertaken by the evaluator (blind to treatment).
The protocol highlights that the headline results for attainment will be the effect size for the post-test
KS total points scores. However, analysis of baseline KS1 scores found considerable imbalance with
the treatment group clearly ahead at the outset (see results section). Therefore, the headline results

Children’s University
Education Endowment Foundation
16
are presented as progress from KS1 to KS2 scores for each subject (although both pre- and post-
intervention ‘effect’ sizes are presented first). Because KS1 and KS2 scores used difference metrics,
both were converted to standardised z-scores before gains were compared.
The EEF suggested that the headline results should be based on our regression models (see below),
for example, using prior attainment and treatment group as the predictors and subsequent attainment
as the dependent variable. However, simulations of large numbers of trials conducted as part of
preparing this report show that the substantive results based on progress scores and R, R-squared or
standardised coefficients from regression models are the same on all occasions (see also Xiao et al.
2016). This is so, as long as the correlation between pre- and post-intervention scores is high (as it is
here at around +0.7) and similar across trials. If the pre/post correlation is volatile across trials, then the
results from regression models can diverge from progress score ‘effect’ sizes because the latter is far
less affected by the change in correlation. So, put simply, if the correlation is high and static (as here)
it does not matter to the results which approach is used, and progress scores are preferred because
they are easier to understand. If the correlation is low (or variable between trials) then progress scores
are to be preferred. Nevertheless, we do present regression models as well for the primary attainment
outcome.
Please note that none of the analyses include significance tests, confidence intervals or similar figures
as these are inappropriate and completely misleading in this context (see, for example, Falk and
Greenbaum 1995, Hubbard and Meyer 2013, Colquhoun et al. 2014, Gorard et al. 2017). Because
standard errors are not relevant it follows that clustering is also not relevant. It has been shown in
repeated comparative analysis that the actual headline effect sizes are unrelated to clustering. We have
only one estimate for each ‘effect’ size, and so cannot provide a standard deviation for these, by
definition. Anything else used as a purported measure of uncertainty, such as a ‘standard deviation’
formed by repeated sub-sampling of the full dataset, would merely be a complex way of portraying the
scale of the difference, the variability of scores (both encapsulated in the ‘effect’ size already) and the
scale of the study (N for each treatment group, as already reported).
Subgroup analysis
We present headline figures on each outcome for those pupils reported as EverFSM-eligible pupils in
the NPD data, in order to assess the impact on disadvantaged pupils and the poverty gradient in results.
We also present additional analyses of the major results for boys and girls.
Secondary analysis
We present results for ‘volunteers’ in the initial Year 6 after only one year, which is less time to find a
difference. Other attitudinal outcomes, including occupational aspiration, have also been analysed.
The funders provided free places on CU activities for 20 pupils per participating school. This means that
each school either had to select 20 pupils or use their own funds to permit all to take part. Of the initial
36 treatment schools, six did not actually pursue the intervention from the outset, 16 used only the 20
funded places, and 14 used the whole year groups. We conducted a simple analysis comparing the
progress in maths, reading, and attitudes of four groups of pre-specified ‘volunteer’ pupils:
(1) The ‘volunteers’ in the control schools
(2) Those ‘volunteer’ pupils in the treatment schools who did not actually participate in CU
(3) Those ‘volunteer’ pupils known to be participating in the intervention
(4) Those ‘volunteer’ pupils from the 6 treatment schools that withdrew from the intervention as it
started.

Children’s University
Education Endowment Foundation
17
If the intervention were effective we would expect the full participants (group 3) to have better outcomes
than the ‘volunteers’ from the control (group 1) and dropping out schools (group 4). All were willing to
take part in CU, but did not ultimately receive the intervention. The same could also be said of group 2,
but here they may be influenced indirectly by the youth social action undertaken by others in their
classes.
Where the outcome measures are real numbers, or can be treated as real numbers (such as with the
11 scaled attitude items – see Appendix D), any differences between the two groups are converted into
a Hedge’s effect size. Where the outcomes measures are frequencies, the two groups are compared
in terms of post hoc odds ratios (a different form of ‘effect’ size for categorical or frequency data). For a
table with four cells representing two treatment groups and two possible outcomes, the odds ratio of
the first outcome for the intervention group compared to the control group is the first cell multiplied by
the last cell, divided by the second cell multiplied by the third cell.
All key results are presented with a simple sensitivity analysis – the number of counterfactual cases
needed to disturb the finding, or NNTD (Gorard and Gorard 2016). This can be computed by multiplying
the achieved ‘effect’ size by the number of cases in the smallest group, and then comparing it to the
number of missing cases. If the answer is clearly greater than the number of missing cases, then the
finding cannot be due to biased missing data. The larger the answer is the more secure the finding is.
Many of the supplementary analyses are in Appendix A. None is a substitute for the simple headline
results.
Implementation and process evaluation
The process evaluation provided formative evidence on all phases and aspects of the intervention from
the selection and retention of schools, through the training of teachers, to testing the eventual outcomes.
This was used to help assess fidelity to treatment, implementation issues, and the perceptions of
participants, including any resentment or resistance. It also enables us to identify the features of
successful implementation as well as highlighting potential barriers. We conducted the process
evaluation in co-operation with the CU managers and school leaders who were mainly in charge of the
intervention delivery in their respective regions and schools.
The process evaluation covers the following aspects of the programme:
The introductory CU workshop for all participating schools
Consultation meetings with the CU management group
Informal interviews with pupils and parents
Observations of the out-of-school hours activities and CU graduation ceremony
Interviews with the CU managers, head teachers, and teachers in CU schools and as well as schools in the control group
Analysis of the CU website to understand the objectives of the programme, and their regular updates on the features and activities followed.
The nature of the CU intervention is not strictly structured in terms of delivery. Regional factors play a
role in the choice of activities, access to resources, and the opportunities created by schools for pupils’
social action. However, standard procedures for logging the activities in the Passport to Learning
allowed us a chance to see a broad range of implemented activities. The CU managers from the
participating four regions shared the data on activities followed in each school. The CU managers were
also asked to provide us with their feedback on each school’s participation level at the interim and later
stages of the evaluation. This information gave us a general idea about the factors that could be a
barrier to implementation of school-based social action activities. The evaluators closely worked with
the CU managers in assembling formative information about the participating schools.

Children’s University
Education Endowment Foundation
18
The CU managers were the primary contact with the participating school so the data for pupils’
attendance in the intervention activities was collected by them and shared with us for our information
and analysis. Further formative data from pupils and teachers was collected by the evaluation team
members. Observations were first recorded as hand-written field notes by the evaluation team member
who conducted the school visit. After each visit the evaluator team member developed a report of the
visit that included the detailed descriptions of the field notes, teachers’ feedback and comments and
details about conversations with the pupils. All visit reports were shared and read by the evaluation
team members and important themes and issues were extracted and synthesised for reporting.
We made over 200 visits to the 68 schools in both groups, mostly to deliver, administer or collect
surveys. On each occasion we took any available opportunities to talk to staff and pupils, or to observe
a relevant session. In addition, we observed 12 different CU activities in 10 treatment schools, attended
three training events and two graduation ceremonies, and interviewed 6 CU managers, 16 school staff
members including 2 head teachers, 6 parents and 30 pupils.
Costs
The cost information was collected from the central CU office in Manchester. They provided the
information as a total cost of the programme over three years. The cost break-down included
administrative costs of the programme, and per child and per school costs
Timeline
Table 3: Outline of timeline
Date Activity
March 2014 Pupils survey for the non-cognitive measures was designed
April 2014 The survey was piloted, pupil data was collected for the survey printing
June 2014 First pupil survey conducted in all 68 schools
10th July 2014 Randomisation was conducted by the evaluators at Durham University
14th July 2014 CU managers were informed about the randomisation results
July 2014 CU introduction and school staff training on record-keeping conducted
September 2014 Parental consent letter sent out by the schools
September–October 2014 Intervention plans and resources were set up by the CU managers
November 2014–June
2015
Intervention conducted in treatment schools, evaluators conducted
observation visits in schools, collected pupil-level data needed for
analysis. KS2 tests were conducted in May 2015.

Children’s University
Education Endowment Foundation
19
July 2015 Second round of survey conducted in all 68 schools
August–September 2015 Received coded survey data from Trax, cleaned the data files and
produced interim results
October–May 2016 School visits for process evaluation
June 2016 Third round of survey conducted
January 2017 Validated KS2 results obtained via the NPD

Children’s University
Education Endowment Foundation
20
Impact evaluation
Participants
The analysis was intention-to-treat. Therefore for the second and third round of the surveys we followed
pupils to their new schools where possible. We found 20 such pupils who successfully completed the
surveys, to be included in the final analysis.
Some dropout can be expected in a study lasting over two years. According to the existing evidence, in
England non-compulsory pupil mobility between schools is 3%, and this is higher among pupils in
primary schools. During Key Stage 1 years 6% pupils change schools, and nearly 5% change school
during Key Stage 2 years (Machin et al. 2006). On this basis, the dropout of around 2% for attainment,
and 9% for attitudes after two years, in this study is less than would be expected even if no trial had
taken place.
Children’s University
Education Endowment Foundation
21
All
oca
tio
n
Rec
ruit
men
t A
nal
ysi
s F
oll
ow
-up
Agreed to participate
(school n = 68)
Randomised (school n = 68; pupil n =
1,840, ‘volunteers’ n = 1,258)
Excluded (school n = 0)
Not meeting inclusion
criteria (school n = 0)
Other (school n=0)
Waitlist control
(business as usual)
school n = 32
pupil n=840
Approached (school
n = 120) Did not agree to participate
(school n = 52)
Post-test data
collected
schools = 32
‘volunteers’ (Maths)
n = 577
Figure 1: Participant flow diagram for pupils after two years
Intervention
school n = 36
pupil n = 1,000
‘volunteers’ n=670
Not
analysed
As above
Analysed for
headline
As above
Not analysed
As above
Analysed for
headline
As above
Lost to follow up
school n = 0
‘volunteers’
(Maths) n = 16
‘volunteers’
(Reading) n= 20
‘volunteers’
(attitudes) n= 37
Post-test data
collected
schools = 36
‘volunteers’
(Maths) n = 654
‘volunteers’
(Reading) n= 650
‘volunteers’
(attitudes) n= 633
Lost to follow up
school n = 0
‘volunteers’
(Maths) n = 11
‘volunteers’
(Reading) n= 14
‘volunteers’
(attitudes) n= 55

Children’s University
Education Endowment Foundation
22
Table 4: Characteristics of attainment measures
Stage N [schools/pupils]
(n = intervention;
n = control)
Correlation between
pre-test (+other
covariates) & post-
test
ICC
Analysis (i.e. available
pre- and post-test)
68 (36:32) Maths 0.75
Reading 0.69
Maths 0
Reading 0
Note: ICC is relevant only for estimating a design effect in order to try and estimate the ‘standard error’. Since neither of the
headline analyses (for volunteers and EverFSM-eligible pupils) involve cases actually randomised as such, there is no standard
error. Even for the analyses involving all pupils (in the Appendix), over 5% of scores are missing and so again there can be no
standard error by definition.
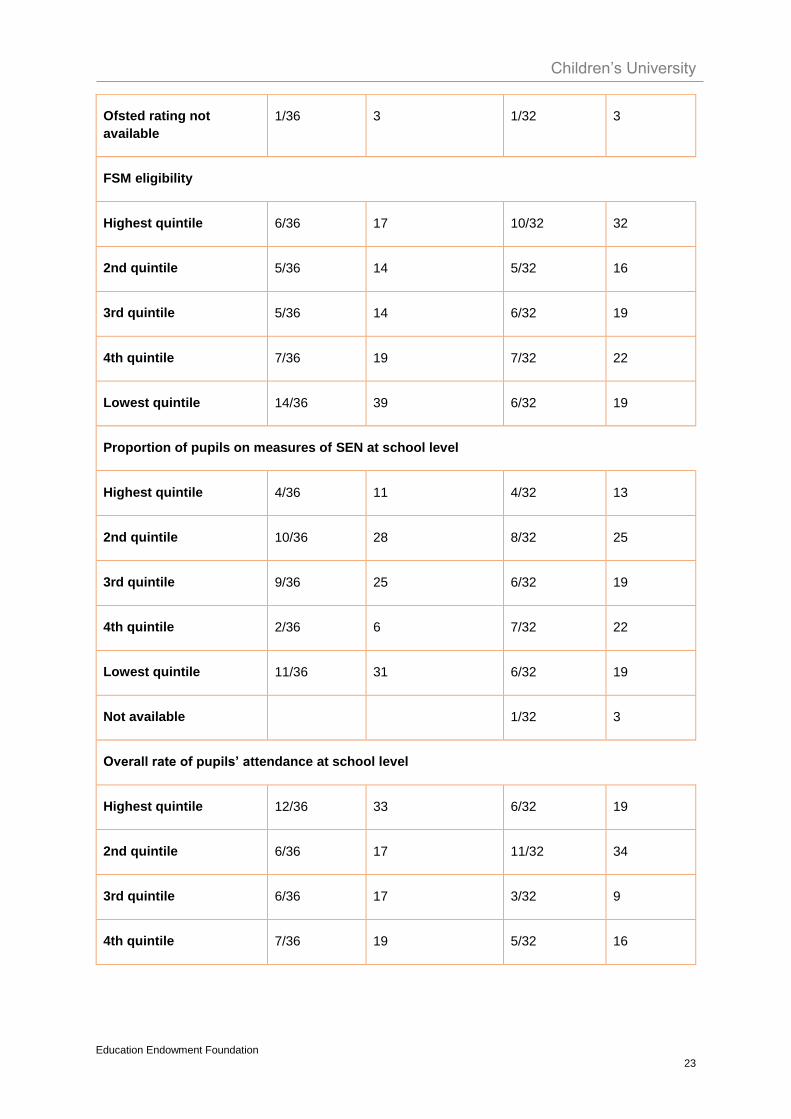
Pupil characteristics
The schools in this study are all state-maintained primary schools. Ofsted has developed a data
dashboard for school characteristics that ranks schools into five quintiles where each quintile represents
20% of the data. A school in the highest quintile is in the top 20% of schools for that characteristic in
comparison to all other schools. Table 5 describes characteristics of the participant schools according
to the Ofsted data dashboard and annual school-level census (SLASC). No schools withdrew from the
evaluation. The treatment group has slightly more ‘Outstanding’ schools with overall higher attendance,
and the control has more FSM-eligible and SEN pupils. These factors may be reflected in the higher
prior outcome scores for the treatment group (described elsewhere).
Table 5: Baseline comparison
Variable Intervention group Control group
School-level n/N Percentage n/N Percentage
School characteristics
Ofsted rating
Outstanding 11/36 31 7/32 22
Good 21/36 58 20/32 63
Inadequate 0/36 0 1/32 3
Requires improvement 3/36 8 3/32 9
Children’s University
Education Endowment Foundation
23
Ofsted rating not
available
1/36 3 1/32 3
FSM eligibility
Highest quintile 6/36 17 10/32 32
2nd quintile 5/36 14 5/32 16
3rd quintile 5/36 14 6/32 19
4th quintile 7/36 19 7/32 22
Lowest quintile 14/36 39 6/32 19
Proportion of pupils on measures of SEN at school level
Highest quintile 4/36 11 4/32 13
2nd quintile 10/36 28 8/32 25
3rd quintile 9/36 25 6/32 19
4th quintile 2/36 6 7/32 22
Lowest quintile 11/36 31 6/32 19
Not available 1/32 3
Overall rate of pupils’ attendance at school level
Highest quintile 12/36 33 6/32 19
2nd quintile 6/36 17 11/32 34
3rd quintile 6/36 17 3/32 9
4th quintile 7/36 19 5/32 16

Children’s University
Education Endowment Foundation
24
Lowest quintile 5/36 14 7/32 22
Pupil characteristics
Pupil-level n/N (missing) Percentage n/N (missing) Percentage
Eligible for FSM 1258/7641 16.5 1452/7026 20.7
Boys 4062/7641 53.2 3961/7026 52.5
Average KS2 points scores 15.4 14.7
Note: The NPD did not provide data on pupil-level SEN for this study (and so the published quintiles are used above).
Note: These figures are for the schools involved in the evaluation. The characteristics and prior attainment of the pupils actually
in the treatment and control groups are detailed in the results section.
Missing cases
Those missing from the control group have lower attainment, but only to the same extent as for pupils
in the control group for whom there is KS2 data (as the treatment group was ahead at the outset, see
below). There is no reason to assume that dropout is unbalanced by prior attainment (Table 6). The
data missing from attainment scores could not be matched in the NPD due to reasons such as errors
in UPN details, pupils absent on the Key Stage 2 assessment days, or movement in or out of England.
Table 6: KS1 scores for those in initial survey missing KS2 scores
N Reading
progress
Standard
deviation
Maths
progress
Standard
deviation
Treatment 96 16.1 4.0 16.0 3.5
Control 39 15.6 4.0 15.8 3.7
Overall 135 15.8 4.0 15.9 3.6

Children’s University
Education Endowment Foundation
25
Impact evaluation
Outcomes and analysis
Headline findings for ‘volunteer’ pupils after 2 years
It is clear that due to the vagaries of randomisation, the treatment group was ahead of the control group
in terms of KS1 scores for both English and maths (Tables 7 and 8). The prior KS1 ‘effect’ sizes
computed from Tables 7 and 8 are +0.10 for maths and +0.16 for reading. This means that, although
there is also a positive post-intervention ‘effect’ size for both subjects, a post-intervention-only analysis
as presented in Tables 7 and 8 would be misleading as it would not take account of the groups’ starting
points.
Table 7: Post-intervention analysis of KS2 outcomes in maths after two years, ‘volunteer’ pupils
Group N KS1
maths
points
SD Pre-
‘effect
size’
KS2
maths
score
SD Post-
‘effect
size’
Treatment 654 16.23 3.25 – 103.49 6.58 –
Control 577 15.88 3.59 – 102.17 6.68 –
Overall 1,231 16.07 3.42 +0.10 102.87 6.65 +0.20
Table 8: Post-intervention analysis of KS2 outcomes in reading after two years, ‘volunteer’
pupils
Group N KS1
reading
points
SD Pre-
‘effect
size’
KS2
reading
score
SD Post-
‘effect
size’
Treatment 650 16.44 3.67 – 103.28 8.43 –
Control 574 15.84 3.97 – 101.24 7.85 –
Overall 1,224 16.15 3.82 +0.16 102.32 8.22 +0.25
Therefore, Tables 9 and 10 present the results in terms of pupil progress (their gain scores) from KS1
to KS2 for each group. These are treated as the headline figures, and it is possible to conclude from
these that the intervention has had a slight benefit in terms of academic outcomes. The ‘effect’ sizes in
Tables 9 and 10 are smaller than in corresponding Tables 7 and 8 because they take into account that
the treatment group was ahead at the outset. The number of counterfactual cases that would be needed
to disturb the effect size in maths (NNTD) would be 87, and the NNTD for reading would be 64. Both
results are therefore reasonably robust. But because these NNTD figures are of the same order of

Children’s University
Education Endowment Foundation
26
magnitude as the number of missing cases, it is possible that the headline findings are partly created
by missing data.
Table 9: KS1–KS2 progress in maths after two years, ‘volunteer’ pupils
Group N Maths gain
z-score
SD ‘Effect size’
Treatment 654 +0.049 0.74 –
Control 577 –0.062 0.77 –
Overall 1,231 –0.003 0.76 +0.15
Note: In this table and all that follow, because the treatment group was ahead at the outset, this gain score positive result cannot
be due to regression to the mean.
Table 10: KS1–KS2 progress in reading after two years, ‘volunteer’ pupils
Group N Reading gain z-
score
SD ‘Effect size’
Treatment 650 +0.048 0.77 –
Control 574 –0.051 0.83 –
Overall 1,224 +0.001 0.80 +0.12
In addition to academic outcomes, there are 11 attitude responses, and the full results for all of these
are in Appendix A. Of these, ‘teamwork’ and ‘social responsibility’ were pre-selected, and agreed with
developers and funders, as the headline items. As with the attainment outcomes, the treatment group
was slightly ahead of the control from the outset in terms of teamwork (+0.06), but not social
responsibility. This may be partly responsible for the small positive post-intervention outcomes (Tables
11 and 12).

Children’s University
Education Endowment Foundation
27
Table 11: Post-intervention analysis of attitude to teamwork after two years, ‘volunteer’ pupils
Group N Pre-
survey
SD Pre-‘effect
size’
Post-
survey
SD Post-
‘effect
size’
Treatment 625 6.86 2.95 – 7.00 2.62 –
Control 529 6.68 3.15 – 6.67 2.77 –
Overall 1,154 6.78 3.05 +0.06 6.85 2.70 +0.12
Note: Based on ‘I can work with someone who has different opinions’. Only includes cases with pre- and post-intervention results.
Table 12: Post-intervention analysis of attitude to social responsibility after two years,
‘volunteer’ pupils
Group N Pre-
survey
SD Pre-
‘effect
size’
Post-
survey
SD Post-
‘effect
size’
Treatment 628 8.23 2.65 – 7.67 2.53 –
Control 528 8.28 2.70 – 7.45 2.61 –
Overall 1,156 8.26 2.67 –0.02 7.57 2.57 +0.09
Note: Based on ‘I want to try and make my local area a better place’.
Therefore, the attitude results are also presented as gain scores from pre- to post-intervention (Tables
13 and 14). For both outcomes the treatment group were slightly ahead in terms of progress. Given that
the results were always going to be muted because only around 50% of the initial volunteers actually
took part in CU (and that other attitudes show progress as well), these findings may be an indication of
slight benefit from the treatment.
Table 13: Progress in teamwork after two years, ‘volunteer’ pupils
Group Progress SD ‘Effect size’
Treatment +0.13 3.47 –
Control +0.00 3.84 –
Overall +0.07 3.64 +0.04

Children’s University
Education Endowment Foundation
28
It is interesting to note that, although the progress score shows a positive effect of the treatment on
social responsibility, both treatment and control groups’ scores declined from the pre-test. Normal
decline in certain attitudes during childhood has been reported in other studies (Washburn et al. 2011).
Table 14: Progress in social responsibility after two years, ‘volunteer’ pupils
Group Progress SD ‘Effect size’
Treatment –0.55 3.29 –
Control –0.82 3.48 –
Overall –0.68 3.38 +0.08
The number of counterfactual cases that would be needed to disturb the effect size in teamwork (NNTD)
would be 21, and the NNTD for reading would be 42. The first result is not very robust. The second is
better. But because both NNTD figures are at or below the order of magnitude of the number of missing
cases, it is possible that the headline findings are partly created by missing data.
Headline findings for FSM-eligible pupils
As with the volunteer pupils, the outcomes for EverFSM-eligible pupils were better after two years in
the CU group for both maths and English (Tables 15 and 16). And again, this is at least partly because
these pupils were ahead at the outset (by +0.09 for maths and +0.13 for reading).
Table 15: Post-intervention analysis of KS2 outcomes in maths after two years, EverFSM-eligible
pupils
Group N KS1
maths
points
SD Pre-
‘effect’
size
KS2
maths
score
SD ‘Effect’
size
Treatment 219 14.89 3.01 – 100.74 6.41 –
Control 278 14.58 3.74 – 99.89 6.72 –
Overall 494 14.72 3.44 +0.09 100.26 6.59 +0.13

Children’s University
Education Endowment Foundation
29
Table 16: Post-intervention analysis of KS2 outcomes in reading after two years, EverFSM-
eligible pupils
Group N KS1
reading
points
SD Pre-
‘effect’
size
KS2
reading
score
SD Post-
‘effect’
size
Treatment 216 14.96 3.82 – 100.36 8.32 –
Control 277 14.43 4.21 – 98.94 7.86 –
Overall 493 14.66 4.05 +0.13 99.56 8.09 +0.18
This difference pre-intervention is taken account of in Tables 17 and 18. The progress scores suggest
a very small benefit linked to the intervention for EverFSM-eligible pupils in maths and reading.
Table 17: KS1–KS2 progress in maths, after two years, EverFSM-eligible pupils
Group Maths gain score SD ‘Effect size’
Treatment –0.07 0.76 –
Control –0.11 0.78 –
Overall –0.09 0.77 +0.05
Table 18: KS1–KS2 progress in reading, after two years, EverFSM-eligible pupils
Group Reading gain score SD ‘Effect size’
Treatment –0.08 0.82 –
Control –0.10 0.89 –
Overall –0.09 0.86 +0.03
The difference for EverFSM-eligible pupils in teamwork results especially, but also social responsibility,
is positive after two years (Tables 19 and 20). But as with the other outcomes the two groups were not
balanced at the outset.

Children’s University
Education Endowment Foundation
30
Table 19: Post-intervention analysis of teamwork, EverFSM-eligible pupils, two-year result
Group N Pre-
survey
SD Pre-
‘effect’
size
Post-
survey
SD Post-
‘effect’
size
Treatment 206 6.43 3.35 – 6.90 2.79 –
Control 247 6.11 3.50 – 5.85 2.97 –
Overall 453 6.26 3.44 +0.09 6.33 2.93 +0.36
Table 20: Post-intervention analysis of social responsibility, EverFSM-eligible pupils, two-year
result
Group N Pre-
survey
SD Pre-
‘effect’
size
Post-
survey
SD Post-
‘effect’
size
Treatment 206 8.10 2.91 – 7.60 2.71 –
Control 247 8.04 3.02 – 7.15 2.86 –
Overall 453 8.07 2.97 +0.02 7.35 2.80 +0.16
Therefore, the safest estimate of the impact comes from the progress scores in Tables 21 and 22. Both
are positive, and slightly higher for these EverFSM pupils than overall.
Table 21: Progress in teamwork after two years, EverFSM-eligible pupils
Group Progress SD ‘Effect size’
Treatment 0.47 3.68 –
Control –0.20 4.07 –
Overall 0.11 3.91 +0.17

Children’s University
Education Endowment Foundation
31
Table 22: Progress in social responsibility after two years, EverFSM-eligible pupils
Group Progress SD ‘Effect size’
Treatment –0.53 3.68 –
Control –0.92 3.95 –
Overall –0.74 3.83 +0.10
Overall, with the other results in Appendix A, the impact findings suggest promise for both academic
outcomes and a variety of non-cognitive outcomes, and for reducing the poverty gap in the attitude
results.
Additional findings for on-treatment ‘effects’
One way of assessing this further is to consider the results only for those in treatment schools who
actually took part in CU. There are four ‘volunteer’ groups to compare: those in the control, those
participating in CU activities, those in treatment schools but not participating, and those whose schools
were randomised to treatment but withdrew from the intervention. Pupils taking part in CU had higher
post-test and gain scores than the control for all four headline outcomes (Tables 23 to 26). Pupils taking
part in CU had the highest gain scores for reading and teamwork of all four groups (including those
withdrawn or not participating in treatment schools). However, those pupils in schools that withdrew or
who otherwise did not participate in CU had gain scores for all four outcomes that were similar to and
sometimes higher than those pupils who did participate. Of course, the schools dropping out from the
intervention were not random and so may have been on a course to higher outcomes anyway.
Nevertheless, this finding should merely act as a slight caution about whether any of the impact findings
are caused by actual participation in CU or simply being in the same cohort as those assigned to
participate in CU.
Table 23: KS2 results after two years by level of actual participation, ‘volunteers’
N KS1
maths
SD Pre-
‘effect’
size
KS2
maths
SD Post-
‘effect’
size
Maths
gain
score
SD Gain
‘effect’
size
Control 563 15.85 3.59 – 102.14 6.69 – –0.12 0.74 –
Not
participating
218 16.06 3.39 +0.06 103.20 6.94 +0.16 –0.02 0.79 +0.14
Withdrawn 78 16.38 3.20 +0.16 103.86 6.30 +0.26 –0.02 0.71 +0.14
Participating 357 16.36 3.18 +0.15 103.61 6.41 +0.22 –0.03 0.67 +0.12
Overall 1,209 16.11 3.39 – 102.97 6.57 – –0.07 0.73 –

Children’s University
Education Endowment Foundation
32
Table 24: KS2 results after two years by level of actual participation, ‘volunteers’
N
KS1
readin
g
SD
Pre-
‘effect
’ size
KS2
reading SD
Post-
‘effect’
size
Reading
gain
score
SD
Gain
‘effect’
size
Control 560 15.80 4.0 – 101.16 7.82 – –0.17 0.80 –
Not
participating 218 16.21 3.62 +0.11 102.78 8.28 +0.20 –0.06 0.79 +0.14
Withdrawn 78 16.85 4.31 +0.27 104.04 8.29 +0.35 –0.07 0.82 +0.13
Participating 353 16.54 3.54 +0.19 103.50 8.55 +0.28 –0.05 0.72 +0.15
Overall 1,209 16.15 3.82 – 102.32 8.22 – –0.11 0.78 –
Note: All ‘effect’ sizes are in relation to the control group.
For the two headline attitude results, those in the treatment group not participating in the intervention
had outcomes as good as or better than those participating, and both had better outcomes than the
control (Tables 25 and 26).
Table 25: Teamwork results after two years by level of actual participation
N Pre-
teamwork SD
Pre-
‘effect’
size
Post-
teamwork SD
Post-
‘effect’
size
Teamwork
gain score SD
Gain
‘effect
’ size
Control 520 6.66 3.17 – 6.68 2.78 – 0.03 3.85 –
Not
participating 216 6.82 3.09 +0.05 6.95 2.85 +0.10 0.12 3.70
+0.02
Withdrawn 68 7.04 2.97 +0.12 7.06 2.68 +0.14 0.01 3.18 –0.01
Participating 350 6.87 2.85 +0.07 7.00 2.47 +0.12 0.11 3.37 +0.02
Overall 1,154 6.78 3.05 – 6.85 2.70 – 0.07 3.64 –

Children’s University
Education Endowment Foundation
33
Table 26: Social responsibility results after two years by level of actual participation
Both of these attitude findings should again add slight caution as to the extent that any improvements
noted are the result of actual participation in the intervention itself.
Additional analyses
In addition to the analyses reported above, analyses were conducted for the interim findings for pupils
after one year, for all pupils, not just volunteers, and for boys and girls separately. Furthermore, a
regression analysis was carried out in line with current EEF guidance. The results for all of these
analyses can be found in Appendix A.
Costs
The immediate cost for participation in the CU programme is a standard per pupil (£6) that is paid by
the schools or individual parents. This covers the cost of the Passport to Learning, that is £5 (this is not
annual but paid each time a new passport is required) and an e-passport licence (annual) of £1. The
maximum cost to a child participating through their school is £6 per passport, and schools have the
option to absorb this cost or pass it on to the families.
Staff must be prepared to commit extra time to the intervention (not included as a cost here). And
outside organisations, including universities for graduation ceremonies, provide time and resources as
in-kind contributions. There are several other costs, as presented in Table 27, as averaged for the 29
schools who completed the intervention. Figures are estimates provided by the developers, and costs
are estimated over three years for comparability across EEF projects. If a school were to deliver this
intervention over three years, the cost increases in the Graduation events because these events would
have the maximum number of children completing successfully in the third year of the project. In the 1st
and 2nd years, schools/children were not all ready to receive the CU certificates. The cost for travelling
to CU destinations, activities and material estimates also increased because the intervention was more
mature and involved more children in each activity as compared to the first year.
N Pre-social
responsibility SD
Pre-
‘effect’
size
Post- social
responsibility SD
Post-
‘effect’
size
Social
responsibility
gain score
SD
Gain
‘effect’
size
Control 519 8.29 2.71 – 7.47 2.60 – –0.82 3.50 –
Not
participating 216 8.06 2.80 –0.09 7.64 2.67 +0.07 –0.39 3.30 +0.13
Withdrawn 68 7.93 2.78 –0.13 7.71 2.71 +0.09 –0.22 3.28 +0.18
Participating 353 8.39 2.51 +0.04 7.66 2.43 +0.07 –0.72 3.27 +0.03
Overall 1,156 8.26 2.67 – 7.57 2.57 – –0.68 3.38 –

Children’s University
Education Endowment Foundation
34
Table 27: The average cost of CU per school
The true cost for the CU activities may be more, and will vary according to the school, region where the
school is located, size of the school, resources available, and staff members engaged in the
organisation and management of the activities. Some examples of the CU activities and their direct
costs, not counting staffing costs, are shown in Table 27. If CU costs £3,287 in total over three years,
and assuming 25 volunteering eligible pupils per school across two year groups, the average cost per
pupil per year is around £45 (including the £6 CU membership fee, as above). This is considered ‘low’.
Outside of this trial, CU is usually offered on a whole-school basis, which could lower the cost per pupil
from the figure reported here.
Expense Year 1 Year 2 Year 3 Details
Average CU
membership fee for
large primary
£350 £500 £ 500 Membership fees vary significantly
depending on local funding
arrangements/proportion subsidises by
local CU
Travel to graduation
events
£300 £450 £600 Pupils and staff attending: coach
transport
Travel to validation
training for school
coordinator
£25 Depending on size of school, more than
one teacher plus volunteers/TAs, and
proximity to schools
Photocopying,
materials, printing
£125 £187 £250 Handbooks and information material
Total £800 £1,137 £1,350

Children’s University
Education Endowment Foundation
35
Process evaluation
Implementation
Many of the participating schools already had OFSTED-recognised after-school clubs that mainly gave
working parents some support by keeping children in schools, while providing pupils with study support,
and offering them a broader range of experiences and interests. However, the purpose of out-of-hours
activities offered by CU is to extend reward-based learning to the out-of-school context. Many of the
participating schools already had existing after-school clubs but CU honed these by motivating the
schools to regulate activities through Passports to Learning and providing an opportunity for pupils to
participate in a graduation ceremony wearing gowns and mortarboards. The newest element for some
schools was the CU social action modules, that they did not already have comparable clubs for.
The level of school participation varied across treatment schools and was largely observed to be
dependent on school leadership and challenges or targets faced by schools. CU could only recruit 68
schools, even though it was offered free to 20 pupils in each school, and after the group allocation and
initial training, six schools from the treatment group dropped out from participation in the CU (and
another one later). Not all of the control schools expressed interest in pursuing CU once the trial was
over. This may be indicative of a lack of interest in what CU offers that is additional to what schools
already do (or believe that they do). All schools that had signed the MoU and were randomised
continued to provide data and cooperate with the evaluation process.
Ten teachers involved in the intervention schools questioned the lack of financial support or other
benefits to schools for organising after-school activities, visits to Learning Destinations (such as
historical places, museums, libraries, hospitals, botanical gardens, and science labs), and exploring
ideas and opportunities of social action. Some of the teachers also showed mild resentment at the
increased workload involved in monitoring pupils’ participation, logging individual pupils’ activities and
spending time on each activity.
A teacher said:
If all children got was a ‘graduation ceremony’ at the end of the year, what would be
the benefit for the schools and teachers to complete all the paperwork and ‘force’ the
creation of new clubs?
Several school leads raised the point that their schools were already engaged in social action activities,
school visits to museums, libraries, and historic places. Participation in CU was not considered essential
but rather an additional cost for staff time and engagement.
However, not all school leaders perceived participation in the CU in the same way. Some were eager
to participate because they wanted to establish after-school clubs and social action activities for the first
time and participation in the project was seen as beneficial for involving parental support. Some schools
already had established activities and wanted these endorsed by the CU project. The CU endorsement
allowed schools to improve school profile for Ofsted inspections and parental engagement. Reward-
based out-of-school hours participation was considered important for pupil motivation. It was also
reported by a headteacher that participation in what they termed a ‘recognised’ programme (CU) helped
their school to justify the expenditure of pupil premium funds.
According to one regional CU manager, school leadership played a key role in implementing out-of-
school learning and supporting disadvantaged pupils through outreach activities. If the school
leadership does not consider pupil participation in social action or after-school activities beneficial for
pupils, they are less likely to fully engage. Sometimes there are also restrictions such as lack of time or

Children’s University
Education Endowment Foundation
36
priority, due to major academic improvement targets set by Ofsted. In some cases, schools cannot
afford having extra staff time for taking the responsibility for tasks done in out-of-school hours.
The CU regional staff member also reported that the implementation of social action activities could
face challenges due to the geographical location of the schools. Schools in urban centres had various
opportunities to engage with partnerships or approach Learning Destinations with low travel costs.
However, schools in rural areas needed more resources to create wider engagement opportunities for
pupils.
Parental support and involvement could be a factor in pupils’ full engagement in the after-school
activities. One teacher provided her feedback on parental support, saying that it is sometimes really
hard to engage parents from the most disadvantaged backgrounds. In several cases, the school
expects parental engagement in the form of sending prompt consent for their children’s participation in
an activity, visiting schools on club events and community days to support their child’s participation,
attending school ceremonies and celebrations, supporting children in providing prompt pick-and-drop
services, and arranging social and outdoor activities for a wider experience of their children. School
leaders often mentioned that some parents do not cooperate with schools. One teacher said that it is
sometimes a challenge to effectively communicate with some parents even regarding important
activities in which their child needs to participate.
There has been a very little parental support. Some parents really do not engage with
us and we find this a most challenging part of the programme. It is difficult to raise
children’s aspiration unless parents are involved with us.
Another teacher commented:
A number of children have been very enthusiastic about CU. Parental support has
varied across the board but some parents have been keen to have their children
graduate from a university.
The CU managers also gave their views on the importance of parental support and cooperation in
meeting the objectives of out-of-school learning opportunities and engagement in social actions. The
CU manager reported that some parents are eager and keen to support schools and pupils and it has
been observed that in several areas with dense populations of disadvantaged communities, social
actions can be well supported by parents. One CU manager said that some of the events and the CU
Graduation ceremony are highly appreciated by families from poor backgrounds. Attending a graduation
ceremony in a university campus is sometimes an inspiration for children and their parents to progress
further in education.
The evaluation team visited intervention schools to collect information on the CU activities. A general
observation was that after-school clubs and out-of-school activities were popular and well attended by
pupils. However, the social action activities themselves were not always so frequent or fully integrated
with out-of-hours activities. This may have been because they were the newest element of CU (and so
perhaps less well developed). The schools provided various opportunities for children to participate in
various sports, arts and crafts, singing and drama, cookery, sewing, board games, and photography.
According to one CU manager, such after-school clubs and out-of-school activities are easier to conduct
safely where school staff have control. However, social action activities often require preparatory work
such as risk assessments and protocols for pupils’ health and safety checks, and parental consent. All
of the intervention schools completed some sort of social action as a necessary requirement of
completing 15 hours per term. Details of some of the social action projects observed during schools
visits are given below.

Children’s University
Education Endowment Foundation
37
Charity and fund-raising activities
The CU recommended that all intervention schools utilise the time of existing after-school clubs and
out-of-school activities and develop further activities that could integrate with community
events. One school had a gardening activity as an after-school club, where pupils were helped to grow
vegetables. The school arranged community days to sell the vegetables grown in the garden and raise
money for donations to a cancer research foundation. A few schools organised community days to sell
cupcakes and raised funds to support a children’s hospital. Another school helped pupils in making and
selling arts and crafts items and donations were made to a local home for elderly people. Such activities
were first introduced in the school assemblies and information was also provided to parents for
supporting the cause. The pupils were given passport credit stamps for the time that they spent in
preparation and execution of these activities.
Several schools organised after-school sessions making packs for donations to food banks for the
homeless or disadvantaged. Pupils were asked to collect items that were not used in their homes, such
as clothes, utensils, and toys. The message introduced to pupils in these activities was to help
communities who need help and that sharing is better than wasting. The schools donated items to
organisations such as Oxfam and the Red Cross. The CU managers worked closely with the schools
in providing general support and helping teaching staff in giving credits for pupils’ participation.
Some schools selected a charity support cause such as health, pets, nature, or people with disabilities.
These choices were guided by the CU managers, with teacher and pupil input. A school leader gave
the following comments on pupils’ participation in social action:
The children had an opportunity to look at and share with family members an
information booklet published by the kidney for life charity. We chose this charity
because it supported a young family in our school community through a difficult time.
Looking at families less fortunate than themselves, the children were able to discuss
how thankful they are for their own good health and family. Having raised money for
this charity the children were keen to further their efforts to include other families who
needed support. They decided on supporting a local food bank. Working as a whole
group developed their leadership skills and empathy for others.
Another teacher made the following comments:
All activities encouraged children to respond to a local need recognising that some
families are not so lucky as their own. The activities also allowed children to recognise
their own leadership qualities, organising, speaking publicly to other class members,
encouraging group members.
Pupils also participated in charity and fund-raising activities with help and support provided by parents,
family, and community members. These activities included participation in charity events and collection
services in the local Church and participating in awareness walks. The CU recognised these activities
as pupils’ participation in social action and teachers were asked to award credits to pupils’ individual
efforts.
Another teacher commented:
We raised a total of £72.06. Feedback from parents has been very positive, praising
their children’s effort and their response to those less fortunate than themselves. The
children enjoyed working as a group, raising money and were thrilled that their efforts
could make a difference. We collected over 100 items for the local food bank.
Children’s University
Education Endowment Foundation
38
Some pupils also commented on fund raising:
I helped in Macmillan charity and gave money to brother (sic) so that he could go to
Kenya and build houses for poor people.
I participated in a ballet show for raising charity. It was good to help people for raising
money for homeless and poor people.
Volunteering and community work
The schools developed opportunities for volunteer work in out-of-school hours. Pupils were encouraged
to participate in school councils and volunteer to provide support to staff and peers. Some pupils
participated in peer support programmes during lunch breaks and out-of-school hours. This required
them to help peers who needed support in reading, maths or writing. In one school, pupils gained credits
for helping reception staff during lunch breaks by handling phone calls. Another school was observed
where pupils volunteered to support the local library during weekends and pupils attained reward credits
by helping the library staff arrange books, clear tables and make labels for the book shelves.
A pupil in Year 6 said:
We help younger children in our school learn new games in the playground. It is real
fun and we like helping them to learn exciting games.
A pupil also reported that in the summer holidays he volunteered to participate in local beach area
cleaning activities. Volunteering in the community and religious spaces was encouraged by CU
managers. Some pupils said that in order to achieve the required points in their Learning Passports
they volunteered to help in Sunday Church gatherings. A group of pupils in a school volunteered to
organise a choir service for people in a local hospice that was highly appreciated and they said that
they would continue doing this every term.
Pupils further commented on volunteering and community work as follows:
I volunteered to help in a local library and it gave me a chance to meet new people. I
also learned about books and how to place them in the book-shelves.
I volunteered to help organising a show for St John hospice. It was a competition for
the disabled. It was so great to help people who were helping others.
I like to volunteer. I volunteered helping a local youth group who arranged for litter
picking from the streets.
I volunteered to help in a farmhouse. It was fun to look after animals and to help people
who work so hard to keep animals healthy.
What are the necessary conditions for success of the intervention?
The process evaluation suggested that the intervention was generally well run and popular with a wide
range of pupil participants. The major problem found was schools dropping out early on, or being unable
to provide staff time for the full programme.
School leaders played an important role in making a success of social action and learning in after-
school activities. The activities need school resources, time, and staff and parental engagement but
where school leaders and teachers support the idea of pupils’ learning in out-of-school hours the
challenges are easier to tackle.

Children’s University
Education Endowment Foundation
39
School leaders repeatedly claimed that rewarding pupils’ engagement in activities other than academic
performance through credits had been very effective. Several school leaders gave anecdotal evidence
on pupils’ improvement in behaviour and often in academic performance once they achieved credits for
participation in sports or art and crafts. However, a subset of teachers and school leaders also
expressed their resentment at following the procedures of recording reward credits and giving stamps,
because they doubted it was an effective way of increasing pupils’ motivation in doing the tasks. Some
teachers also said that collecting credits or stamps is not as important as participation in the activities
themselves. A teacher also said that if CU gave some real value to the Learning Passports, such as
reduced prices on school uniforms or books, then participants would be more motivated by them.
Graduation ceremonies in the university campuses were key events in the CU programme. The children
in general enjoyed receiving a certificate of achievement in a formal ceremony. Parental participation
in the graduation ceremonies was encouraging for pupils. The CU management ensured that the event
was a special occasion for pupils, and that the focus was on pupils’ achievement in the form of their
participation in out-of-school-hours activities rather than performance in classroom. Pupils enjoyed
wearing gowns and mortarboards and being photographed with their CU achievement certificates in
their hands.
A pupil reported:
It is really so great. I felt so proud in wearing the graduation gown and scholar’s hat.
This has made me want to come to university for studies in the future.
In the survey, pupils were given the opportunity to report their aspirations for their future career choice.
In the open comments box pupils wrote numerous options for their future careers. The most frequently
reported career choices were professions in sports (athlete, footballer, swimmer, cyclist), technology
(game designer, ‘YouTuber’, computer programmer, graphic designer, space technology scientist),
science (biologist, archaeologist, astronomer, forensic science expert), medicine and veterinary
(surgeon, dentist, midwife, vet, zoo keeper), and arts (actor, dancer, writer, film maker).
Barriers to delivery
The schools that dropped out after training and before the intervention cited pressures of other activities.
They also suggested that the intervention was not what they envisaged, and that for them CU would be
largely badging activities they already provided.
The location of the schools in rural areas could be a challenge, as the choices for activities are more
limited in these settings. One CU manager stated that schools in rural areas are more enthusiastic
about after-school clubs that involve activities related to agriculture and farming. These interests are
more relevant to their local area and school population.
The local CU managers were dependent on the participation of school leaders for regular activities.
Changes in staff and school leadership in some schools affected the implementation of activities. These
changes could lead to slow implementation of the process but usually local CU managers would take
control and work as replacements for the school leaders in this respect.
Some schools not keen on participation reported that they had problems with allocating staff time. The
activities required the use of their staff in out-of-school hours, and this generally required them to make
some new appointments. One of the school leaders also reported that the new challenges in the
curriculum demand more time and focus on direct teaching rather than extra-curricular activities.
Schools that are under pressure for improvement in attainment cannot focus on extra-curricular
projects. Several school leaders said that pupils in Year 6 need preparation for their Key Stage 2 exams

Children’s University
Education Endowment Foundation
40
and it is difficult to engage the last year of primary school in activities other than the main achievement
targets.
Parental lack of support was also reported as an occasional barrier to the engagement of pupils from
disadvantaged families. Some activities required parents’ participation in the form of parental consent
and even their attendance to accompany their child to events such as graduation. It was a challenge to
reach some parents and engage them in the activities and, according to teachers, this was most
common among parents from disadvantaged backgrounds.
Is the intervention attractive to stakeholders?
In general, pupils reported that CU activities were fun and that they enjoyed participation in after-school
clubs, social action activities, and visiting learning destinations. Some reported that the activities were
promised to be in out-of-school hours but sometimes teachers used their breaks from lessons and
lunchtime for these activities. Pupils wanted to have more hours spent out-of-school rather than
attending lessons in classrooms. In several schools, CU was offered as a priority to pupils eligible for
FSM, and this meant that some pupils who were not participating wanted to take part in the CU activities
along with their friends. This showed that CU was popular among all pupils but schools with limited
resources for disadvantaged pupils could not provide the chance to all. One of the pupils said:
My friend does these after-school clubs in which they learn sewing and knitting and
they do other art activities. I also wanted to do but Miss… said I can’t do it this year.
The activities involve extra expenditure and if not funded for all then many pupils could lose the
opportunity of participation and enjoyment. This could affect pupils from families who are just on the
threshold of low-income status or those who are potentially eligible for pupil premium but not recorded
as such for some reason.
Schools were interested in implementation of CU after-school clubs and social action ideas. Some
school staff members were very keen on engagement with local providers, museums, and learning
destinations. The schools in general supported the aims of the project and said they were likely to
continue CU membership and social action activities. A few school leaders also commented that they
have used pupil premium funds for enrichment activities and if school leadership is interested in the
extra-curricular activities then they would arrange them even without CU participation. However, the
school leaders also stated that participation in CU increases networking with other schools and
providers, that allows implementation of innovative ideas and share resources.
The evaluation team members interviewed parents during the school visits and in graduation
ceremonies. Obviously, those who were present on these occasions could be considered as already
engaged with schools. Their feedback was very positive about the schools providing opportunities to
their children for learning in out-of-school activities. Parents appreciated the idea of school visits to
museums, visits to places of worship for different religions, and social action projects for the
communities. The parents also commented that learning could be the aim but most important is that the
children enjoy the activities, and that if schools support these activities then it is helpful to parents.
Fidelity
Delivery of the intervention
Schools were randomised into two groups and half received the intervention while the rest waited until
after the trial period to receive it. There was little chance of diffusion between the schools because the
evaluators carefully monitored the participation of schools in the CU programme. We also visited

Children’s University
Education Endowment Foundation
41
schools on the waiting list regularly for the three surveys, and ensured that none participated in the CU
intervention.
At the school level, the intervention delivery was monitored by the local CU managers and their team
members. Local CU managers and school leaders decided their own action plans and strategies to
meet the aims of the programme. All schools that remained in the intervention group validated the after-
school clubs and learning destinations. Pupils participating in the intervention earned reward points
based on the CU criteria and this was closely monitored by the local CU managers. The schools might
have organised different after-school activities and involved various partners for social actions but all
schools fulfilled the criterion that participating pupils must complete 30 hours of out-of-school learning
out of which 15 hours must be dedicated to social action. The graduation ceremonies were conducted
only when a CU staff member was assured that the pupils had completed 30 hours of learning and
social action.
There was variation across the regions and schools in implementing activities. (Precise figures of the
CU activities implemented are not possible to report here as the process evaluation took place in 10
case study schools only). In general, all schools observed participated in social action but the nature
differed and was dependent on factors such as local area, time of the academic year, and relevance to
what pupils were taught in the curriculum. Flexibility for schools to conduct their own social action and
out-of-school activities was the core element of the CU programme, that was appreciated by the school
leaders. In a sense, CU is a template for an intervention.
Participation in CU formalised the pre-existing engagement of schools and pupils in extra-curricular
activities to some extent. Implementation of activities was closely monitored by the CU regional staff
managers through regular school visits and participating with schools in conducting the activities. The
control schools were not stopped from conducting other enrichment activities or social actions. As far
as we know, the schools in the control group did not implement an equivalent programme.
Outcomes
Perceived outcomes of the intervention
There were several outcomes attributed to the CU activities. All schools in general agreed that out-of-
school activities are enrichment activities that cost staff time, pupil learning time, and financial
resources. The school leaders and parents who were interviewed during the project agreed that
volunteering and other youth social action projects should be recognised as an important part of learning
via schools, as this supports pupils’ character building and inspires them to achieve for a better future.
Participation
According to the school leaders, the participation of pupils from disadvantaged families was perceived
as the most successful outcome of the programme – in some schools this was deliberate, and in others
it occurred naturally. The school leaders believed that pupil premium funds used in these activities were
perhaps the first chance for some pupils to participate in exciting after-school clubs such as swimming,
karate, and coaching for their favourite sports activity. Some schools purchased sport kits for pupils,
that encouraged them to attend the after-school sports clubs regularly. The arrangement was supported
by the school leaders, as they had the knowledge about some children whose parents had severe
financial constraints and could not manage to spend on enrichment activities. The school leaders
perceived visits to different learning destinations as highly beneficial for their disadvantaged pupils.
Participation from parents, local universities, museums, libraries, and other learning resource centres
contributed greatly to the successful implementation of the CU programme. Some parents also helped
schools run after-school clubs. In one school we found that a gardening club where pupils learned about

Children’s University
Education Endowment Foundation
42
plants and grew vegetables and herbs in the school garden was run by a parent. The vegetables grown
in school were sold in the market to raise money for charity.
Local universities participated in organising graduation ceremonies for the pupils who completed their
target of 30 CU hours. The ceremonies were attended by the university staff members, school leaders,
and parents. The parents who attended the ceremony reported that their children’s participation had
made them feel very proud.
Aspirations
Pupils believed that the activities inspired them to think about studying in a university and choosing a
profession. Some schools held lectures by science professionals, and arranged visits to science
museums and laboratories. These activities were perceived to have an impact on pupils’ aspirations to
pursue careers in science.
Several groups of pupils in various schools were asked about their future careers, and during this
conversation they reported that their school had done community and social action projects with
providers called ‘Be the Change’ and in doing this project they were given a lot of information about
social work that inspired some pupils to seek a professional degree in this field. In another school,
where pupils completed a project on building schools in a developing country, they were given a lot of
information about the humanitarian crisis and need for education in war zones. Some pupils also
commented that these social action projects made them think about working for organisations such as
the Red Cross.
A group of pupils showed keen interest in animal welfare. Pupils seemed very interested in research
conducted for the welfare of animals and some even said that this inspired them to become a researcher
in animal sciences. Working in occupations related to animal welfare was the most commonly identified
future career in the survey open comment box for pupils’ aspirations.
School leaders perceived CU activities as a great source of aspiration for children. A school leader
commented that this allowed pupils to think about joining new professions rather than just having limited
examples of their parents’ professions. She said that schools should give more exposure to children on
various work interests and options that can inspire them to think beyond traditional professions.
Empathy and social responsibility
Social action projects were perceived by many stakeholders to have had an impact on pupils’ sense of
empathy and awareness about other people’s feelings. The school leaders said that sponsoring
charities had given pupils a lot of information on causes such as water-aid for developing countries,
animal welfare, homelessness, and cancer research. In the school assemblies these issues were
discussed for pupils’ awareness and participation.
During school visits we asked pupils about the reasons for their participation in social action. It seemed
that in general they had a good idea of the reasons for participation and meaningful social actions are
those that have a cause and benefits for the communities who need help. The pupils gave these
comments:
We know we can’t see children living in countries where there is war but we can at least
collect money for the charity so they can buy food and clothes for children in need.
My school is very nice. Teachers are very nice. We play and do a lot of fun activities.
We have raised funds for school buildings in Uganda so that children go to schools like
mine.

Children’s University
Education Endowment Foundation
43
The schools also adopted social actions that were focused on the needs of local community. Pupils
were asked about these social actions and they said:
We want our streets to be clean and no litter around. We want no graffiti on the walls.
We have made these posters so that people should see that we care about our area.
During play time in the ground we see younger children bullied by the older ones. We
have done a project and we will talk about this in our school assembly so that older
children should know that bullying is bad.
Friendship
Pupils reported that after-school clubs was a time to do ‘fun’ things together with their friends. A few
also reported that when they are on visits or in school clubs they can make new friends. They said that
in classrooms there is not much activity that they can do together and whatever they do out of classroom
involves friends.
School leaders reported that participation in the social actions and after-school clubs had given some
pupils a lot of confidence to talk. Some school leaders reported that children took up different tasks
such as charitable activities themselves and this helped develop their leadership skills. As the tasks are
group projects school leaders felt that it strengthened pupils’ friendship bonds. A few comments by
school leaders were:
We see children in completely different roles when they are doing these activities. They
enjoy more and you can see they have skills to do things that we otherwise don’t notice.
In these activities teachers are there to support and children lead their own social
actions. It gives a lot of confidence to these children when they see any task
successfully accomplished and they can actually own it in the end. This is what helps
their self-esteem.
Children see things achieved by themselves. They work in groups and develop more
trust and friendship when they do things on their own.
Formative findings
According to the developers, school recruitment and engagement over more than two years is a
challenge. The school leaders that chose to withdraw from the treatment were more concerned with
targeted attainment outcomes. Schools under pressure to show academic improvement may not be
able to fully participate and regularly engage in activities that do not address their academic
achievement directly. The literature (see Background evidence section above) shows more
disadvantaged pupils as having lower average access to opportunities for enrichment, and such
decisions by schools may tend to reinforce this.
Schools implement enrichment activities, after-school clubs, and social action projects in different ways,
whether they are part of CU or not. Participation in the CU programme is not the only means to conduct
these activities and some schools also commented that the CU procedures and recording protocols of
activities and pupils engagement require school staff time. Although the CU programme had attempted
to make these procedures less cumbersome by developing an online system for recording the pupil
data, some school leaders perceived signing up to be an extra job to do. The benefits reported by the
teachers and school leaders from signing up with CU were networking with other school partners and
providers, sharing innovative practice and most importantly having a validation from a recognised
organisation for the activities that the schools are doing anyway. School leaders also said that it is

Children’s University
Education Endowment Foundation
44
something that the school can flag-up during Ofsted inspection and this reflects that the school is
addressing the education of pupils as a whole rather than just focusing on academic goals.
The CU local centres extend a lot of support in validation of outdoor activities. This involves addressing
health and risk assessments and checking needs when schools organise visits to various destinations.
There are 15,000 destinations that have achieved CU validation for access to schools and pupils. The
schools sometimes have to align their plans and activities with the CU validation process and
procedures. The process is fully supported by the local CU teams but it can take time as the number of
learning destination sites is always increasing. Google Maps now recognises CU validation of the sites
and shows the CU logo as the validated site that helps schools and parents to make their plans for
activities.
After-school clubs and learning destination visits were found to be more regularly implemented than
social action. The reasons could be that the schools needed more support and networks for social
action as a large number of social action activities require health and safety checks. The CU
organisation focused on social actions only as part of this project and in future they need to increase
the options for social action activities so that the schools can benefit from other partnerships, welfare
centres and charities.
Pupils reported a myriad of interests in professions as their future career. Although a lot of pupils’
choices and options for careers will depend on other academic factors, they have great aspirations to
take up jobs that are challenging and innovative. The schools need to cater for pupils’ interests in
professions and provide regular opportunities about the requirements and knowledge in professions.
Several pupils reported that before this project they had never been asked about future jobs and
careers. Some pupils said that just being asked about future professions made them think about what
they want to choose for a career.
Control group activity
The control schools were on the waiting-list to implement the CU programme once the trial period ended
in 2016. However, the schools were not stopped from conducting activities, that could be other
enrichment activities or social action. As far as we know, the schools in the control group did not
implement enrichment or social action activities similar to those offered by CU. The validation and
reward system followed by CU was only followed by the schools in the treatment group. Some control
schools were permitted by the developer and funders to implement CU in younger year groups after
one year. This may have muted the ‘effect’ sizes if there was diffusion to the older cohorts (but we have
no evidence on this).

Children’s University
Education Endowment Foundation
45
Conclusions
Participation in CU out-of-school activities and social action is linked to small gains in maths and
reading, and ‘teamwork’ and ‘social responsibility’ after two years. Pupils eligible for free school meals
(EverFSM6) generally showed slightly lower levels of benefit from the intervention in attainment terms,
but more benefit in terms of attitudes. The results for EverFSM-eligible pupils tend to be more volatile
because of the smaller number of cases involved.
There are some further promising results for pupils’ aspirations, awareness of feelings for others, and
other attitudes not pre-selected as headline outcomes. Compared to pupils in the control group, those
in the treatment group were more likely to select professional occupations as their future aspiration, to
have greater empathy, and to report higher levels of communication, self-confidence, resilience, and
happiness. This enjoyment and increased esteem could be reasons in their own right for pursuing this
kind of intervention.
The intervention proved feasible to run, and many activities were seen as enjoyable by pupil
participants, who were especially appreciative of the graduation event. Some treatment schools did not
implement the intervention even after agreeing to be randomised and being allocated to the treatment
group. As this happened mostly after the training, it suggests that it is not popular with all schools,
perhaps because of the costs involved compared to the actual benefits for schools already hosting a
programme of extra-curricular activities.
Interpretation
These findings suggest that schools solely interested in improving attainment might have more effective
options. However, given that the activities may also have intrinsic merit, and offer the possibility of gains
in both academic and attitude outcomes, there is promise in this intervention and perhaps others like it.
This is especially so as the design adopted by necessity may tend to mute the impact of the intervention.
The main limitation is that the number of missing cases needed to disturb some of these findings is
small.
Key conclusions
1. Children in the CU schools made 2 additional months’ progress in reading and maths compared to children in the other schools. The finding for maths has moderate security, and the finding for reading has low to moderate security.
2. Children in CU schools made small gains in ‘teamwork’ and ‘social responsibility’ compared to children in the other schools. The finding for social responsibility has moderate security and the finding for teamwork has low to moderate security.
3. Children ever eligible for Free School Meals (FSM) made 1 additional month’s progress in maths, no additional progress in reading, and small gains in ‘teamwork’ and ‘social responsibility’ compared to ever FSM children in the other schools. The smaller number of ever FSM pupils means these results are less secure than the results for all pupils.
4. Compared to pupils in the control group, those in the treatment group were more likely to select professional occupations as their future aspiration, and to report higher levels of communication, empathy, self-confidence, resilience, and happiness, after the intervention.
5. The intervention was feasible to run with support from school leaders. However, 7 schools decided not to implement the intervention despite receiving the training because of pressures to meet performance targets, and limited time.

Children’s University
Education Endowment Foundation
46
The intervention may have had a positive impact on pupils’ aspirations for professional occupations.
This finding is aligned with existing research as well, that shows that pupils’ engagement in after-school
activities and social actions are associated with their aspirations for professional careers (Goodman
and Gregg 2010). The evidence collected through the process evaluation also showed that the pupils
who received the intervention wanted to know more about pathways towards professions of their
interests. There were several other improved scores for non-cognitive aspects – other than those pre-
selected as the headline figures. As the intervention clearly does no damage to overall outcomes, and
may improve pupil enjoyment, schools may wish to continue with such activities for their own sake.
The participation level in CU varied across schools, dependent on school leadership and the challenges
or targets faced by schools. The school recruitment rate was lower than the intended target. CU could
recruit only 68 schools from a target of 80, and even some of these showed early signs of losing
enthusiasm and interest when the CU introduction workshops were conducted. Six schools from the
treatment group dropped out immediately (from the treatment but not from the trial) after the first training
session (and another one later). They had signed the MoU, so they continued to cooperate with the
evaluation itself.
In terms of the feasibility of implementing out-of-school activities including youth social action for primary
schools, it is quite clear that pupils take an interest in these activities and that schools can run these
programmes well in cooperation with external providers. As reported by school leaders, the major
constraints could be funds because the most exciting external programmes can be costly in terms of
utilising resources and staff time. Participation of external providers and other local resources can
reduce the cost to some extent but not all.
Limitations
The evaluation is a reasonably large-scale trial in terms of the number of schools and pupils involved.
The time scale adopted was two complete calendar years, which is a substantial amount of time for an
educational trial that allowed the intervention to be implemented fully. However, this may still be too
short a period for the kind of impact sought by the developers, and the Year 6 were not followed to their
new secondary schools for the final survey.
The study has many strengths. There was no school dropout from the evaluation. The KS1 and matched
KS2 results are from the National Pupil Database and include all initial volunteer cases for which there
are records (98%).
Although attrition was kept to a minimum for the pre and post pupil survey results and all cases of
missing data were pursued vigorously, the fact that around 9% of all pupils and volunteers in Year 6 did
not complete the survey again after one year, and around 9% of all pupils and volunteers in Year 5 did
not complete the survey again after two years, means that these specific results must be interpreted
with some caution.
Attempting to capture changes in non-cognitive outcomes via self-report is perhaps the best that can
be done, but it is not without problems (Gorard et al. 2017).
The main limitation of the evaluation stems from the design in that the funder and developer required
that schools, rather than pupils, were randomised, and that not every child in treatment schools
undertook the intervention – thus reducing the likely estimate of the impact of the intervention. The idea
was to assess whether youth social action activities could influence others in the year group not actually
participating. The two groups in the trial were unbalanced to some extent on most pre-test indicators
from the outset. This must reduce the security of the findings slightly.

Children’s University
Education Endowment Foundation
47
Future research and publications
The CU programme was a combination of several components that included after-school clubs, learning
destination visits, and social action. A future research project can assess the academic impact of
individual components of the programme. It might be possible that the CU intervention can modify some
components to specifically benefit the academic attainment of disadvantaged pupils. Future research
could focus on the long-term impact of the intervention, and the social action modules once they are
more mature. These programmes receive less time compared to the time given for more usual school-
based interventions and therefore the ‘effect’ might appear in later academic outcomes such as Key
Stage 4 results. However, in terms of the outcomes used here, it is likely that there are more fruitful
avenues for future research and development.
We consider that the long-term outcomes of this intervention could be overall well-being and readiness
during academic transition stages, enhanced opportunities for university, and subsequent access to the
employment sector. These wider outcomes are aligned to the aims of CU programme and there is
existing evidence that shows positive associations between children’s participation and learning in out-
of-school hours with social and emotional well-being and access to successful pathways at later stages
in life.
We intend to publish these findings in a peer-reviewed journal. For wider dissemination of the findings,
we will mention this report in our other published work and conference presentations.
Acknowledgements
Our evaluation team included the following researchers who very helpfully assisted with the fieldwork:
Richard Barrie
Jonathan Cairns
Laurence Droy
David Sanders-Ellis
Franzi Florack
Xin Shao
Ourania Maria Ventista
We would like to thank everyone at CU, and all of the schools, staff and pupils who took part in this
study.

Children’s University
Education Endowment Foundation
48
References
Algan, Y., Beasley, E., Vitaro, F., & Tremblay, R. E. (2014). The impact of non-cognitive skills training
on academic and non-academic trajectories: From childhood to early adulthood. Sciences Po
Working Paper.
Birdwell, J., & Bani, M. (2014). Introducing generation citizen (available at
http://dera.ioe.ac.uk/23196/).
Brunello, G., & Schlotter, M. (2011). Non-cognitive skills and personality traits: Labour market
relevance and their development in education & training systems. IZA Discussion Paper No.
5743 (available at https://papers.ssrn.com/sol3/papers.cfm?abstract_id=1858066).
Chanfreau, J.,Tanner,E. ,Callanan,M. Laing, K., Skipp , A. & Todd, L. (2016) Out-of-school activities
during primary school and KS2 attainment. Nuffield Foundation (available at
http://www.nuffieldfoundation.org/sites/default/files/files/CLS%20WP%202016%20(1)%20-
%20Out%20of%20school%20activities%20during%20primary%20school%20and%20KS2%20
attainment.pdf).
Cheung, P. P. (2016). Children’s after-school physical activity participation in Hong Kong: Does family
socioeconomic status matter? Health Education Journal, 0017896916660863.
Chowdry, H., Crawford, C., Dearden, L., Joyce, R., Sibieta, L., Sylva, K., & Washbrook, E. (2010).
Poorer children’s educational attainment: how important are attitudes and behaviour? Joseph
Rowntree Foundation.
Clarke, A. M., Hussein, Y., Morreale, S., Field, C. A., & Barry, M. M. (2015). What works in enhancing
social and emotional skills development during childhood and adolescence? A review of the
evidence on the effectiveness of school-based and out-of-school programmes in the UK
(available at
https://www.gov.uk/government/uploads/system/uploads/attachment_data/file/411492/What_w
orks_in_enhancing_social_and_emotional_skills_development_during_childhood_and_adolesc
ence.pdf).
Clarke, A. M., Morreale, S., Field, C. A.; Hussein, Y., & Barry,M. M. (2015). What works in enhancing
social and emotional skills development during childhood and adolescence? A review of the
evidence on the effectiveness of school-based and out-of-school programmes in the UK. Early
Intervention Foundation (available at http://www.eif.org.uk/wp-content/uploads/2015/03/Review-
of-Social-and-Emotional-Skills-Based-Intervention_Report-WEB-VERSION.pdf).
Colquhoun, D. (2014) An investigation of the false discovery rate and the misinterpretation of p-
values. R. Soc. opensci.1: 140216. http://dx.doi.org/10.1098/rsos.140216.
Department for Education (DfE) (2016) PE and sport premium: Funding allocations for 2016 to
2017 (available at https://www.gov.uk/government/publications/pe-and-sport-premium-funding-
conditions-for-2016-to-2017).
Department for Education (DfE) (2017) Revised A level and other 16–18 results in England,
2015/2016 (available at (available at
https://www.gov.uk/government/uploads/system/uploads/attachment_data/file/584124/SF
R05_2017_A_level_and_other16-18_results_in_England_SFR_revised.pdf).

Children’s University
Education Endowment Foundation
49
Falk, R., & Greenbaum, C. (1995) Significance tests die hard: The amazing persistence of a
probabilistic misconception. Theory and Psychology, 5, 75–98.
Farthing, R. (2014). The costs of going to school, from young people’s perspectives. Child Poverty
Action Group, 10–11.
Garcia, E. (2014). The need to address non-cognitive skills in education policy agenda. Economic
Policy Institute (available at http://www.epi.org/publication/the-need-to-address-noncognitive-
skills-in-the-Education).
Goodman, A., & Gregg, P. (Eds.) (2010) Poorer children's educational attainment: How important are
attitudes and behaviour? York: Joseph Rowntree Foundation.
Gorard, S. (2010) Measuring is more than assigning numbers, in Walford, G., Tucker, E., &
Viswanathan, M. (Eds.) Sage Handbook of Measurement, pp. 389–408, Los Angeles: Sage.
Gorard, S. (2013) Research Design, London: Sage.
Gorard, S., & Gorard, J. (2016) What to do instead of significance testing? Calculating the ‘number of
counterfactual cases needed to disturb a finding’. International Journal of Social Research
Methodology, 19 (4), 481–489.
Gorard, S., & Smith, E. (2010) Equity in education: An international comparison of pupil perspectives.
London: Palgrave.
Gorard, S., See, B.H., & Siddiqui, N. (2017) The trials of evidence-based education. London:
Routledge.
Gupta, N. D., & Simonsen, M. (2010). Non-cognitive child outcomes and universal high quality child
care. Journal of Public Economics, 94(1), 30–43.
Gutman, L. M., & Schoon, I. (2013). The impact of non-cognitive skills on outcomes for young people.
Education Empowerment Foundations, London.
Heckman, J., & Rubinstein, Y. (2001) The importance of non-cognitive skills: Lessons from the GED
testing program. American Economic Review, 91 (2), 145–149.
Holloway, E., Mahony, S., Royston, S., & Mueller, D. (2014). At what cost? Exposing the impact of
poverty on school life (available at
https://www.childrenssociety.org.uk/sites/default/files/At_What_Cost_Exposing_the_imp
act_of_poverty_on_school_life-report_%20summary.pdf).
Hubbard, R. and Meyer, C. (2013) The rise of statistical significance testing in public administration
research and why this is a mistake. Journal of Business and Behavioral Sciences, 25, 1.
Kautz, T., & Zanoni, W. (2014). Measuring and fostering non-cognitive skills in adolescence: Evidence
from Chicago public schools and the OneGoal Program. University of Chicago. (available at
http://home.uchicago.edu/~tkautz/OneGoal_TEXT.pdf).
Kirkman, E., Sanders, M., Emanuel, N., & Larkin, C. (2015) Does participating in social action boost
the skills young people need to succeed in adult life? Evaluating Youth Social Action: Final
report, London: Behavioural Insights Team.
MacBeath, J. (2011). Evaluation of the Children’s University 2010. Manchester: National Children's
University.

Children’s University
Education Endowment Foundation
50
MacBeath, J. (2012) Evaluating provision, progress and quality of learning in the Children’s
University. Leadership for Learning: University of Cambridge (available at
http://www.childrensuniversity.co.uk/media/13021/cu_evaluation_2012-13_full.pdf).
MacBeath, J., & Waterhouse, J. (2008). Evaluation of the Children’s University: First Report.
Cambridge: University of Cambridge.
Office for National Statistics (ONS) (2011). Lifestyles and social participation (available at
http://www.ons.gov.uk/ons/rel/social-trends-rd/social-trends/social-trends-41/lifestyles-
chapter.pdf?format=contrast).
Power, S., Taylor, C., Rees, G., & Jones, K. (2009). Out‐of‐school learning: Variations in provision
and participation in secondary schools. Research Papers in Education, 24(4), 439–460.
Pye, J., & Michlemore, O. (2016) National Youth Social Action Survey. Ipsos: MORI (available at
https://www.ipsos-mori.com/Assets/Docs/Publications/sri-youth-social-action-in-uk-2016.pdf).
Pye, J., James, N., & Stobart, R. (2014). Youth social action in the UK-2014: A face-to-face survey of
10–20 year olds in the UK. Ipsos MORI (available at https://www.ipsos-
mori.com/Assets/Docs/Publications/sri-ecf-youth-social-action-in-the-uk-2014.pdf).
Shadish, W., Cook, T. and Campbell, D. (2002) Experimental and quasi-experimental designs for
generalized causal inference, Belmont: Wadsworth.
Siddiqui, N., Gorard, S., & See, B. H. (2017). Non-cognitive impacts of philosophy for children. School
of Education, Durham University (available at
http://dro.dur.ac.uk/20880/1/20880.pdf?DDD34+DDD29+czwc58+d700tmt).
Southby, K., & South, J. (2016). Volunteering, inequalities and barriers to volunteering: A rapid
evidence review. Leeds Beckett University.
Tanner, C. (2015). Reducing youth violence: The role of afterschool programs (PhD thesis). Georgia
State University.
Wikeley, F., Bullock, K., Muschamp, Y., & Ridge, T. (2007). Educational relationships outside school:
Why access is important. York, UK: Joseph Rowntree Foundation. Retrieved June 2010.
Xiao, Z., Kasim, A. and Higgins, S. (2016) Same difference? Understanding variation in the estimation
of effect sizes from trial data. International Journal of Educational Research, 77 (available at
http://www.sciencedirect.com/science/article/pii/S0883035515304808).

Children’s University
Education Endowment Foundation
51
Appendix A: Further analyses
This appendix presents additional but important analyses including the figures after one year, for all
pupils, for all other wider outcomes, and for boys and girls separately. It includes four simple regression
models.
Attainment outcomes
‘Volunteer’ pupils, one year
As with attainment after two years (the headline figures), the CU group starting in Year 6 was ahead at
the end of that year in both maths and reading. And as with the two-year figures, this group was already
ahead at the outset, making post-intervention scores potentially misleading. At KS1 the treatment group
was ahead by +0.09 in maths, and +0.14 in reading (Tables A1 and A2). The gain scores take this initial
difference into account with the result that the outcomes are slightly positive after one year for maths
and slightly negative for reading.
Table A1: KS2 post-intervention result for maths after one year, ‘volunteers’
Group N KS1
maths
points
SD Pre-
‘effect’
size
KS2
maths
fine
points
SD Post-
‘effect’
size
Gain
score
SD Gain
‘effect’
size
Treatment 695 15.96 3.58 – 4.94 0.82 – 0.04 0.64 –
Control 520 15.62 3.82 – 4.84 0.80 – 0.01 0.80 –
Overall 1,215 15.82 3.69 +0.09 4.90 0.81 +0.12 0.02 0.71 +0.05
Table A2: KS2 post-intervention result for reading after one year, ‘volunteers’
Group N KS1
reading
points
SD Pre-
‘effect’
size
KS2
reading
fine
points
SD Post-
‘effect’
size
Gain
score
SD Gain
‘effect’
size
Treatment 695 15.95 4.06 – 4.86 0.66 – 0.02 0.74 –
Control 520 15.33 4.53 – 4.79 0.64 – 0.06 0.86 –
Overall 1,215 15.68 4.28 +0.14 4.83 0.66 +0.11 0.04 0.79 –0.05
All pupils by sex, two years
The tables below present results for all Year 5 pupils, regardless of their ‘volunteer’ status or
participation in CU, split by sex. This gives an indication of the average impact of being in a school

Children’s University
Education Endowment Foundation
52
doing CU for all Year 5 pupils, versus a school not doing CU. The results for boys and girls have the
same pattern as all other findings with the CU group ahead at the outset and after the intervention, but
boys made slightly clearer progress in maths and reading (Tables A3 to A6).
Table A3: KS2 result for maths, after two years, all male pupils
Group N KS1
maths
points
SD Pre-
‘effect’
size
KS2
maths
score
SD Post-
‘effect’
size
Maths
gain
score
SD ‘Effect’
size
Treatment 522 16.46 3.35 – 104.12 6.73 – 0.01 0.72 –
Control 416 15.80 3.73 – 102.12 7.12 – –0.12 0.78 –
Overall 938 16.17 3.54 +0.19 103.23 6.98 +0.29 –0.05 0.75 +0.17
Table A4: KS2 result for reading, after two years, all male pupils
Group N KS1
reading
points
SD Pre-
‘effect’
size
KS2
reading
scores
SD Post-
‘effect’
size
Reading
gain
score
SD ‘Effect’
size
Treatment 516 16.26 3.67 – 103.30 8.11 – –0.01 0.80 –
Control 416 15.23 4.06 – 100.47 7.79 – –0.11 0.81 –
Overall 932 15.80 3.90 +0.26 102.04 8.09 +0.35 –0.05 0.81 +0.13
Table A5: KS2 result for maths, after two years, all female pupils
Group N KS1
maths
points
SD Pre-
‘effect’
size
KS2
maths
fine
points
SD Post-
‘effect’
size
Maths
gain
score
SD ‘Effect’
size
Treatment 441 15.99 3.11 – 103.02 6.49 – –0.03 0.70 –
Control 401 15.92 3.50 – 102.16 6.27 – –0.14 0.72 –
Overall 842 15.95 3.30 +0.02 102.61 6.40 +0.13 –0.08 0.71 +0.15

Children’s University
Education Endowment Foundation
53
Table A6: KS2 result for reading, after two years, all female pupils
Group N KS1
reading
points
SD Pre-
‘effect’
size
KS2
reading
fine
points
SD Post-
‘effect’
size
Reading
gain
score
SD ‘Effect’
size
Treatment 440 16.59 3.63 – 103.54 8.52 – –0.07 0.71 –
Control 401 16.34 3.82 – 102.16 7.70 – –0.17 0.79 –
Overall 841 16.47 3.72 +0.07 102.88 8.16 +0.17 –0.12 0.76 +0.13
Wider outcomes
‘Volunteer’ pupils, one and two years
Table A7 shows the effect sizes for all 11 of the scaled attitude items, after both one year and two years.
The pre-selected headlines items are in bold, and it is clear that these portray some of the least benefit
from the intervention. The CU group are ahead in terms of communication, self-confidence, resilience
or determination, and happiness. This enjoyment and increased esteem could be reasons, in their own
right, for pursuing this kind of intervention.
Table A7: ‘Effect’ size of gain scores for attitude items, ‘volunteer’ pupils
Item One-year Two-year
I am good at explaining my ideas to other people +0.16 +0.18
I like meeting new people 0 +0.01
I can work with someone who has different opinions –0.05 +0.04
I can do most things if I try +0.10 +0.06
Once I have started a task I like to finish it +0.07 +0.14
I want to try make my local area a better place +0.03 +0.08
I like to be told exactly what to do –0.01 +0.15
I am often afraid to try new things +0.03 +0.10

Children’s University
Education Endowment Foundation
54
I feel happy most days +0.02 +0.14
I try to understand other people’s problems 0 +0.01
I know where to go for help with a problem +0.10 +0.04
Note: Positive scores for items in italics are deemed to portray negative impact.
The CU group became clearly more empathetic/generous in resolving the issue in the vignette about
whether they were happy for others to receive help at their expense (Table A8).
Table A8: Odds ratios for outcomes of vignette on generosity/empathy (Jacinta), ‘volunteer’
pupils
Pre-
intervention
Odds
ratio
Interim Odds
ratio
Post-
intervention
Odds
ratio
Treatment 40.3% 1.00 46.7% 1.25 47.8% 1.23
Control 40.3% 41.2% 42.7%
Note: In tables A8 to A11 and A17 to A20 the percentage represents those agreeing with the social desirable outcome.
The responses to the vignette on social responsibility were so positively skewed (and this was not
picked up in the pilot) that this item is hard to judge for changes over time (Table A9).
Table A9: Odds ratios for outcomes of vignette on social responsibility (Jon), ‘volunteer’ pupils
Pre-
intervention
Odds
ratio
Interim Odds
ratio
Post-
intervention
Odds
ratio
Treatment 92.3% 1.00 94.6% 1.24 93.8% 0.88
Control 92.4% 93.4% 94.5%
The CU group became clearly more likely to report wanting a professional occupation in the future in
resolving the issue in the relevant vignette (Table A10).
Table A10: Odds ratios for professional aspirations, ‘volunteer’ pupils
Pre-
intervention
Odds
ratio
Interim Odds
ratio
Post-
intervention
Odds
ratio
Treatment 45.1% 1.00 60.6% 1.25 63.0% 1.23
Control 45.0% 55.1% 58.0%

Children’s University
Education Endowment Foundation
55
The treatment group reported less charitable or other social action over time (other than in CU), perhaps
because their CU activities replaced them to some extent (Table A11).
Table A11: Odds ratios for charity or other social action, ‘volunteer’ pupils
Pre-
intervention
Odds
ratio
Interim Odds
ratio
Post-
intervention
Odds
ratio
Treatment 75.5% 1.10 72.3% 1.43 35.6% 0.99
Control 73.7% 64.6% 35.9%
Attainment outcomes
All pupils, one and two years
As might be expected, the attainment results considering all pupils in both groups are similar to the
headline figures for ‘volunteers’. As with the overall results, the CU group had been ahead from the
outset (Tables A12–A15). The CU schools are ahead for both maths and reading, after one year
(original Year 6) and two years (original Year 5), and make more progress from KS1 to KS2 in both
subjects.
Table A12: KS2 post-intervention result for maths after one year, all pupils
Group N KS1
maths
points
SD Pre-
‘effect’
size
KS2
maths
fine
points
SD Post-
‘effect’
size
Maths
gain
score
SD ‘Effect’
size
Treatment 1,010 15.97 3.59 – 4.94 0.82 – 0.04 0.66 –
Control 770 15.56 3.74 – 4.81 0.79 – 0.00 0.76 –
Overall 1,780 15.79 3.66 +0.11 4.88 0.81 +0.16 0.02 0.70 +0.05

Children’s University
Education Endowment Foundation
56
Table A13: KS2 result post-intervention for reading after one year, all pupils
Group N KS1
reading
points
SD Pre-
‘effect’
size
KS2
reading
fine
points
SD Post-
‘effect’
size
Reading
gain
score
SD ‘Effect’
size
Treatment 1,010 15.92 4.03 – 4.85 0.66 – 0.02 0.73 –
Control 768 15.29 4.32 – 4.77 0.66 – 0.06 0.85 –
Overall 1,778 15.65 4.17 +0.15 4.81 0.66 +0.12 0.04 0.78 +0.04
Table A14: KS2 result for maths after two years, all pupils
Group N KS1
maths
points
SD Pre-
‘effect’
size
KS2
maths
score
SD Post-
‘effect’
size
Maths
gain
score
SD ‘Effect’
size
Treatment 963 16.25 3.25 – 103.62 6.65 – –0.01 0.71 –
Control 817 15.86 3.62 – 102.14 6.71 – –0.13 0.75 –
Overall 1780 16.07 3.43 +0.11 102.94 6.71 +0.22 –0.06 0.73 +0.16
Table A15: KS2 result for reading after two years, all pupils
Group N KS1
reading
points
SD Pre-
‘effect’
size
KS2
reading
score
SD Post-
‘effect’
size
Reading
gain
score
SD ‘Effect’
size
Treatment 956 16.41 3.67 – 103.41 8.29 – –0.04 0.76 –
Control 817 15.78 3.98 – 101.30 7.79 – –0.14 0.80 –
Overall 1773 16.12 3.83 +0.16 102.44 8.13 +0.26 –0.09 0.78 +0.14
Wider outcomes
All pupils, one and two years
The following results are for all pupils in the relevant year groups, regardless of whether they
volunteered initially to take part in CU or similar. Because so few of them actually took part, the effect
sizes should be more muted, unless there is a clear cohort effect. Table A16 leads to mostly the same
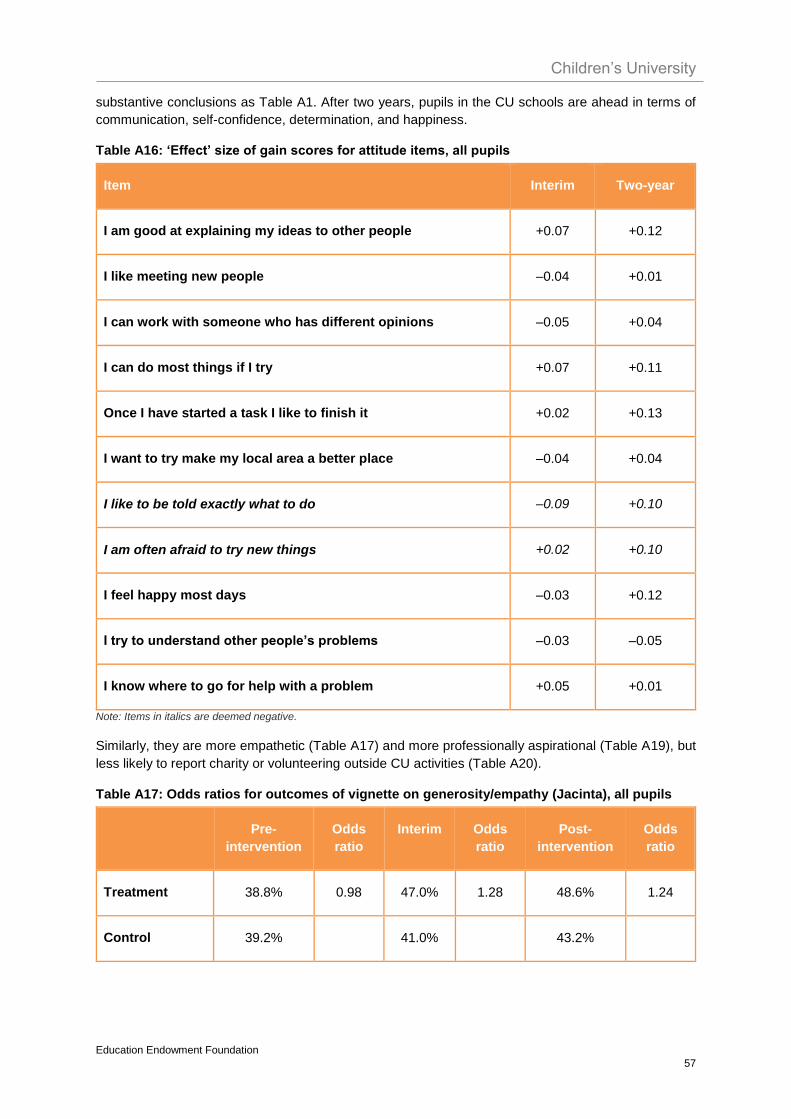
Children’s University
Education Endowment Foundation
57
substantive conclusions as Table A1. After two years, pupils in the CU schools are ahead in terms of
communication, self-confidence, determination, and happiness.
Table A16: ‘Effect’ size of gain scores for attitude items, all pupils
Item Interim Two-year
I am good at explaining my ideas to other people +0.07 +0.12
I like meeting new people –0.04 +0.01
I can work with someone who has different opinions –0.05 +0.04
I can do most things if I try +0.07 +0.11
Once I have started a task I like to finish it +0.02 +0.13
I want to try make my local area a better place –0.04 +0.04
I like to be told exactly what to do –0.09 +0.10
I am often afraid to try new things +0.02 +0.10
I feel happy most days –0.03 +0.12
I try to understand other people’s problems –0.03 –0.05
I know where to go for help with a problem +0.05 +0.01
Note: Items in italics are deemed negative.
Similarly, they are more empathetic (Table A17) and more professionally aspirational (Table A19), but
less likely to report charity or volunteering outside CU activities (Table A20).
Table A17: Odds ratios for outcomes of vignette on generosity/empathy (Jacinta), all pupils
Pre-
intervention
Odds
ratio
Interim Odds
ratio
Post-
intervention
Odds
ratio
Treatment 38.8% 0.98 47.0% 1.28 48.6% 1.24
Control 39.2% 41.0% 43.2%

Children’s University
Education Endowment Foundation
58
Table A18: Odds ratios for outcomes of vignette on social responsibility (Jon), all pupils
Pre-
intervention
Odds
ratio
Interim Odds
ratio
Post-
intervention
Odds
ratio
Treatment 90.4% 0.92 93.5% 1.10 93.8% 0.93
Control 91.1% 92.9% 94.2%
Table A19: Odds ratios for professional aspirations, all pupils
Pre-
intervention
Odds
ratio
Interim Odds
ratio
Post-
intervention
Odds
ratio
Treatment 41.9% 0.96 59.0% 1.13 62.0% 1.13
Control 42.9% 56.0% 59.0%
Table A20: Odds ratios for charity or other social action, all pupils
Pre-
intervention
Odds
ratio
Interim Odds
ratio
Post-
intervention
Odds
ratio
Treatment 71.6% 1.23 68.7% 1.47 34.3% 1.05
Control 67.1% 59.8% 33.1%
Simple regression models
Four two-step regression models were created with post-intervention scores as the outcomes (for
maths, reading, teamwork, and social responsibility), and prior attainment in the relevant subject, or
prior attitude as predictors in the first step, and treatment group as predictor in the second step. The
analyses involve initial volunteer pupils in both groups after two years, and had the same number of
cases as in the headline findings.
As already indicated by the headline findings, being in the treatment group here makes a small
difference to outcomes for reading and maths, over and above KS1 attainment (Table A21). For both
reading and maths, the coefficient ‘effect’ sizes of being in the CU group are small (0.08 and 0.07) as
seen in Table A22. However, it is well-established that such regression modelling is not well-suited for
establishing the results of employing a straightforward design as here or overcoming deficiencies in the
design (Shadish et al. 2002, Gorard 2013). Gain scores are considered by the evaluators to be simpler

Children’s University
Education Endowment Foundation
59
and less prone to error propagation. This result therefore does not replace the headline figures, but the
low increase for R in Step 2 may be seen as a slight caution about their precise strength.
The same is true for teamwork and social responsibility, even though prior attitude is less important
than prior attainment (as evidenced by the lower R scores). As with the headline gain score results, the
coefficients here portray a small benefit linked to being in the CU treatment group.
Table A21: Variation explained (R) by prior attainment/attitude and being in treatment group,
volunteer pupils
R reading R maths Teamwork Social
responsibility
N 1,224 1,231 1,154 1,156
Step 1: Prior score 0.678 0.715 0.197 0.163
Step 2: Treatment group 0.682 0.719 0.204 0.169
Table A22: Standardised coefficients (‘effect’ sizes) for Step 2 of model in Table A21
Reading Maths Teamwork Social
responsibility
Relevant KS1
score
0.67 0.71 – –
Relevant prior
attitude
– – 0.20 0.16
CU group 0.08 0.07 0.05 0.05

Children’s University
Education Endowment Foundation
60
Appendix B: Padlock security ratings
Maths
Rating Criteria for rating Initial
score
Adjust
Final
score
Design Power Attrition
Adjustment
for Balance
[ –1 ]
Adjustment
for threats to
internal
validity
[ 0 ]
5 Well-conducted
experimental design
with appropriate
analysis
MDES < 0.2 0 – 10%
4 Fair and clear quasi-
experimental design for
comparison (e.g. RDD)
with appropriate
analysis, or
experimental design
with minor concerns
about validity
MDES < 0.3 11–20%
4
3 Well-matched
comparison (using
propensity score
matching, or similar) or
experimental design
with moderate
concerns about validity
MDES < 0.4 21–30%
3
2 Weakly matched
comparison or
experimental design
with major flaws
MDES < 0.5 31–40%
1 Comparison group with
poor or no matching
(e.g. volunteer versus
others)
MDES < 0.6 41–50%
0 No comparator MDES > 0.6
>50%
Children’s University
Education Endowment Foundation
61
Initial padlock score: lowest of the three ratings for design, power and attrition = 4 based on MDES in protocol of 0.28
Reason for adjustment for balance (if made): the experimental and control groups were not balanced (effect sizes of 0.1 for maths) which EEF guidance suggests should result in a drop of an additional 1 padlock
Reason for adjustment for threats to validity (if made): none
Final padlock score: initial score adjusted for balance and internal validity = 3

Children’s University
Education Endowment Foundation
62
Reading
Rating Criteria for rating Initial
score
Adjust
Final
score
Design Power Attrition
Adjustment
for Balance
[ –2 ]
Adjustment
for threats to
internal
validity
[ 0 ]
5 Well-conducted
experimental design
with appropriate
analysis
MDES < 0.2 0 – 10%
4 Fair and clear quasi-
experimental design for
comparison (e.g. RDD)
with appropriate
analysis, or
experimental design
with minor concerns
about validity
MDES < 0.3 11–20%
4
3 Well-matched
comparison (using
propensity score
matching, or similar) or
experimental design
with moderate concerns
about validity
MDES < 0.4 21–30%
2 Weakly matched
comparison or
experimental design
with major flaws
MDES < 0.5 31–40%
2
1 Comparison group with
poor or no matching
(e.g. volunteer versus
others)
MDES < 0.6 41–50%
0 No comparator MDES > 0.6
>50%
Initial padlock score: lowest of the three ratings for design, power and attrition = 4 based on MDES in protocol of 0.28

Children’s University
Education Endowment Foundation
63
Reason for adjustment for balance (if made): the experimental and control groups were not balanced (effect sizes of .16 for reading) which EEF guidance suggests should result in a drop of an additional 2 padlocks
Reason for adjustment for threats to validity (if made): none
Final padlock score: initial score adjusted for balance and internal validity = 2

Children’s University
Education Endowment Foundation
64
Teamwork
Rating Criteria for rating Initial
score
Adjust
Final
score
Design Power Attrition
Adjustment
for Balance
[ –1 ]
Adjustment
for threats to
internal
validity
[ –1 ]
5 Well-conducted
experimental design
with appropriate
analysis
MDES < 0.2 0–10%
4 Fair and clear quasi-
experimental design for
comparison (e.g. RDD)
with appropriate
analysis, or
experimental design
with minor concerns
about validity
MDES < 0.3 11–20%
4
3 Well-matched
comparison (using
propensity score
matching, or similar) or
experimental design
with moderate
concerns about validity
MDES < 0.4 21–30%
2 Weakly matched
comparison or
experimental design
with major flaws
MDES < 0.5 31–40%
2
1 Comparison group with
poor or no matching
(e.g. volunteer versus
others)
MDES < 0.6 41–50%
0 No comparator MDES > 0.6
>50%
Initial padlock score: lowest of the three ratings for design, power and attrition = 4

Children’s University
Education Endowment Foundation
65
Reason for adjustment for balance (if made): the experimental and control groups were not balanced (effect sizes of .05 for teamwork) which EEF guidance suggests should result in a drop of an additional 1 padlock
Reason for adjustment for threats to validity (if made): one quality marker issue associated with the bespoke measures used to understand non-academic outcomes. There is no published validity or reliability metrics available for this measure.
Final padlock score: initial score adjusted for balance and internal validity = 2

Children’s University
Education Endowment Foundation
66
Social responsibility
Rating Criteria for rating Initial
score
Adjust
Final
score
Design Power Attrition
Adjustment
for Balance
[ 0 ]
Adjustment
for threats to
internal
validity
[ –1 ]
5 Well-conducted
experimental design
with appropriate
analysis
MDES < 0.2 0 – 10%
4 Fair and clear quasi-
experimental design for
comparison (e.g. RDD)
with appropriate
analysis, or
experimental design
with minor concerns
about validity
MDES < 0.3 11–20%
4
3 Well-matched
comparison (using
propensity score
matching, or similar) or
experimental design
with moderate
concerns about validity
MDES < 0.4 21–30%
3
2 Weakly matched
comparison or
experimental design
with major flaws
MDES < 0.5 31–40%
1 Comparison group with
poor or no matching
(e.g. volunteer versus
others)
MDES < 0.6 41–50%
0 No comparator MDES > 0.6
>50%
Initial padlock score: lowest of the three ratings for design, power and attrition = 4
Reason for adjustment for balance (if made): None. The experimental and control groups were well balanced.
Children’s University
Education Endowment Foundation
67
Reason for adjustment for threats to validity (if made): one quality marker issue associated with the bespoke measures used to understand non-academic outcomes. There is no published validity or reliability metrics available for this measure.
Final padlock score: initial score adjusted for balance and internal validity = 3

Children’s University
Education Endowment Foundation
68
Appendix C: Parental Consent Letter
Date<<>>
Subject: Parental consent for participation
Our school has been asked to take part in an exciting project for our Year 5 and Year 6 children. We
will be working with the Children’s University™, Cabinet Office and Education Endowment Fund.
I am enclosing some information on the work of the Children’s University for you. If, with your
permission, your child takes part in the project our school will be part of the programme. Your child will
have the opportunity to take part in a range of supervised Learning Activities outside of the normal
school day. Many of the Learning Activities will be designed to benefit the community as well, of course,
as capturing your child’s interests.
The children will record the time they spend taking part in these Learning Activities in their own CU
Passport To Learning and online in their own CU E-Passport To Learning.
Once your child has completed at least 30 hours of Learning Activities they will be invited, with guests,
to receive a Children’s University Award at a CU Graduation Ceremony.
As part of our school involvement, children will be asked to complete some short survey questionnaires
before the end of the last academic year. Children will also be asked to complete further questionnaires
whilst they are taking part and at the end of the school year.
These survey questionnaires will be sent to the University of Durham who are looking at whether taking
part in these Learning Activities helps the personal development and achievement of children.
The University of Durham will have access to certain information held on the National Pupil Database.
The name of your child or the name of our school will not be identified in any report written.
<<Name>> will be coordinating the project in school and will be happy to answer any questions you
may have.
I am sure your child will enjoy being part of the programme, but if you would prefer them not to take
part, please inform their class teacher.
Headteacher signatures
<<School name>>
<<School address>>

Children’s University
Education Endowment Foundation
69
Appendix D: The survey

Children’s University
Education Endowment Foundation
70

Children’s University
Education Endowment Foundation
71

Children’s University
Education Endowment Foundation
72

Children’s University
Education Endowment Foundation
73
Appendix E: Photos
Art and craft club
Attendance at a lecture by the Archbishop of York
Social action club activity: Training for first-aid

Children’s University
Education Endowment Foundation
74
Graduation ceremony
Children’s University Passport to Learning

Children’s University
Education Endowment Foundation
75
Appendix F: Cost rating
Cost ratings are based on the approximate cost per pupil per year of implementing the intervention over
three years. More information about the EEF’s approach to cost evaluation can be found here. Cost
ratings are awarded as follows:
Cost rating Description
£ £ £ £ £ Very low: less than £80 per pupil per year.
£ £ £ £ £ Low: up to about £200 per pupil per year.
£ £ £ £ £ Moderate: up to about £700 per pupil per year.
£ £ £ £ £ High: up to £1,200 per pupil per year.
£ £ £ £ £ Very high: over £1,200 per pupil per year.

You may re-use this document/publication (not including logos) free of charge in any format or medium,
under the terms of the Open Government Licence v3.0.
This information is licensed under the Open Government Licence v3.0. To view this licence,
visit http://www.nationalarchives.gov.uk/doc/open-government-licence/
Where we have identified any third party copyright information you will need to obtain permission from
the copyright holders concerned. The views expressed in this report are the authors’ and do not
necessarily reflect those of the Department for Education.
This document is available for download at www.educationendowmentfoundation.org.uk
The Education Endowment Foundation
9th Floor, Millbank Tower
21–24 Millbank
London
SW1P 4QP