Embed Size (px)
Citation preview
Childs, Stephen, Haroune, Nicolas, Williams, Lee and Gronow, Michael (2017)
Investigation of the Low Molecular Weight Thiol Composition in a Metastatic
Prostate Cancer Cell Line (LNCaP) by LC-UV-MS and NMR after Labelling with
the Ellman Reagent. American Journal of Analytical Chemistry, 08 (01). pp. 1-18.
ISSN 2156-8251
Downloaded from: http://sure.sunderland.ac.uk/7242/
Usage guidelines
Please refer to the usage guidelines at http://sure.sunderland.ac.uk/policies.html or alternatively
contact [email protected].
American Journal of Analytical Chemistry, 2017, 8, 1-18
http://www.scirp.org/journal/ajac
ISSN Online: 2156-8278
ISSN Print: 2156-8251
DOI: 10.4236/ajac.2017.81001 January 4, 2017
Investigation of the Low Molecular Weight
Thiol Composition in a Metastatic Prostate
Cancer Cell Line (LNCaP) by LC-UV-MS and
NMR after Labelling with the Ellman Reagent
Stephen Childs1, Nicolas Haroune1, Lee Williams1, Michael Gronow2*
1Department of Pharmacy Health & Well-Being, Faculty of Applied Sciences, University of Sunderland, Sciences Complex,
Sunderland, UK 2Cambridge Cancer Research Fund, Cambridge, UK
Abstract
The low molecular weight thiols present in the deproteinized extract of a
prostate cancer cell line (LNCaP-FGC) were analysed after derivatization with
the Ellman reagent (ESSE). The mixed disulphides formed (RSSE) were frac-
tionated, characterized and quantified by liquid chromatography on a C-18
column using UV detection. This revealed the presence, in femtomoles per
cell, of glutathione (8.30 ± 0.73), cysteine (2.71 ± 0.04) and cysteinylglycine
(0.83 ± 0.10), accounting for the bulk of the thiol present. Further analysis of
the cell extracts using a novel and sensitive mass spectrometry technique al-
lowed the detection of low level of an additional derivative which was identi-
fied as cysteinylglycerate using NMRspectroscopy.
Keywords
Prostate Cancer, Low Molecular Weight Thiols, Thiol Analysis, Ultra-High
Performance Liquid Chromatography, Novel Thiol, LC-MS, NMR, Ellman’s
Reagent
1. Introduction
In the Western world, prostate cancer is a significant burden to men’s health. It
represents the most frequently diagnosed nondermatological malignancy and
the second cause of death due to cancer in men [1] [2]. Fresh research on its
genesis and detection is therefore a matter of some priority.
Currently, there is much interest in the role of oxidative stress in prostate
Childs, S., Ha-
roune, N., Williams, L. and Gronow, M.
(2017) Investigation of the Low Molecular
Weight Thiol Composition in a Metastatic
Prostate Cancer Cell Line (LNCaP) by LC-
UV-MS and NMR after Labelling with the
Ellman Reagent. American Journal of Ana-
lytical Chemistry, 8, 1-18.
http://dx.doi.org/10.4236/ajac.2017.81001
September 20, 2016
January 1, 2017
January 4, 2017
Copyright © 2017 by authors and
Scientific Research Publishing Inc.
This work is licensed under the Creative
Commons Attribution International
License (CC BY 4.0).
http://creativecommons.org/licenses/by/4.0/
S. Childs et al.
2
cancer development and progression [for reviews see [3] and [4]]. Thiols play
major roles and many important cellular metabolic processes and reactions [e.g.
[5]]; in particular the low molecular weight thiols (LMWT) are responsible for
the maintenance of oxidation/reduction (redox) levels in cells. The dynamic re-
lationship between the LMWT, particularly glutathione (GSH), and reactive
oxygen species (ROS) underpins redox regulation and signalling [6] [7]. With
regard to prostate cancer, the recent work of Oberley’s group [8] [9] has illus-
trated the role of cellular thiol components on the cell redox state and oxidative
stress in the genesis and drug metabolism of prostate cancer cell lines.
It is therefore believed that further knowledge regarding the cellular metabo-
lism of LMWT may help in the rational design of new more efficacious drugs to
treat prostate cancer metastases.
Most studies on cellular LMWT have centred around the tripeptide GSH, the
metabolism of which has been studied in detail over the last century and it is now
widely accepted as the major LMWT present in eukaryote cells [10]. This tripep-
tide has been shown to have many roles in cellular metabolism; particularly with
regard to its protective roles [11], cancer progression and chemoresistance [12].
However, earlier studies on the composition of tumor cell LMWT have re-
vealed the presence of other thiols which could have important roles in tumor
cell metabolism. Investigations on the LMWT found in the acid soluble fraction
(ASF) of currently untreatable metastatic human prostate cancer cells indicated
the presence of significant quantities of thiol components other than glutathione
which were not identified [13]. In this paper, we report an in depth reinvestiga-
tion of these findings using more up to date techniques.
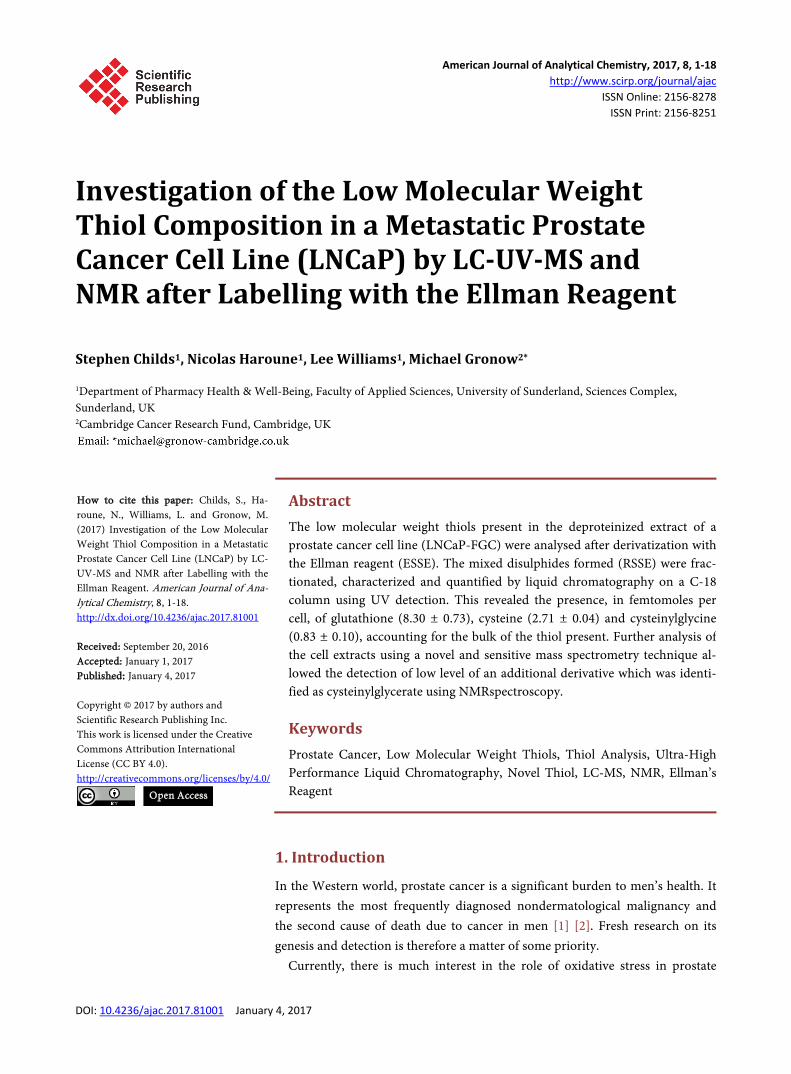
To facilitate this analysis and to avoid the formation of oxidation artefacts, the
ASFthiols (RSH) have been labelled with the Ellman reagent (ESSE) [14] to give
stable mixed disulfide derivatives (RSSE) [15] as shown in .
The mixed disulfides (RSSE) formed from the LNCaP cell ASF were analysed
and quantified by UHPLC-UV at 325 nm. An unknown component was also de-
tected in this system and identified by mass spectrometry and NMR spectroscopy.
2. Materials and Methods
2.1. Chemicals
L-cysteine (CYS), N-acetyl-cysteine (NAC), cysteinylglycine (CYSGLY), homo-
cysteine (HCYS), cysteamine (CYSAM) and glutathione (GSH), 5’5 dithiobis
S
O O-
NO2
SR
SH
O
O-
NO2
R SH S
O
O-
NO2
S
O
HO
O2N
ESSE ES
(Yellow)
RSSE
Buffer pH 7.6
. Reaction of the Ellman reagent (ESSE) with thiols (RSH).
S. Childs et al.
3
(-2-nitrobenzoic acid) (ESSE), trichloroacetic acid (TCA) and sodium phosphate
were purchased from Sigma-Aldrich Ltd (Poole, Dorset, UK). All solutions were
made using 18.2 mΩ-cm2 water, prepared on site by Diamond Lab Water System
(Triple Red Laboratory Technology, Bucks, UK) LC-MS grade methanol was
obtained from Fisher Scientific UK Ltd (Bishop Meadow Road, Loughborough.)
2.2. Cell Culture
A lymph node prostate cancer cell line (LNCaP, clone FGC-ECAC no. 89110211))
was supplied byPublic Health England (PHE) at Porton Down, UK. The cells
were grown in RPMI 1640 medium supplemented with 2 mM glutamine, 1 mM
sodium pyruvate and 10% v/v zone 2 foetal bovineserum. When at 80% conflu-
ence fresh medium was added and 2 hours later the cells were harvested with
trypsin. After centrifuging the pellets down from the trypsin solution they were
stored at −80˚C pending analysis.
2.3. Preparation of Ellman Mixed Disulfides
A) From known biological low molecular weight thiols
Stock solutions of GSH, CYS, CYSGLY, HCYS and NAC were prepared in
18.2 mΩ-cm2 water at an accurately known concentration (ca 2.0 mM). Calibra-
tion standards were prepared by mixing and then serially diluting the aqueous
stock solutions. 350 µL of diluted standard mixture was transferred to a 1.5 ml
micro-centrifuge tube. 50 µL of internal standard solution was added to each
tube followed by 400 µL of 5 mM ESSE solution (in 0.4 mM phosphate buffer,
pH 7.6). Each tube was vortexed briefly to mix the contents. 200 µL of 50% w/v
TCA was added and the tube was vortexed for 10 seconds then centrifuged at
14,000 rpm at +4˚C for 20 minutes. The supernatant was collected and trans-
ferred to a LC vials in a cooled auto sampler (+4˚C) for injection. [It was found
that analysis of these mixed disulfides had to be carried as soon as possible after
preparation to avoid artifact formation from the excess ESSE and ES present in
the mixture].
B) From cells
Cell pellets were defrosted at room temperature over 5 minutes. Each pellet
was re-suspended in 400 µL of cold deionised water by briefly aspirating then 2 ×
10 µl aliquots were taken for cell counting using a C-Chip® disposable haemocy-
tometer. 350 µl of the cell suspension was transferred to a 1.5 ml micro-centrifuge
tube. Blanks were prepared using 350 µl deionised water in place of cell suspen-
sion. 50 µl of internal standard solution was added to each tube followed by 400
µl 5 mM ESSE solution (in 0.4 mM phosphate buffer, pH 7.6). Tubes were vor-
texed briefly to mix the contents. The cells were lysed on ice using a sonic probe
(SoniPrep) on full power for 5 cycles of 10 seconds at an interval of 10 seconds.
After vortexing for 15 seconds the tubes were returned to ice for 5 minutes. 200
µl of 50% w/v TCA were added followed by vortexing for 10 seconds. The mix-
ture was then centrifuged at 14,000 rpm at 4˚C for 20 minutes and the super-
natant transferred to LC vials and placed in a cooled auto sampler (+4˚C) prior
S. Childs et al.
4
to injection.
2.4. Ultra-High Performance Liquid Chromatography Analysis
Gradient UHPLC was performed on an integrated Agilent 1290 UHPLC system,
using a TITAN™ C18 column (1.8 µm, 100 mm × 2.1 mm), (Supelco, Sigma Al-
drich.) The flow rate was 0.7 ml/min and the injection volume was 1 µL. A post
injection needle wash was included in the method to rinse for 3 seconds with
MeOH. Column temperature was automatically regulated at 35˚C. Mobile phase
A consisted of 0.1% v/v formic acid (HCOOH) in 18.2 mΩ-cm2 water. Mobile
phase B was 0.1% v/v formic acid in LC MS grade methanol. The gradient elu-
tion profile of 0 mins, 0% B; 6 mins, 2% B; 15 mins, 20% B; 18 mins, 90% B; 20
mins, 90% B; 22 mins, 0% B. The post time was 5 minutes at 0% B was used.
Primary detection and quantification of RSSE components by UV was per-
formed at 325 nm using a semi micro flow-cell. Details of this method are given
as supplementary information.
The UV absorbing peaks detected were examined by mass spectrometry using
an Agilent 6540 UHD QToF-MS operating in negative mode with Agilent Dual
Jet Stream (ASJ) electrospray ionisation (ESI). The system was programmed to
scan the mass range from 50 to 1700 with a scan rate of 3 spectra per second.
The source parameters were as follows: Gas Temperature, 250˚C; Gas Flow, 8
l/min; Nebulizer Pressure, 25 psig; Sheath Gas Temperature, 325˚C; Sheath Gas
Flow, 10 l/min. During analysis of thiol derivatives only, the collision cell energy
was set to 10 and the fragmentation was set to 50.0 V. Mass accuracy was main-
tained during the run by infusion of mass calibration ions.
LC-MS operation was managed, and data collected, using Agilent Masshunter
Acquisition Software B. 06. MS data was processed and analysed by Agilent
Masshunter Qualitative Analysis Software B. 06. Significance testing and fold-
change analysis of the data was performed using Mass Profiler Pro (Agilent
Technologies, Delaware, USA).
A synopsis of the development of the MS compatible LC methodology is given
in the supplementary information.
2.5. Semi Scaled Preparative HPLC
This was carried out on an integrated Agilent 1290 UHPLC system. ACE C1Co8
(250 × 10 mm, 5 µM). Column Temperature: Ambient (18˚C). Mobile Phase:
(A): 0.1% HCOOH in H20, (B): 0.1% HCOOH in MeOH. Flow Rate: 8.00
ml/min. Gradient: 0 min 10% B; 11.88 min 50% B; 14.77 min 90% B; 17.72 min
90% B; 20.68 min 10% B; 23.63 min 10% B. Post-time: 10 min. UV: 325 nm.
After repeated injections the pooled sample peaks were freeze dried and re-
suspended in 100% D2O for NMR analysis.
2.6. NMR Spectroscopy
1H NMR data were recorded on a Bruker AVANCE III NMR spectrometer at
500.13 MHz at 300 K by using a 5-mm BBI probe equipped with a z-gradient
S. Childs et al.
5
coil.
A relaxation delay, 2.4 s; acquisition time, 1.6 s; spectral window 10 000 Hz, 32
768 data points and a number of 128 scans were used to collect the data. A 0.5
Hz line broadening procedure was applied before Fourier transformation, and
baseline correction was performed before integration with Bruker software. The
methanol signal was used as an internal reference for chemical shift (3.3 ppm).
The signal from residual water was used as an internal reference for chemical
shift (4.7 ppm).
3. Results
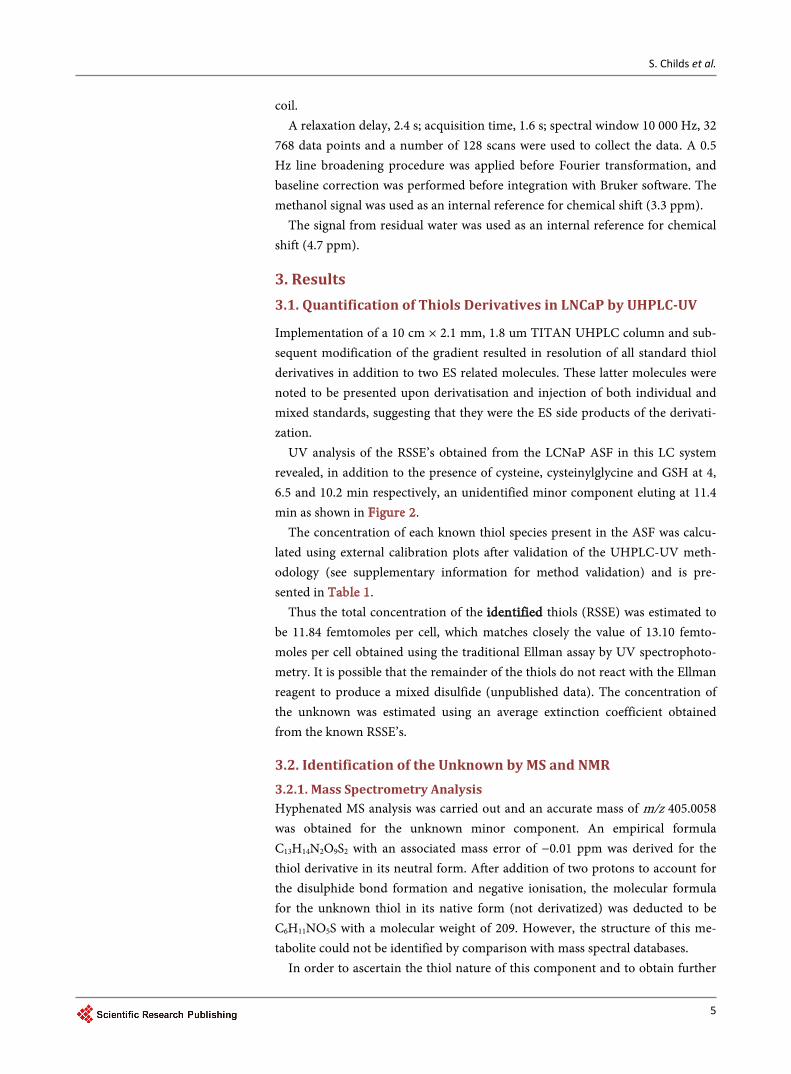
3.1. Quantification of Thiols Derivatives in LNCaP by UHPLC-UV
Implementation of a 10 cm × 2.1 mm, 1.8 um TITAN UHPLC column and sub-
sequent modification of the gradient resulted in resolution of all standard thiol
derivatives in addition to two ES related molecules. These latter molecules were
noted to be presented upon derivatisation and injection of both individual and
mixed standards, suggesting that they were the ES side products of the derivati-
zation.
UV analysis of the RSSE’s obtained from the LCNaP ASF in this LC system
revealed, in addition to the presence of cysteine, cysteinylglycine and GSH at 4,
6.5 and 10.2 min respectively, an unidentified minor component eluting at 11.4
min as shown in .
The concentration of each known thiol species present in the ASF was calcu-
lated using external calibration plots after validation of the UHPLC-UV meth-
odology (see supplementary information for method validation) and is pre-
sented in .
Thus the total concentration of the thiols (RSSE) was estimated to
be 11.84 femtomoles per cell, which matches closely the value of 13.10 femto-
moles per cell obtained using the traditional Ellman assay by UV spectrophoto-
metry. It is possible that the remainder of the thiols do not react with the Ellman
reagent to produce a mixed disulfide (unpublished data). The concentration of
the unknown was estimated using an average extinction coefficient obtained
from the known RSSE’s.
3.2. Identification of the Unknown by MS and NMR
3.2.1. Mass Spectrometry Analysis
Hyphenated MS analysis was carried out and an accurate mass of m/z 405.0058
was obtained for the unknown minor component. An empirical formula
C13H14N2O9S2 with an associated mass error of −0.01 ppm was derived for the
thiol derivative in its neutral form. After addition of two protons to account for
the disulphide bond formation and negative ionisation, the molecular formula
for the unknown thiol in its native form (not derivatized) was deducted to be
C6H11NO5S with a molecular weight of 209. However, the structure of this me-
tabolite could not be identified by comparison with mass spectral databases.
In order to ascertain the thiol nature of this component and to obtain further
S. Childs et al.
6
. UHPLC-UV chromatograms of standard RSSE derivatives (lower blue trace) and in the ASF of LNCaP cells (upper
green trace). Column: SUPELCO TITAN-C18 100 × 2.1 mm, 1.8 µM; Mobile Phase: (A) H2O 0.1% v/v HCOOH, (B) MeCN 0.1%
v/v HCOOH; Injection Volume: 1 µL; Temperature: 35˚C; Flow Rate: 0.7 ml/min; Gradient: 0 min, 100% A; 6 min, 98% A; 15
min, 80% A; 18 min, 100% A; 20 min, 10% A; 22 min, 100% A; Post Time: 5 min; UV: 325 nm.
. UHPLC quantitation of LNCaP cell RSSE components.
RSSE components Concentration in femtomoles per cell
Acid soluble fraction (ASF): total thiol content (Ellman assay) 13.10 ± 0.80
GS-SE glutathione 8.30 ± 0.73
CYS-SE cysteine 2.70 ± 0.04
CYSGLY-SE cysteinylglycine 0.83 ± 0.10
Unknown S-SE 0.011 (estimate)
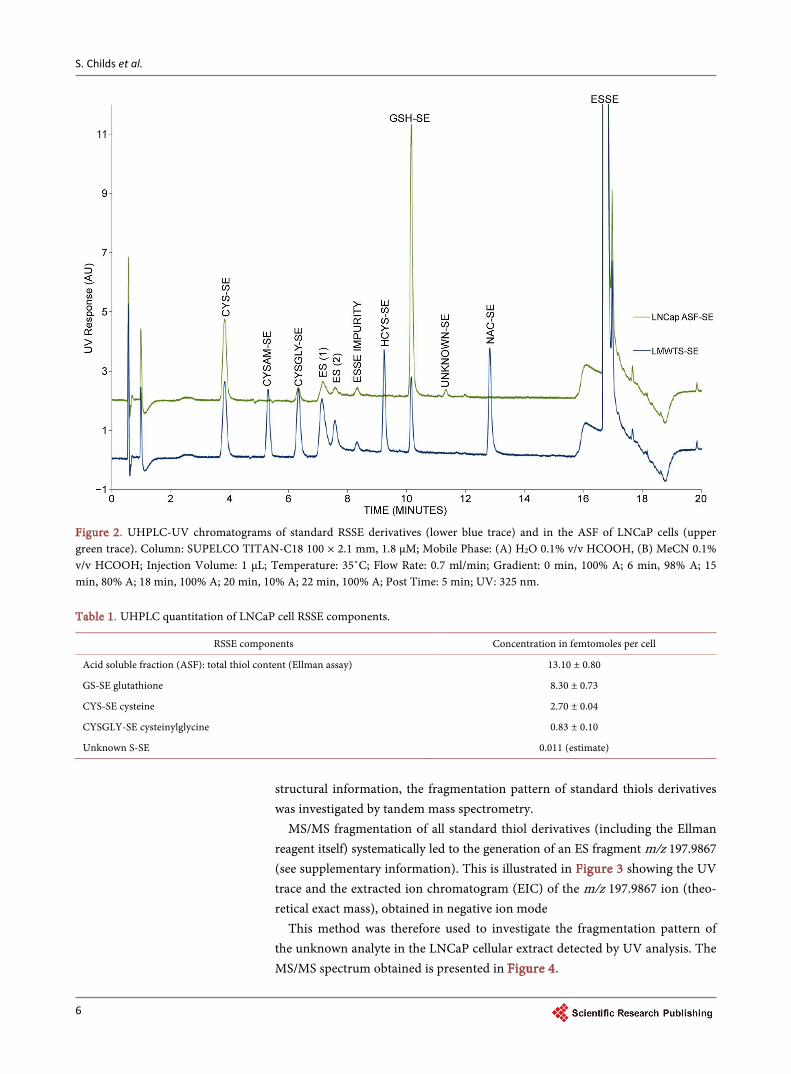
structural information, the fragmentation pattern of standard thiols derivatives
was investigated by tandem mass spectrometry.
MS/MS fragmentation of all standard thiol derivatives (including the Ellman
reagent itself) systematically led to the generation of an ES fragment m/z 197.9867
(see supplementary information). This is illustrated in showing the UV
trace and the extracted ion chromatogram (EIC) of the m/z 197.9867 ion (theo-
retical exact mass), obtained in negative ion mode
This method was therefore used to investigate the fragmentation pattern of
the unknown analyte in the LNCaP cellular extract detected by UV analysis. The
MS/MS spectrum obtained is presented in .
S. Childs et al.
7
Chromatographic traces—UV (red trace) and EIC 197.9867 (blue trace) showing the pattern obtained from standard
mixed thiol derivatives. Column: SUPELCO TITAN-C18 100 × 2.1 mm, 1.8 µM; Mobile Phase: (A) H2O 0.1% v/v HCOOH, (B)
MeCN 0.1% v/v HCOOH; Injection Volume: 1 µL; Temperature: 35˚C; Flow Rate: 0.7 ml/min; Gradient: 0 min, 100% A; 6 min,
98% A; 15 min, 80% A; 18 min, 100% A; 20 min, 10% A; 22 min, 100% A; Post Time: 5 min; UV: 325 nm; MS Mode: Negative;
Scan 50 - 1700 m/z (EIC for 197.9867).
. MS fragmentation spectrum of the unknown derivative.
S. Childs et al.
8
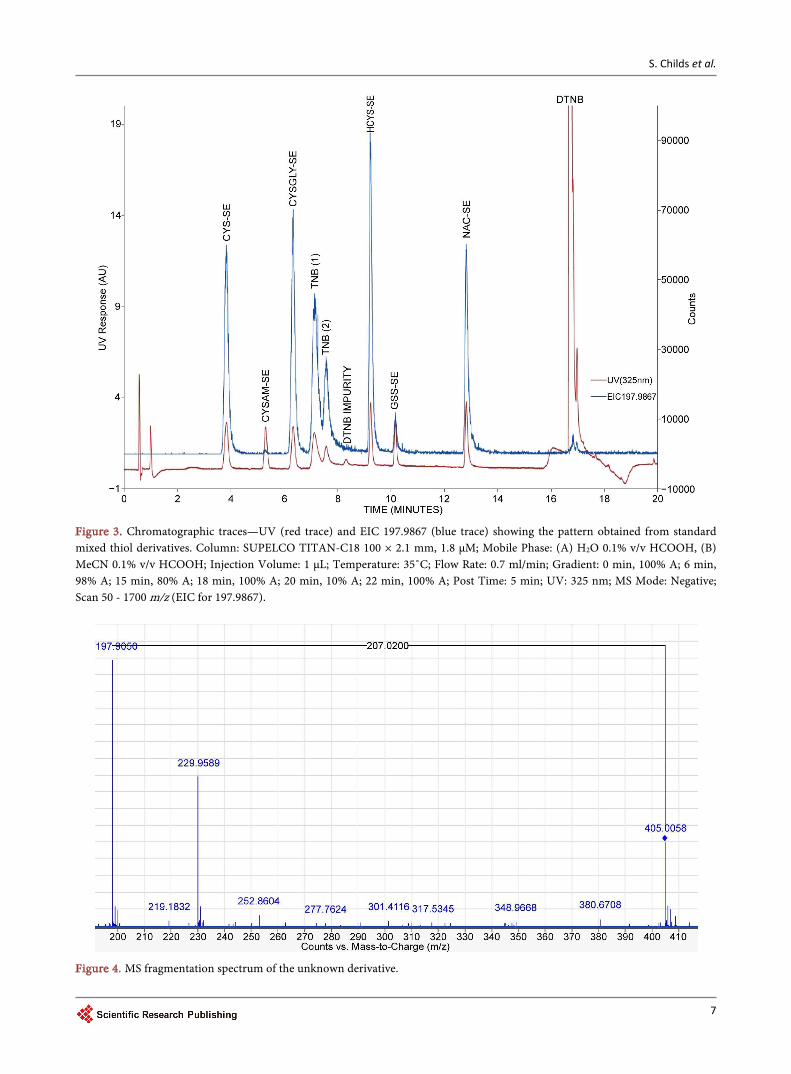
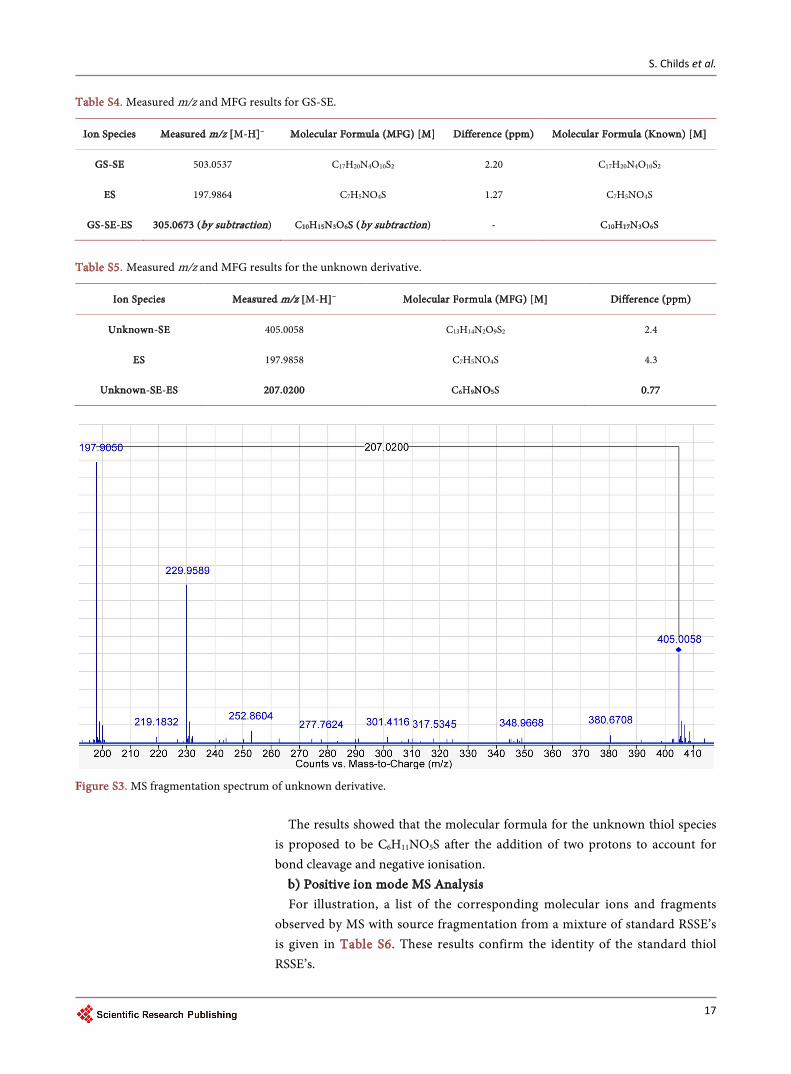
Two fragments were observed at 229.9589 and 197.9858 m/z, the former being
identified as the ES-S− ion whereas the latter, corresponding to the ES ion, con-
firmed the thiol nature of the analyte ( 2).
However, even in conjunction with the number of double bond equivalents in
C6H11NO5S determined to be 2, the structure of the unknown thiol could not be
identified by MS or MS/MS alone. Therefore sufficient material for an NMR
analysis had to be generated using preparative chromatography.
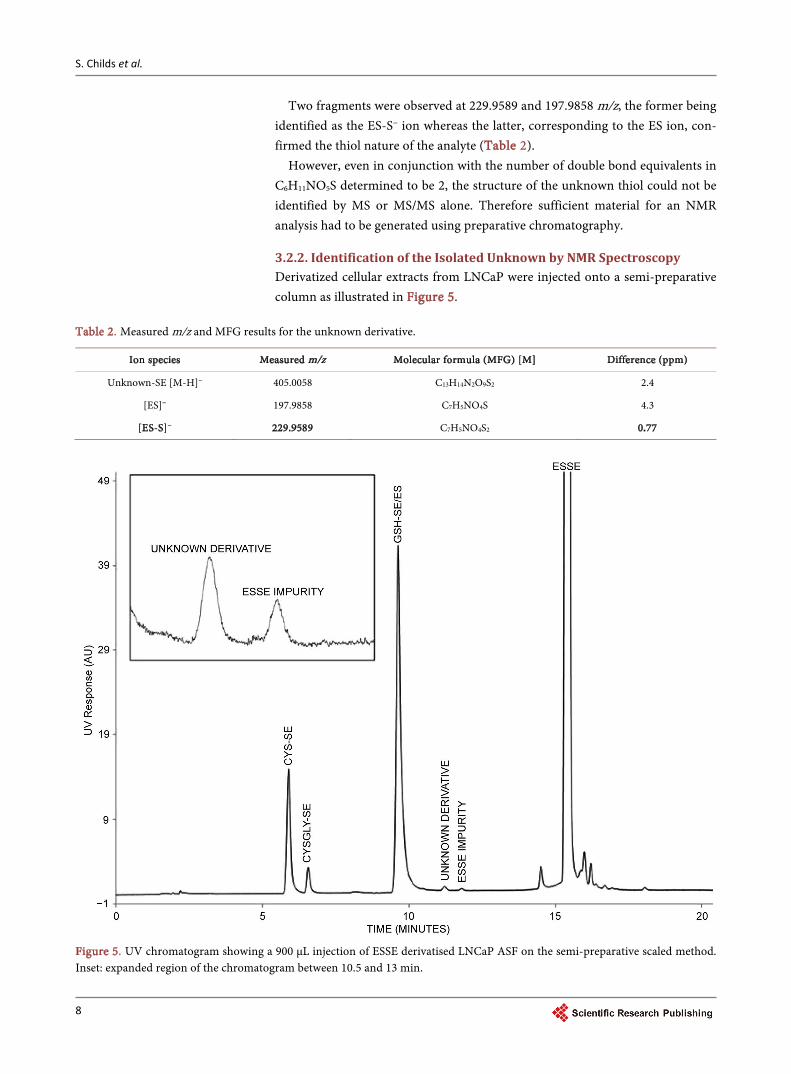
3.2.2. Identification of the Isolated Unknown by NMR Spectroscopy
Derivatized cellular extracts from LNCaP were injected onto a semi-preparative
column as illustrated in .
. Measured m/z and MFG results for the unknown derivative.
[
Unknown-SE [M-H]− 405.0058 C13H14N2O9S2 2.4
[ES]− 197.9858 C7H5NO4S 4.3
[ - − C7H5NO4S2
. UV chromatogram showing a 900 µL injection of ESSE derivatised LNCaP ASF on the semi-preparative scaled method.
Inset: expanded region of the chromatogram between 10.5 and 13 min.
S. Childs et al.
9
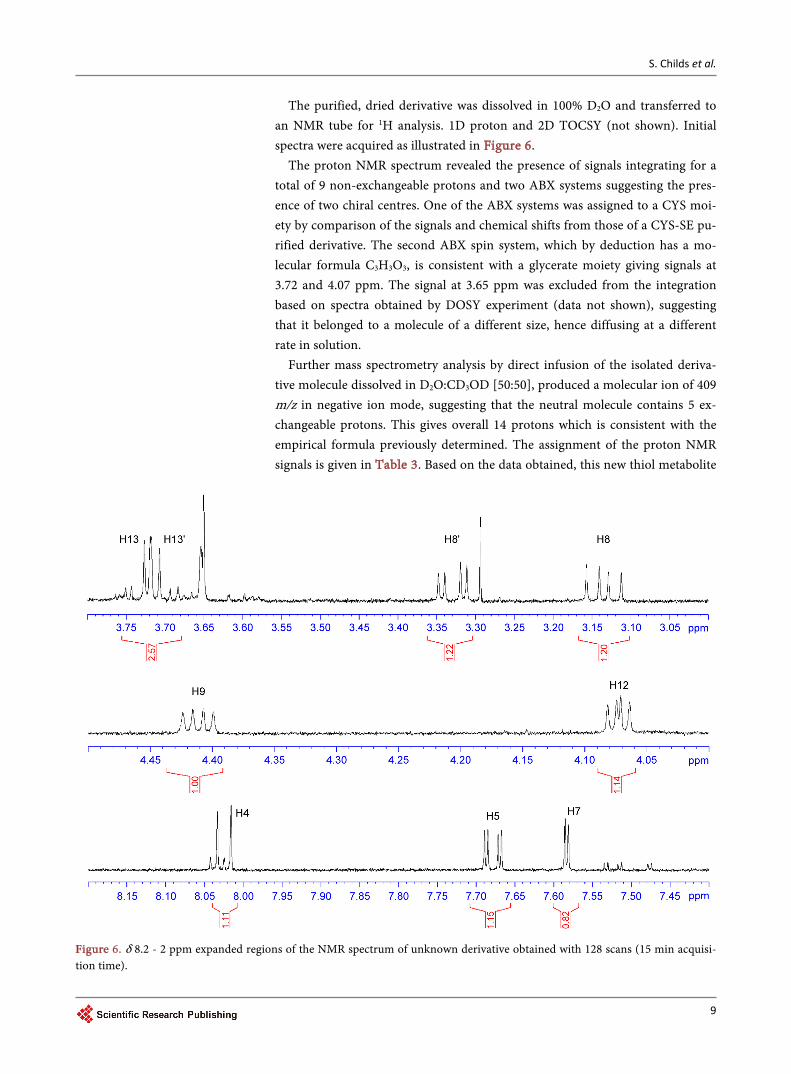
The purified, dried derivative was dissolved in 100% D2O and transferred to
an NMR tube for 1H analysis. 1D proton and 2D TOCSY (not shown). Initial
spectra were acquired as illustrated in .
The proton NMR spectrum revealed the presence of signals integrating for a
total of 9 non-exchangeable protons and two ABX systems suggesting the pres-
ence of two chiral centres. One of the ABX systems was assigned to a CYS moi-
ety by comparison of the signals and chemical shifts from those of a CYS-SE pu-
rified derivative. The second ABX spin system, which by deduction has a mo-
lecular formula C3H3O3, is consistent with a glycerate moiety giving signals at
3.72 and 4.07 ppm. The signal at 3.65 ppm was excluded from the integration
based on spectra obtained by DOSY experiment (data not shown), suggesting
that it belonged to a molecule of a different size, hence diffusing at a different
rate in solution.
Further mass spectrometry analysis by direct infusion of the isolated deriva-
tive molecule dissolved in D2O:CD3OD [50:50], produced a molecular ion of 409
m/z in negative ion mode, suggesting that the neutral molecule contains 5 ex-
changeable protons. This gives overall 14 protons which is consistent with the
empirical formula previously determined. The assignment of the proton NMR
signals is given in . Based on the data obtained, this new thiol metabolite
6. δ 8.2 - 2 ppm expanded regions of the NMR spectrum of unknown derivative obtained with 128 scans (15 min acquisi-
tion time).
S. Childs et al.
10
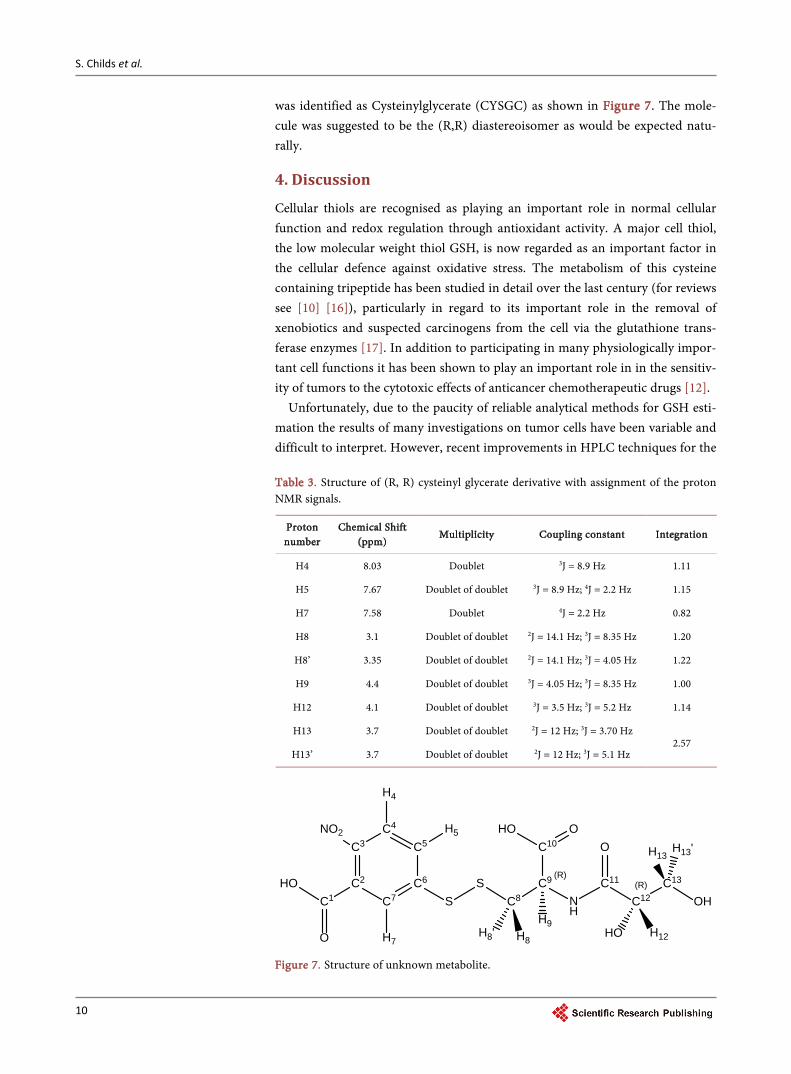
was identified as Cysteinylglycerate (CYSGC) as shown in . The mole-
cule was suggested to be the (R,R) diastereoisomer as would be expected natu-
rally.
4. Discussion
Cellular thiols are recognised as playing an important role in normal cellular
function and redox regulation through antioxidant activity. A major cell thiol,
the low molecular weight thiol GSH, is now regarded as an important factor in
the cellular defence against oxidative stress. The metabolism of this cysteine
containing tripeptide has been studied in detail over the last century (for reviews
see [10] [16]), particularly in regard to its important role in the removal of
xenobiotics and suspected carcinogens from the cell via the glutathione trans-
ferase enzymes [17]. In addition to participating in many physiologically impor-
tant cell functions it has been shown to play an important role in in the sensitiv-
ity of tumors to the cytotoxic effects of anticancer chemotherapeutic drugs [12].
Unfortunately, due to the paucity of reliable analytical methods for GSH esti-
mation the results of many investigations on tumor cells have been variable and
difficult to interpret. However, recent improvements in HPLC techniques for the
. Structure of (R, R) cysteinyl glycerate derivative with assignment of the proton
NMR signals.
H4 8.03 Doublet 3J = 8.9 Hz 1.11
H5 7.67 Doublet of doublet 3J = 8.9 Hz; 4J = 2.2 Hz 1.15
H7 7.58 Doublet 4J = 2.2 Hz 0.82
H8 3.1 Doublet of doublet 2J = 14.1 Hz; 3J = 8.35 Hz 1.20
H8’ 3.35 Doublet of doublet 2J = 14.1 Hz; 3J = 4.05 Hz 1.22
H9 4.4 Doublet of doublet 3J = 4.05 Hz; 3J = 8.35 Hz 1.00
H12 4.1 Doublet of doublet 3J = 3.5 Hz; 3J = 5.2 Hz 1.14
H13 3.7 Doublet of doublet 2J = 12 Hz; 3J = 3.70 Hz 2.57
H13’ 3.7 Doublet of doublet 2J = 12 Hz; 3J = 5.1 Hz
NO2
S
C8
C9 (R)
C10
OHO
NH
O
OH
H12HO
C13
C12(R)C11
H9
C6
C7
C2
C3
C4
C5
SC1
O
HO
H13H13'
H8' H8H7
H5
H4
. Structure of unknown metabolite.
S. Childs et al.
11
estimation of GSH [18] and other thiols, such those illustrated in this paper,
should help greatly to elucidate the role of LMWT thiols in tumor metabolism.
The results reported here confirm the previously reported findings of lower
percentage GSH content in the acid soluble fraction of LNCaP cells than usually
found in other cells [7]. The amount of GSH present in the ASF was higher than
previously found; possibly due to 2 hours re-incubation of confluent cells in
fresh medium employed before harvesting. However the presence of significant
quantities of cysteine (which usually quickly incorporated into GSH) and cys-
teinylglycine indicates that abnormal/aberrant GSH metabolic pathways exist in
this tumor cell line [19]. In the normal cellular synthesis of GSH the only cys-
teinyl dipeptide involved is γ-glutamylcysteine; GSH synthetase adds glycine to
this to give the tripeptide. Free dipeptide cysteinylglycine is not normally present
and if formed it is broken down by a dipeptidase to generate cysteine and gly-
cine. The only enzyme that can hydrolyse GSH, removing the glutamate to give
cysteinylglycine, is γ-glutamyltranspeptidase which is only present on the exter-
nal surfaces of certain cell types [20].
Whether this pattern of low molecular weight thiols is a characteristic of
lymph node metastatic cells in general is yet to be ascertained. However, in a
study of human prostate cells obtained from clinical biopsy samples Chaiswing
et al. [21] demonstrated a decrease in GSH (using an enzyme assay) and an in-
crease in cysteine levels in these samples with increasing Gleason scores (a clini-
cal measure of an increased presence of malignant cells). They attributed this to
redox imbalance occurring with prostate cancer progression. They concluded
that, as treatment of metastatic cancer is generally unsuccessful, further knowl-
edge of redox-state profiles in these cancers may help to predict their behaviour
and response to chemotherapeutic drugs and radiation.
The presence of a new metabolite, cysteinylglycerate, albeit in small quantities,
may be due to a defect in the usual phosphoglycerate pathways; phosphoglycer-
ates are important biochemical intermediates in glycolysis. Increased glycolysis
is a feature of the well-known Warburg effect of increased anaerobic respiration
found in most tumour cells [22] though there have been no reports of glycerate
being involved with thiol metabolism.
Cysteinylglycerate might prove to be a useful biomarker for this kind of tu-
mour, however further metabolomic investigations are needed to establish the
biochemical relevance of this new metabolite in the overall biochemistry of
lymph node metastatic cells and to evaluate its diagnostic potential.
5. Conclusion
Using the Ellman reagent as a label for the LMWT present in LNCaP metastatic
tumor cells, we have identified 4 components. In ascending order of concentra-
tion, they are glutathione, cysteine, cysteinylglycine and cysteinylglycerate. Fur-
ther, metabolomic investigations are needed to establish their importance in the
overall biochemistry of lymph node metastatic cell. This knowledge may aid the
development of new chemotherapeutic agents to treat metastatic tumours that
S. Childs et al.
12
are resistant to radiation and cannot be effectively removed by surgery.
Acknowledgements
The authors wish to thank the Cambridge Cancer Research Fund for generous
financial support throughout this project.
References
[1] (2013) NCI Statistics.
https://seer.cancer.gov/statfacts/html/prost.html
[2] Cancer Research UK. Org Prostate Cancer Statistics. 2012.
http://info.cancerresearchuk.org/cancerstats/types/prostate/incidence/#geog
[3] Gupta-Elera, G., Garrett, A.R., Robison, R.A. and O’Neill, K.L. (2012) The Role of
Oxidative Stress in Prostate Cancer. European Journal of Cancer Prevention, ,
155-162. https://doi.org/10.1097/CEJ.0b013e32834a8002
[4] Paschos, A., Pandya, R., Duivenvoorden, W.C.M. and Pinthus, J.H. (2013) Oxida-
tive Stress in Prostate Cancer: Changing Research Concepts towards a Novel Para-
digm for Prevention ad Therapeutics. Prostate Cancer and Prostatic Disease, ,
217-225. https://doi.org/10.1038/pcan.2013.13
[5] Haugarrd, N. (2000) Reflections on the Role of the Thiol Group in Biology. Annals
of the New York Academy of Sciences, , 148-158.
https://doi.org/10.1111/j.1749-6632.2000.tb06183.x
[6] Harris, C. and Hansen, J.M. (2012) Oxidative Stress, Thiols, and Redox Profiles.
Methods in Molecular Biology, , 325-346.
https://doi.org/10.1007/978-1-61779-867-2_21
[7] Bindoli, A., Fukuto, J.M. and Forman, H.J. (2008) Thiol Chemistry in Peroxidase
Catalysis and Redox Signaling. Antioxidants & Redox Signaling, , 1549-1564.
[8] Chaiswing, L., Zhong, W. and Oberley, T.D. (2011) Distinct Redox Profiles of Se-
lected Human Prostate Carcinoma Cell Lines: Implications for Rational Design of
Redox Therapy. Cancers, 3, 3557-3584. https://doi.org/10.3390/cancers3033557
[9] Chaiswing, L., Zhong, W., Liang, Y., Jones, D.P. and Oberley, T.D. (2012) Regula-
tion of Prostate Cancer Cell Invasion by Modulation of Extra- and Intracellular Re-
dox Balance. Free Radical Biology & Medicine, , 452-461.
https://doi.org/10.1016/j.freeradbiomed.2011.10.489
[10] Dickinson, D.A. and Forman, H.J. (2002) Cellular Glutathione and Thiols Metabo-
lism. Biochemical Pharmacology, , 1019-1026.
https://doi.org/10.1016/S0006-2952(02)01172-3
[11] Forman, H.J., Zhang, H. and Rinna, A. (2009) Glutathione: Overview of Its Protec-
tive Roles, Measurement and Biosynthesis. Molecular Aspects of Medicine, , 1-12.
https://doi.org/10.1016/j.mam.2008.08.006
[12] Traverso, N., Ricciari, R., Nitti, M., Marengo, B., Furfaro, A.L., Pronzato, M., Mari-
nari, U.M. and Domenicotti, C. (2013) Role of Glutathione in Cancer Progression
and Chemoresistance. Oxidative Medicine and Cellular Longevity, , Article ID:
972913. https://doi.org/10.1155/2013/972913
[13] Gronow, M. (2010) Studies on the Non-Protein Thiols of a Human Prostatic Cancer
Cell Line: Glutathione Content. Cancers, 2, 1092-1106.
https://doi.org/10.3390/cancers2021092
[14] Ellman, G.L. (1959) Tissue Sulfhydryl Groups. Archives of Biochemistry and Bio-
physics, , 70-77. https://doi.org/10.1016/0003-9861(59)90090-6
S. Childs et al.
13
[15] Russell, J., McKeown, J.A., Hensman, C., Smith, W.E. and Reglinski, J. (1997) HPLC
Determination of Biologically Active Thiols Using Pre-Column Derivatization with
5,5’-Dithio-(Bis-2-Nitrobenzoic Acid). Journal of Pharmaceutical and Biomedical
Analysis, , 1757-1763. https://doi.org/10.1016/S0731-7085(96)02019-5
[16] Vina, J. (1990) Glutathione: Metabolism and Physiological Functions. CRC Press,
Boca Raton.
[17] Hayes, J.D. and Pulford, D.J. (1995) The Glut Athione S-Transferase Supergene
Family: Regulation of GST and the Contribution of the Lsoenzymes to Cancer
Chemoprotection and Drug Resistance Part I. Critical Reviews in Biochemistry and
Molecular Biology, , 445-599. https://doi.org/10.3109/10409239509083491
[18] Monostori, P., Wittmann, G., Karg, E. and Turi, S. (2009) Determination of Glu-
tathione and Glutathione Disulfide in Biological Samples: An In-Depth Review.
Journal of Chromatography B, , 3331-3346.
https://doi.org/10.1016/j.jchromb.2009.06.016
[19] Childs, S., Haroune, N., Wlliams, L. and Gronow, M. (2016) Determination of Cel-
lular Glutathione: Glutathione Disulfide Ratio in Prostate Cancer Cells by High
Performance Liquid Chromatography with Electrochemical Detection. Journal of
Chromatography A, , 67-73. https://doi.org/10.1016/j.chroma.2016.01.050
[20] Lu, S.C. (2013) Glutathione Biosynthesis. Biochimica et Biophysica Acta (BBA)—
General Subjects, , 3143-3153. https://doi.org/10.1016/j.bbagen.2012.09.008
[21] Chaiswing, L., Zhong, W. and Oberley, T.D. (2014) Increasing Discordant Antioxi-
dant Protein Levels and Enzymatic Activities Contribute to Increasing Redox Im-
balance Observed during Human Prostate Cancer Progression. Free Radical Biology
and Medicine, , 342-352. https://doi.org/10.1016/j.freeradbiomed.2013.11.006
[22] Chen, Z., Qian, Y. and Wu, S. (2015) The Warburg Effect: Evolving Interpretations
of an Established Concept. Free Radical Biology and Medicine, , 253-263.
https://doi.org/10.1016/j.freeradbiomed.2014.08.027
S. Childs et al.
14
1. Supplementary Information
1.1. Method Validation for UV Quantification
The achieved chromatographic resolution of derivatised thiol standards and the
use of a specific wavelength for derivative moieties ensured the suitable selectiv-
ity of this method for analysis of LNCaP cellular thiols.
1.2. Determination of Lower Limits of Detection
The lower limits of detection were established for each derivative standard by
sequentially reducing the concentration of standard thiol injected onto the col-
umn until a signal to noise ratio (S:N) of 3:1 was observed. Triplicate injections
at the LLOD concentration were performed to confirm these values. The LLOD
was determined to be 2.1 µM for CYS-SE, 1.6 µM for GS-SE and 2.7 µM for
CYSGLY-SE
1.3. Determination of Lower Limits of Quantitation (LLOQ) &
Intraday Precision
The lower limits of quantitation and intraday precision were assessed simulta-
neously by measuring 8 repeat injections at the concentration deemed to be the
lower limit of quantitation. This concentration gave a peak area response with a
coefficient of variation less than 3% for the derivatised standards and therefore is
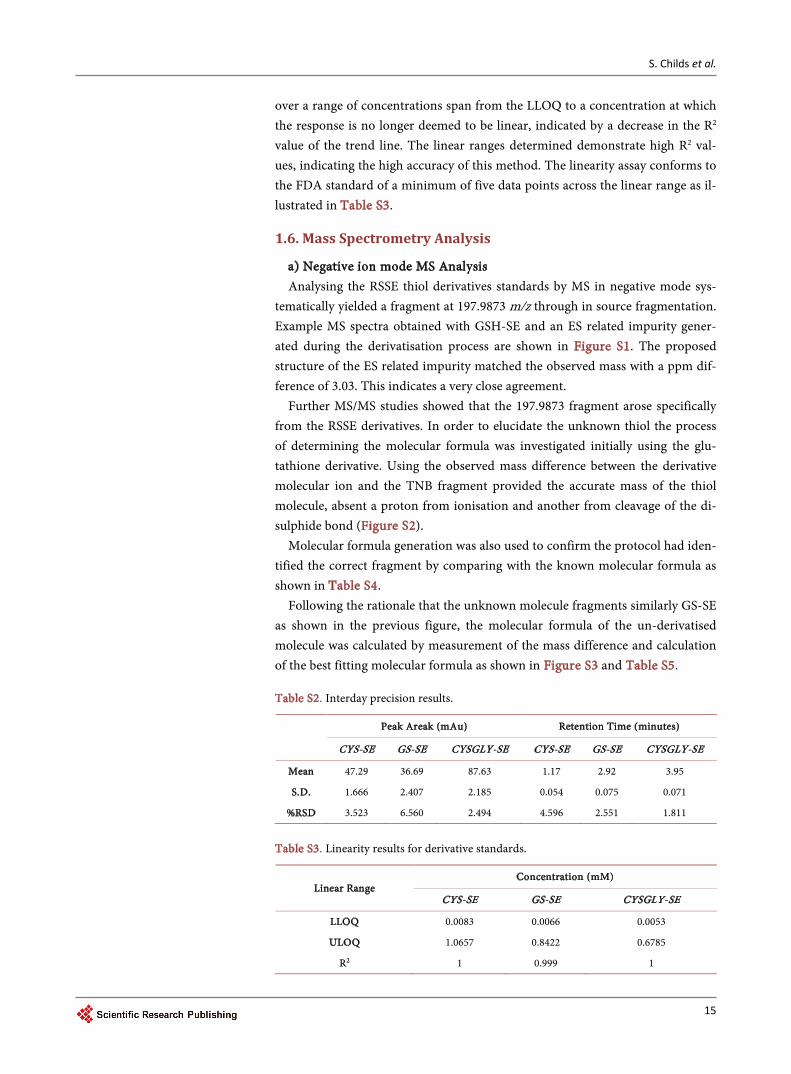
a suitable LLOQ as illustrated in .
1.4. Determination of Interday Precision
Interday precision was assessed to ascertain the stability of the method over an
extended period of time with respect to the peak response and retention time of
the thiol derivatives in the sample. Freshly prepared derivatised LNCaP cellular
extract was injected six times over six consecutive days and was stored at ambi-
ent temperature in the autosampler between days. The coefficient of variation
was determined for each derivative analyte over the course of the validation as
shown in .
The coefficients of variation for retention time and peak area of the analytes
are shown to be less than 10% and therefore are within the criteria limits for
biological method validation.
1.5. Determination of Linearity
Linearity was assessed for each standard derivative by injecting a mixed standard
. LLOQ & intraday precision results.
- - -
0.0083 0.0066 0.0053
4.04 3.94 2.24
0.048 0.070 0.048
1.199 1.768 2.164
S. Childs et al.
15
over a range of concentrations span from the LLOQ to a concentration at which
the response is no longer deemed to be linear, indicated by a decrease in the R2
value of the trend line. The linear ranges determined demonstrate high R2 val-
ues, indicating the high accuracy of this method. The linearity assay conforms to
the FDA standard of a minimum of five data points across the linear range as il-
lustrated in .
1.6. Mass Spectrometry Analysis
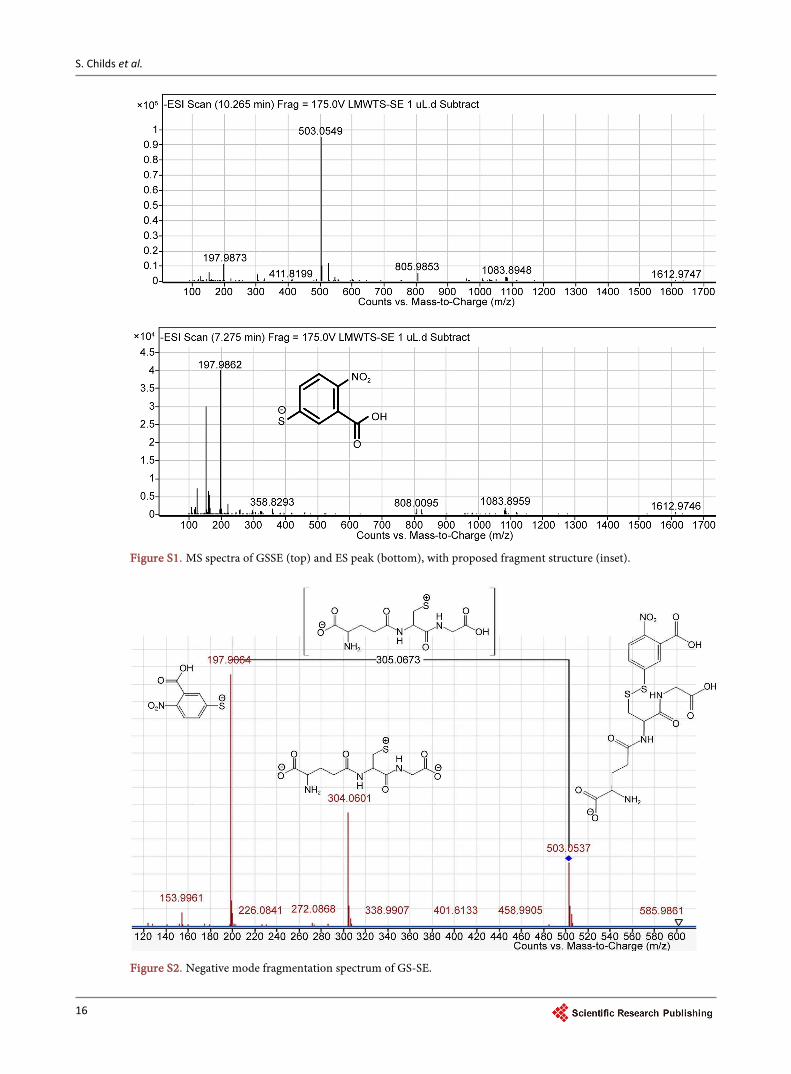
Analysing the RSSE thiol derivatives standards by MS in negative mode sys-
tematically yielded a fragment at 197.9873 m/z through in source fragmentation.
Example MS spectra obtained with GSH-SE and an ES related impurity gener-
ated during the derivatisation process are shown in . The proposed
structure of the ES related impurity matched the observed mass with a ppm dif-
ference of 3.03. This indicates a very close agreement.
Further MS/MS studies showed that the 197.9873 fragment arose specifically
from the RSSE derivatives. In order to elucidate the unknown thiol the process
of determining the molecular formula was investigated initially using the glu-
tathione derivative. Using the observed mass difference between the derivative
molecular ion and the TNB fragment provided the accurate mass of the thiol
molecule, absent a proton from ionisation and another from cleavage of the di-
sulphide bond ( ).
Molecular formula generation was also used to confirm the protocol had iden-
tified the correct fragment by comparing with the known molecular formula as
shown in .
Following the rationale that the unknown molecule fragments similarly GS-SE
as shown in the previous figure, the molecular formula of the un-derivatised
molecule was calculated by measurement of the mass difference and calculation
of the best fitting molecular formula as shown in and .
. Interday precision results.
- - - - - -
47.29 36.69 87.63 1.17 2.92 3.95
1.666 2.407 2.185 0.054 0.075 0.071
3.523 6.560 2.494 4.596 2.551 1.811
. Linearity results for derivative standards.
- - -
0.0083 0.0066 0.0053
1.0657 0.8422 0.6785
R2 1 0.999 1
S. Childs et al.
16
. MS spectra of GSSE (top) and ES peak (bottom), with proposed fragment structure (inset).
. Negative mode fragmentation spectrum of GS-SE.
S. Childs et al.
17
. Measured m/z and MFG results for GS-SE.
[M- − [ [
- 503.0537 C17H20N4O10S2 2.20 C17H20N4O10S2
197.9864 C7H5NO4S 1.27 C7H5NO4S
- - ) C H N3O6 ) - C H N3O6S
. Measured m/z and MFG results for the unknown derivative.
[M- − [
- 405.0058 C13H14N2O9S2 2.4
197.9858 C7H5NO4S 4.3
- - C6H9 5S
. MS fragmentation spectrum of unknown derivative.
The results showed that the molecular formula for the unknown thiol species
is proposed to be C6H11NO5S after the addition of two protons to account for
bond cleavage and negative ionisation.
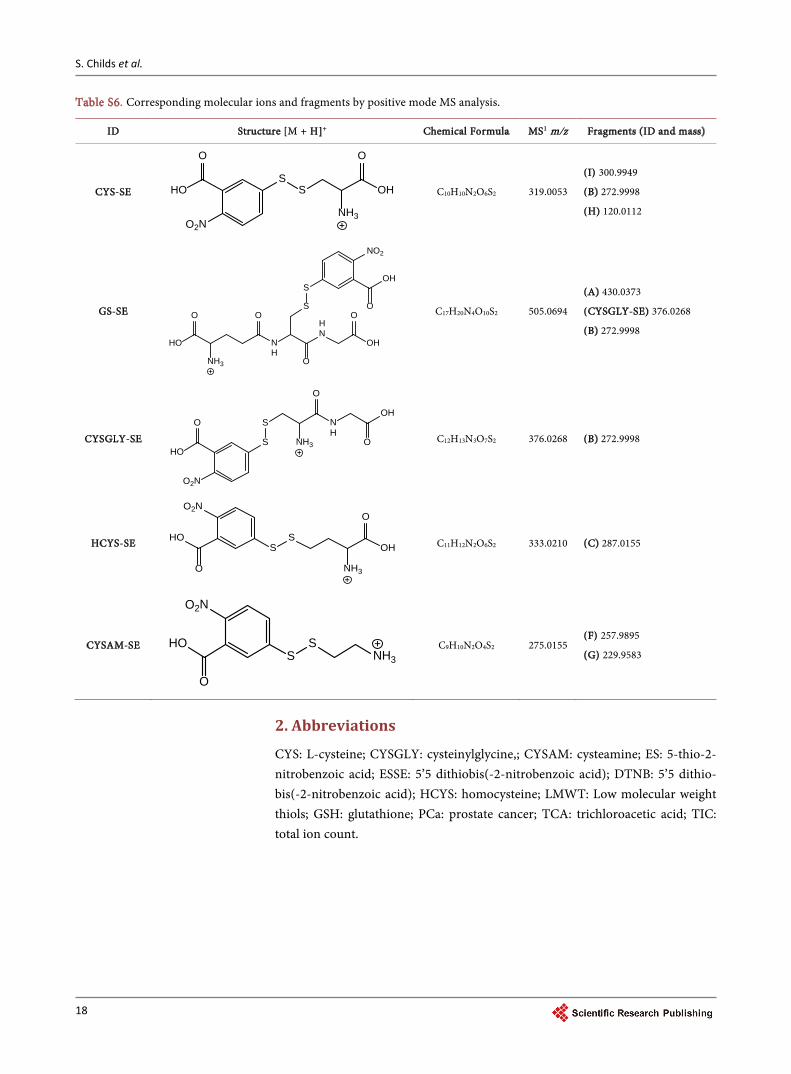
For illustration, a list of the corresponding molecular ions and fragments
observed by MS with source fragmentation from a mixture of standard RSSE’s
is given in . These results confirm the identity of the standard thiol
RSSE’s.
S. Childs et al.
18
. Corresponding molecular ions and fragments by positive mode MS analysis.
[M + + 1
-
S
O
HO
O2NNH3
O
OHS
C10H10N2O6S2 319.0053
300.9949
272.9998
120.0112
-
NH3
O
HO
S
O
OH
NO2
NH
O
O
HN
SO
OH
C17H20N4O10S2 505.0694
430.0373
- 376.0268
272.9998
- NH3
O
NH
S
O
OH
S
O
HO
O2N
C12H13N3O7S2 376.0268 272.9998
- S
O
HO
O2N
S
NH3
O
OH
C11H12N2O6S2 333.0210 287.0155
- S
O
HO
O2N
SNH3
C9H10N2O4S2 275.0155 257.9895
229.9583
2. Abbreviations
CYS: L-cysteine; CYSGLY: cysteinylglycine,; CYSAM: cysteamine; ES: 5-thio-2-
nitrobenzoic acid; ESSE: 5’5 dithiobis(-2-nitrobenzoic acid); DTNB: 5’5 dithio-
bis(-2-nitrobenzoic acid); HCYS: homocysteine; LMWT: Low molecular weight
thiols; GSH: glutathione; PCa: prostate cancer; TCA: trichloroacetic acid; TIC:
total ion count.
Accepting pre-submission inquiries through Email, Facebook, LinkedIn, Twitter, etc.
A wide selection of journals (inclusive of 9 subjects, more than 200 journals)
Providing 24-hour high-quality service
User-friendly online submission system
Fair and swift peer-review system
Efficient typesetting and proofreading procedure
Display of the result of downloads and visits, as well as the number of cited articles
Maximum dissemination of your research work
Submit your manuscript at: http://papersubmission.scirp.org/ Or contact [email protected]