Embed Size (px)
Citation preview
1
Legal
Disclaimer
• The information contained in this presentation,
including all forward-looking information, is
subject to change without notice, whether as a
result of new information, further events or
otherwise, and China Airlines(the “Company”)
undertakes no obligation to publicly update or
revise the information contained in this
presentation.
• No guarantees regarding the completeness,
accuracy, and reliability of information contained
are made explicitly or implicitly. They are not
intended to represent complete statement of the
Company, industryor futuredevelopment.
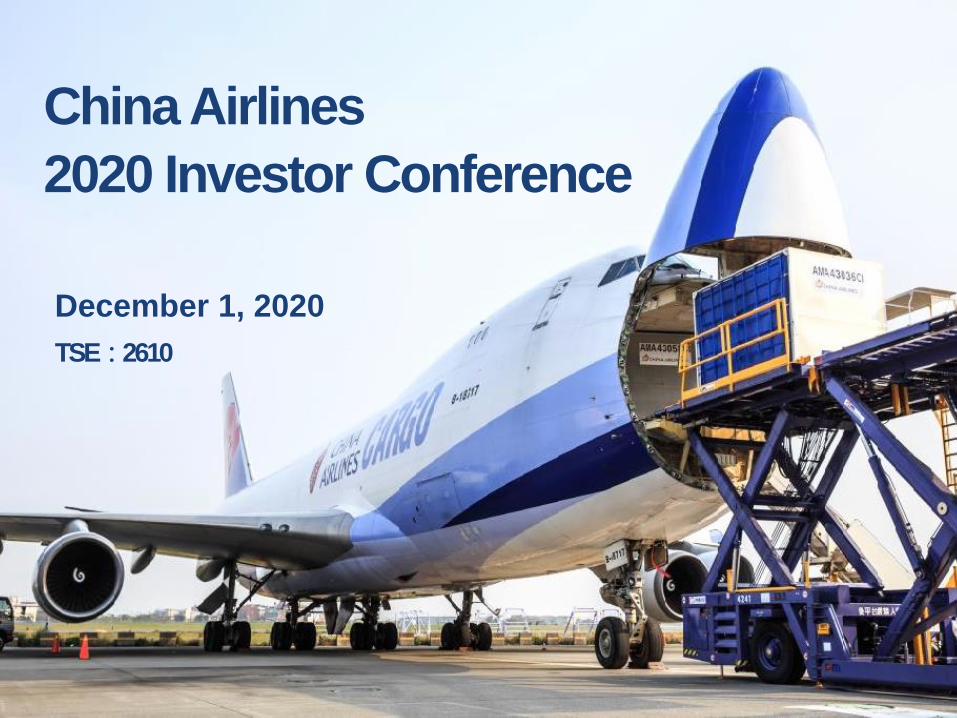
China Airlines
2020 Investor Conference
December 1, 2020
TSE:2610
2
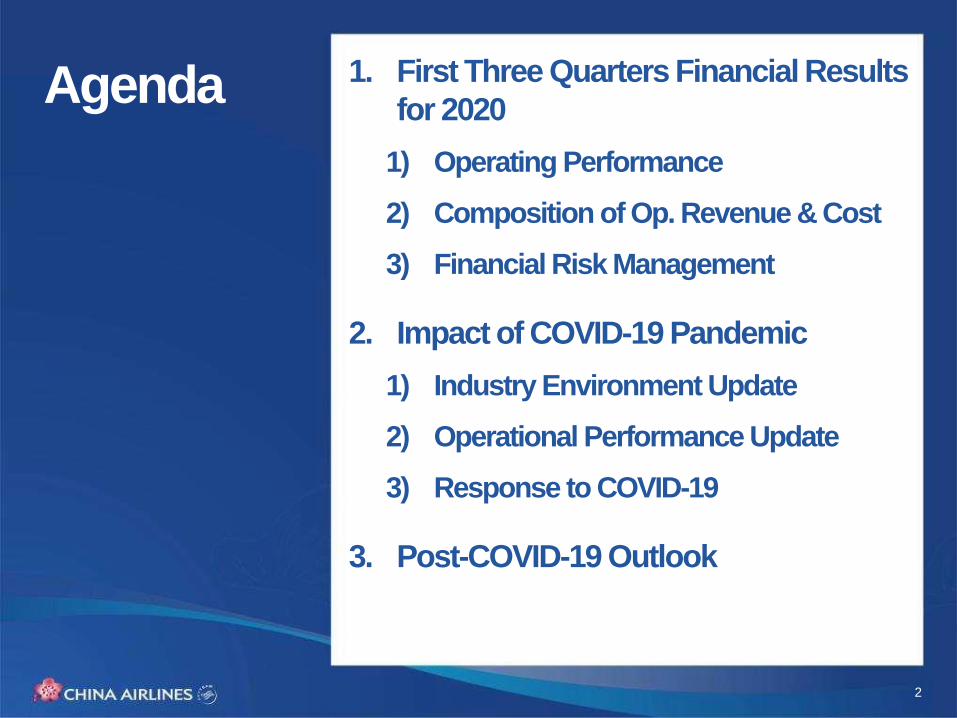
Agenda 1. First Three Quarters Financial Results
for 2020
1) Operating Performance
2) Composition of Op. Revenue & Cost
3) Financial Risk Management
2. Impact of COVID-19 Pandemic
1) Industry Environment Update
2) Operational Performance Update
3) Response to COVID-19
3. Post-COVID-19 Outlook
First Three Quarters Financial Results for
2020
3
4
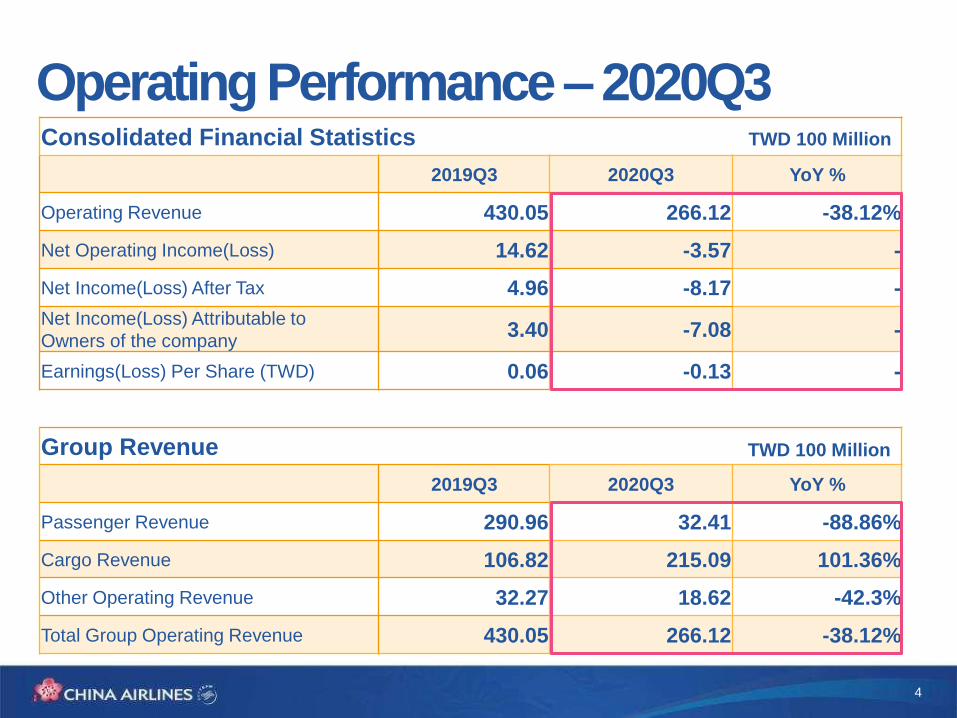
Consolidated Financial Statistics
2019Q3 2020Q3 YoY %
Operating Revenue 430.05 266.12 -38.12%
Net Operating Income(Loss) 14.62 -3.57 -
Net Income(Loss) After Tax 4.96 -8.17 -
Net Income(Loss) Attributable to
Owners of the company3.40 -7.08 -
Earnings(Loss) Per Share (TWD) 0.06 -0.13 -
Group Revenue
2019Q3 2020Q3 YoY %
Passenger Revenue 290.96 32.41 -88.86%
Cargo Revenue 106.82 215.09 101.36%
Other Operating Revenue 32.27 18.62 -42.3%
Total Group Operating Revenue 430.05 266.12 -38.12%
Operating Performance – 2020Q3TWD 100 Million
TWD 100 Million
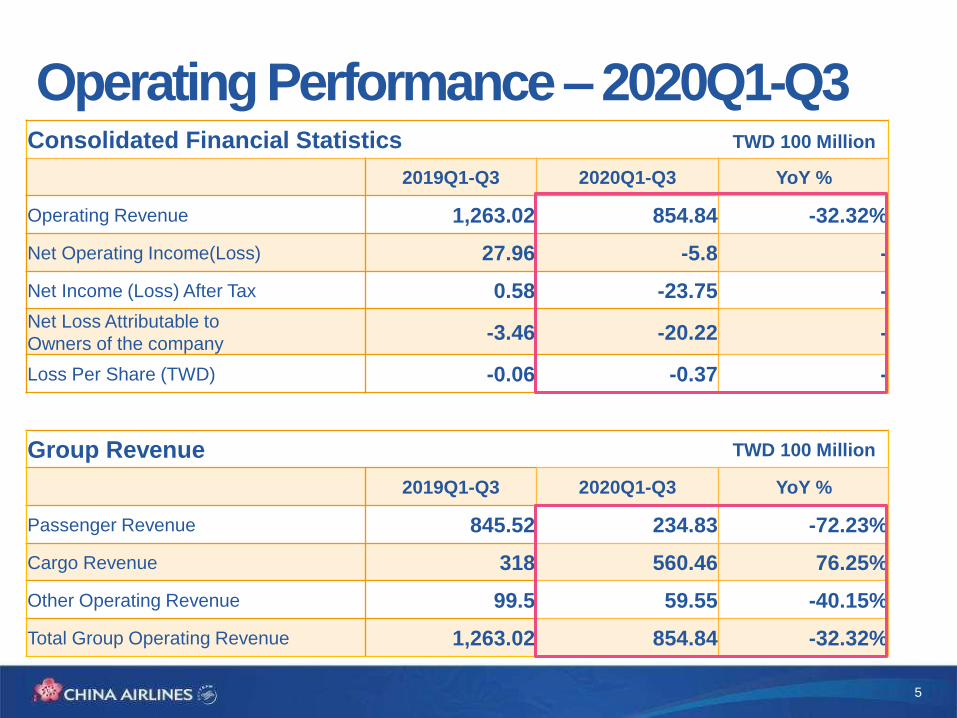
5
Consolidated Financial Statistics
2019Q1-Q3 2020Q1-Q3 YoY %
Operating Revenue 1,263.02 854.84 -32.32%
Net Operating Income(Loss) 27.96 -5.8 -
Net Income (Loss) After Tax 0.58 -23.75 -
Net Loss Attributable to
Owners of the company-3.46 -20.22 -
Loss Per Share (TWD) -0.06 -0.37 -
Group Revenue
2019Q1-Q3 2020Q1-Q3 YoY %
Passenger Revenue 845.52 234.83 -72.23%
Cargo Revenue 318 560.46 76.25%
Other Operating Revenue 99.5 59.55 -40.15%
Total Group Operating Revenue 1,263.02 854.84 -32.32%
Operating Performance – 2020Q1-Q3TWD 100 Million
TWD 100 Million
6
Passenger
Revenue
Passenger Revenue
Cargo Revenue
Cargo Revenue
Oth
er O
p. R
ev.
Oth
er O
p. R
ev.
2020Q1-Q3
2019Q1-Q3
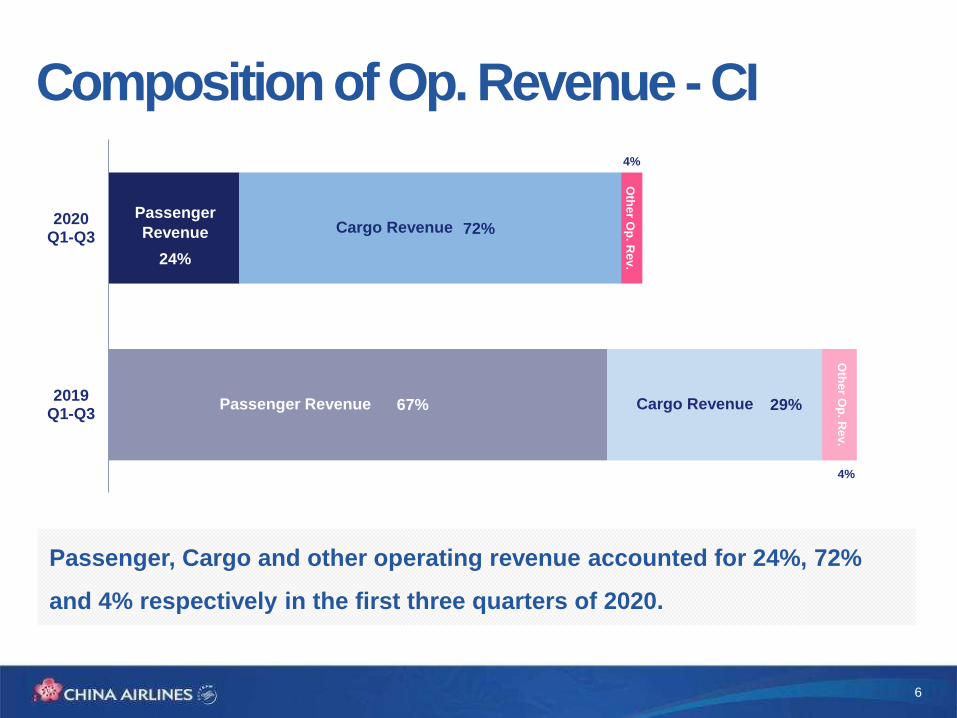
Composition of Op. Revenue - CI
Passenger, Cargo and other operating revenue accounted for 24%, 72%
and 4% respectively in the first three quarters of 2020.
24%
72%
4%
67% 29%
4%
7
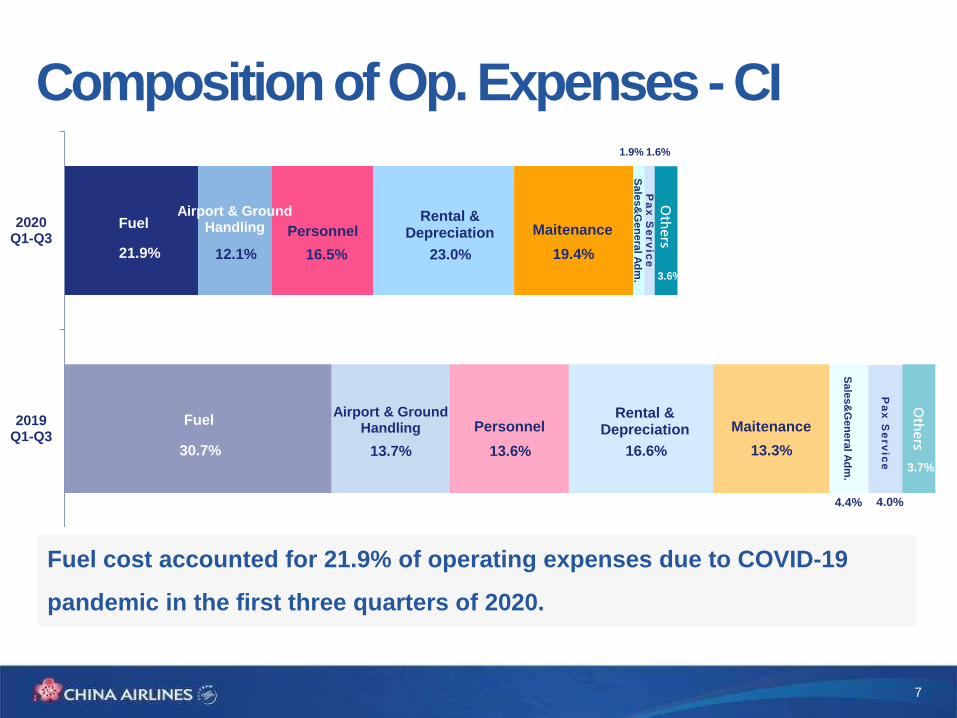
Fuel cost accounted for 21.9% of operating expenses due to COVID-19
pandemic in the first three quarters of 2020.
Composition of Op. Expenses - CI
Fuel
Fuel
Airport & Ground Handling
Airport & Ground Handling
Personnel
Personnel
Rental & Depreciation
Rental & Depreciation
Maitenance
Maitenance
Sale
s&
Gen
era
l Ad
m.
Sale
s&
Gen
era
l Ad
m.
Pa
x S
erv
ice
Pa
x S
erv
ice
Others
Others
2020Q1-Q3
2019Q1-Q3
21.9%
30.7%
12.1%
13.7%
16.5%
13.6% 16.6%
23.0% 19.4%
13.3%
4.4%
1.9% 1.6%
4.0%
3.5%
3.7%
3.6%
8
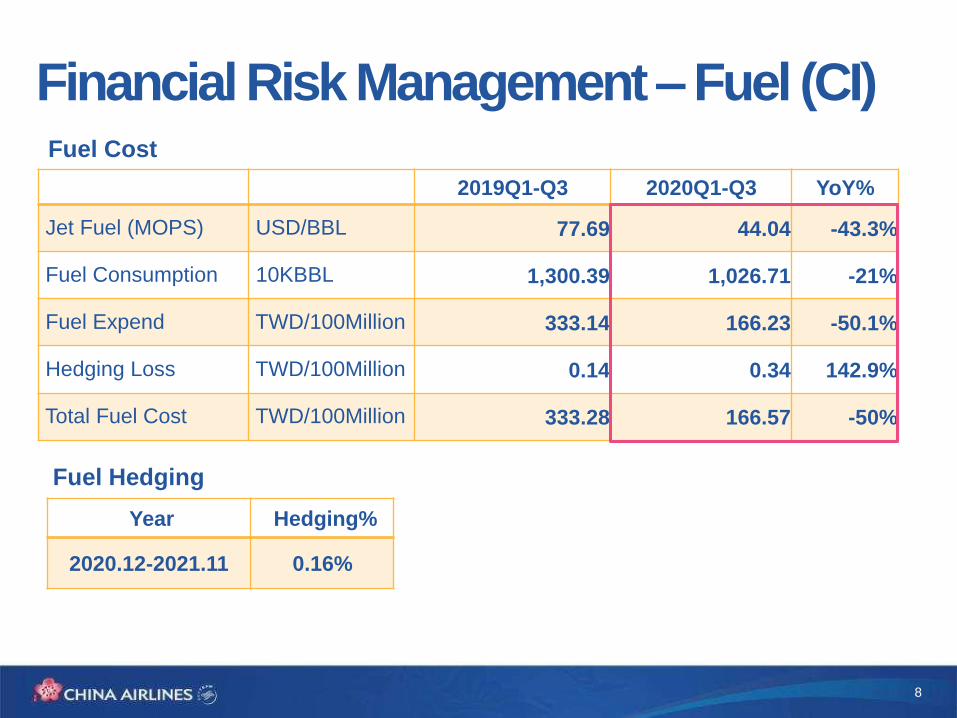
Financial Risk Management – Fuel (CI)
2019Q1-Q3 2020Q1-Q3 YoY%
Jet Fuel (MOPS) USD/BBL 77.69 44.04 -43.3%
Fuel Consumption 10KBBL 1,300.39 1,026.71 -21%
Fuel Expend TWD/100Million 333.14 166.23 -50.1%
Hedging Loss TWD/100Million 0.14 0.34 142.9%
Total Fuel Cost TWD/100Million 333.28 166.57 -50%
Fuel Cost
Fuel Hedging
Year Hedging%
2020.12-2021.11 0.16%
Impact of COVID-19 Pandemic
Industry Environment Update
9
10
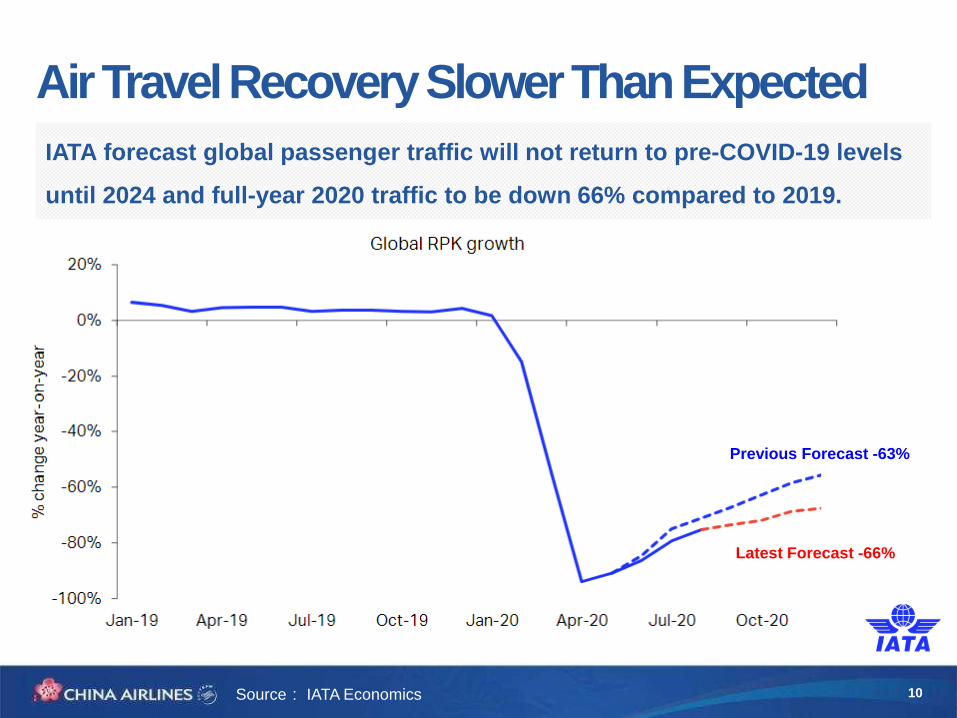
Air Travel Recovery Slower Than Expected
Source: IATA Economics
IATA forecast global passenger traffic will not return to pre-COVID-19 levels
until 2024 and full-year 2020 traffic to be down 66% compared to 2019.
Previous Forecast -63%
Latest Forecast -66%
11
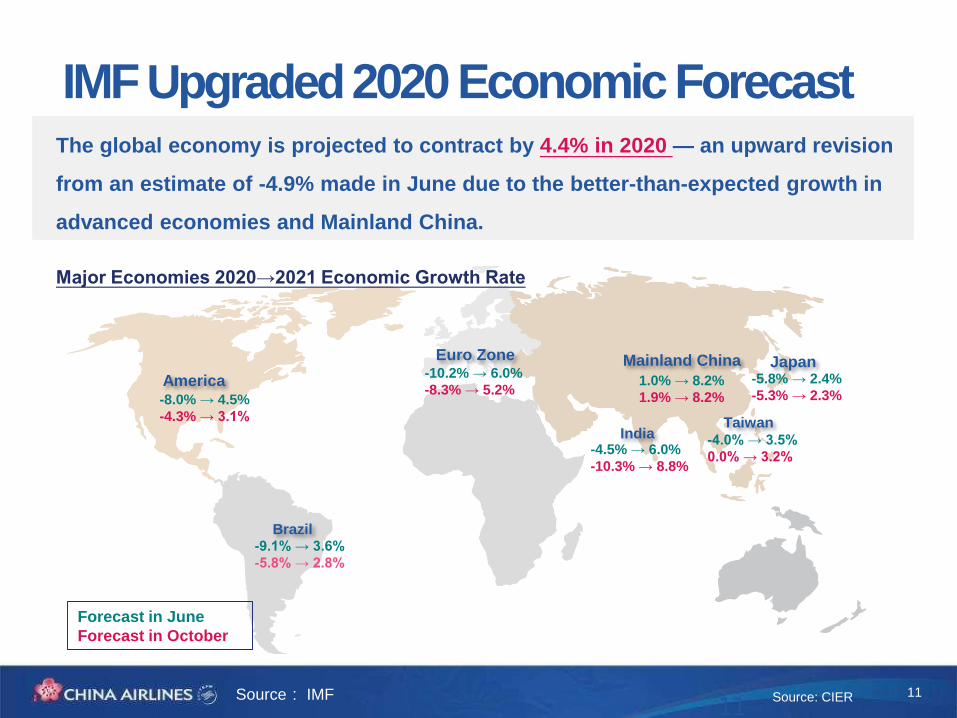
The global economy is projected to contract by 4.4% in 2020 — an upward revision
from an estimate of -4.9% made in June due to the better-than-expected growth in
advanced economies and Mainland China.
11
IMF Upgraded2020 Economic Forecast
Source: CIER
America
Brazil
Euro Zone Mainland China
India
Japan
Taiwan
-8.0% → 4.5%
-4.3% → 3.1%
-9.1% → 3.6%
-5.8% → 2.8%
-10.2% → 6.0%
-8.3% → 5.2%1.0% → 8.2%
1.9% → 8.2%
-5.8% → 2.4%
-5.3% → 2.3%
-4.0% → 3.5%
0.0% → 3.2%-4.5% → 6.0%
-10.3% → 8.8%
Forecast in June
Forecast in October
Major Economies 2020→2021 Economic Growth Rate
Source: IMF
12
Impact of COVID-19 Pandemic
Operational Performance Update
13
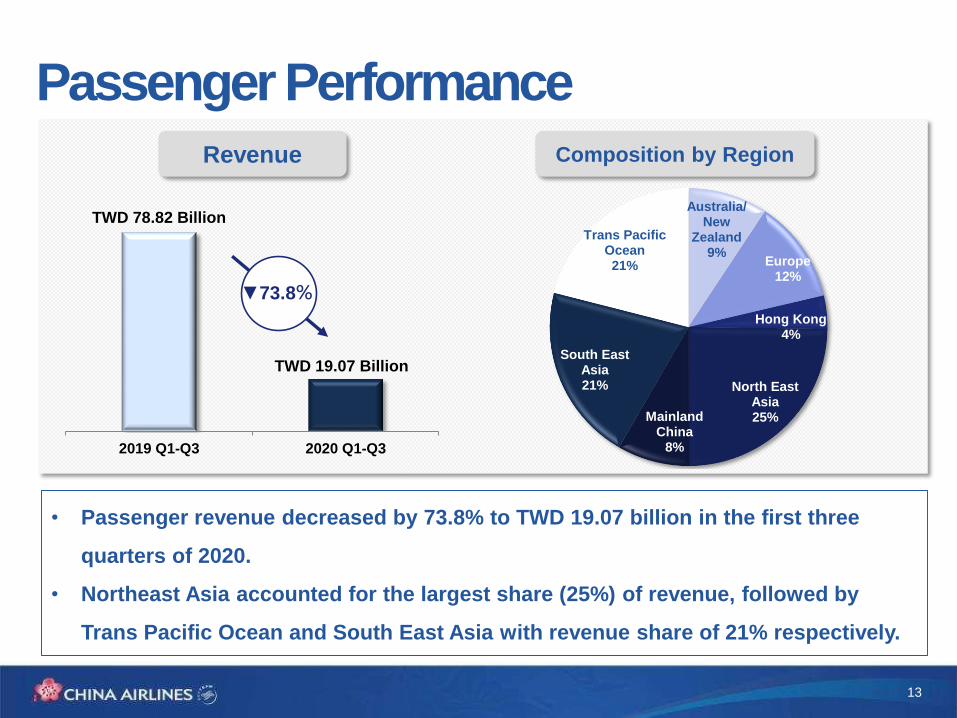
TWD 78.82 Billion
TWD 19.07 Billion
2019 Q1-Q3 2020 Q1-Q3
Revenue
▼73.8%
• Passenger revenue decreased by 73.8% to TWD 19.07 billion in the first three
quarters of 2020.
• Northeast Asia accounted for the largest share (25%) of revenue, followed by
Trans Pacific Ocean and South East Asia with revenue share of 21% respectively.
Australia/New
Zealand9%
Europe12%
Hong Kong4%
North East Asia25%Mainland
China8%
South East Asia21%
Trans Pacific Ocean21%
Passenger PerformanceComposition by Region
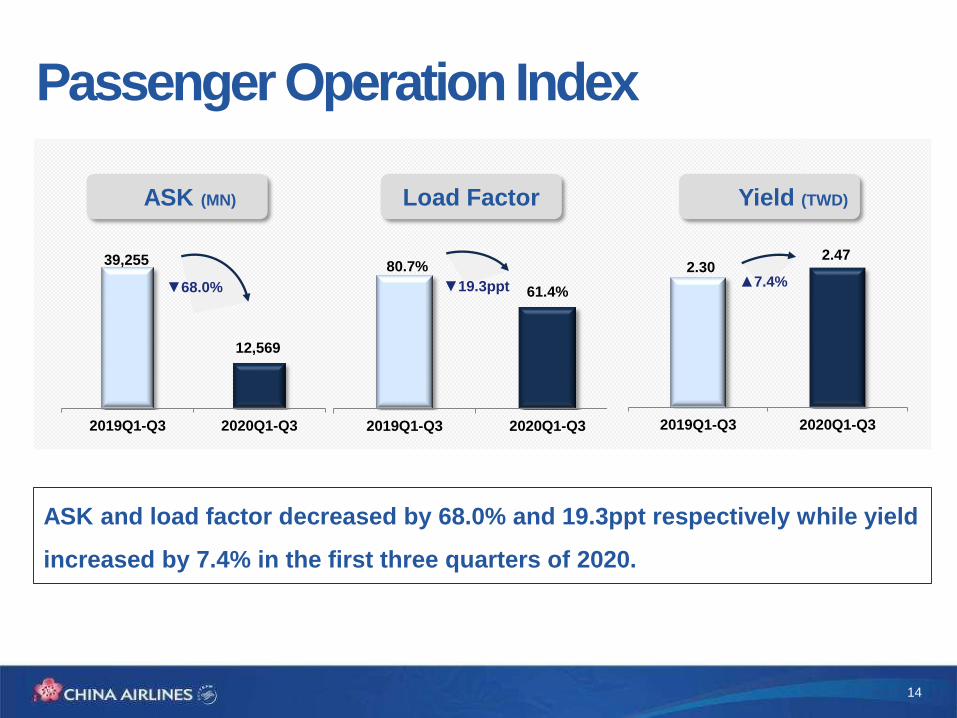
14
ASK and load factor decreased by 68.0% and 19.3ppt respectively while yield
increased by 7.4% in the first three quarters of 2020.
Passenger Operation Index
39,255
12,569
2019Q1-Q3 2020Q1-Q3
80.7%
61.4%
2019Q1-Q3 2020Q1-Q3
2.302.47
2019Q1-Q3 2020Q1-Q3
Load FactorASK (MN) Yield (TWD)
▲7.4%▼68.0% ▼19.3ppt
15
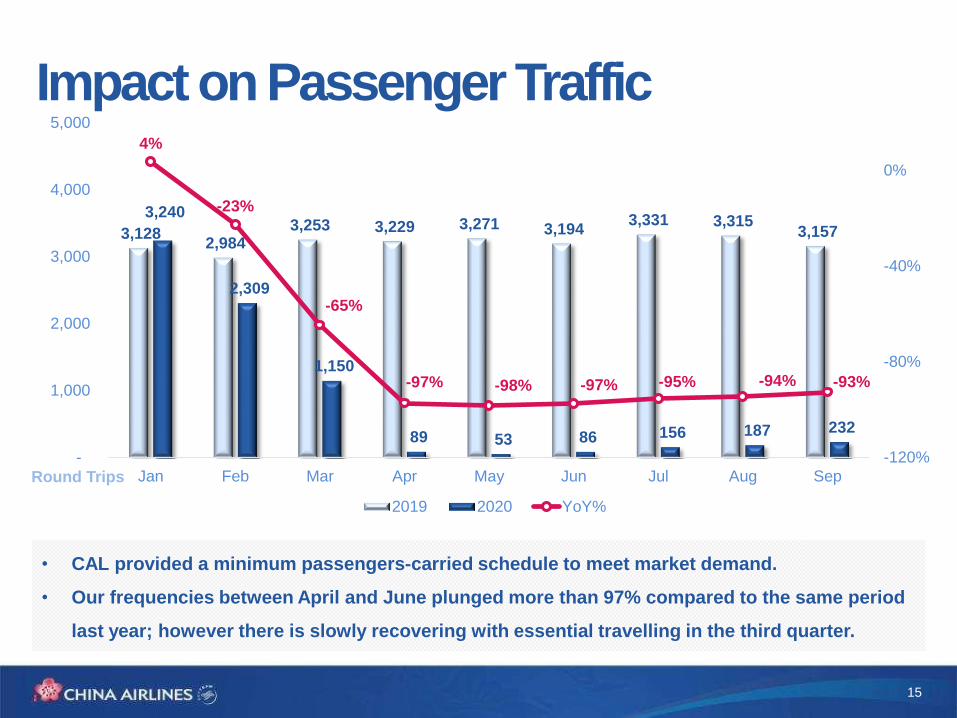
Impact on Passenger Traffic
• CAL provided a minimum passengers-carried schedule to meet market demand.
• Our frequencies between April and June plunged more than 97% compared to the same period
last year; however there is slowly recovering with essential travelling in the third quarter.
3,128 2,984
3,253 3,229 3,271 3,194 3,331 3,315
3,157
3,240
2,309
1,150
89 53 86 156 187 232
4%
-23%
-65%
-97% -98% -97% -95% -94% -93%
-120%
-80%
-40%
0%
-
1,000
2,000
3,000
4,000
5,000
Jan Feb Mar Apr May Jun Jul Aug SepRound Trips
2019 2020 YoY%
16
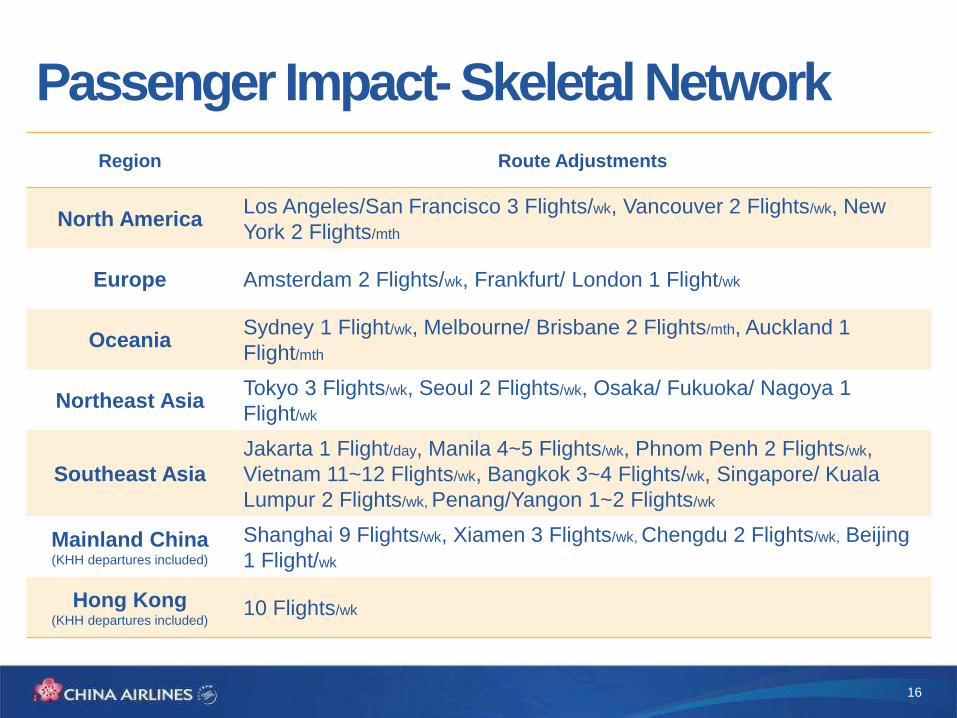
Passenger Impact- Skeletal Network
Region Route Adjustments
North AmericaLos Angeles/San Francisco 3 Flights/wk, Vancouver 2 Flights/wk, New
York 2 Flights/mth
Europe Amsterdam 2 Flights/wk, Frankfurt/ London 1 Flight/wk
OceaniaSydney 1 Flight/wk, Melbourne/ Brisbane 2 Flights/mth, Auckland 1
Flight/mth
Northeast AsiaTokyo 3 Flights/wk, Seoul 2 Flights/wk, Osaka/ Fukuoka/ Nagoya 1
Flight/wk
Southeast Asia
Jakarta 1 Flight/day, Manila 4~5 Flights/wk, Phnom Penh 2 Flights/wk,
Vietnam 11~12 Flights/wk, Bangkok 3~4 Flights/wk, Singapore/ Kuala
Lumpur 2 Flights/wk, Penang/Yangon 1~2 Flights/wk
Mainland China(KHH departures included)
Shanghai 9 Flights/wk, Xiamen 3 Flights/wk, Chengdu 2 Flights/wk, Beijing
1 Flight/wk
Hong Kong(KHH departures included)
10 Flights/wk
17
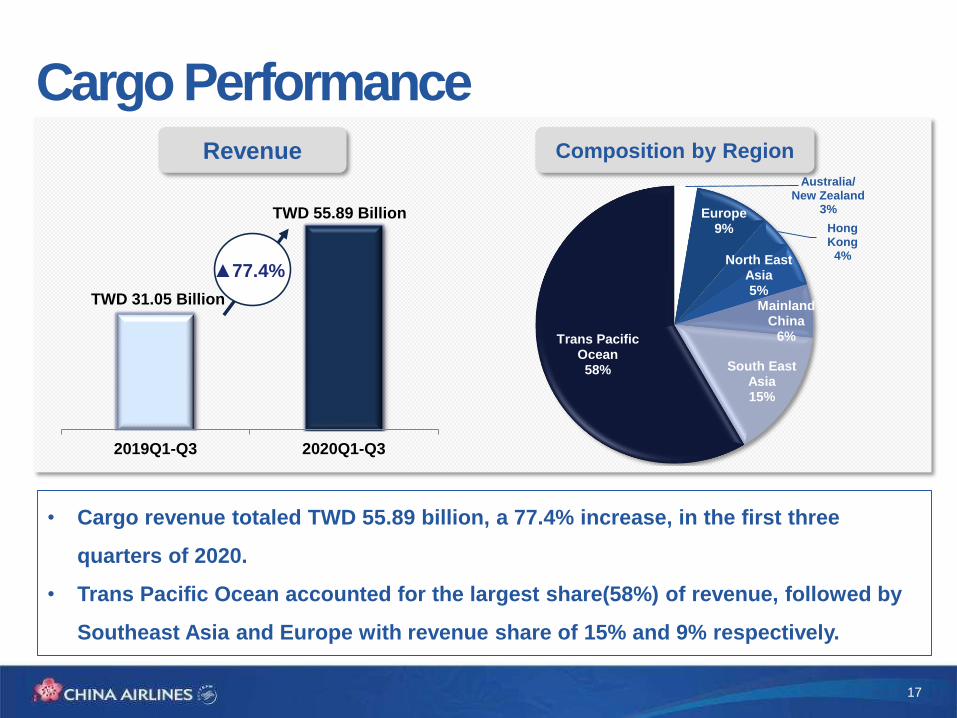
TWD 31.05 Billion
TWD 55.89 Billion
2019Q1-Q3 2020Q1-Q3
▲77.4%
• Cargo revenue totaled TWD 55.89 billion, a 77.4% increase, in the first three
quarters of 2020.
• Trans Pacific Ocean accounted for the largest share(58%) of revenue, followed by
Southeast Asia and Europe with revenue share of 15% and 9% respectively.
Cargo PerformanceRevenue Composition by Region
Australia/New Zealand
3%Europe9% Hong
Kong4%North East
Asia5%
Mainland China
6%
South East Asia15%
Trans Pacific Ocean58%
18
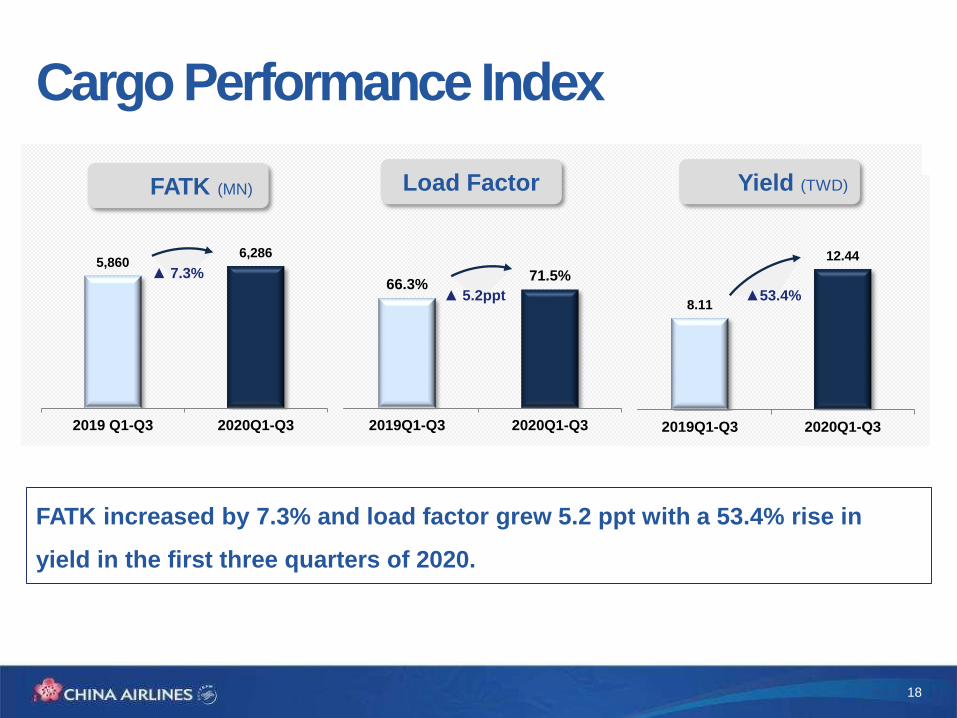
FATK increased by 7.3% and load factor grew 5.2 ppt with a 53.4% rise in
yield in the first three quarters of 2020.
Cargo Performance Index
8.11
12.44
2019Q1-Q3 2020Q1-Q3
66.3%71.5%
2019Q1-Q3 2020Q1-Q3
Load Factor
5,860 6,286
2019 Q1-Q3 2020Q1-Q3
▲53.4%
▲ 7.3%
▲ 5.2ppt
FATK (MN) Yield (TWD)
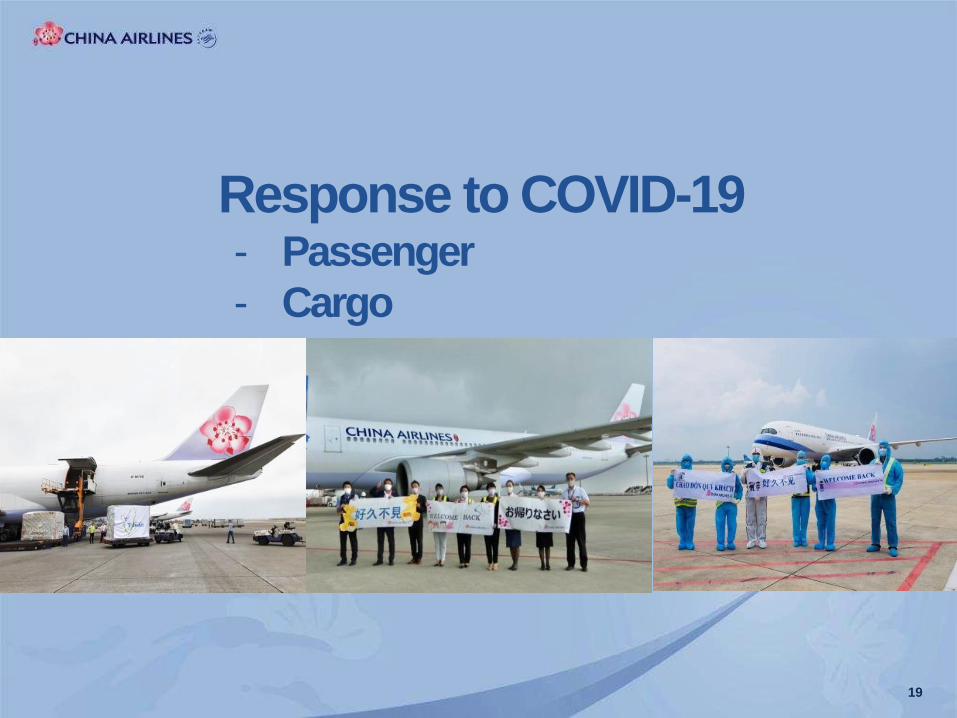
Response to COVID-19
19
- Passenger
- Cargo
20
Flight Schedule Adjusted in Line with Market DemandOperations remain active in adapting to the dynamic changes of the market landscape
and governments regulations.
Operate selected routes to maintain network connectivity, taking
advantage of sixth traffic rights.
Increase Taiwan domestic air travel market via CAL Group’s
subsidiaries .
Operate charter flights to generate revenue.
Gradually resume flights to align with boarder reopening, regional
business travel needs and travel bubble.
21
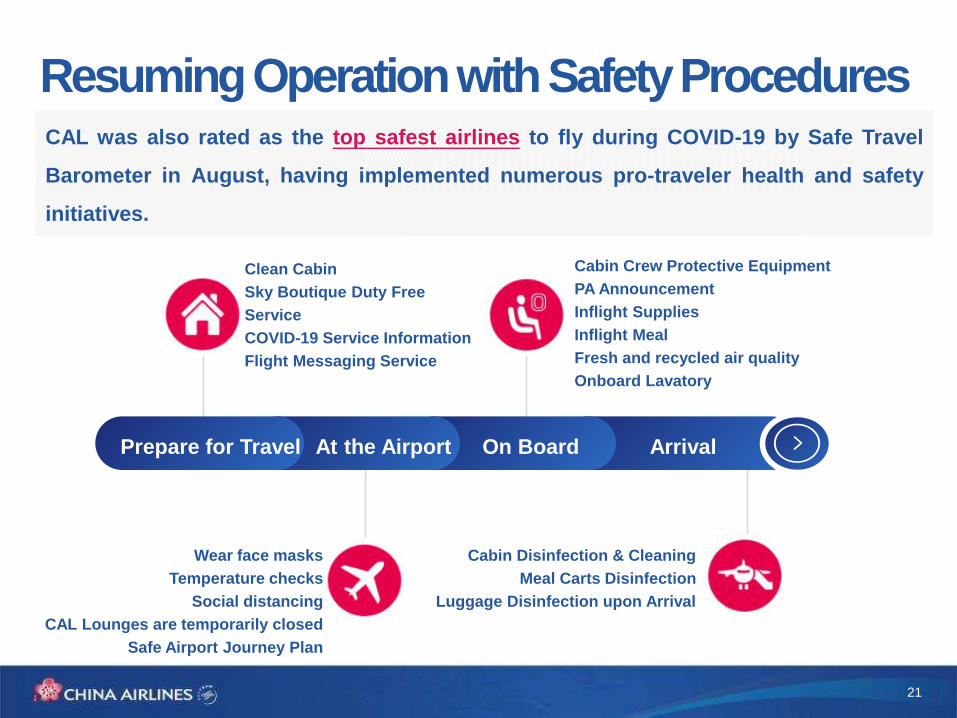
ArrivalOn BoardAt the AirportPrepare for Travel
Clean Cabin
Sky Boutique Duty Free
Service
COVID-19 Service Information
Flight Messaging Service
Cabin Crew Protective Equipment
PA Announcement
Inflight Supplies
Inflight Meal
Fresh and recycled air quality
Onboard Lavatory
Wear face masks
Temperature checks
Social distancing
CAL Lounges are temporarily closed
Safe Airport Journey Plan
Cabin Disinfection & Cleaning
Meal Carts Disinfection
Luggage Disinfection upon Arrival
Resuming Operation with Safety ProceduresCAL was also rated as the top safest airlines to fly during COVID-19 by Safe Travel
Barometer in August, having implemented numerous pro-traveler health and safety
initiatives.
22
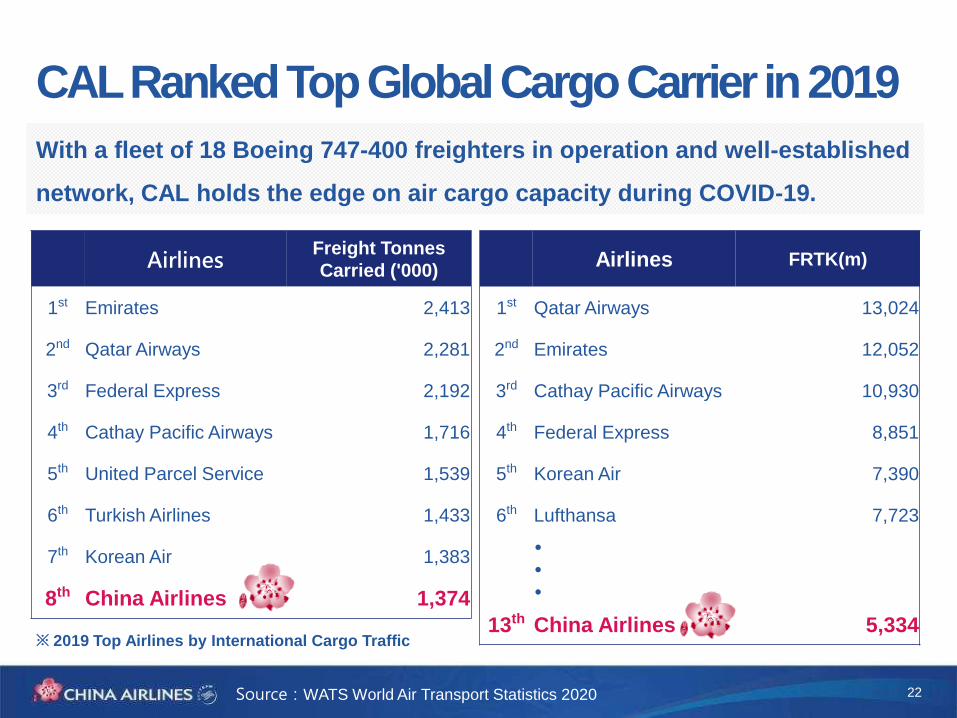
With a fleet of 18 Boeing 747-400 freighters in operation and well-established
network, CAL holds the edge on air cargo capacity during COVID-19.
AirlinesFreight Tonnes
Carried ('000)
1st Emirates 2,413
2nd Qatar Airways 2,281
3rd Federal Express 2,192
4th Cathay Pacific Airways 1,716
5th United Parcel Service 1,539
6th Turkish Airlines 1,433
7th Korean Air 1,383
8th China Airlines 1,374
Airlines FRTK(m)
1st Qatar Airways 13,024
2nd Emirates 12,052
3rd Cathay Pacific Airways 10,930
4th Federal Express 8,851
5th Korean Air 7,390
6th Lufthansa 7,723
13th China Airlines 5,334
Source:WATS World Air Transport Statistics 2020
CAL Ranked Top Global Cargo Carrier in 2019
※ 2019 Top Airlines by International Cargo Traffic

23
• Utilize CAL 18 747-400 freighters
• Make the most of belly capacity of passenger aircraft
• Improve operational efficiency with 3 upcoming 777F
deliveries
Expanding Cargo Service to Seize the window of
Opportunity CAL leverages Taiwan’s strategic position and cargo capacity to make 10% more cargo
flights per week.
• Monthly route review and flexible route
adjustment
• Priority for high-yield goods and
regular project shipment for route
profit boost
• Pursue charter or BSA business to
maintain load factor and revenue uplift34 destinations with 100 flights per week for
freighter service
Post-COVID-19 Outlook
24
25
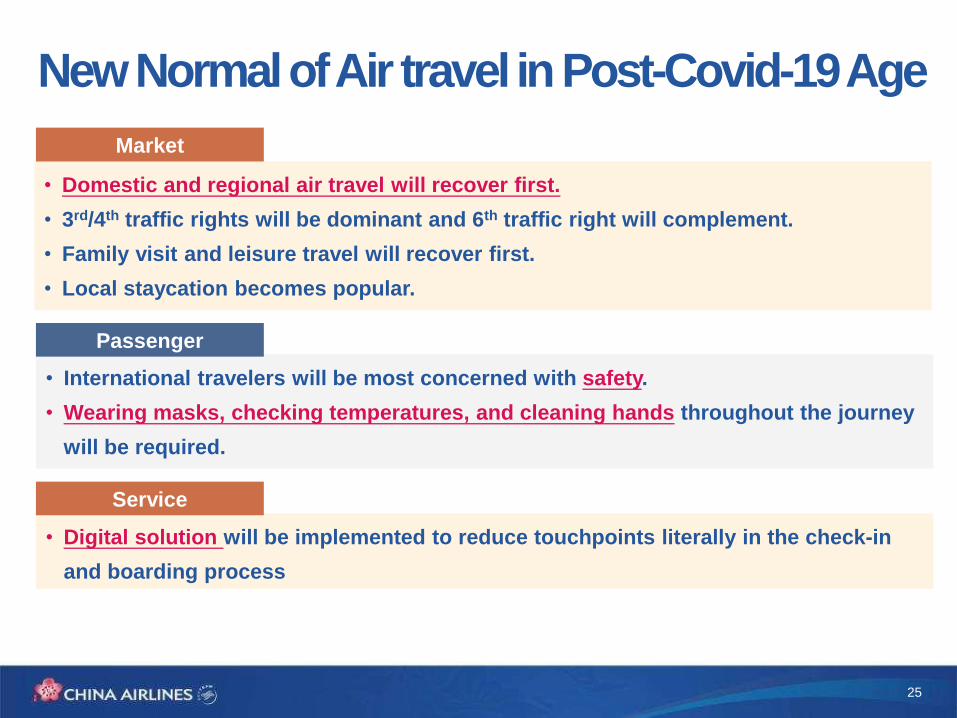
• International travelers will be most concerned with safety.
• Wearing masks, checking temperatures, and cleaning hands throughout the journey
will be required.
• Domestic and regional air travel will recover first.
• 3rd/4th traffic rights will be dominant and 6th traffic right will complement.
• Family visit and leisure travel will recover first.
• Local staycation becomes popular.
Passenger
New Normal of Air travel in Post-Covid-19 Age
Market
• Digital solution will be implemented to reduce touchpoints literally in the check-in
and boarding process
Service
26
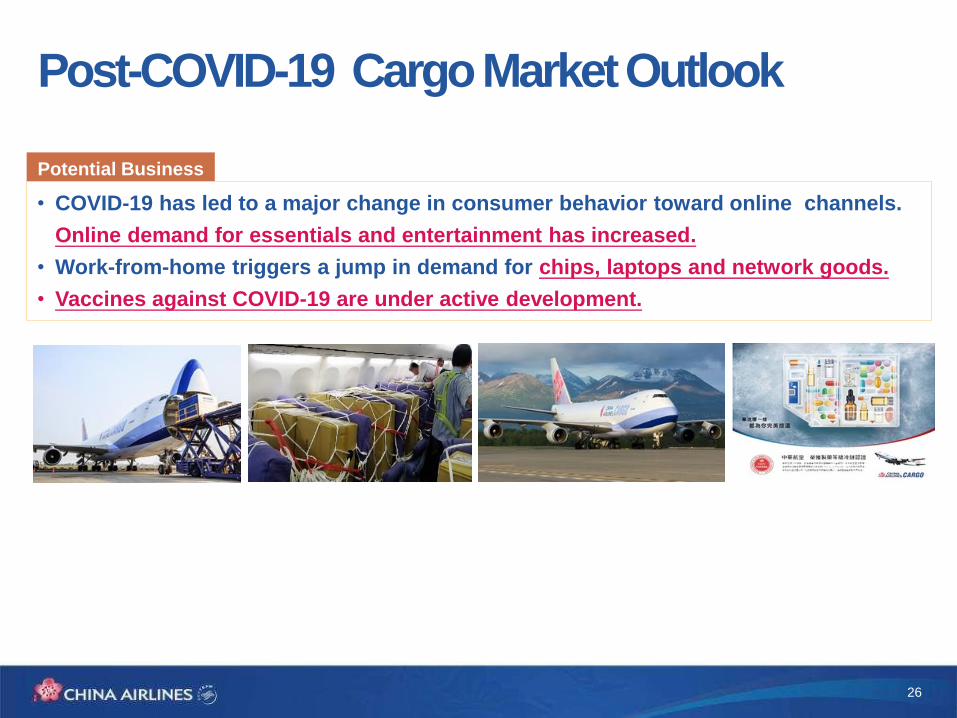
Post-COVID-19 Cargo Market Outlook
• COVID-19 has led to a major change in consumer behavior toward online channels.
Online demand for essentials and entertainment has increased.
• Work-from-home triggers a jump in demand for chips, laptops and network goods.
• Vaccines against COVID-19 are under active development.
Potential Business
27
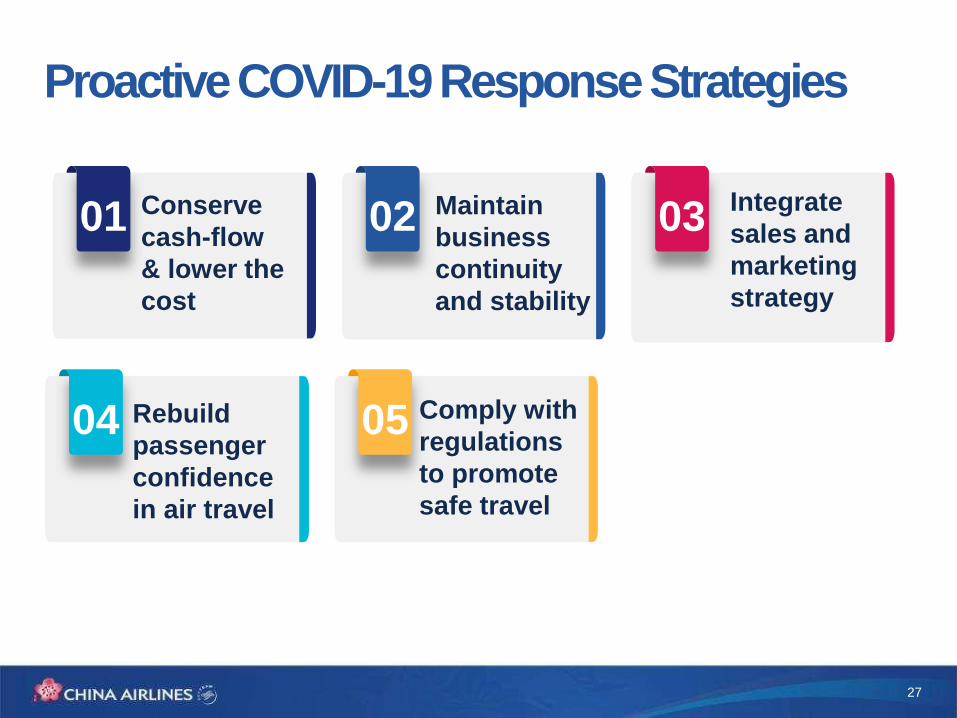
Proactive COVID-19 Response Strategies
04 Rebuild
passenger
confidence
in air travel
05 Comply with
regulations
to promote
safe travel
03Integrate
sales and
marketing
strategy
01 Conserve
cash-flow
& lower the
cost
02 Maintain
business
continuity
and stability

28
CAL wins awards for seventh consecutive year at the “Oscars” of Taiwan Corporate
Sustainability- Taiwan Corporate Sustainability Awards (TCSA) and two consecutive
year at Global Corporate Sustainability Awards (GCSA).
Giving Back to Society and Creating Social Value
2020.12
China Airlines│No.1, Hangzhan S. Rd., Dayuan Dist., Taoyuan City, Taiwan
TEL│03.399.8888
Thank you
# We fly We fight
# We will all be fine