Embed Size (px)
Citation preview
4-1
China
Ex-Post Evaluation of Japanese ODA Loan Project
Hainan Development Project (Yangpu Port)
External Evaluator: Kenichi Inazawa, Office Mikage LLC
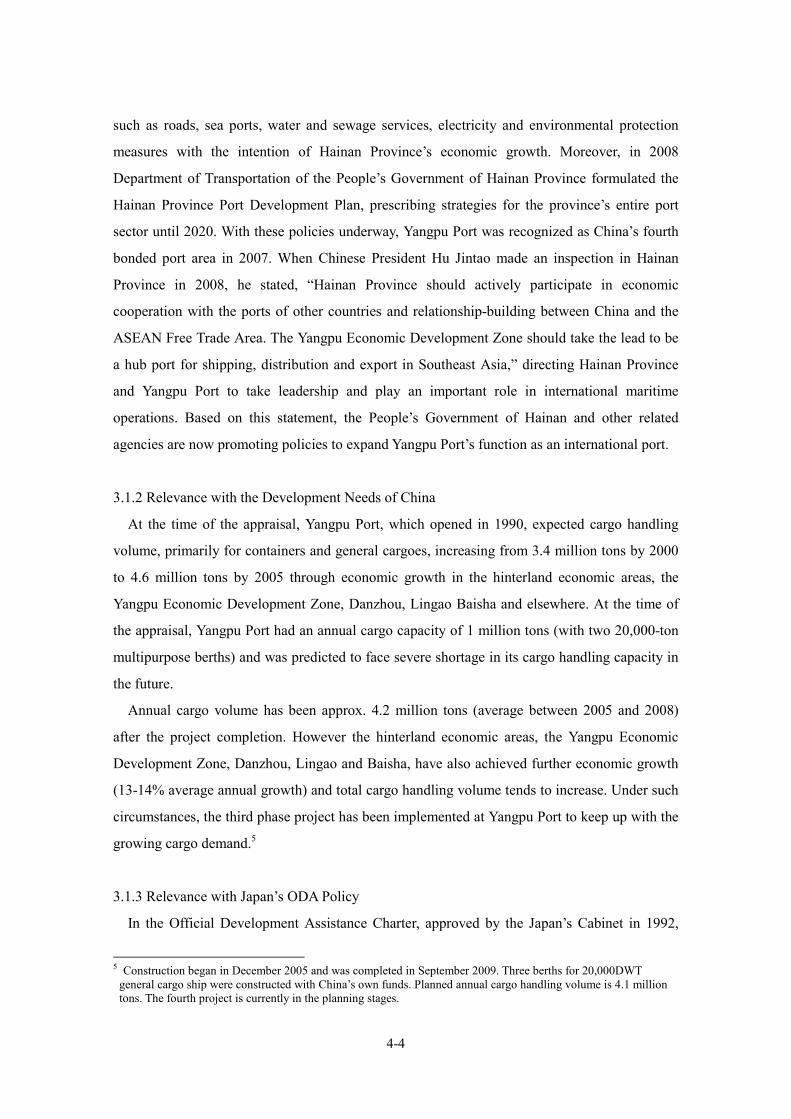
1. Project Description
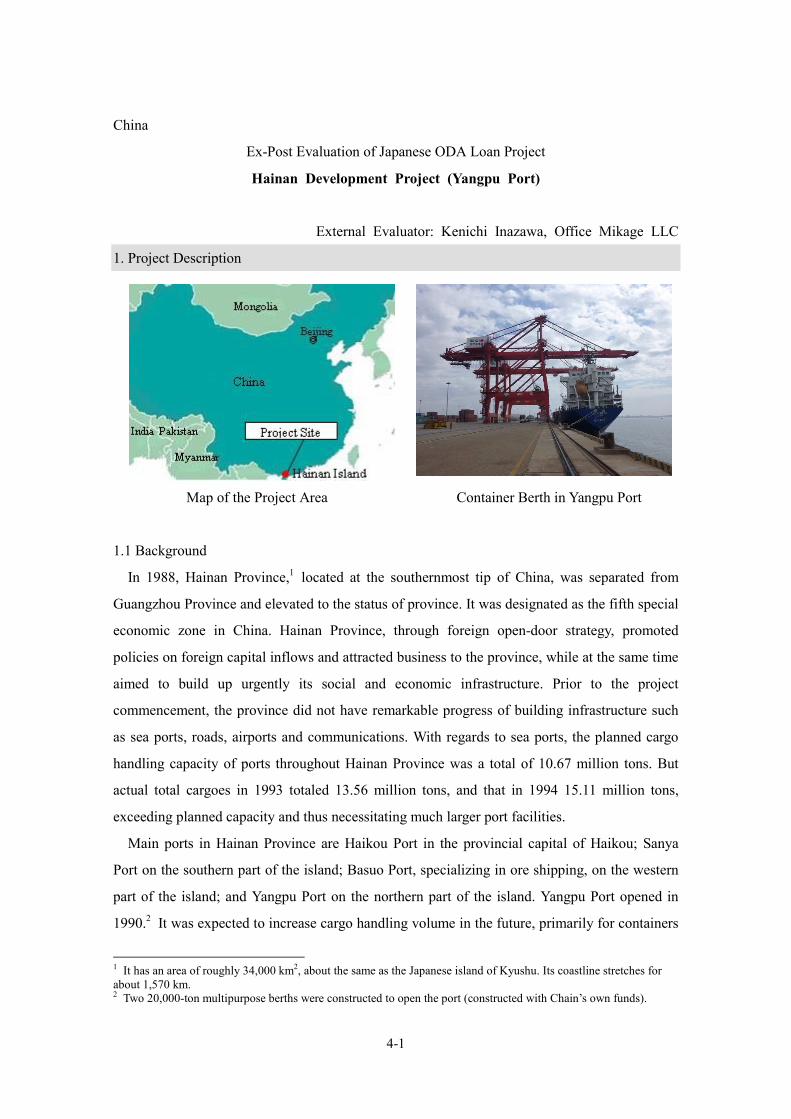
Map of the Project Area Container Berth in Yangpu Port
1.1 Background
In 1988, Hainan Province,1 located at the southernmost tip of China, was separated from
Guangzhou Province and elevated to the status of province. It was designated as the fifth special
economic zone in China. Hainan Province, through foreign open-door strategy, promoted
policies on foreign capital inflows and attracted business to the province, while at the same time
aimed to build up urgently its social and economic infrastructure. Prior to the project
commencement, the province did not have remarkable progress of building infrastructure such
as sea ports, roads, airports and communications. With regards to sea ports, the planned cargo
handling capacity of ports throughout Hainan Province was a total of 10.67 million tons. But
actual total cargoes in 1993 totaled 13.56 million tons, and that in 1994 15.11 million tons,
exceeding planned capacity and thus necessitating much larger port facilities.
Main ports in Hainan Province are Haikou Port in the provincial capital of Haikou; Sanya
Port on the southern part of the island; Basuo Port, specializing in ore shipping, on the western
part of the island; and Yangpu Port on the northern part of the island. Yangpu Port opened in
1990.2 It was expected to increase cargo handling volume in the future, primarily for containers
1 It has an area of roughly 34,000 km2, about the same as the Japanese island of Kyushu. Its coastline stretches for about 1,570 km. 2 Two 20,000-ton multipurpose berths were constructed to open the port (constructed with Chain’s own funds).
4-2
and general cargoes, in accordance with the economic development of the Yangpu Economic
Development Zone3 and the Danzhou Economic Zone (Danzhou, Lingao and Baisha) further
inland. In order to respond to increased demand of cargo volume at Yangpu Port, new berths and
other construction were required to expand the port facilities quickly.
1.2 Project Outline
The objective of this project is to expand the cargo-handling capacity in Yangpu port, which
the hinterland is Dangzhou Economic Zone, located on the north-west part of Hainan Province,
by constructing one multi-purpose berth (for 20,000DWT general cargo ship) and two general
cargo berths (for 20,000DWT general cargo ship) and developing port facilities; thereby
contributing to promote the economic development in Hainan Province.
Approved Amount/ Disbursed Amount 4,300 million yen / 3,372 million yen
Exchange of Notes Date/ Loan Agreement Signing Date October 1995 / November 1995
Terms and Conditions Interest Rate: 2.3%
Repayment Period: 30 years (Grace Period: 10 years)
Conditions for Procurement: General untied
Borrower / Executing Agency(ies) Government of the People’s Republic of China / People’s Government of Hainan Province
(Project Implementation Unit: State Development Investment Company Yangpu Port (SDIC Yangpu Port))
Final Disbursement Date December 2002 Main Contractor (Over 1 billion yen) N/A
Main Consultant (Over 100 million yen) N/A
Feasibility Studies, etc. F/S prepared by China Ministry of Transport, Second Harbor Consultants Co., Ltd. (1991)
F/S approved by the National Plan Committee (1994)
Related Projects (if any) Study for Comprehensive Development Plan of Hainan Island
conducted by JICA (1988)
2. Outline of Evaluation Study
2.1 External Evaluator
3 Approved as a National Development Zone in 1992 by the State Council. It has an area of roughly 30 km2 and is an economic development zone centered around the port.
4-3
Kenichi Inazawa, Evaluation Consultant, Office Mikage LLC
2.2 Duration of Evaluation Study
Duration of the Study: September 14, 2009 – July 12, 2010
Duration of the Field Study: December 7-19, 2009 (1st study)
March 8-13, 2010 (2nd study)
2.3 Constraints during the Evaluation Study
N/A
3. Results of the Evaluation (Overall Rating: A)
3.1 Relevance (Rating: a) 3.1.1 Relevance with the Development Plan of China
At the time of the appraisal, the Chinese government’s Eighth Five-Year Plan (1991-95)
aimed to promote the construction of berths and increase cargo handling volume in order to
respond to increasing demand of cargo volume at Chinese ports as the economy grew. This
project was incorporated into this Five-Year Plan with construction of other major Chinese ports.
In addition, in 1988, prior to this Five-Year Plan, JICA formulated “Comprehensive
Development Plan of Hainan Island” as a plan to advance the island’s industrialization and
urbanization by infrastructure development such as upgrading maritime transport and improving
cargo handling efficiency at port facilities.4 Moreover, Hainan, which elevated to a province in
1988, formulated the Strategic Development Plan for Transportation. It set building
infrastructure including sea ports, roads, airports, communications and etc as a priority issue and
aimed for economic growth through promoting direct investment as well as foreign capital
inflows. In particular, development of port facilities was recognized as important infrastructure
which could lead the island’s economic growth together with development of highway
networks.
At the time of the ex-post evaluation, the Chinese government also aims to promote coastal
port development and improve cargo handling capacity in the Eleventh Five-Year Plan
(2006-10), the national development plan. The Eleventh Five-Year Plan for Hainan Province
National Economic and Social Development Outline, established at the Third Meeting of the
Hainan Province People’s Committee in 2006, also includes important infrastructure projects
4 This project was described in the development plan.
4-4
such as roads, sea ports, water and sewage services, electricity and environmental protection
measures with the intention of Hainan Province’s economic growth. Moreover, in 2008
Department of Transportation of the People’s Government of Hainan Province formulated the
Hainan Province Port Development Plan, prescribing strategies for the province’s entire port
sector until 2020. With these policies underway, Yangpu Port was recognized as China’s fourth
bonded port area in 2007. When Chinese President Hu Jintao made an inspection in Hainan
Province in 2008, he stated, “Hainan Province should actively participate in economic
cooperation with the ports of other countries and relationship-building between China and the
ASEAN Free Trade Area. The Yangpu Economic Development Zone should take the lead to be
a hub port for shipping, distribution and export in Southeast Asia,” directing Hainan Province
and Yangpu Port to take leadership and play an important role in international maritime
operations. Based on this statement, the People’s Government of Hainan and other related
agencies are now promoting policies to expand Yangpu Port’s function as an international port.
3.1.2 Relevance with the Development Needs of China
At the time of the appraisal, Yangpu Port, which opened in 1990, expected cargo handling
volume, primarily for containers and general cargoes, increasing from 3.4 million tons by 2000
to 4.6 million tons by 2005 through economic growth in the hinterland economic areas, the
Yangpu Economic Development Zone, Danzhou, Lingao Baisha and elsewhere. At the time of
the appraisal, Yangpu Port had an annual cargo capacity of 1 million tons (with two 20,000-ton
multipurpose berths) and was predicted to face severe shortage in its cargo handling capacity in
the future.
Annual cargo volume has been approx. 4.2 million tons (average between 2005 and 2008)
after the project completion. However the hinterland economic areas, the Yangpu Economic
Development Zone, Danzhou, Lingao and Baisha, have also achieved further economic growth
(13-14% average annual growth) and total cargo handling volume tends to increase. Under such
circumstances, the third phase project has been implemented at Yangpu Port to keep up with the
growing cargo demand.5
3.1.3 Relevance with Japan’s ODA Policy
In the Official Development Assistance Charter, approved by the Japan’s Cabinet in 1992,
5 Construction began in December 2005 and was completed in September 2009. Three berths for 20,000DWT
general cargo ship were constructed with China’s own funds. Planned annual cargo handling volume is 4.1 million tons. The fourth project is currently in the planning stages.
4-5
trade and investment, which have a significant impact on the Japan’s ODA and growth of the
developing countries, could have been promoted with meaningful coordination links and were
deemed as one of the important issues, in order to promote the growth of developing countries.
In particular the Asian region, which has a close relationship with Japan and has a great impact
on Japan’s security and prosperity, was recognized as an essential area. Since this project aims
to promote trade and investment in the region, by taking full consideration of strengthening
economic links with the region, it is considered relevant to Japan’s foreign aid policy.
This project has been highly relevant with the China’s development plan, development needs,
as well as Japan’s ODA policy, therefore its relevance is high.
3.2 Efficiency (Rating: b)
3.2.1 Project Outputs
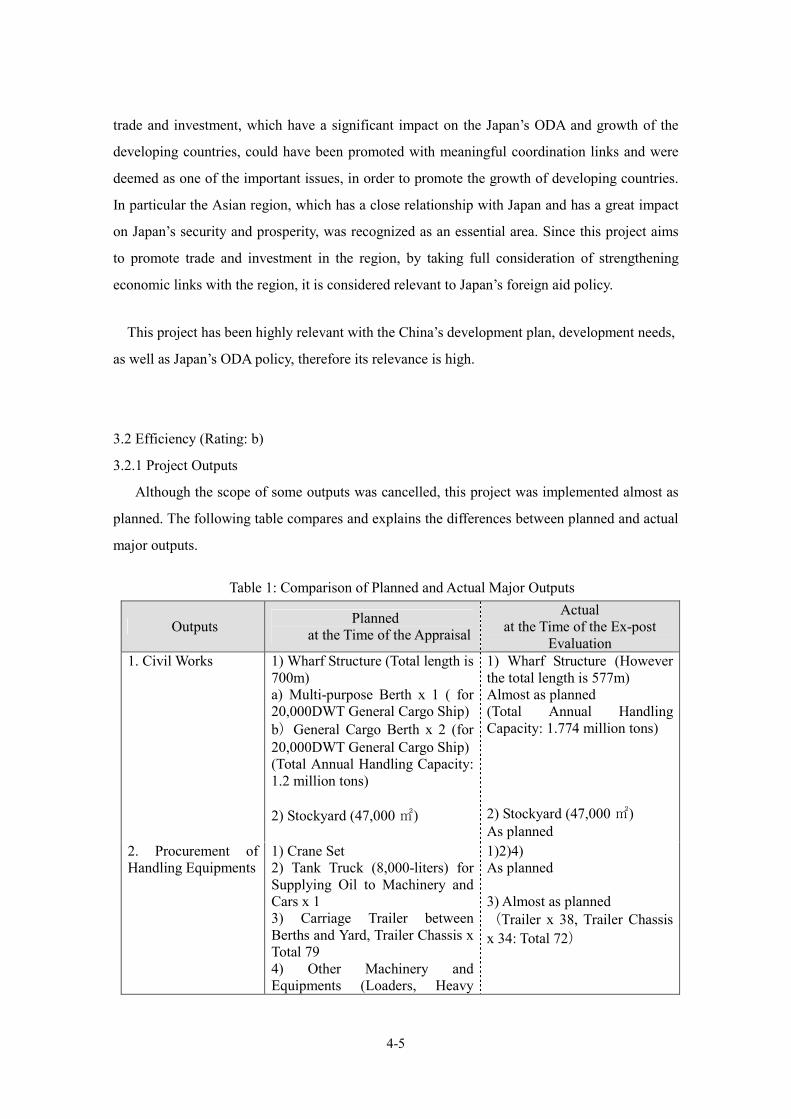
Although the scope of some outputs was cancelled, this project was implemented almost as
planned. The following table compares and explains the differences between planned and actual
major outputs.
Table 1: Comparison of Planned and Actual Major Outputs
Outputs Planned at the Time of the Appraisal
Actual at the Time of the Ex-post
Evaluation 1. Civil Works 1) Wharf Structure (Total length is
700m) a) Multi-purpose Berth x 1 ( for 20,000DWT General Cargo Ship) b)General Cargo Berth x 2 (for 20,000DWT General Cargo Ship) (Total Annual Handling Capacity: 1.2 million tons) 2) Stockyard (47,000 ㎡)
1) Wharf Structure (However the total length is 577m) Almost as planned (Total Annual Handling Capacity: 1.774 million tons) 2) Stockyard (47,000 ㎡) As planned
2. Procurement of Handling Equipments
1) Crane Set 2) Tank Truck (8,000-liters) for Supplying Oil to Machinery and Cars x 1 3) Carriage Trailer between Berths and Yard, Trailer Chassis x Total 79 4) Other Machinery and Equipments (Loaders, Heavy
1)2)4) As planned 3) Almost as planned (Trailer x 38, Trailer Chassis x 34: Total 72)
4-6
Machinery, Forklifts, etc.)
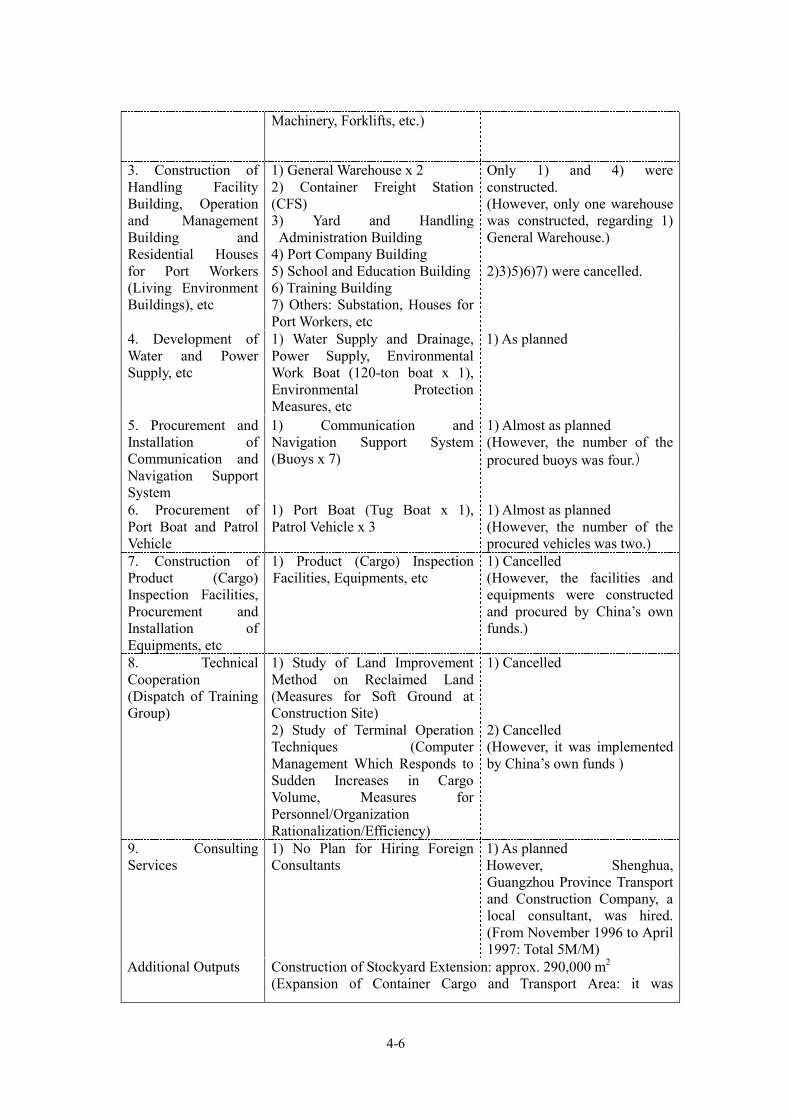
3. Construction of Handling Facility Building, Operation and Management Building and Residential Houses for Port Workers (Living Environment Buildings), etc
1) General Warehouse x 2 2) Container Freight Station (CFS) 3) Yard and Handling
Administration Building 4) Port Company Building 5) School and Education Building 6) Training Building 7) Others: Substation, Houses for Port Workers, etc
Only 1) and 4) were constructed. (However, only one warehouse was constructed, regarding 1) General Warehouse.) 2)3)5)6)7) were cancelled.
4. Development of Water and Power Supply, etc
1) Water Supply and Drainage, Power Supply, Environmental Work Boat (120-ton boat x 1), Environmental Protection Measures, etc
1) As planned
5. Procurement and Installation of Communication and Navigation Support System
1) Communication and Navigation Support System (Buoys x 7)
1) Almost as planned (However, the number of the procured buoys was four.)
6. Procurement of Port Boat and Patrol Vehicle
1) Port Boat (Tug Boat x 1), Patrol Vehicle x 3
1) Almost as planned (However, the number of the procured vehicles was two.)
7. Construction of Product (Cargo) Inspection Facilities, Procurement and Installation of Equipments, etc
1) Product (Cargo) Inspection Facilities, Equipments, etc
1) Cancelled (However, the facilities and equipments were constructed and procured by China’s own funds.)
8. Technical Cooperation (Dispatch of Training Group)
1) Study of Land Improvement Method on Reclaimed Land (Measures for Soft Ground at Construction Site) 2) Study of Terminal Operation Techniques (Computer Management Which Responds to Sudden Increases in Cargo Volume, Measures for Personnel/Organization Rationalization/Efficiency)
1) Cancelled 2) Cancelled (However, it was implemented by China’s own funds )
9. Consulting Services
1) No Plan for Hiring Foreign Consultants
1) As planned However, Shenghua, Guangzhou Province Transport and Construction Company, a local consultant, was hired. (From November 1996 to April 1997: Total 5M/M)
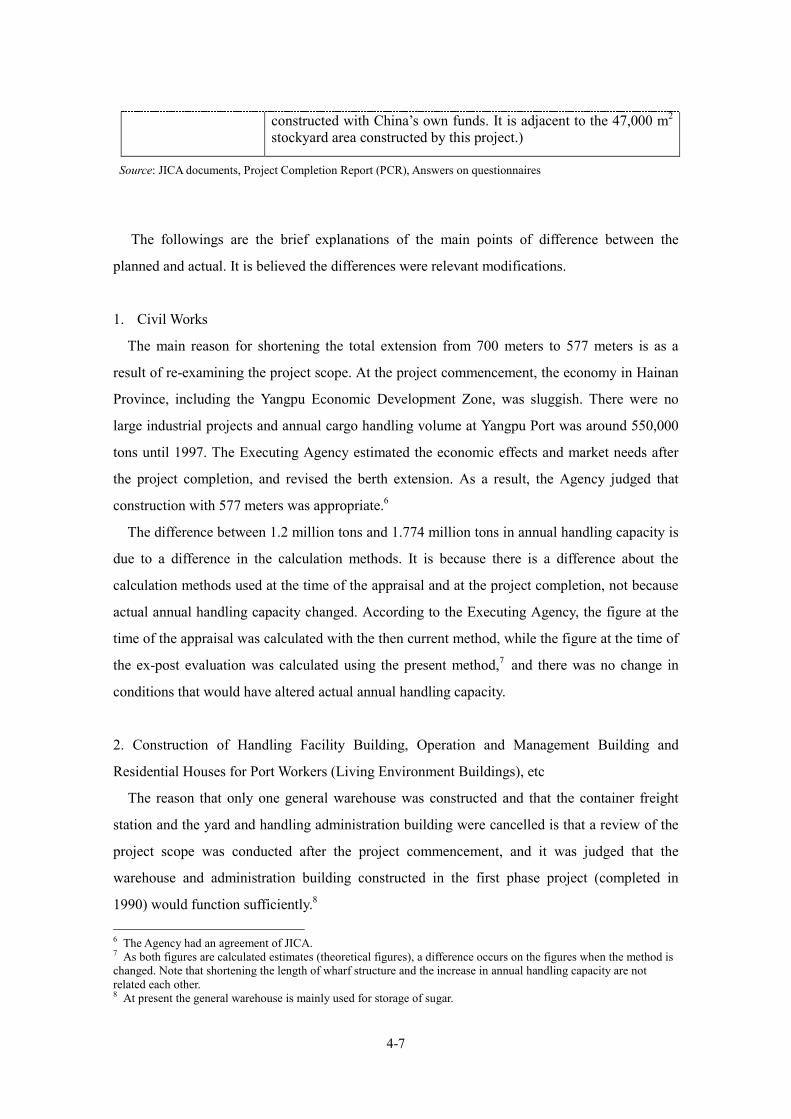
Additional Outputs
Construction of Stockyard Extension: approx. 290,000 m2 (Expansion of Container Cargo and Transport Area: it was
4-7
constructed with China’s own funds. It is adjacent to the 47,000 m2 stockyard area constructed by this project.)
Source: JICA documents, Project Completion Report (PCR), Answers on questionnaires
The followings are the brief explanations of the main points of difference between the
planned and actual. It is believed the differences were relevant modifications.
1. Civil Works
The main reason for shortening the total extension from 700 meters to 577 meters is as a
result of re-examining the project scope. At the project commencement, the economy in Hainan
Province, including the Yangpu Economic Development Zone, was sluggish. There were no
large industrial projects and annual cargo handling volume at Yangpu Port was around 550,000
tons until 1997. The Executing Agency estimated the economic effects and market needs after
the project completion, and revised the berth extension. As a result, the Agency judged that
construction with 577 meters was appropriate.6
The difference between 1.2 million tons and 1.774 million tons in annual handling capacity is
due to a difference in the calculation methods. It is because there is a difference about the
calculation methods used at the time of the appraisal and at the project completion, not because
actual annual handling capacity changed. According to the Executing Agency, the figure at the
time of the appraisal was calculated with the then current method, while the figure at the time of
the ex-post evaluation was calculated using the present method,7 and there was no change in
conditions that would have altered actual annual handling capacity.
2. Construction of Handling Facility Building, Operation and Management Building and
Residential Houses for Port Workers (Living Environment Buildings), etc
The reason that only one general warehouse was constructed and that the container freight
station and the yard and handling administration building were cancelled is that a review of the
project scope was conducted after the project commencement, and it was judged that the
warehouse and administration building constructed in the first phase project (completed in
1990) would function sufficiently.8 6 The Agency had an agreement of JICA. 7 As both figures are calculated estimates (theoretical figures), a difference occurs on the figures when the method is changed. Note that shortening the length of wharf structure and the increase in annual handling capacity are not related each other. 8 At present the general warehouse is mainly used for storage of sugar.
4-8
The reason for cancelling the construction of school and education building, the training
building and other related facilities, such as the substation and houses for port workers, is that as
China was transitioning to a market economy, the necessity of the employee welfare program in
place prior to the project commencement was re-examined. As a result, it was cancelled.
3. Procurement and Installation of Communication and Navigation Support System
The reason for decreasing the number of procured buoys is that the Executing Agency
re-examined the quality and amount of equipment and machinery at Yangpu Port at the
procurement phase. As a result, it was judged that four would be sufficient.
4. Procurement of Port Boat and Patrol Vehicle
The reason for the reduction is as above in 3. The Executing Agency re-examined the quality
and amount of equipment and machinery at Yangpu Port at the procurement phase. As a result, it
was judged that two would be sufficient.
5. Construction of Product (Cargo) Inspection Facilities9, Procurement and Installation of
Equipments, etc
Under the order of China’s State Council, the Department of Inspection and Quarantine
Clearance undertook this work and it was cancelled as part of this project.
6. Technical Cooperation (Dispatch of Training Group)
According to the Executing Agency, the reason for cancelling the Study of Land
Improvement on Reclaimed Land is that necessary measures such as training conducted with
China’s own funds were taken, after the project commencement, therefore it was not
implemented. On the other hand, the reason for cancelling the Study of Terminal Operation
Techniques is that this was also conducted with China’s own funds and trainees took technical
training related to operating machinery in other Chinese cities, therefore it was not implemented
as part of this project.
9 Total area is approx. 12,000 ㎡.
4-9
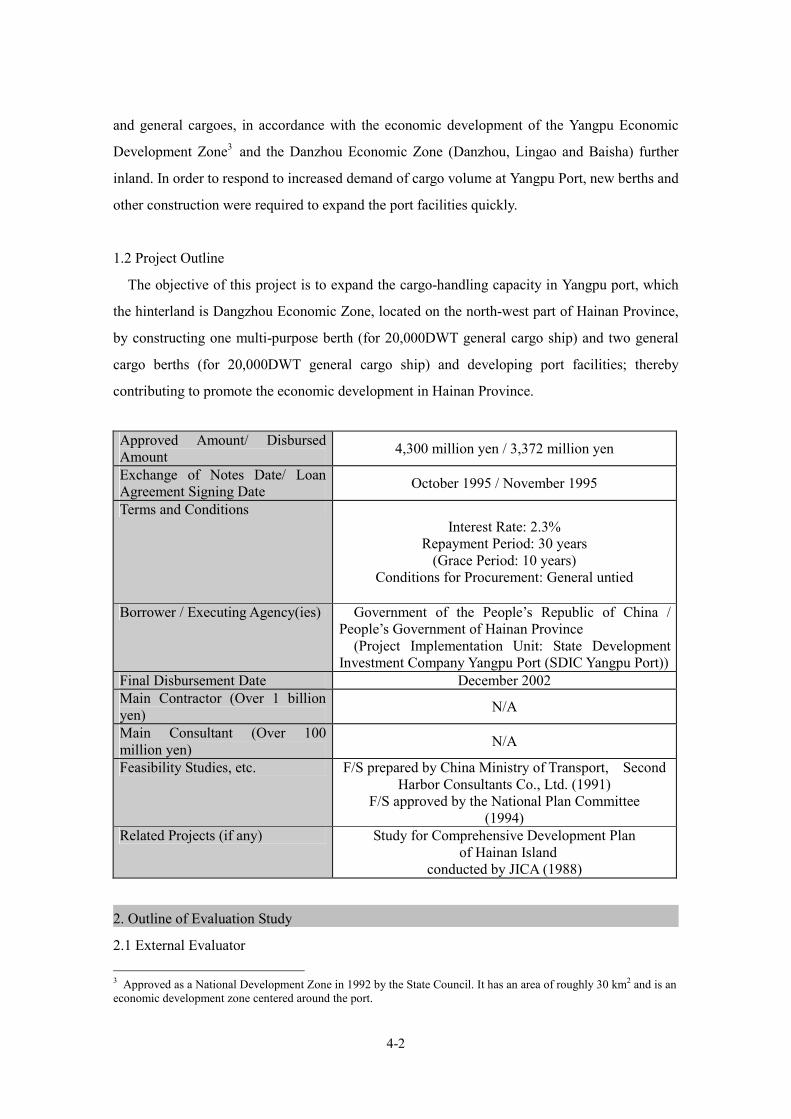
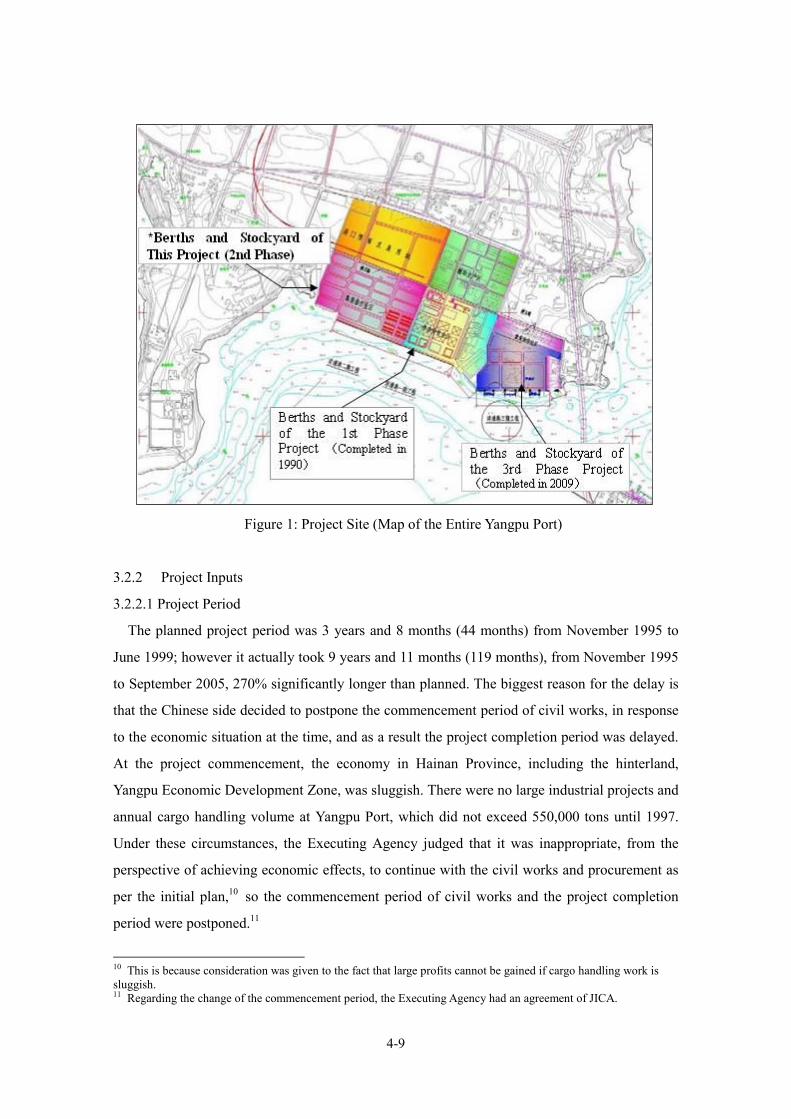
Figure 1: Project Site (Map of the Entire Yangpu Port)
3.2.2 Project Inputs
3.2.2.1 Project Period
The planned project period was 3 years and 8 months (44 months) from November 1995 to
June 1999; however it actually took 9 years and 11 months (119 months), from November 1995
to September 2005, 270% significantly longer than planned. The biggest reason for the delay is
that the Chinese side decided to postpone the commencement period of civil works, in response
to the economic situation at the time, and as a result the project completion period was delayed.
At the project commencement, the economy in Hainan Province, including the hinterland,
Yangpu Economic Development Zone, was sluggish. There were no large industrial projects and
annual cargo handling volume at Yangpu Port, which did not exceed 550,000 tons until 1997.
Under these circumstances, the Executing Agency judged that it was inappropriate, from the
perspective of achieving economic effects, to continue with the civil works and procurement as
per the initial plan,10 so the commencement period of civil works and the project completion
period were postponed.11
10 This is because consideration was given to the fact that large profits cannot be gained if cargo handling work is sluggish. 11 Regarding the change of the commencement period, the Executing Agency had an agreement of JICA.
4-10
Table 2: Comparison of Planned and Actual Project Period
Outputs Planned Actual
(The whole project) November 1995 to June 1999
(44 months) November 1995 to September
2005 (119 months)
1. Civil Works November 1995 to June 1999 November 1998 to September 2005
2. Procurement of Handling Equipments
January 1997 to June 1999 January 1998 to June 2003
3. Construction of Handling Facility Building, Operation and Management Building and Residential Houses for Port Workers (Living Environment Buildings), etc
July 1996 to June 1999 November 2000 to January 2005
4. Development of Water and Power Supply
July 1996 to June 1999 December 1998 to July 2005
5. Procurement and Installation of Communication and Navigation Support System
July 1996 to December 1997, January to June 1999
(Procurement in two installments)
January 2002 to March 2004 (Procurement in only one time)
6. Procurement of Port Boat and Patrol Vehicle
January 1997 to March 1998 October 1998 to November 1999
7. Land Acquisition and Resettlement
November 1995 to March 1996 November 1995 to December 1997
8. Consulting Services No Establishment of Planned M/M
November 1996 to April 1997
Source: JICA documents, Project Completion Report (PCR), Answers on questionnaires
3.3.2.2 Project Cost
The planned cost was 9,378 million yen (Japan’s ODA loan amount was 4,300 million yen),
and the actual cost was 6,819 million yen (Japan’s ODA loan amount was 3,372 million yen). It
is lower than planned (about 73% of the plan). The reasons the project cost was less than
planned are: 1) cancellation of facilities such as the warehouse, the administration, operation
and the school buildings, cancellation of “product (cargo) inspection facility construction,
procurement and installation of machineries, etc.” and cancellation of “technical cooperation”;
2) project funds were saved by thoroughly controlling funds related to biddings, procurements
and contracts; 3) fluctuations in exchange rates, etc.
Thus, although the project period was significantly longer than planned, the project cost was
lower than planned, therefore efficiency of the project is fair.
4-11
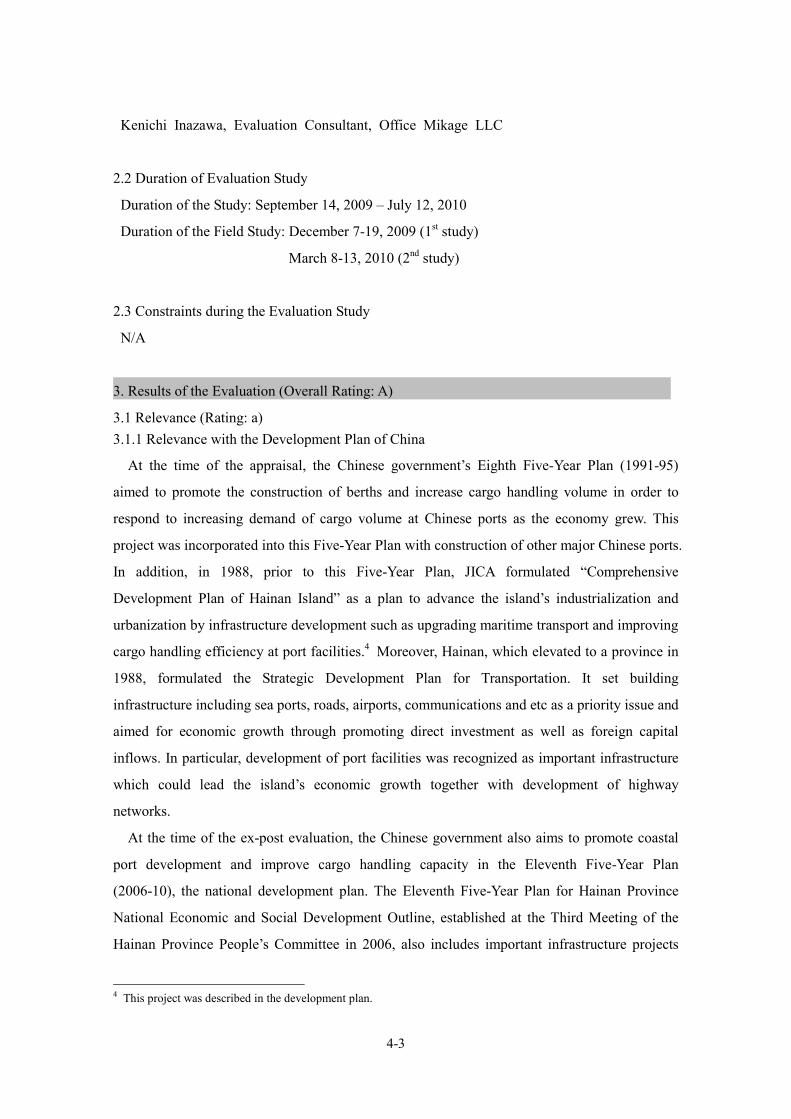
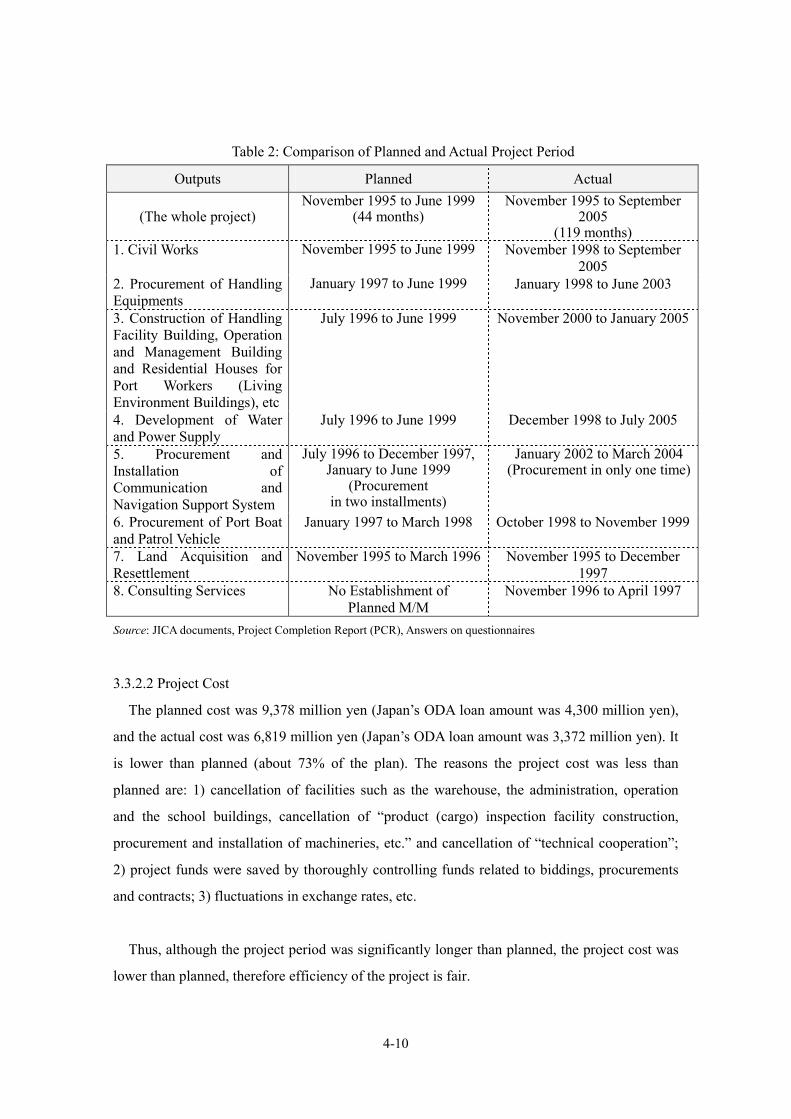
Figure 2: Berth and Cranes of this Project Figure 3: Trailer Chassises of this Project
3.3 Effectiveness (Rating: a)
3.3.1 Quantitative Effects
3.3.1.1 Results from Operation and Effect Indicators
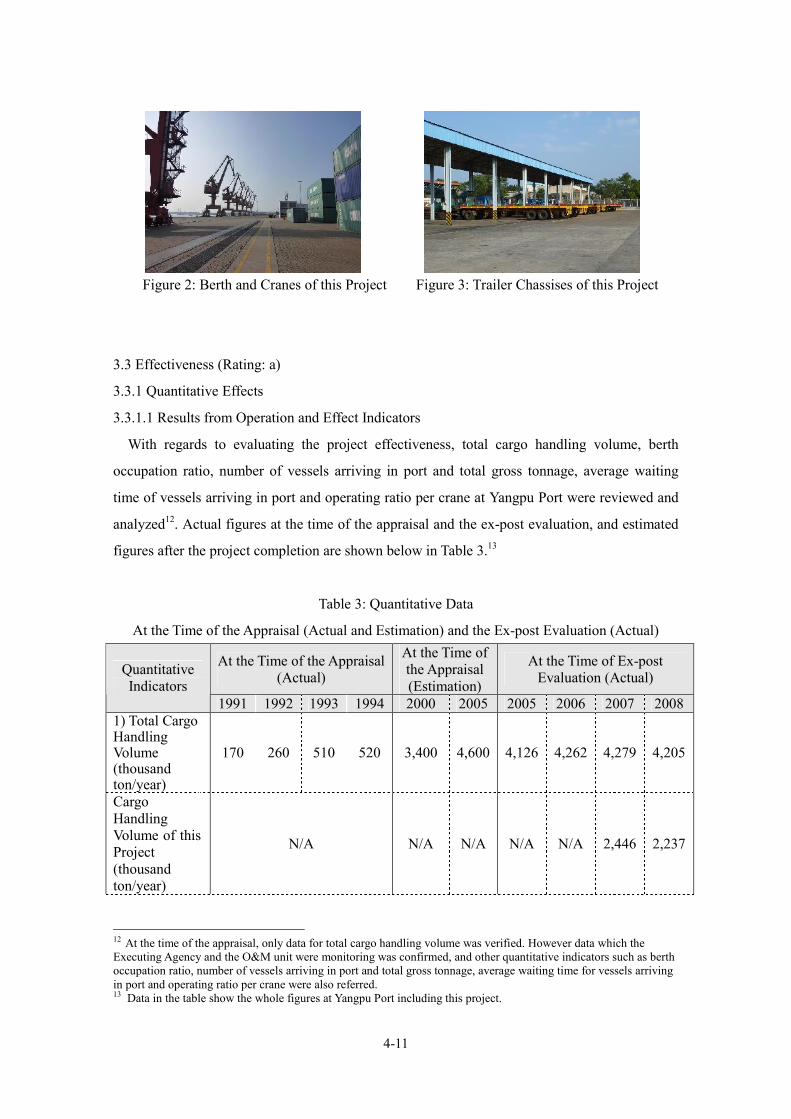
With regards to evaluating the project effectiveness, total cargo handling volume, berth
occupation ratio, number of vessels arriving in port and total gross tonnage, average waiting
time of vessels arriving in port and operating ratio per crane at Yangpu Port were reviewed and
analyzed12. Actual figures at the time of the appraisal and the ex-post evaluation, and estimated
figures after the project completion are shown below in Table 3.13
Table 3: Quantitative Data
At the Time of the Appraisal (Actual and Estimation) and the Ex-post Evaluation (Actual)
At the Time of the Appraisal (Actual)
At the Time of the Appraisal (Estimation)
At the Time of Ex-post Evaluation (Actual) Quantitative
Indicators 1991 1992 1993 1994 2000 2005 2005 2006 2007 2008
1) Total Cargo Handling Volume (thousand ton/year)
170 260 510 520 3,400 4,600 4,126 4,262 4,279 4,205
Cargo Handling Volume of this Project (thousand ton/year)
N/A N/A N/A N/A N/A 2,446 2,237
12 At the time of the appraisal, only data for total cargo handling volume was verified. However data which the Executing Agency and the O&M unit were monitoring was confirmed, and other quantitative indicators such as berth occupation ratio, number of vessels arriving in port and total gross tonnage, average waiting time for vessels arriving in port and operating ratio per crane were also referred. 13 Data in the table show the whole figures at Yangpu Port including this project.
4-12
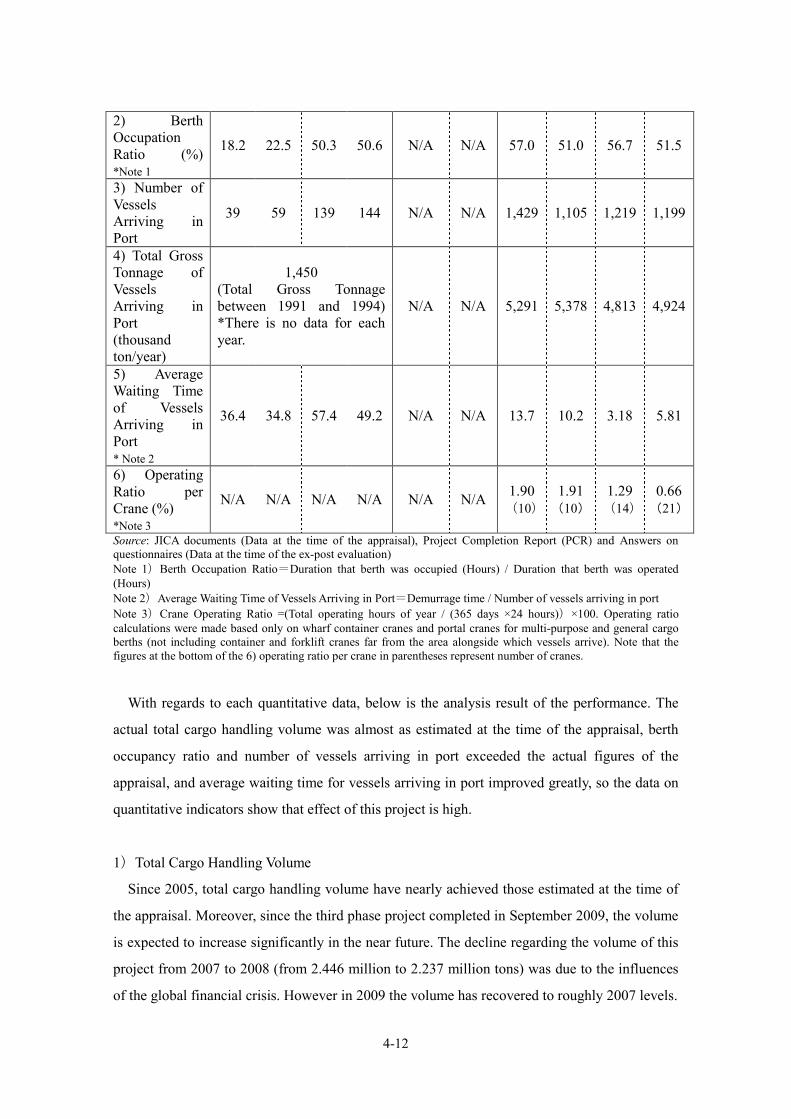
2) Berth Occupation Ratio (%) *Note 1
18.2 22.5 50.3 50.6 N/A N/A 57.0 51.0 56.7 51.5
3) Number of Vessels Arriving in Port
39 59 139 144 N/A N/A 1,429 1,105 1,219 1,199
4) Total Gross Tonnage of Vessels Arriving in Port (thousand ton/year)
1,450 (Total Gross Tonnage between 1991 and 1994) *There is no data for each year.
N/A N/A 5,291 5,378 4,813 4,924
5) Average Waiting Time of Vessels Arriving in Port * Note 2
36.4 34.8 57.4 49.2 N/A N/A 13.7 10.2 3.18 5.81
6) Operating Ratio per Crane (%) *Note 3
N/A N/A N/A N/A N/A N/A 1.90 (10)
1.91 (10)
1.29 (14)
0.66 (21)
Source: JICA documents (Data at the time of the appraisal), Project Completion Report (PCR) and Answers on questionnaires (Data at the time of the ex-post evaluation) Note 1)Berth Occupation Ratio=Duration that berth was occupied (Hours) / Duration that berth was operated (Hours) Note 2)Average Waiting Time of Vessels Arriving in Port=Demurrage time / Number of vessels arriving in port Note 3)Crane Operating Ratio =(Total operating hours of year / (365 days ×24 hours))×100. Operating ratio calculations were made based only on wharf container cranes and portal cranes for multi-purpose and general cargo berths (not including container and forklift cranes far from the area alongside which vessels arrive). Note that the figures at the bottom of the 6) operating ratio per crane in parentheses represent number of cranes.
With regards to each quantitative data, below is the analysis result of the performance. The
actual total cargo handling volume was almost as estimated at the time of the appraisal, berth
occupancy ratio and number of vessels arriving in port exceeded the actual figures of the
appraisal, and average waiting time for vessels arriving in port improved greatly, so the data on
quantitative indicators show that effect of this project is high.
1)Total Cargo Handling Volume
Since 2005, total cargo handling volume have nearly achieved those estimated at the time of
the appraisal. Moreover, since the third phase project completed in September 2009, the volume
is expected to increase significantly in the near future. The decline regarding the volume of this
project from 2007 to 2008 (from 2.446 million to 2.237 million tons) was due to the influences
of the global financial crisis. However in 2009 the volume has recovered to roughly 2007 levels.
4-13
2)Berth Occupation Ratio
The occupation ratio of the five berths (three built in this project and two built in the first
phase project) is 51.0% to 57.0% (2005-08). A target of 50% to 60% is often used at ports
managed by public agencies in Japan, so this range is believed to be without problem.
3)Number of Vessels Arriving in Port, 4)Total Gross Tonnage of Vessels Arriving in Port
After the project completion, over 1,000 ships have arrived in the port annually. The number
of vessels arriving in port has significantly increased, compared to the time of the appraisal. The
reason that a large number of ships arrived in 2005 is that there were relatively high numbers of
small, 1,000-ton vessels carrying raw lumber and coal. Total gross tonnage of vessels arriving in
port after the project completion has reached about 5 million annually, a remarkable increase
compared to the time of the appraisal.
5)Average Waiting Time of Vessels Arriving in Port
Since 2005, average waiting time of vessels arriving in port has largely reduced, compared to
the time of the appraisal. Efficient crane works, operation and service after the project
completion have also had a large impact on the reduction. The reason that average waiting times
increased somewhat from 2007 to 2008 is that there were many vessels shipping cement in 2008.
In other words, as loading works for cement are relatively laborious, the loading efficiency
lowers. As a result, average waiting time of vessels arriving in port increased somewhat.
6)Operating Ratio per Crane
Targets of operating ratio are basically set according to total cargo handling volume and
strategic targets. However since such figures could not be verified for this project, it is not
possible to judge the project effectiveness directly from these indicators. Therefore, the
following explanation has been verified purely from what is known about current
circumstances.
As a result of calculating crane operating ratio with a formula of “(Annual total operating
hours of multi-purpose/general cargo berth crane at Yangpu Port ÷ (365 days x 24 hours)) x
100),” it was under 20% for each year. This means that annual average crane operating hours is
20 to 30 minutes per hour. Note that these calculations include cranes procured in the first and
third phase projects (implemented through China’s own funds). At Yangpu Port sufficient cranes
4-14
have now been secured and deployed relative to the number of vessels arriving in port. Under
this formula, the average crane operating hours have been short. In addition, the reason that the
year-on-year operating ratio for 2007-08 is relatively low is that the Executing Agency
commenced the third phase project and procured new cranes. This means that just after the
Agency increased the number of cranes, the crane operating ratio is temporarily low unless the
number of vessels arriving in port rises drastically. However, the number of vessels arriving in
port is forecast to rise in the future, so it is believed that the operating ratio will also increase.
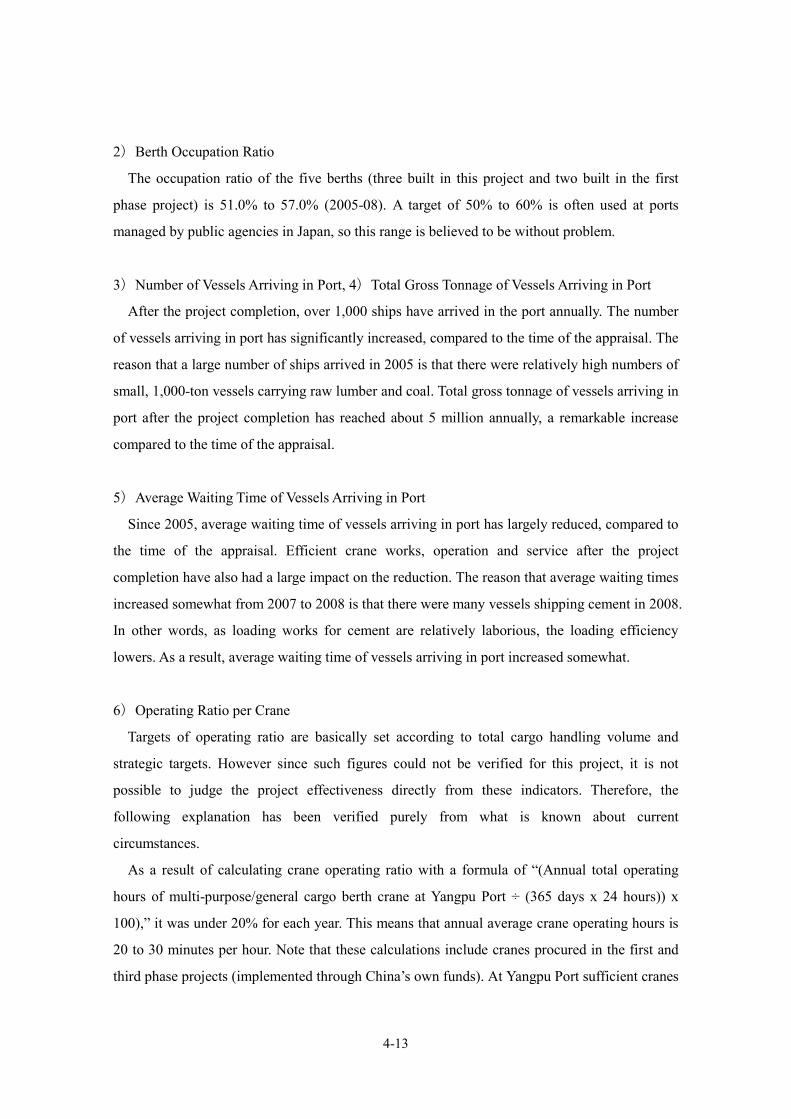
Figure 4: Container Forklift of this Project Figure 5: Port Boat of this Project
3.3.1.2 Results of Calculations of Internal Rates of Return (IRR)
Financial Internal Rate of Return:
Recalculating the financial internal rate of return with the fare revenues (port revenues) as the
benefits and project construction costs, operational and maintenance expenses, and taxes as the
costs, and assumed a project life of 20 years, the result was 6.43%. It is near to the 6.60%
estimation figure at the time of the appraisal.
Economic Internal Rate of Return:
Recalculating the economic internal rate of return with 1) reduction of waiting time of vessels
staying in port, 2) cargo transportation costs exit to other ports minus the costs enter to Yangpu
port as the benefits and project construction costs and operational and maintenance expenses as
the costs, and assumed a project life of 20 years, the result was 23.62%. It is a higher figure than
the 15.60% estimation figure at the time of the appraisal. This result is a larger figure than the
appraisal’s because 1) the initial investment (construction costs) was reduced and 2) benefits
increased more than the estimated figures (total cargoes increased more than estimated and
reduction of waiting time of vessels staying in port came true.14)
14 Refer to table 3 in this report
4-15
3.3.2 Qualitative Effects
3.3.2.1 Results of Beneficiary Survey on Improvement of Utilization in Yangpu Port
Questionnaire interviews were conducted to companies using Yangpu Port since 2005 (before
the project completion) and those that began using the port after the project completion. The
overall positive results were obtained as shown below.15 It can be assumed that the Executing
Agency has had an effort to the efficient operation and service for facilities, and the results were
positive.
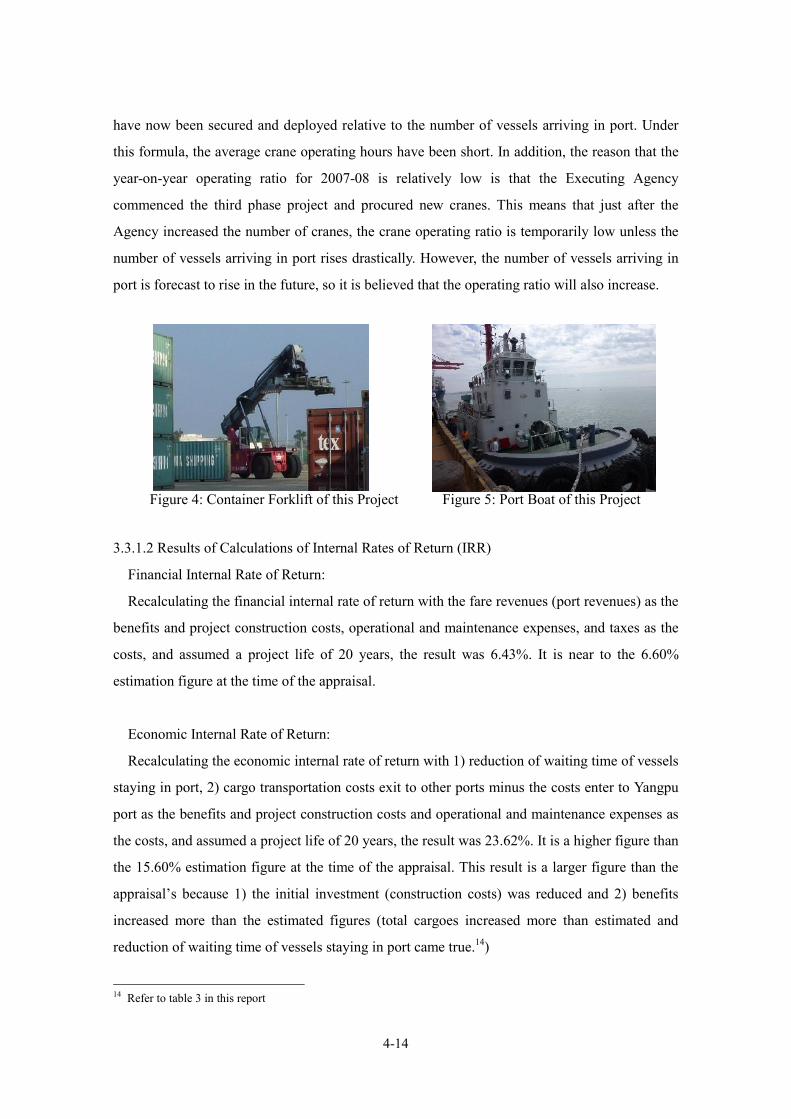
Table 4: Questions for All Companies Using Yangpu Port
(Beneficiary Survey Conducted in this Study) (Unit: People) Questions Answers
Significantly Increased: 16 (50%) Increased: 15 (47%) Not Changed: 0 (0%) Decreased: 1 (3%)
1)Changes in Total Cargo Handling Volume since 2005 at Yangpu Port
Not Certain: 0 (0%) Will Expand and Develop: 31 (97%) Will Not Change: 1 (3%)
2)Future Perspective of Yangpu Port
Not Certain: 0 (0%) Source: Results of beneficiary survey (The total sample size is 32.)
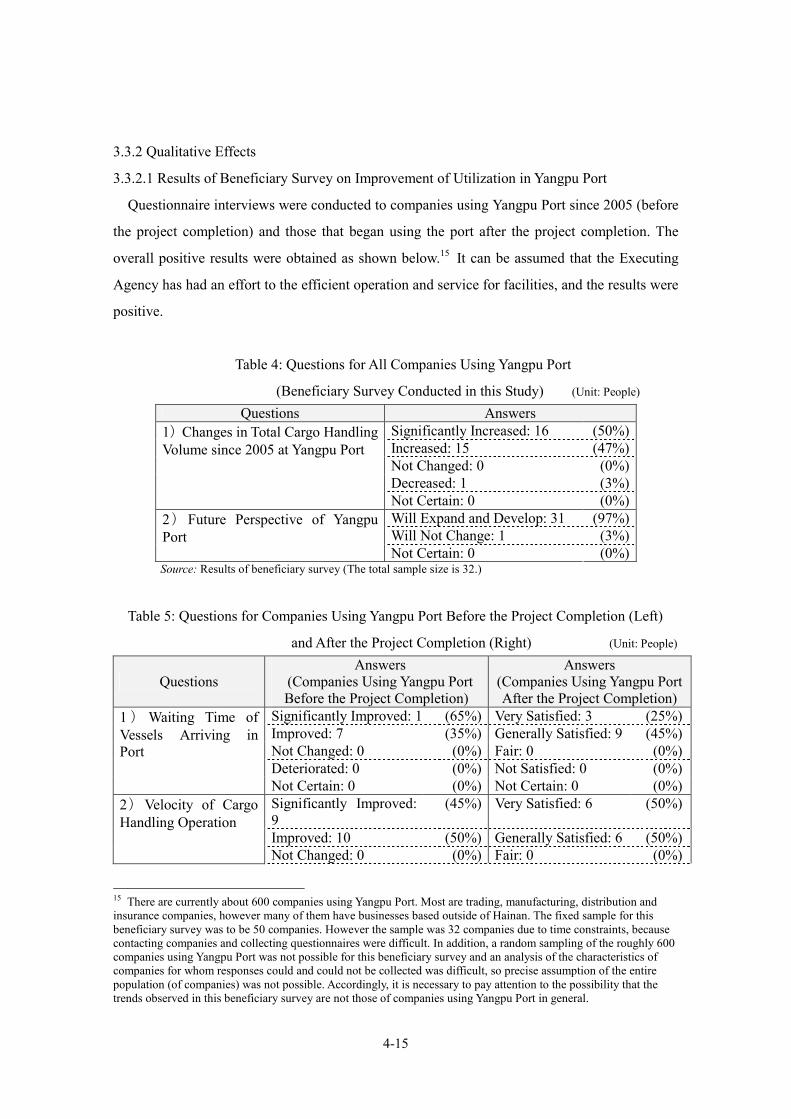
Table 5: Questions for Companies Using Yangpu Port Before the Project Completion (Left)
and After the Project Completion (Right) (Unit: People)
Questions Answers
(Companies Using Yangpu Port Before the Project Completion)
Answers (Companies Using Yangpu Port After the Project Completion)
Significantly Improved: 13 (65%) Very Satisfied: 3 (25%) Improved: 7 (35%) Generally Satisfied: 9 (45%) Not Changed: 0 (0%) Fair: 0 (0%) Deteriorated: 0 (0%) Not Satisfied: 0 (0%)
1 ) Waiting Time of Vessels Arriving in Port
Not Certain: 0 (0%) Not Certain: 0 (0%)
Significantly Improved: 9
(45%) Very Satisfied: 6 (50%)
Improved: 10 (50%) Generally Satisfied: 6 (50%)
2)Velocity of Cargo Handling Operation
Not Changed: 0 (0%) Fair: 0 (0%)
15 There are currently about 600 companies using Yangpu Port. Most are trading, manufacturing, distribution and insurance companies, however many of them have businesses based outside of Hainan. The fixed sample for this beneficiary survey was to be 50 companies. However the sample was 32 companies due to time constraints, because contacting companies and collecting questionnaires were difficult. In addition, a random sampling of the roughly 600 companies using Yangpu Port was not possible for this beneficiary survey and an analysis of the characteristics of companies for whom responses could and could not be collected was difficult, so precise assumption of the entire population (of companies) was not possible. Accordingly, it is necessary to pay attention to the possibility that the trends observed in this beneficiary survey are not those of companies using Yangpu Port in general.
4-16
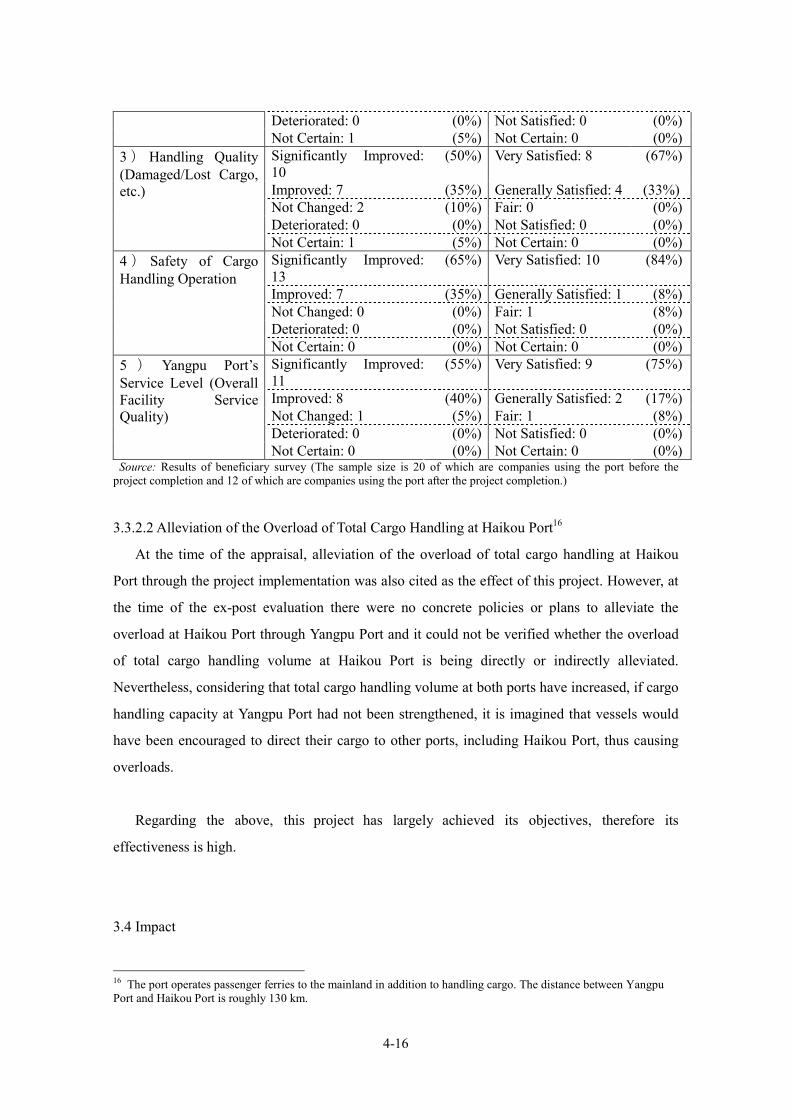
Deteriorated: 0 (0%) Not Satisfied: 0 (0%) Not Certain: 1 (5%) Not Certain: 0 (0%) Significantly Improved: 10
(50%) Very Satisfied: 8 (67%)
Improved: 7 (35%) Generally Satisfied: 4 (33%) Not Changed: 2 (10%) Fair: 0 (0%) Deteriorated: 0 (0%) Not Satisfied: 0 (0%)
3 ) Handling Quality (Damaged/Lost Cargo, etc.)
Not Certain: 1 (5%) Not Certain: 0 (0%) Significantly Improved: 13
(65%) Very Satisfied: 10 (84%)
Improved: 7 (35%) Generally Satisfied: 1 (8%) Not Changed: 0 (0%) Fair: 1 (8%) Deteriorated: 0 (0%) Not Satisfied: 0 (0%)
4 ) Safety of Cargo Handling Operation
Not Certain: 0 (0%) Not Certain: 0 (0%) Significantly Improved: 11
(55%) Very Satisfied: 9 (75%)
Improved: 8 (40%) Generally Satisfied: 2 (17%) Not Changed: 1 (5%) Fair: 1 (8%) Deteriorated: 0 (0%) Not Satisfied: 0 (0%)
5 ) Yangpu Port’s Service Level (Overall Facility Service Quality)
Not Certain: 0 (0%) Not Certain: 0 (0%) Source: Results of beneficiary survey (The sample size is 20 of which are companies using the port before the
project completion and 12 of which are companies using the port after the project completion.)
3.3.2.2 Alleviation of the Overload of Total Cargo Handling at Haikou Port16
At the time of the appraisal, alleviation of the overload of total cargo handling at Haikou
Port through the project implementation was also cited as the effect of this project. However, at
the time of the ex-post evaluation there were no concrete policies or plans to alleviate the
overload at Haikou Port through Yangpu Port and it could not be verified whether the overload
of total cargo handling volume at Haikou Port is being directly or indirectly alleviated.
Nevertheless, considering that total cargo handling volume at both ports have increased, if cargo
handling capacity at Yangpu Port had not been strengthened, it is imagined that vessels would
have been encouraged to direct their cargo to other ports, including Haikou Port, thus causing
overloads.
Regarding the above, this project has largely achieved its objectives, therefore its
effectiveness is high.
3.4 Impact
16 The port operates passenger ferries to the mainland in addition to handling cargo. The distance between Yangpu Port and Haikou Port is roughly 130 km.
4-17
3.4.1 Intended Impacts
3.4.1.1 Economic Development in Yangpu Economic Development Zone and the Hinterland
such as Dangzhou, Lingao, Baisha, and Development of Investment Environment
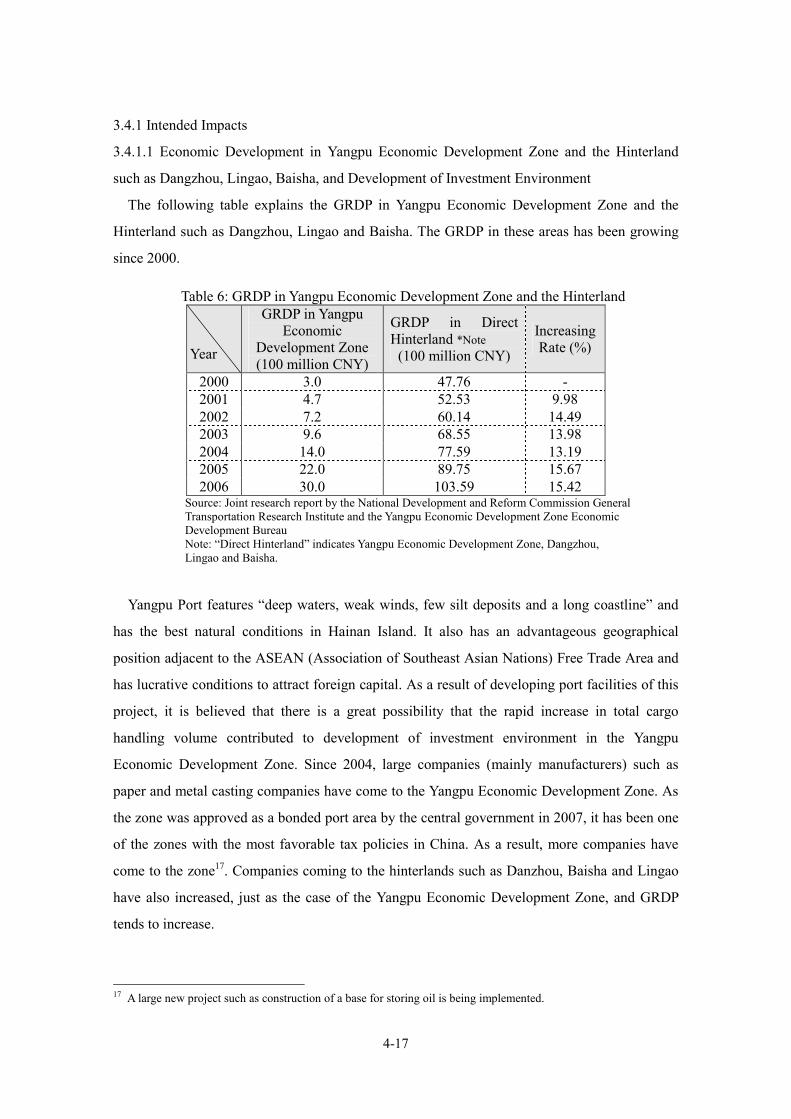
The following table explains the GRDP in Yangpu Economic Development Zone and the
Hinterland such as Dangzhou, Lingao and Baisha. The GRDP in these areas has been growing
since 2000.
Table 6: GRDP in Yangpu Economic Development Zone and the Hinterland GRDP in Yangpu
Economic Development Zone (100 million CNY)
GRDP in Direct Hinterland *Note
(100 million CNY)
Increasing Rate (%)
2000 3.0 47.76 - 2001 4.7 52.53 9.98 2002 7.2 60.14 14.49 2003 9.6 68.55 13.98 2004 14.0 77.59 13.19 2005 22.0 89.75 15.67 2006 30.0 103.59 15.42
Source: Joint research report by the National Development and Reform Commission General Transportation Research Institute and the Yangpu Economic Development Zone Economic Development Bureau Note: “Direct Hinterland” indicates Yangpu Economic Development Zone, Dangzhou, Lingao and Baisha.
Yangpu Port features “deep waters, weak winds, few silt deposits and a long coastline” and
has the best natural conditions in Hainan Island. It also has an advantageous geographical
position adjacent to the ASEAN (Association of Southeast Asian Nations) Free Trade Area and
has lucrative conditions to attract foreign capital. As a result of developing port facilities of this
project, it is believed that there is a great possibility that the rapid increase in total cargo
handling volume contributed to development of investment environment in the Yangpu
Economic Development Zone. Since 2004, large companies (mainly manufacturers) such as
paper and metal casting companies have come to the Yangpu Economic Development Zone. As
the zone was approved as a bonded port area by the central government in 2007, it has been one
of the zones with the most favorable tax policies in China. As a result, more companies have
come to the zone17. Companies coming to the hinterlands such as Danzhou, Baisha and Lingao
have also increased, just as the case of the Yangpu Economic Development Zone, and GRDP
tends to increase.
17 A large new project such as construction of a base for storing oil is being implemented.
Year
4-18
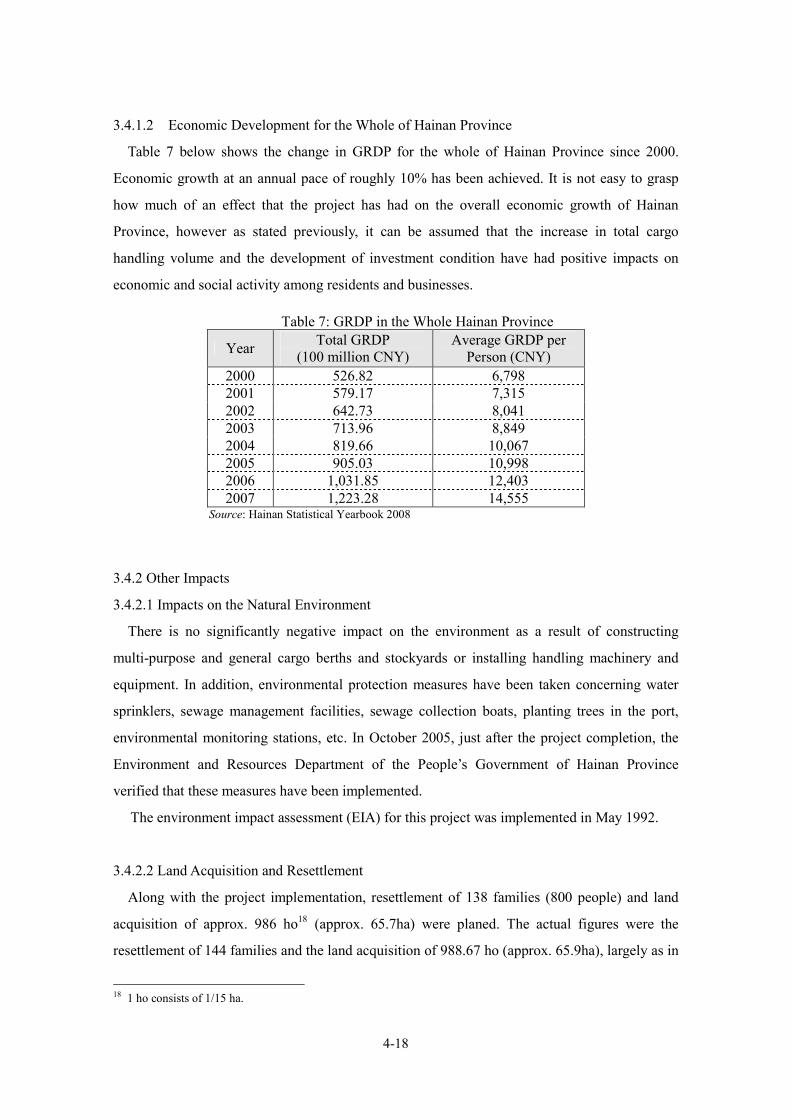
3.4.1.2 Economic Development for the Whole of Hainan Province
Table 7 below shows the change in GRDP for the whole of Hainan Province since 2000.
Economic growth at an annual pace of roughly 10% has been achieved. It is not easy to grasp
how much of an effect that the project has had on the overall economic growth of Hainan
Province, however as stated previously, it can be assumed that the increase in total cargo
handling volume and the development of investment condition have had positive impacts on
economic and social activity among residents and businesses.
Table 7: GRDP in the Whole Hainan Province
Year Total GRDP (100 million CNY)
Average GRDP per Person (CNY)
2000 526.82 6,798 2001 579.17 7,315 2002 642.73 8,041 2003 713.96 8,849 2004 819.66 10,067 2005 905.03 10,998 2006 1,031.85 12,403 2007 1,223.28 14,555
Source: Hainan Statistical Yearbook 2008
3.4.2 Other Impacts
3.4.2.1 Impacts on the Natural Environment
There is no significantly negative impact on the environment as a result of constructing
multi-purpose and general cargo berths and stockyards or installing handling machinery and
equipment. In addition, environmental protection measures have been taken concerning water
sprinklers, sewage management facilities, sewage collection boats, planting trees in the port,
environmental monitoring stations, etc. In October 2005, just after the project completion, the
Environment and Resources Department of the People’s Government of Hainan Province
verified that these measures have been implemented.
The environment impact assessment (EIA) for this project was implemented in May 1992.
3.4.2.2 Land Acquisition and Resettlement
Along with the project implementation, resettlement of 138 families (800 people) and land
acquisition of approx. 986 ho18 (approx. 65.7ha) were planed. The actual figures were the
resettlement of 144 families and the land acquisition of 988.67 ho (approx. 65.9ha), largely as in
18 1 ho consists of 1/15 ha.
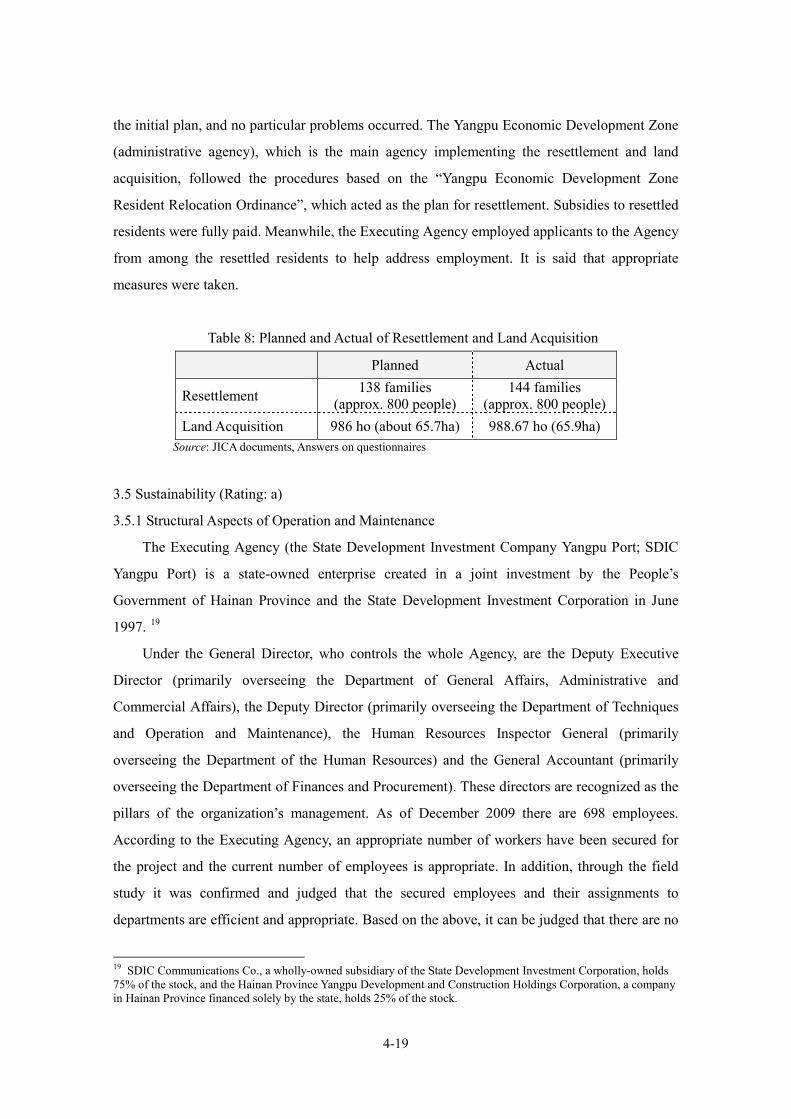
4-19
the initial plan, and no particular problems occurred. The Yangpu Economic Development Zone
(administrative agency), which is the main agency implementing the resettlement and land
acquisition, followed the procedures based on the “Yangpu Economic Development Zone
Resident Relocation Ordinance”, which acted as the plan for resettlement. Subsidies to resettled
residents were fully paid. Meanwhile, the Executing Agency employed applicants to the Agency
from among the resettled residents to help address employment. It is said that appropriate
measures were taken.
Table 8: Planned and Actual of Resettlement and Land Acquisition
Planned Actual
Resettlement 138 families (approx. 800 people)
144 families (approx. 800 people)
Land Acquisition 986 ho (about 65.7ha) 988.67 ho (65.9ha) Source: JICA documents, Answers on questionnaires
3.5 Sustainability (Rating: a)
3.5.1 Structural Aspects of Operation and Maintenance
The Executing Agency (the State Development Investment Company Yangpu Port; SDIC
Yangpu Port) is a state-owned enterprise created in a joint investment by the People’s
Government of Hainan Province and the State Development Investment Corporation in June
1997. 19
Under the General Director, who controls the whole Agency, are the Deputy Executive
Director (primarily overseeing the Department of General Affairs, Administrative and
Commercial Affairs), the Deputy Director (primarily overseeing the Department of Techniques
and Operation and Maintenance), the Human Resources Inspector General (primarily
overseeing the Department of the Human Resources) and the General Accountant (primarily
overseeing the Department of Finances and Procurement). These directors are recognized as the
pillars of the organization’s management. As of December 2009 there are 698 employees.
According to the Executing Agency, an appropriate number of workers have been secured for
the project and the current number of employees is appropriate. In addition, through the field
study it was confirmed and judged that the secured employees and their assignments to
departments are efficient and appropriate. Based on the above, it can be judged that there are no
19 SDIC Communications Co., a wholly-owned subsidiary of the State Development Investment Corporation, holds 75% of the stock, and the Hainan Province Yangpu Development and Construction Holdings Corporation, a company in Hainan Province financed solely by the state, holds 25% of the stock.
4-20
problems with the structural aspects of operation and maintenance.
The following departments in SDIC Yangpu Port are in charge of the operation and
maintenance.
1)Department of Techniques (8 employees)
This department is mainly in charge of procuring equipment of port facilities, general
management, technical improvements and management of operating boats, etc.
2)Mechanic Group (153 employees)
This group is mainly in charge of crane equipment operation and management, maintenance
work, etc.
3)Mechanic and Repairing Factory (93 employees)
This factory is mainly in charge of repairing equipment and machinery of the whole port
facility.
3.5.2 Technical Aspects of Operation and Maintenance
Department of Human Resources Department at the Executing Agency is mainly in charge of
conducting personnel courses and training programs for employees. The department also
conducts training for mid-level management and technical staff. 78 people participated in
training held for general employees in 2009, and 29 people participated in training held for
mid-level management. Training on operation and maintenance of machinery and equipment
was held in 2008, which 128 people participated. There are also many employees with ample
work experience and on-the-job training is occasionally conducted. Each department in charge
of the operation and maintenance works (those listed previously in 3.5.1) has many sufficiently
qualified personnel assigned (e.g. operator licenses about handling machinery, etc). Based on
the above, it can be judged that the technical level of the Executing Agency with regards to
operation and maintenance has been secured.
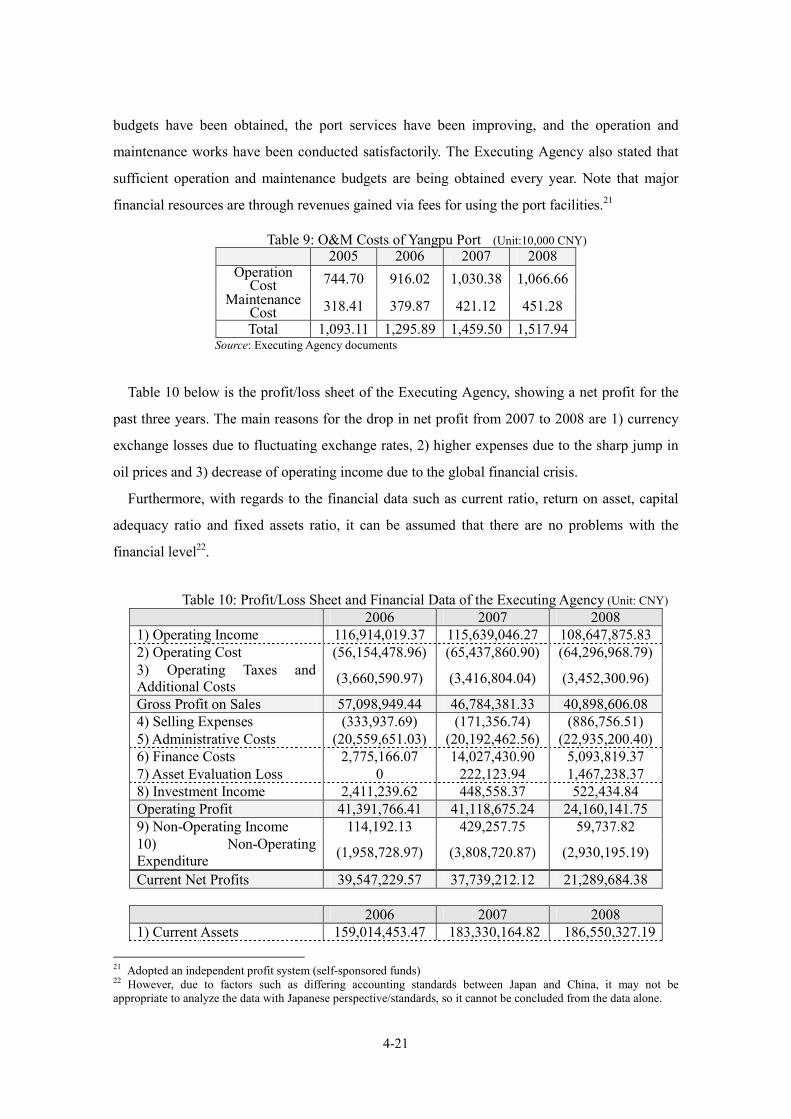
3.5.3 Financial Aspects of Operation and Maintenance
Table 9 below shows operation and maintenance costs of Yangpu Port in recent years.20 As
previously mentioned in Quantitative Effects (Effectiveness section), while the annual total
cargo handling volume did not greatly increase during 2005-08, it can be inferred that the net
increase in operation and maintenance costs as in the table below show that the sufficient 20 The Executing Agency did not calculate the operation and maintenance costs from this project (the second phase project) alone. Rather, the data in the table also consist of costs both from the first and the second phase project.
4-21
budgets have been obtained, the port services have been improving, and the operation and
maintenance works have been conducted satisfactorily. The Executing Agency also stated that
sufficient operation and maintenance budgets are being obtained every year. Note that major
financial resources are through revenues gained via fees for using the port facilities.21
Table 9: O&M Costs of Yangpu Port (Unit:10,000 CNY) 2005 2006 2007 2008
Operation Cost 744.70 916.02 1,030.38 1,066.66
Maintenance Cost 318.41 379.87 421.12 451.28 Total 1,093.11 1,295.89 1,459.50 1,517.94
Source: Executing Agency documents
Table 10 below is the profit/loss sheet of the Executing Agency, showing a net profit for the
past three years. The main reasons for the drop in net profit from 2007 to 2008 are 1) currency
exchange losses due to fluctuating exchange rates, 2) higher expenses due to the sharp jump in
oil prices and 3) decrease of operating income due to the global financial crisis.
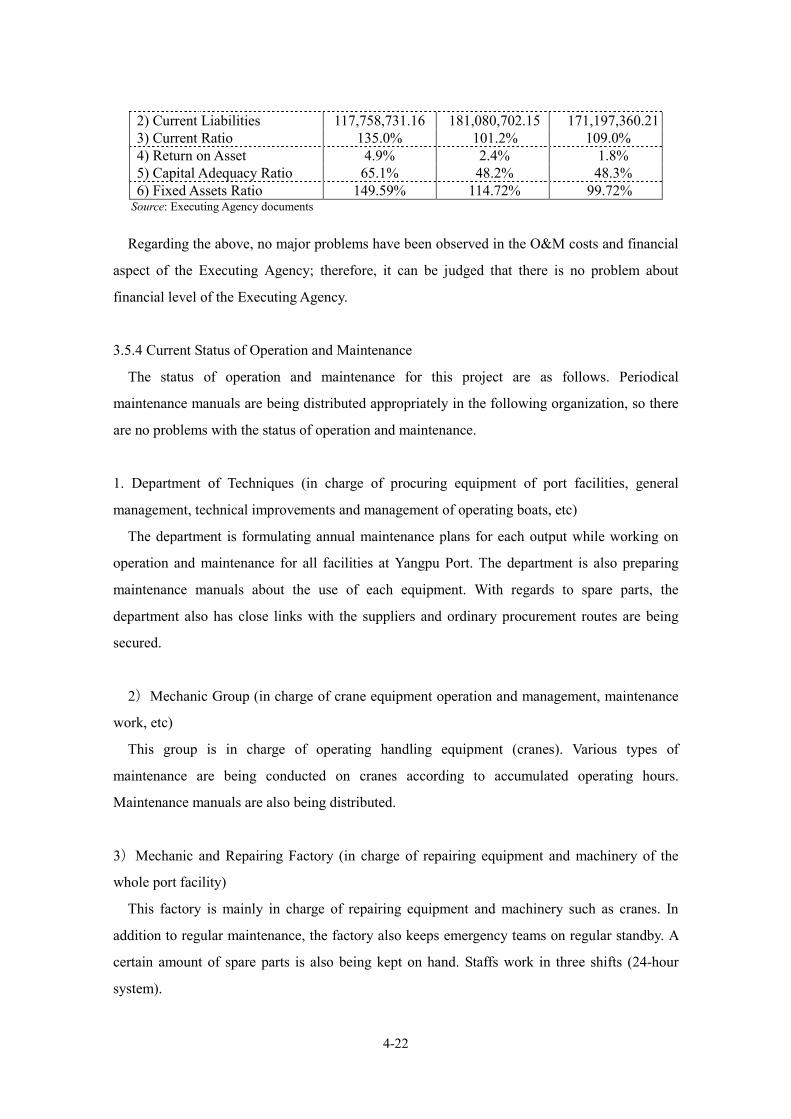
Furthermore, with regards to the financial data such as current ratio, return on asset, capital
adequacy ratio and fixed assets ratio, it can be assumed that there are no problems with the
financial level22.
Table 10: Profit/Loss Sheet and Financial Data of the Executing Agency (Unit: CNY)
2006 2007 2008 1) Operating Income 116,914,019.37 115,639,046.27 108,647,875.83 2) Operating Cost (56,154,478.96) (65,437,860.90) (64,296,968.79) 3) Operating Taxes and Additional Costs (3,660,590.97) (3,416,804.04) (3,452,300.96)
Gross Profit on Sales 57,098,949.44 46,784,381.33 40,898,606.08 4) Selling Expenses (333,937.69) (171,356.74) (886,756.51) 5) Administrative Costs (20,559,651.03) (20,192,462.56) (22,935,200.40) 6) Finance Costs 2,775,166.07 14,027,430.90 5,093,819.37 7) Asset Evaluation Loss 0 222,123.94 1,467,238.37 8) Investment Income 2,411,239.62 448,558.37 522,434.84 Operating Profit 41,391,766.41 41,118,675.24 24,160,141.75 9) Non-Operating Income 114,192.13 429,257.75 59,737.82 10) Non-Operating Expenditure (1,958,728.97) (3,808,720.87) (2,930,195.19)
Current Net Profits 39,547,229.57 37,739,212.12 21,289,684.38 2006 2007 2008 1) Current Assets 159,014,453.47 183,330,164.82 186,550,327.19
21 Adopted an independent profit system (self-sponsored funds) 22 However, due to factors such as differing accounting standards between Japan and China, it may not be appropriate to analyze the data with Japanese perspective/standards, so it cannot be concluded from the data alone.
4-22
2) Current Liabilities 117,758,731.16 181,080,702.15 171,197,360.21 3) Current Ratio 135.0% 101.2% 109.0% 4) Return on Asset 4.9% 2.4% 1.8% 5) Capital Adequacy Ratio 65.1% 48.2% 48.3% 6) Fixed Assets Ratio 149.59% 114.72% 99.72% Source: Executing Agency documents
Regarding the above, no major problems have been observed in the O&M costs and financial
aspect of the Executing Agency; therefore, it can be judged that there is no problem about
financial level of the Executing Agency.
3.5.4 Current Status of Operation and Maintenance
The status of operation and maintenance for this project are as follows. Periodical
maintenance manuals are being distributed appropriately in the following organization, so there
are no problems with the status of operation and maintenance.
1. Department of Techniques (in charge of procuring equipment of port facilities, general
management, technical improvements and management of operating boats, etc)
The department is formulating annual maintenance plans for each output while working on
operation and maintenance for all facilities at Yangpu Port. The department is also preparing
maintenance manuals about the use of each equipment. With regards to spare parts, the
department also has close links with the suppliers and ordinary procurement routes are being
secured.
2)Mechanic Group (in charge of crane equipment operation and management, maintenance
work, etc)
This group is in charge of operating handling equipment (cranes). Various types of
maintenance are being conducted on cranes according to accumulated operating hours.
Maintenance manuals are also being distributed.
3)Mechanic and Repairing Factory (in charge of repairing equipment and machinery of the
whole port facility)
This factory is mainly in charge of repairing equipment and machinery such as cranes. In
addition to regular maintenance, the factory also keeps emergency teams on regular standby. A
certain amount of spare parts is also being kept on hand. Staffs work in three shifts (24-hour
system).
4-23
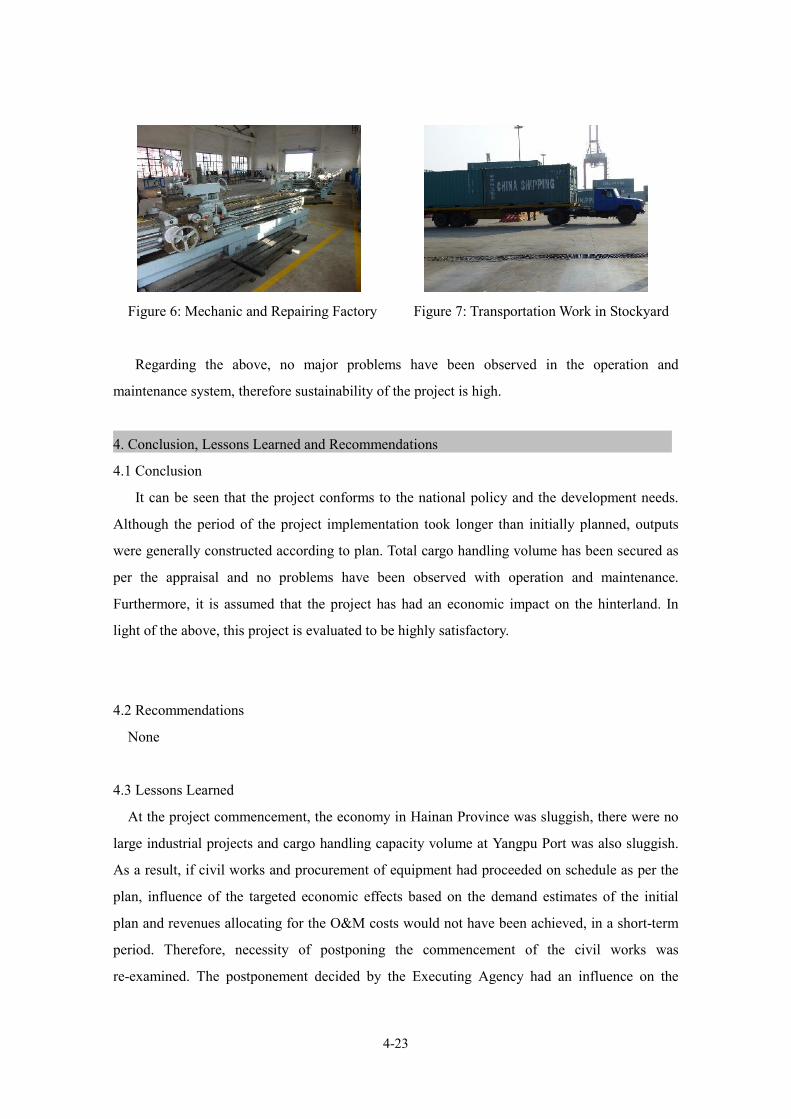
Figure 6: Mechanic and Repairing Factory Figure 7: Transportation Work in Stockyard
Regarding the above, no major problems have been observed in the operation and
maintenance system, therefore sustainability of the project is high.
4. Conclusion, Lessons Learned and Recommendations
4.1 Conclusion
It can be seen that the project conforms to the national policy and the development needs.
Although the period of the project implementation took longer than initially planned, outputs
were generally constructed according to plan. Total cargo handling volume has been secured as
per the appraisal and no problems have been observed with operation and maintenance.
Furthermore, it is assumed that the project has had an economic impact on the hinterland. In
light of the above, this project is evaluated to be highly satisfactory.
4.2 Recommendations
None
4.3 Lessons Learned
At the project commencement, the economy in Hainan Province was sluggish, there were no
large industrial projects and cargo handling capacity volume at Yangpu Port was also sluggish.
As a result, if civil works and procurement of equipment had proceeded on schedule as per the
plan, influence of the targeted economic effects based on the demand estimates of the initial
plan and revenues allocating for the O&M costs would not have been achieved, in a short-term
period. Therefore, necessity of postponing the commencement of the civil works was
re-examined. The postponement decided by the Executing Agency had an influence on the

4-24
efficiency evaluation, however the project effects such as total cargo handling volume have
appeared as per the plan and it is believed that revenues which are necessary for maintenance
work have been obtained. It is said that the decision was appropriate from the perspective of
effectiveness and sustainability. Therefore, going forward with construction and procurement
according to the initial plan is basically preferable. However if unexpected changes occur with
regards to external conditions upon which the project effects are premised (such as economic
and social conditions that involve the project), going back to the project’s purpose and
reviewing the project plan will also be one of the effective choices.
4-25
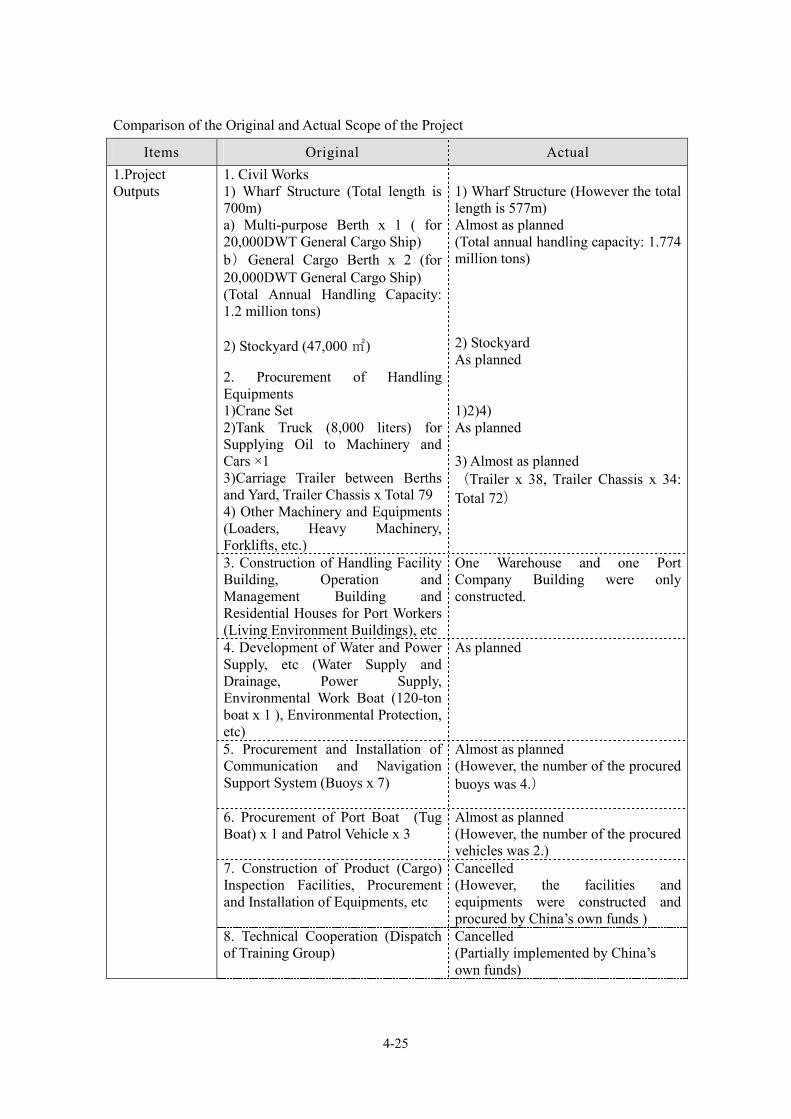
Comparison of the Original and Actual Scope of the Project
Items Original Actual 1. Civil Works 1) Wharf Structure (Total length is 700m) a) Multi-purpose Berth x 1 ( for 20,000DWT General Cargo Ship) b)General Cargo Berth x 2 (for 20,000DWT General Cargo Ship) (Total Annual Handling Capacity: 1.2 million tons) 2) Stockyard (47,000 ㎡)
1) Wharf Structure (However the total length is 577m) Almost as planned (Total annual handling capacity: 1.774 million tons) 2) Stockyard As planned
2. Procurement of Handling Equipments 1)Crane Set 2)Tank Truck (8,000 liters) for Supplying Oil to Machinery and Cars ×1 3)Carriage Trailer between Berths and Yard, Trailer Chassis x Total 79 4) Other Machinery and Equipments (Loaders, Heavy Machinery, Forklifts, etc.)
1)2)4) As planned 3) Almost as planned (Trailer x 38, Trailer Chassis x 34: Total 72)
3. Construction of Handling Facility Building, Operation and Management Building and Residential Houses for Port Workers (Living Environment Buildings), etc
One Warehouse and one Port Company Building were only constructed.
4. Development of Water and Power Supply, etc (Water Supply and Drainage, Power Supply, Environmental Work Boat (120-ton boat x 1 ), Environmental Protection, etc)
As planned
5. Procurement and Installation of Communication and Navigation Support System (Buoys x 7)
Almost as planned (However, the number of the procured buoys was 4.)
6. Procurement of Port Boat (Tug Boat) x 1 and Patrol Vehicle x 3
Almost as planned (However, the number of the procured vehicles was 2.)
7. Construction of Product (Cargo) Inspection Facilities, Procurement and Installation of Equipments, etc
Cancelled (However, the facilities and equipments were constructed and procured by China’s own funds )
1.Project Outputs
8. Technical Cooperation (Dispatch of Training Group)
Cancelled (Partially implemented by China’s own funds)
4-26
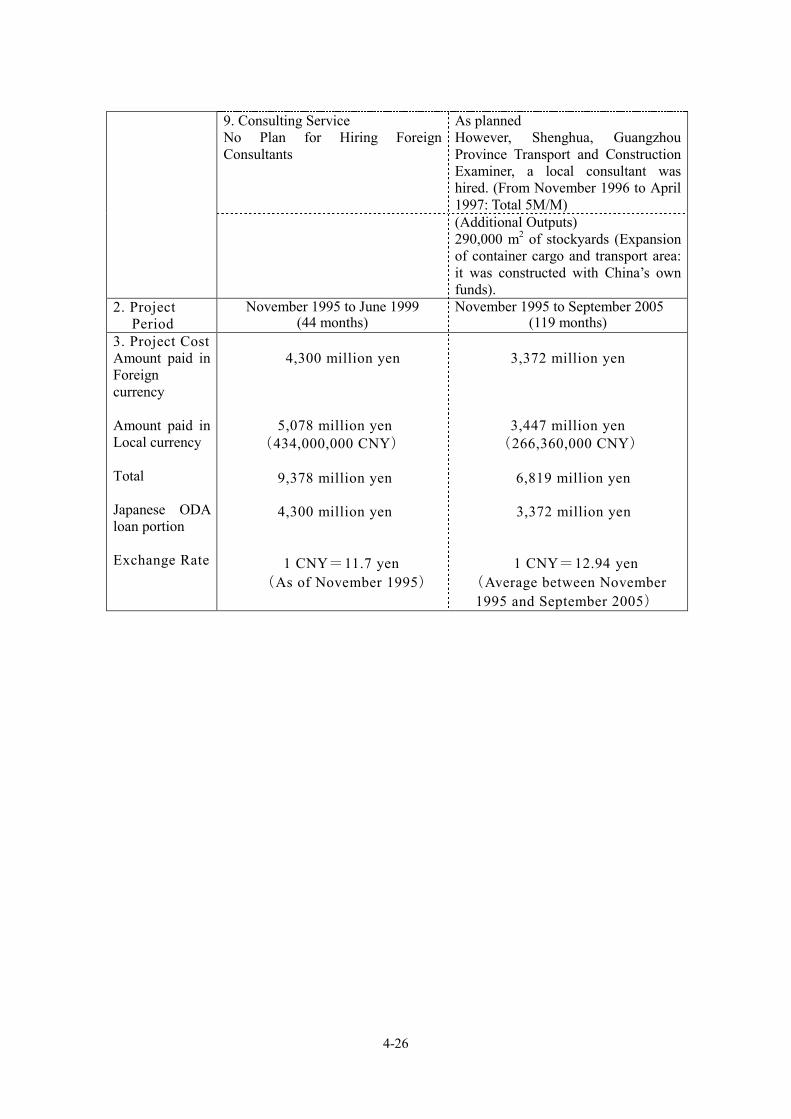
9. Consulting Service No Plan for Hiring Foreign Consultants
As planned However, Shenghua, Guangzhou Province Transport and Construction Examiner, a local consultant was hired. (From November 1996 to April 1997: Total 5M/M)
(Additional Outputs) 290,000 m2 of stockyards (Expansion of container cargo and transport area: it was constructed with China’s own funds).
2. Project Period
November 1995 to June 1999 (44 months)
November 1995 to September 2005 (119 months)
3. Project Cost Amount paid in Foreign currency Amount paid in Local currency Total Japanese ODA loan portion Exchange Rate
4,300 million yen
5,078 million yen (434,000,000 CNY)
9,378 million yen
4,300 million yen
1 CNY=11.7 yen (As of November 1995)
3,372 million yen
3,447 million yen (266,360,000 CNY)
6,819 million yen
3,372 million yen
1 CNY=12.94 yen (Average between November 1995 and September 2005)