Embed Size (px)
Citation preview
China General Plastics Corporation and Subsidiaries Consolidated Financial Statements for the Years Ended December 31, 2019 and 2018 and Independent Auditors’ Report
- 1 -
DECLARATION OF CONSOLIDATION OF FINANCIAL STATEMENTS OF AFFILIATES
The entities that are required to be included in the combined financial statements of China General
Plastics Corporation as of and for the year ended December 31, 2019, under the “Criteria Governing
Preparation of Affiliation Reports, Consolidated Business Reports and Consolidated Financial Statements
of Affiliated Enterprises”, are the same as those included in the consolidated financial statements
prepared in conformity with International Financial Reporting Standard 10, “Consolidated Financial
Statements”. In addition, the information required to be disclosed in the combined financial statements of
affiliates is included in the consolidated financial statements of China General Plastics Corporation and
Subsidiaries. Consequently, we do not prepared a separate set of combined financial statements of
affiliates.
Very truly yours,
CHINA GENERAL PLASTICS CORPORATION
By
YI-GUI WU
Chairman
March 5, 2020

- 3 -
The key audit matters identified in the Group’s consolidated financial statements for the year ended December
31, 2019 are stated as follows:
Validity of Specific Revenue
The amount of revenue derived from certain customers was NT$3,509,113 thousand, representing 23% of total
revenue of the Group for the year ended December 31, 2019. These customers were all distributors, and their
growth rate of revenue is significantly higher compared to the average growth rate of revenue. Therefore, we
identified the validity of the revenue derived from these customers has been identified as a key audit matter.
For the accounting policy related to the validity of the revenue derived from these customers, refer to Notes 4
and 26 to the accompanying consolidated financial statements.
The main audit procedures that we performed to assess the validity of the revenue derived from the
above-mentioned specific customers are as follows:
1. We understood the designed and tested operating effectiveness of internal control and confirmed the
validity of revenue recognition derived from the above-mentioned customers.
2. We sampled the transaction documents related to revenue derived from the above-mentioned customers,
including sales order, shipping, customs and receipt documents, and verified verify that the revenue was
recognized upon completion of the performance obligation.
3. We sampled sales returns, provisions and cash collections which have occurred subsequent to the balance
sheet date and verified the reasonableness of revenue recognition.
Valuation of Inventory
As of December 31, 2019, the carrying amount of the Group’s inventory was NT$1,469,212 thousand (i.e., the
gross amount of inventory of NT$1,551,532 thousand with a deduction of the allowance for inventory valuation
of NT$82,320 thousand), representing 12% of the Group’s total assets. As the Group’s inventory was stated at
the lower of cost or net realizable value in accordance with IAS 2 “Inventories”, which involved critical
judgment and accounting estimates by the management, we identified the valuation of inventory has been
identified as a key audit matter.
Refer to Notes 4, 5 and 11 to the Group’s financial statements for the related accounting policies and disclosures
on inventory valuation.
The main audit procedures that we performed for valuation of inventory are as follows:
1. We obtained an understanding of the reasonableness of the Group’s policies and methods of the allowance
for inventory valuation.
2. By performing a year-end inventory observation, we understood the inventory status and evaluated the
reasonableness of the allowance for inventory valuation.
3. We tested the inventory aging and net realizable value report used in valuation, including verification of the
completeness, net realizable value and recalculation of the accuracy of the reports. In addition, we also
performed the retrospective test to verify the validity of the impairment items and value decline in
subsequent period.
Other Matter
We have also audited the parent company only financial statements of China General Plastics Corporation as of
and for the years ended December 31, 2019 and 2018 on which we have issued an unmodified opinion.
- 4 -
Responsibilities of Management and Those Charged with Governance for the Consolidated Financial
Statements
Management is responsible for the preparation and fair presentation of the consolidated financial statements in
accordance with the Regulations Governing the Preparation of Financial Reports by Securities Issuers and the
IFRS, IAS, IFRIC, and SIC endorsed and issued into effect by the Financial Supervisory Commission of the
Republic of China, and for such internal control as management determines is necessary to enable the
preparation of consolidated financial statements that are free from material misstatement, whether due to fraud
or error.
In preparing the consolidated financial statements, management is responsible for assessing the Group’s ability
to continue as a going concern, disclosing, as applicable, matters related to going concern and using the going
concern basis of accounting unless management either intends to liquidate the Group or to cease operations, or
has no realistic alternative but to do so.
Those charged with governance (including the audit committee) are responsible for overseeing the Group’s
financial reporting process.
Auditors’ Responsibilities for the Audit of the Consolidated Financial Statements
Our objectives are to obtain reasonable assurance about whether the consolidated financial statements as a
whole are free from material misstatement, whether due to fraud or error, and to issue an auditors’ report that
includes our opinion. Reasonable assurance is a high level of assurance, but is not a guarantee that an audit
conducted in accordance with the auditing standards generally accepted in the Republic of China will always
detect a material misstatement when it exists. Misstatements can arise from fraud or error and are considered
material if, individually or in the aggregate, they could reasonably be expected to influence the economic
decisions of users taken on the basis of these consolidated financial statements.
As part of an audit in accordance with the auditing standards generally accepted in the Republic of China, we
exercise professional judgment and maintain professional skepticism throughout the audit. We also:
1. Identify and assess the risks of material misstatement of the consolidated financial statements, whether due
to fraud or error, design and perform audit procedures responsive to those risks, and obtain audit evidence
that is sufficient and appropriate to provide a basis for our opinion. The risk of not detecting a material
misstatement resulting from fraud is higher than for one resulting from error, as fraud may involve
collusion, forgery, intentional omissions, misrepresentations, or the override of internal control.
2. Obtain an understanding of internal control relevant to the audit in order to design audit procedures that are
appropriate in the circumstances, but not for the purpose of expressing an opinion on the effectiveness of
the Group’s internal control.
3. Evaluate the appropriateness of accounting policies used and the reasonableness of accounting estimates
and related disclosures made by management.
4. Conclude on the appropriateness of management’s use of the going concern basis of accounting and, based
on the audit evidence obtained, whether a material uncertainty exists related to events or conditions that
may cast significant doubt on the Group’s ability to continue as a going concern. If we conclude that a
material uncertainty exists, we are required to draw attention in our auditors’ report to the related
disclosures in the consolidated financial statements or, if such disclosures are inadequate, to modify our
opinion. Our conclusions are based on the audit evidence obtained up to the date of our auditors’ report.
However, future events or conditions may cause the Group to cease to continue as a going concern.
- 5 -
5. Evaluate the overall presentation, structure and content of the consolidated financial statements, including
the disclosures, and whether the consolidated financial statements represent the underlying transactions and
events in a manner that achieves fair presentation.
6. Obtain sufficient appropriate audit evidence regarding the financial information of the entities or business
activities within the Group to express an opinion on the consolidated financial statements. We are
responsible for the direction, supervision and performance of the group audit. We remain solely responsible
for our audit opinion.
We communicate with those charged with governance regarding, among other matters, the planned scope and
timing of the audit and significant audit findings, including any significant deficiencies in internal control that
we identify during our audit.
We also provide those charged with governance with statements that we have complied with relevant ethical
requirements regarding independence, and to communicate with them all relationships and other matters that
may reasonably be thought to bear on our independence, and where applicable, related safeguards.
From the matters communicated with those charged with governance, we determine those matters that were of
most significance in the audit of the consolidated financial statements for the year ended December 31, 2019
and are therefore the key audit matters. We describe these matters in our auditor’s report unless law or
regulation preludes public disclosure about the matter or when, in extremely rare circumstances, we determine
that a matter should not be communicated in our report because the adverse consequences of doing so would
reasonably be expected to outweigh the public interest benefits of such communication.
The engagement partners on the audit resulting in this independent auditors’ report are Hsiu-Chun Huang and
Cheng-Chun Chiu.
Deloitte & Touche
Taipei, Taiwan
Republic of China
March 13, 2020
Notice to Readers
The accompanying consolidated financial statements are intended only to present the consolidated financial
position, financial performance and cash flows in accordance with accounting principles and practices
generally accepted in the Republic of China and not those of any other jurisdictions. The standards, procedures
and practices to audit such consolidated financial statements are those generally applied in the Republic of
China.
For the convenience of readers, the independent auditors’ report and the accompanying consolidated financial
statements have been translated into English from the original Chinese version prepared and used in the
Republic of China. If there is any conflict between the English version and the original Chinese version or any
difference in the interpretation of the two versions, the Chinese-language independent auditors’ report and
consolidated financial statements shall prevail.
- 6 -
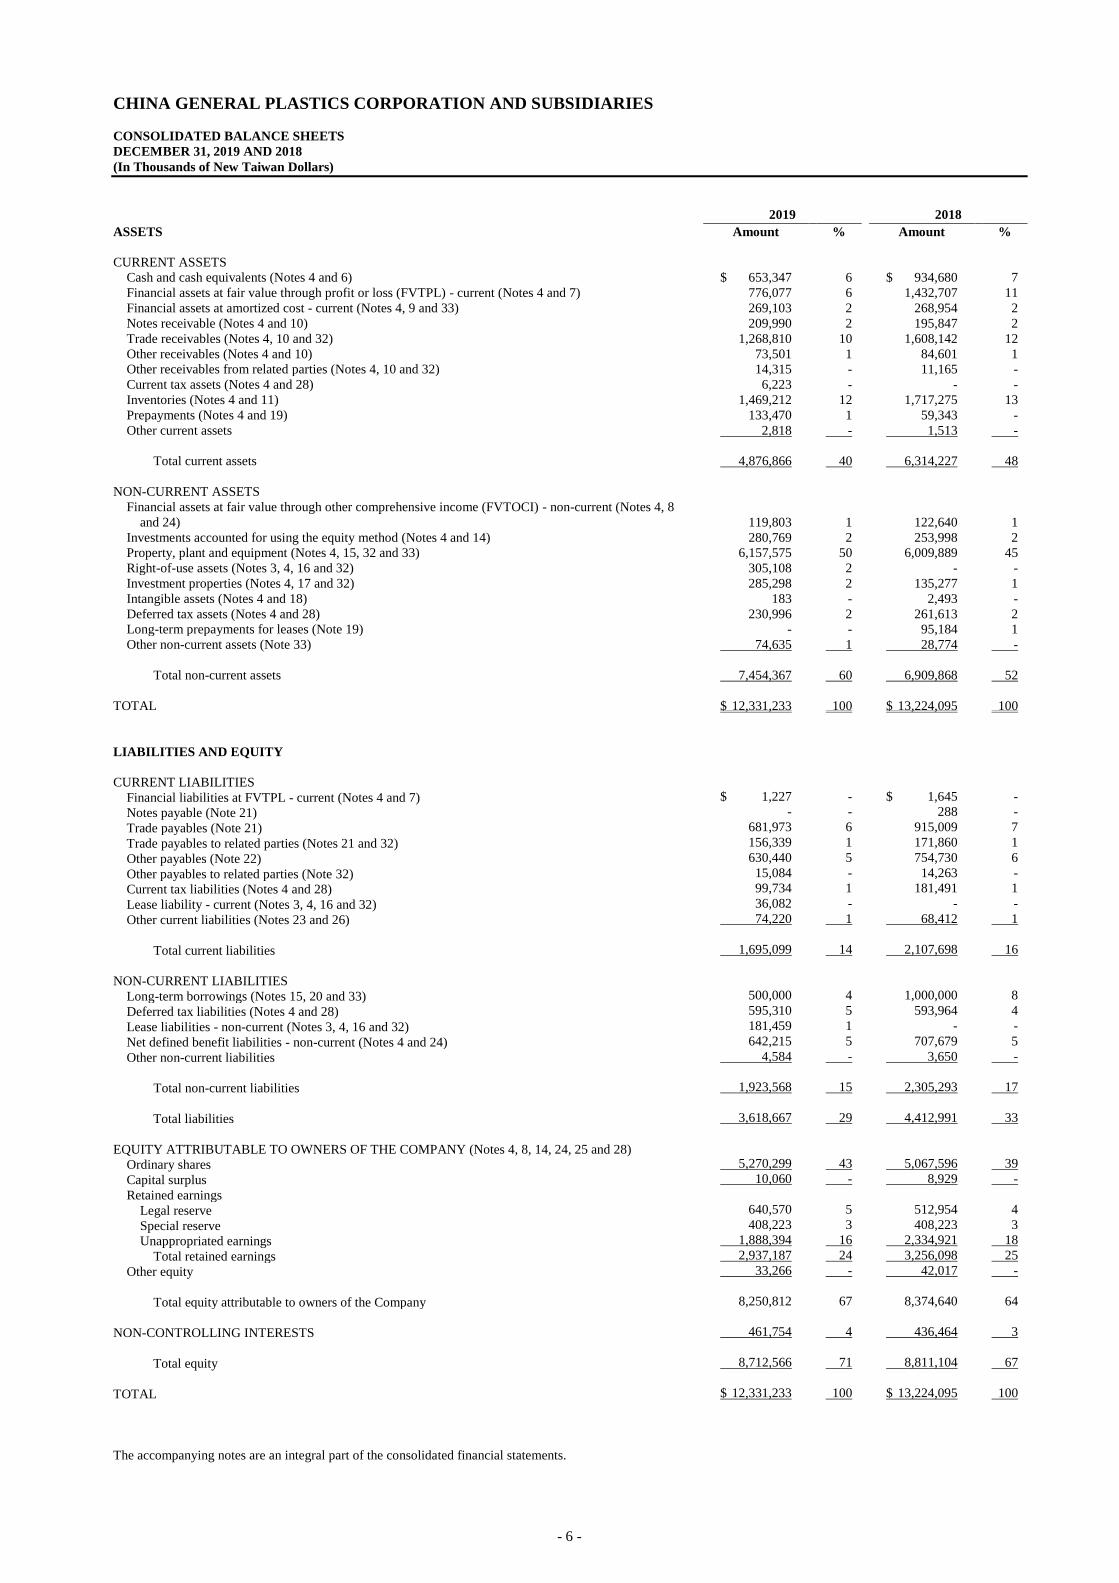
CHINA GENERAL PLASTICS CORPORATION AND SUBSIDIARIES
CONSOLIDATED BALANCE SHEETS
DECEMBER 31, 2019 AND 2018
(In Thousands of New Taiwan Dollars)
2019 2018
ASSETS Amount % Amount %
CURRENT ASSETS
Cash and cash equivalents (Notes 4 and 6) $ 653,347 6 $ 934,680 7
Financial assets at fair value through profit or loss (FVTPL) - current (Notes 4 and 7) 776,077 6 1,432,707 11
Financial assets at amortized cost - current (Notes 4, 9 and 33) 269,103 2 268,954 2
Notes receivable (Notes 4 and 10) 209,990 2 195,847 2
Trade receivables (Notes 4, 10 and 32) 1,268,810 10 1,608,142 12
Other receivables (Notes 4 and 10) 73,501 1 84,601 1
Other receivables from related parties (Notes 4, 10 and 32) 14,315 - 11,165 -
Current tax assets (Notes 4 and 28) 6,223 - - -
Inventories (Notes 4 and 11) 1,469,212 12 1,717,275 13
Prepayments (Notes 4 and 19) 133,470 1 59,343 -
Other current assets 2,818 - 1,513 -
Total current assets 4,876,866 40 6,314,227 48
NON-CURRENT ASSETS
Financial assets at fair value through other comprehensive income (FVTOCI) - non-current (Notes 4, 8
and 24) 119,803 1 122,640 1
Investments accounted for using the equity method (Notes 4 and 14) 280,769 2 253,998 2
Property, plant and equipment (Notes 4, 15, 32 and 33) 6,157,575 50 6,009,889 45
Right-of-use assets (Notes 3, 4, 16 and 32) 305,108 2 - -
Investment properties (Notes 4, 17 and 32) 285,298 2 135,277 1
Intangible assets (Notes 4 and 18) 183 - 2,493 -
Deferred tax assets (Notes 4 and 28) 230,996 2 261,613 2
Long-term prepayments for leases (Note 19) - - 95,184 1
Other non-current assets (Note 33) 74,635 1 28,774 -
Total non-current assets 7,454,367 60 6,909,868 52
TOTAL $ 12,331,233 100 $ 13,224,095 100
LIABILITIES AND EQUITY
CURRENT LIABILITIES
Financial liabilities at FVTPL - current (Notes 4 and 7) $ 1,227 - $ 1,645 -
Notes payable (Note 21) - - 288 -
Trade payables (Note 21) 681,973 6 915,009 7
Trade payables to related parties (Notes 21 and 32) 156,339 1 171,860 1
Other payables (Note 22) 630,440 5 754,730 6
Other payables to related parties (Note 32) 15,084 - 14,263 -
Current tax liabilities (Notes 4 and 28) 99,734 1 181,491 1
Lease liability - current (Notes 3, 4, 16 and 32) 36,082 - - -
Other current liabilities (Notes 23 and 26) 74,220 1 68,412 1
Total current liabilities 1,695,099 14 2,107,698 16
NON-CURRENT LIABILITIES
Long-term borrowings (Notes 15, 20 and 33) 500,000 4 1,000,000 8
Deferred tax liabilities (Notes 4 and 28) 595,310 5 593,964 4
Lease liabilities - non-current (Notes 3, 4, 16 and 32) 181,459 1 - -
Net defined benefit liabilities - non-current (Notes 4 and 24) 642,215 5 707,679 5
Other non-current liabilities 4,584 - 3,650 -
Total non-current liabilities 1,923,568 15 2,305,293 17
Total liabilities 3,618,667 29 4,412,991 33
EQUITY ATTRIBUTABLE TO OWNERS OF THE COMPANY (Notes 4, 8, 14, 24, 25 and 28)
Ordinary shares 5,270,299 43 5,067,596 39
Capital surplus 10,060 - 8,929 -
Retained earnings
Legal reserve 640,570 5 512,954 4
Special reserve 408,223 3 408,223 3
Unappropriated earnings 1,888,394 16 2,334,921 18
Total retained earnings 2,937,187 24 3,256,098 25
Other equity 33,266 - 42,017 -
Total equity attributable to owners of the Company 8,250,812 67 8,374,640 64
NON-CONTROLLING INTERESTS 461,754 4 436,464 3
Total equity 8,712,566 71 8,811,104 67
TOTAL $ 12,331,233 100 $ 13,224,095 100
The accompanying notes are an integral part of the consolidated financial statements.
- 7 -
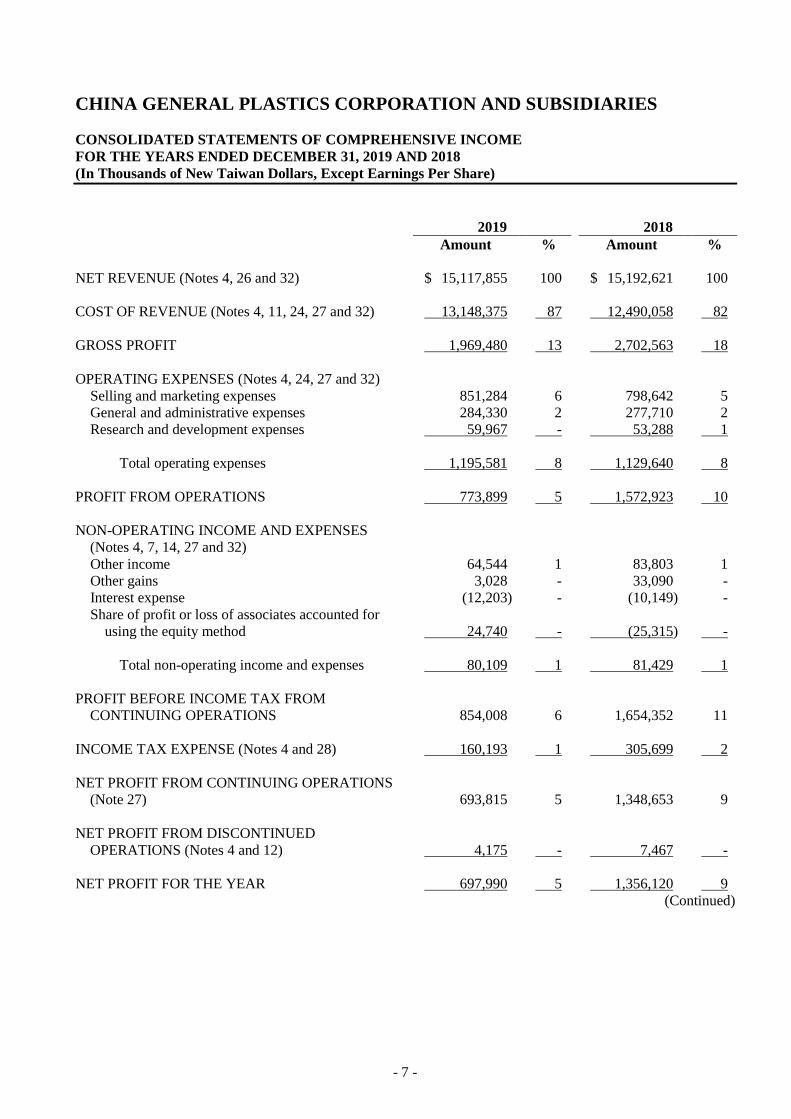
CHINA GENERAL PLASTICS CORPORATION AND SUBSIDIARIES
CONSOLIDATED STATEMENTS OF COMPREHENSIVE INCOME
FOR THE YEARS ENDED DECEMBER 31, 2019 AND 2018
(In Thousands of New Taiwan Dollars, Except Earnings Per Share)
2019 2018
Amount % Amount %
NET REVENUE (Notes 4, 26 and 32) $ 15,117,855 100 $ 15,192,621 100
COST OF REVENUE (Notes 4, 11, 24, 27 and 32) 13,148,375 87 12,490,058 82
GROSS PROFIT 1,969,480 13 2,702,563 18
OPERATING EXPENSES (Notes 4, 24, 27 and 32)
Selling and marketing expenses 851,284 6 798,642 5
General and administrative expenses 284,330 2 277,710 2
Research and development expenses 59,967 - 53,288 1
Total operating expenses 1,195,581 8 1,129,640 8
PROFIT FROM OPERATIONS 773,899 5 1,572,923 10
NON-OPERATING INCOME AND EXPENSES
(Notes 4, 7, 14, 27 and 32)
Other income 64,544 1 83,803 1
Other gains 3,028 - 33,090 -
Interest expense (12,203) - (10,149) -
Share of profit or loss of associates accounted for
using the equity method 24,740 - (25,315) -
Total non-operating income and expenses 80,109 1 81,429 1
PROFIT BEFORE INCOME TAX FROM
CONTINUING OPERATIONS 854,008 6 1,654,352 11
INCOME TAX EXPENSE (Notes 4 and 28) 160,193 1 305,699 2
NET PROFIT FROM CONTINUING OPERATIONS
(Note 27) 693,815 5 1,348,653 9
NET PROFIT FROM DISCONTINUED
OPERATIONS (Notes 4 and 12) 4,175 - 7,467 -
NET PROFIT FOR THE YEAR 697,990 5 1,356,120 9
(Continued)

- 8 -
CHINA GENERAL PLASTICS CORPORATION AND SUBSIDIARIES
CONSOLIDATED STATEMENTS OF COMPREHENSIVE INCOME
FOR THE YEARS ENDED DECEMBER 31, 2019 AND 2018
(In Thousands of New Taiwan Dollars, Except Earnings Per Share)
2019 2018
Amount % Amount %
OTHER COMPREHENSIVE INCOME (LOSS)
(Notes 4, 8, 14, 24, 25 and 28)
Items that will not be reclassified subsequently to
profit or loss:
Remeasurement of defined benefit plans $ 7,692 - $ (591) -
Unrealized gain on investments in equity
instruments at FVTOCI 4,054 - 20,346 -
Share of the other comprehensive income (loss)
of associates accounted for using the equity
method - remeasurement of defined benefit
plans (411) - 462 -
Share of the other comprehensive income (loss) of
associates accounted for using the equity
method - unrealized loss on investments in
equity instruments at FVTOCI 5,175 - (19,493) -
Income tax relating to items that will not be
reclassified subsequently to profit or loss (862) - 7,778 -
15,648 - 8,502 -
Items that may be reclassified subsequently to profit
or loss:
Exchange differences on translating the financial
statements of foreign operations (20,861) - 7,723 -
Share of the other comprehensive loss of
associates accounted for using the equity
method - exchange differences on translating
the financial statements of foreign operations (711) - (400) -
Income tax relating to items that may be
reclassified subsequently to profit or loss 3,634 - (3,565) -
(17,938) - 3,758 -
Other comprehensive income (loss) for the year,
net of income tax (2,290) - 12,260 -
TOTAL COMPREHENSIVE INCOME FOR THE
YEAR $ 695,700 5 $ 1,368,380 9
NET PROFIT ATTRIBUTABLE TO:
Owners of the Company $ 642,677 4 $ 1,276,156 8
Non-controlling interests 55,313 1 79,964 1
$ 697,990 5 $ 1,356,120 9
(Continued)
- 9 -
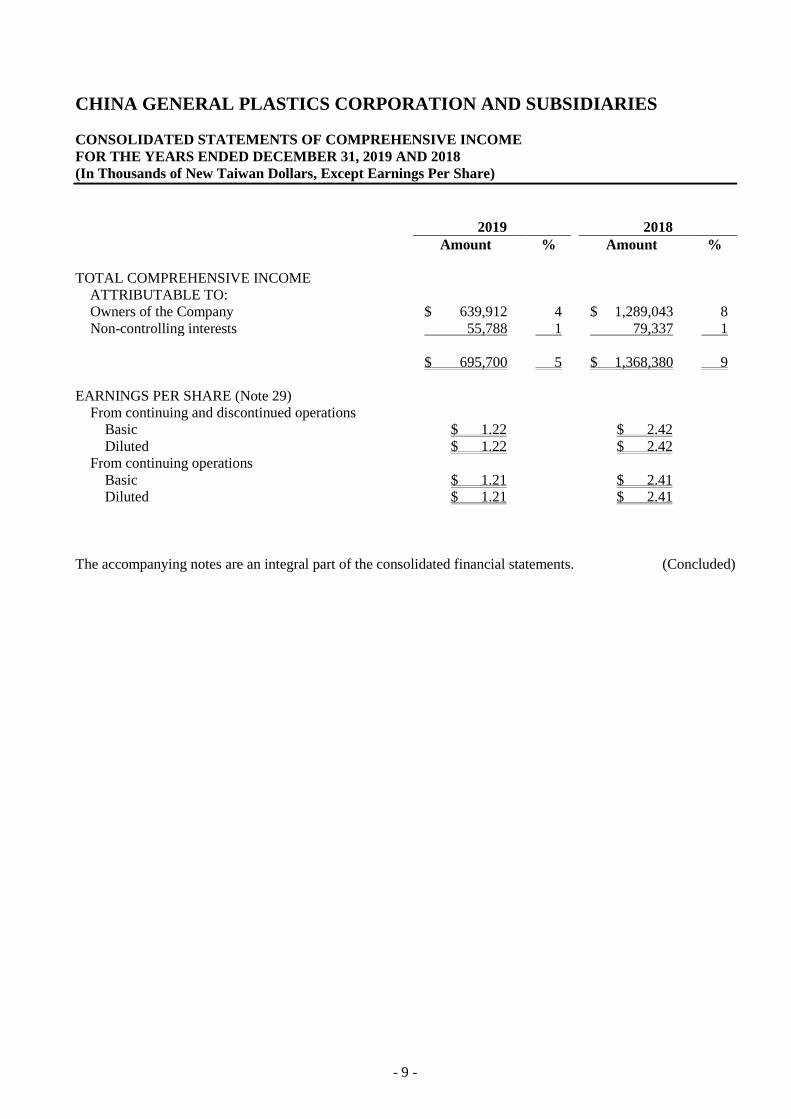
CHINA GENERAL PLASTICS CORPORATION AND SUBSIDIARIES
CONSOLIDATED STATEMENTS OF COMPREHENSIVE INCOME
FOR THE YEARS ENDED DECEMBER 31, 2019 AND 2018
(In Thousands of New Taiwan Dollars, Except Earnings Per Share)
2019 2018
Amount % Amount %
TOTAL COMPREHENSIVE INCOME
ATTRIBUTABLE TO:
Owners of the Company $ 639,912 4 $ 1,289,043 8
Non-controlling interests 55,788 1 79,337 1
$ 695,700 5 $ 1,368,380 9
EARNINGS PER SHARE (Note 29)
From continuing and discontinued operations
Basic $ 1.22 $ 2.42
Diluted $ 1.22 $ 2.42
From continuing operations
Basic $ 1.21 $ 2.41
Diluted $ 1.21 $ 2.41
The accompanying notes are an integral part of the consolidated financial statements. (Concluded)
- 10 -
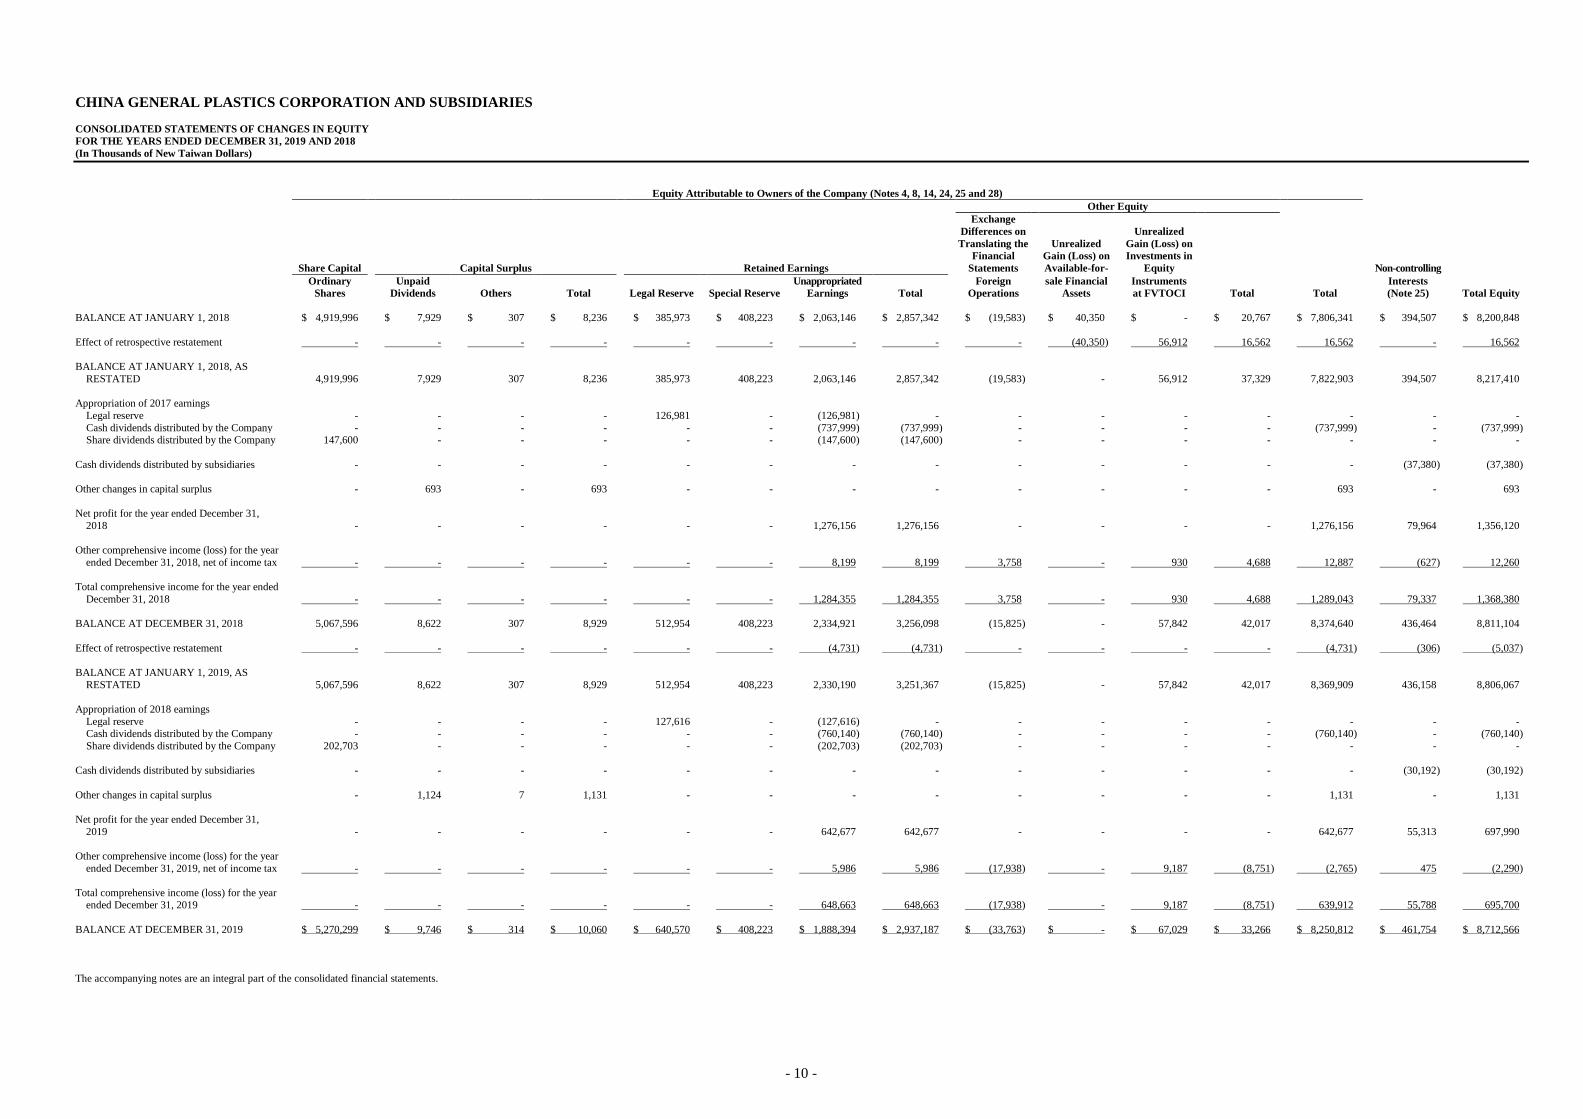
CHINA GENERAL PLASTICS CORPORATION AND SUBSIDIARIES
CONSOLIDATED STATEMENTS OF CHANGES IN EQUITY
FOR THE YEARS ENDED DECEMBER 31, 2019 AND 2018
(In Thousands of New Taiwan Dollars)
Equity Attributable to Owners of the Company (Notes 4, 8, 14, 24, 25 and 28)
Other Equity
Share Capital Capital Surplus Retained Earnings
Exchange
Differences on
Translating the
Financial
Statements
Unrealized
Gain (Loss) on
Available-for-
Unrealized
Gain (Loss) on
Investments in
Equity Non-controlling
Ordinary Unpaid Unappropriated Foreign sale Financial Instruments Interests
Shares Dividends Others Total Legal Reserve Special Reserve Earnings Total Operations Assets at FVTOCI Total Total (Note 25) Total Equity
BALANCE AT JANUARY 1, 2018 $ 4,919,996 $ 7,929 $ 307 $ 8,236 $ 385,973 $ 408,223 $ 2,063,146 $ 2,857,342 $ (19,583 ) $ 40,350 $ - $ 20,767 $ 7,806,341 $ 394,507 $ 8,200,848
Effect of retrospective restatement - - - - - - - - - (40,350 ) 56,912 16,562 16,562 - 16,562
BALANCE AT JANUARY 1, 2018, AS
RESTATED 4,919,996 7,929 307 8,236 385,973 408,223 2,063,146 2,857,342 (19,583 ) - 56,912 37,329 7,822,903 394,507 8,217,410
Appropriation of 2017 earnings
Legal reserve - - - - 126,981 - (126,981 ) - - - - - - - -
Cash dividends distributed by the Company - - - - - - (737,999 ) (737,999 ) - - - - (737,999 ) - (737,999 ) Share dividends distributed by the Company 147,600 - - - - - (147,600 ) (147,600 ) - - - - - - -
Cash dividends distributed by subsidiaries - - - - - - - - - - - - - (37,380 ) (37,380 )
Other changes in capital surplus - 693 - 693 - - - - - - - - 693 - 693
Net profit for the year ended December 31,
2018 - - - - - - 1,276,156 1,276,156 - - - - 1,276,156 79,964 1,356,120
Other comprehensive income (loss) for the year
ended December 31, 2018, net of income tax - - - - - - 8,199 8,199 3,758 - 930 4,688 12,887 (627 ) 12,260
Total comprehensive income for the year ended
December 31, 2018 - - - - - - 1,284,355 1,284,355 3,758 - 930 4,688 1,289,043 79,337 1,368,380
BALANCE AT DECEMBER 31, 2018 5,067,596 8,622 307 8,929 512,954 408,223 2,334,921 3,256,098 (15,825 ) - 57,842 42,017 8,374,640 436,464 8,811,104
Effect of retrospective restatement - - - - - - (4,731 ) (4,731 ) - - - - (4,731 ) (306 ) (5,037 )
BALANCE AT JANUARY 1, 2019, AS
RESTATED 5,067,596 8,622 307 8,929 512,954 408,223 2,330,190 3,251,367 (15,825 ) - 57,842 42,017 8,369,909 436,158 8,806,067
Appropriation of 2018 earnings
Legal reserve - - - - 127,616 - (127,616 ) - - - - - - - - Cash dividends distributed by the Company - - - - - - (760,140 ) (760,140 ) - - - - (760,140 ) - (760,140 )
Share dividends distributed by the Company 202,703 - - - - - (202,703 ) (202,703 ) - - - - - - -
Cash dividends distributed by subsidiaries - - - - - - - - - - - - - (30,192 ) (30,192 )
Other changes in capital surplus - 1,124 7 1,131 - - - - - - - - 1,131 - 1,131
Net profit for the year ended December 31,
2019 - - - - - - 642,677 642,677 - - - - 642,677 55,313 697,990
Other comprehensive income (loss) for the year
ended December 31, 2019, net of income tax - - - - - - 5,986 5,986 (17,938 ) - 9,187 (8,751 ) (2,765 ) 475 (2,290 )
Total comprehensive income (loss) for the year ended December 31, 2019 - - - - - - 648,663 648,663 (17,938 ) - 9,187 (8,751 ) 639,912 55,788 695,700
BALANCE AT DECEMBER 31, 2019 $ 5,270,299 $ 9,746 $ 314 $ 10,060 $ 640,570 $ 408,223 $ 1,888,394 $ 2,937,187 $ (33,763 ) $ - $ 67,029 $ 33,266 $ 8,250,812 $ 461,754 $ 8,712,566
The accompanying notes are an integral part of the consolidated financial statements.
- 11 -
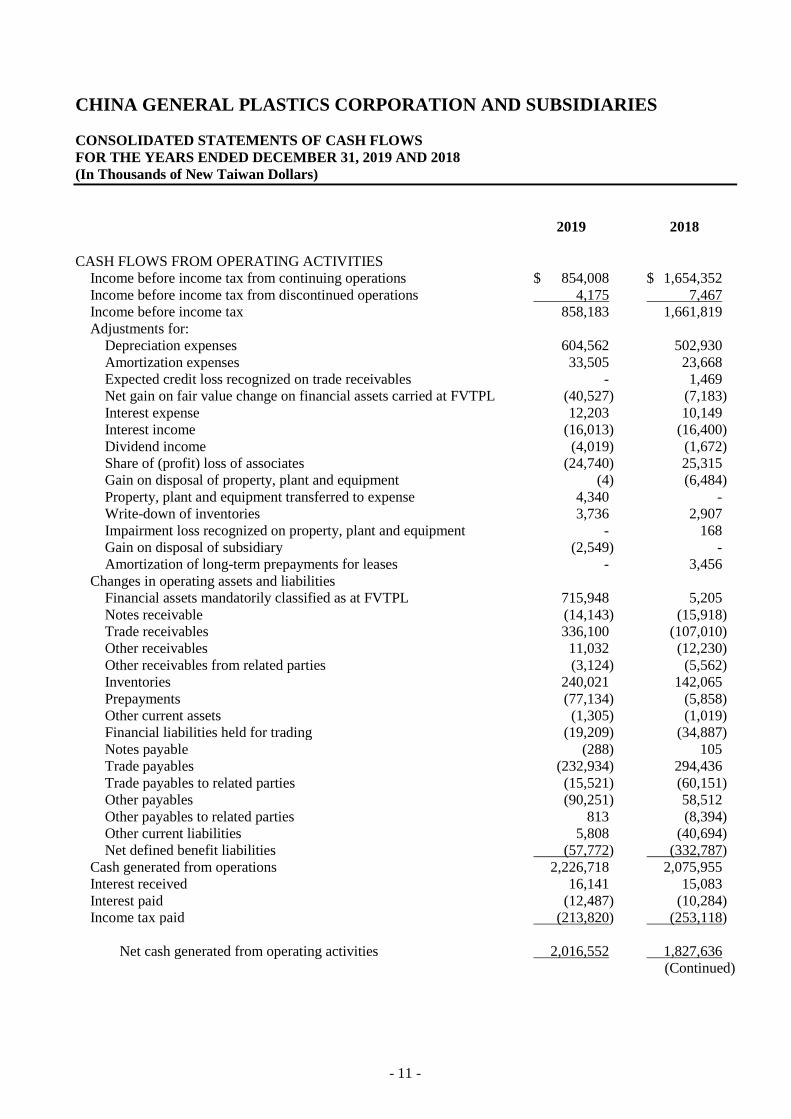
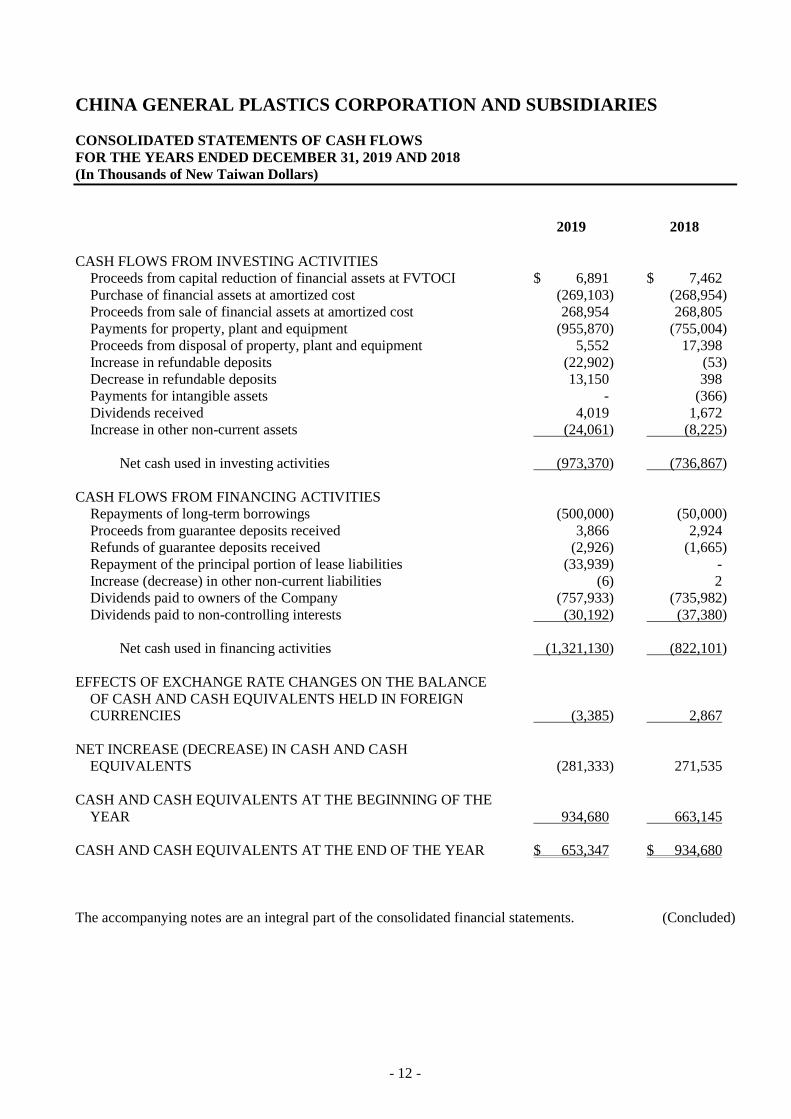
CHINA GENERAL PLASTICS CORPORATION AND SUBSIDIARIES
CONSOLIDATED STATEMENTS OF CASH FLOWS
FOR THE YEARS ENDED DECEMBER 31, 2019 AND 2018
(In Thousands of New Taiwan Dollars)
2019 2018
CASH FLOWS FROM OPERATING ACTIVITIES
Income before income tax from continuing operations $ 854,008 $ 1,654,352
Income before income tax from discontinued operations 4,175 7,467
Income before income tax 858,183 1,661,819
Adjustments for:
Depreciation expenses 604,562 502,930
Amortization expenses 33,505 23,668
Expected credit loss recognized on trade receivables - 1,469
Net gain on fair value change on financial assets carried at FVTPL (40,527) (7,183)
Interest expense 12,203 10,149
Interest income (16,013) (16,400)
Dividend income (4,019) (1,672)
Share of (profit) loss of associates (24,740) 25,315
Gain on disposal of property, plant and equipment (4) (6,484)
Property, plant and equipment transferred to expense 4,340 -
Write-down of inventories 3,736 2,907
Impairment loss recognized on property, plant and equipment - 168
Gain on disposal of subsidiary (2,549) -
Amortization of long-term prepayments for leases - 3,456
Changes in operating assets and liabilities
Financial assets mandatorily classified as at FVTPL 715,948 5,205
Notes receivable (14,143) (15,918)
Trade receivables 336,100 (107,010)
Other receivables 11,032 (12,230)
Other receivables from related parties (3,124) (5,562)
Inventories 240,021 142,065
Prepayments (77,134) (5,858)
Other current assets (1,305) (1,019)
Financial liabilities held for trading (19,209) (34,887)
Notes payable (288) 105
Trade payables (232,934) 294,436
Trade payables to related parties (15,521) (60,151)
Other payables (90,251) 58,512
Other payables to related parties 813 (8,394)
Other current liabilities 5,808 (40,694)
Net defined benefit liabilities (57,772) (332,787)
Cash generated from operations 2,226,718 2,075,955
Interest received 16,141 15,083
Interest paid (12,487) (10,284)
Income tax paid (213,820) (253,118)
Net cash generated from operating activities 2,016,552 1,827,636
(Continued)
- 12 -
CHINA GENERAL PLASTICS CORPORATION AND SUBSIDIARIES
CONSOLIDATED STATEMENTS OF CASH FLOWS
FOR THE YEARS ENDED DECEMBER 31, 2019 AND 2018
(In Thousands of New Taiwan Dollars)
2019 2018
CASH FLOWS FROM INVESTING ACTIVITIES
Proceeds from capital reduction of financial assets at FVTOCI $ 6,891 $ 7,462
Purchase of financial assets at amortized cost (269,103) (268,954)
Proceeds from sale of financial assets at amortized cost 268,954 268,805
Payments for property, plant and equipment (955,870) (755,004)
Proceeds from disposal of property, plant and equipment 5,552 17,398
Increase in refundable deposits (22,902) (53)
Decrease in refundable deposits 13,150 398
Payments for intangible assets - (366)
Dividends received 4,019 1,672
Increase in other non-current assets (24,061) (8,225)
Net cash used in investing activities (973,370) (736,867)
CASH FLOWS FROM FINANCING ACTIVITIES
Repayments of long-term borrowings (500,000) (50,000)
Proceeds from guarantee deposits received 3,866 2,924
Refunds of guarantee deposits received (2,926) (1,665)
Repayment of the principal portion of lease liabilities (33,939) -
Increase (decrease) in other non-current liabilities (6) 2
Dividends paid to owners of the Company (757,933) (735,982)
Dividends paid to non-controlling interests (30,192) (37,380)
Net cash used in financing activities (1,321,130) (822,101)
EFFECTS OF EXCHANGE RATE CHANGES ON THE BALANCE
OF CASH AND CASH EQUIVALENTS HELD IN FOREIGN
CURRENCIES (3,385) 2,867
NET INCREASE (DECREASE) IN CASH AND CASH
EQUIVALENTS (281,333) 271,535
CASH AND CASH EQUIVALENTS AT THE BEGINNING OF THE
YEAR 934,680 663,145
CASH AND CASH EQUIVALENTS AT THE END OF THE YEAR $ 653,347 $ 934,680
The accompanying notes are an integral part of the consolidated financial statements. (Concluded)
- 13 -
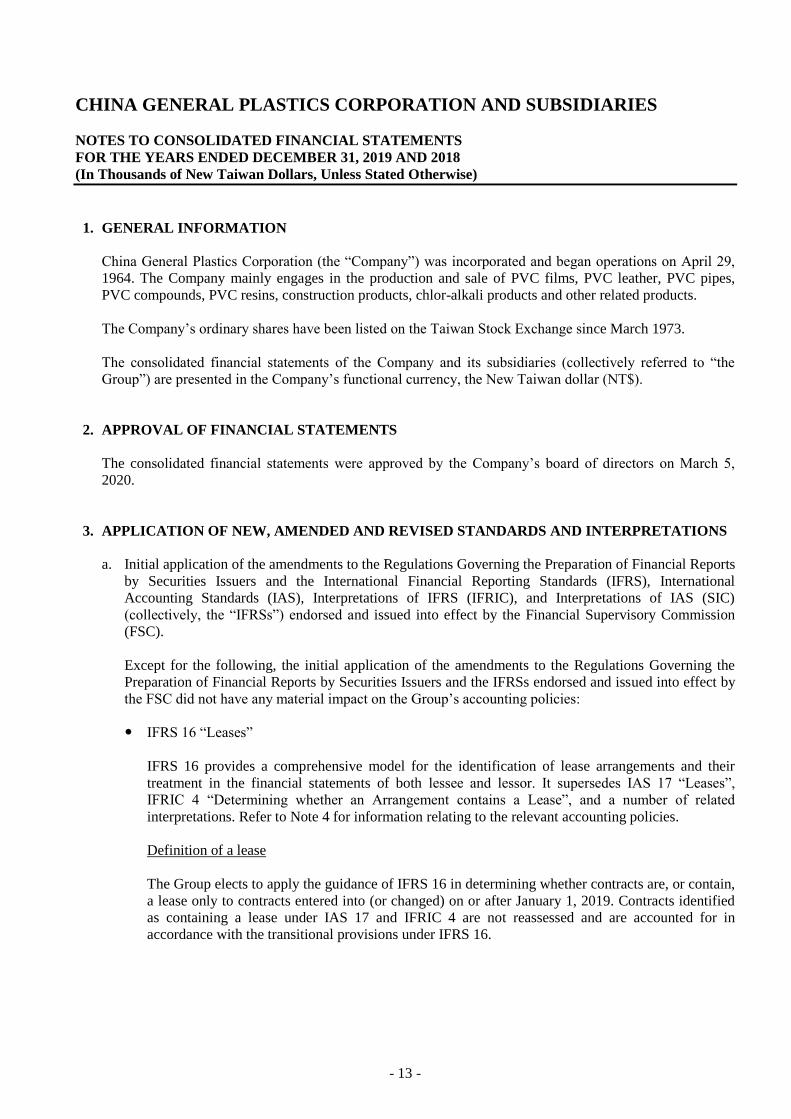
CHINA GENERAL PLASTICS CORPORATION AND SUBSIDIARIES
NOTES TO CONSOLIDATED FINANCIAL STATEMENTS
FOR THE YEARS ENDED DECEMBER 31, 2019 AND 2018
(In Thousands of New Taiwan Dollars, Unless Stated Otherwise)
1. GENERAL INFORMATION
China General Plastics Corporation (the “Company”) was incorporated and began operations on April 29,
1964. The Company mainly engages in the production and sale of PVC films, PVC leather, PVC pipes,
PVC compounds, PVC resins, construction products, chlor-alkali products and other related products.
The Company’s ordinary shares have been listed on the Taiwan Stock Exchange since March 1973.
The consolidated financial statements of the Company and its subsidiaries (collectively referred to “the
Group”) are presented in the Company’s functional currency, the New Taiwan dollar (NT$).
2. APPROVAL OF FINANCIAL STATEMENTS
The consolidated financial statements were approved by the Company’s board of directors on March 5,
2020.
3. APPLICATION OF NEW, AMENDED AND REVISED STANDARDS AND INTERPRETATIONS
a. Initial application of the amendments to the Regulations Governing the Preparation of Financial Reports
by Securities Issuers and the International Financial Reporting Standards (IFRS), International
Accounting Standards (IAS), Interpretations of IFRS (IFRIC), and Interpretations of IAS (SIC)
(collectively, the “IFRSs”) endorsed and issued into effect by the Financial Supervisory Commission
(FSC).
Except for the following, the initial application of the amendments to the Regulations Governing the
Preparation of Financial Reports by Securities Issuers and the IFRSs endorsed and issued into effect by
the FSC did not have any material impact on the Group’s accounting policies:
IFRS 16 “Leases”
IFRS 16 provides a comprehensive model for the identification of lease arrangements and their
treatment in the financial statements of both lessee and lessor. It supersedes IAS 17 “Leases”,
IFRIC 4 “Determining whether an Arrangement contains a Lease”, and a number of related
interpretations. Refer to Note 4 for information relating to the relevant accounting policies.
Definition of a lease
The Group elects to apply the guidance of IFRS 16 in determining whether contracts are, or contain,
a lease only to contracts entered into (or changed) on or after January 1, 2019. Contracts identified
as containing a lease under IAS 17 and IFRIC 4 are not reassessed and are accounted for in
accordance with the transitional provisions under IFRS 16.
- 14 -
The Group as lessee
The Group recognizes right-of-use assets and lease liabilities for all leases on the consolidated
balance sheets except for those whose payments under low-value asset and short-term leases are
recognized as expenses on a straight-line basis. On the consolidated statements of comprehensive
income, the Group presents the depreciation expense charged on right-of-use assets separately from
the interest expense accrued on lease liabilities; interest is computed using the effective interest
method. On the consolidated statements of cash flows, cash payments for the principal portion of
lease liabilities are classified within financing activities; cash payments for the interest portion are
classified within operating activities. Prior to the application of IFRS 16, payments under operating
lease contracts, were recognized as expenses on a straight-line basis. Prepaid lease payments for
land use rights in China were recognized as prepayments for leases. Cash flows for operating leases
were classified within operating activities on the consolidated statements of cash flows.
The Group elects to apply IFRS 16 retrospectively with the cumulative effect of the initial
application of this standard recognized in retained earnings on January 1, 2019. Comparative
information is not restated.
Lease liabilities were recognized on January 1, 2019 for leases previously classified as operating
leases under IAS 17. Lease liabilities were measured at the present value of the remaining lease
payments, discounted using the lessee’s incremental borrowing rate on January 1, 2019. The Group
applies IAS 36 to all right-of-use assets.
The Group also applies the following practical expedients:
1) The Group applies a single discount rate to a portfolio of leases with reasonably similar
characteristics to measure lease liabilities.
2) The Group accounts for those leases for which the lease term ends on or before December 31,
2019 as short-term leases.
3) The Group excludes initial direct costs from the measurement of right-of-use assets on January
1, 2019.
4) The Group uses hindsight, such as in determining lease terms, to measure lease liabilities.
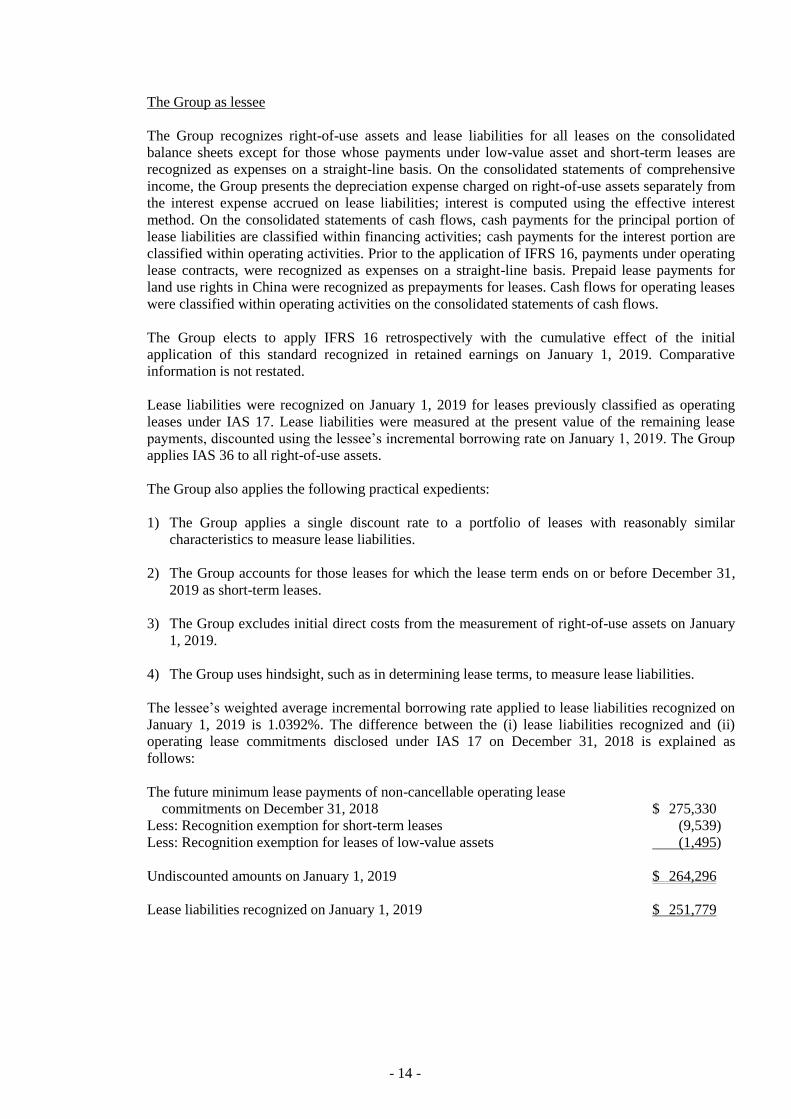
The lessee’s weighted average incremental borrowing rate applied to lease liabilities recognized on
January 1, 2019 is 1.0392%. The difference between the (i) lease liabilities recognized and (ii)
operating lease commitments disclosed under IAS 17 on December 31, 2018 is explained as
follows:
The future minimum lease payments of non-cancellable operating lease
commitments on December 31, 2018 $ 275,330
Less: Recognition exemption for short-term leases (9,539)
Less: Recognition exemption for leases of low-value assets (1,495)
Undiscounted amounts on January 1, 2019 $ 264,296
Lease liabilities recognized on January 1, 2019 $ 251,779
- 15 -
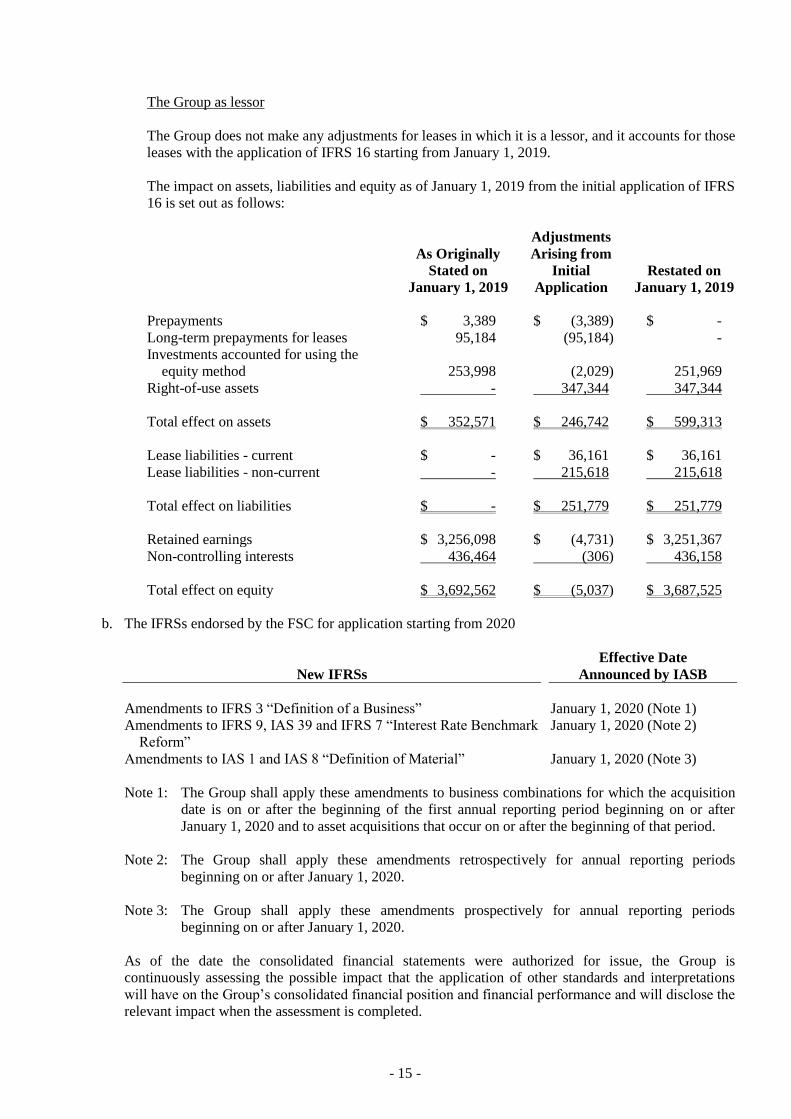
The Group as lessor
The Group does not make any adjustments for leases in which it is a lessor, and it accounts for those
leases with the application of IFRS 16 starting from January 1, 2019.
The impact on assets, liabilities and equity as of January 1, 2019 from the initial application of IFRS
16 is set out as follows:
As Originally
Stated on
January 1, 2019
Adjustments
Arising from
Initial
Application
Restated on
January 1, 2019
Prepayments $ 3,389 $ (3,389) $ -
Long-term prepayments for leases 95,184 (95,184) -
Investments accounted for using the
equity method 253,998 (2,029) 251,969
Right-of-use assets - 347,344 347,344
Total effect on assets $ 352,571 $ 246,742 $ 599,313
Lease liabilities - current $ - $ 36,161 $ 36,161
Lease liabilities - non-current - 215,618 215,618
Total effect on liabilities $ - $ 251,779 $ 251,779
Retained earnings $ 3,256,098 $ (4,731) $ 3,251,367
Non-controlling interests 436,464 (306) 436,158
Total effect on equity $ 3,692,562 $ (5,037) $ 3,687,525
b. The IFRSs endorsed by the FSC for application starting from 2020
New IFRSs
Effective Date
Announced by IASB
Amendments to IFRS 3 “Definition of a Business” January 1, 2020 (Note 1)
Amendments to IFRS 9, IAS 39 and IFRS 7 “Interest Rate Benchmark
Reform”
January 1, 2020 (Note 2)
Amendments to IAS 1 and IAS 8 “Definition of Material” January 1, 2020 (Note 3)
Note 1: The Group shall apply these amendments to business combinations for which the acquisition
date is on or after the beginning of the first annual reporting period beginning on or after
January 1, 2020 and to asset acquisitions that occur on or after the beginning of that period.
Note 2: The Group shall apply these amendments retrospectively for annual reporting periods
beginning on or after January 1, 2020.
Note 3: The Group shall apply these amendments prospectively for annual reporting periods
beginning on or after January 1, 2020.
As of the date the consolidated financial statements were authorized for issue, the Group is
continuously assessing the possible impact that the application of other standards and interpretations
will have on the Group’s consolidated financial position and financial performance and will disclose the
relevant impact when the assessment is completed.

- 16 -
c. New IFRSs in issue but not yet endorsed and issued into effect by the FSC
New IFRSs
Effective Date
Announced by IASB (Note)
Amendments to IFRS 10 and IAS 28 “Sale or Contribution of Assets
between an Investor and its Associate or Joint Venture”
To be determined by IASB
IFRS 17 “Insurance Contracts” January 1, 2021
Amendments to IAS 1 “Classification of Liabilities as Current or Non-
current”
January 1, 2022
Note: Unless stated otherwise, the above New IFRSs are effective for annual reporting periods
beginning on or after their respective effective dates.
As of the date the consolidated financial statements were authorized for issue, the Group is
continuously assessing the possible impact that the application of other standards and interpretations
will have on the Group’s consolidated financial position and financial performance and will disclose the
relevant impact when the assessment is completed.
4. SUMMARY OF SIGNIFICANT ACCOUNTING POLICIES
a. Statement of compliance
The consolidated financial statements have been prepared in accordance with the Regulations
Governing the Preparation of Financial Reports by Securities Issuers and IFRSs as endorsed and issued
into effect by the FSC.
b. Basis of preparation
The consolidated financial statements have been prepared on the historical cost basis except for
financial instruments which are measured at fair value and net defined benefit liabilities which are
measured at the present value of the defined benefit obligation less the fair value of plan assets.
The fair value measurements, which are grouped into Levels 1 to 3 based on the degree to which the
fair value measurement inputs are observable and based on the significance of the inputs to the fair
value measurement in its entirety, are described as follows:
1) Level 1 inputs are quoted prices (unadjusted) in active markets for identical assets or liabilities;
2) Level 2 inputs are inputs other than quoted prices included within Level 1 that are observable for an
asset or liability, either directly (i.e., as prices) or indirectly (i.e., derived from prices); and
3) Level 3 inputs are unobservable inputs for an asset or liability.
c. Classification of current and non-current assets and liabilities
Current assets include:
1) Assets held primarily for the purpose of trading;
2) Assets expected to be realized within 12 months after the reporting period; and
3) Cash and cash equivalents unless the asset is restricted from being exchanged or used to settle a
liability for at least 12 months after the reporting period.

- 17 -
Current liabilities include:
1) Liabilities held primarily for the purpose of trading;
2) Liabilities due to be settled within 12 months after the reporting period; and
3) Liabilities for which the Group does not have an unconditional right to defer settlement for at least
12 months after the reporting period.
Assets and liabilities that are not classified as current are classified as non-current.
d. Basis of consolidation
The consolidated financial statements incorporate the financial statements of the Company and the
entities controlled by the Company (i.e., its subsidiaries).
Income and expenses of subsidiaries acquired or disposed of during the period are included in the
consolidated statement of profit or loss and other comprehensive income from the effective dates of
acquisitions up to the effective dates of disposals, as appropriate.
When necessary, adjustments are made to the financial statements of subsidiaries to bring their
accounting policies into line with those used by the Company.
All intra-group transactions, balances, income and expenses are eliminated in full upon consolidation.
Total comprehensive income of subsidiaries is attributed to the owners of the Company and to the
non-controlling interests even if this results in the non-controlling interests having a deficit balance.
Changes in the Group’s ownership interests in subsidiaries that do not result in the Group losing control
over the subsidiaries are accounted for as equity transactions. The carrying amounts of the interests of
the Group and the non-controlling interests are adjusted to reflect the changes in their relative interests
in the subsidiaries. Any difference between the amount by which the non-controlling interests are
adjusted and the fair value of the consideration paid or received is recognized directly in equity and
attributed to the owners of the Company.
See Note 13 and Tables 7 and 8 for detailed information on subsidiaries (including the percentages of
ownership and main businesses).
e. Foreign currencies
In preparing the financial statements of each individual entity, transactions in currencies other than the
entity’s functional currency (i.e., foreign currencies) are recognized at the rates of exchange prevailing
at the dates of the transactions.
At the end of each reporting period, monetary items denominated in foreign currencies are retranslated
at the rates prevailing at that date. Exchange differences on monetary items arising from settlement or
translation are recognized in profit or loss in the period.
Non-monetary items measured at fair value that are denominated in foreign currencies are retranslated
at the rates prevailing at the date when the fair value was determined. Exchange differences arising
from the retranslation of non-monetary items are included in profit or loss for the period except for
exchange differences arising from the retranslation of non-monetary items in respect of which gains and
losses are recognized directly in other comprehensive income, in which case, the exchange differences
are also recognized directly in other comprehensive income.
- 18 -
Non-monetary items that are measured at historical cost in a foreign currency are translated using the
exchange rate at the date of the transaction.
For the purpose of presenting consolidated financial statements, the functional currencies of foreign
operations (including subsidiaries and associates in other countries that use currencies which are
different from the currency of the Company) are translated into the presentation currency, the New
Taiwan dollar, as follows: Assets and liabilities are translated at the exchange rates prevailing at the end
of the reporting period; and income and expense items are translated at the average exchange rates for
the period. The resulting currency translation differences are recognized in other comprehensive income
(attributed to the owners of the Company and non-controlling interests as appropriate).
On the disposal of a foreign operation (i.e., a disposal of the Company’s entire interest in a foreign
operation, or a disposal involving the loss of control over a subsidiary that includes a foreign operation,
or a partial disposal of an associate that includes a foreign operation of which the retained interest
becomes a financial asset), all of the exchange differences accumulated in equity in respect of that
operation which are attributable to the owners of the Company are reclassified to profit or loss.
f. Inventories
Inventories consist of raw materials, finished goods and work in progress and are stated at the lower of
cost or net realizable value. Inventory write-downs are made by item, except where it may be
appropriate to group similar or related items. The net realizable value is the estimated selling price of
inventories less all estimated costs of completion and costs necessary to make the sale. Inventories are
recorded at the weighted-average cost on the balance sheet date.
g. Investments in associates
An associate is an entity over which the Group has significant influence and that is not a subsidiary.
The Group uses the equity method to account for its investments in associates.
Under the equity method, investments in an associate are initially recognized at cost and adjusted
thereafter to recognize the Group’s share of the profit or loss and other comprehensive income of the
associate. The Group also recognizes the changes in the Group’s share of the equity of associates
attributable to Group.
When the Company subscribes for additional new shares of an associate at a percentage different from
its existing ownership percentage, the resulting carrying amount of the investment differs from the
amount of the Group’s proportionate interest in the associate. The Group records such a difference as an
adjustment to investments with the corresponding amount charged or credited to capital surplus -
changes in capital surplus from investments in associates accounted for using the equity method. If the
Group’s ownership interest is reduced due to its additional subscription of the new shares of the
associate, the proportionate amount of the gains or losses previously recognized in other comprehensive
income in relation to that associate is reclassified to profit or loss on the same basis as would be
required if the investee had directly disposed of the related assets or liabilities. When the adjustment
should be debited to capital surplus, but the capital surplus recognized from investments accounted for
using the equity method is insufficient, the shortage is debited to retained earnings.
When the Group’s share of losses of an associate equals or exceeds its interest in that associate (which
includes any carrying amount of the investment accounted for using the equity method and long-term
interests that, in substance, form part of the Group’s net investment in the associate), the Group
discontinues recognizing its share of further losses. Additional losses and liabilities are recognized only
to the extent that the Group has incurred legal obligations, or constructive obligations, or made
payments on behalf of that associate.

- 19 -
The entire carrying amount of an investment is tested for impairment as a single asset by comparing its
recoverable amount with its carrying amount. Any impairment loss recognized forms part of the
carrying amount of the investment. Any reversal of that impairment loss is recognized to the extent that
the recoverable amount of the investment subsequently increases.
The Group discontinues the use of the equity method from the date on which its investment ceases to be
an associate. Any retained investment is measured at fair value at that date, and the fair value is
regarded as the investment’s fair value on initial recognition as a financial asset. The difference
between the previous carrying amount of the associate attributable to the retained interest and its fair
value is included in the determination of the gain or loss on disposal of the associate. The Group
accounts for all amounts previously recognized in other comprehensive income in relation to that
associate on the same basis as would be required if that associate had directly disposed of the related
assets or liabilities.
When a group entity transacts with its associate, profits and losses resulting from the transactions with
the associate are recognized in the Group’ consolidated financial statements only to the extent that
interests in the associate are not related to the Group.
h. Property, plant and equipment
Property, plant and equipment are measured at cost less accumulated depreciation and accumulated
impairment loss.
Property, plant and equipment in the course of construction are carried at cost less any recognized
impairment loss. Cost includes professional fees and borrowing costs eligible for capitalization. Such
assets are depreciated and classified to the appropriate categories of property, plant and equipment
when completed and ready for their intended use.
Depreciation on property, plant and equipment is recognized using the straight-line method and unit of
production method. Each significant part is depreciated separately. If a lease term is shorter than the
assets’ useful lives, such assets are depreciated over the lease term. The estimated useful lives, residual
values and depreciation methods are reviewed at the end of each reporting period, with the effects of
any changes in the estimates accounted for on a prospective basis.
On derecognition of an item of property, plant and equipment, the difference between the sales proceeds
and the carrying amount of the asset is recognized in profit or loss.
i. Investment properties
Investment properties are properties held to earn rentals and/or for capital appreciation.
Investment properties are initially measured at cost, including transaction cost. Subsequent to initial
recognition, investment properties are measured at cost less accumulated depreciation and accumulated
impairment loss. Depreciation is recognized using the straight-line method.
For a transfer of classification from property, plant and equipment to investment properties, the deemed
cost of an item of property from subsequent accounting is its carrying amount at the end of
owner-occupation.
On derecognition of an investment property, the difference between the net disposal proceeds and the
carrying amount of the asset is included in profit or loss.
- 20 -
j. Intangible assets
1) Intangible assets acquired separately
Intangible assets with finite useful lives that are acquired separately are initially measured at cost
and subsequently measured at cost less accumulated amortization and accumulated impairment loss.
Amortization is recognized on a straight-line basis. The estimated useful lives, residual values, and
amortization methods are reviewed at the end of each year, with the effects of any changes in the
estimates accounted for on a prospective basis.
2) Derecognition of intangible assets
On derecognition of an intangible asset, the difference between the net disposal proceeds and the
carrying amount of the asset are recognized in profit or loss.
k. Impairment of tangible and intangible assets other than goodwill
At the end of each reporting period, the Group reviews the carrying amounts of its tangible and
intangible assets, excluding goodwill, to determine whether there is any indication that those assets
have suffered any impairment loss. If any such indication exists, the recoverable amount of the asset is
estimated in order to determine the extent of the impairment loss. When it is not possible to estimate the
recoverable amount of an individual asset, the Group estimates the recoverable amount of the
cash-generating unit to which the asset belongs. Corporate assets are allocated to the smallest group of
cash-generating units on a reasonable and consistent basis of allocation.
The recoverable amount is the higher of fair value less costs to sell and value in use. If the recoverable
amount of an asset or cash-generating unit is estimated to be less than its carrying amount, the carrying
amount of the asset or cash-generating unit is reduced to its recoverable amount, with the resulting
impairment loss recognized in profit or loss.
When an impairment loss is subsequently reversed, the carrying amount of the corresponding asset or
cash-generating unit is increased to the revised estimate of its recoverable amount, but only to the extent
of the carrying amount that would have been determined had no impairment loss been recognized for
the asset or cash-generating unit in prior years. A reversal of an impairment loss is recognized in profit
or loss.
l. Financial instruments
Financial assets and financial liabilities are recognized when a group entity becomes a party to the
contractual provisions of the instruments.
Financial assets and financial liabilities are initially measured at fair value. Transaction costs that are
directly attributable to an acquisition or issuance of financial assets and financial liabilities (other than
financial assets and financial liabilities at FVTPL) are added to or deducted from the fair value of the
financial assets or financial liabilities, as appropriate, on initial recognition. Transaction costs directly
attributable to the acquisition of financial assets or financial liabilities at FVTPL are recognized
immediately in profit or loss.
1) Financial assets
All regular way purchases or sales of financial assets are recognized and derecognized on a trade
date basis.
- 21 -
a) Measurement categories
Financial assets are classified into the following categories: Financial assets at FVTPL, financial
assets at amortized cost and investments in equity instruments at FVTOCI.
i. Financial assets at FVTPL
Financial assets are classified as at FVTPL when such a financial asset is mandatorily
classified as at FVTPL. Financial assets mandatorily classified as at FVTPL include
investments in equity instruments which are not designated as at FVTOCI and derivative
instruments and fund beneficiary certificates that do not meet the amortized cost criteria or
the FVTOCI criteria.
Financial assets at FVTPL are subsequently measured at fair value, with any gains or losses
arising on remeasurement recognized in profit or loss. The net gain or loss recognized in
profit or loss does not incorporate any dividends or interest earned on such a financial asset.
Fair value is determined in the manner described in Note 31.
ii. Financial assets at amortized cost
Financial assets that meet the following conditions are subsequently measured at amortized
cost:
The financial asset is held within a business model whose objective is to hold financial
assets in order to collect contractual cash flows; and
The contractual terms of the financial asset give rise on specified dates to cash flows
that are solely payments of principal and interest on the principal amount outstanding.
Subsequent to initial recognition, financial assets at amortized cost, including cash and cash
equivalents, notes receivable at amortized cost, trade receivables, other receivables, pledged
time deposits and refundable deposits, are measured at amortized cost, which equals the
gross carrying amount determined using the effective interest method less any impairment
loss. Exchange differences are recognized in profit or loss.
Interest income is calculated by applying the effective interest rate to the gross carrying
amount of a financial asset, except for:
Purchased or originated credit-impaired financial assets, for which interest income is
calculated by applying the credit adjusted effective interest rate to the amortized cost of
such a financial asset; and
Financial assets that are not credit impaired on purchase or origination but have
subsequently become credit impaired, for which interest income is calculated by
applying the effective interest rate to the amortized cost of such financial assets in
subsequent reporting periods.
A financial asset is credit impaired when significant financial difficulty of the issuer or the
borrower, breach of contract, it is becoming probable that the borrower will enter
bankruptcy or undergo a financial reorganization or the disappearance of an active market
for that financial asset because of financial difficulties have occurred.
Cash equivalents include time deposits and reverse repurchase agreements collateralized by
bonds, which are highly liquid, readily convertible to a known amount of cash and are
subject to an insignificant risk of changes in value. These cash equivalents are held for the
purpose of meeting short-term cash commitments.
- 22 -
iii. Investments in equity instruments at FVTOCI
On initial recognition, the Group may make an irrevocable election to designate investments
in equity instruments as at FVTOCI. Designation as at FVTOCI is not permitted if the
equity investment is held for trading or if it is contingent consideration recognized by an
acquirer in a business combination.
Investments in equity instruments at FVTOCI are subsequently measured at fair value with
gains and losses arising from changes in fair value recognized in other comprehensive
income and accumulated in other equity. The cumulative gain or loss will not be reclassified
to profit or loss on disposal of the equity investments; instead, they will be transferred to
retained earnings.
Dividends on these investments in equity instruments are recognized in profit or loss when
the Group’s right to receive the dividends is established, unless the dividends clearly
represent a recovery of part of the cost of the investment.
b) Impairment of financial assets
The Group recognizes a loss allowance for expected credit losses on financial assets at
amortized cost (including trade receivables).
The Group always recognizes lifetime expected credit losses (ECLs) for trade receivables. For
all other financial instruments, the Group recognizes lifetime ECLs when there has been a
significant increase in credit risk since initial recognition. If, on the other hand, the credit risk on
a financial instrument has not increased significantly since initial recognition, the Group
measures the loss allowance for that financial instrument at an amount equal to 12-month ECLs.
Expected credit losses reflect the weighted average of credit losses with the respective risks of
default occurring as the weights. Lifetime ECLs represent the expected credit losses that will
result from all possible default events over the expected life of a financial instrument. In
contrast, 12-month ECLs represent the portion of lifetime ECLs that is expected to result from
default events on a financial instrument that are possible within 12 months after the reporting
date.
For internal credit risk management purposes, the Group determines that the following
situations indicate that a financial asset is in default (without taking into account any collateral
held by the Group):
i. Internal or external information show that the debtor is unlikely to pay its creditors.
ii. When a financial asset is more than specific days past due unless the Group has reasonable
and corroborative information to support a more lagged default criterion.
The impairment loss of all financial assets is recognized in profit or loss by a reduction in their
carrying amounts through a loss allowance account.
c) Derecognition of financial assets
The Group derecognizes a financial asset only when the contractual rights to the cash flows
from the asset expire or when it transfers the financial asset and substantially all the risks and
rewards of ownership of the asset to another party.
- 23 -
On derecognition of a financial asset at amortized cost in its entirety, the difference between the
asset’s carrying amount and the sum of the consideration received and receivable is recognized
in profit or loss. On derecognition of an investment in an equity instrument at FVTOCI, the
difference between the asset’s carrying amount and the sum of the consideration received and
receivable is recognized in profit or loss, and the cumulative gain or loss which had been
recognized in other comprehensive income is transferred directly to retained earnings, without
recycling through profit or loss.
2) Financial liabilities
a) Subsequent measurement
Except the derivative instruments, all financial liabilities are measured at amortized cost using
the effective interest method.
b) Derecognition of financial liabilities
The difference between the carrying amount of a financial liability derecognized and the
consideration paid, including any non-cash assets transferred or liabilities assumed, is
recognized in profit or loss.
3) Derivative financial instruments
The Group enters into a variety of derivative financial instruments to manage its exposure to foreign
exchange rate risks, including foreign exchange forward contracts.
Derivatives are initially recognized at fair value at the date the derivative contracts are entered into
and are subsequently remeasured to their fair value at the end of each reporting period. The
resulting gain or loss is recognized in profit or loss immediately. When the fair value of a derivative
financial instrument is positive, the derivative is recognized as a financial asset; when the fair value
of a derivative financial instrument is negative, the derivative is recognized as a financial liability.
Derivatives embedded in hybrid contracts that contain financial asset hosts that is within the scope
of IFRS 9 are not separated; instead, the classification is determined in accordance with the entire
hybrid contract. Derivatives embedded in non-derivative host contracts that are not financial assets
that is within the scope of IFRS 9 (e.g., financial liabilities) are treated as separate derivatives when
they meet the definition of a derivative; their risks and characteristics are not closely related to those
of the host contracts; and the host contracts are not measured at FVTPL.
m. Revenue recognition
The Group identifies contracts with customers, allocates the transaction price to the performance
obligations and recognizes revenue when performance obligations are satisfied. The refund liabilities
are recognized at the time of sale based on the seller’s reliable estimate of future returns and based on
past experience and other relevant factors.
Revenue from the sale of goods
Revenue from the sale of goods comes from the sale of VCM, chlor-alkali products, PVC resins,
PVC compounds and other related products. The sale of goods above is recognized as revenue when
the goods are delivered to a customer because it is the time when the customer has full discretion
over the manner of distribution and the price to sell the goods, has the primary responsibility for
sales to future customers and bears the risks of obsolescence. Trade receivables are recognized
concurrently.

- 24 -
n. Discontinued operations
A discontinued operation is a component of an entity that either has been disposed of or is classified as
held for sale. A component of an entity which is for operational and financial reporting purposes has
cash flows which can be clearly distinguished from the rest of the entity.
o. Leasing
2019
At the inception of a contract, the Group assesses whether the contract is, or contains, a lease.
1) The Group as lessor
Leases are classified as finance leases whenever the terms of a lease transfer substantially all the
risks and rewards of ownership to the lessee. All other leases are classified as operating leases.
Lease payments (less any lease incentives payable) from operating leases are recognized as income
on a straight-line basis over the terms of the relevant leases.
2) The Group as lessee
The Group recognizes right-of-use assets and lease liabilities for all leases at the commencement
date of a lease, except for short-term leases and low-value asset leases accounted for applying a
recognition exemption where lease payments are recognized as expenses on a straight-line basis
over the lease terms.
Right-of-use assets are initially measured at cost, which comprises the initial measurement of lease
liabilities adjusted for lease payments made at or before the commencement date, plus any initial
direct costs incurred and an estimate of costs needed to restore the underlying assets, and less any
lease incentives received. Right-of-use assets are subsequently measured at cost less accumulated
depreciation and impairment losses and adjusted for any remeasurement of the lease liabilities.
Right-of-use assets are presented on a separate line in the consolidated balance sheets.
Right-of-use assets are depreciated using the straight-line method from the commencement dates to
the earlier of the end of the useful lives of the right-of-use assets or the end of the lease terms.
Lease liabilities are initially measured at the present value of the lease payments, which comprise
fixed payments, variable lease payments which depend on an index or a rate. The lease payments
are discounted using the interest rate implicit in a lease, if that rate can be readily determined. If that
rate cannot be readily determined, the Group uses the lessee’s incremental borrowing rate.
Subsequently, lease liabilities are measured at amortized cost using the effective interest method,
with interest expense recognized over the lease terms. When there is a change in a lease term, or a
change in future lease payments resulting from a change in an index or a rate used to determine
those payments, the Group remeasures the lease liabilities with a corresponding adjustment to the
right-of-use-assets. However, if the carrying amount of the right-of-use assets is reduced to zero,
any remaining amount of the remeasurement is recognized in profit or loss. Lease liabilities are
presented on a separate line in the consolidated balance sheets.
Variable lease payments that do not depend on an index or a rate are recognized as expenses in the
periods in which they are incurred.
- 25 -
2018
Leases are classified as finance leases whenever the terms of a lease transfer substantially all the risks
and rewards of ownership to the lessee. All other leases are classified as operating leases.
1) The Group as lessor
Rental income from operating leases is recognized on a straight-line basis over the term of the
relevant lease.
2) The Group as lessee
Operating lease payments are recognized as expenses on a straight-line basis over the lease term.
p. Borrowing costs
Borrowing costs directly attributable to an acquisition, construction or production of qualifying assets
are added to the cost of those assets, until such time as the assets are substantially ready for their
intended use or sale.
Investment income earned on the temporary investment of specific borrowings pending their
expenditure on qualifying assets is deducted from the borrowing costs eligible for capitalization.
Other than that which is stated above, all other borrowing costs are recognized in profit or loss in the
period in which they are incurred.
q. Employee benefits
1) Short-term employee benefits
Liabilities recognized in respect of short-term employee benefits are measured at the undiscounted
amount of the benefits expected to be paid in exchange for the related services.
2) Retirement benefits
Payments to defined contribution retirement benefit plans are recognized as expenses when
employees have rendered service entitling them to the contributions.
Defined benefit costs (including service cost, net interest and remeasurement) under the defined
benefit retirement benefit plans are determined using the projected unit credit method. Service cost
(including current service cost) and net interest on the net defined benefit liabilities (assets) are
recognized as employee benefits expenses in the period in which they occur. Remeasurement,
comprising actuarial gains and losses and the return on plan assets (excluding interest), is
recognized in other comprehensive income in the period in which it occurs. Remeasurement
recognized in other comprehensive income is reflected immediately in retained earnings and will
not be reclassified to profit or loss.
Net defined benefit liabilities (assets) represent the actual deficit (surplus) in the Group’s defined
benefit plans. Any surplus resulting from this calculation is limited to the present value of any
refunds from the plans or reductions in future contributions to the plans.
- 26 -
r. Taxation
Income tax expense represents the sum of the tax currently payable and deferred tax.
1) Current tax
According to the Income Tax Law, an additional tax on unappropriated earnings is provided for in
the year the shareholders approve to retain earnings.
Adjustments of prior years’ tax liabilities are added to or deducted from the current year’s tax
provision.
2) Deferred tax
Deferred tax is recognized on temporary differences between the carrying amounts of assets and
liabilities and the corresponding tax bases used in the computation of taxable profit.
Deferred tax liabilities are generally recognized for all taxable temporary differences. Deferred tax
assets are generally recognized for all deductible temporary differences to the extent that it is
probable that taxable profit will be available against which those deductible temporary differences
can be utilized.
Deferred tax liabilities are recognized for taxable temporary differences associated with investments
in subsidiaries and associates, except where the Group is able to control the reversal of the
temporary difference and it is probable that the temporary difference will not reverse in the
foreseeable future. Deferred tax assets arising from deductible temporary differences associated
with such investments and interests are only recognized to the extent that it is probable that there
will be sufficient taxable profit against which to utilize the temporary differences and they are
expected to reverse in the foreseeable future.
The carrying amount of deferred tax assets is reviewed at the end of each reporting period and
reduced to the extent that it is no longer probable that sufficient taxable profit will be available to
allow all or part of the assets to be recovered. A previously unrecognized deferred tax asset is also
reviewed at the end of each reporting period and recognized to the extent that it has become
probable that future taxable profit will allow the deferred tax asset to be recovered.
Deferred tax liabilities and assets are measured at the tax rates that are expected to apply in the
period in which the liabilities are settled or the assets are realized, based on tax rates (and tax laws)
that have been enacted or substantively enacted by the end of the reporting period. The
measurement of deferred tax liabilities and assets reflects the tax consequences that would follow
from the manner in which the Group expects, at the end of the reporting period, to recover or settle
the carrying amount of its assets and liabilities.
3) Current and deferred taxes for the year
Current and deferred taxes are recognized in profit or loss, except when they relate to items that are
recognized in other comprehensive income or directly in equity, in which case, the current and
deferred tax are also recognized in other comprehensive income or directly in equity, respectively.
- 27 -
5. CRITICAL ACCOUNTING JUDGMENTS AND KEY SOURCES OF ESTIMATION
UNCERTAINTY
In the application of the Group’s accounting policies, management is required to make judgments, estimates
and assumptions about the carrying amounts of assets and liabilities that are not readily apparent from other
sources. The estimates and associated assumptions are based on historical experience and other factors that
are considered relevant. Actual results may differ from these estimates.
The estimates and underlying assumptions are reviewed on an ongoing basis. Revisions to accounting
estimates are recognized in the period in which the estimates are revised if the revisions affect only that
period or in the period of the revisions and future periods if the revisions affect both current and future
periods.
Key Sources of Estimation Uncertainty
Write-down of inventories
The net realizable value of inventories is the estimated selling price in the ordinary course of business less
the estimated costs of completion and the estimated costs necessary to make the sale. The estimation of net
realizable value is based on current market conditions and historical experience with product sales of a
similar nature. Changes in market conditions may have a material impact on the estimation of the net
realizable value.
Income taxes
As of December 31, 2019 and 2018, the carrying amounts of deferred tax assets in relation to unused tax
losses were $230,996 thousand and $261,613 thousand, respectively. As of December 31, 2019 and 2018,
no deferred tax assets have been recognized on tax losses and deductible temporary differences of $807,600
thousand and $889,469 thousand, respectively, due to the unpredictability of future profit streams. The
realizability of deferred tax assets mainly depends on whether sufficient future profit or taxable temporary
differences will be available. In cases where the actual future profit generated is less than expected, a
material reversal of deferred tax assets may arise, which would be recognized in profit or loss for the period
in which such a reversal takes place.
Associate’s estimated damage compensation for Kaohsiung gas explosions
The Group’s associate, China General Terminal & Distribution Corporation (“CGTD”), recognized a
provision caused by the Kaohsiung gas explosions. The management estimated the provision based on the
progress of civil/criminal judgment, settlement, and the legal advice. However, the difference between the
estimated compensation and the actual amount may exist.
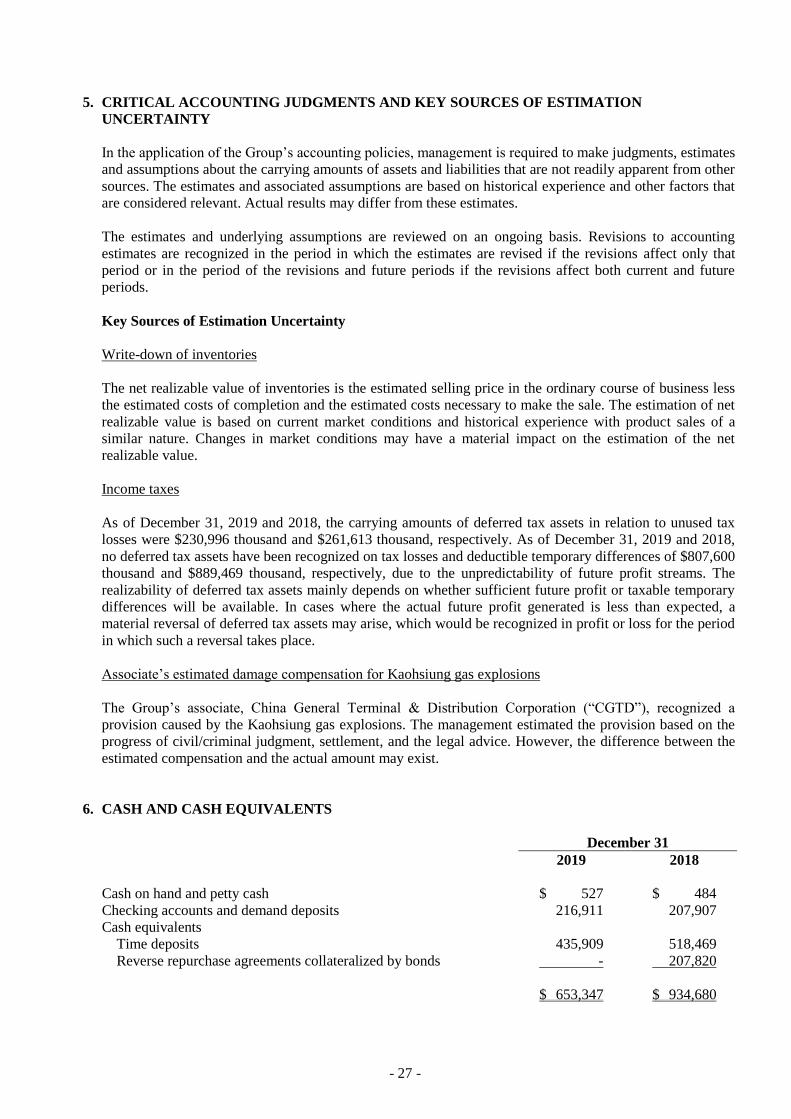
6. CASH AND CASH EQUIVALENTS
December 31
2019 2018
Cash on hand and petty cash $ 527 $ 484
Checking accounts and demand deposits 216,911 207,907
Cash equivalents
Time deposits 435,909 518,469
Reverse repurchase agreements collateralized by bonds - 207,820
$ 653,347 $ 934,680
- 28 -
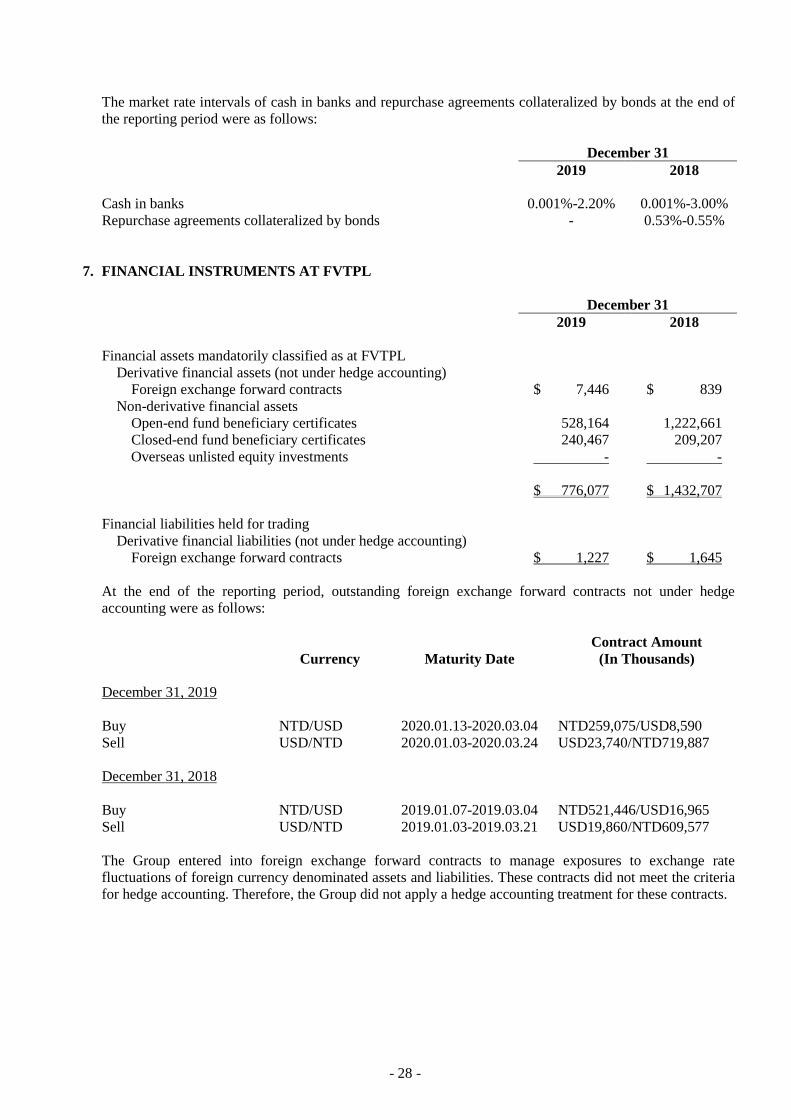
The market rate intervals of cash in banks and repurchase agreements collateralized by bonds at the end of
the reporting period were as follows:
December 31
2019 2018
Cash in banks 0.001%-2.20% 0.001%-3.00%
Repurchase agreements collateralized by bonds - 0.53%-0.55%
7. FINANCIAL INSTRUMENTS AT FVTPL
December 31
2019 2018
Financial assets mandatorily classified as at FVTPL
Derivative financial assets (not under hedge accounting)
Foreign exchange forward contracts $ 7,446 $ 839
Non-derivative financial assets
Open-end fund beneficiary certificates 528,164 1,222,661
Closed-end fund beneficiary certificates 240,467 209,207
Overseas unlisted equity investments - -
$ 776,077 $ 1,432,707
Financial liabilities held for trading
Derivative financial liabilities (not under hedge accounting)
Foreign exchange forward contracts $ 1,227 $ 1,645
At the end of the reporting period, outstanding foreign exchange forward contracts not under hedge
accounting were as follows:
Currency Maturity Date
Contract Amount
(In Thousands)
December 31, 2019
Buy NTD/USD 2020.01.13-2020.03.04 NTD259,075/USD8,590
Sell USD/NTD 2020.01.03-2020.03.24 USD23,740/NTD719,887
December 31, 2018
Buy NTD/USD 2019.01.07-2019.03.04 NTD521,446/USD16,965
Sell USD/NTD 2019.01.03-2019.03.21 USD19,860/NTD609,577
The Group entered into foreign exchange forward contracts to manage exposures to exchange rate
fluctuations of foreign currency denominated assets and liabilities. These contracts did not meet the criteria
for hedge accounting. Therefore, the Group did not apply a hedge accounting treatment for these contracts.
- 29 -
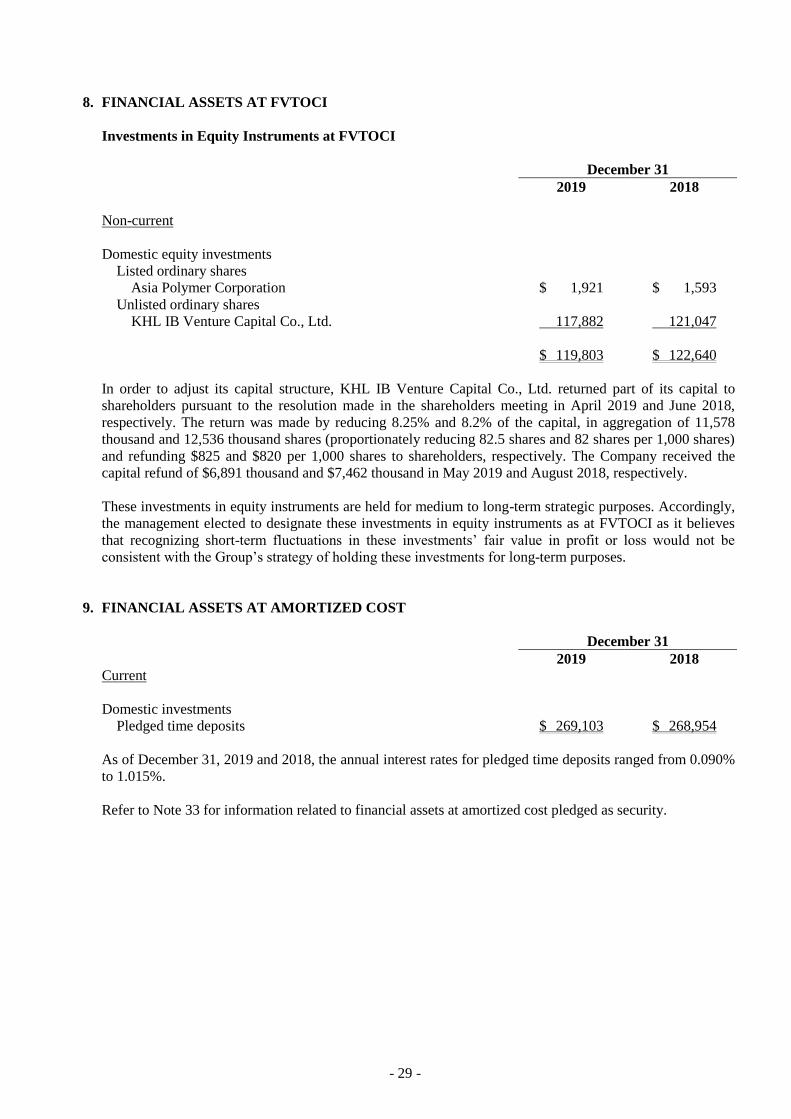
8. FINANCIAL ASSETS AT FVTOCI
Investments in Equity Instruments at FVTOCI
December 31
2019 2018
Non-current
Domestic equity investments
Listed ordinary shares
Asia Polymer Corporation $ 1,921 $ 1,593
Unlisted ordinary shares
KHL IB Venture Capital Co., Ltd. 117,882 121,047
$ 119,803 $ 122,640
In order to adjust its capital structure, KHL IB Venture Capital Co., Ltd. returned part of its capital to
shareholders pursuant to the resolution made in the shareholders meeting in April 2019 and June 2018,
respectively. The return was made by reducing 8.25% and 8.2% of the capital, in aggregation of 11,578
thousand and 12,536 thousand shares (proportionately reducing 82.5 shares and 82 shares per 1,000 shares)
and refunding $825 and $820 per 1,000 shares to shareholders, respectively. The Company received the
capital refund of $6,891 thousand and $7,462 thousand in May 2019 and August 2018, respectively.
These investments in equity instruments are held for medium to long-term strategic purposes. Accordingly,
the management elected to designate these investments in equity instruments as at FVTOCI as it believes
that recognizing short-term fluctuations in these investments’ fair value in profit or loss would not be
consistent with the Group’s strategy of holding these investments for long-term purposes.
9. FINANCIAL ASSETS AT AMORTIZED COST
December 31
2019 2018
Current
Domestic investments
Pledged time deposits $ 269,103 $ 268,954
As of December 31, 2019 and 2018, the annual interest rates for pledged time deposits ranged from 0.090%
to 1.015%.
Refer to Note 33 for information related to financial assets at amortized cost pledged as security.
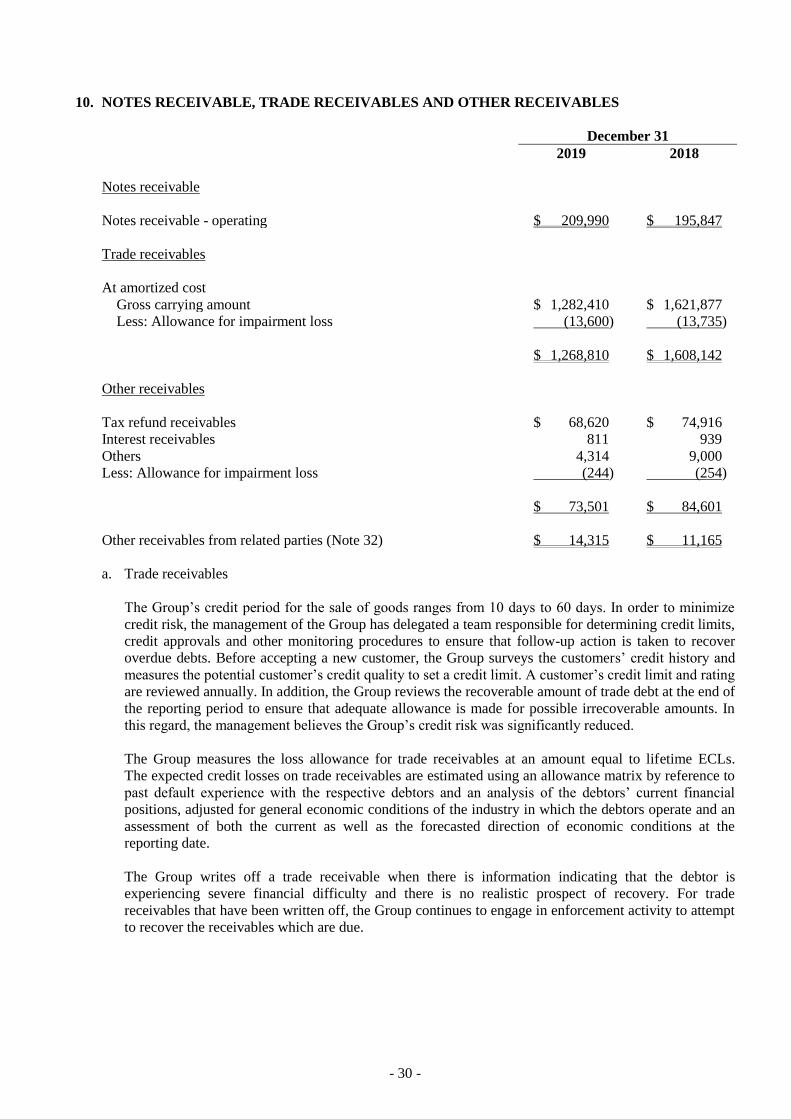
- 30 -
10. NOTES RECEIVABLE, TRADE RECEIVABLES AND OTHER RECEIVABLES
December 31
2019 2018
Notes receivable
Notes receivable - operating $ 209,990 $ 195,847
Trade receivables
At amortized cost
Gross carrying amount $ 1,282,410 $ 1,621,877
Less: Allowance for impairment loss (13,600) (13,735)
$ 1,268,810 $ 1,608,142
Other receivables
Tax refund receivables $ 68,620 $ 74,916
Interest receivables 811 939
Others 4,314 9,000
Less: Allowance for impairment loss (244) (254)
$ 73,501 $ 84,601
Other receivables from related parties (Note 32) $ 14,315 $ 11,165
a. Trade receivables
The Group’s credit period for the sale of goods ranges from 10 days to 60 days. In order to minimize
credit risk, the management of the Group has delegated a team responsible for determining credit limits,
credit approvals and other monitoring procedures to ensure that follow-up action is taken to recover
overdue debts. Before accepting a new customer, the Group surveys the customers’ credit history and
measures the potential customer’s credit quality to set a credit limit. A customer’s credit limit and rating
are reviewed annually. In addition, the Group reviews the recoverable amount of trade debt at the end of
the reporting period to ensure that adequate allowance is made for possible irrecoverable amounts. In
this regard, the management believes the Group’s credit risk was significantly reduced.
The Group measures the loss allowance for trade receivables at an amount equal to lifetime ECLs.
The expected credit losses on trade receivables are estimated using an allowance matrix by reference to
past default experience with the respective debtors and an analysis of the debtors’ current financial
positions, adjusted for general economic conditions of the industry in which the debtors operate and an
assessment of both the current as well as the forecasted direction of economic conditions at the
reporting date.
The Group writes off a trade receivable when there is information indicating that the debtor is
experiencing severe financial difficulty and there is no realistic prospect of recovery. For trade
receivables that have been written off, the Group continues to engage in enforcement activity to attempt
to recover the receivables which are due.
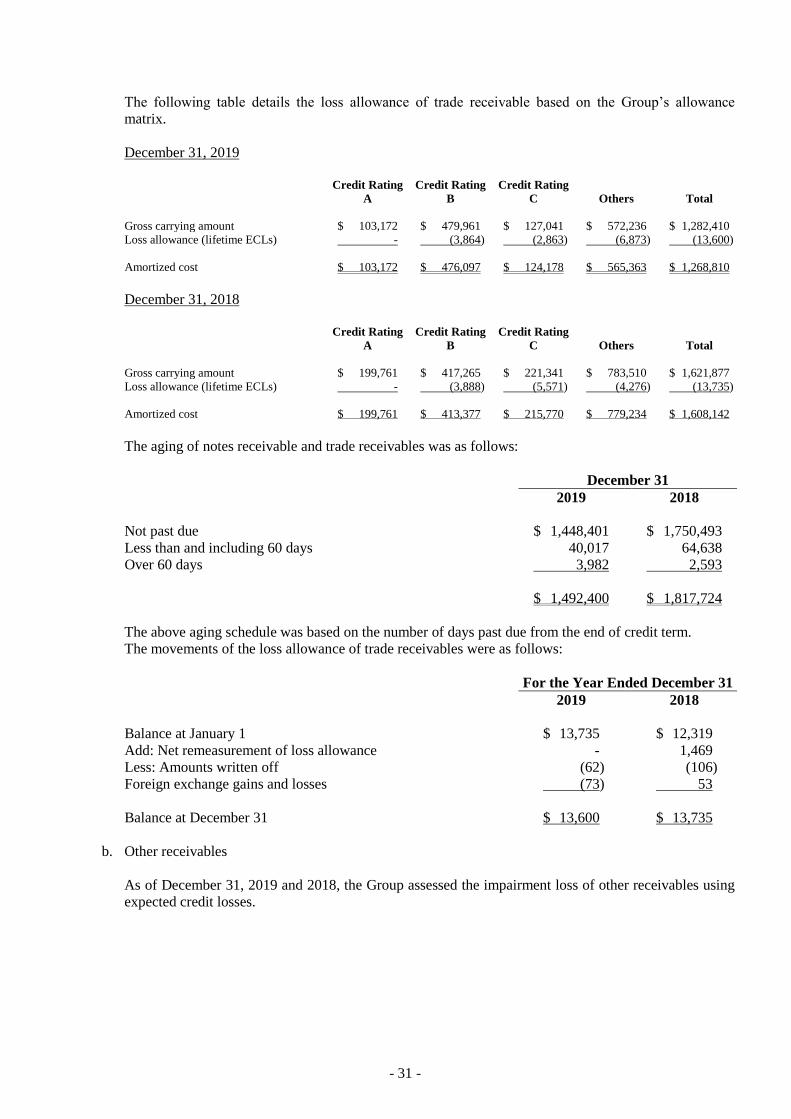
- 31 -
The following table details the loss allowance of trade receivable based on the Group’s allowance
matrix.
December 31, 2019
Credit Rating
A
Credit Rating
B
Credit Rating
C Others Total
Gross carrying amount $ 103,172 $ 479,961 $ 127,041 $ 572,236 $ 1,282,410
Loss allowance (lifetime ECLs) - (3,864) (2,863) (6,873) (13,600)
Amortized cost $ 103,172 $ 476,097 $ 124,178 $ 565,363 $ 1,268,810
December 31, 2018
Credit Rating
A
Credit Rating
B
Credit Rating
C Others Total
Gross carrying amount $ 199,761 $ 417,265 $ 221,341 $ 783,510 $ 1,621,877
Loss allowance (lifetime ECLs) - (3,888) (5,571) (4,276) (13,735)
Amortized cost $ 199,761 $ 413,377 $ 215,770 $ 779,234 $ 1,608,142
The aging of notes receivable and trade receivables was as follows:
December 31
2019 2018
Not past due $ 1,448,401 $ 1,750,493
Less than and including 60 days 40,017 64,638
Over 60 days 3,982 2,593
$ 1,492,400 $ 1,817,724
The above aging schedule was based on the number of days past due from the end of credit term.
The movements of the loss allowance of trade receivables were as follows:
For the Year Ended December 31
2019 2018
Balance at January 1 $ 13,735 $ 12,319
Add: Net remeasurement of loss allowance - 1,469
Less: Amounts written off (62) (106)
Foreign exchange gains and losses (73) 53
Balance at December 31 $ 13,600 $ 13,735
b. Other receivables
As of December 31, 2019 and 2018, the Group assessed the impairment loss of other receivables using
expected credit losses.

- 32 -
11. INVENTORIES
December 31
2019 2018
Finished goods $ 722,447 $ 1,131,291
Work in progress 37,077 45,025
Raw materials 709,688 540,959
$ 1,469,212 $ 1,717,275
The cost of inventories recognized as cost of goods sold for the years ended December 31, 2019 and 2018
was $13,148,375 thousand and $12,490,058 thousand, respectively.
The cost of goods sold included inventory write-down of $3,736 thousand and $2,907 thousand for the
years ended December 31, 2019 and 2018, respectively.
12. DISCONTINUED OPERATIONS
On October 24, 2011, the Company’s board of directors approved to dispose of Continental General
Plastics (Zhong Shan) Co., Ltd. and CGPC Consumer Products Corporation. The details of profit from
discontinued operations and the related cash flows information were as follows:
The operating performance of the discontinued operations included in the consolidated comprehensive
income statement were as follows:
For the Year Ended December 31
2019 2018
Administrative expenses $ (28,650) $ (33,267)
Loss from operations (28,650) (33,267)
Non-operating income 32,825 40,734
Net profit from discontinued operations $ 4,175 $ 7,467
For the years ended December 31, 2019 and 2018, the cash flows from the discontinued operations were as
follows:
For the Year Ended December 31
2019 2018
Net cash generated from operating activities $ 9,674 $ 17,640
Net cash generated from investing activities 411 378
Effect of exchange rate changes (3,234) (334)
Net cash inflow $ 6,851 $ 17,684
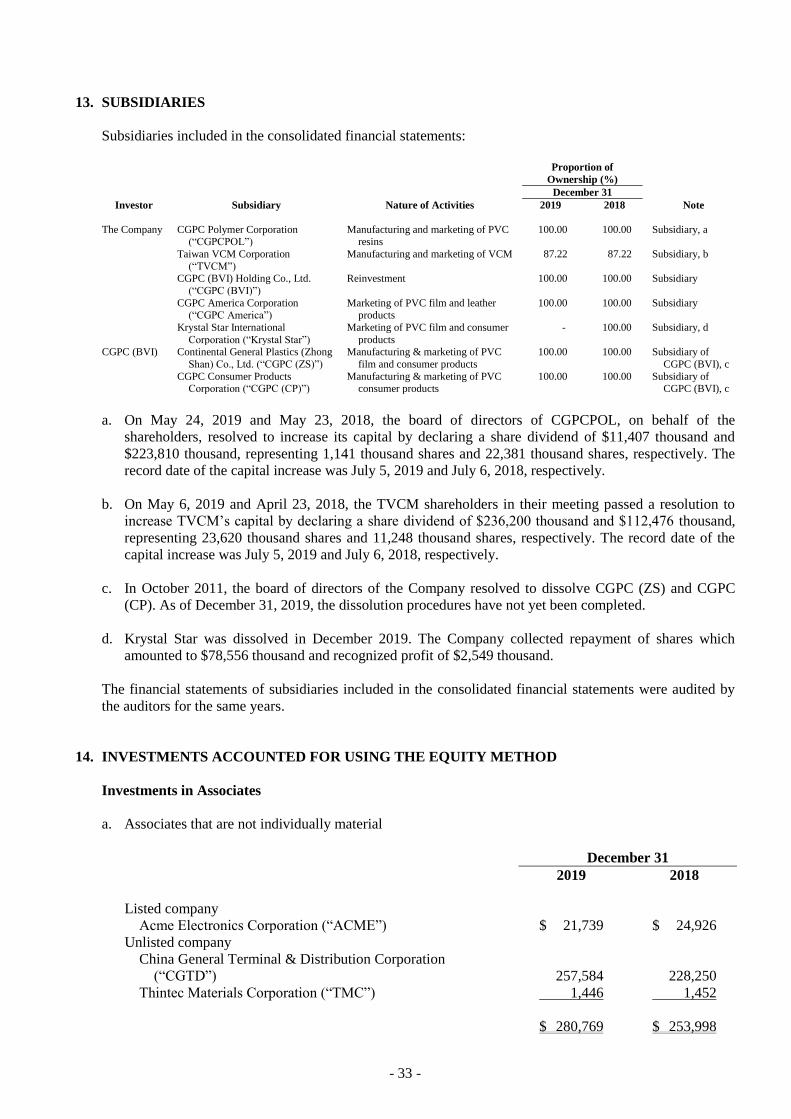
- 33 -
13. SUBSIDIARIES
Subsidiaries included in the consolidated financial statements:
Proportion of
Ownership (%)
December 31
Investor Subsidiary Nature of Activities 2019 2018 Note
The Company CGPC Polymer Corporation (“CGPCPOL”)
Manufacturing and marketing of PVC resins
100.00 100.00 Subsidiary, a
Taiwan VCM Corporation
(“TVCM”)
Manufacturing and marketing of VCM 87.22 87.22 Subsidiary, b
CGPC (BVI) Holding Co., Ltd.
(“CGPC (BVI)”)
Reinvestment 100.00 100.00 Subsidiary
CGPC America Corporation (“CGPC America”)
Marketing of PVC film and leather products
100.00 100.00 Subsidiary
Krystal Star International
Corporation (“Krystal Star”)
Marketing of PVC film and consumer
products
- 100.00 Subsidiary, d
CGPC (BVI) Continental General Plastics (Zhong
Shan) Co., Ltd. (“CGPC (ZS)”)
Manufacturing & marketing of PVC
film and consumer products
100.00 100.00 Subsidiary of
CGPC (BVI), c
CGPC Consumer Products Corporation (“CGPC (CP)”)
Manufacturing & marketing of PVC consumer products
100.00 100.00 Subsidiary of CGPC (BVI), c
a. On May 24, 2019 and May 23, 2018, the board of directors of CGPCPOL, on behalf of the
shareholders, resolved to increase its capital by declaring a share dividend of $11,407 thousand and
$223,810 thousand, representing 1,141 thousand shares and 22,381 thousand shares, respectively. The
record date of the capital increase was July 5, 2019 and July 6, 2018, respectively.
b. On May 6, 2019 and April 23, 2018, the TVCM shareholders in their meeting passed a resolution to
increase TVCM’s capital by declaring a share dividend of $236,200 thousand and $112,476 thousand,
representing 23,620 thousand shares and 11,248 thousand shares, respectively. The record date of the
capital increase was July 5, 2019 and July 6, 2018, respectively.
c. In October 2011, the board of directors of the Company resolved to dissolve CGPC (ZS) and CGPC
(CP). As of December 31, 2019, the dissolution procedures have not yet been completed.
d. Krystal Star was dissolved in December 2019. The Company collected repayment of shares which
amounted to $78,556 thousand and recognized profit of $2,549 thousand.
The financial statements of subsidiaries included in the consolidated financial statements were audited by
the auditors for the same years.
14. INVESTMENTS ACCOUNTED FOR USING THE EQUITY METHOD
Investments in Associates
a. Associates that are not individually material
December 31
2019 2018
Listed company
Acme Electronics Corporation (“ACME”) $ 21,739 $ 24,926
Unlisted company
China General Terminal & Distribution Corporation
(“CGTD”) 257,584 228,250
Thintec Materials Corporation (“TMC”) 1,446 1,452
$ 280,769 $ 253,998
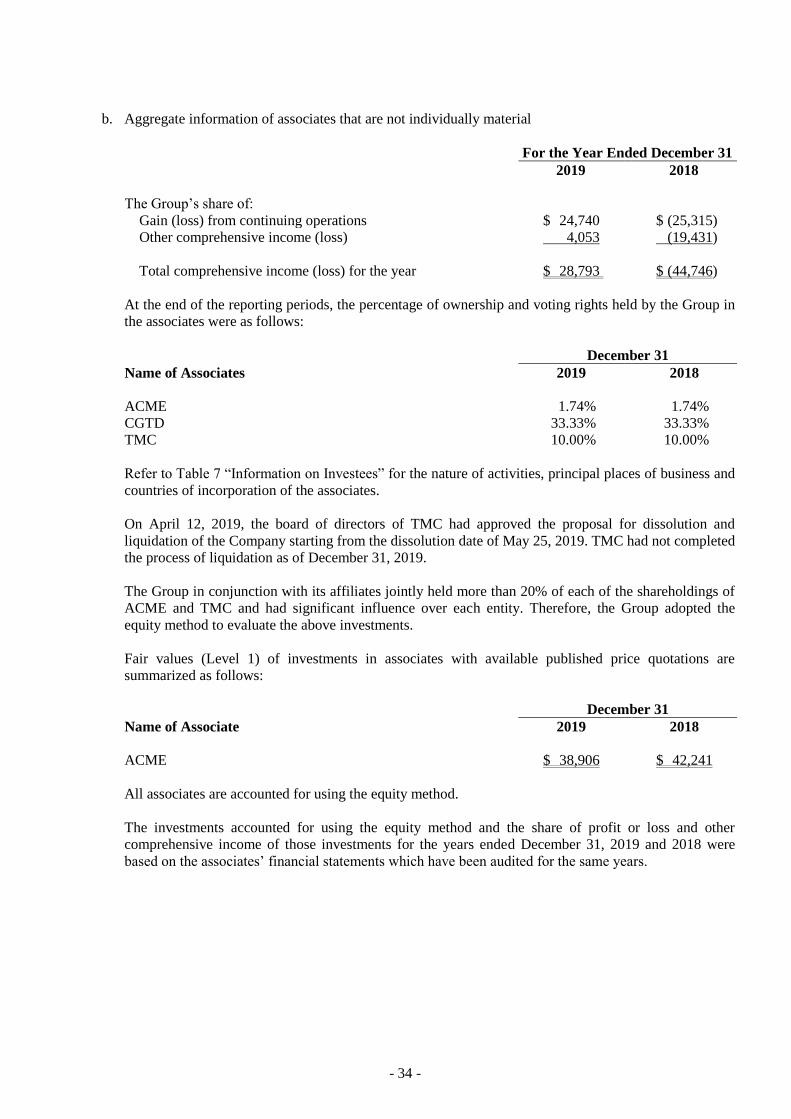
- 34 -
b. Aggregate information of associates that are not individually material
For the Year Ended December 31
2019 2018
The Group’s share of:
Gain (loss) from continuing operations $ 24,740 $ (25,315)
Other comprehensive income (loss) 4,053 (19,431)
Total comprehensive income (loss) for the year $ 28,793 $ (44,746)
At the end of the reporting periods, the percentage of ownership and voting rights held by the Group in
the associates were as follows:
December 31
Name of Associates 2019 2018
ACME 1.74% 1.74%
CGTD 33.33% 33.33%
TMC 10.00% 10.00%
Refer to Table 7 “Information on Investees” for the nature of activities, principal places of business and
countries of incorporation of the associates.
On April 12, 2019, the board of directors of TMC had approved the proposal for dissolution and
liquidation of the Company starting from the dissolution date of May 25, 2019. TMC had not completed
the process of liquidation as of December 31, 2019.
The Group in conjunction with its affiliates jointly held more than 20% of each of the shareholdings of
ACME and TMC and had significant influence over each entity. Therefore, the Group adopted the
equity method to evaluate the above investments.
Fair values (Level 1) of investments in associates with available published price quotations are
summarized as follows:
December 31
Name of Associate 2019 2018
ACME $ 38,906 $ 42,241
All associates are accounted for using the equity method.
The investments accounted for using the equity method and the share of profit or loss and other
comprehensive income of those investments for the years ended December 31, 2019 and 2018 were
based on the associates’ financial statements which have been audited for the same years.
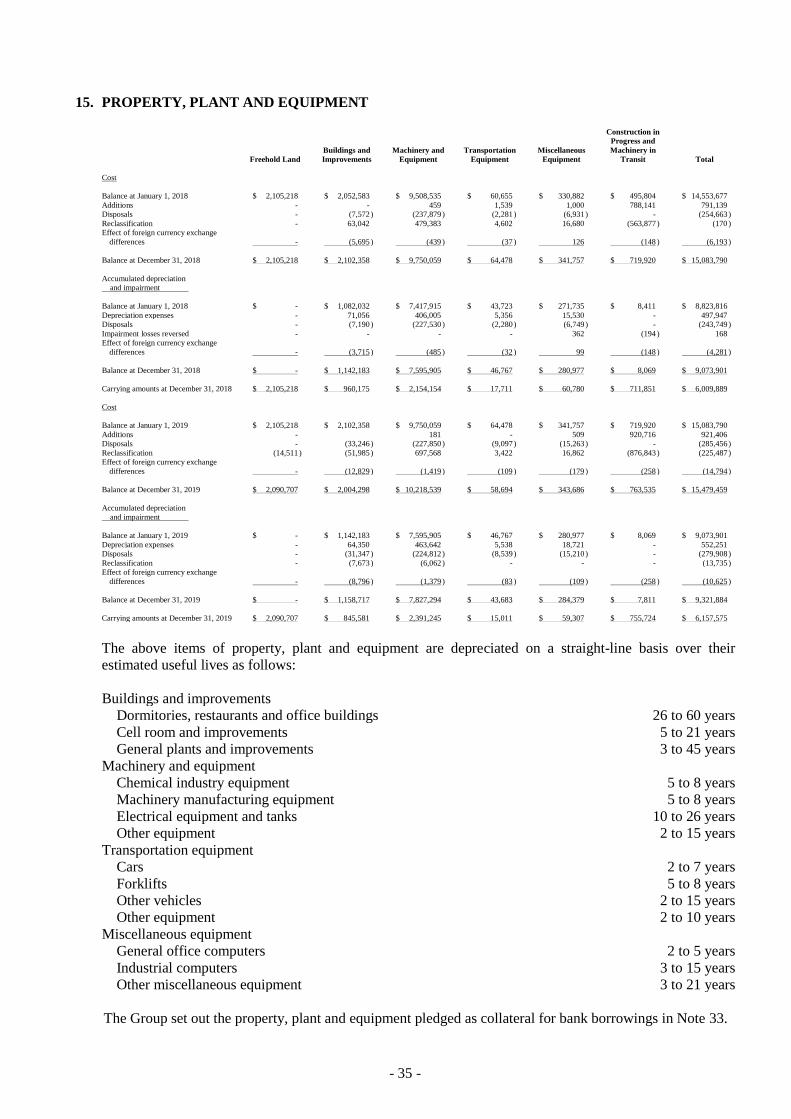
- 35 -
15. PROPERTY, PLANT AND EQUIPMENT
Freehold Land
Buildings and
Improvements
Machinery and
Equipment
Transportation
Equipment
Miscellaneous
Equipment
Construction in
Progress and
Machinery in
Transit Total
Cost
Balance at January 1, 2018 $ 2,105,218 $ 2,052,583 $ 9,508,535 $ 60,655 $ 330,882 $ 495,804 $ 14,553,677
Additions - - 459 1,539 1,000 788,141 791,139
Disposals - (7,572 ) (237,879 ) (2,281 ) (6,931 ) - (254,663 )
Reclassification - 63,042 479,383 4,602 16,680 (563,877 ) (170 )
Effect of foreign currency exchange
differences - (5,695 ) (439 ) (37 ) 126 (148 ) (6,193 )
Balance at December 31, 2018 $ 2,105,218 $ 2,102,358 $ 9,750,059 $ 64,478 $ 341,757 $ 719,920 $ 15,083,790
Accumulated depreciation
and impairment
Balance at January 1, 2018 $ - $ 1,082,032 $ 7,417,915 $ 43,723 $ 271,735 $ 8,411 $ 8,823,816
Depreciation expenses - 71,056 406,005 5,356 15,530 - 497,947
Disposals - (7,190 ) (227,530 ) (2,280 ) (6,749 ) - (243,749 )
Impairment losses reversed - - - - 362 (194 ) 168
Effect of foreign currency exchange
differences - (3,715 ) (485 ) (32 ) 99 (148 ) (4,281 )
Balance at December 31, 2018 $ - $ 1,142,183 $ 7,595,905 $ 46,767 $ 280,977 $ 8,069 $ 9,073,901
Carrying amounts at December 31, 2018 $ 2,105,218 $ 960,175 $ 2,154,154 $ 17,711 $ 60,780 $ 711,851 $ 6,009,889
Cost
Balance at January 1, 2019 $ 2,105,218 $ 2,102,358 $ 9,750,059 $ 64,478 $ 341,757 $ 719,920 $ 15,083,790
Additions - 181 - 509 920,716 921,406
Disposals - (33,246 ) (227,850 ) (9,097 ) (15,263 ) - (285,456 )
Reclassification (14,511 ) (51,985 ) 697,568 3,422 16,862 (876,843 ) (225,487 )
Effect of foreign currency exchange
differences - (12,829 ) (1,419 ) (109 ) (179 ) (258 ) (14,794 )
Balance at December 31, 2019 $ 2,090,707 $ 2,004,298 $ 10,218,539 $ 58,694 $ 343,686 $ 763,535 $ 15,479,459
Accumulated depreciation
and impairment
Balance at January 1, 2019 $ - $ 1,142,183 $ 7,595,905 $ 46,767 $ 280,977 $ 8,069 $ 9,073,901
Depreciation expenses - 64,350 463,642 5,538 18,721 - 552,251
Disposals - (31,347 ) (224,812 ) (8,539 ) (15,210 ) - (279,908 )
Reclassification - (7,673 ) (6,062 ) - - - (13,735 )
Effect of foreign currency exchange
differences - (8,796 ) (1,379 ) (83 ) (109 ) (258 ) (10,625 )
Balance at December 31, 2019 $ - $ 1,158,717 $ 7,827,294 $ 43,683 $ 284,379 $ 7,811 $ 9,321,884
Carrying amounts at December 31, 2019 $ 2,090,707 $ 845,581 $ 2,391,245 $ 15,011 $ 59,307 $ 755,724 $ 6,157,575
The above items of property, plant and equipment are depreciated on a straight-line basis over their
estimated useful lives as follows:
Buildings and improvements
Dormitories, restaurants and office buildings 26 to 60 years
Cell room and improvements 5 to 21 years
General plants and improvements 3 to 45 years
Machinery and equipment
Chemical industry equipment 5 to 8 years
Machinery manufacturing equipment 5 to 8 years
Electrical equipment and tanks 10 to 26 years
Other equipment 2 to 15 years
Transportation equipment
Cars 2 to 7 years
Forklifts 5 to 8 years
Other vehicles 2 to 15 years
Other equipment 2 to 10 years
Miscellaneous equipment
General office computers 2 to 5 years
Industrial computers 3 to 15 years
Other miscellaneous equipment 3 to 21 years
The Group set out the property, plant and equipment pledged as collateral for bank borrowings in Note 33.

- 36 -
16. LEASE ARRANGEMENTS
a. Right-of-use assets - 2019
December 31,
2019
Carrying amounts
Land $ 264,921
Buildings 12,836
Machinery 27,351
$ 305,108
For the Year
Ended
December 31,
2019
Depreciation charge for right-of-use assets
Land $ 24,762
Buildings 4,292
Machinery 9,117
$ 38,171
b. Lease liabilities - 2019
December 31,
2019
Carrying amounts
Current $ 36,082
Non-current $ 181,459
Range of discount rate for lease liabilities was as follows:
December 31,
2019
Land 1.0392%
Buildings 1.0392%
Machinery 1.0392%
c. Material lease-in activities and terms
The Group leases certain land and buildings for the use of product manufacturing and office with lease
terms of 2 to 15 years. The Group does not have bargain purchase options to acquire the leasehold land
and buildings at the end of the lease terms.
The Group also leases machinery for the use of product manufacturing and Group’s operations with
lease terms of 5 years. The Group does not have bargain purchase options to acquire the leasehold
machinery at the end of the lease terms.

- 37 -
The lease contract for land located in Kaohsiung specifies that lease payments will be adjusted on the
basis of changes in announced land value prices.
d. Other lease information
2019
For the Year
Ended
December 31,
2019
Expenses relating to short-term leases $ 11,769
Expenses relating to low-value asset leases $ 588
Expenses relating to variable lease payments not included in the
measurement of lease liabilities $ 43,148
Total cash outflow for leases $ (91,900)
The Group leases certain buildings, transportation equipment which qualify as short term leases and
certain land and office equipment which qualify as low-value asset leases. The Group has elected to
apply the recognition exemption and thus, did not recognize right-of-use assets and lease liabilities for
these leases.
2018
The future minimum lease payments of non-cancellable operating lease commitments are as follows:
December 31,
2018
Not later than 1 year $ 46,518
Later than 1 year and not later than 5 years 140,238
Later than 5 years 88,574
$ 275,330
17. INVESTMENT PROPERTIES
Land
Building and
improvements Total
Cost
Balance at January 1 and December 31, 2018 $ 13,204 $ 129,547 $ 142,751
Accumulated depreciation
Balance at January 1, 2018 $ - $ 2,491 $ 2,491
Depreciation expense - 4,983 4,983
Balance at December 31, 2018 $ - $ 7,474 $ 7,474
Carrying amount at December 31, 2018 $ 13,204 $ 122,073 $ 135,277
(Continued)
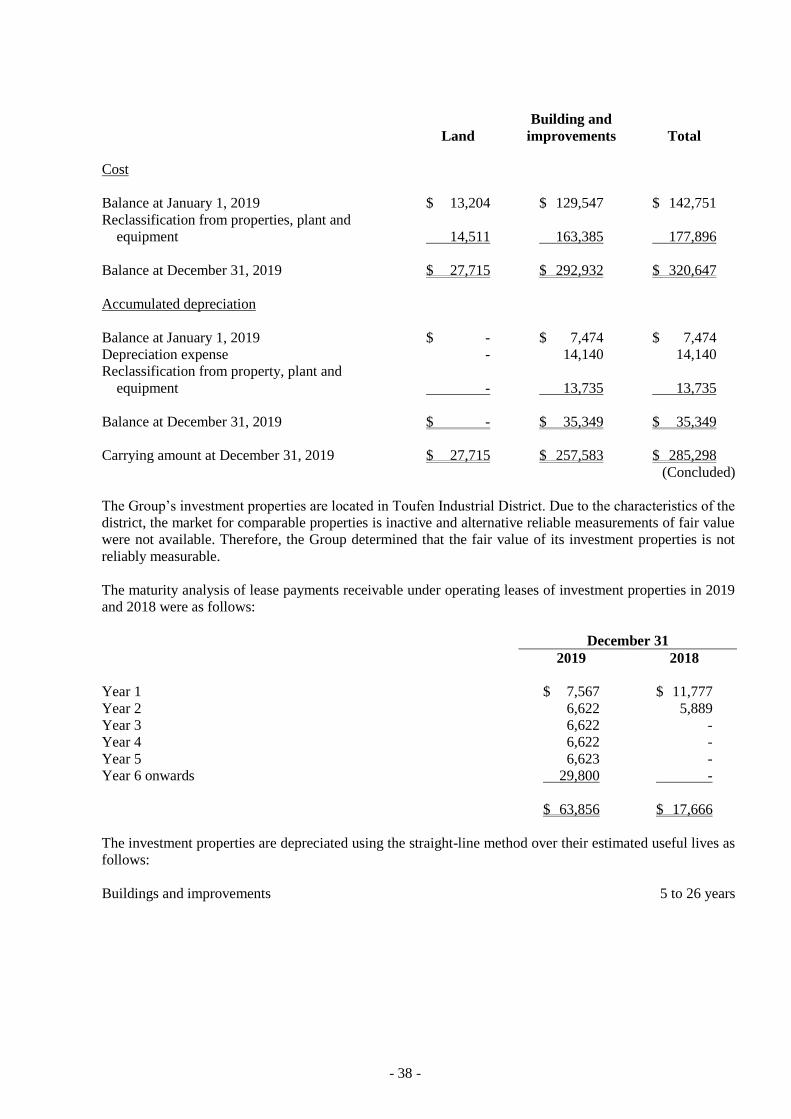
- 38 -
Land
Building and
improvements Total
Cost
Balance at January 1, 2019 $ 13,204 $ 129,547 $ 142,751
Reclassification from properties, plant and
equipment 14,511 163,385 177,896
Balance at December 31, 2019 $ 27,715 $ 292,932 $ 320,647
Accumulated depreciation
Balance at January 1, 2019 $ - $ 7,474 $ 7,474
Depreciation expense - 14,140 14,140
Reclassification from property, plant and
equipment - 13,735 13,735
Balance at December 31, 2019 $ - $ 35,349 $ 35,349
Carrying amount at December 31, 2019 $ 27,715 $ 257,583 $ 285,298
(Concluded)
The Group’s investment properties are located in Toufen Industrial District. Due to the characteristics of the
district, the market for comparable properties is inactive and alternative reliable measurements of fair value
were not available. Therefore, the Group determined that the fair value of its investment properties is not
reliably measurable.
The maturity analysis of lease payments receivable under operating leases of investment properties in 2019
and 2018 were as follows:
December 31
2019 2018
Year 1 $ 7,567 $ 11,777
Year 2 6,622 5,889
Year 3 - 6,622 -
Year 4 - 6,622 -
Year 5 - 6,623 -
Year 6 onwards 29,800 -
$ 63,856 $ 17,666
The investment properties are depreciated using the straight-line method over their estimated useful lives as
follows:
Buildings and improvements 5 to 26 years
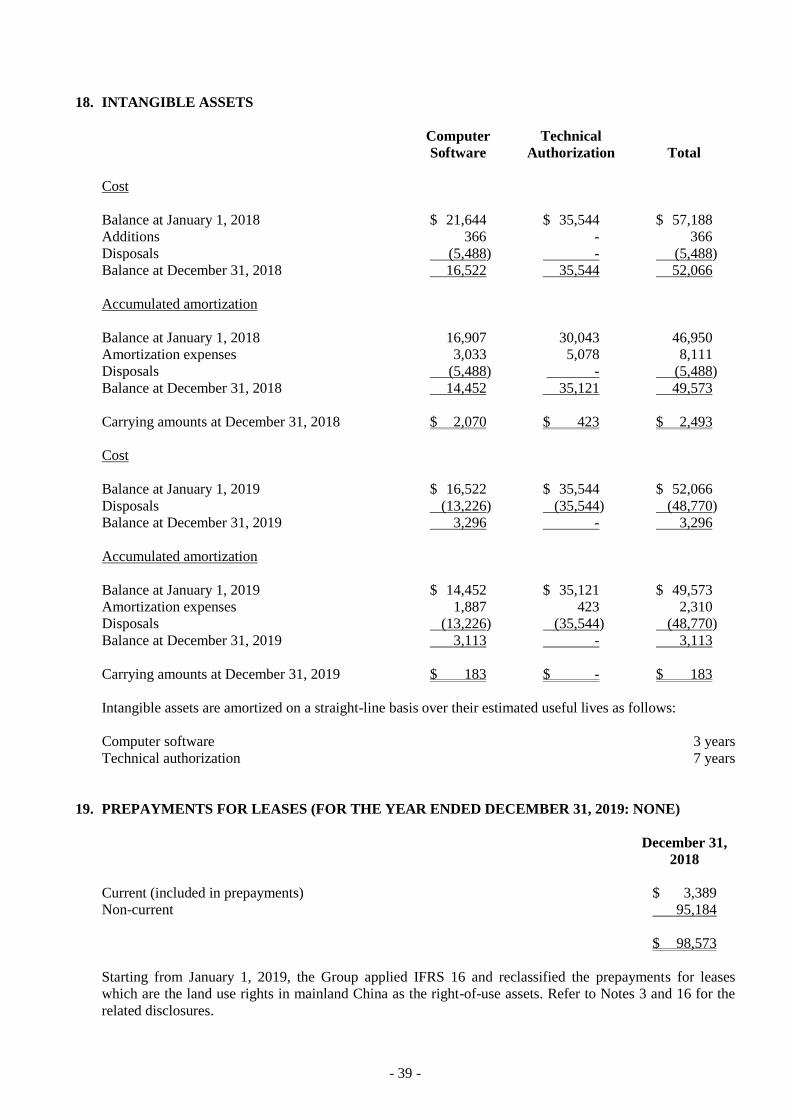
- 39 -
18. INTANGIBLE ASSETS
Computer
Software
Technical
Authorization Total
Cost
Balance at January 1, 2018 $ 21,644 $ 35,544 $ 57,188
Additions 366 - 366
Disposals (5,488) - (5,488)
Balance at December 31, 2018 16,522 35,544 52,066
Accumulated amortization
Balance at January 1, 2018 16,907 30,043 46,950
Amortization expenses 3,033 5,078 8,111
Disposals (5,488) - (5,488)
Balance at December 31, 2018 14,452 35,121 49,573
Carrying amounts at December 31, 2018 $ 2,070 $ 423 $ 2,493
Cost
Balance at January 1, 2019 $ 16,522 $ 35,544 $ 52,066
Disposals (13,226) (35,544) (48,770)
Balance at December 31, 2019 3,296 - 3,296
Accumulated amortization
Balance at January 1, 2019 $ 14,452 $ 35,121 $ 49,573
Amortization expenses 1,887 423 2,310
Disposals (13,226) (35,544) (48,770)
Balance at December 31, 2019 3,113 - 3,113
Carrying amounts at December 31, 2019 $ 183 $ - $ 183
Intangible assets are amortized on a straight-line basis over their estimated useful lives as follows:
Computer software 3 years
Technical authorization 7 years
19. PREPAYMENTS FOR LEASES (FOR THE YEAR ENDED DECEMBER 31, 2019: NONE)
December 31,
2018
Current (included in prepayments) $ 3,389
Non-current 95,184
$ 98,573
Starting from January 1, 2019, the Group applied IFRS 16 and reclassified the prepayments for leases
which are the land use rights in mainland China as the right-of-use assets. Refer to Notes 3 and 16 for the
related disclosures.
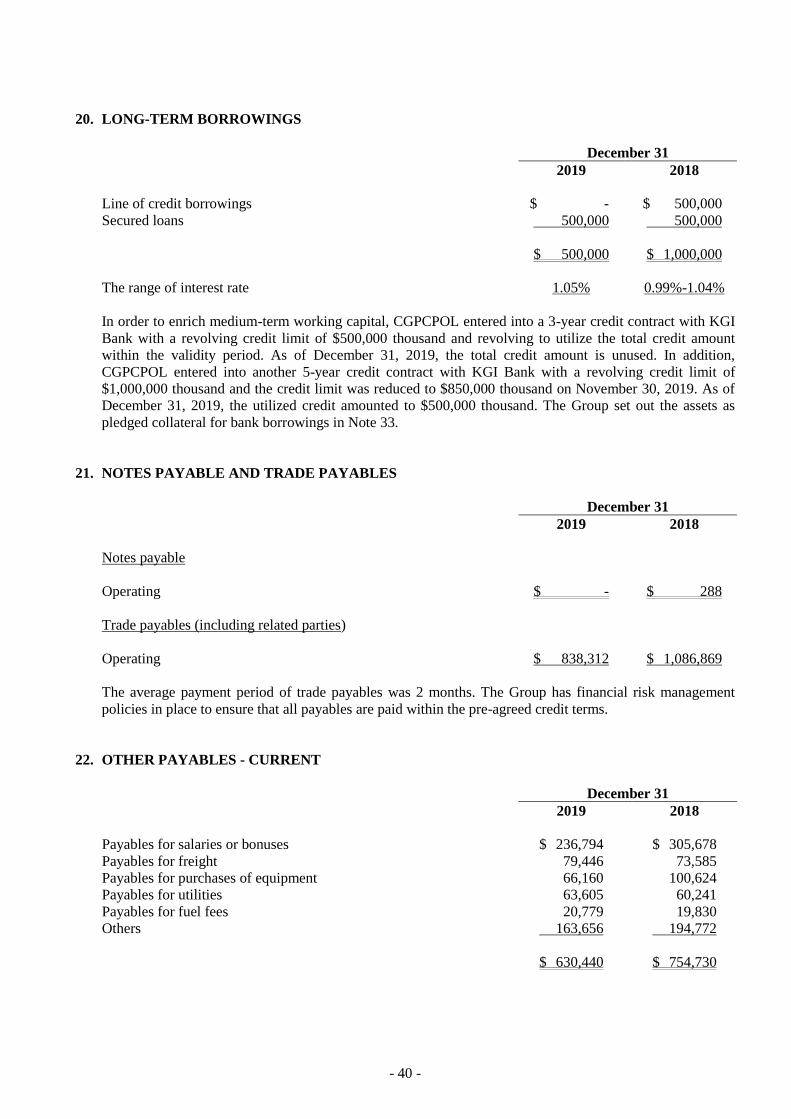
- 40 -
20. LONG-TERM BORROWINGS
December 31
2019 2018
Line of credit borrowings $ - $ 500,000
Secured loans 500,000 500,000
$ 500,000 $ 1,000,000
The range of interest rate 1.05% 0.99%-1.04%
In order to enrich medium-term working capital, CGPCPOL entered into a 3-year credit contract with KGI
Bank with a revolving credit limit of $500,000 thousand and revolving to utilize the total credit amount
within the validity period. As of December 31, 2019, the total credit amount is unused. In addition,
CGPCPOL entered into another 5-year credit contract with KGI Bank with a revolving credit limit of
$1,000,000 thousand and the credit limit was reduced to $850,000 thousand on November 30, 2019. As of
December 31, 2019, the utilized credit amounted to $500,000 thousand. The Group set out the assets as
pledged collateral for bank borrowings in Note 33.
21. NOTES PAYABLE AND TRADE PAYABLES
December 31
2019 2018
Notes payable
Operating $ - $ 288
Trade payables (including related parties)
Operating $ 838,312 $ 1,086,869
The average payment period of trade payables was 2 months. The Group has financial risk management
policies in place to ensure that all payables are paid within the pre-agreed credit terms.
22. OTHER PAYABLES - CURRENT
December 31
2019 2018
Payables for salaries or bonuses $ 236,794 $ 305,678
Payables for freight 79,446 73,585
Payables for purchases of equipment 66,160 100,624
Payables for utilities 63,605 60,241
Payables for fuel fees 20,779 19,830
Others 163,656 194,772
$ 630,440 $ 754,730
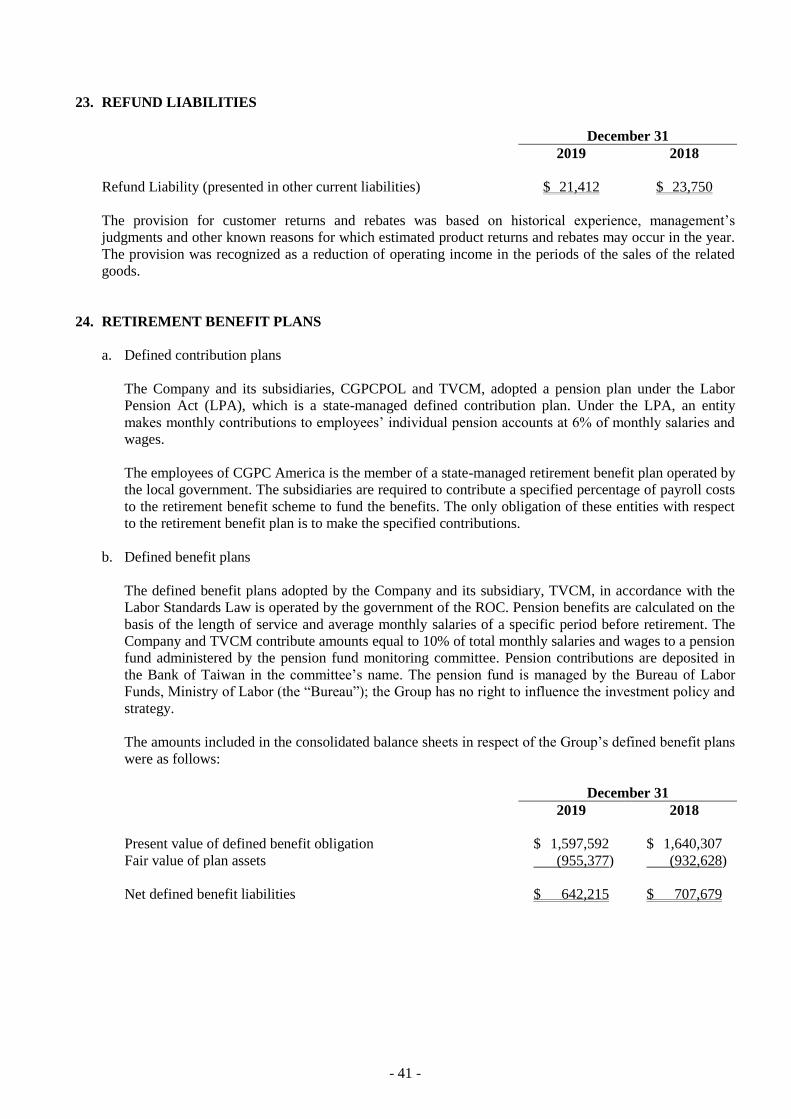
- 41 -
23. REFUND LIABILITIES
December 31
2019 2018
Refund Liability (presented in other current liabilities) $ 21,412 $ 23,750
The provision for customer returns and rebates was based on historical experience, management’s
judgments and other known reasons for which estimated product returns and rebates may occur in the year.
The provision was recognized as a reduction of operating income in the periods of the sales of the related
goods.
24. RETIREMENT BENEFIT PLANS
a. Defined contribution plans
The Company and its subsidiaries, CGPCPOL and TVCM, adopted a pension plan under the Labor
Pension Act (LPA), which is a state-managed defined contribution plan. Under the LPA, an entity
makes monthly contributions to employees’ individual pension accounts at 6% of monthly salaries and
wages.
The employees of CGPC America is the member of a state-managed retirement benefit plan operated by
the local government. The subsidiaries are required to contribute a specified percentage of payroll costs
to the retirement benefit scheme to fund the benefits. The only obligation of these entities with respect
to the retirement benefit plan is to make the specified contributions.
b. Defined benefit plans
The defined benefit plans adopted by the Company and its subsidiary, TVCM, in accordance with the
Labor Standards Law is operated by the government of the ROC. Pension benefits are calculated on the
basis of the length of service and average monthly salaries of a specific period before retirement. The
Company and TVCM contribute amounts equal to 10% of total monthly salaries and wages to a pension
fund administered by the pension fund monitoring committee. Pension contributions are deposited in
the Bank of Taiwan in the committee’s name. The pension fund is managed by the Bureau of Labor
Funds, Ministry of Labor (the “Bureau”); the Group has no right to influence the investment policy and
strategy.
The amounts included in the consolidated balance sheets in respect of the Group’s defined benefit plans
were as follows:
December 31
2019 2018
Present value of defined benefit obligation $ 1,597,592 $ 1,640,307
Fair value of plan assets (955,377) (932,628)
Net defined benefit liabilities $ 642,215 $ 707,679

- 42 -
Movements in net defined benefit liabilities (assets) were as follows:
Present Value
of the Defined
Benefit
Obligation
Fair Value of
the Plan Assets
Net Defined
Benefit
Liabilities
(Assets)
Balance at January 1, 2018 $ 1,643,363 $ (603,488) $ 1,039,875
Service cost
Current service cost 16,301 - 16,301
Net interest expense (income) 18,218 (8,514) 9,704
Recognized in profit or loss 34,519 (8,514) 26,005
Remeasurement
Return on plan assets (excluding amounts
included in net interest) - (13,297) (13,297)
Actuarial loss - changes in demographic
assumptions 97 - 97
Actuarial loss - changes in financial
assumptions 30,632 - 30,632
Actuarial gain - experience adjustments (16,841) - (16,841)
Recognized in other comprehensive income 13,888 (13,297) 591
Contributions from the employer - (358,792) (358,792)
Benefits paid (51,463) 51,463 -
Balance at December 31, 2018 1,640,307 (932,628) 707,679
Service cost
Current service cost 15,176 - 15,176
Net interest expense (income) 14,459 (8,557) 5,902
Recognized in profit or loss 29,635 (8,557) 21,078
Remeasurement
Return on plan assets (excluding amounts
included in net interest) - (32,254) (32,254)
Actuarial loss - changes in demographic
assumptions 47 - 47
Actuarial loss - changes in financial
assumptions 31,785 - 31,785
Actuarial gain - experience adjustments (7,270) - (7,270)
Recognized in other comprehensive income 24,562 (32,254) (7,692)
Contributions from the employer - (78,850) (78,850)
Benefits paid (96,912) 96,912 -
Balance at December 31, 2019 $ 1,597,592 $ (955,377) $ 642,215
An analysis by function of the amounts recognized in profit or loss in respect of the defined benefit
plans is as follows:
For the Year Ended December 31
2019 2018
Operating costs $ 17,111 $ 21,351
Selling and marketing expenses 1,682 2,017
General and administrative expenses 1,590 1,844
Research and development expenses 695 793
$ 21,078 $ 26,005
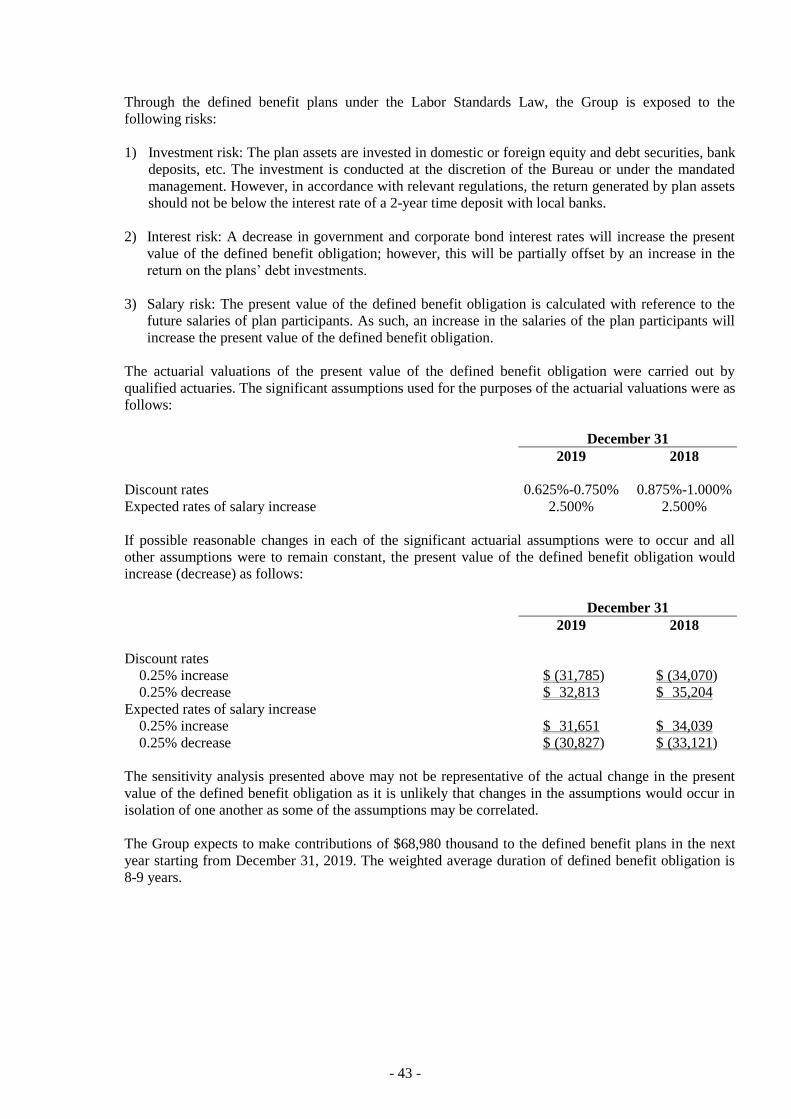
- 43 -
Through the defined benefit plans under the Labor Standards Law, the Group is exposed to the
following risks:
1) Investment risk: The plan assets are invested in domestic or foreign equity and debt securities, bank
deposits, etc. The investment is conducted at the discretion of the Bureau or under the mandated
management. However, in accordance with relevant regulations, the return generated by plan assets
should not be below the interest rate of a 2-year time deposit with local banks.
2) Interest risk: A decrease in government and corporate bond interest rates will increase the present
value of the defined benefit obligation; however, this will be partially offset by an increase in the
return on the plans’ debt investments.
3) Salary risk: The present value of the defined benefit obligation is calculated with reference to the
future salaries of plan participants. As such, an increase in the salaries of the plan participants will
increase the present value of the defined benefit obligation.
The actuarial valuations of the present value of the defined benefit obligation were carried out by
qualified actuaries. The significant assumptions used for the purposes of the actuarial valuations were as
follows:
December 31
2019 2018
Discount rates 0.625%-0.750% 0.875%-1.000%
Expected rates of salary increase 2.500% 2.500%
If possible reasonable changes in each of the significant actuarial assumptions were to occur and all
other assumptions were to remain constant, the present value of the defined benefit obligation would
increase (decrease) as follows:
December 31
2019 2018
Discount rates
0.25% increase $ (31,785) $ (34,070)
0.25% decrease $ 32,813 $ 35,204
Expected rates of salary increase
0.25% increase $ 31,651 $ 34,039
0.25% decrease $ (30,827) $ (33,121)
The sensitivity analysis presented above may not be representative of the actual change in the present
value of the defined benefit obligation as it is unlikely that changes in the assumptions would occur in
isolation of one another as some of the assumptions may be correlated.
The Group expects to make contributions of $68,980 thousand to the defined benefit plans in the next
year starting from December 31, 2019. The weighted average duration of defined benefit obligation is
8-9 years.
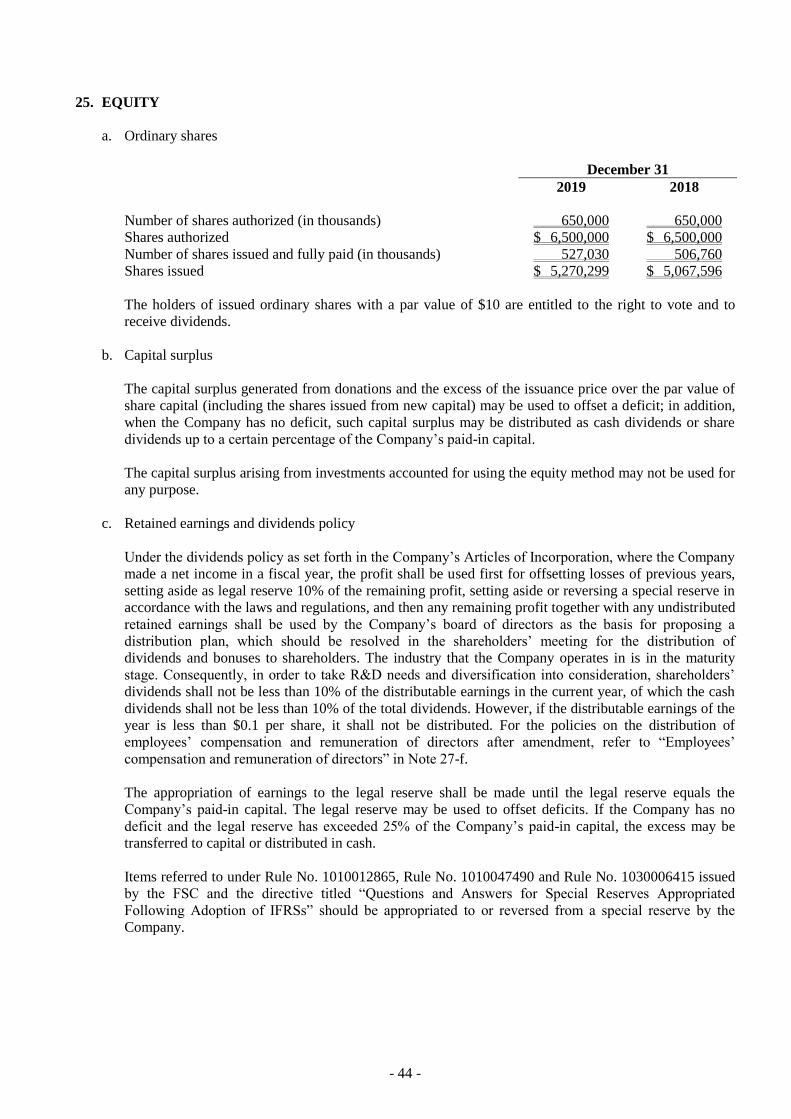
- 44 -
25. EQUITY
a. Ordinary shares
December 31
2019 2018
Number of shares authorized (in thousands) 650,000 650,000
Shares authorized $ 6,500,000 $ 6,500,000
Number of shares issued and fully paid (in thousands) 527,030 506,760
Shares issued $ 5,270,299 $ 5,067,596
The holders of issued ordinary shares with a par value of $10 are entitled to the right to vote and to
receive dividends.
b. Capital surplus
The capital surplus generated from donations and the excess of the issuance price over the par value of
share capital (including the shares issued from new capital) may be used to offset a deficit; in addition,
when the Company has no deficit, such capital surplus may be distributed as cash dividends or share
dividends up to a certain percentage of the Company’s paid-in capital.
The capital surplus arising from investments accounted for using the equity method may not be used for
any purpose.
c. Retained earnings and dividends policy
Under the dividends policy as set forth in the Company’s Articles of Incorporation, where the Company
made a net income in a fiscal year, the profit shall be used first for offsetting losses of previous years,
setting aside as legal reserve 10% of the remaining profit, setting aside or reversing a special reserve in
accordance with the laws and regulations, and then any remaining profit together with any undistributed
retained earnings shall be used by the Company’s board of directors as the basis for proposing a
distribution plan, which should be resolved in the shareholders’ meeting for the distribution of
dividends and bonuses to shareholders. The industry that the Company operates in is in the maturity
stage. Consequently, in order to take R&D needs and diversification into consideration, shareholders’
dividends shall not be less than 10% of the distributable earnings in the current year, of which the cash
dividends shall not be less than 10% of the total dividends. However, if the distributable earnings of the
year is less than $0.1 per share, it shall not be distributed. For the policies on the distribution of
employees’ compensation and remuneration of directors after amendment, refer to “Employees’
compensation and remuneration of directors” in Note 27-f.
The appropriation of earnings to the legal reserve shall be made until the legal reserve equals the
Company’s paid-in capital. The legal reserve may be used to offset deficits. If the Company has no
deficit and the legal reserve has exceeded 25% of the Company’s paid-in capital, the excess may be
transferred to capital or distributed in cash.
Items referred to under Rule No. 1010012865, Rule No. 1010047490 and Rule No. 1030006415 issued
by the FSC and the directive titled “Questions and Answers for Special Reserves Appropriated
Following Adoption of IFRSs” should be appropriated to or reversed from a special reserve by the
Company.
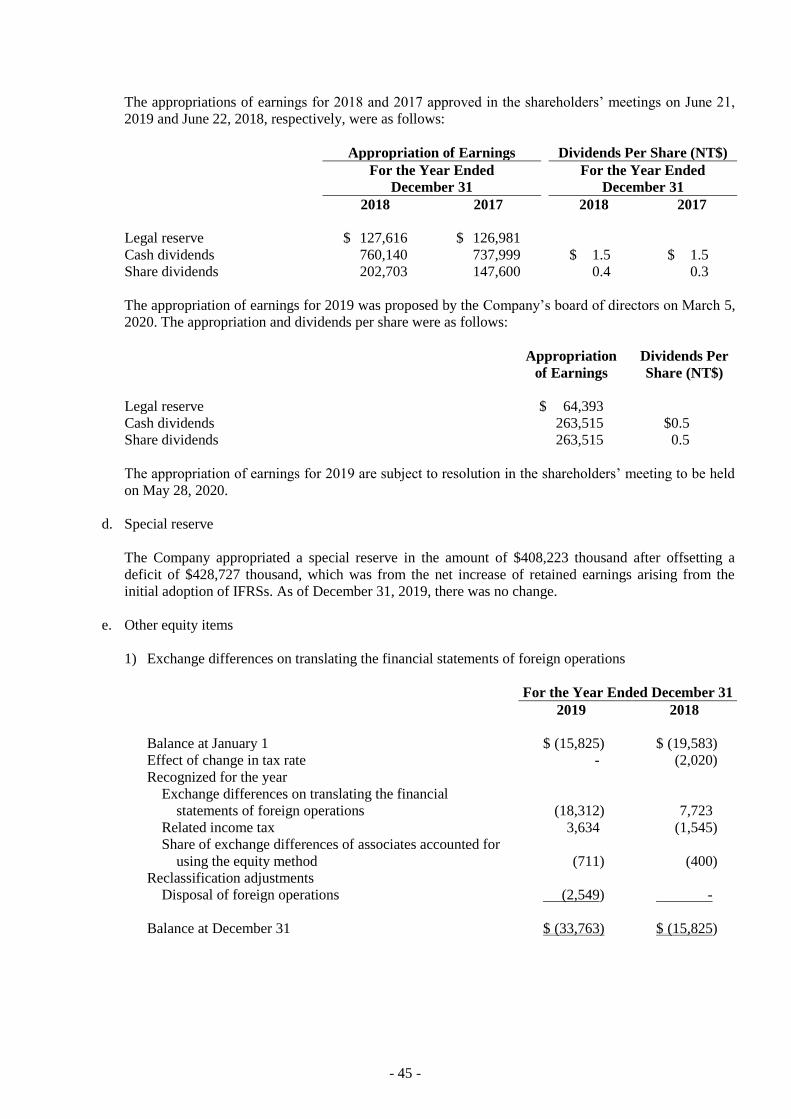
- 45 -
The appropriations of earnings for 2018 and 2017 approved in the shareholders’ meetings on June 21,
2019 and June 22, 2018, respectively, were as follows:
Appropriation of Earnings Dividends Per Share (NT$)
For the Year Ended
December 31
For the Year Ended
December 31
2018 2017 2018 2017
Legal reserve $ 127,616 $ 126,981
Cash dividends 760,140 737,999 $ 1.5 $ 1.5
Share dividends 202,703 147,600 0.4 0.3
The appropriation of earnings for 2019 was proposed by the Company’s board of directors on March 5,
2020. The appropriation and dividends per share were as follows:
Appropriation
of Earnings
Dividends Per
Share (NT$)
Legal reserve $ 64,393
Cash dividends 263,515 $0.5
Share dividends 263,515 0.5
The appropriation of earnings for 2019 are subject to resolution in the shareholders’ meeting to be held
on May 28, 2020.
d. Special reserve
The Company appropriated a special reserve in the amount of $408,223 thousand after offsetting a
deficit of $428,727 thousand, which was from the net increase of retained earnings arising from the
initial adoption of IFRSs. As of December 31, 2019, there was no change.
e. Other equity items
1) Exchange differences on translating the financial statements of foreign operations
For the Year Ended December 31
2019 2018
Balance at January 1 $ (15,825) $ (19,583)
Effect of change in tax rate - (2,020)
Recognized for the year
Exchange differences on translating the financial
statements of foreign operations (18,312) 7,723
Related income tax 3,634 (1,545)
Share of exchange differences of associates accounted for
using the equity method (711) (400)
Reclassification adjustments
Disposal of foreign operations (2,549) -
Balance at December 31 $ (33,763) $ (15,825)
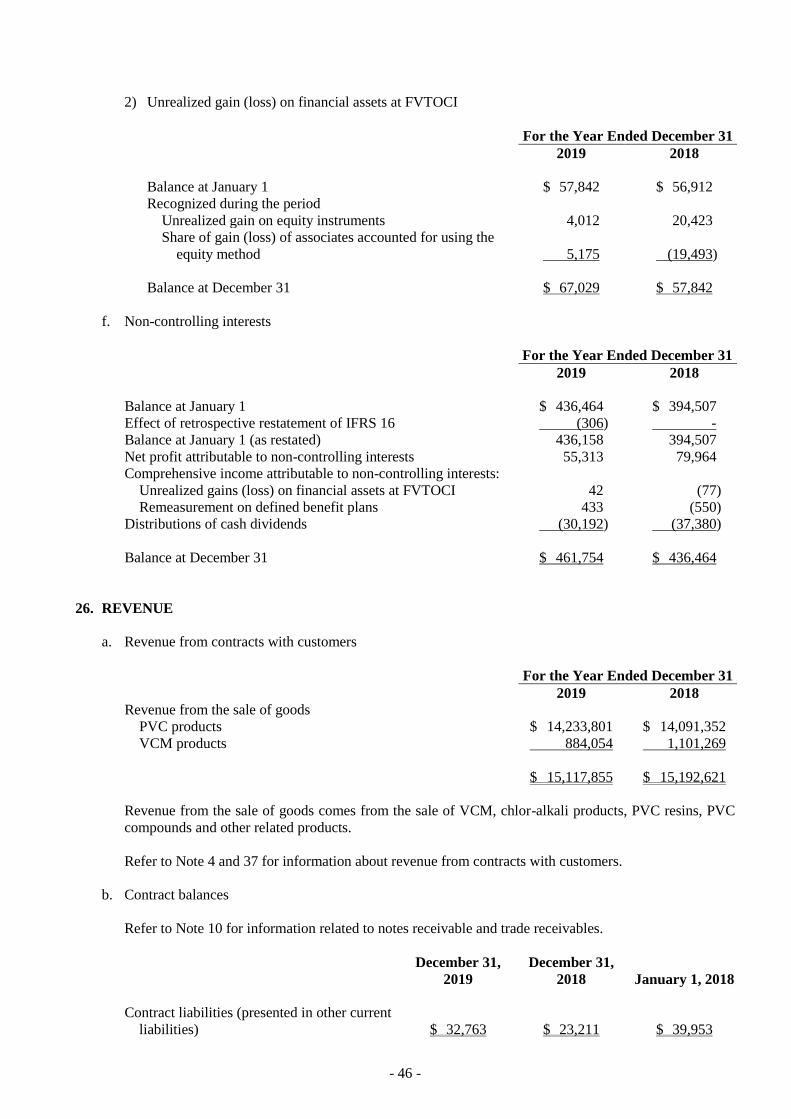
- 46 -
2) Unrealized gain (loss) on financial assets at FVTOCI
For the Year Ended December 31
2019 2018
Balance at January 1 $ 57,842 $ 56,912
Recognized during the period
Unrealized gain on equity instruments 4,012 20,423
Share of gain (loss) of associates accounted for using the
equity method 5,175 (19,493)
Balance at December 31 $ 67,029 $ 57,842
f. Non-controlling interests
For the Year Ended December 31
2019 2018
Balance at January 1 $ 436,464 $ 394,507
Effect of retrospective restatement of IFRS 16 (306) -
Balance at January 1 (as restated) 436,158 394,507
Net profit attributable to non-controlling interests 55,313 79,964
Comprehensive income attributable to non-controlling interests:
Unrealized gains (loss) on financial assets at FVTOCI 42 (77)
Remeasurement on defined benefit plans 433 (550)
Distributions of cash dividends (30,192) (37,380)
Balance at December 31 $ 461,754 $ 436,464
26. REVENUE
a. Revenue from contracts with customers
For the Year Ended December 31
2019 2018
Revenue from the sale of goods
PVC products $ 14,233,801 $ 14,091,352
VCM products 884,054 1,101,269
$ 15,117,855 $ 15,192,621
Revenue from the sale of goods comes from the sale of VCM, chlor-alkali products, PVC resins, PVC
compounds and other related products.
Refer to Note 4 and 37 for information about revenue from contracts with customers.
b. Contract balances
Refer to Note 10 for information related to notes receivable and trade receivables.
December 31,
2019
December 31,
2018 January 1, 2018
Contract liabilities (presented in other current
liabilities) $ 32,763 $ 23,211 $ 39,953
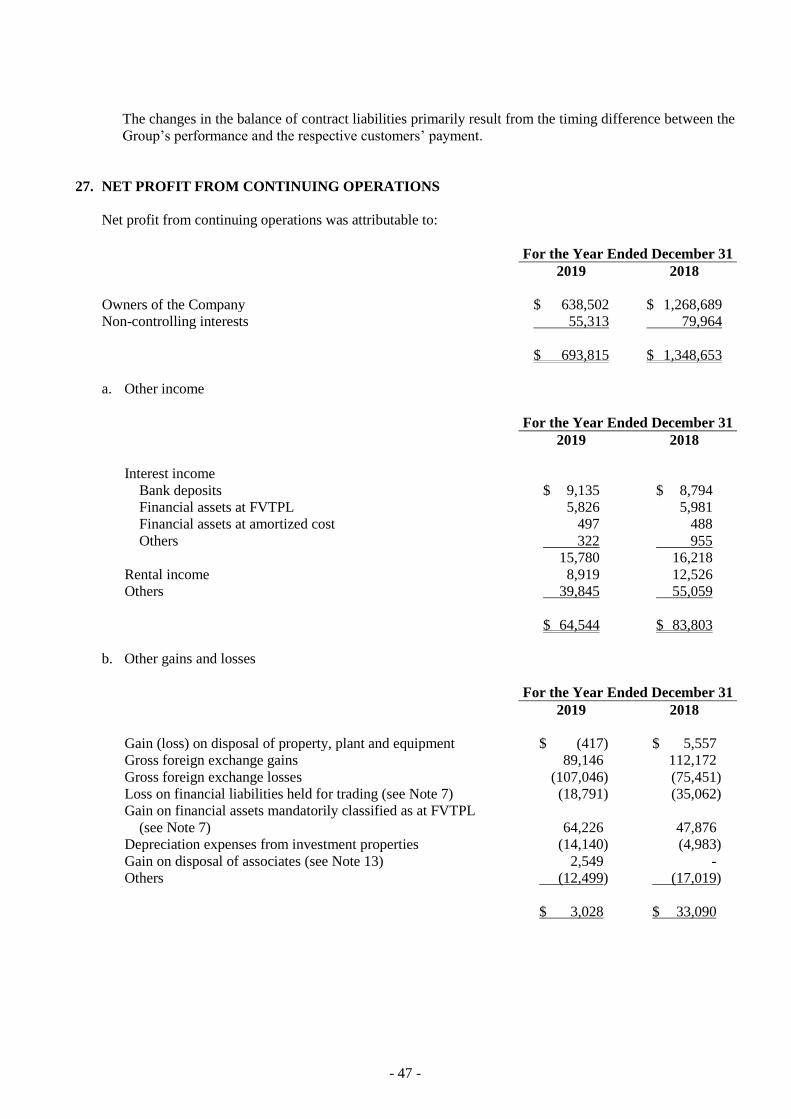
- 47 -
The changes in the balance of contract liabilities primarily result from the timing difference between the
Group’s performance and the respective customers’ payment.
27. NET PROFIT FROM CONTINUING OPERATIONS
Net profit from continuing operations was attributable to:
For the Year Ended December 31
2019 2018
Owners of the Company $ 638,502 $ 1,268,689
Non-controlling interests 55,313 79,964
$ 693,815 $ 1,348,653
a. Other income
For the Year Ended December 31
2019 2018
Interest income
Bank deposits $ 9,135 $ 8,794
Financial assets at FVTPL 5,826 5,981
Financial assets at amortized cost 497 488
Others 322 955
15,780 16,218
Rental income 8,919 12,526
Others 39,845 55,059
$ 64,544 $ 83,803
b. Other gains and losses
For the Year Ended December 31
2019 2018
Gain (loss) on disposal of property, plant and equipment $ (417) $ 5,557
Gross foreign exchange gains 89,146 112,172
Gross foreign exchange losses (107,046) (75,451)
Loss on financial liabilities held for trading (see Note 7) (18,791) (35,062)
Gain on financial assets mandatorily classified as at FVTPL
(see Note 7) 64,226 47,876
Depreciation expenses from investment properties (14,140) (4,983)
Gain on disposal of associates (see Note 13) 2,549 -
Others (12,499) (17,019)
$ 3,028 $ 33,090
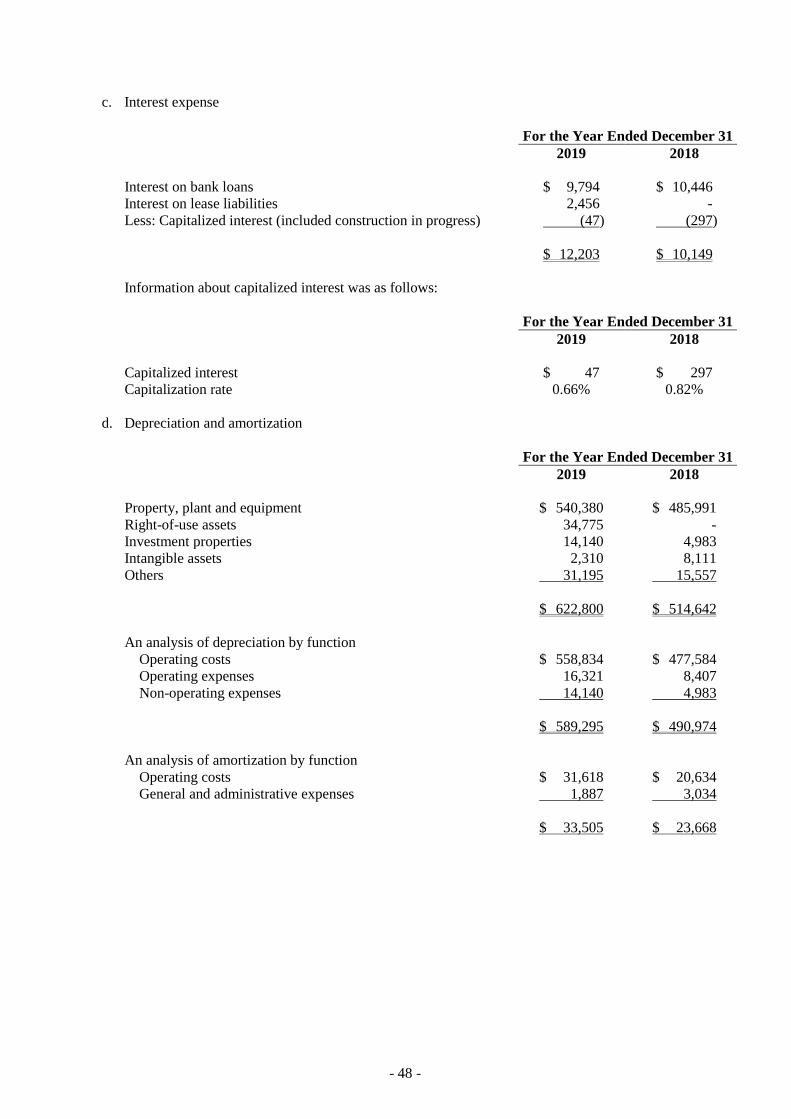
- 48 -
c. Interest expense
For the Year Ended December 31
2019 2018
Interest on bank loans $ 9,794 $ 10,446
Interest on lease liabilities 2,456 -
Less: Capitalized interest (included construction in progress) (47) (297)
$ 12,203 $ 10,149
Information about capitalized interest was as follows:
For the Year Ended December 31
2019 2018
Capitalized interest $ 47 $ 297
Capitalization rate 0.66% 0.82%
d. Depreciation and amortization
For the Year Ended December 31
2019 2018
Property, plant and equipment $ 540,380 $ 485,991
Right-of-use assets 34,775 -
Investment properties 14,140 4,983
Intangible assets 2,310 8,111
Others 31,195 15,557
$ 622,800 $ 514,642
An analysis of depreciation by function
Operating costs $ 558,834 $ 477,584
Operating expenses 16,321 8,407
Non-operating expenses 14,140 4,983
$ 589,295 $ 490,974
An analysis of amortization by function
Operating costs $ 31,618 $ 20,634
General and administrative expenses 1,887 3,034
$ 33,505 $ 23,668
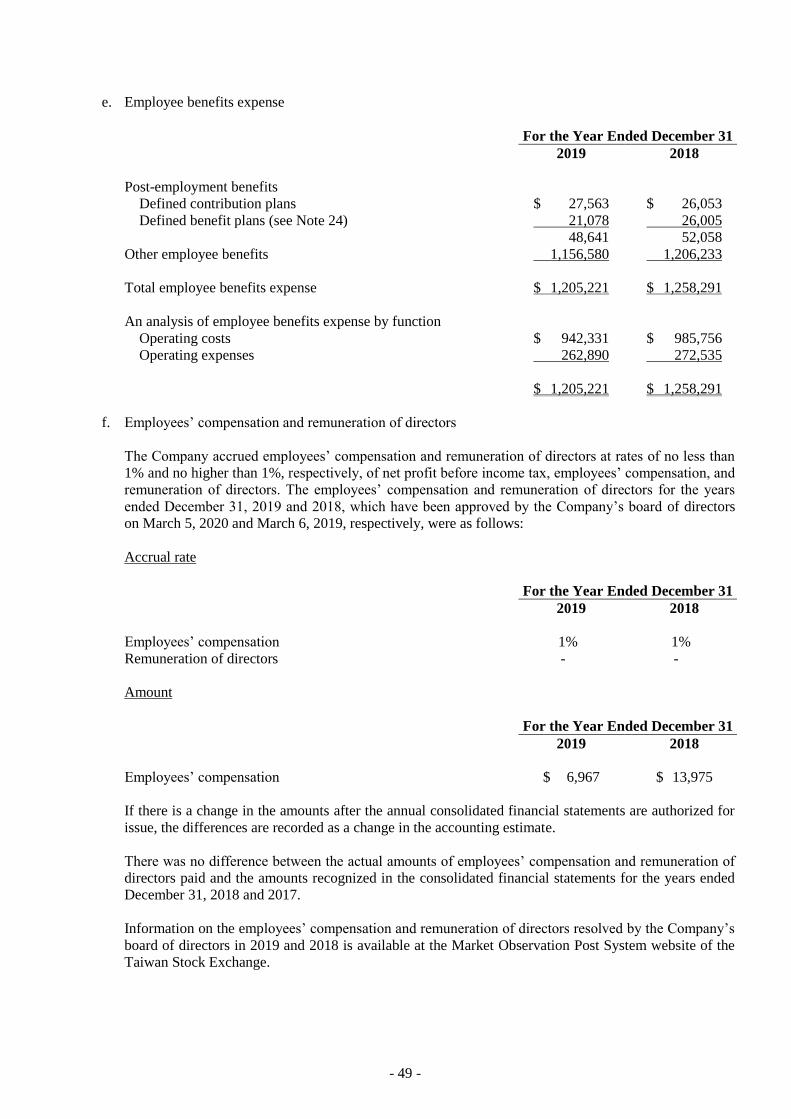
- 49 -
e. Employee benefits expense
For the Year Ended December 31
2019 2018
Post-employment benefits
Defined contribution plans $ 27,563 $ 26,053
Defined benefit plans (see Note 24) 21,078 26,005
48,641 52,058
Other employee benefits 1,156,580 1,206,233
Total employee benefits expense $ 1,205,221 $ 1,258,291
An analysis of employee benefits expense by function
Operating costs $ 942,331 $ 985,756
Operating expenses 262,890 272,535
$ 1,205,221 $ 1,258,291
f. Employees’ compensation and remuneration of directors
The Company accrued employees’ compensation and remuneration of directors at rates of no less than
1% and no higher than 1%, respectively, of net profit before income tax, employees’ compensation, and
remuneration of directors. The employees’ compensation and remuneration of directors for the years
ended December 31, 2019 and 2018, which have been approved by the Company’s board of directors
on March 5, 2020 and March 6, 2019, respectively, were as follows:
Accrual rate
For the Year Ended December 31
2019 2018
Employees’ compensation 1% 1%
Remuneration of directors - -
Amount
For the Year Ended December 31
2019 2018
Employees’ compensation $ 6,967 $ X $ 13,975
If there is a change in the amounts after the annual consolidated financial statements are authorized for
issue, the differences are recorded as a change in the accounting estimate.
There was no difference between the actual amounts of employees’ compensation and remuneration of
directors paid and the amounts recognized in the consolidated financial statements for the years ended
December 31, 2018 and 2017.
Information on the employees’ compensation and remuneration of directors resolved by the Company’s
board of directors in 2019 and 2018 is available at the Market Observation Post System website of the
Taiwan Stock Exchange.

- 50 -
28. INCOME TAX RELATING TO CONTINUING OPERATIONS
a. Income tax recognized in profit or loss
Major components of income tax expense (benefit) are as follows:
For the Year Ended December 31
2019 2018
Current tax
In respect of the current year $ 110,421 $ 238,997
Income tax on unappropriated earnings 14,390 33,067
Adjustments for prior years 647 20,708
125,458 292,772
Deferred tax
In respect of the current year 33,222 49,185
Adjustments for prior years (701) 1,722
Adjustments to deferred tax attributable to changes in tax rates
and laws - (40,873)
Others 2,214 2,893
34,735 12,927
Income tax expense recognized in profit or loss $ 160,193 $ 305,699
A reconciliation of accounting profit and income tax expense is as follows:
For the Year Ended December 31
2019 2018
Profit before tax from continuing operations $ 854,008 $ 1,654,352
Income tax expense calculated at the statutory rate $ 255,700 $ 493,579
Domestic investment gains accounted for using the equity
method (95,582) (153,666)
Others (15,907) (54,923)
Additional income tax under the Alternative Minimum Tax Act 4,491 37,973
Income tax on unappropriated earnings 14,390 33,067
Unrecognized deductible temporary differences (6,789) (35,452)
Adjustments to deferred tax attributable to changes in tax rates
and laws - (40,873)
Effect of different tax rates 3,943 3,564
Adjustments for prior years’ tax (53) 22,430
Income tax expense recognized in profit or loss $ 160,193 $ 305,699
The Income Tax Act in the ROC was amended in 2018, and the corporate income tax rate was adjusted
from 17% to 20%. However, the applicable corporate income tax rate used by the Company, TVCM
and CGPCPOL is 20%. In addition, the rate of the corporate surtax applicable to the 2018
unappropriated earnings was reduced from 10% to 5%. The applicable corporate income tax rate used
by the CGPC (ZS) and CGPC (CP) in China is 25%, while the applicable tax rate used by CGPC
America is a state tax rate of 9% and a federal tax rate is 21%, which was adjusted from 30% to 21%,
effective in 2018.
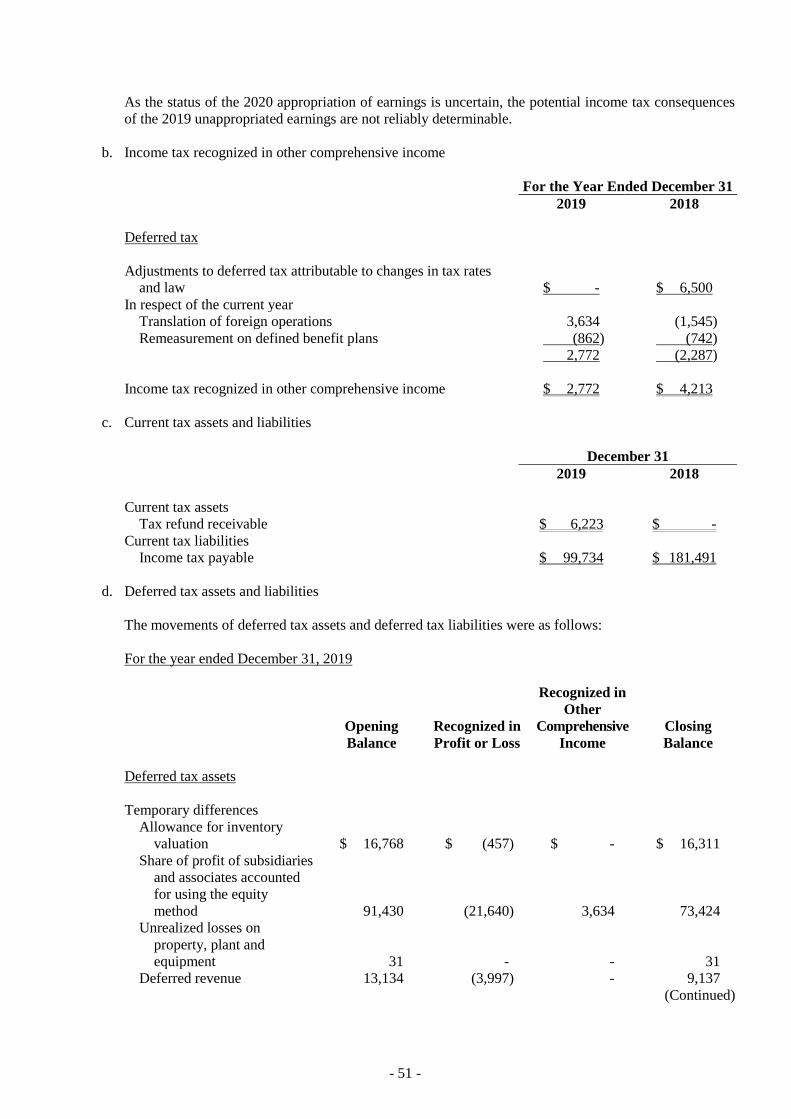
- 51 -
As the status of the 2020 appropriation of earnings is uncertain, the potential income tax consequences
of the 2019 unappropriated earnings are not reliably determinable.
b. Income tax recognized in other comprehensive income
For the Year Ended December 31
2019 2018
Deferred tax
Adjustments to deferred tax attributable to changes in tax rates
and law $ - $ 6,500
In respect of the current year
Translation of foreign operations 3,634 (1,545)
Remeasurement on defined benefit plans (862) (742)
2,772 (2,287)
Income tax recognized in other comprehensive income $ 2,772 $ 4,213
c. Current tax assets and liabilities
December 31
2019 2018
Current tax assets
Tax refund receivable $ 6,223 $ -
Current tax liabilities
Income tax payable $ 99,734 $ 181,491
d. Deferred tax assets and liabilities
The movements of deferred tax assets and deferred tax liabilities were as follows:
For the year ended December 31, 2019
Recognized in
Other
Opening Recognized in Comprehensive Closing
Balance Profit or Loss Income Balance
Deferred tax assets
Temporary differences
Allowance for inventory
valuation $ 16,768 $ (457) $ - $ 16,311
Share of profit of subsidiaries
and associates accounted
for using the equity
method 91,430 (21,640) 3,634 73,424
Unrealized losses on
property, plant and
equipment 31 - - 31
Deferred revenue 13,134 (3,997) - 9,137
(Continued)
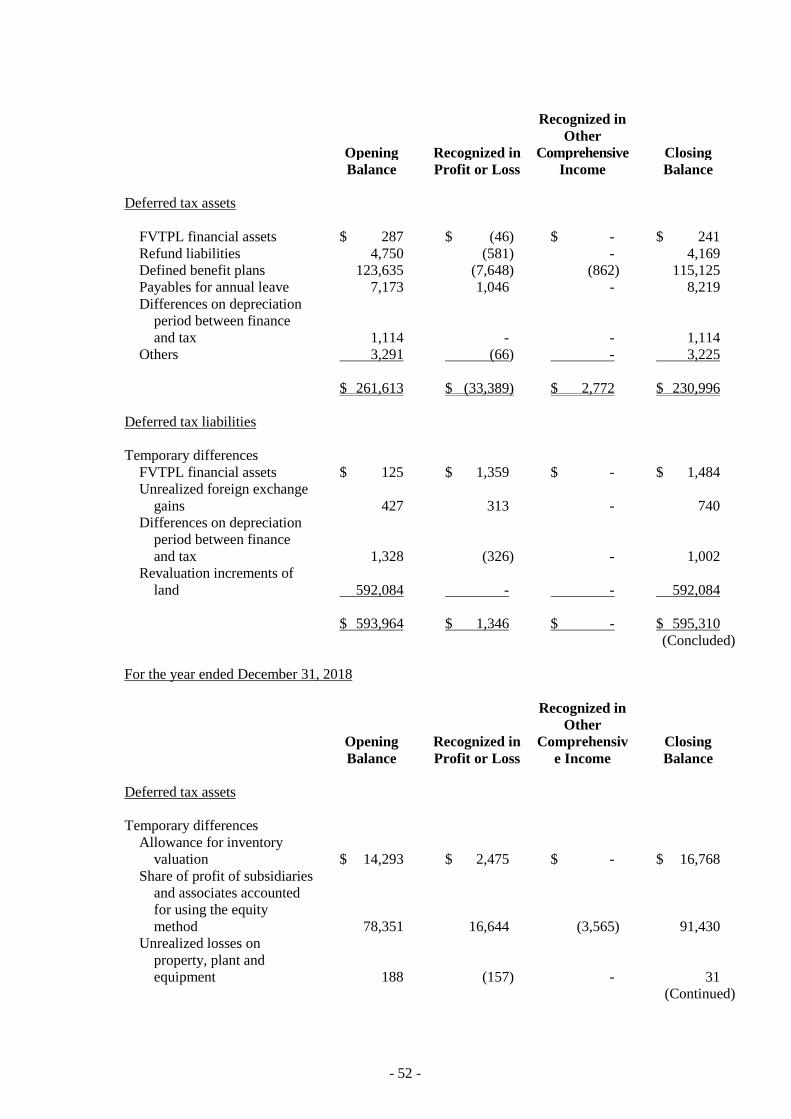
- 52 -
Recognized in
Other
Opening Recognized in Comprehensive Closing
Balance Profit or Loss Income Balance
Deferred tax assets
FVTPL financial assets $ 287 $ (46) $ - $ 241
Refund liabilities 4,750 (581) - 4,169
Defined benefit plans 123,635 (7,648) (862) 115,125
Payables for annual leave 7,173 1,046 - 8,219
Differences on depreciation
period between finance
and tax 1,114 - - 1,114
Others 3,291 (66) - 3,225
$ 261,613 $ (33,389) $ 2,772 $ 230,996
Deferred tax liabilities
Temporary differences
FVTPL financial assets $ 125 $ 1,359 $ - $ 1,484
Unrealized foreign exchange
gains 427 313 - 740
Differences on depreciation
period between finance
and tax 1,328 (326) - 1,002
Revaluation increments of
land 592,084 - - 592,084
$ 593,964 $ 1,346 $ - $ 595,310
(Concluded)
For the year ended December 31, 2018
Opening
Balance
Recognized in
Profit or Loss
Recognized in
Other
Comprehensiv
e Income
Closing
Balance
Deferred tax assets
Temporary differences
Allowance for inventory
valuation $ 14,293 $ 2,475 $ - $ 16,768
Share of profit of subsidiaries
and associates accounted
for using the equity
method 78,351 16,644 (3,565) 91,430
Unrealized losses on
property, plant and
equipment 188 (157) - 31
(Continued)
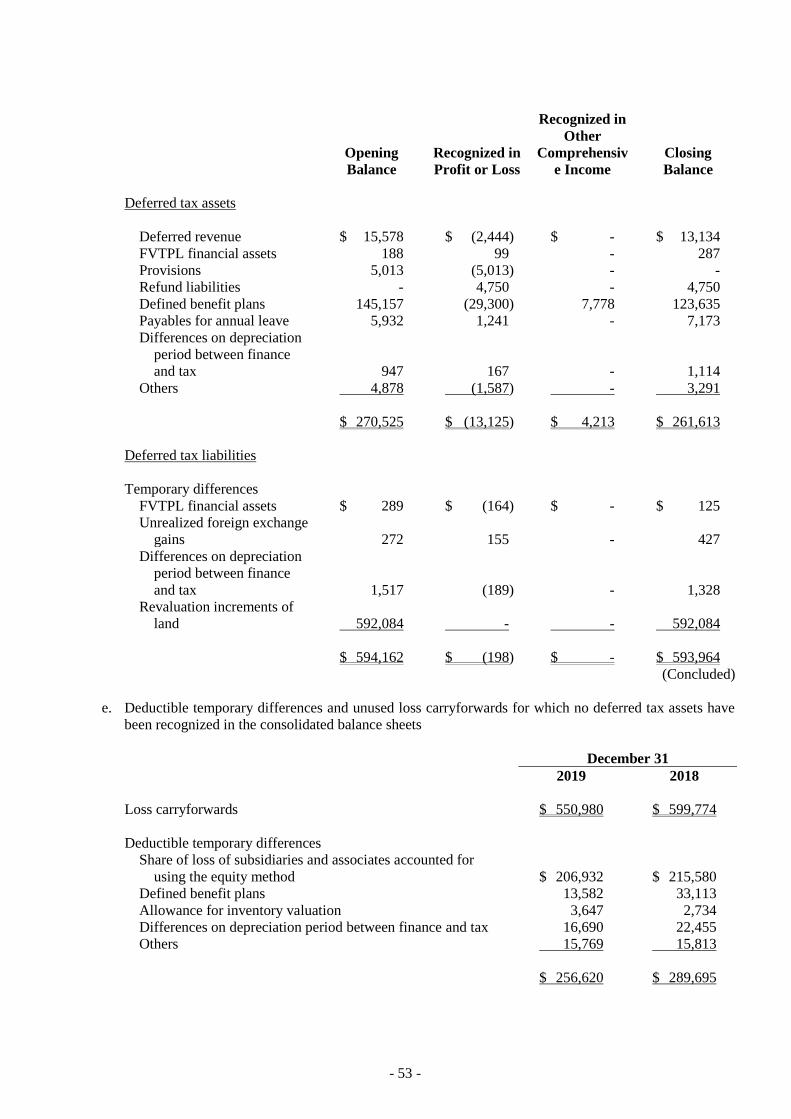
- 53 -
Opening
Balance
Recognized in
Profit or Loss
Recognized in
Other
Comprehensiv
e Income
Closing
Balance
Deferred tax assets
Deferred revenue $ 15,578 $ (2,444) $ - $ 13,134
FVTPL financial assets 188 99 - 287
Provisions 5,013 (5,013) - -
Refund liabilities - 4,750 - 4,750
Defined benefit plans 145,157 (29,300) 7,778 123,635
Payables for annual leave 5,932 1,241 - 7,173
Differences on depreciation
period between finance
and tax 947 167 - 1,114
Others 4,878 (1,587) - 3,291
$ 270,525 $ (13,125) $ 4,213 $ 261,613
Deferred tax liabilities
Temporary differences
FVTPL financial assets $ 289 $ (164) $ - $ 125
Unrealized foreign exchange
gains 272 155 - 427
Differences on depreciation
period between finance
and tax 1,517 (189) - 1,328
Revaluation increments of
land 592,084 - - 592,084
$ 594,162 $ (198) $ - $ 593,964
(Concluded)
e. Deductible temporary differences and unused loss carryforwards for which no deferred tax assets have
been recognized in the consolidated balance sheets
December 31
2019 2018
Loss carryforwards $ 550,980 $ 599,774
Deductible temporary differences
Share of loss of subsidiaries and associates accounted for
using the equity method $ 206,932 $ 215,580
Defined benefit plans 13,582 33,113
Allowance for inventory valuation 3,647 2,734
Differences on depreciation period between finance and tax 16,690 22,455
Others 15,769 15,813
$ 256,620 $ 289,695
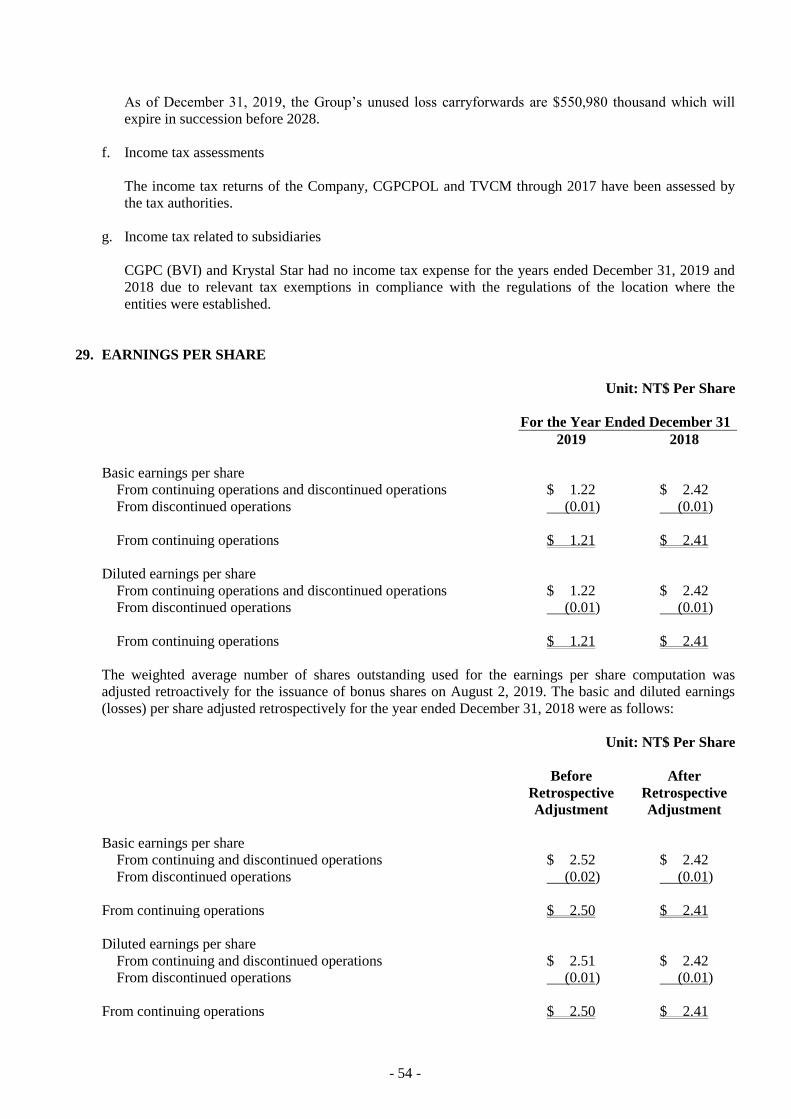
- 54 -
As of December 31, 2019, the Group’s unused loss carryforwards are $550,980 thousand which will
expire in succession before 2028.
f. Income tax assessments
The income tax returns of the Company, CGPCPOL and TVCM through 2017 have been assessed by
the tax authorities.
g. Income tax related to subsidiaries
CGPC (BVI) and Krystal Star had no income tax expense for the years ended December 31, 2019 and
2018 due to relevant tax exemptions in compliance with the regulations of the location where the
entities were established.
29. EARNINGS PER SHARE
Unit: NT$ Per Share
For the Year Ended December 31
2019 2018
Basic earnings per share
From continuing operations and discontinued operations $ 1.22 $ 2.42
From discontinued operations (0.01) (0.01)
From continuing operations $ 1.21 $ 2.41
Diluted earnings per share
From continuing operations and discontinued operations $ 1.22 $ 2.42
From discontinued operations (0.01) (0.01)
From continuing operations $ 1.21 $ 2.41
The weighted average number of shares outstanding used for the earnings per share computation was
adjusted retroactively for the issuance of bonus shares on August 2, 2019. The basic and diluted earnings
(losses) per share adjusted retrospectively for the year ended December 31, 2018 were as follows:
Unit: NT$ Per Share
Before
Retrospective
Adjustment
After
Retrospective
Adjustment
Basic earnings per share
From continuing and discontinued operations $ 2.52 $ 2.42
From discontinued operations (0.02) (0.01)
From continuing operations $ 2.50 $ 2.41
Diluted earnings per share
From continuing and discontinued operations $ 2.51 $ 2.42
From discontinued operations (0.01) (0.01)
From continuing operations $ 2.50 $ 2.41
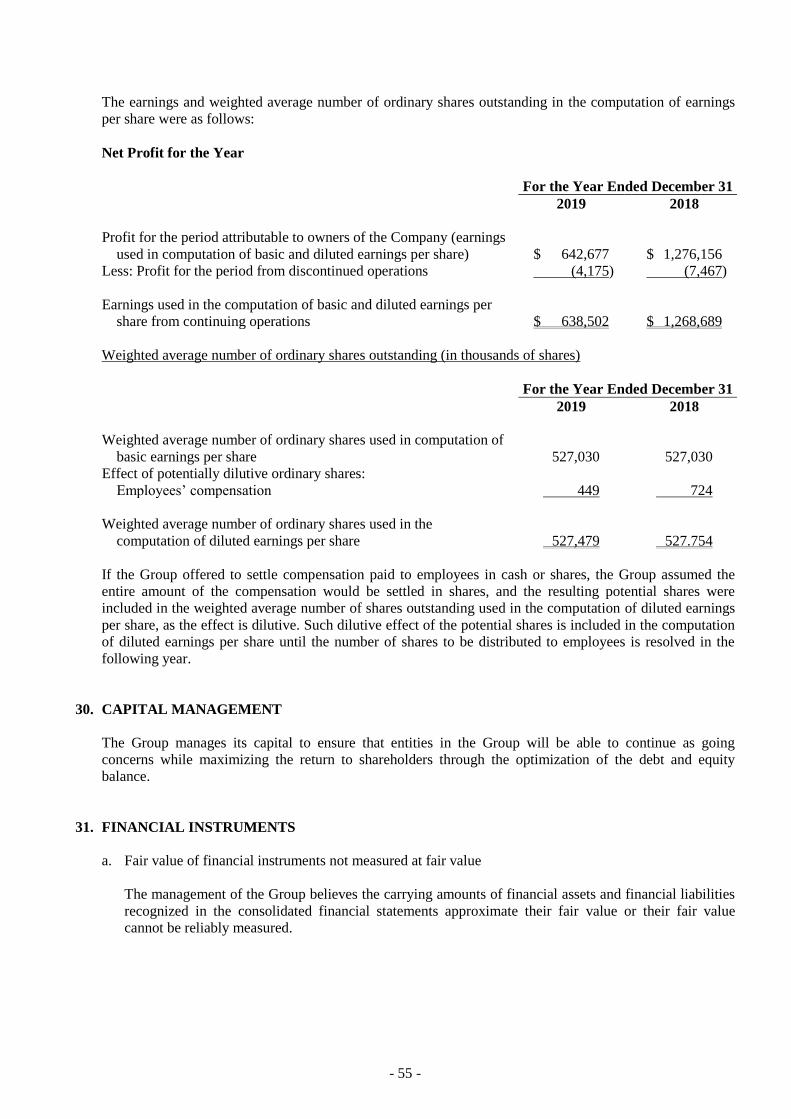
- 55 -
The earnings and weighted average number of ordinary shares outstanding in the computation of earnings
per share were as follows:
Net Profit for the Year
For the Year Ended December 31
2019 2018
Profit for the period attributable to owners of the Company (earnings
used in computation of basic and diluted earnings per share) $ 642,677 $ 1,276,156
Less: Profit for the period from discontinued operations (4,175) (7,467)
Earnings used in the computation of basic and diluted earnings per
share from continuing operations $ 638,502 $ 1,268,689
Weighted average number of ordinary shares outstanding (in thousands of shares)
For the Year Ended December 31
2019 2018
Weighted average number of ordinary shares used in computation of
basic earnings per share 527,030 527,030
Effect of potentially dilutive ordinary shares:
Employees’ compensation 449 724
Weighted average number of ordinary shares used in the
computation of diluted earnings per share 527,479 527.754
If the Group offered to settle compensation paid to employees in cash or shares, the Group assumed the
entire amount of the compensation would be settled in shares, and the resulting potential shares were
included in the weighted average number of shares outstanding used in the computation of diluted earnings
per share, as the effect is dilutive. Such dilutive effect of the potential shares is included in the computation
of diluted earnings per share until the number of shares to be distributed to employees is resolved in the
following year.
30. CAPITAL MANAGEMENT
The Group manages its capital to ensure that entities in the Group will be able to continue as going
concerns while maximizing the return to shareholders through the optimization of the debt and equity
balance.
31. FINANCIAL INSTRUMENTS
a. Fair value of financial instruments not measured at fair value
The management of the Group believes the carrying amounts of financial assets and financial liabilities
recognized in the consolidated financial statements approximate their fair value or their fair value
cannot be reliably measured.
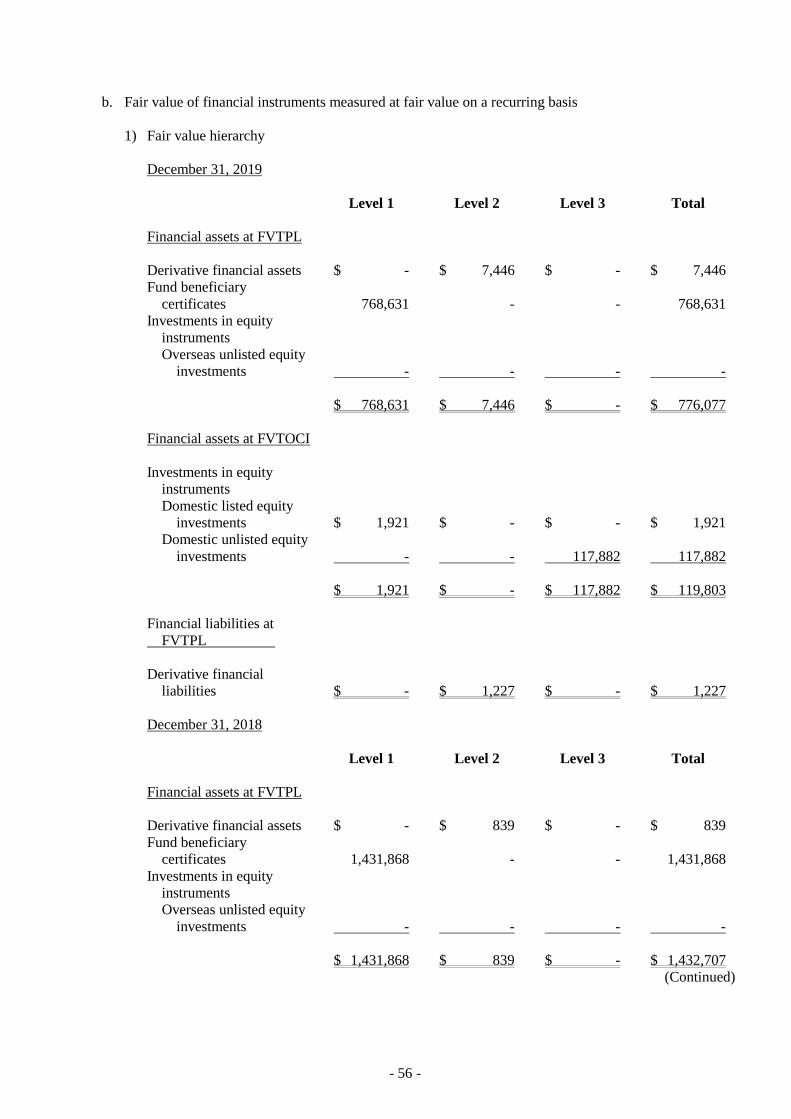
- 56 -
b. Fair value of financial instruments measured at fair value on a recurring basis
1) Fair value hierarchy
December 31, 2019
Level 1 Level 2 Level 3 Total
Financial assets at FVTPL
Derivative financial assets $ - $ 7,446 $ - $ 7,446
Fund beneficiary
certificates 768,631 - - 768,631
Investments in equity
instruments
Overseas unlisted equity
investments - - - -
$ 768,631 $ 7,446 $ - $ 776,077
Financial assets at FVTOCI
Investments in equity
instruments
Domestic listed equity
investments $ 1,921 $ - $ - $ 1,921
Domestic unlisted equity
investments - - 117,882 117,882
$ 1,921 $ - $ 117,882 $ 119,803
Financial liabilities at
FVTPL
Derivative financial
liabilities $ - $ 1,227 $ - $ 1,227
December 31, 2018
Level 1 Level 2 Level 3 Total
Financial assets at FVTPL
Derivative financial assets $ - $ 839 $ - $ 839
Fund beneficiary
certificates 1,431,868 - - 1,431,868
Investments in equity
instruments
Overseas unlisted equity
investments - - - -
$ 1,431,868 $ 839 $ - $ 1,432,707
(Continued)

- 57 -
Level 1 Level 2 Level 3 Total
Financial assets at FVTOCI
Investments in equity
instruments
Domestic listed equity
investments $ 1,593 $ - $ - $ 1,593
Domestic unlisted equity
investments - - 121,047 121,047
$ 1,593 $ - $ 121,047 $ 122,640
Financial liabilities at
FVTPL
Derivative financial
liabilities $ - $ 1,645 $ - $ 1,645
(Concluded)
There were no transfers between Levels 1 and 2 for the years ended December 31, 2019 and 2018.
2) Reconciliation of Level 3 fair value measurements of financial instruments
For the years ended December 31, 2019
Financial Assets
Financial Assets
at FVTOCI
Balance at January 1, 2019 $ 121,047
Recognized in other comprehensive income (included in unrealized gain on
financial assets at FVTOCI) 3,726
Return of capital (6,891)
Balance at December 31, 2019 $ 117,882
For the years ended December 31, 2018
Financial Assets
Financial Assets
at FVTOCI
Balance at January 1, 2018 $ 107,562
Recognized in other comprehensive income (included in unrealized gain on
financial assets at FVTOCI) 20,947
Return of capital (7,462)
Balance at December 31, 2018 $ 121,047
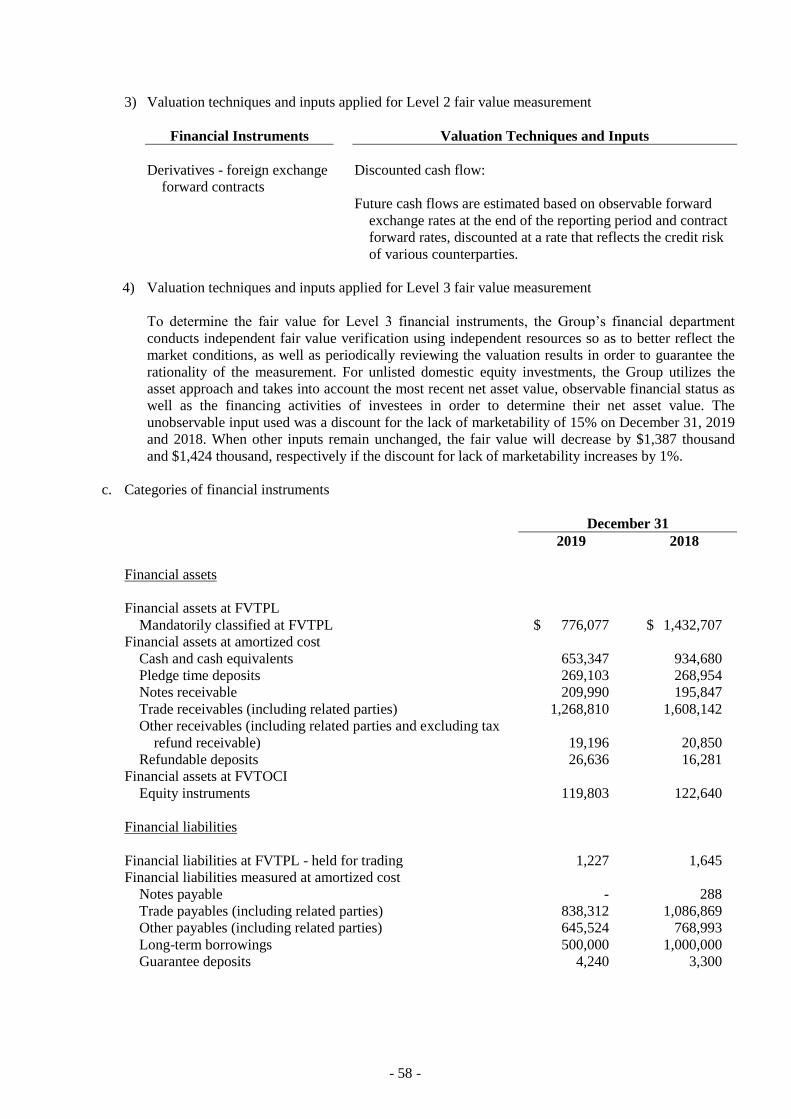
- 58 -
3) Valuation techniques and inputs applied for Level 2 fair value measurement
Financial Instruments Valuation Techniques and Inputs
Derivatives - foreign exchange
forward contracts
Discounted cash flow:
Future cash flows are estimated based on observable forward
exchange rates at the end of the reporting period and contract
forward rates, discounted at a rate that reflects the credit risk
of various counterparties.
4) Valuation techniques and inputs applied for Level 3 fair value measurement
To determine the fair value for Level 3 financial instruments, the Group’s financial department
conducts independent fair value verification using independent resources so as to better reflect the
market conditions, as well as periodically reviewing the valuation results in order to guarantee the
rationality of the measurement. For unlisted domestic equity investments, the Group utilizes the
asset approach and takes into account the most recent net asset value, observable financial status as
well as the financing activities of investees in order to determine their net asset value. The
unobservable input used was a discount for the lack of marketability of 15% on December 31, 2019
and 2018. When other inputs remain unchanged, the fair value will decrease by $1,387 thousand
and $1,424 thousand, respectively if the discount for lack of marketability increases by 1%.
c. Categories of financial instruments
December 31
2019 2018
Financial assets
Financial assets at FVTPL
Mandatorily classified at FVTPL $ 776,077 $ 1,432,707
Financial assets at amortized cost
Cash and cash equivalents 653,347 934,680
Pledge time deposits 269,103 268,954
Notes receivable 209,990 195,847
Trade receivables (including related parties) 1,268,810 1,608,142
Other receivables (including related parties and excluding tax
refund receivable) 19,196 20,850
Refundable deposits 26,636 16,281
Financial assets at FVTOCI
Equity instruments 119,803 122,640
Financial liabilities
Financial liabilities at FVTPL - held for trading 1,227 1,645
Financial liabilities measured at amortized cost
Notes payable - 288
Trade payables (including related parties) 838,312 1,086,869
Other payables (including related parties) 645,524 768,993
Long-term borrowings 500,000 1,000,000
Guarantee deposits 4,240 3,300
- 59 -
d. Financial risk management objectives and policies
The Group’s conduct of risk controlling and hedging strategy is influenced by the operational
environment. The Group monitors and manages the financial risk by business nature and risk
dispersion.
These risks include market risk (including foreign currency risk, interest rate risk and other price risk),
credit risk and liquidity risk.
1) Market risk
The Group’s operating activities exposed itself primarily to the market risks of changes in foreign
currency exchange rates and interest rates.
There has been no change to the Group’s exposure to market risks or the manner in which these
risks were managed and measured.
a) Foreign currency risk
The Group conducted foreign currency sales and purchases, which exposed the Group to foreign
currency risk. In order to avoid the impact of foreign currency exchange rate changes, which
lead to deductions in foreign currency denominated assets and fluctuations in their future cash
flows, the Group maintains a balance of hedged net foreign currency denominated assets and
liabilities. The Group also utilizes foreign exchange forward contracts to hedge the currency
exposure. The use of foreign exchange forward contracts is regulated by the policies passed by
the Group’s board of directors. Internal auditors focus on reviewing the observance of the
policies and the quota of risk exposures. The foreign exchange forward contracts that the Group
engaged in were not for speculation purposes.
The carrying amounts of the Group’s foreign currency denominated monetary assets and
monetary liabilities at the end of the reporting period are set out in Note 35.
Sensitivity analysis
The Group’s sensitivity analysis mainly focuses on the foreign currency risk of U.S. dollars at
the end of the reporting period. Assuming a 3% strengthening/weakening of the functional
currency against U.S. dollars, the net income before tax for the years ended December 31, 2019
and 2018 would have decreased/increased by $26,998 thousand and $30,688 thousand,
respectively.
In management’s opinion, the sensitivity analysis was unrepresentative of the inherent foreign
currency risk because the exposure at the end of the reporting period did not reflect the exposure
during the period.
b) Interest rate risk
The Group was exposed to the fair value risk of interest rate fluctuations for the fixed interest
rate bearing financial assets and financial liabilities; the Group was exposed to the cash flow
risk of interest rate fluctuations for the floating interest rate bearing financial assets and
financial liabilities. The Group’s management regularly monitors the fluctuations on market
rates and then adjusted its balance of floating rate bearing financial liabilities to make the
Group’s interest rates more closely approach market rates in response to the interest rate risk.
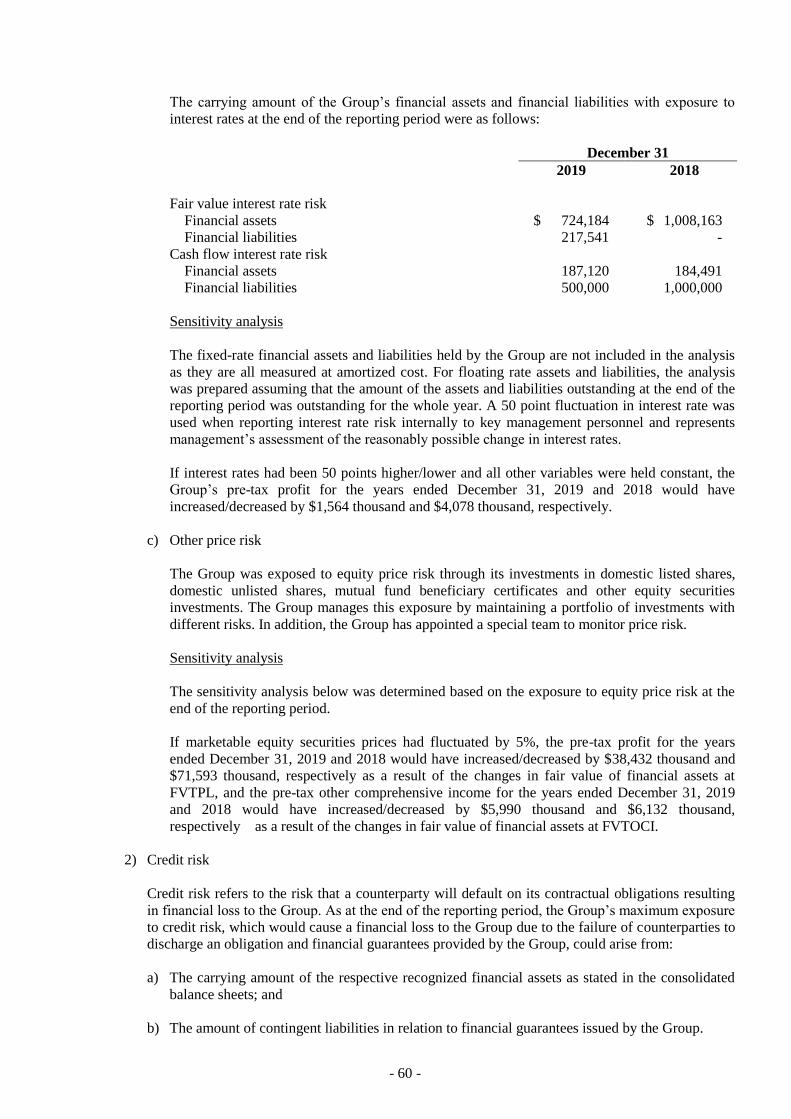
- 60 -
The carrying amount of the Group’s financial assets and financial liabilities with exposure to
interest rates at the end of the reporting period were as follows:
December 31
2019 2018
Fair value interest rate risk
Financial assets $ 724,184 $ 1,008,163
Financial liabilities 217,541 -
Cash flow interest rate risk
Financial assets 187,120 184,491
Financial liabilities 500,000 1,000,000
Sensitivity analysis
The fixed-rate financial assets and liabilities held by the Group are not included in the analysis
as they are all measured at amortized cost. For floating rate assets and liabilities, the analysis
was prepared assuming that the amount of the assets and liabilities outstanding at the end of the
reporting period was outstanding for the whole year. A 50 point fluctuation in interest rate was
used when reporting interest rate risk internally to key management personnel and represents
management’s assessment of the reasonably possible change in interest rates.
If interest rates had been 50 points higher/lower and all other variables were held constant, the
Group’s pre-tax profit for the years ended December 31, 2019 and 2018 would have
increased/decreased by $1,564 thousand and $4,078 thousand, respectively.
c) Other price risk
The Group was exposed to equity price risk through its investments in domestic listed shares,
domestic unlisted shares, mutual fund beneficiary certificates and other equity securities
investments. The Group manages this exposure by maintaining a portfolio of investments with
different risks. In addition, the Group has appointed a special team to monitor price risk.
Sensitivity analysis
The sensitivity analysis below was determined based on the exposure to equity price risk at the
end of the reporting period.
If marketable equity securities prices had fluctuated by 5%, the pre-tax profit for the years
ended December 31, 2019 and 2018 would have increased/decreased by $38,432 thousand and
$71,593 thousand, respectively as a result of the changes in fair value of financial assets at
FVTPL, and the pre-tax other comprehensive income for the years ended December 31, 2019
and 2018 would have increased/decreased by $5,990 thousand and $6,132 thousand,
respectively as a result of the changes in fair value of financial assets at FVTOCI.
2) Credit risk
Credit risk refers to the risk that a counterparty will default on its contractual obligations resulting
in financial loss to the Group. As at the end of the reporting period, the Group’s maximum exposure
to credit risk, which would cause a financial loss to the Group due to the failure of counterparties to
discharge an obligation and financial guarantees provided by the Group, could arise from:
a) The carrying amount of the respective recognized financial assets as stated in the consolidated
balance sheets; and
b) The amount of contingent liabilities in relation to financial guarantees issued by the Group.
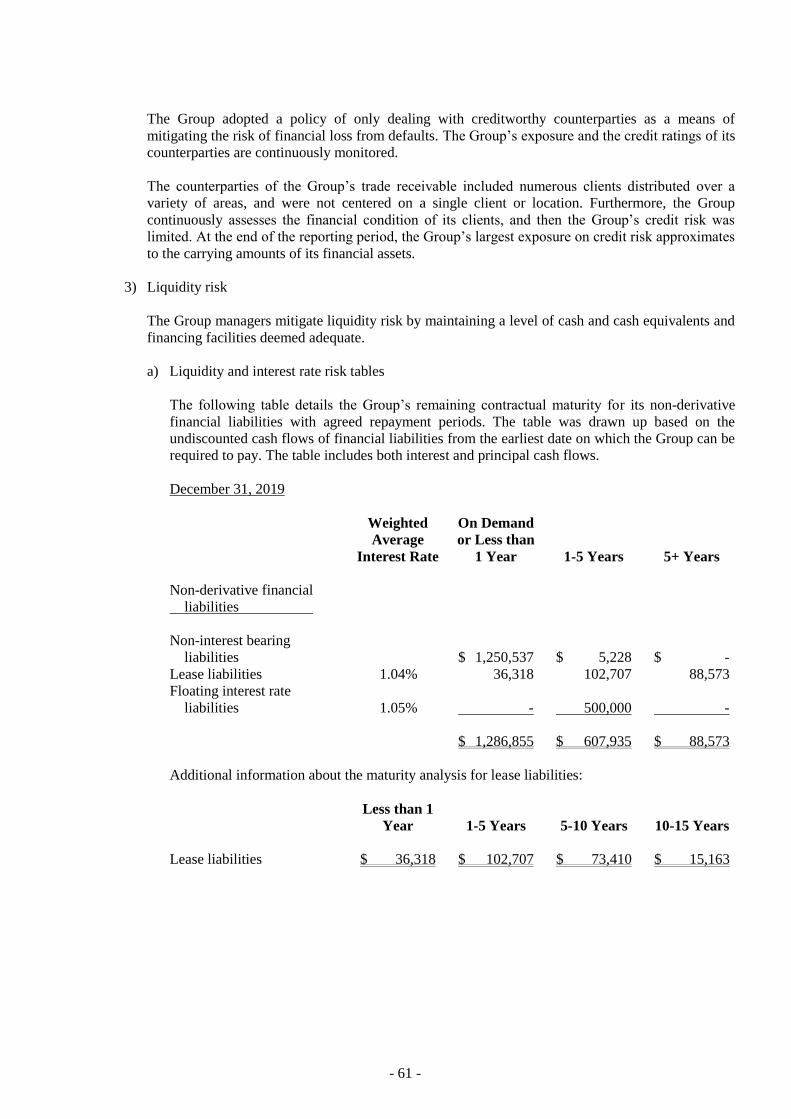
- 61 -
The Group adopted a policy of only dealing with creditworthy counterparties as a means of
mitigating the risk of financial loss from defaults. The Group’s exposure and the credit ratings of its
counterparties are continuously monitored.
The counterparties of the Group’s trade receivable included numerous clients distributed over a
variety of areas, and were not centered on a single client or location. Furthermore, the Group
continuously assesses the financial condition of its clients, and then the Group’s credit risk was
limited. At the end of the reporting period, the Group’s largest exposure on credit risk approximates
to the carrying amounts of its financial assets.
3) Liquidity risk
The Group managers mitigate liquidity risk by maintaining a level of cash and cash equivalents and
financing facilities deemed adequate.
a) Liquidity and interest rate risk tables
The following table details the Group’s remaining contractual maturity for its non-derivative
financial liabilities with agreed repayment periods. The table was drawn up based on the
undiscounted cash flows of financial liabilities from the earliest date on which the Group can be
required to pay. The table includes both interest and principal cash flows.
December 31, 2019
Weighted
Average
Interest Rate
On Demand
or Less than
1 Year 1-5 Years 5+ Years
Non-derivative financial
liabilities
Non-interest bearing
liabilities $ 1,250,537 $ 5,228 $ -
Lease liabilities 1.04% 36,318 102,707 88,573
Floating interest rate
liabilities 1.05% - 500,000 -
$ 1,286,855 $ 607,935 $ 88,573
Additional information about the maturity analysis for lease liabilities:
Less than 1
Year 1-5 Years 5-10 Years 10-15 Years
Lease liabilities $ 36,318 $ 102,707 $ 73,410 $ 15,163
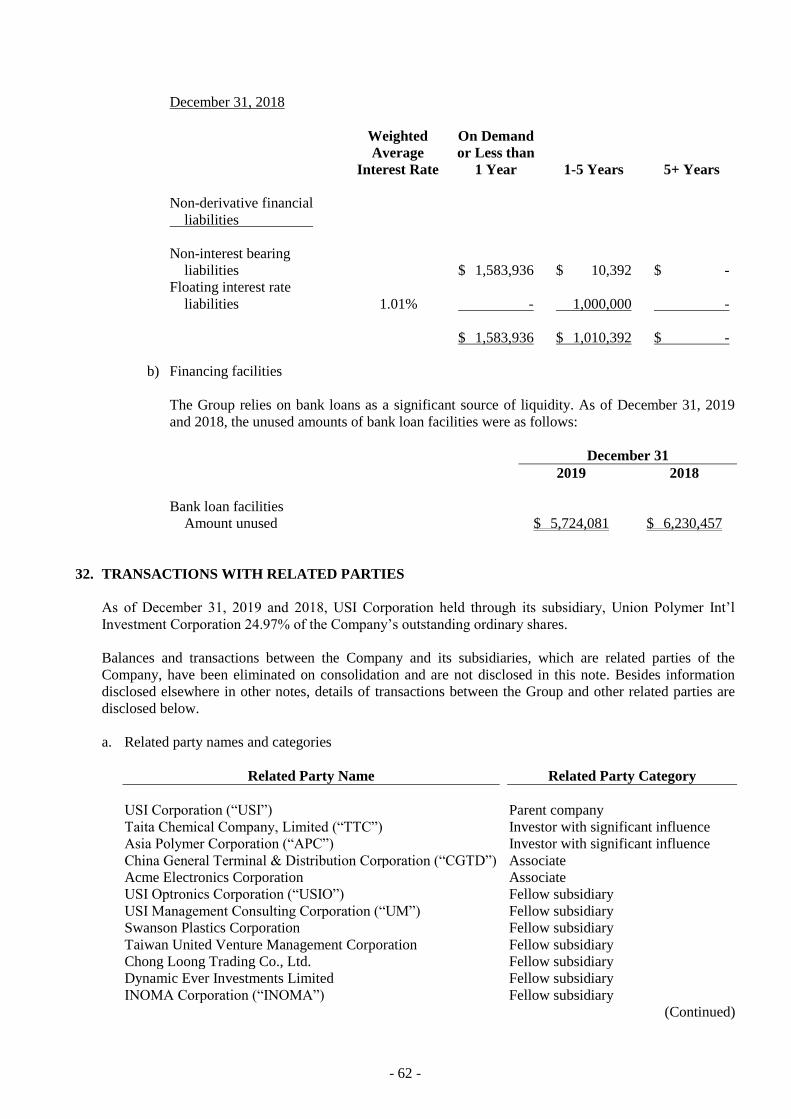
- 62 -
December 31, 2018
Weighted
Average
Interest Rate
On Demand
or Less than
1 Year 1-5 Years 5+ Years
Non-derivative financial
liabilities
Non-interest bearing
liabilities $ 1,583,936 $ 10,392 $ -
Floating interest rate
liabilities 1.01% - 1,000,000 -
$ 1,583,936 $ 1,010,392 $ -
b) Financing facilities
The Group relies on bank loans as a significant source of liquidity. As of December 31, 2019
and 2018, the unused amounts of bank loan facilities were as follows:
December 31
2019 2018
Bank loan facilities
Amount unused $ 5,724,081 $ 6,230,457
32. TRANSACTIONS WITH RELATED PARTIES
As of December 31, 2019 and 2018, USI Corporation held through its subsidiary, Union Polymer Int’l
Investment Corporation 24.97% of the Company’s outstanding ordinary shares.
Balances and transactions between the Company and its subsidiaries, which are related parties of the
Company, have been eliminated on consolidation and are not disclosed in this note. Besides information
disclosed elsewhere in other notes, details of transactions between the Group and other related parties are
disclosed below.
a. Related party names and categories
Related Party Name Related Party Category
USI Corporation (“USI”) Parent company
Taita Chemical Company, Limited (“TTC”) Investor with significant influence
Asia Polymer Corporation (“APC”) Investor with significant influence
China General Terminal & Distribution Corporation (“CGTD”) Associate
Acme Electronics Corporation Associate
USI Optronics Corporation (“USIO”) Fellow subsidiary
USI Management Consulting Corporation (“UM”) Fellow subsidiary
Swanson Plastics Corporation Fellow subsidiary
Taiwan United Venture Management Corporation Fellow subsidiary
Chong Loong Trading Co., Ltd. Fellow subsidiary
Dynamic Ever Investments Limited Fellow subsidiary
INOMA Corporation (“INOMA”) Fellow subsidiary
(Continued)
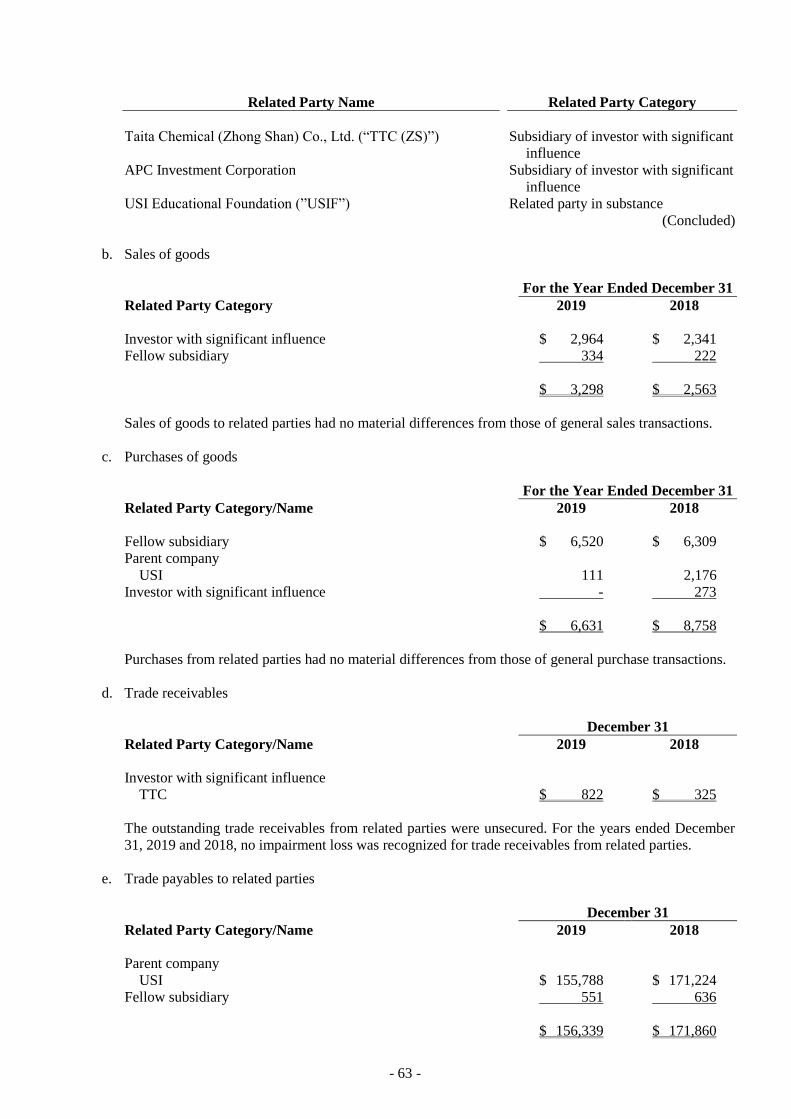
- 63 -
Related Party Name Related Party Category
Taita Chemical (Zhong Shan) Co., Ltd. (“TTC (ZS)”) Subsidiary of investor with significant
influence
APC Investment Corporation Subsidiary of investor with significant
influence
USI Educational Foundation (”USIF”) Related party in substance
(Concluded)
b. Sales of goods
For the Year Ended December 31
Related Party Category 2019 2018
Investor with significant influence $ 2,964 $ 2,341
Fellow subsidiary 334 222
$ 3,298 $ 2,563
Sales of goods to related parties had no material differences from those of general sales transactions.
c. Purchases of goods
For the Year Ended December 31
Related Party Category/Name 2019 2018
Fellow subsidiary $ 6,520 $ 6,309
Parent company
USI 111 2,176
Investor with significant influence - 273
$ 6,631 $ 8,758
Purchases from related parties had no material differences from those of general purchase transactions.
d. Trade receivables
December 31
Related Party Category/Name 2019 2018
Investor with significant influence
TTC $ 822 $ 325
The outstanding trade receivables from related parties were unsecured. For the years ended December
31, 2019 and 2018, no impairment loss was recognized for trade receivables from related parties.
e. Trade payables to related parties
December 31
Related Party Category/Name 2019 2018
Parent company
USI $ 155,788 $ 171,224
Fellow subsidiary 551 636
$ 156,339 $ 171,860
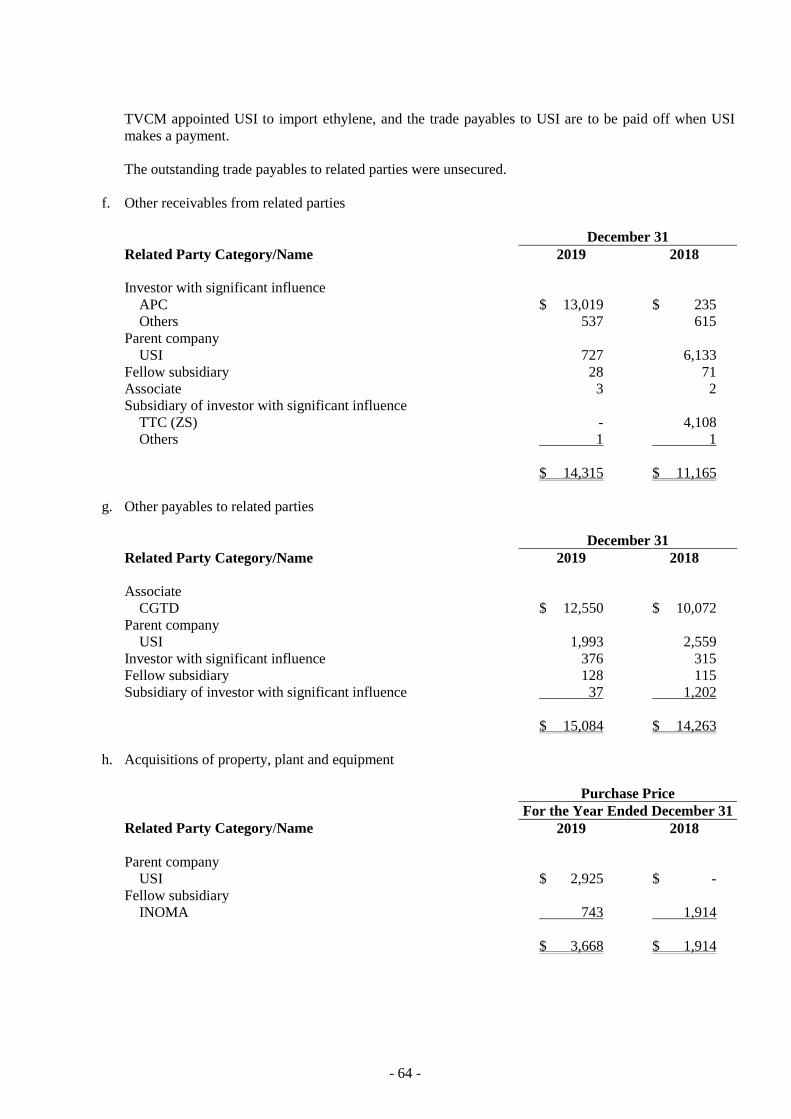
- 64 -
TVCM appointed USI to import ethylene, and the trade payables to USI are to be paid off when USI
makes a payment.
The outstanding trade payables to related parties were unsecured.
f. Other receivables from related parties
December 31
Related Party Category/Name 2019 2018
Investor with significant influence
APC $ 13,019 $ 235
Others 537 615
Parent company
USI 727 6,133
Fellow subsidiary 28 71
Associate 3 2
Subsidiary of investor with significant influence
TTC (ZS) - 4,108
Others 1 1
$ 14,315 $ 11,165
g. Other payables to related parties
December 31
Related Party Category/Name 2019 2018
Associate
CGTD $ 12,550 $ 10,072
Parent company
USI 1,993 2,559
Investor with significant influence 376 315
Fellow subsidiary 128 115
Subsidiary of investor with significant influence 37 1,202
$ 15,084 $ 14,263
h. Acquisitions of property, plant and equipment
Purchase Price
For the Year Ended December 31
Related Party Category/Name 2019 2018
Parent company
USI $ 2,925 $ -
Fellow subsidiary
INOMA 743 1,914
$ 3,668 $ 1,914
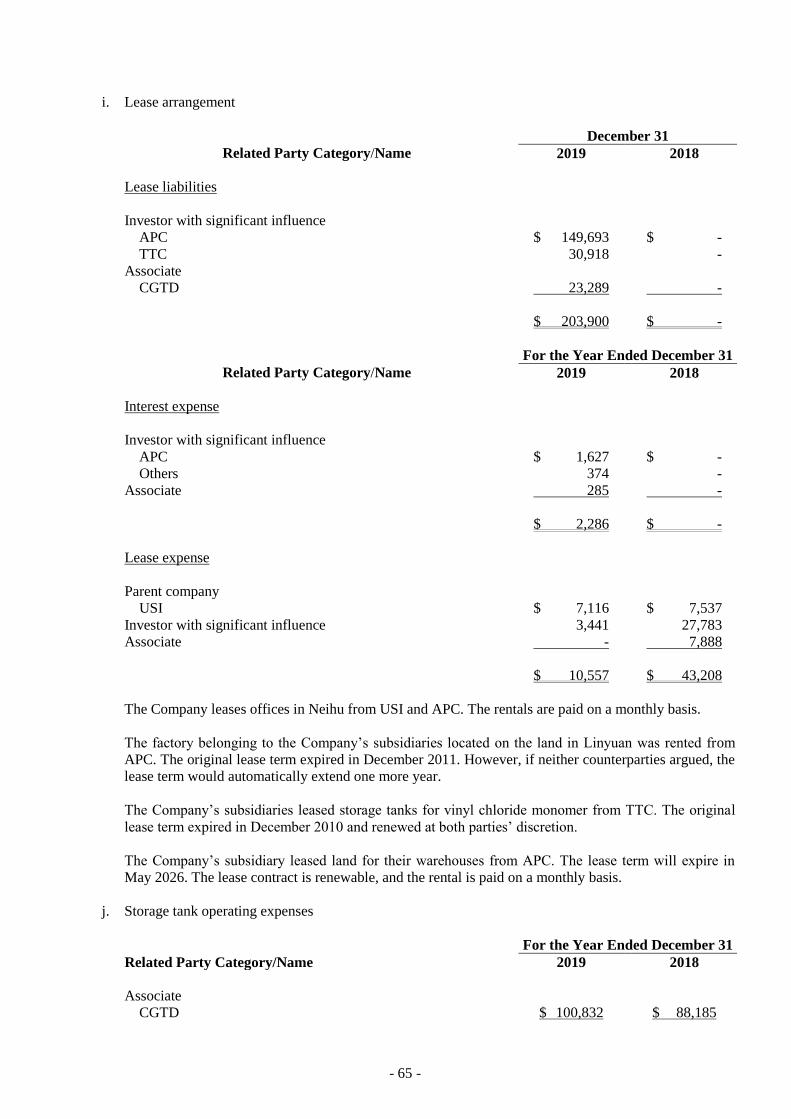
- 65 -
i. Lease arrangement
December 31
Related Party Category/Name 2019 2018
Lease liabilities
Investor with significant influence
APC $ 149,693 $ -
TTC 30,918 -
Associate
CGTD 23,289 -
$ 203,900 $ -
For the Year Ended December 31
Related Party Category/Name 2019 2018
Interest expense
Investor with significant influence
APC $ 1,627 $ -
Others 374 -
Associate 285 -
$ 2,286 $ -
Lease expense
Parent company
USI $ 7,116 $ 7,537
Investor with significant influence 3,441 27,783
Associate - 7,888
$ 10,557 $ 43,208
The Company leases offices in Neihu from USI and APC. The rentals are paid on a monthly basis.
The factory belonging to the Company’s subsidiaries located on the land in Linyuan was rented from
APC. The original lease term expired in December 2011. However, if neither counterparties argued, the
lease term would automatically extend one more year.
The Company’s subsidiaries leased storage tanks for vinyl chloride monomer from TTC. The original
lease term expired in December 2010 and renewed at both parties’ discretion.
The Company’s subsidiary leased land for their warehouses from APC. The lease term will expire in
May 2026. The lease contract is renewable, and the rental is paid on a monthly basis.
j. Storage tank operating expenses
For the Year Ended December 31
Related Party Category/Name 2019 2018
Associate
CGTD $ 100,832 $ 88,185
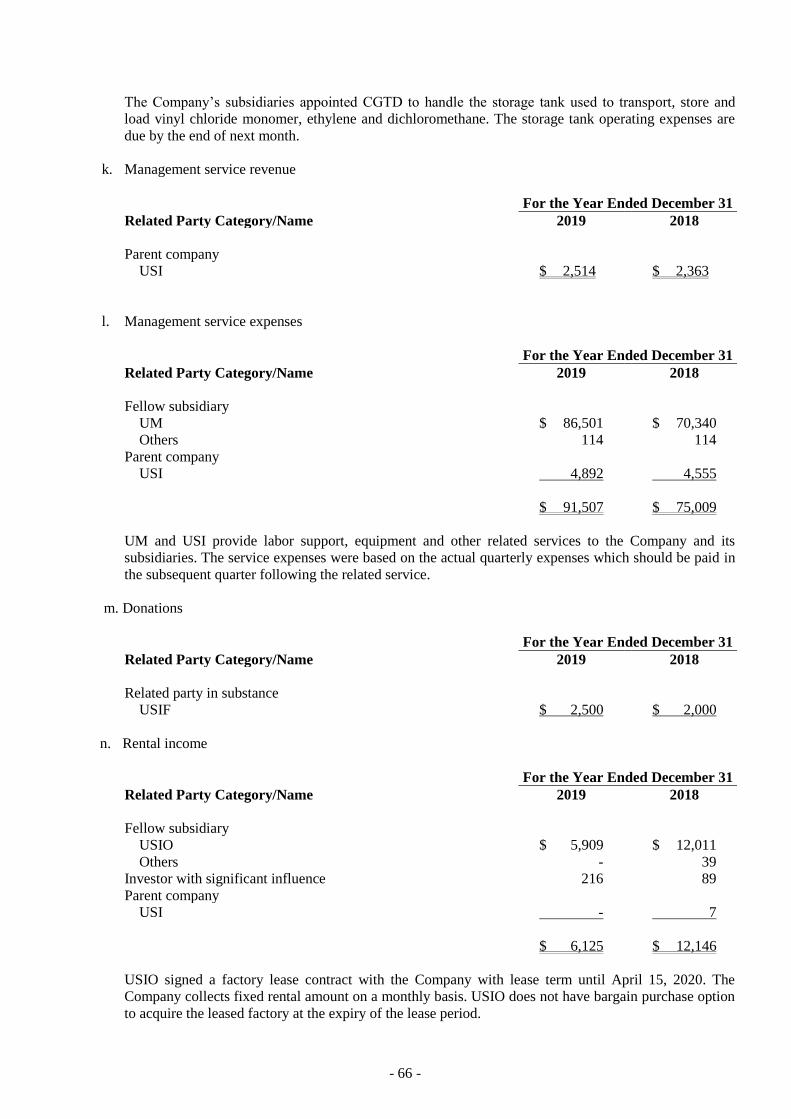
- 66 -
The Company’s subsidiaries appointed CGTD to handle the storage tank used to transport, store and
load vinyl chloride monomer, ethylene and dichloromethane. The storage tank operating expenses are
due by the end of next month.
k. Management service revenue
For the Year Ended December 31
Related Party Category/Name 2019 2018
Parent company
USI $ 2,514 $ 2,363
l. Management service expenses
For the Year Ended December 31
Related Party Category/Name 2019 2018
Fellow subsidiary
UM $ 86,501 $ 70,340
Others 114 114
Parent company
USI 4,892 4,555
$ 91,507 $ 75,009
UM and USI provide labor support, equipment and other related services to the Company and its
subsidiaries. The service expenses were based on the actual quarterly expenses which should be paid in
the subsequent quarter following the related service.
m. Donations
For the Year Ended December 31
Related Party Category/Name 2019 2018
Related party in substance
USIF $ 2,500 $ 2,000
n. Rental income
For the Year Ended December 31
Related Party Category/Name 2019 2018
Fellow subsidiary
USIO $ 5,909 $ 12,011
Others - 39
Investor with significant influence 216 89
Parent company
USI - 7
$ 6,125 $ 12,146
USIO signed a factory lease contract with the Company with lease term until April 15, 2020. The
Company collects fixed rental amount on a monthly basis. USIO does not have bargain purchase option
to acquire the leased factory at the expiry of the lease period.
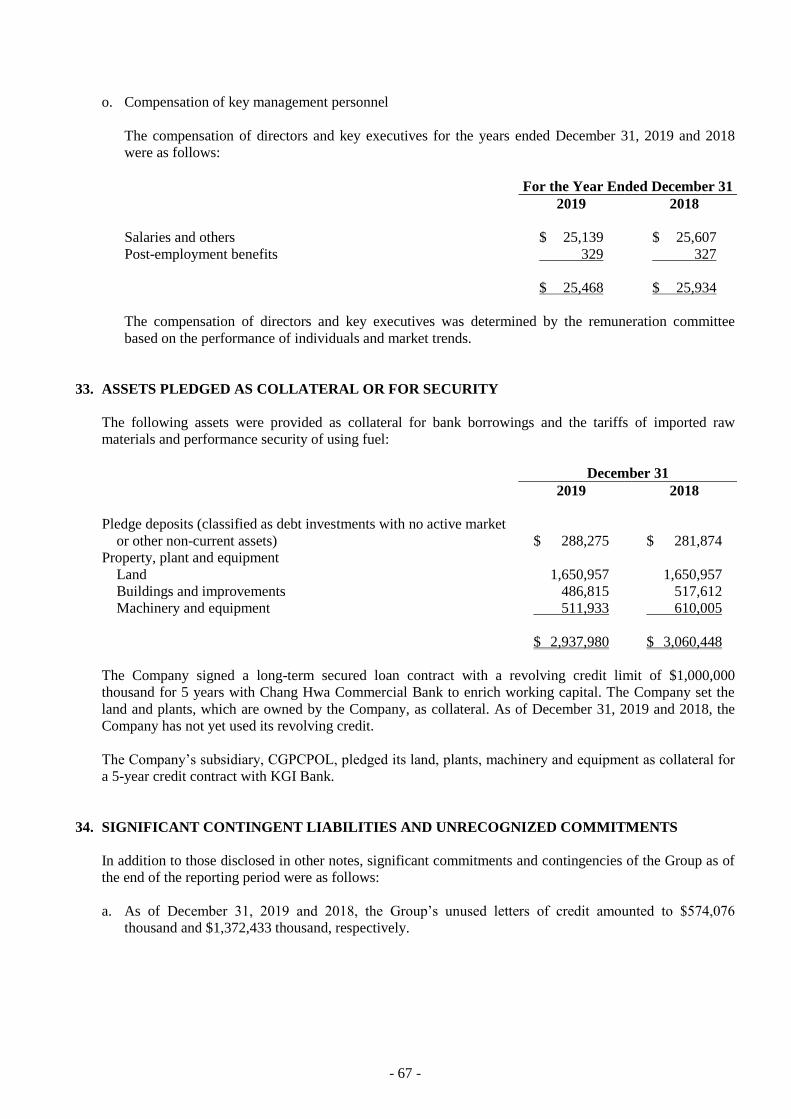
- 67 -
o. Compensation of key management personnel
The compensation of directors and key executives for the years ended December 31, 2019 and 2018
were as follows:
For the Year Ended December 31
2019 2018
Salaries and others $ 25,139 $ 25,607
Post-employment benefits 329 327
$ 25,468 $ 25,934
The compensation of directors and key executives was determined by the remuneration committee
based on the performance of individuals and market trends.
33. ASSETS PLEDGED AS COLLATERAL OR FOR SECURITY
The following assets were provided as collateral for bank borrowings and the tariffs of imported raw
materials and performance security of using fuel:
December 31
2019 2018
Pledge deposits (classified as debt investments with no active market
or other non-current assets) $ 288,275 $ 281,874
Property, plant and equipment
Land 1,650,957 1,650,957
Buildings and improvements 486,815 517,612
Machinery and equipment 511,933 610,005
$ 2,937,980 $ 3,060,448
The Company signed a long-term secured loan contract with a revolving credit limit of $1,000,000
thousand for 5 years with Chang Hwa Commercial Bank to enrich working capital. The Company set the
land and plants, which are owned by the Company, as collateral. As of December 31, 2019 and 2018, the
Company has not yet used its revolving credit.
The Company’s subsidiary, CGPCPOL, pledged its land, plants, machinery and equipment as collateral for
a 5-year credit contract with KGI Bank.
34. SIGNIFICANT CONTINGENT LIABILITIES AND UNRECOGNIZED COMMITMENTS
In addition to those disclosed in other notes, significant commitments and contingencies of the Group as of
the end of the reporting period were as follows:
a. As of December 31, 2019 and 2018, the Group’s unused letters of credit amounted to $574,076
thousand and $1,372,433 thousand, respectively.
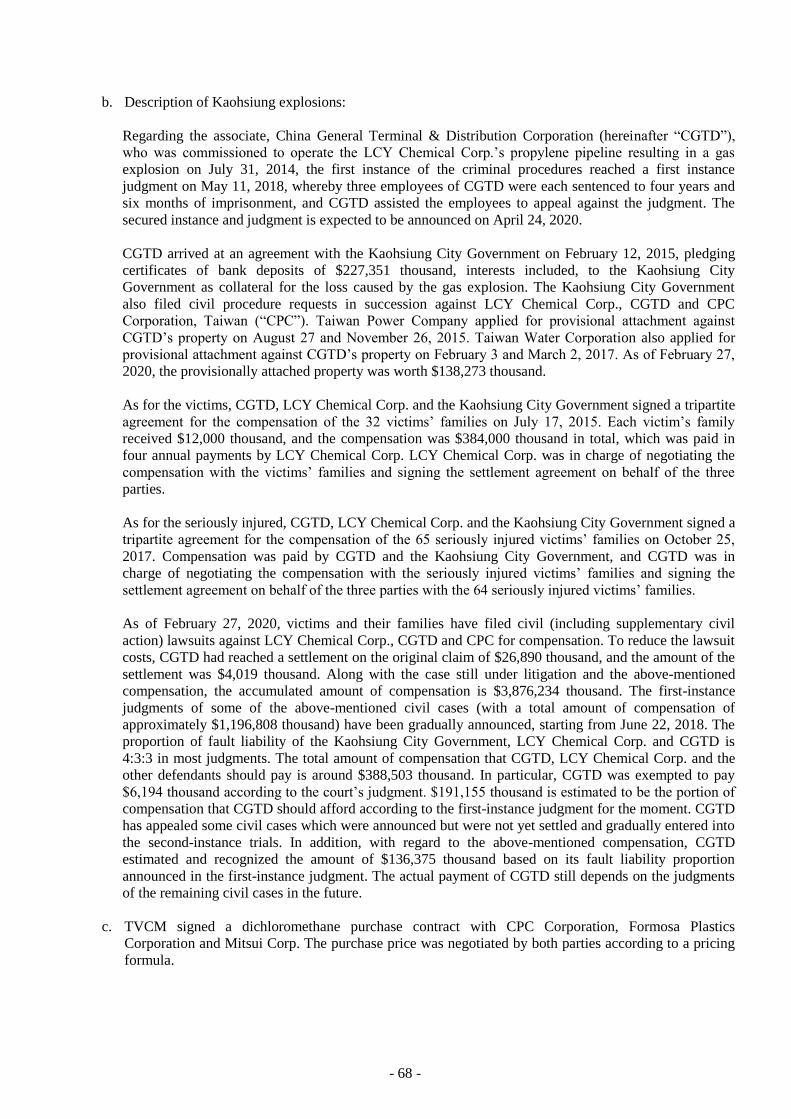
- 68 -
b. Description of Kaohsiung explosions:
Regarding the associate, China General Terminal & Distribution Corporation (hereinafter “CGTD”),
who was commissioned to operate the LCY Chemical Corp.’s propylene pipeline resulting in a gas
explosion on July 31, 2014, the first instance of the criminal procedures reached a first instance
judgment on May 11, 2018, whereby three employees of CGTD were each sentenced to four years and
six months of imprisonment, and CGTD assisted the employees to appeal against the judgment. The
secured instance and judgment is expected to be announced on April 24, 2020.
CGTD arrived at an agreement with the Kaohsiung City Government on February 12, 2015, pledging
certificates of bank deposits of $227,351 thousand, interests included, to the Kaohsiung City
Government as collateral for the loss caused by the gas explosion. The Kaohsiung City Government
also filed civil procedure requests in succession against LCY Chemical Corp., CGTD and CPC
Corporation, Taiwan (“CPC”). Taiwan Power Company applied for provisional attachment against
CGTD’s property on August 27 and November 26, 2015. Taiwan Water Corporation also applied for
provisional attachment against CGTD’s property on February 3 and March 2, 2017. As of February 27,
2020, the provisionally attached property was worth $138,273 thousand.
As for the victims, CGTD, LCY Chemical Corp. and the Kaohsiung City Government signed a tripartite
agreement for the compensation of the 32 victims’ families on July 17, 2015. Each victim’s family
received $12,000 thousand, and the compensation was $384,000 thousand in total, which was paid in
four annual payments by LCY Chemical Corp. LCY Chemical Corp. was in charge of negotiating the
compensation with the victims’ families and signing the settlement agreement on behalf of the three
parties.
As for the seriously injured, CGTD, LCY Chemical Corp. and the Kaohsiung City Government signed a
tripartite agreement for the compensation of the 65 seriously injured victims’ families on October 25,
2017. Compensation was paid by CGTD and the Kaohsiung City Government, and CGTD was in
charge of negotiating the compensation with the seriously injured victims’ families and signing the
settlement agreement on behalf of the three parties with the 64 seriously injured victims’ families.
As of February 27, 2020, victims and their families have filed civil (including supplementary civil
action) lawsuits against LCY Chemical Corp., CGTD and CPC for compensation. To reduce the lawsuit
costs, CGTD had reached a settlement on the original claim of $26,890 thousand, and the amount of the
settlement was $4,019 thousand. Along with the case still under litigation and the above-mentioned
compensation, the accumulated amount of compensation is $3,876,234 thousand. The first-instance
judgments of some of the above-mentioned civil cases (with a total amount of compensation of
approximately $1,196,808 thousand) have been gradually announced, starting from June 22, 2018. The
proportion of fault liability of the Kaohsiung City Government, LCY Chemical Corp. and CGTD is
4:3:3 in most judgments. The total amount of compensation that CGTD, LCY Chemical Corp. and the
other defendants should pay is around $388,503 thousand. In particular, CGTD was exempted to pay
$6,194 thousand according to the court’s judgment. $191,155 thousand is estimated to be the portion of
compensation that CGTD should afford according to the first-instance judgment for the moment. CGTD
has appealed some civil cases which were announced but were not yet settled and gradually entered into
the second-instance trials. In addition, with regard to the above-mentioned compensation, CGTD
estimated and recognized the amount of $136,375 thousand based on its fault liability proportion
announced in the first-instance judgment. The actual payment of CGTD still depends on the judgments
of the remaining civil cases in the future.
c. TVCM signed a dichloromethane purchase contract with CPC Corporation, Formosa Plastics
Corporation and Mitsui Corp. The purchase price was negotiated by both parties according to a pricing
formula.
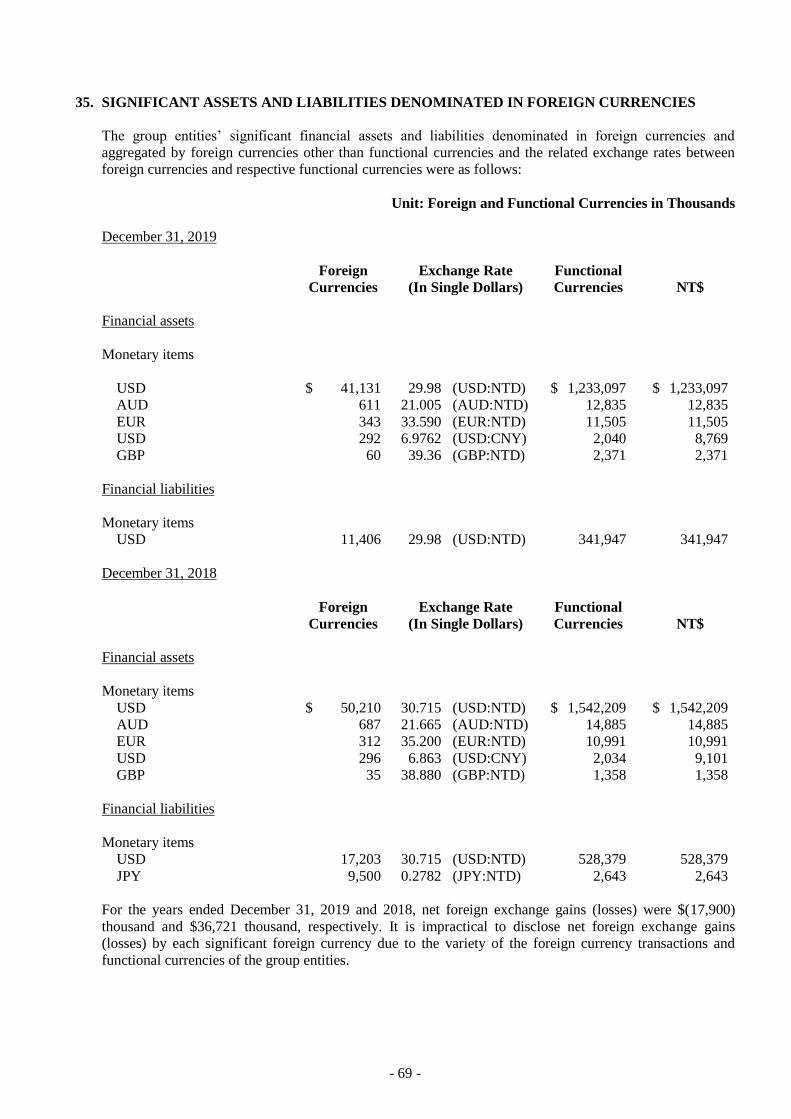
- 69 -
35. SIGNIFICANT ASSETS AND LIABILITIES DENOMINATED IN FOREIGN CURRENCIES
The group entities’ significant financial assets and liabilities denominated in foreign currencies and
aggregated by foreign currencies other than functional currencies and the related exchange rates between
foreign currencies and respective functional currencies were as follows:
Unit: Foreign and Functional Currencies in Thousands
December 31, 2019
Foreign
Currencies Exchange Rate
(In Single Dollars) Functional
Currencies NT$
Financial assets
Monetary items
USD $ 41,131 29.98
(USD:NTD) $ 1,233,097 $ 1,233,097
AUD 611 21.005 (AUD:NTD) 12,835 12,835
EUR 343 33.590 (EUR:NTD) 11,505 11,505
USD 292 6.9762 (USD:CNY) 2,040 8,769
GBP 60 39.36 (GBP:NTD) 2,371 2,371
Financial liabilities
Monetary items
USD 11,406 29.98 (USD:NTD) 341,947 341,947
December 31, 2018
Foreign
Currencies Exchange Rate
(In Single Dollars) Functional
Currencies NT$
Financial assets
Monetary items
USD $ 50,210 30.715 (USD:NTD) $ 1,542,209 $ 1,542,209
AUD 687 21.665 (AUD:NTD) 14,885 14,885
EUR 312 35.200 (EUR:NTD) 10,991 10,991
USD 296 6.863 (USD:CNY) 2,034 9,101
GBP 35 38.880 (GBP:NTD) 1,358 1,358
Financial liabilities
Monetary items
USD 17,203 30.715 (USD:NTD) 528,379 528,379
JPY 9,500 0.2782 (JPY:NTD) 2,643 2,643
For the years ended December 31, 2019 and 2018, net foreign exchange gains (losses) were $(17,900)
thousand and $36,721 thousand, respectively. It is impractical to disclose net foreign exchange gains
(losses) by each significant foreign currency due to the variety of the foreign currency transactions and
functional currencies of the group entities.
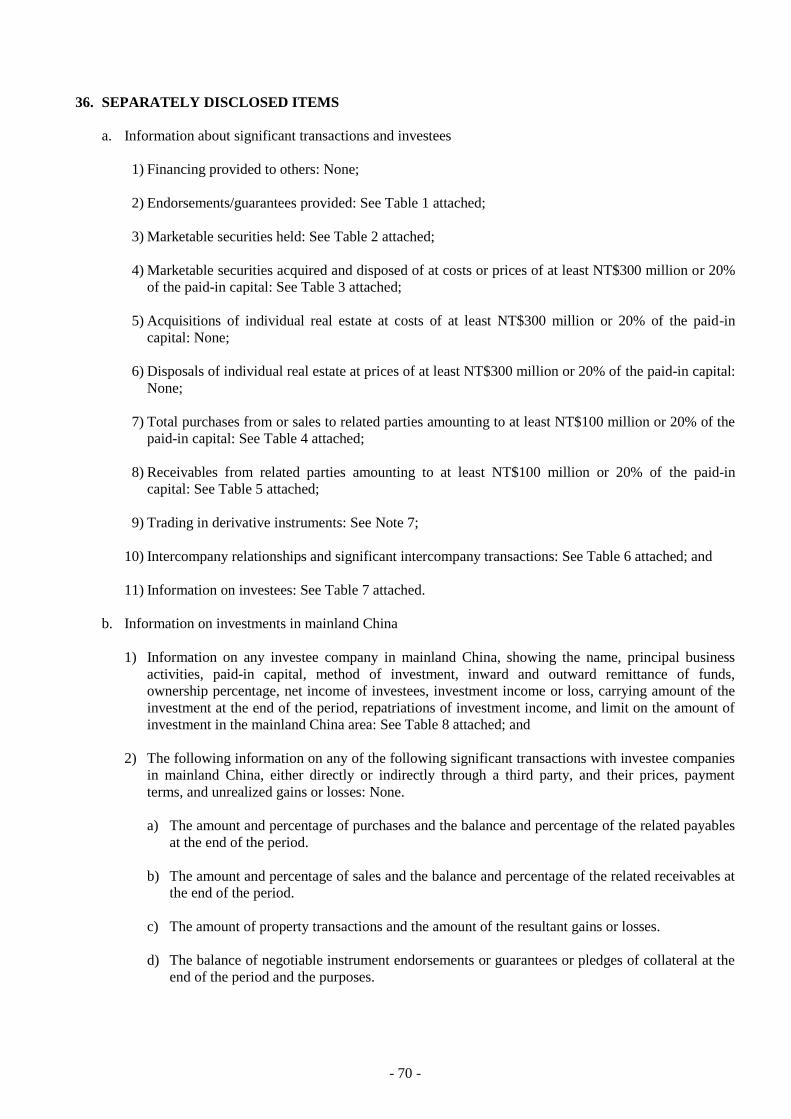
- 70 -
36. SEPARATELY DISCLOSED ITEMS
a. Information about significant transactions and investees
1) Financing provided to others: None;
2) Endorsements/guarantees provided: See Table 1 attached;
3) Marketable securities held: See Table 2 attached;
4) Marketable securities acquired and disposed of at costs or prices of at least NT$300 million or 20%
of the paid-in capital: See Table 3 attached;
5) Acquisitions of individual real estate at costs of at least NT$300 million or 20% of the paid-in
capital: None;
6) Disposals of individual real estate at prices of at least NT$300 million or 20% of the paid-in capital:
None;
7) Total purchases from or sales to related parties amounting to at least NT$100 million or 20% of the
paid-in capital: See Table 4 attached;
8) Receivables from related parties amounting to at least NT$100 million or 20% of the paid-in
capital: See Table 5 attached;
9) Trading in derivative instruments: See Note 7;
10) Intercompany relationships and significant intercompany transactions: See Table 6 attached; and
11) Information on investees: See Table 7 attached.
b. Information on investments in mainland China
1) Information on any investee company in mainland China, showing the name, principal business
activities, paid-in capital, method of investment, inward and outward remittance of funds,
ownership percentage, net income of investees, investment income or loss, carrying amount of the
investment at the end of the period, repatriations of investment income, and limit on the amount of
investment in the mainland China area: See Table 8 attached; and
2) The following information on any of the following significant transactions with investee companies
in mainland China, either directly or indirectly through a third party, and their prices, payment
terms, and unrealized gains or losses: None.
a) The amount and percentage of purchases and the balance and percentage of the related payables
at the end of the period.
b) The amount and percentage of sales and the balance and percentage of the related receivables at
the end of the period.
c) The amount of property transactions and the amount of the resultant gains or losses.
d) The balance of negotiable instrument endorsements or guarantees or pledges of collateral at the
end of the period and the purposes.

- 71 -
e) The highest balance during the period, the end of period balance, the interest rate range, and
total current period interest with respect to financing of funds.
f) Other transactions that have a material effect on the profit or loss for the period or on the
financial position, such as the rendering or receipt of services.
37. SEGMENT INFORMATION
Information reported to the chief operating decision maker for the purpose of resource allocation and
assessment of segment performance focuses on the types of goods or services delivered or provided.
Specifically, the Group’s reportable segments, including departments of VCM products and PVC products,
under IFRS 8 “Operating Segments” were as follows:
a. Segment revenue and results
The following was an analysis of the Group’s revenue and results from continuing operations by
reportable segments.
For the year ended December 31, 2019
VCM Products PVC Products Total
Revenue from external customers $ 884,054 $ 14,233,801 $ 15,117,855
Inter-segment revenue 8,947,977 439,166 9,387,143
Segment revenue $ 9,832,031 $ 14,672,967 24,504,998
Eliminations (9,387,143)
Consolidated revenue $ 15,117,855
Segment income $ 45,711 $ 728,188 $ 773,899
Share of gain of associates accounted for
using the equity method 24,740
Interest income 15,780
Rental income 8,919
Loss on disposal of property, plant and
equipment (417)
Foreign exchange losses (17,900)
Loss on financial instruments held for trading (18,791)
Gain on financial assets mandatorily
classified as at FVTPL 64,226
Depreciation expenses of investment
properties (14,140)
Gain on disposal of subsidiary accounted for
using the equity method 2,549
Interest expense (12,203)
Others 27,346
Profit before tax from continuing operations $ 854,008
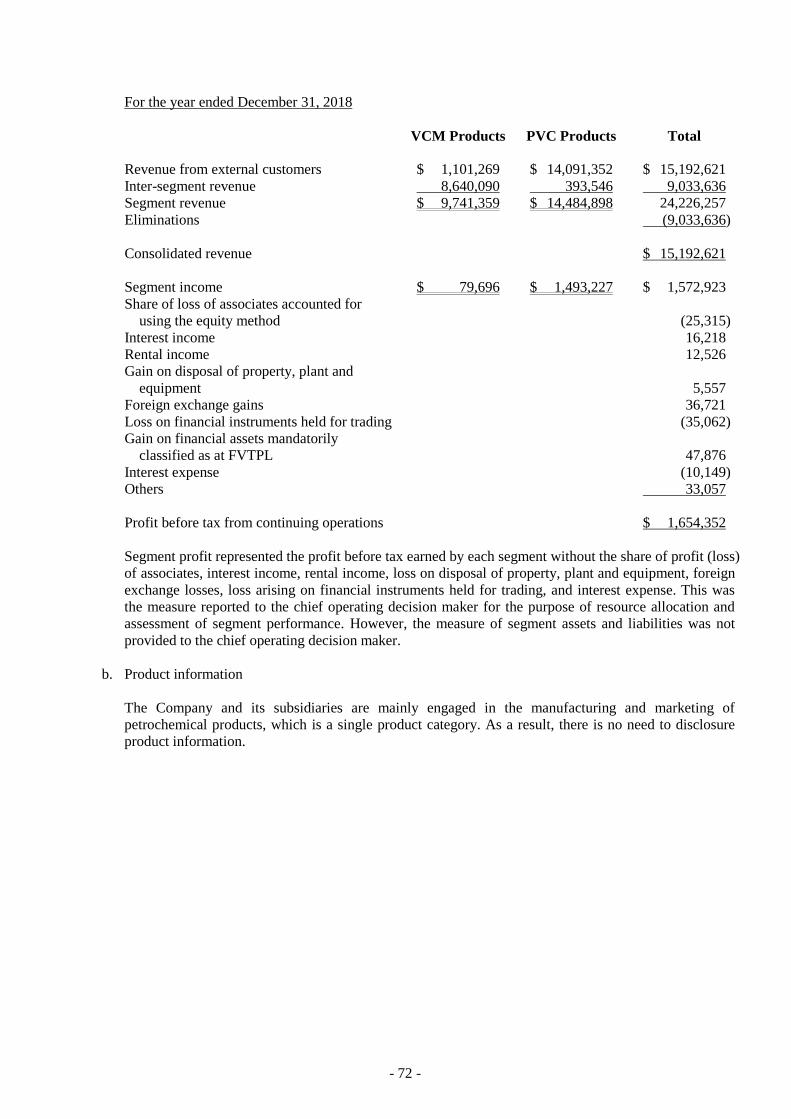
- 72 -
For the year ended December 31, 2018
VCM Products PVC Products Total
Revenue from external customers $ 1,101,269 $ 14,091,352 $ 15,192,621
Inter-segment revenue 8,640,090 393,546 9,033,636
Segment revenue $ 9,741,359 $ 14,484,898 24,226,257
Eliminations (9,033,636)
Consolidated revenue $ 15,192,621
Segment income $ 79,696 $ 1,493,227 $ 1,572,923
Share of loss of associates accounted for
using the equity method (25,315)
Interest income 16,218
Rental income 12,526
Gain on disposal of property, plant and
equipment 5,557
Foreign exchange gains 36,721
Loss on financial instruments held for trading (35,062)
Gain on financial assets mandatorily
classified as at FVTPL 47,876
Interest expense (10,149)
Others 33,057
Profit before tax from continuing operations $ 1,654,352
Segment profit represented the profit before tax earned by each segment without the share of profit (loss)
of associates, interest income, rental income, loss on disposal of property, plant and equipment, foreign
exchange losses, loss arising on financial instruments held for trading, and interest expense. This was
the measure reported to the chief operating decision maker for the purpose of resource allocation and
assessment of segment performance. However, the measure of segment assets and liabilities was not
provided to the chief operating decision maker.
b. Product information
The Company and its subsidiaries are mainly engaged in the manufacturing and marketing of
petrochemical products, which is a single product category. As a result, there is no need to disclosure
product information.
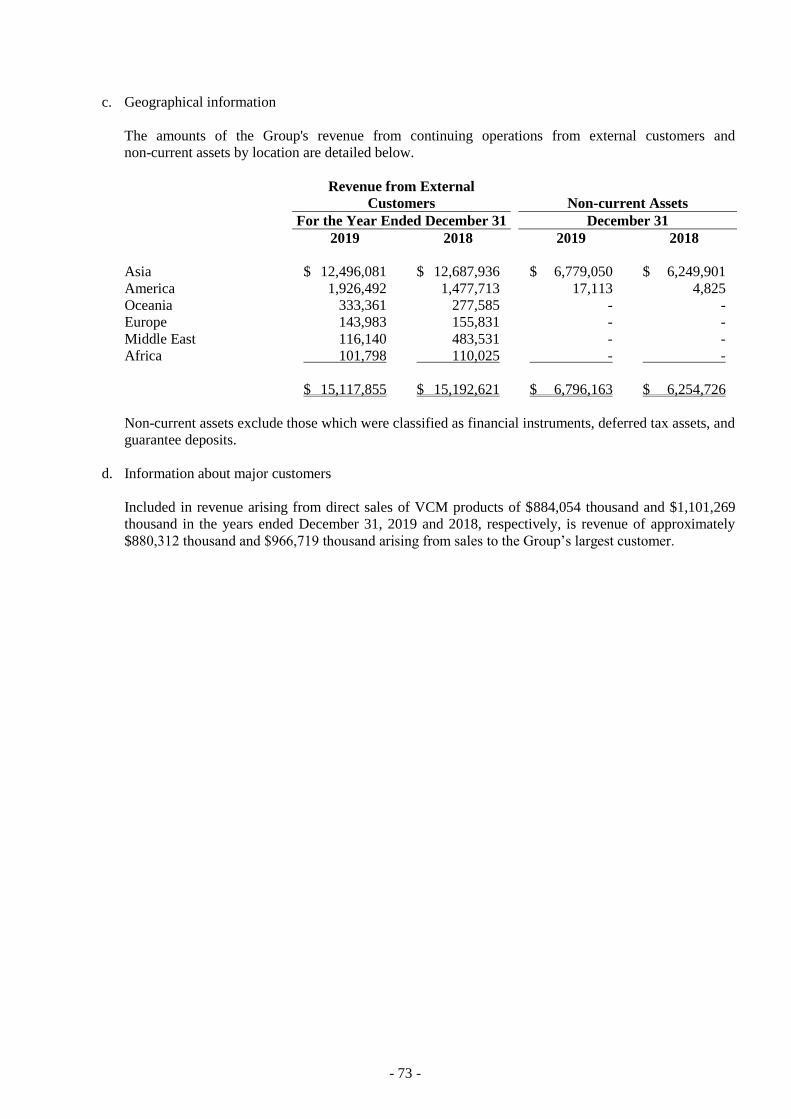
- 73 -
c. Geographical information
The amounts of the Group's revenue from continuing operations from external customers and
non-current assets by location are detailed below.
Revenue from External
Customers Non-current Assets
For the Year Ended December 31 December 31
2019 2018 2019 2018
Asia $ 12,496,081 $ 12,687,936 $ 6,779,050 $ 6,249,901
America 1,926,492 1,477,713 17,113 4,825
Oceania 333,361 277,585 - -
Europe 143,983 155,831 - -
Middle East 116,140 483,531 - -
Africa 101,798 110,025 - -
$ 15,117,855 $ 15,192,621 $ 6,796,163 $ 6,254,726
Non-current assets exclude those which were classified as financial instruments, deferred tax assets, and
guarantee deposits.
d. Information about major customers
Included in revenue arising from direct sales of VCM products of $884,054 thousand and $1,101,269
thousand in the years ended December 31, 2019 and 2018, respectively, is revenue of approximately
$880,312 thousand and $966,719 thousand arising from sales to the Group’s largest customer.

- 74 -
TABLE 1
CHINA GENERAL PLASTICS CORPORATION AND SUBSIDIARIES
ENDORSEMENTS/GUARANTEES PROVIDED
FOR THE YEAR ENDED DECEMBER 31, 2019
(In Thousands of New Taiwan Dollars)
No. Endorser/Guarantor
Endorsee/Guarantee
Limits on
Endorsement/
Guarantee
Given on
Behalf of Each
Party
(Note 2)
Maximum
Amount
Endorsed/
Guaranteed
During the
Period
Outstanding
Endorsement/
Guarantee at
the End of the
Period
Actual
Borrowing
Amount
Amount
Endorsed/
Guaranteed
by Collateral
Ratio of
Accumulated
Endorsement/
Guarantee to
Net Equity in
Latest
Financial
Statements
(%)
(Note 1)
Aggregate
Endorsement/
Guarantee
Limit
(Note 2)
Endorsement/
Guarantee
Given by
Parent on
Behalf of
Subsidiaries
Endorsement/
Guarantee
Given by
Subsidiaries
on Behalf of
Parent
Endorsement/
Guarantee
Given on
Behalf of
Companies in
Mainland
China
Name Relationship
0 China General Plastics
Corporation
CGPC Polymer Corporation Subsidiary $ 8,250,812 $ 2,899,800 $ 2,200,000 $ 14,990 None 26.66 $ 8,250,812 Yes No No
Note 1: The ratio is calculated using the ending balance of equity of the Company as of December 31, 2019.
Note 2: The total amount of guarantee that may be provided by the Company to any individual entity and in aggregate shall not exceed 100% of the Company’s net worth.
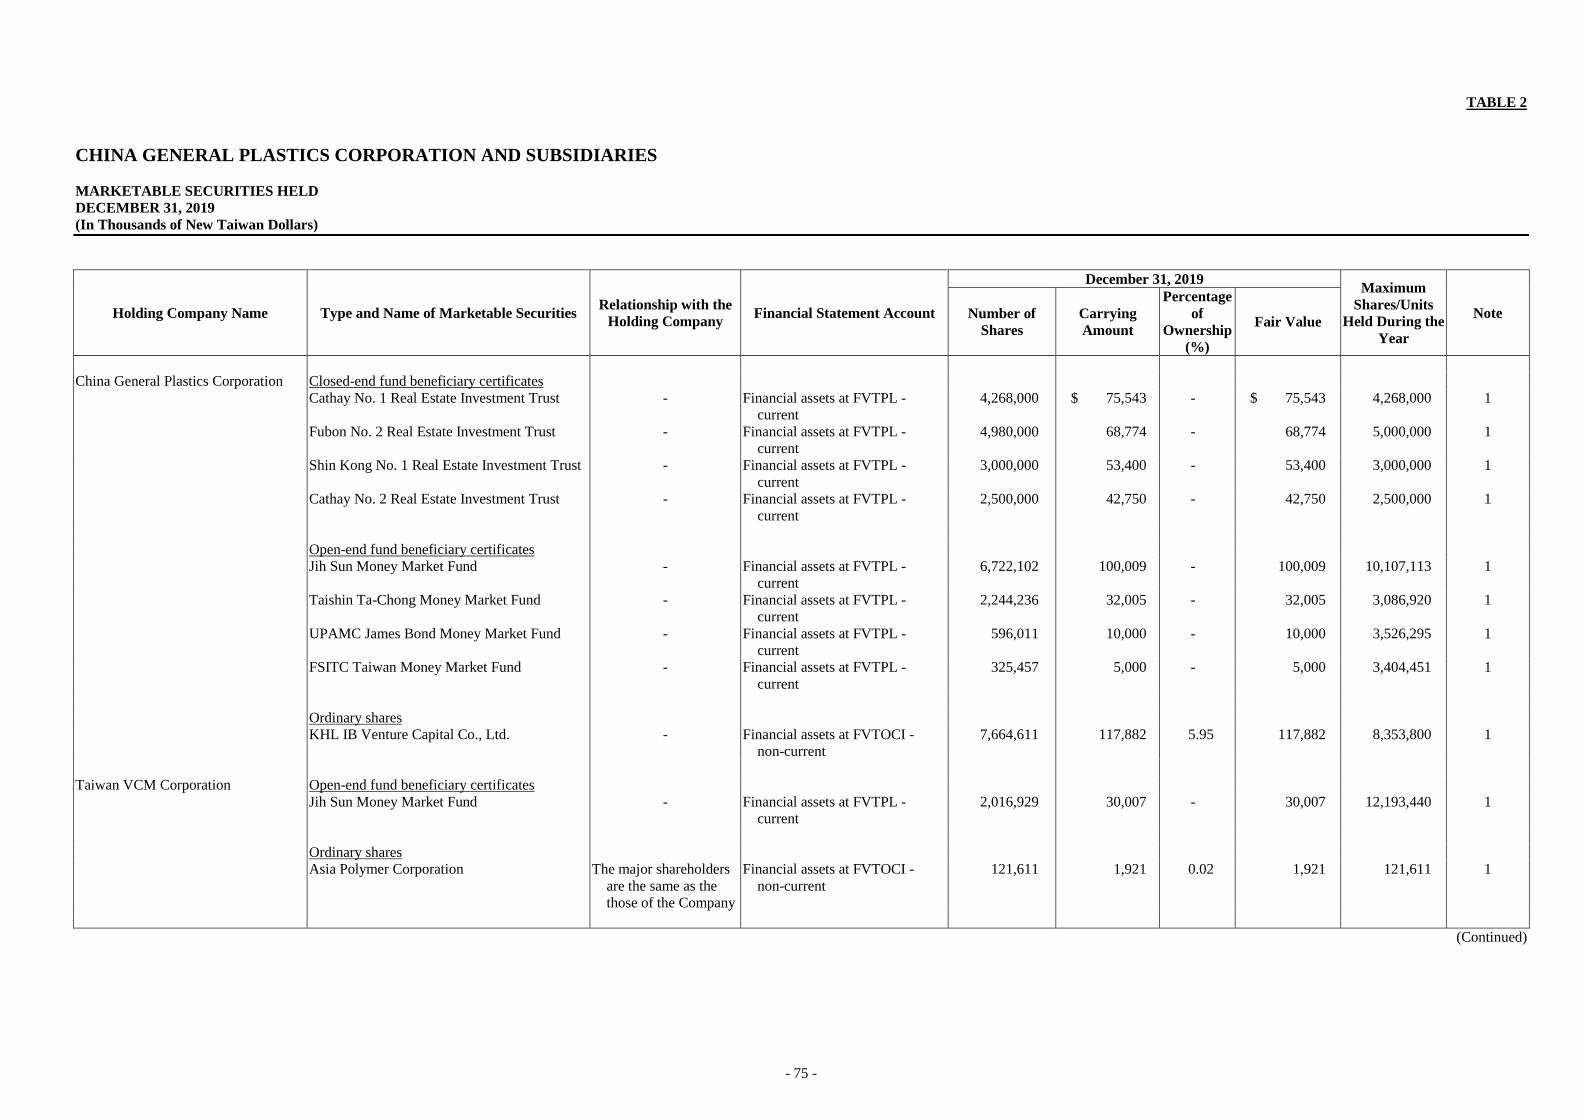
- 75 -
TABLE 2
CHINA GENERAL PLASTICS CORPORATION AND SUBSIDIARIES
MARKETABLE SECURITIES HELD
DECEMBER 31, 2019
(In Thousands of New Taiwan Dollars)
Holding Company Name Type and Name of Marketable Securities Relationship with the
Holding Company Financial Statement Account
December 31, 2019 Maximum
Shares/Units
Held During the
Year
Note Number of
Shares
Carrying
Amount
Percentage
of
Ownership
(%)
Fair Value
China General Plastics Corporation Closed-end fund beneficiary certificates
Cathay No. 1 Real Estate Investment Trust - Financial assets at FVTPL -
current
4,268,000 $ 75,543 - $ 75,543 4,268,000 1
Fubon No. 2 Real Estate Investment Trust - Financial assets at FVTPL -
current
4,980,000 68,774 - 68,774 5,000,000 1
Shin Kong No. 1 Real Estate Investment Trust - Financial assets at FVTPL -
current
3,000,000 53,400 - 53,400 3,000,000 1
Cathay No. 2 Real Estate Investment Trust - Financial assets at FVTPL -
current
2,500,000 42,750 - 42,750 2,500,000 1
Open-end fund beneficiary certificates
Jih Sun Money Market Fund - Financial assets at FVTPL -
current
6,722,102 100,009 - 100,009 10,107,113 1
Taishin Ta-Chong Money Market Fund - Financial assets at FVTPL -
current
2,244,236 32,005 - 32,005 3,086,920 1
UPAMC James Bond Money Market Fund - Financial assets at FVTPL -
current
596,011 10,000 - 10,000 3,526,295 1
FSITC Taiwan Money Market Fund - Financial assets at FVTPL -
current
325,457 5,000 - 5,000 3,404,451 1
Ordinary shares
KHL IB Venture Capital Co., Ltd. - Financial assets at FVTOCI -
non-current
7,664,611 117,882 5.95 117,882 8,353,800 1
Taiwan VCM Corporation Open-end fund beneficiary certificates
Jih Sun Money Market Fund - Financial assets at FVTPL -
current
2,016,929 30,007 - 30,007 12,193,440 1
Ordinary shares
Asia Polymer Corporation The major shareholders
are the same as the
those of the Company
Financial assets at FVTOCI -
non-current
121,611 1,921 0.02 1,921 121,611 1
(Continued)
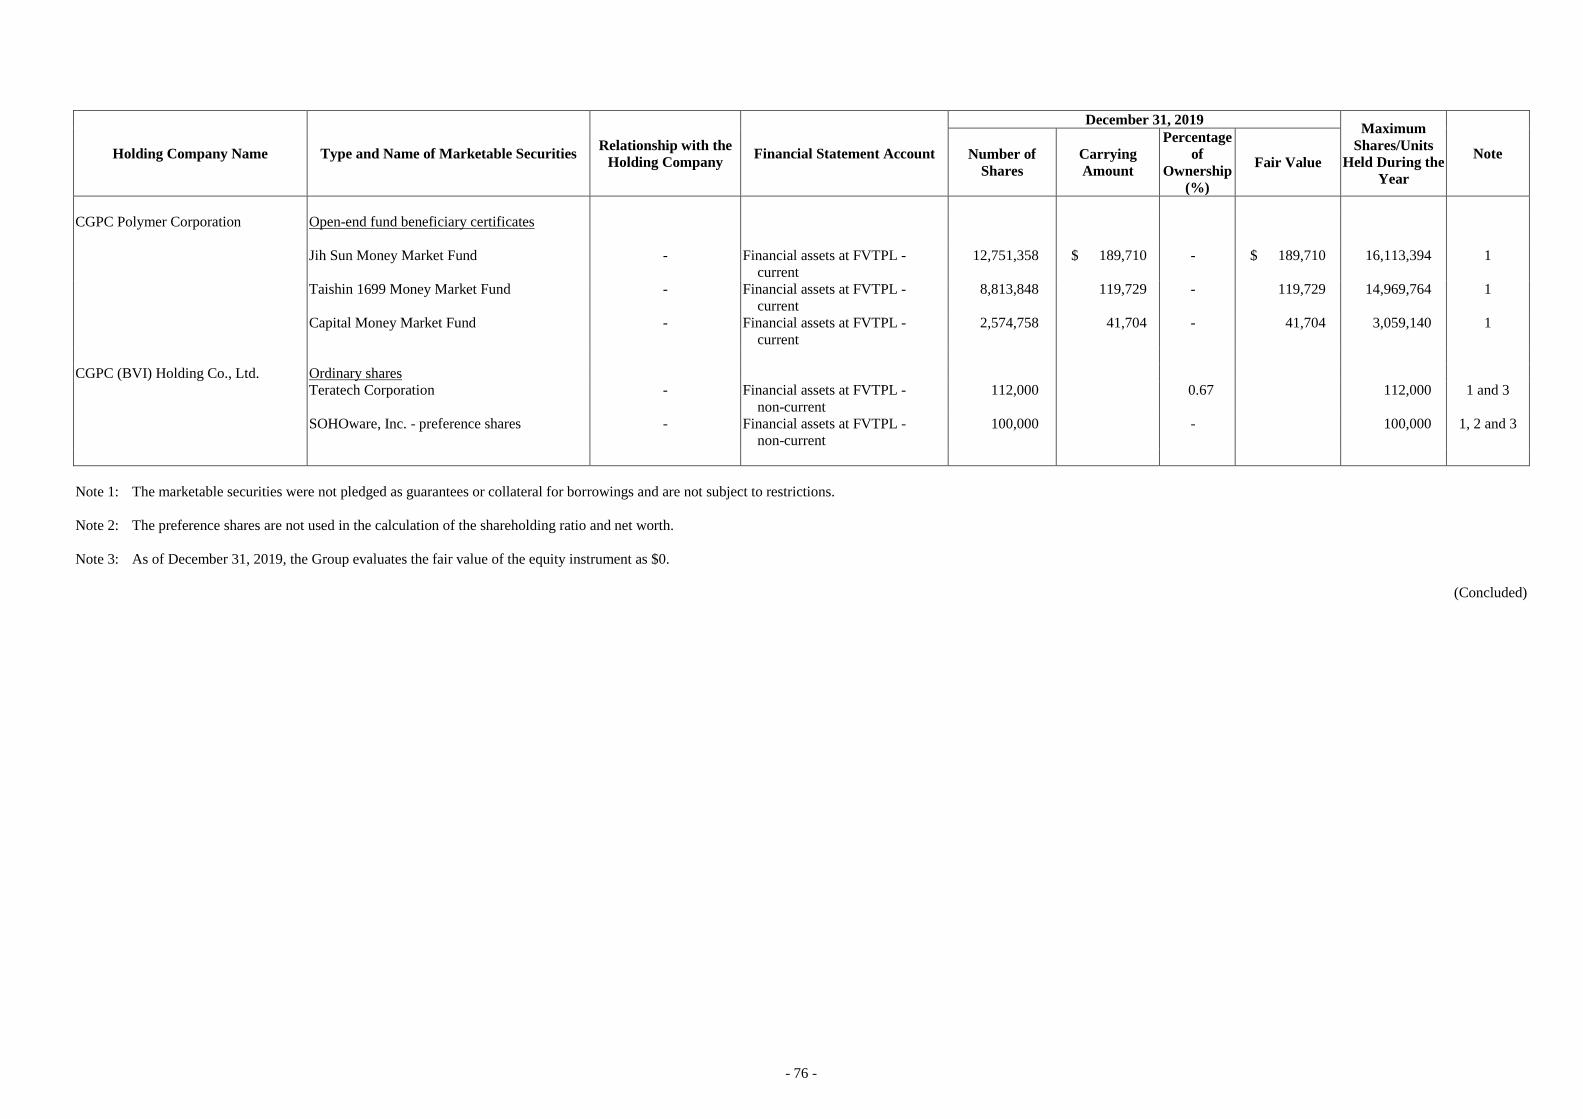
- 76 -
Holding Company Name Type and Name of Marketable Securities Relationship with the
Holding Company Financial Statement Account
December 31, 2019 Maximum
Shares/Units
Held During the
Year
Note Number of
Shares
Carrying
Amount
Percentage
of
Ownership
(%)
Fair Value
CGPC Polymer Corporation Open-end fund beneficiary certificates
Jih Sun Money Market Fund - Financial assets at FVTPL -
current
12,751,358 $ 189,710 - $ 189,710 16,113,394 1
Taishin 1699 Money Market Fund - Financial assets at FVTPL -
current
8,813,848 119,729 - 119,729 14,969,764 1
Capital Money Market Fund - Financial assets at FVTPL -
current
2,574,758 41,704 - 41,704 3,059,140 1
CGPC (BVI) Holding Co., Ltd. Ordinary shares
Teratech Corporation - Financial assets at FVTPL -
non-current
112,000 0.67 112,000 1 and 3
SOHOware, Inc. - preference shares - Financial assets at FVTPL -
non-current
100,000 - 100,000 1, 2 and 3
Note 1: The marketable securities were not pledged as guarantees or collateral for borrowings and are not subject to restrictions.
Note 2: The preference shares are not used in the calculation of the shareholding ratio and net worth.
Note 3: As of December 31, 2019, the Group evaluates the fair value of the equity instrument as $0.
(Concluded)
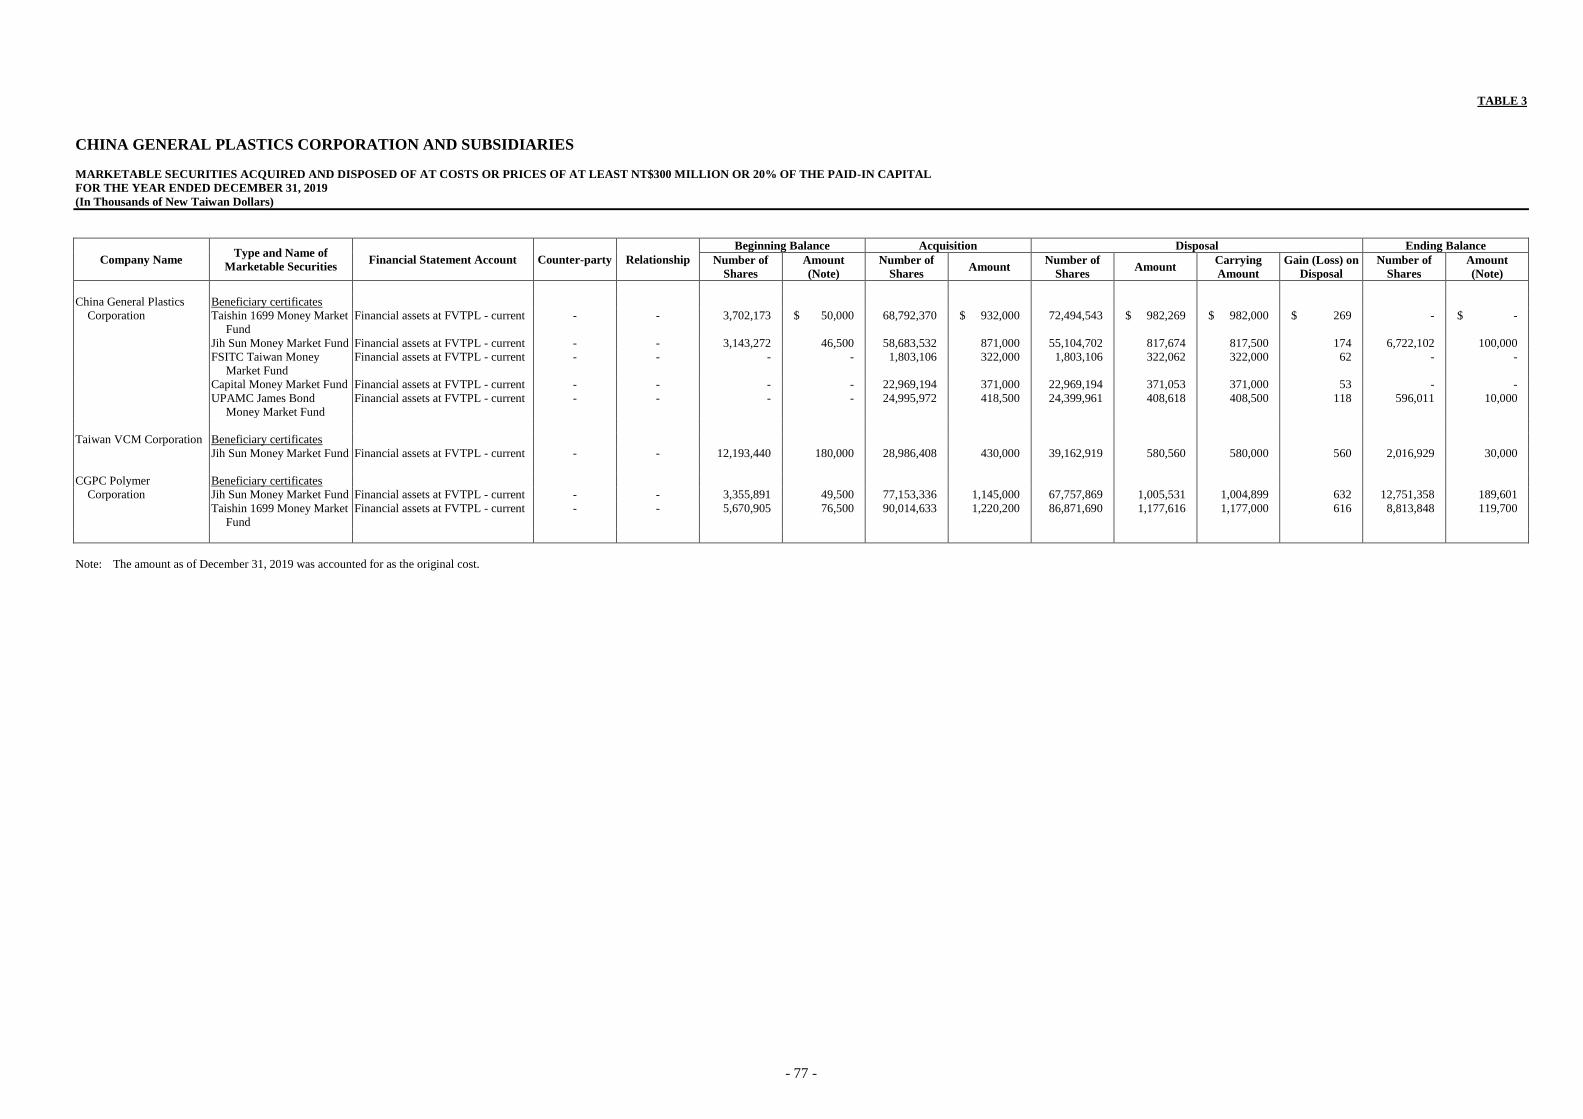
- 77 -
TABLE 3
CHINA GENERAL PLASTICS CORPORATION AND SUBSIDIARIES
MARKETABLE SECURITIES ACQUIRED AND DISPOSED OF AT COSTS OR PRICES OF AT LEAST NT$300 MILLION OR 20% OF THE PAID-IN CAPITAL
FOR THE YEAR ENDED DECEMBER 31, 2019
(In Thousands of New Taiwan Dollars)
Company Name Type and Name of
Marketable Securities Financial Statement Account Counter-party Relationship
Beginning Balance Acquisition Disposal Ending Balance
Number of
Shares
Amount
(Note)
Number of
Shares Amount
Number of
Shares Amount
Carrying
Amount
Gain (Loss) on
Disposal
Number of
Shares
Amount
(Note)
China General Plastics Beneficiary certificates
Corporation Taishin 1699 Money Market
Fund
Financial assets at FVTPL - current - - 3,702,173 $ 50,000 68,792,370 $ 932,000 72,494,543 $ 982,269 $ 982,000 $ 269 - $ -
Jih Sun Money Market Fund Financial assets at FVTPL - current - - 3,143,272 46,500 58,683,532 871,000 55,104,702 817,674 817,500 174 6,722,102 100,000
FSITC Taiwan Money
Market Fund
Financial assets at FVTPL - current - - - - 1,803,106 322,000 1,803,106 322,062 322,000 62 - -
Capital Money Market Fund Financial assets at FVTPL - current - - - - 22,969,194 371,000 22,969,194 371,053 371,000 53 - -
UPAMC James Bond
Money Market Fund
Financial assets at FVTPL - current - - - - 24,995,972 418,500 24,399,961 408,618 408,500 118 596,011 10,000
Taiwan VCM Corporation Beneficiary certificates
Jih Sun Money Market Fund Financial assets at FVTPL - current - - 12,193,440 180,000 28,986,408 430,000 39,162,919 580,560 580,000 560 2,016,929 30,000
CGPC Polymer Beneficiary certificates
Corporation Jih Sun Money Market Fund Financial assets at FVTPL - current - - 3,355,891 49,500 77,153,336 1,145,000 67,757,869 1,005,531 1,004,899 632 12,751,358 189,601
Taishin 1699 Money Market
Fund
Financial assets at FVTPL - current - - 5,670,905 76,500 90,014,633 1,220,200 86,871,690 1,177,616 1,177,000 616 8,813,848 119,700
Note: The amount as of December 31, 2019 was accounted for as the original cost.
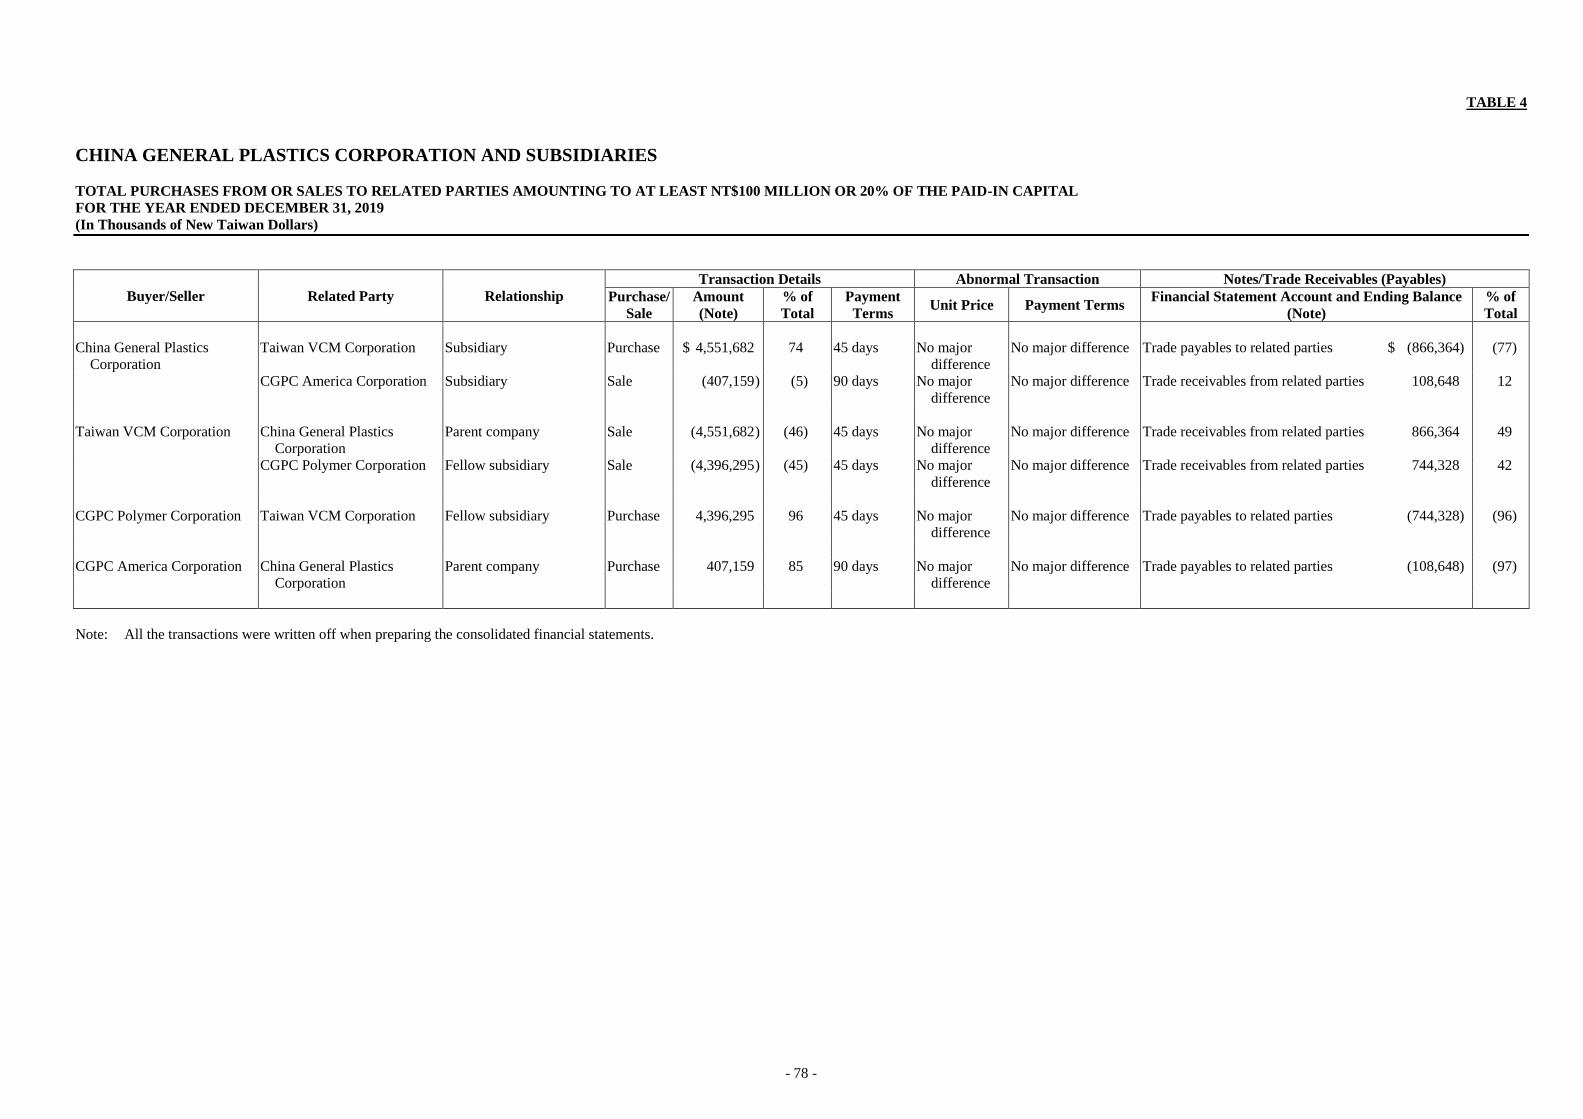
- 78 -
TABLE 4
CHINA GENERAL PLASTICS CORPORATION AND SUBSIDIARIES
TOTAL PURCHASES FROM OR SALES TO RELATED PARTIES AMOUNTING TO AT LEAST NT$100 MILLION OR 20% OF THE PAID-IN CAPITAL
FOR THE YEAR ENDED DECEMBER 31, 2019
(In Thousands of New Taiwan Dollars)
Buyer/Seller Related Party Relationship
Transaction Details Abnormal Transaction Notes/Trade Receivables (Payables)
Purchase/
Sale
Amount
(Note)
% of
Total
Payment
Terms Unit Price Payment Terms
Financial Statement Account and Ending Balance
(Note)
% of
Total
China General Plastics
Corporation
Taiwan VCM Corporation Subsidiary Purchase $ 4,551,682 74 45 days No major
difference
No major difference Trade payables to related parties $ (866,364)
(77)
CGPC America Corporation Subsidiary Sale (407,159 ) (5) 90 days No major
difference
No major difference Trade receivables from related parties 108,648 12
Taiwan VCM Corporation China General Plastics
Corporation
Parent company Sale (4,551,682 ) (46) 45 days No major
difference
No major difference Trade receivables from related parties 866,364 49
CGPC Polymer Corporation Fellow subsidiary Sale (4,396,295 ) (45) 45 days No major
difference
No major difference Trade receivables from related parties 744,328 42
CGPC Polymer Corporation Taiwan VCM Corporation Fellow subsidiary Purchase 4,396,295 96 45 days No major
difference
No major difference Trade payables to related parties (744,328) (96)
CGPC America Corporation China General Plastics
Corporation
Parent company Purchase 407,159 85 90 days No major
difference
No major difference Trade payables to related parties (108,648) (97)
Note: All the transactions were written off when preparing the consolidated financial statements.

- 79 -
TABLE 5
CHINA GENERAL PLASTICS CORPORATION AND SUBSIDIARIES
RECEIVABLES FROM RELATED PARTIES AMOUNTING TO AT LEAST NT$100 MILLION OR 20% OF THE PAID-IN CAPITAL
DECEMBER 31, 2019
(In Thousands of New Taiwan Dollars)
Company Name Related Party Relationship Financial Statement Account and Ending Balance
(Note 3)
Turnover
Rate
Overdue Amounts
Received in
Subsequent
Period
(Note 2)
Allowance for
Impairment
Loss Amount Actions Taken
China General Plastics Corporation CGPC America Corporation Subsidiary Trade receivables from related parties $ 108,648 3.88 $ - - $ 48,615 Note 1
Taiwan VCM Corporation China General Plastics Corporation Parent company Trade receivables from related parties $ 866,364 5.55 - - 866,364 Note 1
CGPC Polymer Corporation Fellow subsidiary Trade receivables from related parties $ 744,328 5.78 - - 744,328 Note 1
Note 1: There is no allowance of impairment loss after an impairment assessment.
Note 2: The subsequent period is between January 1 and February 20, 2020.
Note 3: All the transactions were written off when preparing the consolidated financial statements.
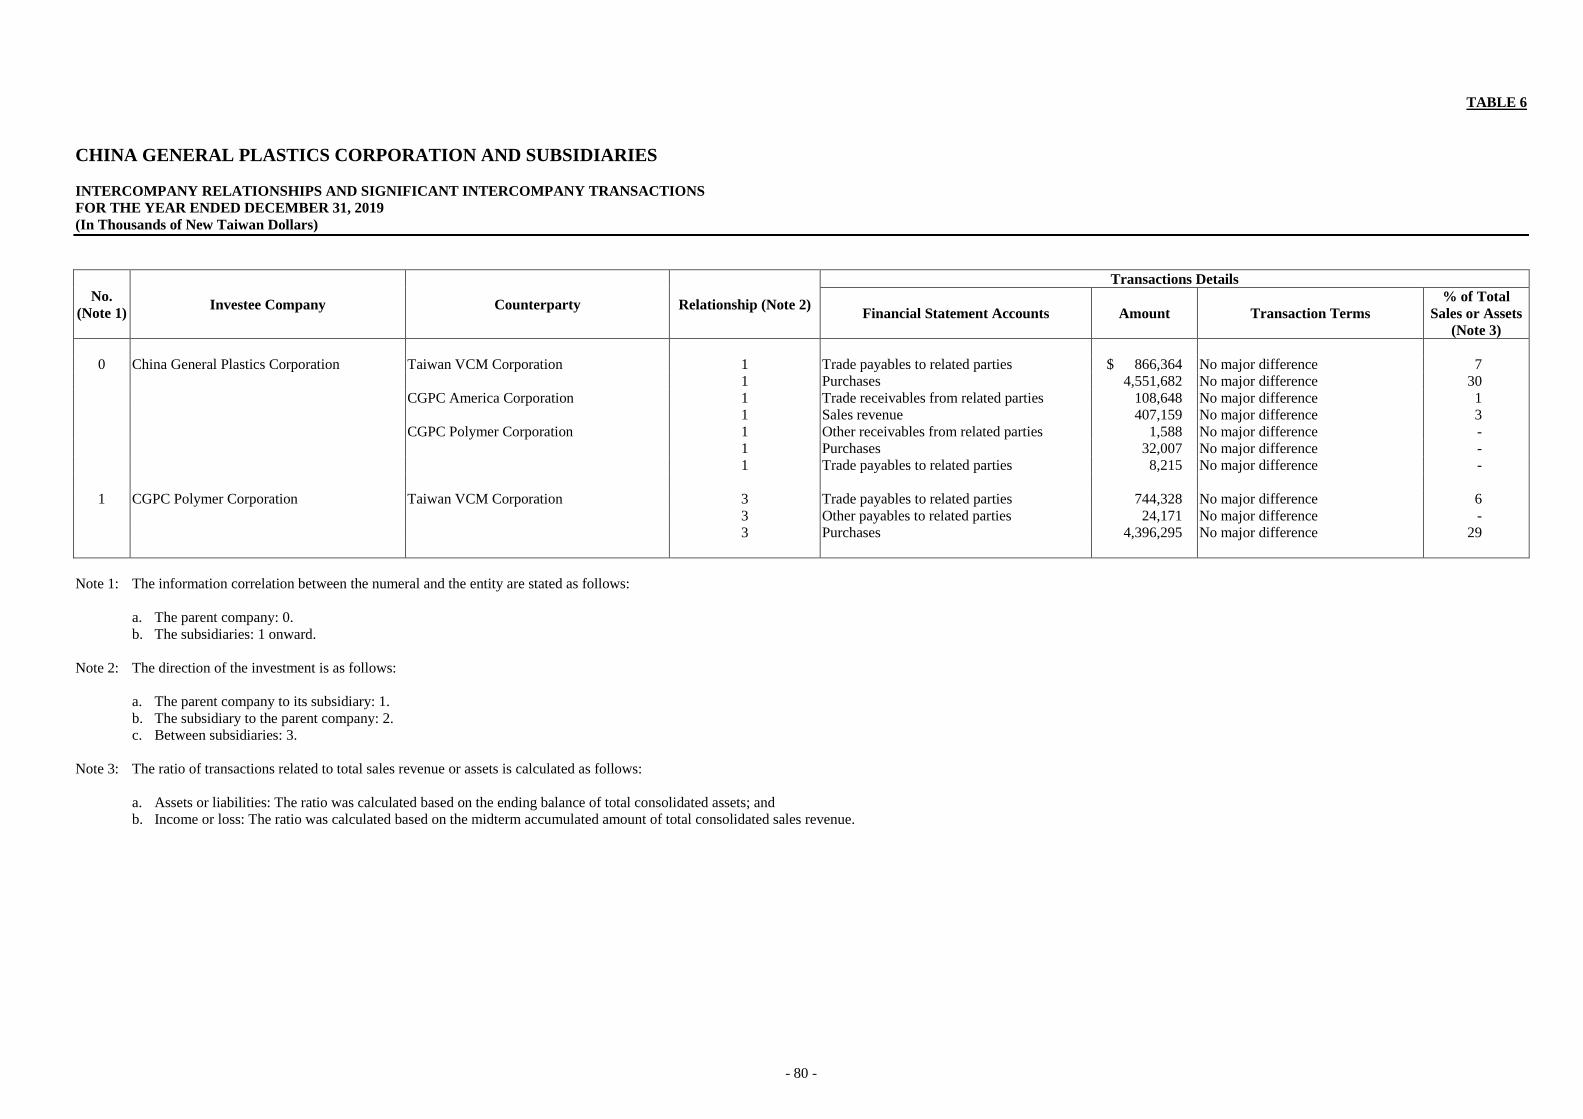
- 80 -
TABLE 6
CHINA GENERAL PLASTICS CORPORATION AND SUBSIDIARIES
INTERCOMPANY RELATIONSHIPS AND SIGNIFICANT INTERCOMPANY TRANSACTIONS
FOR THE YEAR ENDED DECEMBER 31, 2019
(In Thousands of New Taiwan Dollars)
No.
(Note 1) Investee Company Counterparty Relationship (Note 2)
Transactions Details
Financial Statement Accounts Amount Transaction Terms
% of Total
Sales or Assets
(Note 3)
0 China General Plastics Corporation Taiwan VCM Corporation 1 Trade payables to related parties $ 866,364 No major difference 7
1 Purchases 4,551,682 No major difference 30
CGPC America Corporation 1 Trade receivables from related parties 108,648 No major difference 1
1 Sales revenue 407,159 No major difference 3
CGPC Polymer Corporation 1 Other receivables from related parties 1,588 No major difference -
1 Purchases 32,007 No major difference -
1 Trade payables to related parties 8,215 No major difference -
1 CGPC Polymer Corporation Taiwan VCM Corporation 3 Trade payables to related parties 744,328 No major difference 6
3 Other payables to related parties 24,171 No major difference -
3 Purchases 4,396,295 No major difference 29
Note 1: The information correlation between the numeral and the entity are stated as follows:
a. The parent company: 0.
b. The subsidiaries: 1 onward.
Note 2: The direction of the investment is as follows:
a. The parent company to its subsidiary: 1.
b. The subsidiary to the parent company: 2.
c. Between subsidiaries: 3.
Note 3: The ratio of transactions related to total sales revenue or assets is calculated as follows:
a. Assets or liabilities: The ratio was calculated based on the ending balance of total consolidated assets; and
b. Income or loss: The ratio was calculated based on the midterm accumulated amount of total consolidated sales revenue.
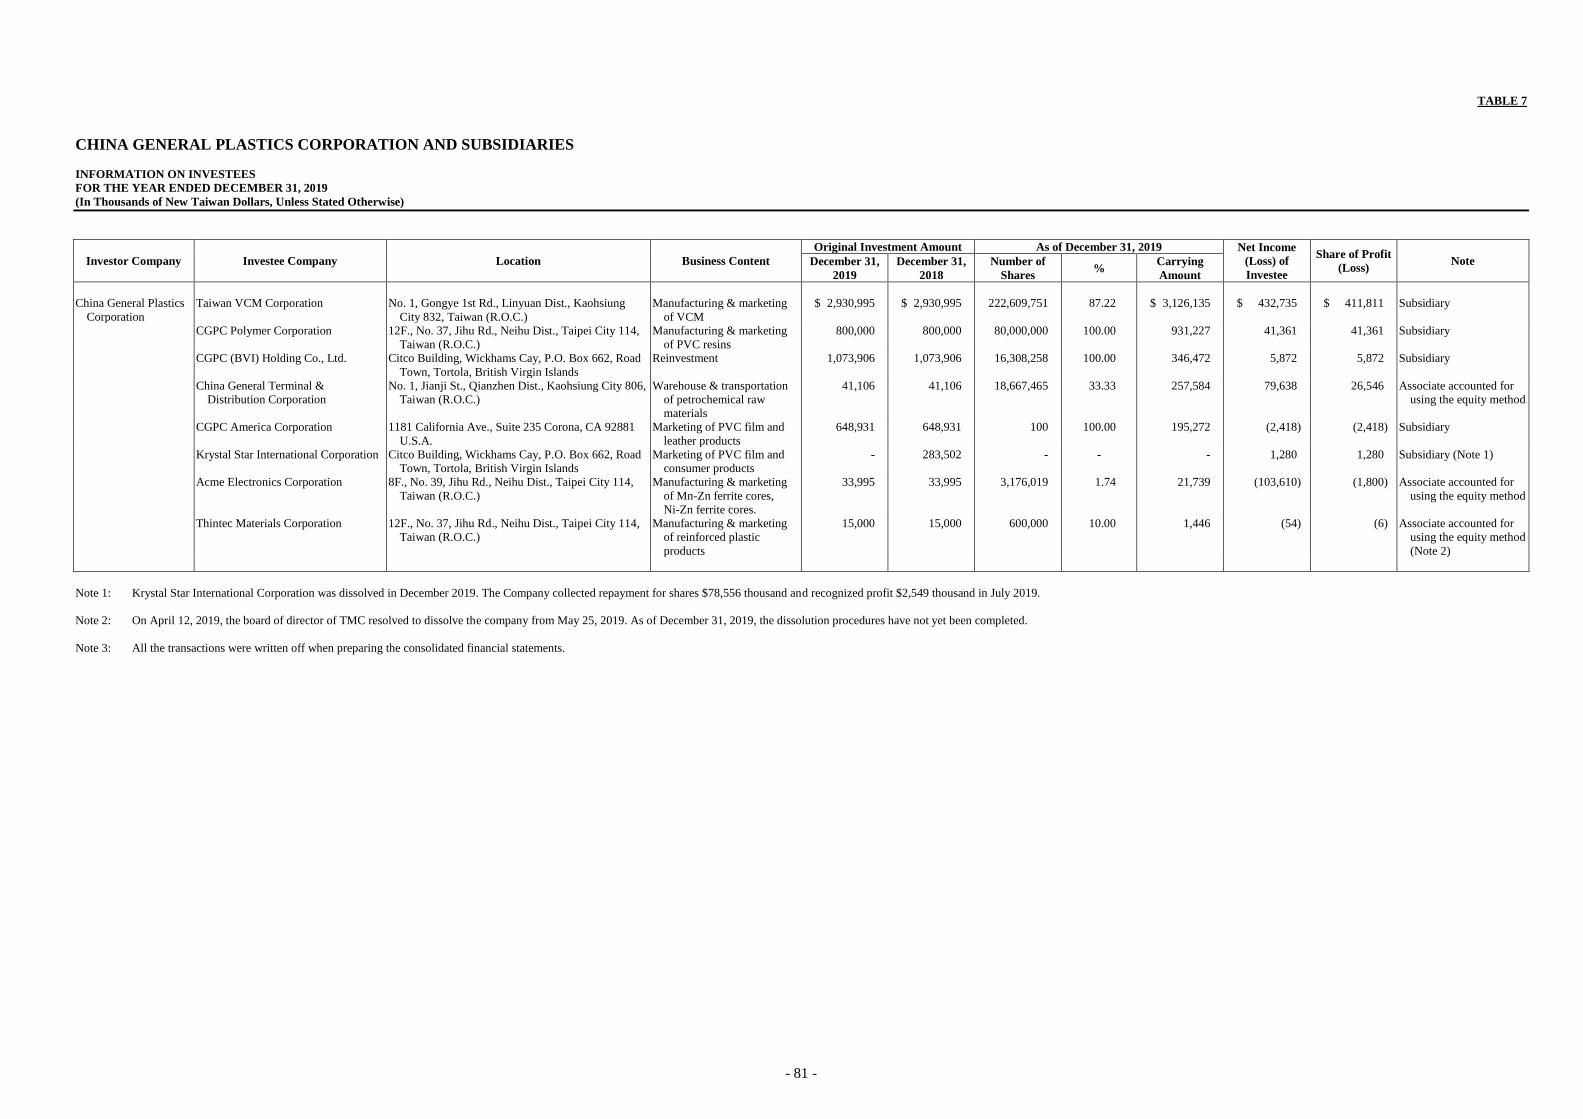
- 81 -
TABLE 7
CHINA GENERAL PLASTICS CORPORATION AND SUBSIDIARIES
INFORMATION ON INVESTEES
FOR THE YEAR ENDED DECEMBER 31, 2019
(In Thousands of New Taiwan Dollars, Unless Stated Otherwise)
Investor Company Investee Company Location Business Content
Original Investment Amount As of December 31, 2019 Net Income
(Loss) of
Investee
Share of Profit
(Loss) Note December 31,
2019
December 31,
2018
Number of
Shares %
Carrying
Amount
China General Plastics
Corporation
Taiwan VCM Corporation No. 1, Gongye 1st Rd., Linyuan Dist., Kaohsiung
City 832, Taiwan (R.O.C.)
Manufacturing & marketing
of VCM
$ 2,930,995 $ 2,930,995 222,609,751 87.22 $ 3,126,135 $ 432,735 $ 411,811 Subsidiary
CGPC Polymer Corporation 12F., No. 37, Jihu Rd., Neihu Dist., Taipei City 114,
Taiwan (R.O.C.)
Manufacturing & marketing
of PVC resins
800,000 800,000 80,000,000 100.00 931,227 41,361 41,361 Subsidiary
CGPC (BVI) Holding Co., Ltd. Citco Building, Wickhams Cay, P.O. Box 662, Road
Town, Tortola, British Virgin Islands
Reinvestment 1,073,906 1,073,906 16,308,258 100.00 346,472 5,872 5,872 Subsidiary
China General Terminal &
Distribution Corporation
No. 1, Jianji St., Qianzhen Dist., Kaohsiung City 806,
Taiwan (R.O.C.)
Warehouse & transportation
of petrochemical raw
materials
41,106 41,106 18,667,465 33.33 257,584 79,638 26,546 Associate accounted for
using the equity method
CGPC America Corporation 1181 California Ave., Suite 235 Corona, CA 92881
U.S.A.
Marketing of PVC film and
leather products
648,931 648,931 100 100.00 195,272 (2,418) (2,418) Subsidiary
Krystal Star International Corporation Citco Building, Wickhams Cay, P.O. Box 662, Road
Town, Tortola, British Virgin Islands
Marketing of PVC film and
consumer products
- 283,502 - - - 1,280 1,280 Subsidiary (Note 1)
Acme Electronics Corporation 8F., No. 39, Jihu Rd., Neihu Dist., Taipei City 114,
Taiwan (R.O.C.)
Manufacturing & marketing
of Mn-Zn ferrite cores,
Ni-Zn ferrite cores.
33,995 33,995 3,176,019 1.74 21,739 (103,610) (1,800) Associate accounted for
using the equity method
Thintec Materials Corporation 12F., No. 37, Jihu Rd., Neihu Dist., Taipei City 114,
Taiwan (R.O.C.)
Manufacturing & marketing
of reinforced plastic
products
15,000 15,000 600,000 10.00 1,446 (54) (6) Associate accounted for
using the equity method
(Note 2)
Note 1: Krystal Star International Corporation was dissolved in December 2019. The Company collected repayment for shares $78,556 thousand and recognized profit $2,549 thousand in July 2019.
Note 2: On April 12, 2019, the board of director of TMC resolved to dissolve the company from May 25, 2019. As of December 31, 2019, the dissolution procedures have not yet been completed.
Note 3: All the transactions were written off when preparing the consolidated financial statements.

- 82 -
TABLE 8
CHINA GENERAL PLASTICS CORPORATION AND SUBSIDIARIES
INFORMATION ON INVESTMENTS IN MAINLAND CHINA
FOR THE YEAR ENDED DECEMBER 31, 2019
(In Thousands of New Taiwan Dollars, Unless Stated Otherwise)
Investee Company Business Content Paid-in Capital
(Note 1) Method of Investment
Accumulated
Outward
Remittance for
Investment
from Taiwan
as of
January 1,
2019
(Note 1)
Investment Flows Accumulated
Outward
Remittance for
Investment
from Taiwan
as of
December 31,
2019
(Note 1)
Net Income
(Loss) of
Investee
% Ownership
of Direct or
Indirect
Investment
Investment
Gain (Loss)
(Notes 5 and 6)
Carrying
Amount as of
December 31,
2019
(Notes 1 and 6)
Accumulated
Repatriation of
Investment
Income as of
December 31,
2019
Outflow Inflow
Continental General Plastics
(Zhong Shan) Co., Ltd.
(“CGPC (ZS)”) (Note 4)
Manufacturing & marketing of
PVC film and consumer
products
$ 599,600
(US$ 20,000
thousand)
Investment through CGPC
(BVI) Holding Co., Ltd.
(“CGPC (BVI)”)
$ 599,600
(US$ 20,000
thousand)
$ - $ - $ 599,600
(US$ 20,000
thousand)
$ 4,246
(US$ 137
thousand)
100.00 $ 4,246
(US$ 137
thousand)
$ 257,984
(US$ 8,605
thousand)
$ -
CGPC Consumer Products
Corporation (“CGPC
(CP)”) (Note 4)
Manufacturing & marketing of
PVC consumer products
44,970
(US$ 1,500
thousand)
Investment through CGPC
(BVI) Holding Co., Ltd.
(“CGPC (BVI)”)
44,970
(US$ 1,500
thousand)
- - 44,970
(US$ 1,500
thousand)
(71)
(US$ 2
thousand)
100.00 (71)
(US$ 2
thousand)
13,308
(US$ 444
thousand)
-
Accumulated Outward Remittance
for Investment in Mainland China
as of December 31, 2019
(Notes 1 and 3)
Investment Amounts Authorized by
Investment Commission, MOEA
(Note 1)
Upper Limit on the Amount of
Investment Stipulated by
Investment Commission, MOEA
$811,918
(US$27,082 thousand)
$941,372
(US$31,400 thousand) (Note 2)
Note 1: The calculation was based on the spot exchange rate as on December 31, 2019.
Note 2: As the Company has obtained the certificate of qualification for operating headquarters issued by the Industrial Development Bureau, MOEA No. 10620424930 on September 22, 2017, the upper limit on investment in mainland China pursuant to the “Principle
of Investment or Technical Cooperation in Mainland China” is not applicable.
Note 3: QuanZhou Continental General Plastics Co., Ltd. (“CGPC (QZ)”) and Union (Zhong Shan) Co., Ltd. (“Union (ZS)”) completed dissolution procedures, and CGPC (BVI) retrieved the residual assets. The shares of Continental General Plastics (San He) Co., Ltd.
(“CGPC (SH)”) were fully sold, and CGPC (BVI) retrieved the residual assets. However, the amount of capital has not been wired back to Taiwan. The accumulated amount includes the investment amount of CGPC (QZ) of $20,506 thousand (US$684
thousand), the investment amount of Union (ZS) of $26,922 thousand (US$898 thousand) and the investment amount of CGPC (SH) of $119,920 thousand (US$4,000 thousand).
Note 4: The board of directors of the Company passed a resolution to dissolve CGPC (ZS) and CGPC (CP) on October 24, 2011. As of December 31, 2019, the dissolution procedures have not yet been completed.
Note 5: The investment income (loss) recognition in 2019 is based on the financial statements audited by the parent company’s CPA.
Note 6: All the transactions were written off when preparing the consolidated financial statements.