Embed Size (px)
Citation preview
Morning Notes China/Hong Kong
China & HK Research Team (852) 2600 8593 Monday, 04 November 2013
Please see important notice on last page Page 1 of 2
Find CLSA research on Bloomberg, Thomson Reuters, CapIQ and themarkets.com - and profit from our evalu@tor proprietary database at clsa.com
Conviction calls
Ticker Company Rec Target
return P/E(x) EPSg(%) Yield(%) P/B(x) ROE(%) 1M YTD
BIDU US Baidu BUY 31 26.2 21.9 0.0 6.9 30.3 0.1 59.6
293 HK Cathay Pacific BUY 16 9.6 114.3 4.2 1.0 10.4 0.6 9.0
1 HK Cheung Kong BUY 20 9.1 11.7 3.0 0.7 8.5 (0.2) 2.9
2007 HK Country Garden BUY 36 6.6 39.8 5.7 1.5 25.6 4.9 31.8
CTRP US Ctrip BUY 8 42.2 27.0 0.0 4.7 12.1 (8.3) 142.4
992 HK Lenovo BUY 7 15.8 13.8 2.6 3.5 24.8 4.2 20.2
MPEL US Melco Crown BUY 26 23.4 32.3 0.0 3.7 17.2 1.6 98.3
NTES US NetEase BUY 26 10.2 17.4 2.5 2.3 25.3 (7.4) 57.7
3968 HK CMB SELL (13) 5.9 5.1 4.2 1.0 18.1 8.5 (10.2)
1072 HK Dongfang SELL (25) 12.3 (12.3) 1.1 1.1 9.2 13.4 (17.9)
2727 HK Shanghai Electric SELL (17) 12.5 (4.5) 2.4 0.8 6.7 (0.7) (17.8)
3 HK HK & China Gas SELL (10) 25.9 5.6 2.1 3.4 13.4 (2.8) (5.3)
Performance(%)Valuations 14CL
MSCI China vs MSCI Asia ex-Japan
China & HK Indices
Last 1D 1M 3M
HSCEI 10,679 0.5 1.5 9.7
HSCCI 4,537 (0.3) 0.8 9.0
Shanghai A 2,250 0.4 (1.2) 5.9
Shanghai B 249 (0.0) (1.3) 3.8
Shenzhen A 1,061 (0.4) (3.8) 4.2
Shenzhen B 834 0.6 0.8 6.4
HSI 23,250 0.2 0.5 4.8
Finance 32,405 0.2 1.4 3.7
Properties 30,164 0.6 (1.6) 0.2
Utilities 50,060 (0.0) (1.5) (5.7)
Comm & Ind. 13,604 0.1 0.2 8.8
Yesterday's top five gainers and losers
% change
Top gainers Ticker 1D 1M YTD
Future Bright 703 HK 9.7 29.1 170.6
China Taiping 966 HK 7.3 11.3 (17.3)
Tingyi 322 HK 6.4 16.7 8.1
EVA Precision 838 HK 6.3 13.5 (6.3)
Gome 493 HK 5.0 20.0 37.0
Top losers
Shanda Games GAME US (4.5) 6.3 39.1
Antonoil 3337 HK (4.3) (7.3) 14.7
GCL-Poly 3800 HK (2.5) (4.5) 48.7
Techtronic 669 HK (2.4) (6.4) 32.6
Hysan 14 HK (2.2) 2.5 (4.8)
Upcoming Key Economic Data
05-Nov Oct
08-Nov Oct
09-Nov Oct
09-Nov Oct
09-Nov Oct
09-Nov Oct
Upcoming CLSA Events
15Oct - 4 Nov HK
4-5 Nov HK
28 Oct - 5 Nov HK
31 Oct-1 Nov SG
31 Oct-1 Nov HK
HSI vs CSI300 vs HSCEI
Consumer Price Index
Asia Transportation roadshow - Paul Wan
e-normous - Paul McKenzie
HK Banks - A City of Two Tales - Derek Ovington
% change
HSBC Services PMI
Import & Export Trade
Fixed Assets Investment
Korean Conglomerates & Construction - Steve Chung
Gaming & Consumer Roadshow - Aaron Fischer
Producer Price Index
Retail Sales Value
(25)
(20)
(15)
(10)
(5)
0
5
10
15
20
25
Nov-12 Feb-13 May-13 Aug-13
Hang Seng
HSCEI
CSI 300
(%)
(20)
(15)
(10)
(5)
0
5
10
15
Nov-12 Feb-13 May-13 Aug-13
MSCI China
MSCI Asia x Japan
(%) What’s inside: Sector Outlook. China Property Sector. Untightening.
ASM Pacific (522 HK - BUY). A Mixed Bag.
Sector Outlook. China Property Sector. Untightening.
We expect more stable policy environment, and hence better growth visibility for listed developers after the Third Plenary Meeting. Trading at an average
6.3x FY14 PE despite an average 25% net profit growth, the sector looks due for a re-rating and we reiterate OVERWEIGHT. Our top picks: Country Garden for its sustainable high growth and COLI for potentially earnings accretive asset injection.
ASM Pacific (522 HK - BUY). A Mixed Bag.
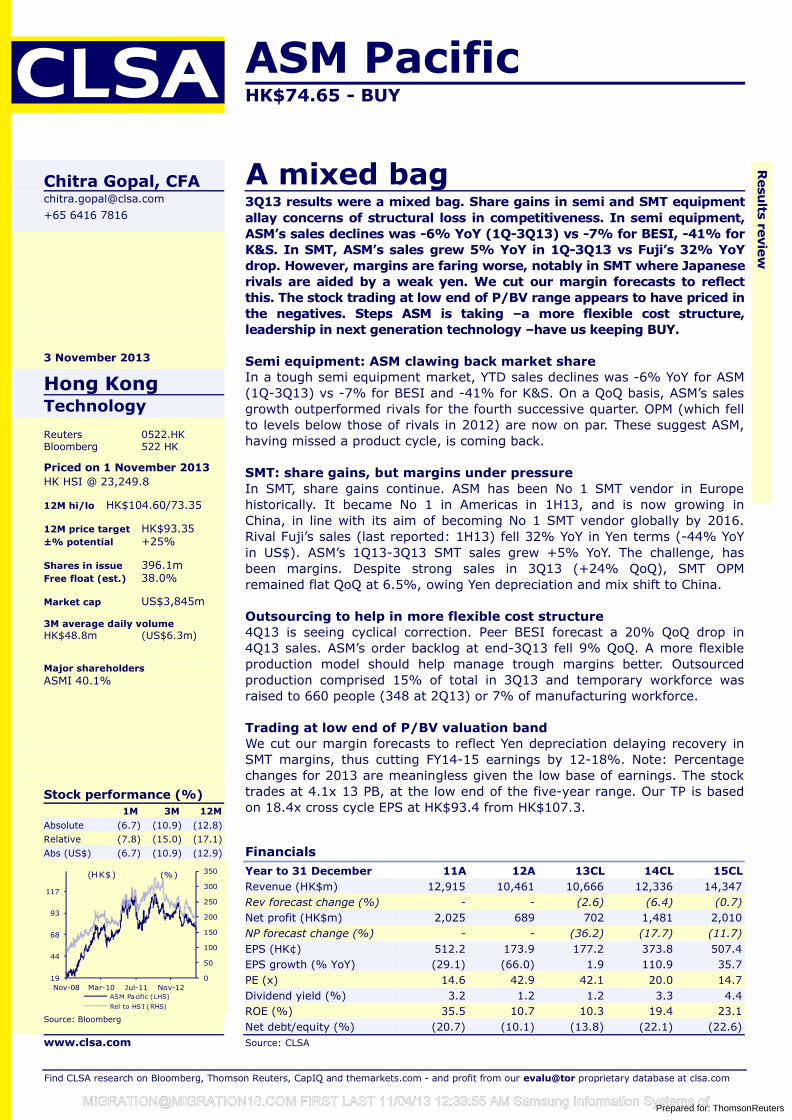
3Q13 results were a mixed bag. Share gains in semi and SMT equipment allay concerns of structural loss in competitiveness. In semi equipment, ASM’s sales declines was -6% YoY (1Q-3Q13) vs -7% for BESI, -41% for K&S. In SMT, ASM’s sales grew 5% YoY in 1Q-3Q13 vs Fuji’s 32% YoY drop. However, margins are faring worse, notably in SMT where Japanese rivals are aided by a weak yen. We cut our margin forecasts to reflect this. The stock
trading at low end of P/BV range appears to have priced in the negatives. Steps ASM is taking –a more flexible cost structure, leadership in next generation technology –have us keeping BUY.
News headlines China Services Index Rises to Year’s High in Rebound Sign A Chinese services-industry index rose to the highest level this year, adding to evidence the nation’s economic rebound is sustaining momentum as leaders prepare to map out a blueprint for reform. - Bloomberg Manufacturing Strengthens From China to South Korea Manufacturing strengthened from China to South Korea last month in a sign that growth risks are abating in Asia and expansion may pick up this quarter. - Bloomberg Macau Casino Revenue Rises to Record in October Macau casino revenue jumped 32% to a record of 36.5 billion patacas (US$4.57 billion) in October, boosted by mainland Chinese visitors who spent their Golden Week holiday in the world’s largest gambling hub. - Bloomberg
Home prices still rising in major cities Some top-tier cities are likely to miss targets set at the beginning of the year to stabilize home prices, as prices in China's 100 major cities continued to rise in October, a survey showed. - China Daily China, US 'ready to engage' on TPP talks China and the United States strongly intend to engage each other in the Trans-Pacific Partnership, a "high-standard" trade agreement involving the US and other countries including Japan and Australia, according to insiders close to both governments. – China Daily
Prepared for: [email protected] FIRST LAST 11/04/13 12:33:55 AM Samsung Information Systems of
Morning Notes - China/Hong Kong
Page 2 of 2
Find CLSA research on Bloomberg, Thomson Reuters, CapIQ and themarkets.com - and profit from our evalu@tor proprietary database at clsa.com
Research subscriptions To change your report distribution requirements, please contact your CLSA sales representative or email us at [email protected].
You can also fine-tune your Research Alert email preferences at https://www.clsa.com/member/tools/email_alert/.
Key to CLSA/CA Taiwan investment rankings: BUY: Total return expected to exceed market return AND provide 20% or greater absolute
return; O-PF: Total return expected to be greater than market return but less than 20% absolute return; U-PF: Total return expected to be less
than market return but expected to provide a positive absolute return; SELL: Total return expected to be less than market return AND to provide a
negative absolute return. For relative performance, we benchmark the 12-month total return (including dividends) for the stock against the 12-month forecast return (including dividends) for the local market where the stock is traded. We define stocks we expect to provide returns of 100%
or higher including dividends within three years as “Double Baggers”.
©2013 CLSA Limited (for research compiled by non-Taiwan analyst(s)) and/or Credit Agricole Securities Taiwan Co., Ltd (for research
compiled by Taiwan analyst(s)). Note: In the interests of timeliness, this document has not been edited.
The analyst/s who compiled this publication/communication hereby state/s and confirm/s that the contents hereof truly reflect his/her/their views and opinions on the subject matter and that the analyst/s has/have not been placed under any undue influence, intervention or pressure by any person/s in
compiling such publication/communication.
CLSA group of companies (excluding CLSA Americas, LLC) (“CLSA”), Credit Agricole Securities Taiwan Co., Ltd. (“CA Taiwan”), CLSA/CA Taiwan's
analysts and/or their associates do and from time to time seek to establish business or financial relationships with companies covered in their
research reports. As a result, investors should be aware that CLSA and/or such individuals may have one or more conflicts of interests that could
affect the objectivity of this report. Regulations or market practice of some jurisdictions/markets prescribe certain disclosures to be made for
certain actual, potential or perceived conflicts of interests relating to research reports and such details are available at
www.clsa.com/member/research_disclosures/. Disclosures therein include the position of CLSA, CLSA Americas, LLC and CA Taiwan only and do not reflect those of CITIC Securities International Company Limited, Credit Agricole Corporate & Investment Bank and/or their respective affiliates. If
investors have any difficulty accessing this website, please contact [email protected] or +852 2600 8111. If you require disclosure information
on previous dates, please contact [email protected]
IMPORTANT: The content of this report is subject to and should be read in conjunction with the disclaimer and CLSA's Legal and Regulatory Notices as set
out at www.clsa.com/disclaimer.html, a hard copy of which may be obtained on request from CLSA Publications or CLSA Compliance Group (18/F, One Pacific Place, 88 Queensway, Hong Kong, telephone +852 2600 8888) and/or CA Taiwan Compliance (27/F, 95, Section 2 Dun Hua South Road, Taipei
10682, Taiwan, telephone +886 2 2326 8188). 05/08/2013
Prepared for: [email protected] FIRST LAST 11/04/13 12:33:55 AM Samsung Information Systems of
China PropertySector outlook
Find CLSA research on Bloomberg, Thomson Reuters, CapIQ and themarkets.com - and profit from our evalu@tor proprietary database at clsa.com
Nicole [email protected]+852 2600 8207
Susanna Leung+852 2600 8597
Jackson Hui+852 2600 8723
4 November 2013
ChinaProperty
Country Garden (2007 HK)Rec: BUYTarget price: HK$7.0Upside: +32%
COLI (688 HK)Rec: BUYTarget price: HK$31.4Upside:+31%
Evergrande (3333 HK)Rec: U-PFTarget price: HK$3.60Upside: +10%
www.clsa.com
UntighteningWe expect more stable policy environment, and hence better growth visibility for listed developers after the Third Plenary Meeting. Trading at an average 6.3x FY14 PE despite an average 25% net profit growth, the sector looks due for a re-rating and we reiterate OVERWEIGHT. Our top picks: Country Garden for its sustainable high growth and COLI for potentially earnings accretive asset injection.
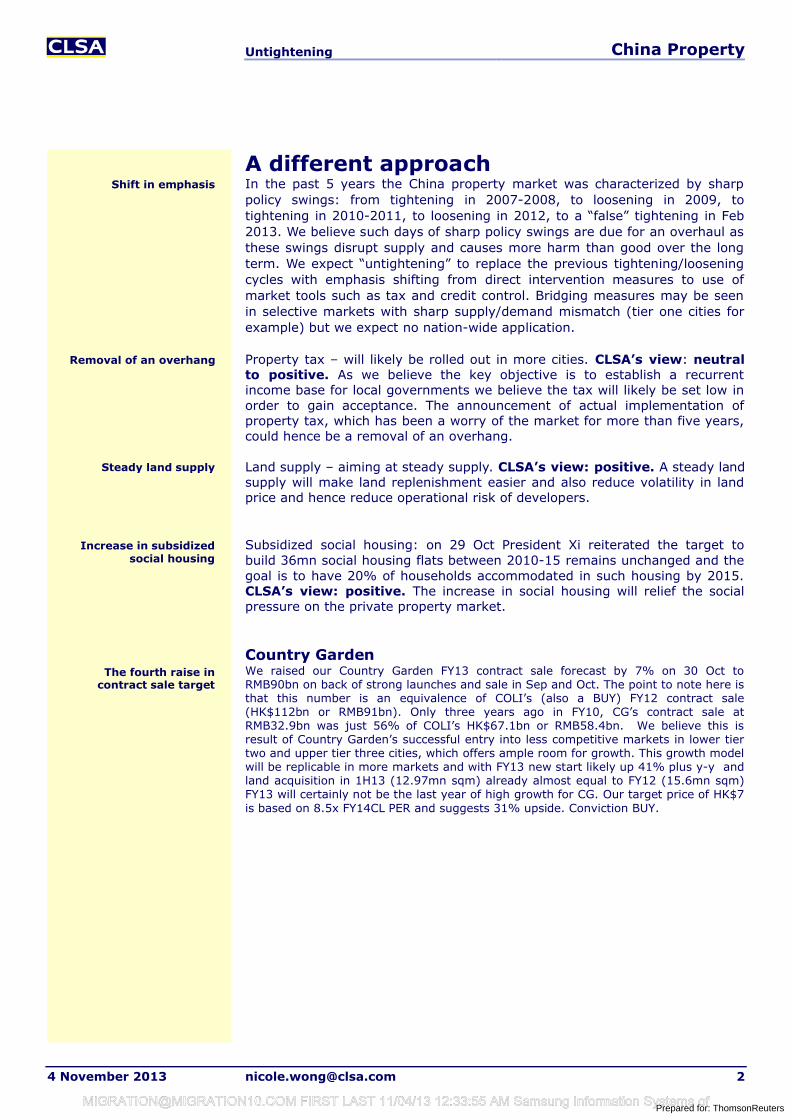
A different approachq In the past 5 years the China property market was characterized by sharp policy
swings: from tightening in 2007-2008, to loosening in 2009, to tightening in 2010-2011, to loosening in 2012, to a “false” tightening in Feb 2013.
q We believe such days of sharp policy swings are due for an overhaul as these swings disrupt supply and causes more harm than good over the long term. We expect “untightening” to replace the previous tightening/loosening cycles with emphasis shifting from direct intervention measures to use of market tools such as tax and credit control, the shift away from direct invention being unspoken and hence the sector re-rating to happen over subtle signals.
q Bridging measures may be seen in selective markets with sharp supply/demand mismatch (recent measures in Shenzhen and Beijing are examples) but we expect no nation-wide application.
Three key property focus measures in Third Plenary Meetingq Property tax – neutral to positive: has been expected for years and the actual
implementation actually removes overhang. We expect the tax will be set low initially to gain acceptance.
q Land supply increase – positive: the new government may emphasize a steady land supply which will make land replenishment easier for developers.
q Subsidized social housing - positive: We believe will relieve social pressure on private developers.
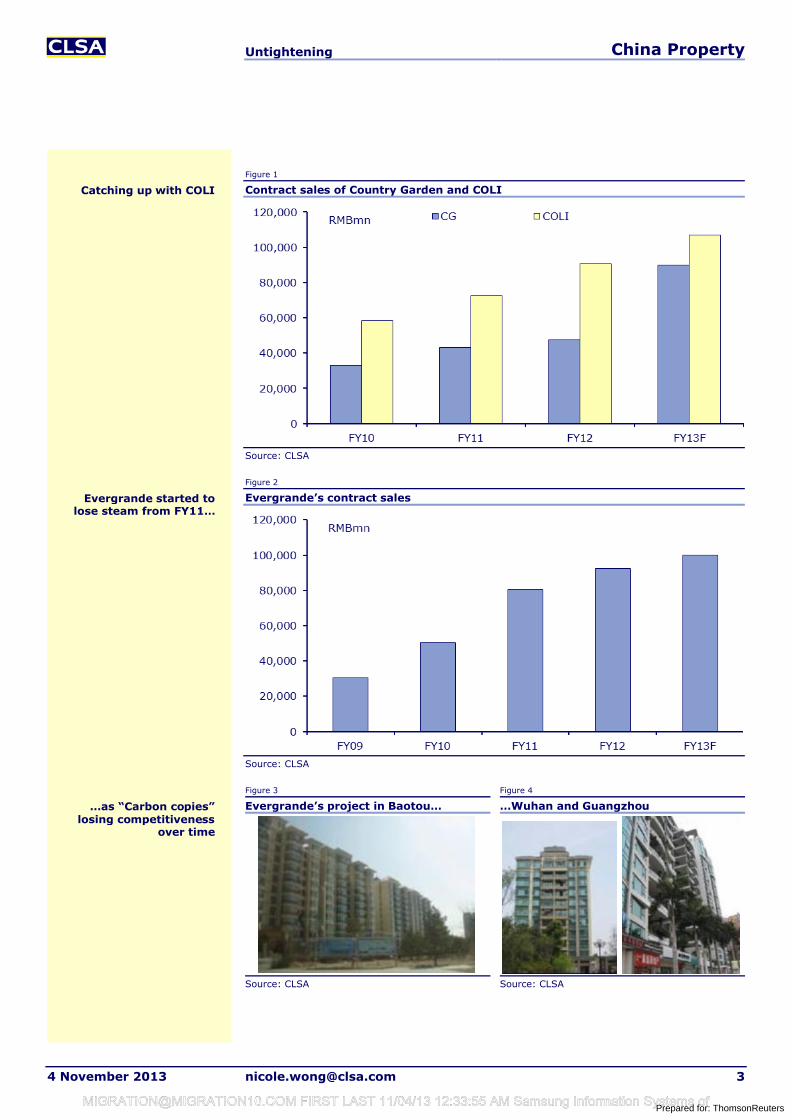
BUY Country Garden – almost a COLIq We raised our Country Garden FY13 contract sale forecast by 7% on 30 Oct to
RMB90bn on back of strong launches and sale in Sep and Oct.q The point to note here is that this number is an equivalence of COLI’s (also a BUY)
FY12 contract sale (HK$112bn or RMB91bn).q Only three years ago in FY10, CG’s contract sale at RMB32.9bn was just 56% of
COLI’s HK$67.1bn or RMB58.4bn. q We believe this is result of Country Garden’s successful entry into less competitive
markets in lower tier two and upper tier three cities, which offers ample room for growth.
q This growth model will be replicable in more markets and with FY13 new start likely up 41% plus y-y and land acquisition in 1H13 (12.97mn sqm) already almost equal to FY12 (15.6mn sqm) FY13 will certainly not be the last year of high growth for CG. Our target price of HK$7 is based on 8.5x FY14CL PER and suggests 31% upside. Conviction BUY.
BUY COLI – Change under wayq We are also BUYer of COLI where we expect 25% earnings CAGR for the next three
years with construction new start in FY13 expected to increase 21% plus y-y, and YTD Sep land acquisition already up 155% y-y (Report link: Coli - BUY (Change under way)).
q The above is before we consider the asset injection program from parent company CSCEC.
q We believe COLI is beginning to take over some CSCEC projects. In the best case scenario, the asset injection may happen in 1H14 and COLI may lift its scale of sale by 15% given CSCEC’s scale of sale in FY12 was about 25% of COLI’s and COLI is likely to cherry pick 30-50% of CSCEC’s projects.
q Our target price of HK$31.4 is set at 10x FY14 PE (par to 5-year historic average) and also suggests 31% upside. BUY.
Prepared for: [email protected] FIRST LAST 11/04/13 12:33:55 AM Samsung Information Systems of
Untightening China Property
4 November 2013 [email protected] 2
A different approachIn the past 5 years the China property market was characterized by sharp policy swings: from tightening in 2007-2008, to loosening in 2009, to tightening in 2010-2011, to loosening in 2012, to a “false” tightening in Feb 2013. We believe such days of sharp policy swings are due for an overhaul as these swings disrupt supply and causes more harm than good over the long term. We expect “untightening” to replace the previous tightening/loosening cycles with emphasis shifting from direct intervention measures to use of market tools such as tax and credit control. Bridging measures may be seen in selective markets with sharp supply/demand mismatch (tier one cities for example) but we expect no nation-wide application.
Property tax – will likely be rolled out in more cities. CLSA’s view: neutral to positive. As we believe the key objective is to establish a recurrent income base for local governments we believe the tax will likely be set low in order to gain acceptance. The announcement of actual implementation of property tax, which has been a worry of the market for more than five years, could hence be a removal of an overhang.
Land supply – aiming at steady supply. CLSA’s view: positive. A steady land supply will make land replenishment easier and also reduce volatility in land price and hence reduce operational risk of developers.
Subsidized social housing: on 29 Oct President Xi reiterated the target to build 36mn social housing flats between 2010-15 remains unchanged and the goal is to have 20% of households accommodated in such housing by 2015.CLSA’s view: positive. The increase in social housing will relief the social pressure on the private property market.
Country GardenWe raised our Country Garden FY13 contract sale forecast by 7% on 30 Oct to RMB90bn on back of strong launches and sale in Sep and Oct. The point to note here is that this number is an equivalence of COLI’s (also a BUY) FY12 contract sale (HK$112bn or RMB91bn). Only three years ago in FY10, CG’s contract sale at RMB32.9bn was just 56% of COLI’s HK$67.1bn or RMB58.4bn. We believe this is result of Country Garden’s successful entry into less competitive markets in lower tier two and upper tier three cities, which offers ample room for growth. This growth model will be replicable in more markets and with FY13 new start likely up 41% plus y-y and land acquisition in 1H13 (12.97mn sqm) already almost equal to FY12 (15.6mn sqm) FY13 will certainly not be the last year of high growth for CG. Our target price of HK$7 is based on 8.5x FY14CL PER and suggests 31% upside. Conviction BUY.
Shift in emphasis
Removal of an overhang
Steady land supply
Increase in subsidized social housing
The fourth raise in contract sale target
Prepared for: [email protected] FIRST LAST 11/04/13 12:33:55 AM Samsung Information Systems of
Untightening China Property
4 November 2013 [email protected] 3
Figure 1
Contract sales of Country Garden and COLI
Source: CLSA
Figure 2
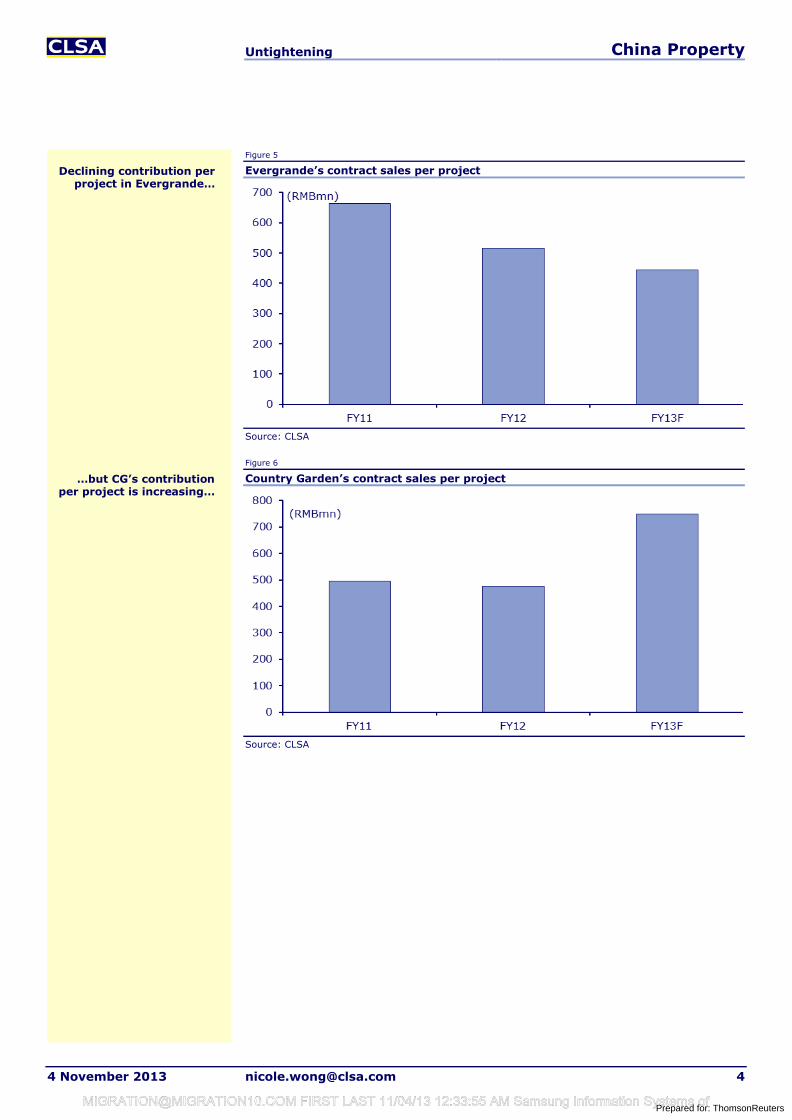
Evergrande’s contract sales
Source: CLSA
Figure 3 Figure 4
Evergrande’s project in Baotou… …Wuhan and Guangzhou
Source: CLSA Source: CLSA
Catching up with COLI
Evergrande started to lose steam from FY11…
…as “Carbon copies” losing competitiveness
over time
Prepared for: [email protected] FIRST LAST 11/04/13 12:33:55 AM Samsung Information Systems of
Untightening China Property
4 November 2013 [email protected] 4
Figure 5
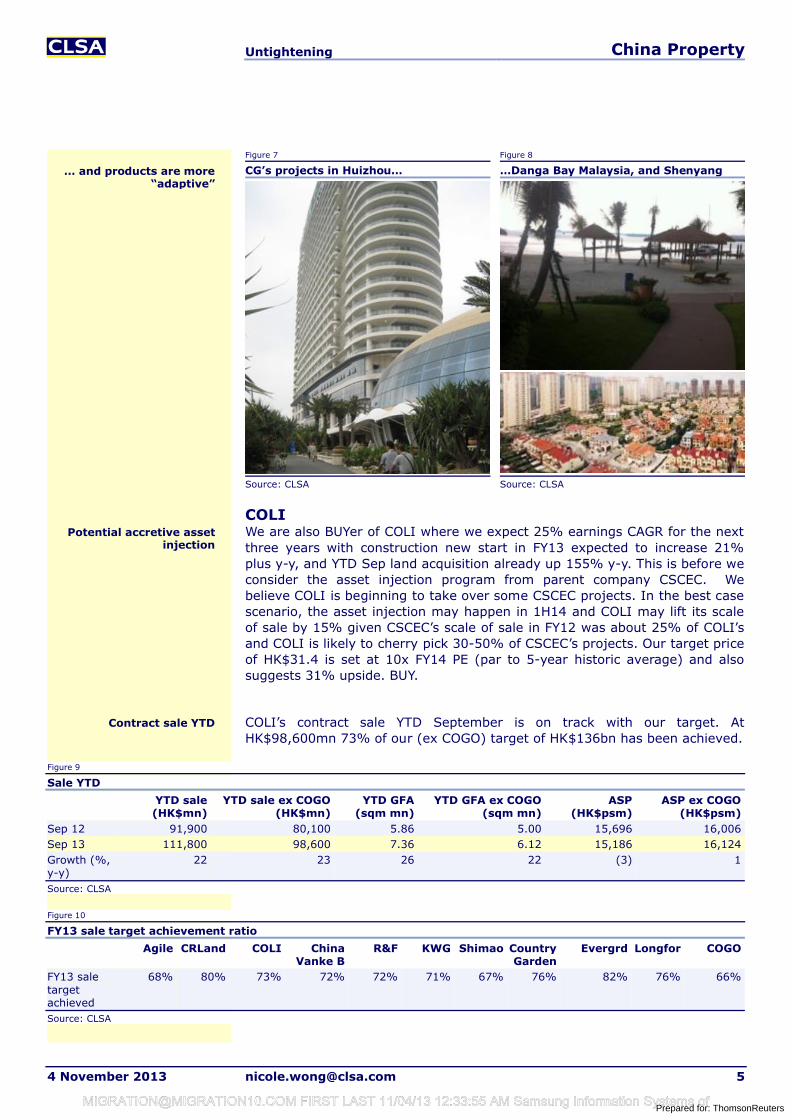
Evergrande’s contract sales per project
Source: CLSA
Figure 6
Country Garden’s contract sales per project
Source: CLSA
Declining contribution per project in Evergrande…
…but CG’s contribution per project is increasing…
Prepared for: [email protected] FIRST LAST 11/04/13 12:33:55 AM Samsung Information Systems of
Untightening China Property
4 November 2013 [email protected] 5
Figure 7 Figure 8
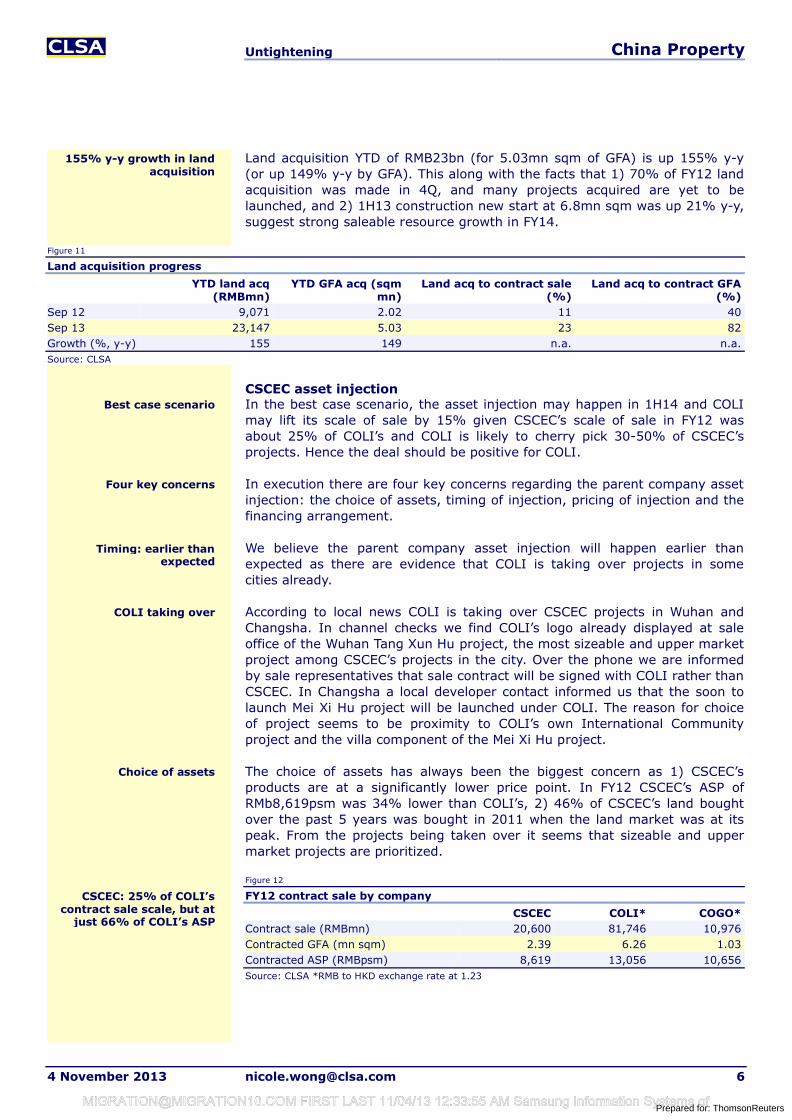
CG’s projects in Huizhou… …Danga Bay Malaysia, and Shenyang
Source: CLSA Source: CLSA
COLIWe are also BUYer of COLI where we expect 25% earnings CAGR for the next three years with construction new start in FY13 expected to increase 21% plus y-y, and YTD Sep land acquisition already up 155% y-y. This is before we consider the asset injection program from parent company CSCEC. We believe COLI is beginning to take over some CSCEC projects. In the best case scenario, the asset injection may happen in 1H14 and COLI may lift its scale of sale by 15% given CSCEC’s scale of sale in FY12 was about 25% of COLI’s and COLI is likely to cherry pick 30-50% of CSCEC’s projects. Our target price of HK$31.4 is set at 10x FY14 PE (par to 5-year historic average) and also suggests 31% upside. BUY.
COLI’s contract sale YTD September is on track with our target. At HK$98,600mn 73% of our (ex COGO) target of HK$136bn has been achieved.
Figure 9
Sale YTD
YTD sale (HK$mn)
YTD sale ex COGO (HK$mn)
YTD GFA (sqm mn)
YTD GFA ex COGO (sqm mn)
ASP (HK$psm)
ASP ex COGO (HK$psm)
Sep 12 91,900 80,100 5.86 5.00 15,696 16,006Sep 13 111,800 98,600 7.36 6.12 15,186 16,124Growth (%, y-y)
22 23 26 22 (3) 1
Source: CLSA
Figure 10
FY13 sale target achievement ratio
Agile CRLand COLI China Vanke B
R&F KWG Shimao Country Garden
Evergrd Longfor COGO
FY13 sale target achieved
68% 80% 73% 72% 72% 71% 67% 76% 82% 76% 66%
Source: CLSA
… and products are more “adaptive”
Contract sale YTD
Potential accretive asset injection
Prepared for: [email protected] FIRST LAST 11/04/13 12:33:55 AM Samsung Information Systems of
Untightening China Property
4 November 2013 [email protected] 6
Land acquisition YTD of RMB23bn (for 5.03mn sqm of GFA) is up 155% y-y (or up 149% y-y by GFA). This along with the facts that 1) 70% of FY12 land acquisition was made in 4Q, and many projects acquired are yet to be launched, and 2) 1H13 construction new start at 6.8mn sqm was up 21% y-y,suggest strong saleable resource growth in FY14.
Figure 11
Land acquisition progress
YTD land acq (RMBmn)
YTD GFA acq (sqm mn)
Land acq to contract sale (%)
Land acq to contract GFA (%)
Sep 12 9,071 2.02 11 40Sep 13 23,147 5.03 23 82Growth (%, y-y) 155 149 n.a. n.a.Source: CLSA
CSCEC asset injectionIn the best case scenario, the asset injection may happen in 1H14 and COLI may lift its scale of sale by 15% given CSCEC’s scale of sale in FY12 was about 25% of COLI’s and COLI is likely to cherry pick 30-50% of CSCEC’s projects. Hence the deal should be positive for COLI.
In execution there are four key concerns regarding the parent company asset injection: the choice of assets, timing of injection, pricing of injection and the financing arrangement.
We believe the parent company asset injection will happen earlier than expected as there are evidence that COLI is taking over projects in some cities already.
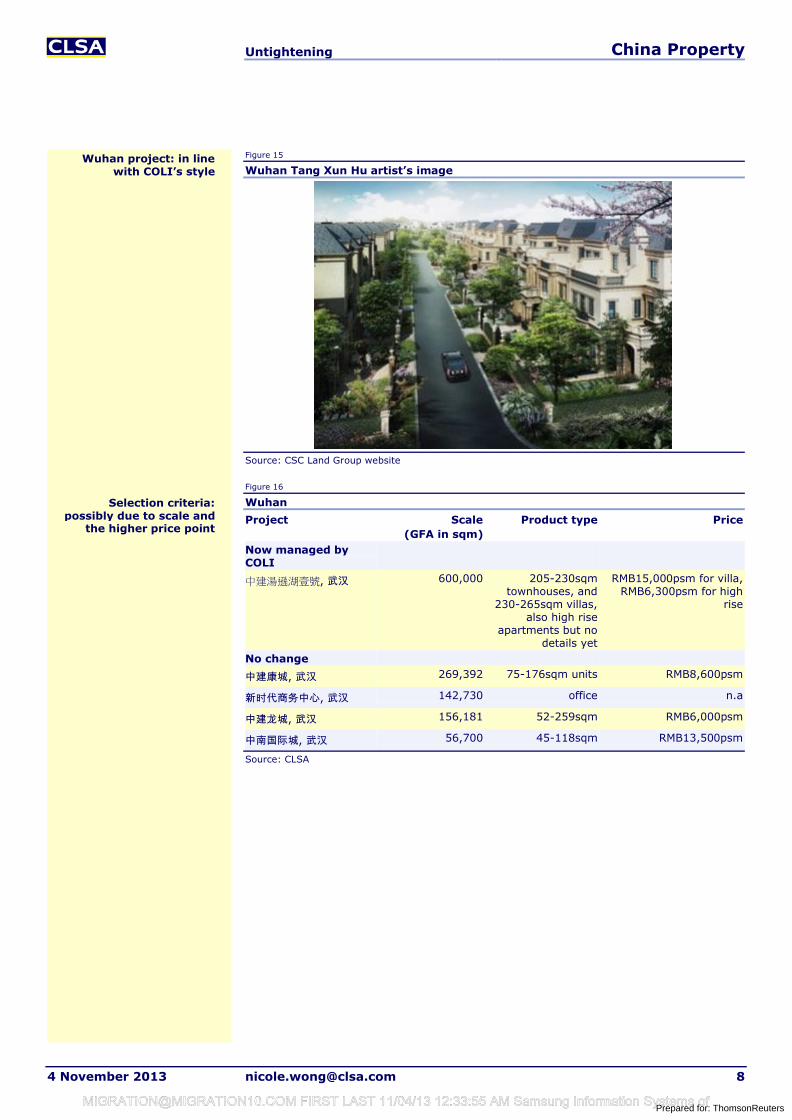
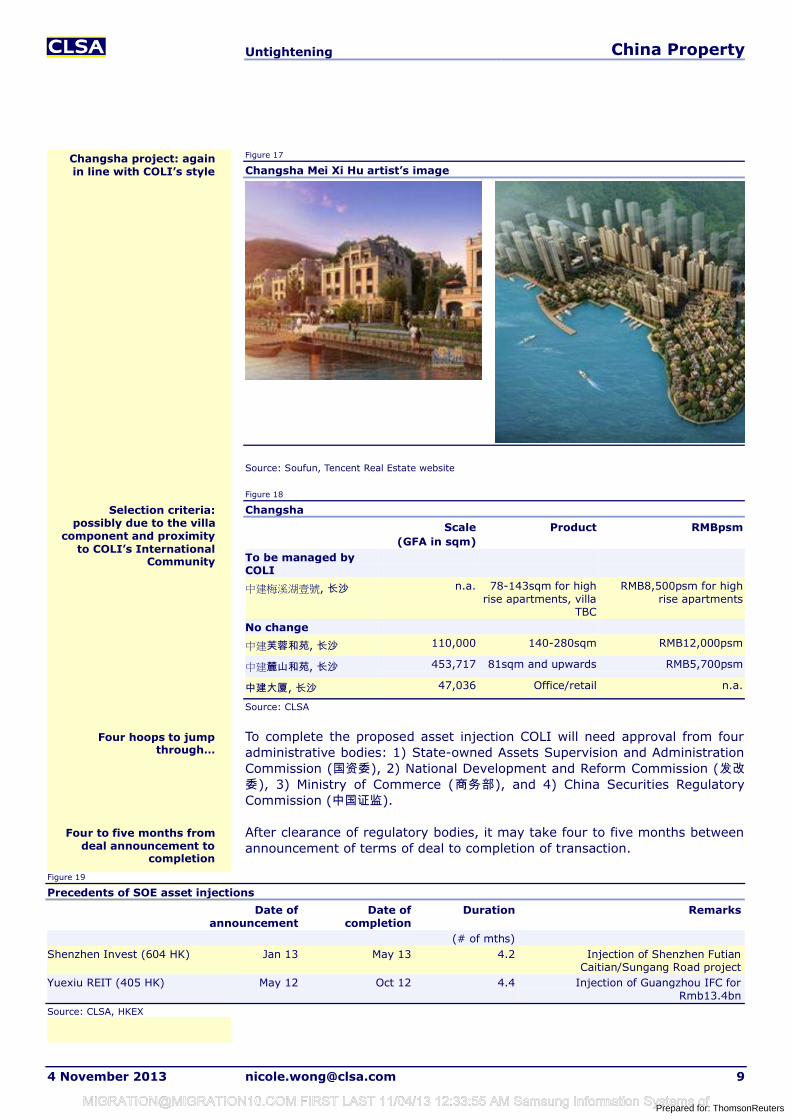
According to local news COLI is taking over CSCEC projects in Wuhan and Changsha. In channel checks we find COLI’s logo already displayed at sale office of the Wuhan Tang Xun Hu project, the most sizeable and upper market project among CSCEC’s projects in the city. Over the phone we are informed by sale representatives that sale contract will be signed with COLI rather than CSCEC. In Changsha a local developer contact informed us that the soon to launch Mei Xi Hu project will be launched under COLI. The reason for choice of project seems to be proximity to COLI’s own International Community project and the villa component of the Mei Xi Hu project.
The choice of assets has always been the biggest concern as 1) CSCEC’s products are at a significantly lower price point. In FY12 CSCEC’s ASP of RMb8,619psm was 34% lower than COLI’s, 2) 46% of CSCEC’s land bought over the past 5 years was bought in 2011 when the land market was at its peak. From the projects being taken over it seems that sizeable and upper market projects are prioritized.
Figure 12
FY12 contract sale by company
CSCEC COLI* COGO*Contract sale (RMBmn) 20,600 81,746 10,976Contracted GFA (mn sqm) 2.39 6.26 1.03Contracted ASP (RMBpsm) 8,619 13,056 10,656Source: CLSA *RMB to HKD exchange rate at 1.23
COLI taking over
Four key concerns
Timing: earlier than expected
CSCEC: 25% of COLI’s contract sale scale, but at
just 66% of COLI’s ASP
Choice of assets
Best case scenario
155% y-y growth in land acquisition
Prepared for: [email protected] FIRST LAST 11/04/13 12:33:55 AM Samsung Information Systems of
Untightening China Property
4 November 2013 [email protected] 7
Figure 13
FY08-12 land acquisition
GFA acq (mn sqm) CSCEC COLI % by year CSCEC % by year COLI2008 1.92 2.79 6.9 8.32009 6.06 11.65 21.9 34.72010 2.29 3.43 8.3 10.22011 12.61 9.06 45.6 27.02012 4.76 6.64 17.2 19.8Source: CLSA
Figure 14
COLI taking over
Source: Soufun
COLI’s logo displayed in CSCEC’s Wuhan Tang Xun
Hu project (汤逊湖壹号)
Prepared for: [email protected] FIRST LAST 11/04/13 12:33:55 AM Samsung Information Systems of
Untightening China Property
4 November 2013 [email protected] 8
Figure 15
Wuhan Tang Xun Hu artist’s image
Source: CSC Land Group website
Figure 16
Wuhan
Project Scale (GFA in sqm)
Product type Price
Now managed by COLI
中建湯遜湖壹號, 武汉 600,000 205-230sqm townhouses, and
230-265sqm villas, also high rise
apartments but no details yet
RMB15,000psm for villa, RMB6,300psm for high
rise
No change
中建康城, 武汉 269,392 75-176sqm units RMB8,600psm
新时代商务中心, 武汉 142,730 office n.a
中建龙城, 武汉 156,181 52-259sqm RMB6,000psm
中南国际城, 武汉 56,700 45-118sqm RMB13,500psm
Source: CLSA
Wuhan project: in line with COLI’s style
Selection criteria: possibly due to scale and
the higher price point
Prepared for: [email protected] FIRST LAST 11/04/13 12:33:55 AM Samsung Information Systems of
Untightening China Property
4 November 2013 [email protected] 9
Figure 17
Changsha Mei Xi Hu artist’s image
Source: Soufun, Tencent Real Estate website
Figure 18
Changsha
Scale(GFA in sqm)
Product RMBpsm
To be managed by COLI
中建梅溪湖壹號, 长沙 n.a. 78-143sqm for high rise apartments, villa
TBC
RMB8,500psm for high rise apartments
No change
中建芙蓉和苑, 长沙 110,000 140-280sqm RMB12,000psm
中建麓山和苑, 长沙 453,717 81sqm and upwards RMB5,700psm
中建大厦, 长沙 47,036 Office/retail n.a.
Source: CLSA
To complete the proposed asset injection COLI will need approval from four administrative bodies: 1) State-owned Assets Supervision and Administration Commission (国资委), 2) National Development and Reform Commission (发改委), 3) Ministry of Commerce (商务部), and 4) China Securities Regulatory Commission (中国证监).
After clearance of regulatory bodies, it may take four to five months between announcement of terms of deal to completion of transaction.
Figure 19
Precedents of SOE asset injections
Date of announcement
Date of completion
Duration Remarks
(# of mths)Shenzhen Invest (604 HK) Jan 13 May 13 4.2 Injection of Shenzhen Futian
Caitian/Sungang Road projectYuexiu REIT (405 HK) May 12 Oct 12 4.4 Injection of Guangzhou IFC for
Rmb13.4bnSource: CLSA, HKEX
Four hoops to jump through…
Four to five months from deal announcement to
completion
Changsha project: again in line with COLI’s style
Selection criteria: possibly due to the villa
component and proximity to COLI’s International
Community
Prepared for: [email protected] FIRST LAST 11/04/13 12:33:55 AM Samsung Information Systems of
Untightening China Property
4 November 2013 [email protected] 10
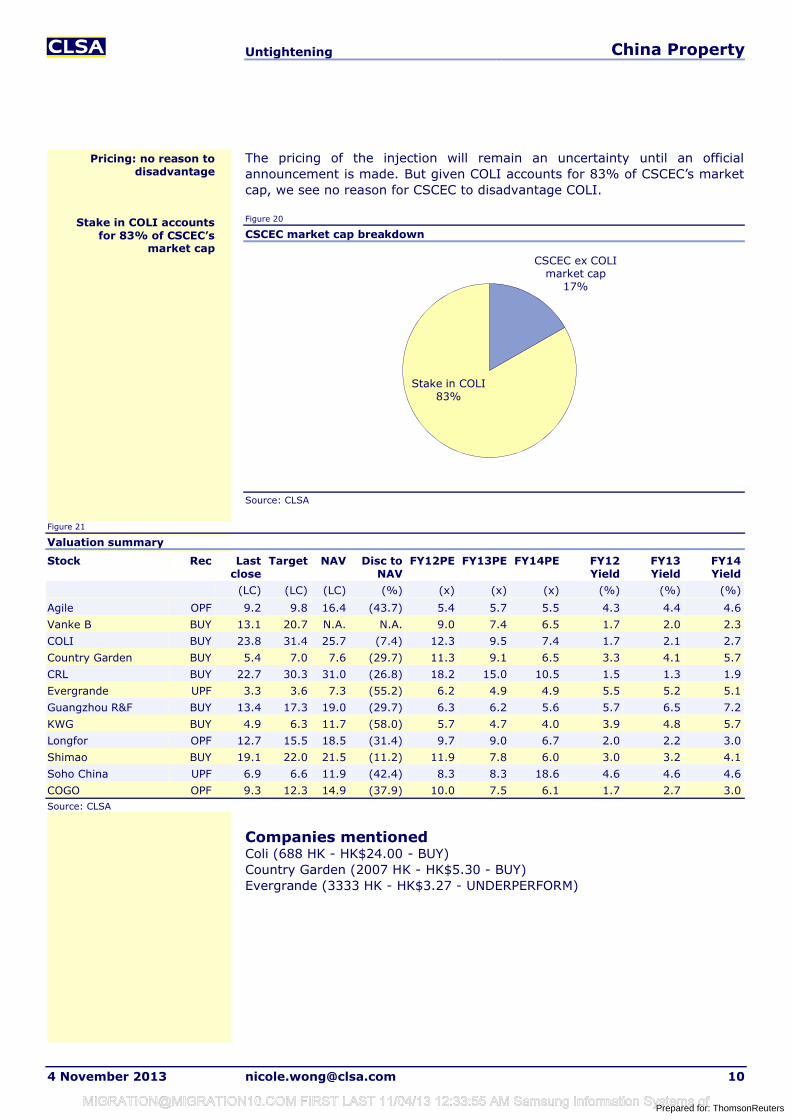
The pricing of the injection will remain an uncertainty until an official announcement is made. But given COLI accounts for 83% of CSCEC’s market cap, we see no reason for CSCEC to disadvantage COLI.
Figure 20
CSCEC market cap breakdown
Source: CLSA
Figure 21
Valuation summary
Stock Rec Last close
Target NAV Disc to NAV
FY12PE FY13PE FY14PE FY12 Yield
FY13 Yield
FY14 Yield
(LC) (LC) (LC) (%) (x) (x) (x) (%) (%) (%)
Agile OPF 9.2 9.8 16.4 (43.7) 5.4 5.7 5.5 4.3 4.4 4.6
Vanke B BUY 13.1 20.7 N.A. N.A. 9.0 7.4 6.5 1.7 2.0 2.3
COLI BUY 23.8 31.4 25.7 (7.4) 12.3 9.5 7.4 1.7 2.1 2.7
Country Garden BUY 5.4 7.0 7.6 (29.7) 11.3 9.1 6.5 3.3 4.1 5.7
CRL BUY 22.7 30.3 31.0 (26.8) 18.2 15.0 10.5 1.5 1.3 1.9
Evergrande UPF 3.3 3.6 7.3 (55.2) 6.2 4.9 4.9 5.5 5.2 5.1
Guangzhou R&F BUY 13.4 17.3 19.0 (29.7) 6.3 6.2 5.6 5.7 6.5 7.2
KWG BUY 4.9 6.3 11.7 (58.0) 5.7 4.7 4.0 3.9 4.8 5.7
Longfor OPF 12.7 15.5 18.5 (31.4) 9.7 9.0 6.7 2.0 2.2 3.0
Shimao BUY 19.1 22.0 21.5 (11.2) 11.9 7.8 6.0 3.0 3.2 4.1
Soho China UPF 6.9 6.6 11.9 (42.4) 8.3 8.3 18.6 4.6 4.6 4.6
COGO OPF 9.3 12.3 14.9 (37.9) 10.0 7.5 6.1 1.7 2.7 3.0Source: CLSA
Companies mentioned Coli (688 HK - HK$24.00 - BUY)Country Garden (2007 HK - HK$5.30 - BUY)Evergrande (3333 HK - HK$3.27 - UNDERPERFORM)
CSCEC ex COLI market cap
17%
Stake in COLI83%
Pricing: no reason to disadvantage
Stake in COLI accounts for 83% of CSCEC’s
market cap
Prepared for: [email protected] FIRST LAST 11/04/13 12:33:55 AM Samsung Information Systems of
Untightening China Property
4 November 2013 [email protected] 11
Research subscriptionsTo change your report distribution requirements, please contact your CLSA sales representative or email us at [email protected] can also fine-tune your Research Alert email preferences at https://www.clsa.com/member/tools/email_alert/.
Key to CLSA/CA Taiwan investment rankings: BUY: Total return expected to exceed market return AND provide 20% or greater absolute return; O-PF: Total return expected to be greater than market return but less than 20% absolute return; U-PF: Total return expected to be less than market return but expected to provide a positive absolute return; SELL: Total return expected to be less than market return AND to provide a negative absolute return. For relative performance, we benchmark the 12-month total return (including dividends) for the stock against the 12-month forecast return (including dividends) for the local market where the stock is traded. We define stocks we expect to provide returns of 100% or higher including dividends within three years as “Double Baggers”.
©2013 CLSA Limited (for research compiled by non-Taiwan analyst(s)) and/or Credit Agricole Securities Taiwan Co., Ltd (for research compiled by Taiwan analyst(s)). Note: In the interests of timeliness, this document has not been edited.
The analyst/s who compiled this publication/communication hereby state/s and confirm/s that the contents hereof truly reflect his/her/their views and opinions on the subject matter and that the analyst/s has/have not been placed under any undue influence, intervention or pressure by any person/s in compiling such publication/communication.
CLSA group of companies (excluding CLSA Americas, LLC) (“CLSA”), Credit Agricole Securities Taiwan Co., Ltd. (“CA Taiwan”), CLSA/CA Taiwan's analysts and/or their associates do and from time to time seek to establish business or financial relationships with companies covered in their research reports. As a result, investors should be aware that CLSA and/or such individuals may have one or more conflicts of interests that could affect the objectivity of this report. Regulations or market practice of some jurisdictions/markets prescribe certain disclosures to be made for certain actual, potential or perceived conflicts of interests relating to research reports and such details are available at www.clsa.com/member/research_disclosures/. Disclosures therein include the position of CLSA, CLSA Americas, LLC and CA Taiwan only and do not reflect those of CITIC Securities International Company Limited, Credit Agricole Corporate & Investment Bank and/or their respective affiliates. If investors have any difficulty accessing this website, please contact [email protected] or +852 2600 8111. If you require disclosure information on previous dates, please contact [email protected]
IMPORTANT: The content of this report is subject to and should be read in conjunction with the disclaimer and CLSA's Legal and Regulatory Notices as set out at www.clsa.com/disclaimer.html, a hard copy of which may be obtained on request from CLSA Publications or CLSA Compliance Group (18/F, One Pacific Place, 88 Queensway, Hong Kong, telephone +852 2600 8888) and/or CA Taiwan Compliance (27/F, 95, Section 2 Dun Hua South Road, Taipei 10682, Taiwan, telephone +886 2 2326 8188). 05/08/2013
Prepared for: [email protected] FIRST LAST 11/04/13 12:33:55 AM Samsung Information Systems of
ASM PacificHK$74.65 - BUY
FinancialsYear to 31 December 11A 12A 13CL 14CL 15CLRevenue (HK$m) 12,915 10,461 10,666 12,336 14,347Rev forecast change (%) - - (2.6) (6.4) (0.7)Net profit (HK$m) 2,025 689 702 1,481 2,010NP forecast change (%) - - (36.2) (17.7) (11.7)EPS (HK¢) 512.2 173.9 177.2 373.8 507.4EPS growth (% YoY) (29.1) (66.0) 1.9 110.9 35.7PE (x) 14.6 42.9 42.1 20.0 14.7Dividend yield (%) 3.2 1.2 1.2 3.3 4.4ROE (%) 35.5 10.7 10.3 19.4 23.1Net debt/equity (%) (20.7) (10.1) (13.8) (22.1) (22.6)Source: CLSA
Find CLSA research on Bloomberg, Thomson Reuters, CapIQ and themarkets.com - and profit from our evalu@tor proprietary database at clsa.com
Chitra Gopal, [email protected]
+65 6416 7816
3 November 2013
Hong KongTechnology
Reuters 0522.HKBloomberg 522 HK
Priced on 1 November 2013HK HSI @ 23,249.8
12M hi/lo HK$104.60/73.35
12M price target HK$93.35±% potential +25%
Shares in issue 396.1mFree float (est.) 38.0%
Market cap US$3,845m
3M average daily volumeHK$48.8m (US$6.3m)
Major shareholdersASMI 40.1%
Stock performance (%)1M 3M 12M
Absolute (6.7) (10.9) (12.8)Relative (7.8) (15.0) (17.1)Abs (US$) (6.7) (10.9) (12.9)
0
50
100
150
200
250
300
350
19
44
68
93
117
Nov-08 Mar-10 Jul-11 Nov-12ASM Pacific (LHS)
Rel to HS I (RHS)
(HK$) (%)
Source: Bloomberg
www.clsa.com
Resu
lts revie
w
A mixed bag 3Q13 results were a mixed bag. Share gains in semi and SMT equipmentallay concerns of structural loss in competitiveness. In semi equipment, ASM’s sales declines was -6% YoY (1Q-3Q13) vs -7% for BESI, -41% for K&S. In SMT, ASM’s sales grew 5% YoY in 1Q-3Q13 vs Fuji’s 32% YoY drop. However, margins are faring worse, notably in SMT where Japanese rivals are aided by a weak yen. We cut our margin forecasts to reflect this. The stock trading at low end of P/BV range appears to have priced in the negatives. Steps ASM is taking –a more flexible cost structure, leadership in next generation technology –have us keeping BUY.
Semi equipment: ASM clawing back market shareIn a tough semi equipment market, YTD sales declines was -6% YoY for ASM(1Q-3Q13) vs -7% for BESI and -41% for K&S. On a QoQ basis, ASM’s sales growth outperformed rivals for the fourth successive quarter. OPM (which fell to levels below those of rivals in 2012) are now on par. These suggest ASM, having missed a product cycle, is coming back.
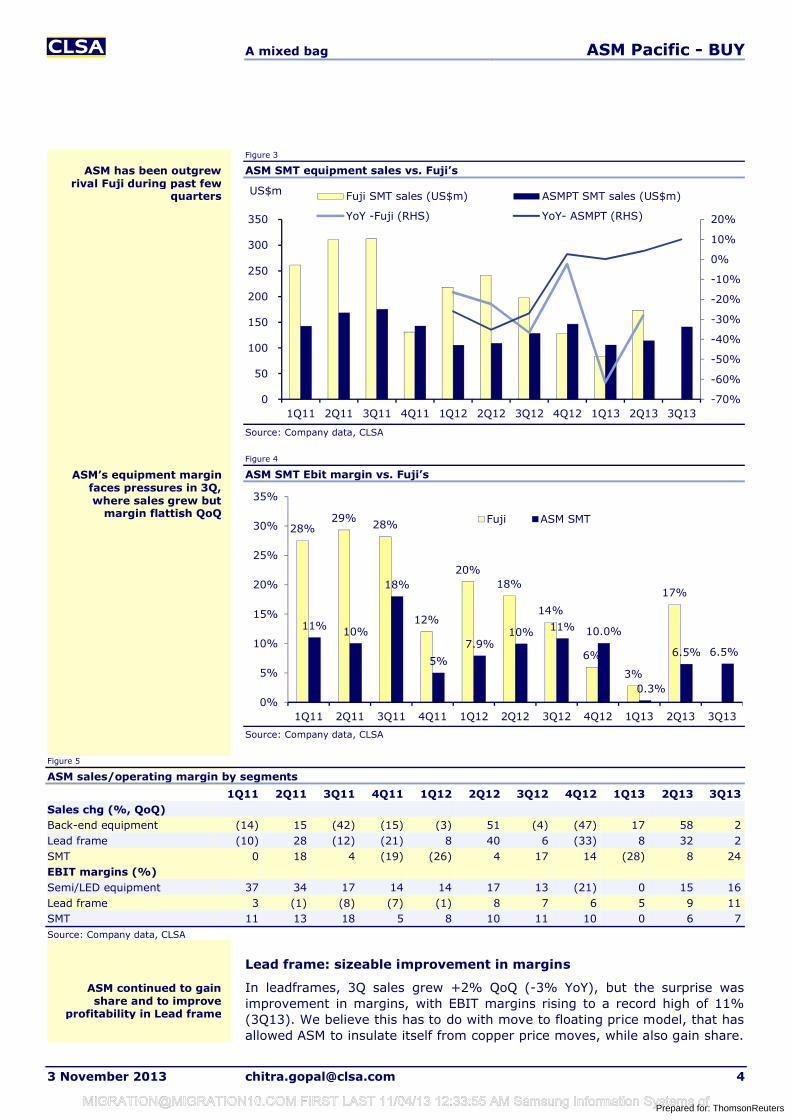
SMT: share gains, but margins under pressureIn SMT, share gains continue. ASM has been No 1 SMT vendor in Europe historically. It became No 1 in Americas in 1H13, and is now growing in China, in line with its aim of becoming No 1 SMT vendor globally by 2016. Rival Fuji’s sales (last reported: 1H13) fell 32% YoY in Yen terms (-44% YoY in US$). ASM’s 1Q13-3Q13 SMT sales grew +5% YoY. The challenge, has been margins. Despite strong sales in 3Q13 (+24% QoQ), SMT OPM remained flat QoQ at 6.5%, owing Yen depreciation and mix shift to China.
Outsourcing to help in more flexible cost structure4Q13 is seeing cyclical correction. Peer BESI forecast a 20% QoQ drop in 4Q13 sales. ASM’s order backlog at end-3Q13 fell 9% QoQ. A more flexible production model should help manage trough margins better. Outsourced production comprised 15% of total in 3Q13 and temporary workforce was raised to 660 people (348 at 2Q13) or 7% of manufacturing workforce.
Trading at low end of P/BV valuation bandWe cut our margin forecasts to reflect Yen depreciation delaying recovery in SMT margins, thus cutting FY14-15 earnings by 12-18%. Note: Percentage changes for 2013 are meaningless given the low base of earnings. The stock trades at 4.1x 13 PB, at the low end of the five-year range. Our TP is based on 18.4x cross cycle EPS at HK$93.4 from HK$107.3.
Prepared for: [email protected] FIRST LAST 11/04/13 12:33:55 AM Samsung Information Systems of
A mixed bag ASM Pacific - BUY
3 November 2013 [email protected] 2
Semi equipment (49% of sales, 67% of profit): Cost reduction efforts start showing results, outperforming peers
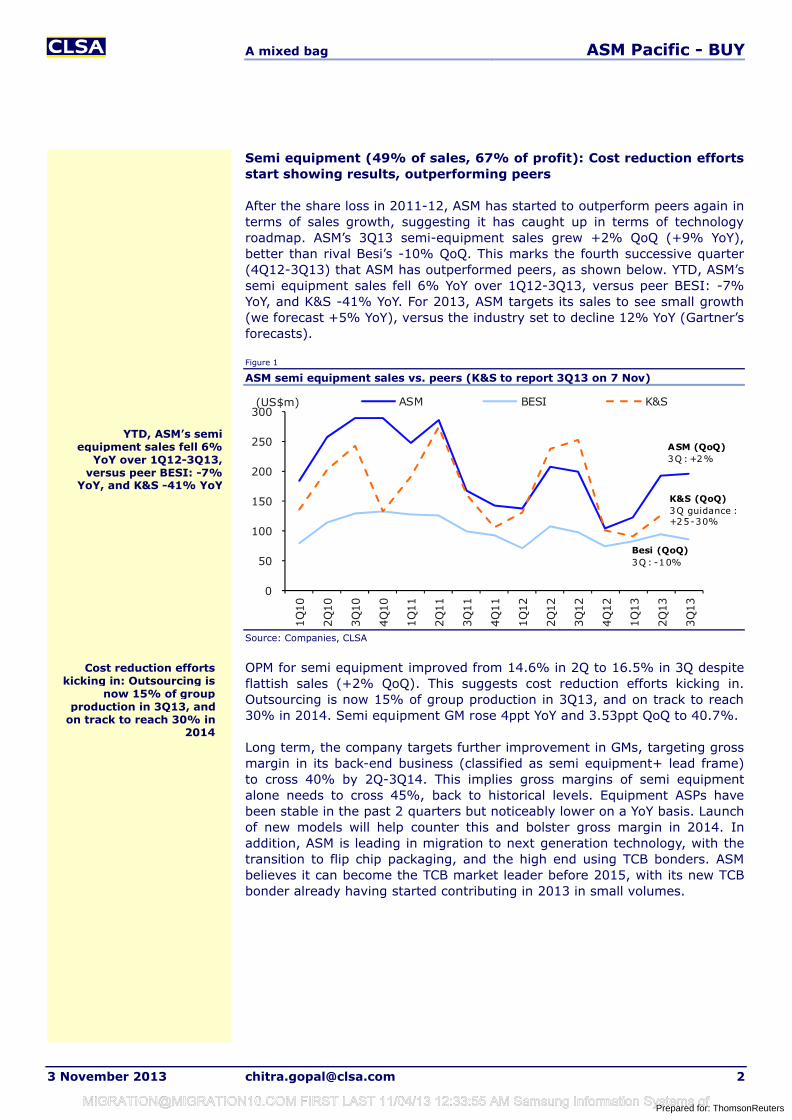
After the share loss in 2011-12, ASM has started to outperform peers again in terms of sales growth, suggesting it has caught up in terms of technology roadmap. ASM’s 3Q13 semi-equipment sales grew +2% QoQ (+9% YoY), better than rival Besi’s -10% QoQ. This marks the fourth successive quarter (4Q12-3Q13) that ASM has outperformed peers, as shown below. YTD, ASM’s semi equipment sales fell 6% YoY over 1Q12-3Q13, versus peer BESI: -7% YoY, and K&S -41% YoY. For 2013, ASM targets its sales to see small growth(we forecast +5% YoY), versus the industry set to decline 12% YoY (Gartner’sforecasts).
Figure 1
ASM semi equipment sales vs. peers (K&S to report 3Q13 on 7 Nov)
Source: Companies, CLSA
OPM for semi equipment improved from 14.6% in 2Q to 16.5% in 3Q despite flattish sales (+2% QoQ). This suggests cost reduction efforts kicking in. Outsourcing is now 15% of group production in 3Q13, and on track to reach 30% in 2014. Semi equipment GM rose 4ppt YoY and 3.53ppt QoQ to 40.7%.
Long term, the company targets further improvement in GMs, targeting gross margin in its back-end business (classified as semi equipment+ lead frame)to cross 40% by 2Q-3Q14. This implies gross margins of semi equipment alone needs to cross 45%, back to historical levels. Equipment ASPs havebeen stable in the past 2 quarters but noticeably lower on a YoY basis. Launch of new models will help counter this and bolster gross margin in 2014. In addition, ASM is leading in migration to next generation technology, with the transition to flip chip packaging, and the high end using TCB bonders. ASM believes it can become the TCB market leader before 2015, with its new TCB bonder already having started contributing in 2013 in small volumes.
0
50
100
150
200
250
300
1Q
10
2Q
10
3Q
10
4Q
10
1Q
11
2Q
11
3Q
11
4Q
11
1Q
12
2Q
12
3Q
12
4Q
12
1Q
13
2Q
13
3Q
13
(US$m) ASM BESI K&S
ASM (QoQ)3Q : +2%
Besi (QoQ)3Q : -10%
K&S (QoQ)3Q guidance : +25-30%
Cost reduction efforts kicking in: Outsourcing is
now 15% of group production in 3Q13, and
on track to reach 30% in 2014
YTD, ASM’s semi equipment sales fell 6%
YoY over 1Q12-3Q13, versus peer BESI: -7%
YoY, and K&S -41% YoY
Prepared for: [email protected] FIRST LAST 11/04/13 12:33:55 AM Samsung Information Systems of
A mixed bag ASM Pacific - BUY
3 November 2013 [email protected] 3
Figure 2
ASM back-end equipment Ebit margin vs. peers (K&S to report 3Q13 on 7 Nov)
Source: Companies, CLSA
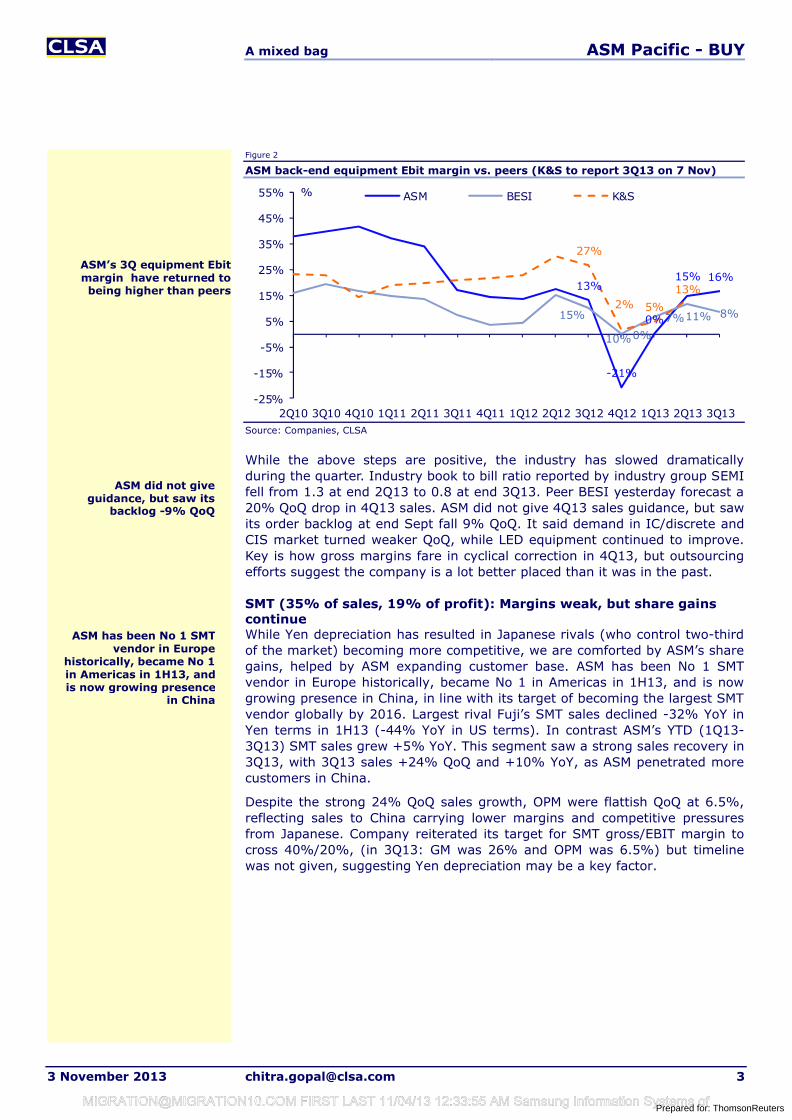
While the above steps are positive, the industry has slowed dramatically during the quarter. Industry book to bill ratio reported by industry group SEMI fell from 1.3 at end 2Q13 to 0.8 at end 3Q13. Peer BESI yesterday forecast a 20% QoQ drop in 4Q13 sales. ASM did not give 4Q13 sales guidance, but saw its order backlog at end Sept fall 9% QoQ. It said demand in IC/discrete and CIS market turned weaker QoQ, while LED equipment continued to improve. Key is how gross margins fare in cyclical correction in 4Q13, but outsourcing efforts suggest the company is a lot better placed than it was in the past.
SMT (35% of sales, 19% of profit): Margins weak, but share gains continue While Yen depreciation has resulted in Japanese rivals (who control two-third of the market) becoming more competitive, we are comforted by ASM’s share gains, helped by ASM expanding customer base. ASM has been No 1 SMT vendor in Europe historically, became No 1 in Americas in 1H13, and is now growing presence in China, in line with its target of becoming the largest SMT vendor globally by 2016. Largest rival Fuji’s SMT sales declined -32% YoY in Yen terms in 1H13 (-44% YoY in US terms). In contrast ASM’s YTD (1Q13-3Q13) SMT sales grew +5% YoY. This segment saw a strong sales recovery in 3Q13, with 3Q13 sales +24% QoQ and +10% YoY, as ASM penetrated more customers in China.
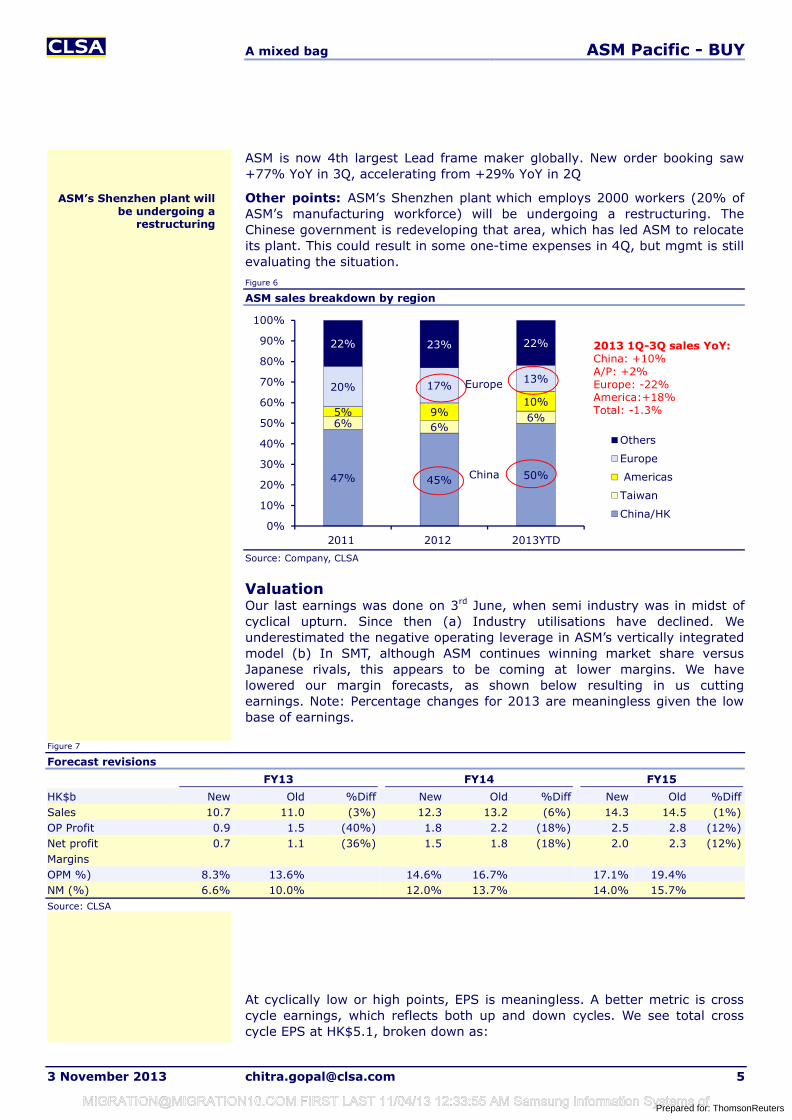
Despite the strong 24% QoQ sales growth, OPM were flattish QoQ at 6.5%, reflecting sales to China carrying lower margins and competitive pressures from Japanese. Company reiterated its target for SMT gross/EBIT margin to cross 40%/20%, (in 3Q13: GM was 26% and OPM was 6.5%) but timeline was not given, suggesting Yen depreciation may be a key factor.
13%
-21%
0%
15% 16%
15%
10%0%
7%11% 8%
27%
2% 5%
13%
-25%
-15%
-5%
5%
15%
25%
35%
45%
55%
2Q10 3Q10 4Q10 1Q11 2Q11 3Q11 4Q11 1Q12 2Q12 3Q12 4Q12 1Q13 2Q13 3Q13
% ASM BESI K&S
ASM did not give guidance, but saw its
backlog -9% QoQ
ASM’s 3Q equipment Ebit margin have returned to being higher than peers
ASM has been No 1 SMT vendor in Europe
historically, became No 1 in Americas in 1H13, and is now growing presence
in China
Prepared for: [email protected] FIRST LAST 11/04/13 12:33:55 AM Samsung Information Systems of
A mixed bag ASM Pacific - BUY
3 November 2013 [email protected] 4
Figure 3
ASM SMT equipment sales vs. Fuji’s
Source: Company data, CLSA
Figure 4
ASM SMT Ebit margin vs. Fuji’s
Source: Company data, CLSA
Figure 5
ASM sales/operating margin by segments
1Q11 2Q11 3Q11 4Q11 1Q12 2Q12 3Q12 4Q12 1Q13 2Q13 3Q13Sales chg (%, QoQ)Back-end equipment (14) 15 (42) (15) (3) 51 (4) (47) 17 58 2Lead frame (10) 28 (12) (21) 8 40 6 (33) 8 32 2SMT 0 18 4 (19) (26) 4 17 14 (28) 8 24EBIT margins (%)Semi/LED equipment 37 34 17 14 14 17 13 (21) 0 15 16Lead frame 3 (1) (8) (7) (1) 8 7 6 5 9 11SMT 11 13 18 5 8 10 11 10 0 6 7Source: Company data, CLSA
Lead frame: sizeable improvement in margins
In leadframes, 3Q sales grew +2% QoQ (-3% YoY), but the surprise was improvement in margins, with EBIT margins rising to a record high of 11% (3Q13). We believe this has to do with move to floating price model, that has allowed ASM to insulate itself from copper price moves, while also gain share.
-70%
-60%
-50%
-40%
-30%
-20%
-10%
0%
10%
20%
0
50
100
150
200
250
300
350
1Q11 2Q11 3Q11 4Q11 1Q12 2Q12 3Q12 4Q12 1Q13 2Q13 3Q13
US$m Fuji SMT sales (US$m) ASMPT SMT sales (US$m)
YoY -Fuji (RHS) YoY- ASMPT (RHS)
28%29%
28%
12%
20%18%
14%
6%
3%
17%
11% 10%
18%
5%
7.9%10% 11% 10.0%
0.3%
6.5% 6.5%
0%
5%
10%
15%
20%
25%
30%
35%
1Q11 2Q11 3Q11 4Q11 1Q12 2Q12 3Q12 4Q12 1Q13 2Q13 3Q13
Fuji ASM SMT
ASM continued to gain share and to improve
profitability in Lead frame
ASM has been outgrew rival Fuji during past few
quarters
ASM’s equipment margin faces pressures in 3Q, where sales grew but
margin flattish QoQ
Prepared for: [email protected] FIRST LAST 11/04/13 12:33:55 AM Samsung Information Systems of
A mixed bag ASM Pacific - BUY
3 November 2013 [email protected] 5
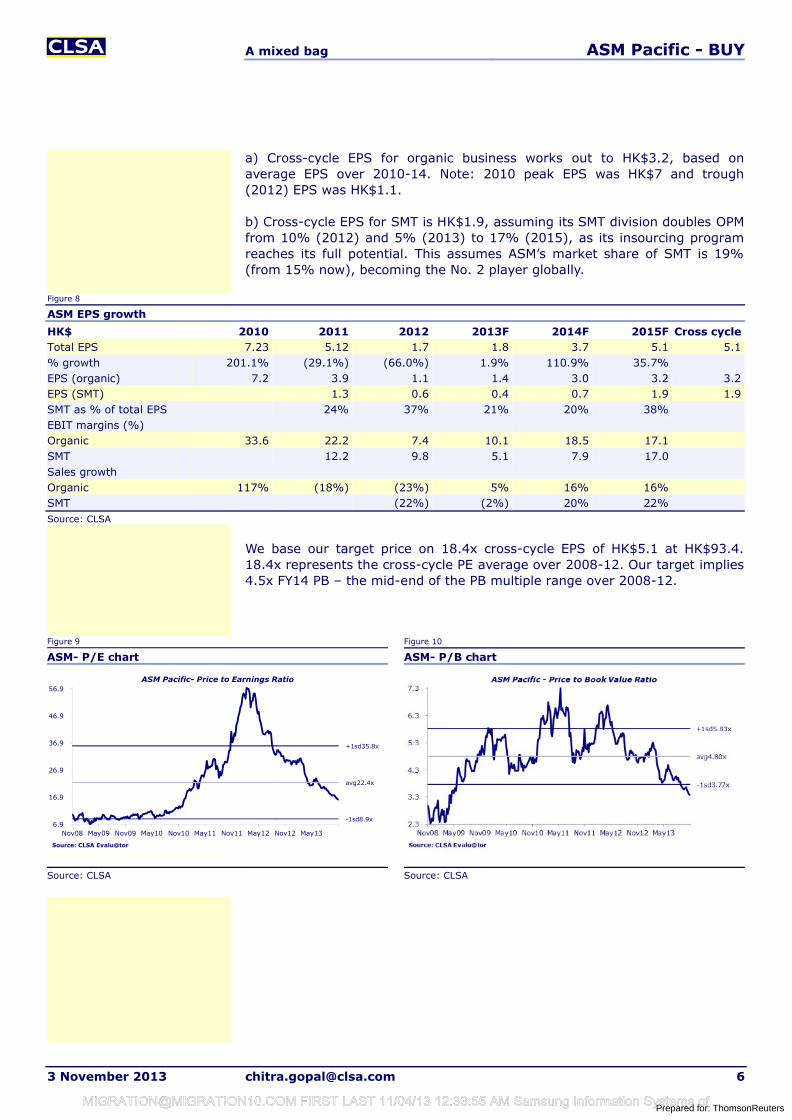
ASM is now 4th largest Lead frame maker globally. New order booking saw +77% YoY in 3Q, accelerating from +29% YoY in 2Q
Other points: ASM’s Shenzhen plant which employs 2000 workers (20% of ASM’s manufacturing workforce) will be undergoing a restructuring. The Chinese government is redeveloping that area, which has led ASM to relocate its plant. This could result in some one-time expenses in 4Q, but mgmt is still evaluating the situation.
Figure 6
ASM sales breakdown by region
Source: Company, CLSA
ValuationOur last earnings was done on 3rd June, when semi industry was in midst of cyclical upturn. Since then (a) Industry utilisations have declined. We underestimated the negative operating leverage in ASM’s vertically integrated model (b) In SMT, although ASM continues winning market share versus Japanese rivals, this appears to be coming at lower margins. We have lowered our margin forecasts, as shown below resulting in us cutting earnings. Note: Percentage changes for 2013 are meaningless given the low base of earnings.
Figure 7
Forecast revisions
FY13 FY14 FY15
HK$b New Old %Diff New Old %Diff New Old %DiffSales 10.7 11.0 (3%) 12.3 13.2 (6%) 14.3 14.5 (1%)OP Profit 0.9 1.5 (40%) 1.8 2.2 (18%) 2.5 2.8 (12%)Net profit 0.7 1.1 (36%) 1.5 1.8 (18%) 2.0 2.3 (12%)MarginsOPM %) 8.3% 13.6% 14.6% 16.7% 17.1% 19.4%NM (%) 6.6% 10.0% 12.0% 13.7% 14.0% 15.7%Source: CLSA
At cyclically low or high points, EPS is meaningless. A better metric is crosscycle earnings, which reflects both up and down cycles. We see total crosscycle EPS at HK$5.1, broken down as:
47% 45% 50%
6% 6%6%5% 9%10%
20% 17%13%
22% 23% 22%
0%
10%
20%
30%
40%
50%
60%
70%
80%
90%
100%
2011 2012 2013YTD
Others
Europe
Americas
Taiwan
China/HK
2013 1Q-3Q sales YoY:China: +10%A/P: +2%Europe: -22%America:+18%Total: -1.3%
China
Europe
ASM’s Shenzhen plant will be undergoing a
restructuring
Prepared for: [email protected] FIRST LAST 11/04/13 12:33:55 AM Samsung Information Systems of
A mixed bag ASM Pacific - BUY
3 November 2013 [email protected] 6
a) Cross-cycle EPS for organic business works out to HK$3.2, based on average EPS over 2010-14. Note: 2010 peak EPS was HK$7 and trough (2012) EPS was HK$1.1.
b) Cross-cycle EPS for SMT is HK$1.9, assuming its SMT division doubles OPM from 10% (2012) and 5% (2013) to 17% (2015), as its insourcing program reaches its full potential. This assumes ASM’s market share of SMT is 19% (from 15% now), becoming the No. 2 player globally.
Figure 8
ASM EPS growth
HK$ 2010 2011 2012 2013F 2014F 2015F Cross cycleTotal EPS 7.23 5.12 1.7 1.8 3.7 5.1 5.1% growth 201.1% (29.1%) (66.0%) 1.9% 110.9% 35.7%EPS (organic) 7.2 3.9 1.1 1.4 3.0 3.2 3.2EPS (SMT) 1.3 0.6 0.4 0.7 1.9 1.9SMT as % of total EPS 24% 37% 21% 20% 38%EBIT margins (%)Organic 33.6 22.2 7.4 10.1 18.5 17.1SMT 12.2 9.8 5.1 7.9 17.0Sales growthOrganic 117% (18%) (23%) 5% 16% 16%SMT (22%) (2%) 20% 22%Source: CLSA
We base our target price on 18.4x cross-cycle EPS of HK$5.1 at HK$93.4. 18.4x represents the cross-cycle PE average over 2008-12. Our target implies 4.5x FY14 PB – the mid-end of the PB multiple range over 2008-12.
Figure 9 Figure 10
ASM- P/E chart ASM- P/B chart
Source: CLSA Source: CLSA
-1sd8.9x
avg22.4x
+1sd35.8x
6.9
16.9
26.9
36.9
46.9
56.9
Nov08 May09 Nov09 May10 Nov10 May11 Nov11 May12 Nov12 May13
ASM Pacific- Price to Earnings Ratio
Source: CLSA Evalu@tor
Prepared for: [email protected] FIRST LAST 11/04/13 12:33:55 AM Samsung Information Systems of
A mixed bag ASM Pacific - BUY
3 November 2013 [email protected] 7
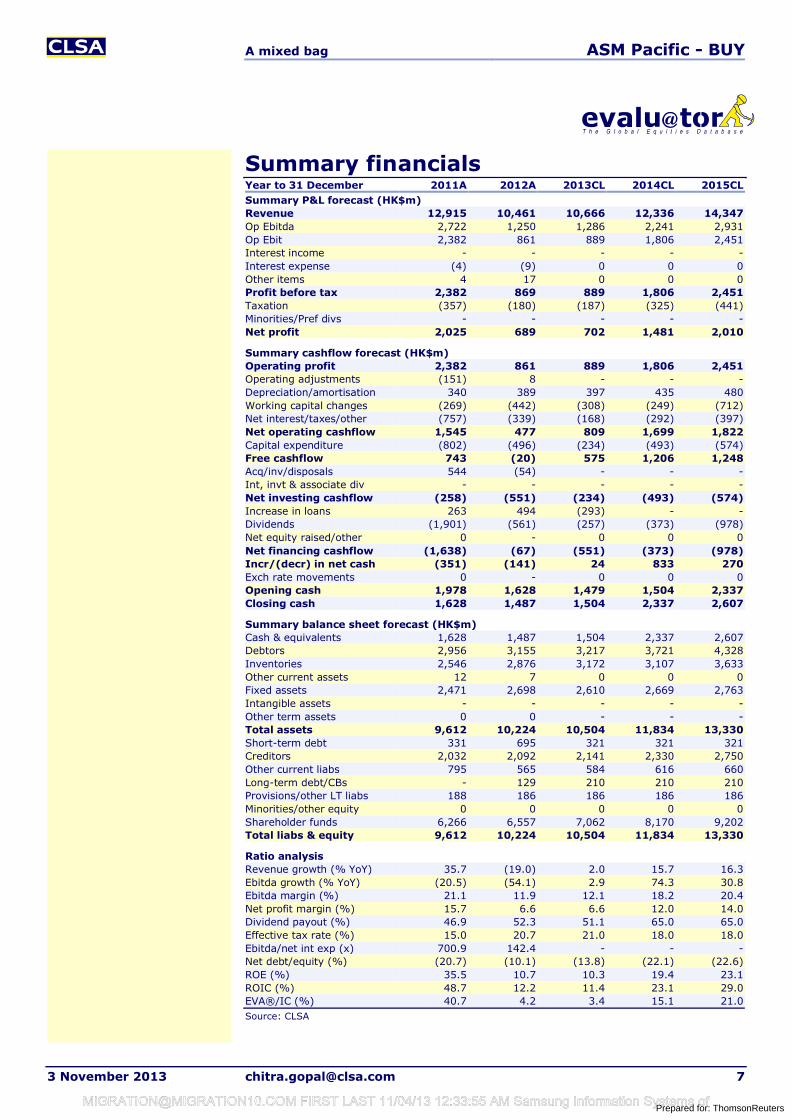
Summary financialsYear to 31 December 2011A 2012A 2013CL 2014CL 2015CLSummary P&L forecast (HK$m)Revenue 12,915 10,461 10,666 12,336 14,347Op Ebitda 2,722 1,250 1,286 2,241 2,931Op Ebit 2,382 861 889 1,806 2,451Interest income - - - - -Interest expense (4) (9) 0 0 0Other items 4 17 0 0 0Profit before tax 2,382 869 889 1,806 2,451Taxation (357) (180) (187) (325) (441)Minorities/Pref divs - - - - -Net profit 2,025 689 702 1,481 2,010
Summary cashflow forecast (HK$m)Operating profit 2,382 861 889 1,806 2,451Operating adjustments (151) 8 - - -Depreciation/amortisation 340 389 397 435 480Working capital changes (269) (442) (308) (249) (712)Net interest/taxes/other (757) (339) (168) (292) (397)Net operating cashflow 1,545 477 809 1,699 1,822Capital expenditure (802) (496) (234) (493) (574)Free cashflow 743 (20) 575 1,206 1,248Acq/inv/disposals 544 (54) - - -Int, invt & associate div - - - - -Net investing cashflow (258) (551) (234) (493) (574)Increase in loans 263 494 (293) - -Dividends (1,901) (561) (257) (373) (978)Net equity raised/other 0 - 0 0 0Net financing cashflow (1,638) (67) (551) (373) (978)Incr/(decr) in net cash (351) (141) 24 833 270Exch rate movements 0 - 0 0 0Opening cash 1,978 1,628 1,479 1,504 2,337Closing cash 1,628 1,487 1,504 2,337 2,607
Summary balance sheet forecast (HK$m)Cash & equivalents 1,628 1,487 1,504 2,337 2,607Debtors 2,956 3,155 3,217 3,721 4,328Inventories 2,546 2,876 3,172 3,107 3,633Other current assets 12 7 0 0 0Fixed assets 2,471 2,698 2,610 2,669 2,763Intangible assets - - - - -Other term assets 0 0 - - -Total assets 9,612 10,224 10,504 11,834 13,330Short-term debt 331 695 321 321 321Creditors 2,032 2,092 2,141 2,330 2,750Other current liabs 795 565 584 616 660Long-term debt/CBs - 129 210 210 210Provisions/other LT liabs 188 186 186 186 186Minorities/other equity 0 0 0 0 0Shareholder funds 6,266 6,557 7,062 8,170 9,202Total liabs & equity 9,612 10,224 10,504 11,834 13,330
Ratio analysisRevenue growth (% YoY) 35.7 (19.0) 2.0 15.7 16.3Ebitda growth (% YoY) (20.5) (54.1) 2.9 74.3 30.8Ebitda margin (%) 21.1 11.9 12.1 18.2 20.4Net profit margin (%) 15.7 6.6 6.6 12.0 14.0Dividend payout (%) 46.9 52.3 51.1 65.0 65.0Effective tax rate (%) 15.0 20.7 21.0 18.0 18.0Ebitda/net int exp (x) 700.9 142.4 - - -Net debt/equity (%) (20.7) (10.1) (13.8) (22.1) (22.6)ROE (%) 35.5 10.7 10.3 19.4 23.1ROIC (%) 48.7 12.2 11.4 23.1 29.0EVA®/IC (%) 40.7 4.2 3.4 15.1 21.0Source: CLSA
Prepared for: [email protected] FIRST LAST 11/04/13 12:33:55 AM Samsung Information Systems of
A mixed bag ASM Pacific - BUY
3 November 2013 [email protected] 8
Companies mentionedASM Pacific (522 HK - HK$74.65 - BUY)
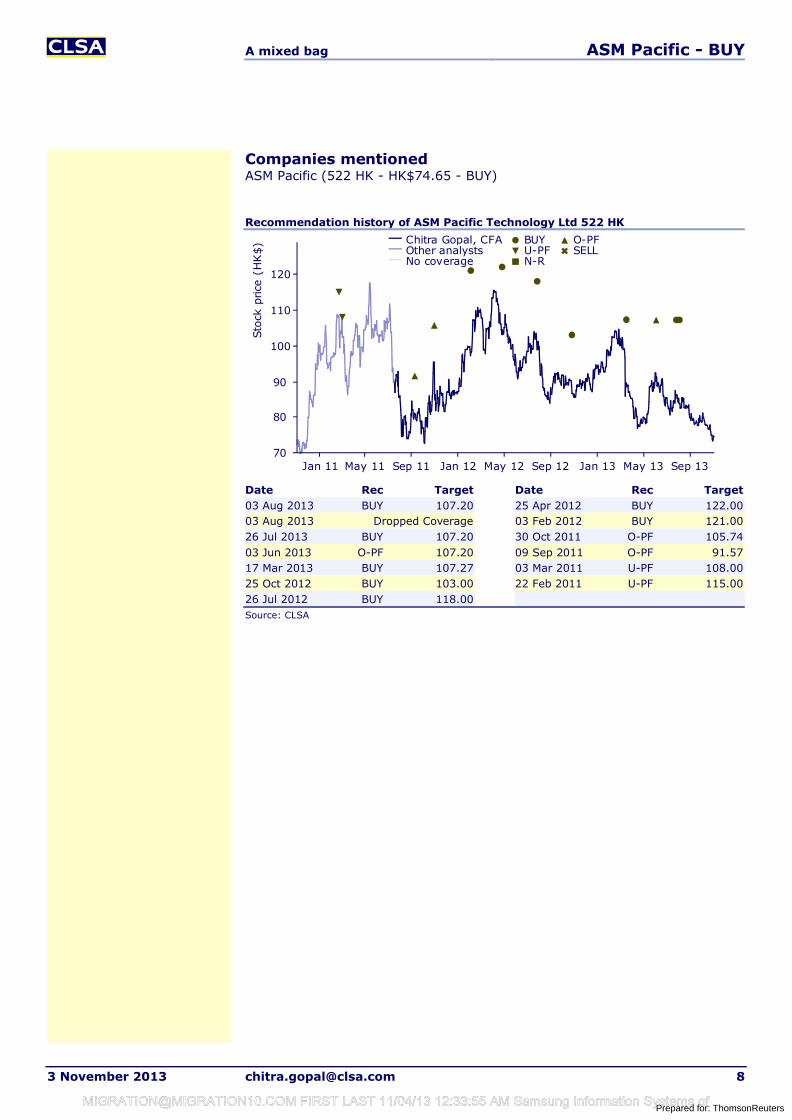
Recommendation history of ASM Pacific Technology Ltd 522 HK
Date Rec Target Date Rec Target03 Aug 2013 BUY 107.20 25 Apr 2012 BUY 122.0003 Aug 2013 Dropped Coverage 03 Feb 2012 BUY 121.0026 Jul 2013 BUY 107.20 30 Oct 2011 O-PF 105.7403 Jun 2013 O-PF 107.20 09 Sep 2011 O-PF 91.5717 Mar 2013 BUY 107.27 03 Mar 2011 U-PF 108.0025 Oct 2012 BUY 103.00 22 Feb 2011 U-PF 115.0026 Jul 2012 BUY 118.00Source: CLSA
70
80
90
100
110
120
Sto
ckpr
ice
(HK
$)
Jan 11 May 11 Sep 11 Jan 12 May 12 Sep 12 Jan 13 May 13 Sep 13
Chitra Gopal, CFAOther analystsNo coverage
BUYU-PFN-R
O-PFSELL
Prepared for: [email protected] FIRST LAST 11/04/13 12:33:55 AM Samsung Information Systems of
A mixed bag ASM Pacific - BUY
3 November 2013 [email protected] 9
Research subscriptionsTo change your report distribution requirements, please contact your CLSA sales representative or email us at [email protected] can also fine-tune your Research Alert email preferences at https://www.clsa.com/member/tools/email_alert/.
Key to CLSA/CA Taiwan investment rankings: BUY: Total return expected to exceed market return AND provide 20% or greater absolute return; O-PF: Total return expected to be greater than market return but less than 20% absolute return; U-PF: Total return expected to be less than market return but expected to provide a positive absolute return; SELL: Total return expected to be less than market return AND to provide a negative absolute return. For relative performance, we benchmark the 12-month total return (including dividends) for the stock against the 12-month forecast return (including dividends) for the local market where the stock is traded. We define stocks we expect to provide returns of 100% or higher including dividends within three years as “Double Baggers”.
©2013 CLSA Limited (for research compiled by non-Taiwan analyst(s)) and/or Credit Agricole Securities Taiwan Co., Ltd (for research compiled by Taiwan analyst(s)). Note: In the interests of timeliness, this document has not been edited.
The analyst/s who compiled this publication/communication hereby state/s and confirm/s that the contents hereof truly reflect his/her/their views and opinions on the subject matter and that the analyst/s has/have not been placed under any undue influence, intervention or pressure by any person/s in compiling such publication/communication.
CLSA group of companies (excluding CLSA Americas, LLC) (“CLSA”), Credit Agricole Securities Taiwan Co., Ltd. (“CA Taiwan”), CLSA/CA Taiwan's analysts and/or their associates do and from time to time seek to establish business or financial relationships with companies covered in their research reports. As a result, investors should be aware that CLSA and/or such individuals may have one or more conflicts of interests that could affect the objectivity of this report. Regulations or market practice of some jurisdictions/markets prescribe certain disclosures to be made for certain actual, potential or perceived conflicts of interests relating to research reports and such details are available at www.clsa.com/member/research_disclosures/. Disclosures therein include the position of CLSA, CLSA Americas, LLC and CA Taiwan only and do not reflect those of CITIC Securities International Company Limited, Credit Agricole Corporate & Investment Bank and/or their respective affiliates. If investors have any difficulty accessing this website, please contact [email protected] or +852 2600 8111. If you require disclosure information on previous dates, please contact [email protected]
IMPORTANT: The content of this report is subject to and should be read in conjunction with the disclaimer and CLSA's Legal and Regulatory Notices as set out at www.clsa.com/disclaimer.html, a hard copy of which may be obtained on request from CLSA Publications or CLSA Compliance Group (18/F, One Pacific Place, 88 Queensway, Hong Kong, telephone +852 2600 8888) and/or CA Taiwan Compliance (27/F, 95, Section 2 Dun Hua South Road, Taipei 10682, Taiwan, telephone +886 2 2326 8188). 05/08/2013
Prepared for: [email protected] FIRST LAST 11/04/13 12:33:55 AM Samsung Information Systems of
High conviction calls
Analyst Rec Ticker Sector MktCap 3m AVTO Close Target otal retur Date includedElinor Leung, CFA BUY BIDU US Internet US$57.69b US$522m 160.80 210.00 31% 05 Aug 2013
Analyst Rec Ticker Sector MktCap 3m AVTO Close Target otal retur Date includedPaul Wan BUY 293 HK Transport US$7.8b US$6m 15.38 17.43 17% 06 May 2013
Analyst Rec Ticker Sector MktCap 3m AVTO Close Target otal retur Date includedJonathan Galligan BUY 1 HK Property US$36.65b US$61m 121.20 143.00 21% 18 Sep 2013
Analyst Rec Ticker Sector MktCap 3m AVTO Close Target otal retur Date includedSusanna Leung BUY 2007 HK Property US$12.14b US$16m 5.30 7.00 38% 10 May 2013
Analyst Rec Ticker Sector MktCap 3m AVTO Close Target otal retur Date includedElinor Leung, CFA BUY CTRP US Internet US$7.11b US$130m 54.26 59.50 10% 05 Aug 2013
• Company gave a confident outlook and is guiding higher revenue growth of 20-25% for 3Q13 (vs 15-20%YoY for 2Q). We believe Ctrip is still at the beginning of turning around its business. Revenue growth will accelerate with new leisure products and mobile migration. Margin could eventually expand to 30% in-line with global peers.
Cheung Kong
• Catalysts for CK in the near term include acquisitions driven by an undergeared balance sheet as well as the launch of the afore mentioned 5k unit HK pipeline.
• Structural improvements at Hutchison have delivered sustainable double digit earnings growth, The positive improvements at Hutch have yet to be reflected at the CK level. Going forward, recurrent profit growth at Hutch will be the most substantial driver to CK's core
fit
• The run in Hutch's share price has yet to be reflected in CK. Cheung Kong is trading at a wide stub discount. While we continue to like Hutch, we believe the risk reward balance for CK has become increasingly attractive.
• Ctrip’s 2Q13 results were very strong beating expectations by 25%. Operating profits grew 16.6%YoY to Rmb196m benefiting from faster revenue growth, operating leverage and margin expansion.
• Aggressive marketing strategy and new leisure products (Tujia, Songguo, Smartchoice and Groupbuy) have accelerated market share gain. Sales volume of hotel booking and air ticketing were up by strong 30-40%YoY. Mobile migration has become a new growth
Country Garden
• Country Garden is not just ahead of the pack in sales achieved YTD, the pace of sales is likely to accelerate with five projects scheduled for launch in May and June, versus three new launches in 1Q.
• Country Garden has contracted Rmb23.05bn of sales in 4M13, up 153% YoY, thanks to 134% YoY in GFA sold to 3.44m sqm and 8% YoY increase in ASP. This represents 38% of our full year sales estimate, one of the highest among peers.
• The company is also preparing for growth beyond 2013 by building and land replenishment, and living up to its promise to diversify away its old problem of geographic concentration by extending its footprint carefully.
Ctrip
• Above street earnings forecast. The street is factoring in a gradual recovery scenario for the cargo business in 2014, which we believe will be more like a rebound as this is a highly cyclical business, margins will recover sharply when global trades recover.
Cathay Pacific
China/HK top ideas
There are 8 buys and 4 sells in our high conviction list. The favoured stocks play to current investment themes such as, smartphone/internet growth, outbound travel and consumption. We sell stocks that are overvalued or gets negatively impacted by policy. Our latest change was removal of Samsonite.
Market strategy
Baidu
• Baidu is guiding stronger than expected 4Q revenue growth of 45.5-49.6%YoY due to mobile monetization. Mobile monetization has been boosted by the new integrated mobile and PC ad platform.
• Cathay Pacific has a history of being first off the ground in the early stages of an upcycle. While HK’s flagship carrier has yet to recover from its multiyear price-book contraction, we expect air traffic to take off in 2H13 as the global economy starts to regain its footing.
• We expect inbound passenger traffic to grow by 8.1% in 2013 and 10% in 2014, which is based on in-house GDP forecasts. Air freight has shown higher beta than sea freight in the past, we expect 2014 to be a much better year as global trades recover. We expect air cargo throughput to HK to rise 3.4% in 2013, and 8.9% in 2014.
• Baidu’s mobile products have also gained strong momentum. Its search app download jumped 50%QoQ in 3Q. Traffic acquisition cost increase slowed in 3Q13. TAC as a percentage of revenues was flat QoQ at 11.7% in 3Q13.
• Baidu earning is recovering. Operating profit was up 1.2%YoY to Rmb3.05bn in 3Q13 (vs -4.5%YoY in 2Q13). Earning recovery will be faster over next two quarters given the easier comparison. Share could continue to re-rate with accelerated revenue growth and multiple expansion.
Prepared for: ThomsonReuters
[email protected] FIRST LAST 11/04/13 12:33:55 AM Samsung Information Systems of
China/HK top ideas Market strategy
Analyst Rec Ticker Sector MktCap 3m AVTO Close Target otal retur Date includedChitra Gopal, CFA BUY 992 HK Technology US$10.97b US$34m 8.30 8.78 8% 22 Mar 2013
Analyst Rec Ticker Sector MktCap 3m AVTO Close Target otal retur Date includedAaron Fischer, CFA BUY MPEL US Hotels & Leisure US$18.69b US$83m 33.16 42.00 27% 08 Jun 2012
Analyst Rec Ticker Sector MktCap 3m AVTO Close Target otal retur Date includedJialong Shi BUY NTES US Internet US$8.72b US$55m 67.51 83.00 25% 04 Mar 2013
Analyst Rec Ticker Sector MktCap 3m AVTO Close Target otal retur Date includedChen Huang SELL 3968 HK Financial services US$46.06b US$47m 15.4 12.71 -13% 08 Jun 2012
Analyst Rec Ticker Sector MktCap 3m AVTO Close Target otal retur Date includedRajesh Panjwani SELL 1072 HK Power US$3.61b US$2m 12.48 9.50 -23% 03 Jun 2013
• Solid earnings outlook. NetEase will likely grow its topline by 28% and earnings by 26% in 2013 driven by solid performance of its flagship titles, FWJ and WWJ2. Our earnings forecast is 13% above consensus. We believe street will likely upgrade their forecasts on the back of recent price hikes for FWJ and WWJ2, which will likely act as a catalyst for share prices.
• We believe China’s coal-fired power capacity addition is in a structural decline as power demand growth slows and China tries to reduce its reliance on coal to curb pollution.
• Falling demand has led to 10-20% lower prices for boilers, turbines and generators over last two years and this will start to impact margins from 2013 onwards.
NetEase
• It has a strong pipeline with five to six new titles for 2013. Its upcoming new game, Dragon Sword, is promising and may become a catalyst upon its debut in 2H13.
• The bank’s capital position has been week with the Tier-1 CAR of 8.49% as of end 2012, the second-lowest among H-share banks.
CMB
• Valuation remains attractive trading at 9.0x PE/5.5x ex-cash PE with ~40% of its market cap in net cash. We believe company will likely begin to pay regular dividend in 2013 with a 25% payout and 2.8% yield.
• The Rmb35bn A+H rights issue is long-overdue and will remain an overhang. • Further disruption to that should constrain CMB’s dividend payout and loan growth in 2013. As the most expensive bank under our coverage, the premium is unjustified and we rate the stock a conviction SELL.
• Margins in wind power remain low and we do not expect a significant recovery in nuclear power before 2015. Our EPS estimates are 18-29% below consensus. Maintain SELL.
Dongfang
• Lenovo is No 2 PC maker globally and sets to become No 1 in 2013. In addition, Lenovo now becomes No 2 smartphone brand in China – ranking as the fastest growing smartphone maker, and looks to overtake leader Samsung in 2013.
• Melco Crown has one of the strongest development pipelines with Belle Grande Manila and Macau Studio City set to open in 2014-15. The company also has the optionality to develop City of Dream Phase 3, which is estimated to have 1.5m sq ft gross floor area.
• Our target price on Melco Crown is HK$25.60, based on 11x EV/Ebitda and HK$2.40 per share from Macau Studio City. While not including any value into our price target for the Belle Grande Manila and City of Dreams Phase 3.
Melco Crown
• Macau Studio City, together with Galaxy Macau Phase II should be the Cotai properties to open first. As a result of the better growth prospects, we are not disappointed by the lack of dividend in the next 12 months.
Lenovo
• We expect Lenovo capex of US$300-400m in 2013, directed to its new smartphone plant in Wuhan. It views in-house manufacturing as critical to developing innovative designs, and helping improve PC margins. Results are reflected in progress in high-end consumer notebooks. In the US, Lenovo achieved a 49% share in notebooks priced at >US$900, helped by the success of Yoga, in Dec quarter 2012.
• Unlike peers who have been bleeding money in phones, Lenovo achieved breakeven in Dec quarter 2012. It is on track to achieve 2% OPM in next 18 months. We have modelled MIDH division (smartphones, tablets, TV) to remain at breakeven, with OPM of -0.7% in year end Mar 14 and -0.5% in Mar 15, up from -2.0% in Mar 13. There is upside to our forecasts, as mix shifts to retail channels where margins are higher.
Prepared for: ThomsonReuters
[email protected] FIRST LAST 11/04/13 12:33:55 AM Samsung Information Systems of
China/HK top ideas Market strategy
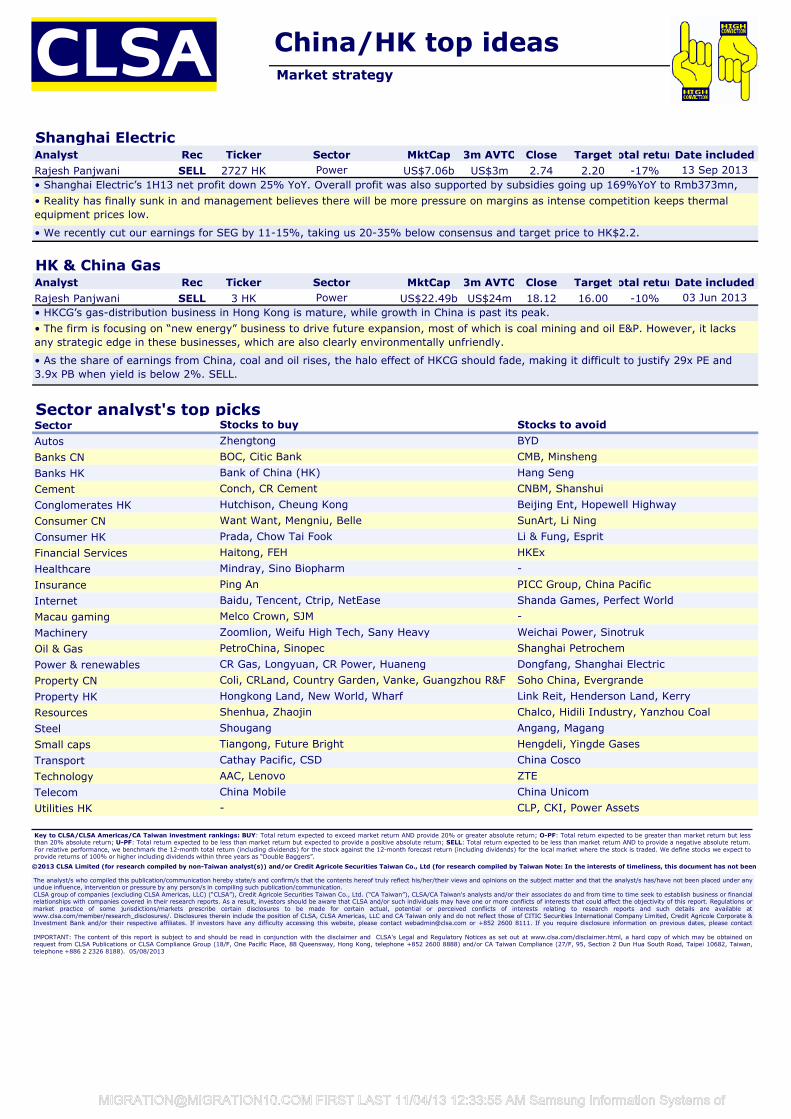
Analyst Rec Ticker Sector MktCap 3m AVTO Close Target otal retur Date includedRajesh Panjwani SELL 2727 HK Power US$7.06b US$3m 2.74 2.20 -17% 13 Sep 2013
Analyst Rec Ticker Sector MktCap 3m AVTO Close Target otal retur Date includedRajesh Panjwani SELL 3 HK Power US$22.49b US$24m 18.12 16.00 -10% 03 Jun 2013
Sector analyst's top picksSectorAutosBanks CNBanks HKCementConglomerates HKConsumer CNConsumer HKFinancial ServicesHealthcareInsuranceInternetMacau gamingMachineryOil & GasPower & renewablesProperty CNProperty HKResourcesSteelSmall capsTransportTechnologyTelecomUtilities HK
• As the share of earnings from China, coal and oil rises, the halo effect of HKCG should fade, making it difficult to justify 29x PE and 3.9x PB when yield is below 2%. SELL.
- CLP, CKI, Power Assets
AAC, Lenovo ZTE
Chalco, Hidili Industry, Yanzhou Coal
Want Want, Mengniu, Belle
-
BOC, Citic Bank
CR Gas, Longyuan, CR Power, HuanengShanghai PetrochemDongfang, Shanghai Electric
Melco Crown, SJM
Link Reit, Henderson Land, Kerry
China Mobile China Unicom
Hengdeli, Yingde GasesChina CoscoCathay Pacific, CSD
Tiangong, Future Bright
Stocks to avoidStocks to buy
Shanghai Electric
• Shanghai Electric’s 1H13 net profit down 25% YoY. Overall profit was also supported by subsidies going up 169%YoY to Rmb373mn,
• We recently cut our earnings for SEG by 11-15%, taking us 20-35% below consensus and target price to HK$2.2.
HK & China Gas
• Reality has finally sunk in and management believes there will be more pressure on margins as intense competition keeps thermal equipment prices low.
Hang Seng
Zhengtong
Haitong, FEH HKEx
CNBM, Shanshui
Prada, Chow Tai Fook Li & Fung, Esprit
Angang, Magang
SunArt, Li Ning
Shougang
Coli, CRLand, Country Garden, Vanke, Guangzhou R&F
Shenhua, Zhaojin
Soho China, Evergrande
• HKCG’s gas-distribution business in Hong Kong is mature, while growth in China is past its peak.• The firm is focusing on “new energy” business to drive future expansion, most of which is coal mining and oil E&P. However, it lacks any strategic edge in these businesses, which are also clearly environmentally unfriendly.
Beijing Ent, Hopewell HighwayHutchison, Cheung KongConch, CR Cement
BYD
Bank of China (HK)CMB, Minsheng
Mindray, Sino Biopharm
Hongkong Land, New World, Wharf
PetroChina, Sinopec
PICC Group, China PacificShanda Games, Perfect World-
Ping An
Zoomlion, Weifu High Tech, Sany Heavy Weichai Power, Sinotruk
Baidu, Tencent, Ctrip, NetEase
Key to CLSA/CLSA Americas/CA Taiwan investment rankings: BUY: Total return expected to exceed market return AND provide 20% or greater absolute return; O-PF: Total return expected to be greater than market return but less than 20% absolute return; U-PF: Total return expected to be less than market return but expected to provide a positive absolute return; SELL: Total return expected to be less than market return AND to provide a negative absolute return. For relative performance, we benchmark the 12-month total return (including dividends) for the stock against the 12-month forecast return (including dividends) for the local market where the stock is traded. We define stocks we expect to provide returns of 100% or higher including dividends within three years as “Double Baggers”.
The analyst/s who compiled this publication/communication hereby state/s and confirm/s that the contents hereof truly reflect his/her/their views and opinions on the subject matter and that the analyst/s has/have not been placed under any undue influence, intervention or pressure by any person/s in compiling such publication/communication. CLSA group of companies (excluding CLSA Americas, LLC) (“CLSA”), Credit Agricole Securities Taiwan Co., Ltd. (“CA Taiwan”), CLSA/CA Taiwan's analysts and/or their associates do and from time to time seek to establish business or financial relationships with companies covered in their research reports. As a result, investors should be aware that CLSA and/or such individuals may have one or more conflicts of interests that could affect the objectivity of this report. Regulations or market practice of some jurisdictions/markets prescribe certain disclosures to be made for certain actual, potential or perceived conflicts of interests relating to research reports and such details are available at www.clsa.com/member/research_disclosures/. Disclosures therein include the position of CLSA, CLSA Americas, LLC and CA Taiwan only and do not reflect those of CITIC Securities International Company Limited, Credit Agricole Corporate & Investment Bank and/or their respective affiliates. If investors have any difficulty accessing this website, please contact [email protected] or +852 2600 8111. If you require disclosure information on previous dates, please contact
IMPORTANT: The content of this report is subject to and should be read in conjunction with the disclaimer and CLSA's Legal and Regulatory Notices as set out at www.clsa.com/disclaimer.html, a hard copy of which may be obtained on request from CLSA Publications or CLSA Compliance Group (18/F, One Pacific Place, 88 Queensway, Hong Kong, telephone +852 2600 8888) and/or CA Taiwan Compliance (27/F, 95, Section 2 Dun Hua South Road, Taipei 10682, Taiwan, telephone +886 2 2326 8188). 05/08/2013
©2013 CLSA Limited (for research compiled by non-Taiwan analyst(s)) and/or Credit Agricole Securities Taiwan Co., Ltd (for research compiled by Taiwan Note: In the interests of timeliness, this document has not been
Prepared for: ThomsonReuters
[email protected] FIRST LAST 11/04/13 12:33:55 AM Samsung Information Systems of
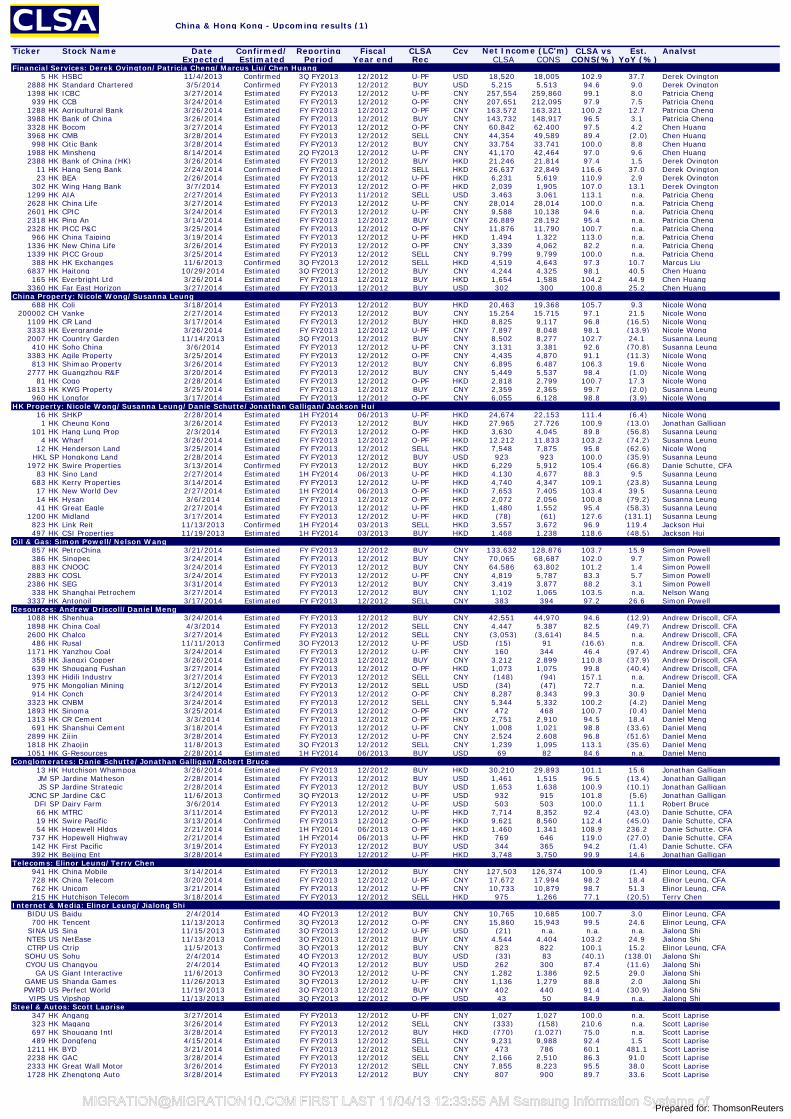
China & Hong Kong - Upcoming results (1)
Ticker Stock Name Date Confirmed/ Reporting Fiscal CLSA Ccy CLSA vs Est. AnalystExpected Estimated Period Year end Rec CLSA CONS CONS(%) YoY (%)
Financial Services: Derek Ovington/Patricia Cheng/Marcus Liu/Chen Huang5 HK HSBC 11/4/2013 Confirmed 3Q FY2013 12/2012 U-PF USD 18,520 18,005 102.9 37.7 Derek Ovington
2888 HK Standard Chartered 3/5/2014 Confirmed FY FY2013 12/2012 BUY USD 5,215 5,513 94.6 9.0 Derek Ovington1398 HK ICBC 3/27/2014 Estimated FY FY2013 12/2012 U-PF CNY 257,554 259,860 99.1 8.0 Patricia Cheng939 HK CCB 3/24/2014 Estimated FY FY2013 12/2012 O-PF CNY 207,651 212,095 97.9 7.5 Patricia Cheng
1288 HK Agricultural Bank 3/26/2014 Estimated FY FY2013 12/2012 O-PF CNY 163,572 163,321 100.2 12.7 Patricia Cheng3988 HK Bank of China 3/26/2014 Estimated FY FY2013 12/2012 BUY CNY 143,732 148,917 96.5 3.1 Patricia Cheng3328 HK Bocom 3/27/2014 Estimated FY FY2013 12/2012 O-PF CNY 60,842 62,400 97.5 4.2 Chen Huang3968 HK CMB 3/28/2014 Estimated FY FY2013 12/2012 SELL CNY 44,354 49,589 89.4 (2.0) Chen Huang998 HK Citic Bank 3/28/2014 Estimated FY FY2013 12/2012 BUY CNY 33,754 33,741 100.0 8.8 Chen Huang
1988 HK Minsheng 8/14/2014 Estimated 2Q FY2013 12/2012 U-PF CNY 41,170 42,464 97.0 9.6 Chen Huang2388 HK Bank of China (HK) 3/26/2014 Estimated FY FY2013 12/2012 BUY HKD 21,246 21,814 97.4 1.5 Derek Ovington
11 HK Hang Seng Bank 2/24/2014 Confirmed FY FY2013 12/2012 SELL HKD 26,637 22,849 116.6 37.0 Derek Ovington23 HK BEA 2/26/2014 Estimated FY FY2013 12/2012 U-PF HKD 6,231 5,619 110.9 2.9 Derek Ovington
302 HK Wing Hang Bank 3/7/2014 Estimated FY FY2013 12/2012 O-PF HKD 2,039 1,905 107.0 13.1 Derek Ovington1299 HK AIA 2/27/2014 Estimated FY FY2013 11/2012 SELL USD 3,463 3,061 113.1 n.a. Patricia Cheng2628 HK China Life 3/27/2014 Estimated FY FY2013 12/2012 U-PF CNY 28,014 28,014 100.0 n.a. Patricia Cheng2601 HK CPIC 3/24/2014 Estimated FY FY2013 12/2012 U-PF CNY 9,588 10,138 94.6 n.a. Patricia Cheng2318 HK Ping An 3/14/2014 Estimated FY FY2013 12/2012 BUY CNY 26,889 28,192 95.4 n.a. Patricia Cheng2328 HK PICC P&C 3/25/2014 Estimated FY FY2013 12/2012 O-PF CNY 11,876 11,790 100.7 n.a. Patricia Cheng966 HK China Taiping 3/19/2014 Estimated FY FY2013 12/2012 U-PF HKD 1,494 1,322 113.0 n.a. Patricia Cheng
1336 HK New China Life 3/26/2014 Estimated FY FY2013 12/2012 O-PF CNY 3,339 4,062 82.2 n.a. Patricia Cheng1339 HK PICC Group 3/25/2014 Estimated FY FY2013 12/2012 SELL CNY 9,799 9,799 100.0 n.a. Patricia Cheng388 HK HK Exchanges 11/6/2013 Confirmed 3Q FY2013 12/2012 SELL HKD 4,519 4,643 97.3 10.7 Marcus Liu
6837 HK Haitong 10/29/2014 Estimated 3Q FY2013 12/2012 BUY CNY 4,244 4,325 98.1 40.5 Chen Huang165 HK Everbright Ltd 3/26/2014 Estimated FY FY2013 12/2012 BUY HKD 1,654 1,588 104.2 44.9 Chen Huang
3360 HK Far East Horizon 3/27/2014 Estimated FY FY2013 12/2012 BUY USD 302 300 100.8 25.2 Chen HuangChina Property: Nicole Wong/Susanna Leung
688 HK Coli 3/18/2014 Estimated FY FY2013 12/2012 BUY HKD 20,463 19,368 105.7 9.3 Nicole Wong200002 CH Vanke 2/27/2014 Estimated FY FY2013 12/2012 BUY CNY 15,254 15,715 97.1 21.5 Nicole Wong
1109 HK CR Land 3/17/2014 Estimated FY FY2013 12/2012 BUY HKD 8,825 9,117 96.8 (16.5) Nicole Wong3333 HK Evergrande 3/26/2014 Estimated FY FY2013 12/2012 U-PF CNY 7,897 8,048 98.1 (13.9) Nicole Wong2007 HK Country Garden 11/14/2013 Estimated 3Q FY2013 12/2012 BUY CNY 8,502 8,277 102.7 24.1 Susanna Leung410 HK Soho China 3/6/2014 Estimated FY FY2013 12/2012 U-PF CNY 3,131 3,381 92.6 (70.8) Susanna Leung
3383 HK Agile Property 3/25/2014 Estimated FY FY2013 12/2012 O-PF CNY 4,435 4,870 91.1 (11.3) Nicole Wong813 HK Shimao Property 3/26/2014 Estimated FY FY2013 12/2012 BUY CNY 6,895 6,487 106.3 19.6 Nicole Wong
2777 HK Guangzhou R&F 3/20/2014 Estimated FY FY2013 12/2012 BUY CNY 5,449 5,537 98.4 (1.0) Nicole Wong81 HK Cogo 2/28/2014 Estimated FY FY2013 12/2012 O-PF HKD 2,818 2,799 100.7 17.3 Nicole Wong
1813 HK KWG Property 3/25/2014 Estimated FY FY2013 12/2012 BUY CNY 2,359 2,365 99.7 (2.0) Susanna Leung960 HK Longfor 3/17/2014 Estimated FY FY2013 12/2012 O-PF CNY 6,055 6,128 98.8 (3.9) Nicole Wong
HK Property: Nicole Wong/Susanna Leung/Danie Schutte/Jonathan Galligan/Jackson Hui16 HK SHKP 2/28/2014 Estimated 1H FY2014 06/2013 U-PF HKD 24,674 22,153 111.4 (6.4) Nicole Wong1 HK Cheung Kong 3/26/2014 Estimated FY FY2013 12/2012 BUY HKD 27,965 27,726 100.9 (13.0) Jonathan Galligan
101 HK Hang Lung Prop 2/3/2014 Estimated FY FY2013 12/2012 O-PF HKD 3,630 4,045 89.8 (56.8) Susanna Leung4 HK Wharf 3/26/2014 Estimated FY FY2013 12/2012 O-PF HKD 12,212 11,833 103.2 (74.2) Susanna Leung
12 HK Henderson Land 3/25/2014 Estimated FY FY2013 12/2012 SELL HKD 7,548 7,875 95.8 (62.6) Nicole WongHKL SP Hongkong Land 2/28/2014 Estimated FY FY2013 12/2012 BUY USD 923 923 100.0 (35.9) Susanna Leung
1972 HK Swire Properties 3/13/2014 Confirmed FY FY2013 12/2012 BUY HKD 6,229 5,912 105.4 (66.8) Danie Schutte, CFA83 HK Sino Land 2/27/2014 Estimated 1H FY2014 06/2013 U-PF HKD 4,130 4,677 88.3 9.5 Susanna Leung
683 HK Kerry Properties 3/14/2014 Estimated FY FY2013 12/2012 U-PF HKD 4,740 4,347 109.1 (23.8) Susanna Leung17 HK New World Dev 2/27/2014 Estimated 1H FY2014 06/2013 O-PF HKD 7,653 7,405 103.4 39.5 Susanna Leung14 HK Hysan 3/6/2014 Estimated FY FY2013 12/2012 O-PF HKD 2,072 2,056 100.8 (79.2) Susanna Leung41 HK Great Eagle 2/27/2014 Estimated FY FY2013 12/2012 U-PF HKD 1,480 1,552 95.4 (58.3) Susanna Leung
1200 HK Midland 3/17/2014 Estimated FY FY2013 12/2012 U-PF HKD (78) (61) 127.6 (131.1) Susanna Leung823 HK Link Reit 11/13/2013 Confirmed 1H FY2014 03/2013 SELL HKD 3,557 3,672 96.9 119.4 Jackson Hui497 HK CSI Properties 11/19/2013 Estimated 1H FY2014 03/2013 BUY HKD 1,468 1,238 118.6 (48.5) Jackson Hui
Oil & Gas: Simon Powell/Nelson Wang857 HK PetroChina 3/21/2014 Estimated FY FY2013 12/2012 BUY CNY 133,632 128,876 103.7 15.9 Simon Powell386 HK Sinopec 3/24/2014 Estimated FY FY2013 12/2012 BUY CNY 70,065 68,687 102.0 9.7 Simon Powell883 HK CNOOC 3/24/2014 Estimated FY FY2013 12/2012 BUY CNY 64,586 63,802 101.2 1.4 Simon Powell
2883 HK COSL 3/24/2014 Estimated FY FY2013 12/2012 U-PF CNY 4,819 5,787 83.3 5.7 Simon Powell2386 HK SEG 3/31/2014 Estimated FY FY2013 12/2012 BUY CNY 3,419 3,877 88.2 3.1 Simon Powell338 HK Shanghai Petrochem 3/27/2014 Estimated FY FY2013 12/2012 BUY CNY 1,102 1,065 103.5 n.a. Nelson Wang
3337 HK Antonoil 3/17/2014 Estimated FY FY2013 12/2012 SELL CNY 383 394 97.2 26.6 Simon PowellResources: Andrew Driscoll/Daniel Meng
1088 HK Shenhua 3/24/2014 Estimated FY FY2013 12/2012 BUY CNY 42,551 44,970 94.6 (12.9) Andrew Driscoll, CFA1898 HK China Coal 4/3/2014 Estimated FY FY2013 12/2012 SELL CNY 4,447 5,387 82.5 (49.7) Andrew Driscoll, CFA2600 HK Chalco 3/27/2014 Estimated FY FY2013 12/2012 SELL CNY (3,053) (3,614) 84.5 n.a. Andrew Driscoll, CFA486 HK Rusal 11/11/2013 Confirmed 3Q FY2013 12/2012 U-PF USD (15) 91 (16.6) n.a. Andrew Driscoll, CFA
1171 HK Yanzhou Coal 3/24/2014 Estimated FY FY2013 12/2012 U-PF CNY 160 344 46.4 (97.4) Andrew Driscoll, CFA358 HK Jiangxi Copper 3/26/2014 Estimated FY FY2013 12/2012 BUY CNY 3,212 2,899 110.8 (37.9) Andrew Driscoll, CFA639 HK Shougang Fushan 3/27/2014 Estimated FY FY2013 12/2012 O-PF HKD 1,073 1,075 99.8 (40.4) Andrew Driscoll, CFA
1393 HK Hidili Industry 3/27/2014 Estimated FY FY2013 12/2012 SELL CNY (148) (94) 157.1 n.a. Andrew Driscoll, CFA975 HK Mongolian Mining 3/12/2014 Estimated FY FY2013 12/2012 SELL USD (34) (47) 72.7 n.a. Daniel Meng914 HK Conch 3/24/2014 Estimated FY FY2013 12/2012 O-PF CNY 8,287 8,343 99.3 30.9 Daniel Meng
3323 HK CNBM 3/24/2014 Estimated FY FY2013 12/2012 SELL CNY 5,344 5,332 100.2 (4.2) Daniel Meng1893 HK Sinoma 3/25/2014 Estimated FY FY2013 12/2012 O-PF CNY 472 468 100.7 (0.4) Daniel Meng1313 HK CR Cement 3/3/2014 Estimated FY FY2013 12/2012 O-PF HKD 2,751 2,910 94.5 18.4 Daniel Meng691 HK Shanshui Cement 3/18/2014 Estimated FY FY2013 12/2012 U-PF CNY 1,008 1,021 98.8 (33.6) Daniel Meng
2899 HK Zijin 3/28/2014 Estimated FY FY2013 12/2012 U-PF CNY 2,524 2,608 96.8 (51.6) Daniel Meng1818 HK Zhaojin 11/8/2013 Estimated 3Q FY2013 12/2012 SELL CNY 1,239 1,095 113.1 (35.6) Daniel Meng1051 HK G-Resources 2/28/2014 Estimated 1H FY2014 06/2013 BUY USD 69 82 84.6 n.a. Daniel Meng
Conglomerates: Danie Schutte/Jonathan Galligan/Robert Bruce13 HK Hutchison Whampoa 3/26/2014 Estimated FY FY2013 12/2012 BUY HKD 30,210 29,893 101.1 15.6 Jonathan GalliganJM SP Jardine Matheson 2/28/2014 Estimated FY FY2013 12/2012 BUY USD 1,461 1,515 96.5 (13.4) Jonathan GalliganJS SP Jardine Strategic 2/28/2014 Estimated FY FY2013 12/2012 BUY USD 1,653 1,638 100.9 (10.1) Jonathan Galligan
JCNC SP Jardine C&C 11/6/2013 Confirmed 3Q FY2013 12/2012 U-PF USD 932 915 101.8 (5.6) Jonathan GalliganDFI SP Dairy Farm 3/6/2014 Estimated FY FY2013 12/2012 U-PF USD 503 503 100.0 11.1 Robert Bruce66 HK MTRC 3/11/2014 Estimated FY FY2013 12/2012 U-PF HKD 7,714 8,352 92.4 (43.0) Danie Schutte, CFA19 HK Swire Pacific 3/13/2014 Confirmed FY FY2013 12/2012 O-PF HKD 9,621 8,560 112.4 (45.0) Danie Schutte, CFA54 HK Hopewell Hldgs 2/21/2014 Estimated 1H FY2014 06/2013 O-PF HKD 1,460 1,341 108.9 236.2 Danie Schutte, CFA
737 HK Hopewell Highway 2/21/2014 Estimated 1H FY2014 06/2013 U-PF HKD 769 646 119.0 (27.0) Danie Schutte, CFA142 HK First Pacific 3/19/2014 Estimated FY FY2013 12/2012 BUY USD 344 365 94.2 (1.4) Danie Schutte, CFA392 HK Beijing Ent 3/28/2014 Estimated FY FY2013 12/2012 U-PF HKD 3,748 3,750 99.9 14.6 Jonathan Galligan
Telecoms: Elinor Leung/Terry Chen941 HK China Mobile 3/14/2014 Estimated FY FY2013 12/2012 BUY CNY 127,503 126,374 100.9 (1.4) Elinor Leung, CFA728 HK China Telecom 3/20/2014 Estimated FY FY2013 12/2012 U-PF CNY 17,672 17,994 98.2 18.4 Elinor Leung, CFA762 HK Unicom 3/21/2014 Estimated FY FY2013 12/2012 U-PF CNY 10,733 10,879 98.7 51.3 Elinor Leung, CFA215 HK Hutchison Telecom 3/18/2014 Estimated FY FY2013 12/2012 SELL HKD 975 1,266 77.1 (20.5) Terry Chen
Internet & Media: Elinor Leung/Jialong ShiBIDU US Baidu 2/4/2014 Estimated 4Q FY2013 12/2012 BUY CNY 10,765 10,685 100.7 3.0 Elinor Leung, CFA700 HK Tencent 11/13/2013 Confirmed 3Q FY2013 12/2012 O-PF CNY 15,860 15,943 99.5 24.6 Elinor Leung, CFA
SINA US Sina 11/15/2013 Estimated 3Q FY2013 12/2012 U-PF USD (21) n.a. n.a. n.a. Jialong ShiNTES US NetEase 11/13/2013 Confirmed 3Q FY2013 12/2012 BUY CNY 4,544 4,404 103.2 24.9 Jialong ShiCTRP US Ctrip 11/5/2013 Confirmed 3Q FY2013 12/2012 BUY CNY 823 822 100.1 15.2 Elinor Leung, CFA
SOHU US Sohu 2/4/2014 Estimated 4Q FY2013 12/2012 BUY USD (33) 83 (40.1) (138.0) Jialong ShiCYOU US Changyou 2/4/2014 Estimated 4Q FY2013 12/2012 BUY USD 262 300 87.4 (11.6) Jialong Shi
GA US Giant Interactive 11/6/2013 Confirmed 3Q FY2013 12/2012 U-PF CNY 1,282 1,386 92.5 29.0 Jialong ShiGAME US Shanda Games 11/26/2013 Estimated 3Q FY2013 12/2012 U-PF CNY 1,136 1,279 88.8 2.0 Jialong ShiPWRD US Perfect World 11/19/2013 Estimated 3Q FY2013 12/2012 BUY CNY 402 440 91.4 (30.9) Jialong ShiVIPS US Vipshop 11/13/2013 Estimated 3Q FY2013 12/2012 O-PF USD 43 50 84.9 n.a. Jialong Shi
Steel & Autos: Scott Laprise347 HK Angang 3/27/2014 Estimated FY FY2013 12/2012 U-PF CNY 1,027 1,027 100.0 n.a. Scott Laprise323 HK Magang 3/26/2014 Estimated FY FY2013 12/2012 SELL CNY (333) (158) 210.6 n.a. Scott Laprise697 HK Shougang Intl 3/28/2014 Estimated FY FY2013 12/2012 BUY HKD (770) (1,027) 75.0 n.a. Scott Laprise489 HK Dongfeng 4/15/2014 Estimated FY FY2013 12/2012 SELL CNY 9,231 9,988 92.4 1.5 Scott Laprise
1211 HK BYD 3/21/2014 Estimated FY FY2013 12/2012 SELL CNY 473 786 60.1 481.1 Scott Laprise2238 HK GAC 3/28/2014 Estimated FY FY2013 12/2012 SELL CNY 2,166 2,510 86.3 91.0 Scott Laprise2333 HK Great Wall Motor 3/26/2014 Estimated FY FY2013 12/2012 SELL CNY 7,855 8,223 95.5 38.0 Scott Laprise1728 HK Zhengtong Auto 3/28/2014 Estimated FY FY2013 12/2012 BUY CNY 807 900 89.7 33.6 Scott Laprise
Net Income (LC'm)
Prepared for: [email protected] FIRST LAST 11/04/13 12:33:55 AM Samsung Information Systems of
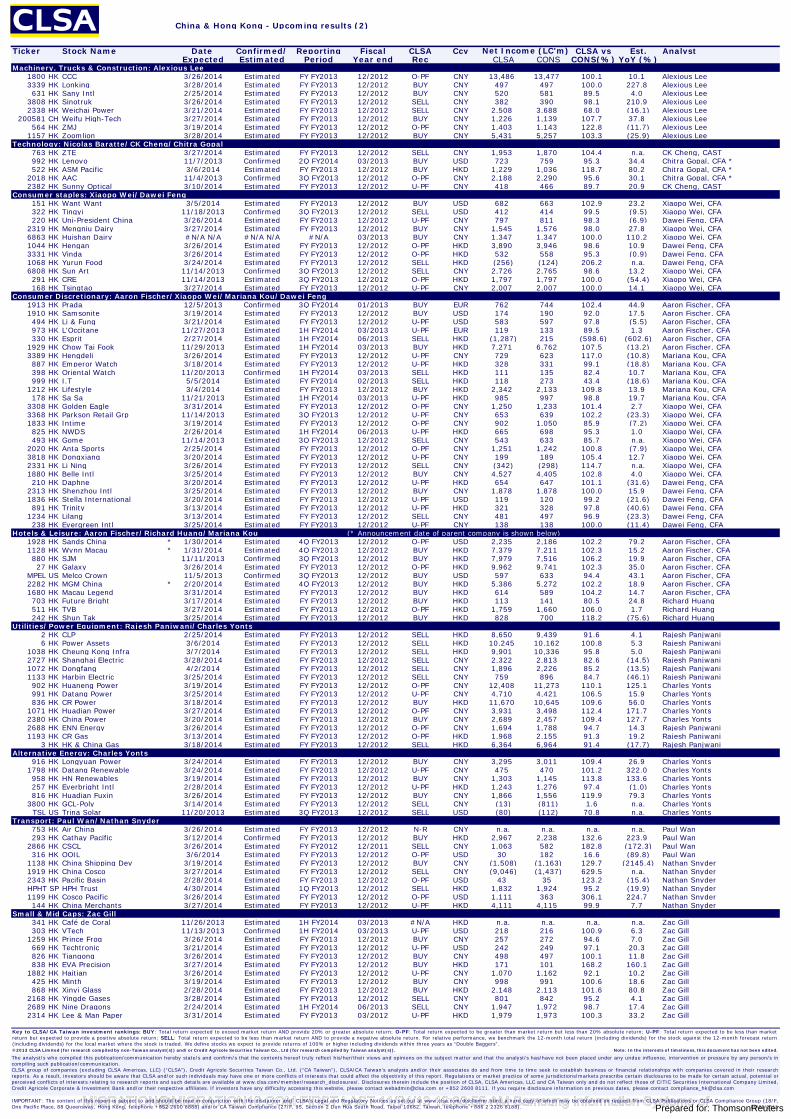
China & Hong Kong - Upcoming results (2)
Ticker Stock Name Date Confirmed/ Reporting Fiscal CLSA Ccy CLSA vs Est. AnalystExpected Estimated Period Year end Rec CLSA CONS CONS(%) YoY (%)
Machinery, Trucks & Construction: Alexious Lee1800 HK CCC 3/26/2014 Estimated FY FY2013 12/2012 O-PF CNY 13,486 13,477 100.1 10.1 Alexious Lee3339 HK Lonking 3/28/2014 Estimated FY FY2013 12/2012 BUY CNY 497 497 100.0 227.8 Alexious Lee631 HK Sany Intl 2/25/2014 Estimated FY FY2013 12/2012 BUY CNY 520 581 89.5 4.0 Alexious Lee
3808 HK Sinotruk 3/26/2014 Estimated FY FY2013 12/2012 SELL CNY 382 390 98.1 210.9 Alexious Lee2338 HK Weichai Power 3/21/2014 Estimated FY FY2013 12/2012 SELL CNY 2,508 3,688 68.0 (16.1) Alexious Lee
200581 CH Weifu High-Tech 3/27/2014 Estimated FY FY2013 12/2012 BUY CNY 1,226 1,139 107.7 37.8 Alexious Lee564 HK ZMJ 3/19/2014 Estimated FY FY2013 12/2012 O-PF CNY 1,403 1,143 122.8 (11.7) Alexious Lee
1157 HK Zoomlion 3/28/2014 Estimated FY FY2013 12/2012 BUY CNY 5,431 5,257 103.3 (25.9) Alexious LeeTechnology: Nicolas Baratte/CK Cheng/Chitra Gopal
763 HK ZTE 3/27/2014 Estimated FY FY2013 12/2012 SELL CNY 1,953 1,870 104.4 n.a. CK Cheng, CAST992 HK Lenovo 11/7/2013 Confirmed 2Q FY2014 03/2013 BUY USD 723 759 95.3 34.4 Chitra Gopal, CFA *522 HK ASM Pacific 3/6/2014 Estimated FY FY2013 12/2012 BUY HKD 1,229 1,036 118.7 80.2 Chitra Gopal, CFA *
2018 HK AAC 11/4/2013 Confirmed 3Q FY2013 12/2012 O-PF CNY 2,188 2,290 95.6 30.1 Chitra Gopal, CFA *2382 HK Sunny Optical 3/10/2014 Estimated FY FY2013 12/2012 U-PF CNY 418 466 89.7 20.9 CK Cheng, CAST
Consumer staples: Xiaopo Wei/Dawei Feng151 HK Want Want 3/5/2014 Estimated FY FY2013 12/2012 BUY USD 682 663 102.9 23.2 Xiaopo Wei, CFA322 HK Tingyi 11/18/2013 Confirmed 3Q FY2013 12/2012 SELL USD 412 414 99.5 (9.5) Xiaopo Wei, CFA220 HK Uni-President China 3/26/2014 Estimated FY FY2013 12/2012 U-PF CNY 797 811 98.3 (6.9) Dawei Feng, CFA
2319 HK Mengniu Dairy 3/27/2014 Estimated FY FY2013 12/2012 BUY CNY 1,545 1,576 98.0 27.8 Xiaopo Wei, CFA6863 HK Huishan Dairy #N/A N/A #N/A N/A #N/A 03/2013 BUY CNY 1,347 1,347 100.0 110.2 Xiaopo Wei, CFA1044 HK Hengan 3/26/2014 Estimated FY FY2013 12/2012 O-PF HKD 3,890 3,946 98.6 10.9 Dawei Feng, CFA3331 HK Vinda 3/26/2014 Estimated FY FY2013 12/2012 O-PF HKD 532 558 95.3 (0.9) Dawei Feng, CFA1068 HK Yurun Food 3/24/2014 Estimated FY FY2013 12/2012 SELL HKD (256) (124) 206.2 n.a. Dawei Feng, CFA6808 HK Sun Art 11/14/2013 Confirmed 3Q FY2013 12/2012 SELL CNY 2,726 2,765 98.6 13.2 Xiaopo Wei, CFA291 HK CRE 11/14/2013 Estimated 3Q FY2013 12/2012 O-PF HKD 1,797 1,797 100.0 (54.4) Xiaopo Wei, CFA168 HK Tsingtao 3/27/2014 Estimated FY FY2013 12/2012 U-PF CNY 2,007 2,007 100.0 14.1 Xiaopo Wei, CFA
Consumer Discretionary: Aaron Fischer/Xiaopo Wei/Mariana Kou/Dawei Feng1913 HK Prada 12/5/2013 Confirmed 3Q FY2014 01/2013 BUY EUR 762 744 102.4 44.9 Aaron Fischer, CFA1910 HK Samsonite 3/19/2014 Estimated FY FY2013 12/2012 BUY USD 174 190 92.0 17.5 Aaron Fischer, CFA494 HK Li & Fung 3/21/2014 Estimated FY FY2013 12/2012 U-PF USD 583 597 97.8 (5.5) Aaron Fischer, CFA973 HK L'Occitane 11/27/2013 Estimated 1H FY2014 03/2013 U-PF EUR 119 133 89.5 1.3 Aaron Fischer, CFA330 HK Esprit 2/27/2014 Estimated 1H FY2014 06/2013 SELL HKD (1,287) 215 (598.6) (602.6) Aaron Fischer, CFA
1929 HK Chow Tai Fook 11/29/2013 Estimated 1H FY2014 03/2013 BUY HKD 7,271 6,762 107.5 (13.2) Aaron Fischer, CFA3389 HK Hengdeli 3/26/2014 Estimated FY FY2013 12/2012 U-PF CNY 729 623 117.0 (10.8) Mariana Kou, CFA887 HK Emperor Watch 3/18/2014 Estimated FY FY2013 12/2012 U-PF HKD 328 331 99.1 (18.8) Mariana Kou, CFA398 HK Oriental Watch 11/20/2013 Confirmed 1H FY2014 03/2013 SELL HKD 111 135 82.4 10.7 Mariana Kou, CFA999 HK I.T 5/5/2014 Estimated FY FY2014 02/2013 SELL HKD 118 273 43.4 (18.6) Mariana Kou, CFA
1212 HK Lifestyle 3/4/2014 Estimated FY FY2013 12/2012 BUY HKD 2,342 2,133 109.8 13.9 Mariana Kou, CFA178 HK Sa Sa 11/21/2013 Estimated 1H FY2014 03/2013 U-PF HKD 985 997 98.8 19.7 Mariana Kou, CFA
3308 HK Golden Eagle 3/31/2014 Estimated FY FY2013 12/2012 O-PF CNY 1,250 1,233 101.4 2.7 Xiaopo Wei, CFA3368 HK Parkson Retail Grp 11/14/2013 Estimated 3Q FY2013 12/2012 U-PF CNY 653 639 102.2 (23.3) Xiaopo Wei, CFA1833 HK Intime 3/19/2014 Estimated FY FY2013 12/2012 O-PF CNY 902 1,050 85.9 (7.2) Xiaopo Wei, CFA825 HK NWDS 2/26/2014 Estimated 1H FY2014 06/2013 U-PF HKD 665 698 95.3 1.0 Xiaopo Wei, CFA493 HK Gome 11/14/2013 Estimated 3Q FY2013 12/2012 SELL CNY 543 633 85.7 n.a. Xiaopo Wei, CFA
2020 HK Anta Sports 2/25/2014 Estimated FY FY2013 12/2012 O-PF CNY 1,251 1,242 100.8 (7.9) Xiaopo Wei, CFA3818 HK Dongxiang 3/20/2014 Estimated FY FY2013 12/2012 U-PF CNY 199 189 105.4 12.7 Xiaopo Wei, CFA2331 HK Li Ning 3/26/2014 Estimated FY FY2013 12/2012 SELL CNY (342) (298) 114.7 n.a. Xiaopo Wei, CFA1880 HK Belle Intl 3/25/2014 Estimated FY FY2013 12/2012 BUY CNY 4,527 4,405 102.8 4.0 Xiaopo Wei, CFA210 HK Daphne 3/20/2014 Estimated FY FY2013 12/2012 U-PF HKD 654 647 101.1 (31.6) Dawei Feng, CFA
2313 HK Shenzhou Intl 3/25/2014 Estimated FY FY2013 12/2012 BUY CNY 1,878 1,878 100.0 15.9 Dawei Feng, CFA1836 HK Stella International 3/20/2014 Estimated FY FY2013 12/2012 U-PF USD 119 120 99.2 (21.6) Dawei Feng, CFA891 HK Trinity 3/13/2014 Estimated FY FY2013 12/2012 U-PF HKD 321 328 97.8 (40.6) Dawei Feng, CFA
1234 HK Lilang 3/13/2014 Estimated FY FY2013 12/2012 SELL CNY 481 497 96.9 (23.3) Dawei Feng, CFA238 HK Evergreen Intl 3/25/2014 Estimated FY FY2013 12/2012 U-PF CNY 138 138 100.0 (11.4) Dawei Feng, CFA
Hotels & Leisure: Aaron Fischer/Richard Huang/Mariana Kou (* Announcement date of parent company is shown below)1928 HK Sands China * 1/30/2014 Estimated 4Q FY2013 12/2012 O-PF USD 2,235 2,186 102.2 79.2 Aaron Fischer, CFA1128 HK Wynn Macau * 1/31/2014 Estimated 4Q FY2013 12/2012 BUY HKD 7,379 7,211 102.3 15.2 Aaron Fischer, CFA880 HK SJM 11/11/2013 Confirmed 3Q FY2013 12/2012 BUY HKD 7,979 7,516 106.2 19.9 Aaron Fischer, CFA27 HK Galaxy 3/26/2014 Estimated FY FY2013 12/2012 O-PF HKD 9,962 9,741 102.3 35.0 Aaron Fischer, CFA
MPEL US Melco Crown 11/5/2013 Confirmed 3Q FY2013 12/2012 BUY USD 597 633 94.4 43.1 Aaron Fischer, CFA2282 HK MGM China * 2/20/2014 Estimated 4Q FY2013 12/2012 BUY HKD 5,386 5,272 102.2 18.9 Aaron Fischer, CFA1680 HK Macau Legend 3/31/2014 Estimated FY FY2013 12/2012 BUY HKD 614 589 104.2 14.7 Aaron Fischer, CFA703 HK Future Bright 3/17/2014 Estimated FY FY2013 12/2012 BUY HKD 113 141 80.5 24.8 Richard Huang511 HK TVB 3/27/2014 Estimated FY FY2013 12/2012 O-PF HKD 1,759 1,660 106.0 1.7 Richard Huang242 HK Shun Tak 3/25/2014 Estimated FY FY2013 12/2012 BUY HKD 828 700 118.2 (75.6) Richard Huang
Utilities/Power Equipment: Rajesh Panjwani/Charles Yonts2 HK CLP 2/25/2014 Estimated FY FY2013 12/2012 SELL HKD 8,650 9,439 91.6 4.1 Rajesh Panjwani6 HK Power Assets 3/6/2014 Estimated FY FY2013 12/2012 SELL HKD 10,245 10,162 100.8 5.3 Rajesh Panjwani
1038 HK Cheung Kong Infra 3/7/2014 Estimated FY FY2013 12/2012 SELL HKD 9,901 10,336 95.8 5.0 Rajesh Panjwani2727 HK Shanghai Electric 3/28/2014 Estimated FY FY2013 12/2012 SELL CNY 2,322 2,813 82.6 (14.5) Rajesh Panjwani1072 HK Dongfang 4/2/2014 Estimated FY FY2013 12/2012 SELL CNY 1,896 2,226 85.2 (13.5) Rajesh Panjwani1133 HK Harbin Electric 3/25/2014 Estimated FY FY2013 12/2012 SELL CNY 759 896 84.7 (46.1) Rajesh Panjwani902 HK Huaneng Power 3/19/2014 Estimated FY FY2013 12/2012 O-PF CNY 12,408 11,273 110.1 125.1 Charles Yonts991 HK Datang Power 3/25/2014 Estimated FY FY2013 12/2012 U-PF CNY 4,710 4,421 106.5 15.9 Charles Yonts836 HK CR Power 3/18/2014 Estimated FY FY2013 12/2012 BUY HKD 11,670 10,645 109.6 56.0 Charles Yonts
1071 HK Huadian Power 3/27/2014 Estimated FY FY2013 12/2012 O-PF CNY 3,931 3,498 112.4 171.7 Charles Yonts2380 HK China Power 3/20/2014 Estimated FY FY2013 12/2012 BUY CNY 2,689 2,457 109.4 127.7 Charles Yonts2688 HK ENN Energy 3/26/2014 Estimated FY FY2013 12/2012 O-PF CNY 1,694 1,788 94.7 14.3 Rajesh Panjwani1193 HK CR Gas 3/13/2014 Estimated FY FY2013 12/2012 O-PF HKD 1,968 2,155 91.3 19.2 Rajesh Panjwani
3 HK HK & China Gas 3/18/2014 Estimated FY FY2013 12/2012 SELL HKD 6,364 6,964 91.4 (17.7) Rajesh PanjwaniAlternative Energy: Charles Yonts
916 HK Longyuan Power 3/24/2014 Estimated FY FY2013 12/2012 BUY CNY 3,295 3,011 109.4 26.9 Charles Yonts1798 HK Datang Renewable 3/24/2014 Estimated FY FY2013 12/2012 U-PF CNY 475 470 101.2 322.0 Charles Yonts958 HK HN Renewables 3/19/2014 Estimated FY FY2013 12/2012 BUY CNY 1,303 1,145 113.8 133.6 Charles Yonts257 HK Everbright Intl 2/28/2014 Estimated FY FY2013 12/2012 U-PF HKD 1,243 1,276 97.4 (1.0) Charles Yonts816 HK Huadian Fuxin 3/26/2014 Estimated FY FY2013 12/2012 BUY CNY 1,866 1,556 119.9 79.3 Charles Yonts
3800 HK GCL-Poly 3/14/2014 Estimated FY FY2013 12/2012 SELL CNY (13) (811) 1.6 n.a. Charles YontsTSL US Trina Solar 11/20/2013 Estimated 3Q FY2013 12/2012 SELL USD (80) (112) 70.8 n.a. Charles Yonts
Transport: Paul Wan/Nathan Snyder 753 HK Air China 3/26/2014 Estimated FY FY2013 12/2012 N-R CNY n.a. n.a. n.a. n.a. Paul Wan293 HK Cathay Pacific 3/12/2014 Confirmed FY FY2013 12/2012 BUY HKD 2,967 2,238 132.6 223.9 Paul Wan
2866 HK CSCL 3/26/2014 Estimated FY FY2012 12/2011 SELL CNY 1,063 582 182.8 (172.3) Paul Wan316 HK OOIL 3/6/2014 Estimated FY FY2013 12/2012 O-PF USD 30 182 16.6 (89.8) Paul Wan
1138 HK China Shipping Dev 3/19/2014 Estimated FY FY2013 12/2012 BUY CNY (1,508) (1,163) 129.7 (2145.4) Nathan Snyder1919 HK China Cosco 3/27/2014 Estimated FY FY2013 12/2012 SELL CNY (9,046) (1,437) 629.5 n.a. Nathan Snyder2343 HK Pacific Basin 2/28/2014 Estimated FY FY2013 12/2012 O-PF USD 43 35 123.2 (15.4) Nathan SnyderHPHT SP HPH Trust 4/30/2014 Estimated 1Q FY2013 12/2012 SELL HKD 1,832 1,924 95.2 (19.9) Nathan Snyder1199 HK Cosco Pacific 3/26/2014 Estimated FY FY2013 12/2012 O-PF USD 1,111 363 306.1 224.7 Nathan Snyder144 HK China Merchants 3/27/2014 Estimated FY FY2013 12/2012 U-PF HKD 4,111 4,115 99.9 7.7 Nathan Snyder
Small & Mid Caps: Zac Gill341 HK Café de Coral 11/26/2013 Estimated 1H FY2014 03/2013 #N/A HKD n.a. n.a. n.a. n.a. Zac Gill303 HK VTech 11/13/2013 Confirmed 1H FY2014 03/2013 U-PF USD 218 216 100.9 6.3 Zac Gill
1259 HK Prince Frog 3/26/2014 Estimated FY FY2013 12/2012 BUY CNY 257 272 94.6 7.0 Zac Gill669 HK Techtronic 3/21/2014 Estimated FY FY2013 12/2012 U-PF USD 242 249 97.1 20.3 Zac Gill826 HK Tiangong 3/26/2014 Estimated FY FY2013 12/2012 BUY CNY 498 497 100.1 11.8 Zac Gill838 HK EVA Precision 3/27/2014 Estimated FY FY2013 12/2012 BUY HKD 171 101 168.2 160.1 Zac Gill
1882 HK Haitian 3/26/2014 Estimated FY FY2013 12/2012 U-PF CNY 1,070 1,162 92.1 10.2 Zac Gill425 HK Minth 3/19/2014 Estimated FY FY2013 12/2012 BUY CNY 998 991 100.6 18.6 Zac Gill868 HK Xinyi Glass 2/28/2014 Estimated FY FY2013 12/2012 BUY HKD 2,148 2,113 101.6 80.8 Zac Gill
2168 HK Yingde Gases 3/28/2014 Estimated FY FY2013 12/2012 SELL CNY 801 842 95.2 4.1 Zac Gill2689 HK Nine Dragons 2/24/2014 Estimated 1H FY2014 06/2013 SELL CNY 1,947 1,972 98.7 17.4 Zac Gill2314 HK Lee & Man Paper 3/31/2014 Estimated FY FY2013 03/2012 U-PF HKD 1,979 1,973 100.3 33.2 Zac Gill
Net Income (LC'm)
Key to CLSA/CA Taiwan investment rankings: BUY: Total return expected to exceed market return AND provide 20% or greater absolute return; O-PF: Total return expected to be greater than market return but less than 20% absolute return; U-PF: Total return expected to be less than marketreturn but expected to provide a positive absolute return; SELL: Total return expected to be less than market return AND to provide a negative absolute return. For relative performance, we benchmark the 12-month total return (including dividends) for the stock against the 12-month forecast return(including dividends) for the local market where the stock is traded. We define stocks we expect to provide returns of 100% or higher including dividends within three years as “Double Baggers”.
The analyst/s who compiled this publication/communication hereby state/s and confirm/s that the contents hereof truly reflect his/her/their views and opinions on the subject matter and that the analyst/s has/have not been placed under any undue influence, intervention or pressure by any person/s incompiling such publication/communication.CLSA group of companies (excluding CLSA Americas, LLC) (“CLSA”), Credit Agricole Securities Taiwan Co., Ltd. (“CA Taiwan”), CLSA/CA Taiwan's analysts and/or their associates do and from time to time seek to establish business or financial relationships with companies covered in their researchreports. As a result, investors should be aware that CLSA and/or such individuals may have one or more conflicts of interests that could affect the objectivity of this report. Regulations or market practice of some jurisdictions/markets prescribe certain disclosures to be made for certain actual, potential orperceived conflicts of interests relating to research reports and such details are available at www.clsa.com/member/research_disclosures/. Disclosures therein include the position of CLSA, CLSA Americas, LLC and CA Taiwan only and do not reflect those of CITIC Securities International Company Limited,Credit Agricole Corporate & Investment Bank and/or their respective affiliates. If investors have any difficulty accessing this website, please contact [email protected] or +852 2600 8111. If you require disclosure information on previous dates, please contact [email protected]
IMPORTANT: The content of this report is subject to and should be read in conjunction with the disclaimer and CLSA's Legal and Regulatory Notices as set out at www.clsa.com/disclaimer.html, a hard copy of which may be obtained on request from CLSA Publications or CLSA Compliance Group (18/F,One Pacific Place, 88 Queensway, Hong Kong, telephone +852 2600 8888) and/or CA Taiwan Compliance (27/F, 95, Section 2 Dun Hua South Road, Taipei 10682, Taiwan, telephone +886 2 2326 8188). 05/08/2013
©2013 CLSA Limited (for research compiled by non-Taiwan analyst(s)) and/or Credit Agricole Securities Taiwan Co., Ltd (for research compiled by Taiwan analyst(s)). Note: In the interests of timeliness, this document has not been edited.
Prepared for: [email protected] FIRST LAST 11/04/13 12:33:55 AM Samsung Information Systems of
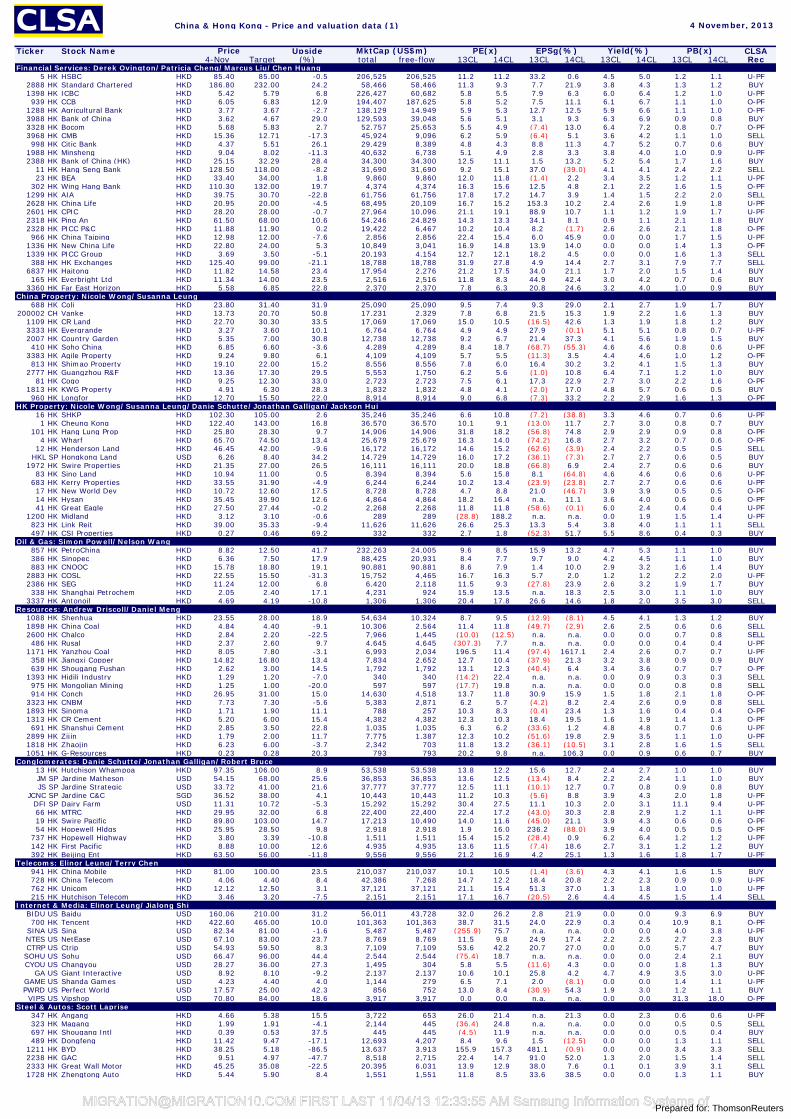
China & Hong Kong - Price and valuation data (1)
Ticker Stock Name Upside CLSA4-Nov Target (%) total free-flow 13CL 14CL 13CL 14CL 13CL 14CL 13CL 14CL Rec
Financial Services: Derek Ovington/Patricia Cheng/Marcus Liu/Chen Huang5 HK HSBC HKD 85.40 85.00 -0.5 206,525 206,525 11.2 11.2 33.2 0.6 4.5 5.0 1.2 1.1 U-PF
2888 HK Standard Chartered HKD 186.80 232.00 24.2 58,466 58,466 11.3 9.3 7.7 21.9 3.8 4.3 1.3 1.2 BUY1398 HK ICBC HKD 5.42 5.79 6.8 226,427 60,682 5.8 5.5 7.9 6.3 6.0 6.4 1.2 1.0 U-PF939 HK CCB HKD 6.05 6.83 12.9 194,407 187,625 5.8 5.2 7.5 11.1 6.1 6.7 1.1 1.0 O-PF
1288 HK Agricultural Bank HKD 3.77 3.67 -2.7 138,129 14,949 5.9 5.3 12.7 12.5 5.9 6.6 1.1 1.0 O-PF3988 HK Bank of China HKD 3.62 4.67 29.0 129,593 39,048 5.6 5.1 3.1 9.3 6.3 6.9 0.9 0.8 BUY3328 HK Bocom HKD 5.68 5.83 2.7 52,757 25,653 5.5 4.9 (7.4) 13.0 6.4 7.2 0.8 0.7 O-PF3968 HK CMB HKD 15.36 12.71 -17.3 45,924 9,096 6.2 5.9 (6.4) 5.1 3.6 4.2 1.1 1.0 SELL998 HK Citic Bank HKD 4.37 5.51 26.1 29,429 8,389 4.8 4.3 8.8 11.3 4.7 5.2 0.7 0.6 BUY
1988 HK Minsheng HKD 9.04 8.02 -11.3 40,632 6,738 5.1 4.9 2.8 3.3 3.8 4.0 1.0 0.9 U-PF2388 HK Bank of China (HK) HKD 25.15 32.29 28.4 34,300 34,300 12.5 11.1 1.5 13.2 5.2 5.4 1.7 1.6 BUY
11 HK Hang Seng Bank HKD 128.50 118.00 -8.2 31,690 31,690 9.2 15.1 37.0 (39.0) 4.1 4.1 2.4 2.2 SELL23 HK BEA HKD 33.40 34.00 1.8 9,860 9,860 12.0 11.8 (1.4) 2.2 3.4 3.5 1.2 1.1 U-PF
302 HK Wing Hang Bank HKD 110.30 132.00 19.7 4,374 4,374 16.3 15.6 12.5 4.8 2.1 2.2 1.6 1.5 O-PF1299 HK AIA HKD 39.75 30.70 -22.8 61,756 61,756 17.8 17.2 14.7 3.9 1.4 1.5 2.2 2.0 SELL2628 HK China Life HKD 20.95 20.00 -4.5 68,495 20,109 16.7 15.2 153.3 10.2 2.4 2.6 1.9 1.8 U-PF2601 HK CPIC HKD 28.20 28.00 -0.7 27,964 10,096 21.1 19.1 88.9 10.7 1.1 1.2 1.9 1.7 U-PF2318 HK Ping An HKD 61.50 68.00 10.6 54,246 24,829 14.3 13.3 34.1 8.1 0.9 1.1 2.1 1.8 BUY2328 HK PICC P&C HKD 11.88 11.90 0.2 19,422 6,467 10.2 10.4 8.2 (1.7) 2.6 2.6 2.1 1.8 O-PF966 HK China Taiping HKD 12.98 12.00 -7.6 2,856 2,856 22.4 15.4 6.0 45.9 0.0 0.0 1.7 1.5 U-PF
1336 HK New China Life HKD 22.80 24.00 5.3 10,849 3,041 16.9 14.8 13.9 14.0 0.0 0.0 1.4 1.3 O-PF1339 HK PICC Group HKD 3.69 3.50 -5.1 20,193 4,154 12.7 12.1 18.2 4.5 0.0 0.0 1.6 1.3 SELL388 HK HK Exchanges HKD 125.40 99.00 -21.1 18,788 18,788 31.9 27.8 4.9 14.4 2.7 3.1 7.9 7.7 SELL
6837 HK Haitong HKD 11.82 14.58 23.4 17,954 2,276 21.2 17.5 34.0 21.1 1.7 2.0 1.5 1.4 BUY165 HK Everbright Ltd HKD 11.34 14.00 23.5 2,516 2,516 11.8 8.3 44.9 42.4 3.0 4.2 0.7 0.6 BUY
3360 HK Far East Horizon HKD 5.58 6.85 22.8 2,370 2,370 7.8 6.3 20.8 24.6 3.2 4.0 1.0 0.9 BUYChina Property: Nicole Wong/Susanna Leung
688 HK Coli HKD 23.80 31.40 31.9 25,090 25,090 9.5 7.4 9.3 29.0 2.1 2.7 1.9 1.7 BUY200002 CH Vanke HKD 13.73 20.70 50.8 17,231 2,329 7.8 6.8 21.5 15.3 1.9 2.2 1.6 1.3 BUY
1109 HK CR Land HKD 22.70 30.30 33.5 17,069 17,069 15.0 10.5 (16.5) 42.6 1.3 1.9 1.8 1.2 BUY3333 HK Evergrande HKD 3.27 3.60 10.1 6,764 6,764 4.9 4.9 27.9 (0.1) 5.1 5.1 0.8 0.7 U-PF2007 HK Country Garden HKD 5.35 7.00 30.8 12,738 12,738 9.2 6.7 21.4 37.3 4.1 5.6 1.9 1.5 BUY410 HK Soho China HKD 6.85 6.60 -3.6 4,289 4,289 8.4 18.7 (68.7) (55.3) 4.6 4.6 0.8 0.6 U-PF
3383 HK Agile Property HKD 9.24 9.80 6.1 4,109 4,109 5.7 5.5 (11.3) 3.5 4.4 4.6 1.0 1.2 O-PF813 HK Shimao Property HKD 19.10 22.00 15.2 8,556 8,556 7.8 6.0 16.4 30.2 3.2 4.1 1.5 1.3 BUY
2777 HK Guangzhou R&F HKD 13.36 17.30 29.5 5,553 1,750 6.2 5.6 (1.0) 10.8 6.4 7.1 1.2 1.0 BUY81 HK Cogo HKD 9.25 12.30 33.0 2,723 2,723 7.5 6.1 17.3 22.9 2.7 3.0 2.2 1.6 O-PF
1813 HK KWG Property HKD 4.91 6.30 28.3 1,832 1,832 4.8 4.1 (2.0) 17.0 4.8 5.7 0.6 0.5 BUY960 HK Longfor HKD 12.70 15.50 22.0 8,914 8,914 9.0 6.8 (7.3) 33.2 2.2 2.9 1.6 1.3 O-PF
HK Property: Nicole Wong/Susanna Leung/Danie Schutte/Jonathan Galligan/Jackson Hui16 HK SHKP HKD 102.30 105.00 2.6 35,246 35,246 6.6 10.8 (7.2) (38.8) 3.3 4.6 0.7 0.6 U-PF1 HK Cheung Kong HKD 122.40 143.00 16.8 36,570 36,570 10.1 9.1 (13.0) 11.7 2.7 3.0 0.8 0.7 BUY
101 HK Hang Lung Prop HKD 25.80 28.30 9.7 14,906 14,906 31.8 18.2 (56.8) 74.8 2.9 2.9 0.9 0.8 O-PF4 HK Wharf HKD 65.70 74.50 13.4 25,679 25,679 16.3 14.0 (74.2) 16.8 2.7 3.2 0.7 0.6 O-PF
12 HK Henderson Land HKD 46.45 42.00 -9.6 16,172 16,172 14.6 15.2 (62.6) (3.9) 2.4 2.2 0.5 0.5 SELLHKL SP Hongkong Land USD 6.26 8.40 34.2 14,729 14,729 16.0 17.2 (36.1) (7.3) 2.7 2.7 0.6 0.5 BUY
1972 HK Swire Properties HKD 21.35 27.00 26.5 16,111 16,111 20.0 18.8 (66.8) 6.9 2.4 2.7 0.6 0.6 BUY83 HK Sino Land HKD 10.94 11.00 0.5 8,394 8,394 5.6 15.8 8.1 (64.8) 4.6 4.6 0.6 0.6 U-PF
683 HK Kerry Properties HKD 33.55 31.90 -4.9 6,244 6,244 10.2 13.4 (23.9) (23.8) 2.7 2.7 0.6 0.6 U-PF17 HK New World Dev HKD 10.72 12.60 17.5 8,728 8,728 4.7 8.8 21.0 (46.7) 3.9 3.9 0.5 0.5 O-PF14 HK Hysan HKD 35.45 39.90 12.6 4,864 4,864 18.2 16.4 n.a. 11.1 3.6 4.0 0.6 0.6 O-PF41 HK Great Eagle HKD 27.50 27.44 -0.2 2,268 2,268 11.8 11.8 (58.6) (0.1) 6.0 2.4 0.4 0.4 U-PF
1200 HK Midland HKD 3.12 3.10 -0.6 289 289 (28.8) 188.2 n.a. n.a. 0.0 1.9 1.5 1.4 U-PF823 HK Link Reit HKD 39.00 35.33 -9.4 11,626 11,626 26.6 25.3 13.3 5.4 3.8 4.0 1.1 1.1 SELL497 HK CSI Properties HKD 0.27 0.46 69.2 332 332 2.7 1.8 (52.3) 51.7 5.5 8.6 0.4 0.3 BUY
Oil & Gas: Simon Powell/Nelson Wang857 HK PetroChina HKD 8.82 12.50 41.7 232,263 24,005 9.6 8.5 15.9 13.2 4.7 5.3 1.1 1.0 BUY386 HK Sinopec HKD 6.36 7.50 17.9 88,425 20,931 8.4 7.7 9.7 9.0 4.2 4.5 1.1 1.0 BUY883 HK CNOOC HKD 15.78 18.80 19.1 90,881 90,881 8.6 7.9 1.4 10.0 2.9 3.2 1.6 1.4 BUY
2883 HK COSL HKD 22.55 15.50 -31.3 15,752 4,465 16.7 16.3 5.7 2.0 1.2 1.2 2.2 2.0 U-PF2386 HK SEG HKD 11.24 12.00 6.8 6,420 2,118 11.5 9.3 (27.8) 23.9 2.6 3.2 1.9 1.7 BUY338 HK Shanghai Petrochem HKD 2.05 2.40 17.1 4,231 924 15.9 13.5 n.a. 18.3 2.5 3.0 1.1 1.0 BUY
3337 HK Antonoil HKD 4.69 4.19 -10.8 1,306 1,306 20.4 17.8 26.6 14.6 1.8 2.0 3.5 3.0 SELLResources: Andrew Driscoll/Daniel Meng
1088 HK Shenhua HKD 23.55 28.00 18.9 54,634 10,324 8.7 9.5 (12.9) (8.1) 4.5 4.1 1.3 1.2 BUY1898 HK China Coal HKD 4.84 4.40 -9.1 10,306 2,564 11.4 11.8 (49.7) (2.9) 2.6 2.5 0.6 0.6 SELL2600 HK Chalco HKD 2.84 2.20 -22.5 7,966 1,445 (10.0) (12.5) n.a. n.a. 0.0 0.0 0.7 0.8 SELL486 HK Rusal HKD 2.37 2.60 9.7 4,645 4,645 (307.3) 7.7 n.a. n.a. 0.0 0.0 0.4 0.4 U-PF
1171 HK Yanzhou Coal HKD 8.05 7.80 -3.1 6,993 2,034 196.5 11.4 (97.4) 1617.1 2.4 2.6 0.7 0.7 U-PF358 HK Jiangxi Copper HKD 14.82 16.80 13.4 7,834 2,652 12.7 10.4 (37.9) 21.3 3.2 3.8 0.9 0.9 BUY639 HK Shougang Fushan HKD 2.62 3.00 14.5 1,792 1,792 13.1 12.3 (40.4) 6.4 3.4 3.6 0.7 0.7 O-PF
1393 HK Hidili Industry HKD 1.29 1.20 -7.0 340 340 (14.2) 22.4 n.a. n.a. 0.0 0.9 0.3 0.3 SELL975 HK Mongolian Mining HKD 1.25 1.00 -20.0 597 597 (17.7) 19.8 n.a. n.a. 0.0 0.0 0.8 0.8 SELL914 HK Conch HKD 26.95 31.00 15.0 14,630 4,518 13.7 11.8 30.9 15.9 1.5 1.8 2.1 1.8 O-PF
3323 HK CNBM HKD 7.73 7.30 -5.6 5,383 2,871 6.2 5.7 (4.2) 8.2 2.4 2.6 0.9 0.8 SELL1893 HK Sinoma HKD 1.71 1.90 11.1 788 257 10.3 8.3 (0.4) 23.4 1.3 1.6 0.4 0.4 O-PF1313 HK CR Cement HKD 5.20 6.00 15.4 4,382 4,382 12.3 10.3 18.4 19.5 1.6 1.9 1.4 1.3 O-PF691 HK Shanshui Cement HKD 2.85 3.50 22.8 1,035 1,035 6.3 6.2 (33.6) 1.2 4.8 4.8 0.7 0.6 U-PF
2899 HK Zijin HKD 1.79 2.00 11.7 7,775 1,387 12.3 10.2 (51.6) 19.8 2.9 3.5 1.1 1.0 U-PF1818 HK Zhaojin HKD 6.23 6.00 -3.7 2,342 703 11.8 13.2 (36.1) (10.5) 3.1 2.8 1.6 1.5 SELL1051 HK G-Resources HKD 0.23 0.28 20.3 793 793 20.2 9.8 n.a. 106.3 0.0 0.9 0.6 0.7 BUY
Conglomerates: Danie Schutte/Jonathan Galligan/Robert Bruce13 HK Hutchison Whampoa HKD 97.35 106.00 8.9 53,538 53,538 13.8 12.2 15.6 12.7 2.4 2.7 1.0 1.0 BUYJM SP Jardine Matheson USD 54.15 68.00 25.6 36,853 36,853 13.6 12.5 (13.4) 8.4 2.2 2.4 1.1 1.0 BUYJS SP Jardine Strategic USD 33.72 41.00 21.6 37,777 37,777 12.5 11.1 (10.1) 12.7 0.7 0.8 0.9 0.8 BUY
JCNC SP Jardine C&C SGD 36.52 38.00 4.1 10,443 10,443 11.2 10.3 (5.6) 8.8 3.9 4.3 2.0 1.8 U-PFDFI SP Dairy Farm USD 11.31 10.72 -5.3 15,292 15,292 30.4 27.5 11.1 10.3 2.0 3.1 11.1 9.4 U-PF66 HK MTRC HKD 29.95 32.00 6.8 22,400 22,400 22.4 17.2 (43.0) 30.3 2.8 2.9 1.2 1.1 U-PF19 HK Swire Pacific HKD 89.80 103.00 14.7 17,213 10,490 14.0 11.6 (45.0) 21.1 3.9 4.3 0.6 0.6 O-PF54 HK Hopewell Hldgs HKD 25.95 28.50 9.8 2,918 2,918 1.9 16.0 236.2 (88.0) 3.9 4.0 0.5 0.5 O-PF
737 HK Hopewell Highway HKD 3.80 3.39 -10.8 1,511 1,511 15.4 15.2 (28.4) 0.9 6.2 6.4 1.2 1.2 U-PF142 HK First Pacific HKD 8.88 10.00 12.6 4,935 4,935 13.6 11.5 (7.4) 18.6 2.7 3.1 1.2 1.2 BUY392 HK Beijing Ent HKD 63.50 56.00 -11.8 9,556 9,556 21.2 16.9 4.2 25.1 1.3 1.6 1.8 1.7 U-PF
Telecoms: Elinor Leung/Terry Chen941 HK China Mobile HKD 81.00 100.00 23.5 210,037 210,037 10.1 10.5 (1.4) (3.6) 4.3 4.1 1.6 1.5 BUY728 HK China Telecom HKD 4.06 4.40 8.4 42,386 7,268 14.7 12.2 18.4 20.8 2.2 2.3 0.9 0.9 U-PF762 HK Unicom HKD 12.12 12.50 3.1 37,121 37,121 21.1 15.4 51.3 37.0 1.3 1.8 1.0 1.0 U-PF215 HK Hutchison Telecom HKD 3.46 3.20 -7.5 2,151 2,151 17.1 16.7 (20.5) 2.6 4.4 4.5 1.5 1.4 SELL
Internet & Media: Elinor Leung/Jialong ShiBIDU US Baidu USD 160.06 210.00 31.2 56,011 43,728 32.0 26.2 2.8 21.9 0.0 0.0 9.3 6.9 BUY700 HK Tencent HKD 422.60 465.00 10.0 101,363 101,363 38.7 31.5 24.0 22.9 0.3 0.4 10.9 8.1 O-PF
SINA US Sina USD 82.34 81.00 -1.6 5,487 5,487 (255.9) 75.7 n.a. n.a. 0.0 0.0 4.0 3.8 U-PFNTES US NetEase USD 67.10 83.00 23.7 8,769 8,769 11.5 9.8 24.9 17.4 2.2 2.5 2.7 2.3 BUYCTRP US Ctrip USD 54.93 59.50 8.3 7,109 7,109 53.6 42.2 20.7 27.0 0.0 0.0 5.7 4.7 BUY
SOHU US Sohu USD 66.47 96.00 44.4 2,544 2,544 (75.4) 18.7 n.a. n.a. 0.0 0.0 2.4 2.1 BUYCYOU US Changyou USD 28.27 36.00 27.3 1,495 304 5.8 5.5 (11.6) 4.3 0.0 0.0 1.8 1.3 BUY
GA US Giant Interactive USD 8.92 8.10 -9.2 2,137 2,137 10.6 10.1 25.8 4.2 4.7 4.9 3.5 3.0 U-PFGAME US Shanda Games USD 4.23 4.40 4.0 1,144 279 6.5 7.1 2.0 (8.1) 0.0 0.0 1.4 1.1 U-PFPWRD US Perfect World USD 17.57 25.00 42.3 856 752 13.0 8.4 (30.9) 54.3 1.9 3.0 1.2 1.1 BUYVIPS US Vipshop USD 70.80 84.00 18.6 3,917 3,917 0.0 0.0 n.a. n.a. 0.0 0.0 31.3 18.0 O-PF
Steel & Autos: Scott Laprise347 HK Angang HKD 4.66 5.38 15.5 3,722 653 26.0 21.4 n.a. 21.3 0.0 2.3 0.6 0.6 U-PF323 HK Magang HKD 1.99 1.91 -4.1 2,144 445 (36.4) 24.8 n.a. n.a. 0.0 0.0 0.5 0.5 SELL697 HK Shougang Intl HKD 0.39 0.53 37.5 445 445 (4.5) 11.9 n.a. n.a. 0.0 0.0 0.5 0.4 BUY489 HK Dongfeng HKD 11.42 9.47 -17.1 12,693 4,207 8.4 9.6 1.5 (12.5) 0.0 0.0 1.3 1.1 SELL
1211 HK BYD HKD 38.25 5.18 -86.5 13,637 3,913 155.9 157.3 481.1 (0.9) 0.0 0.0 3.4 3.3 SELL2238 HK GAC HKD 9.51 4.97 -47.7 8,518 2,715 22.4 14.7 91.0 52.0 1.3 2.0 1.5 1.4 SELL2333 HK Great Wall Motor HKD 45.25 35.08 -22.5 20,395 6,031 13.9 12.9 38.0 7.6 0.1 0.1 3.9 3.1 SELL1728 HK Zhengtong Auto HKD 5.44 5.90 8.4 1,551 1,551 11.8 8.5 33.6 38.5 0.0 0.0 1.3 1.1 BUY
4 November, 2013
Yield(%) PB(x)Price PE(x) EPSg(%)MktCap (US$m)
Prepared for: [email protected] FIRST LAST 11/04/13 12:33:55 AM Samsung Information Systems of
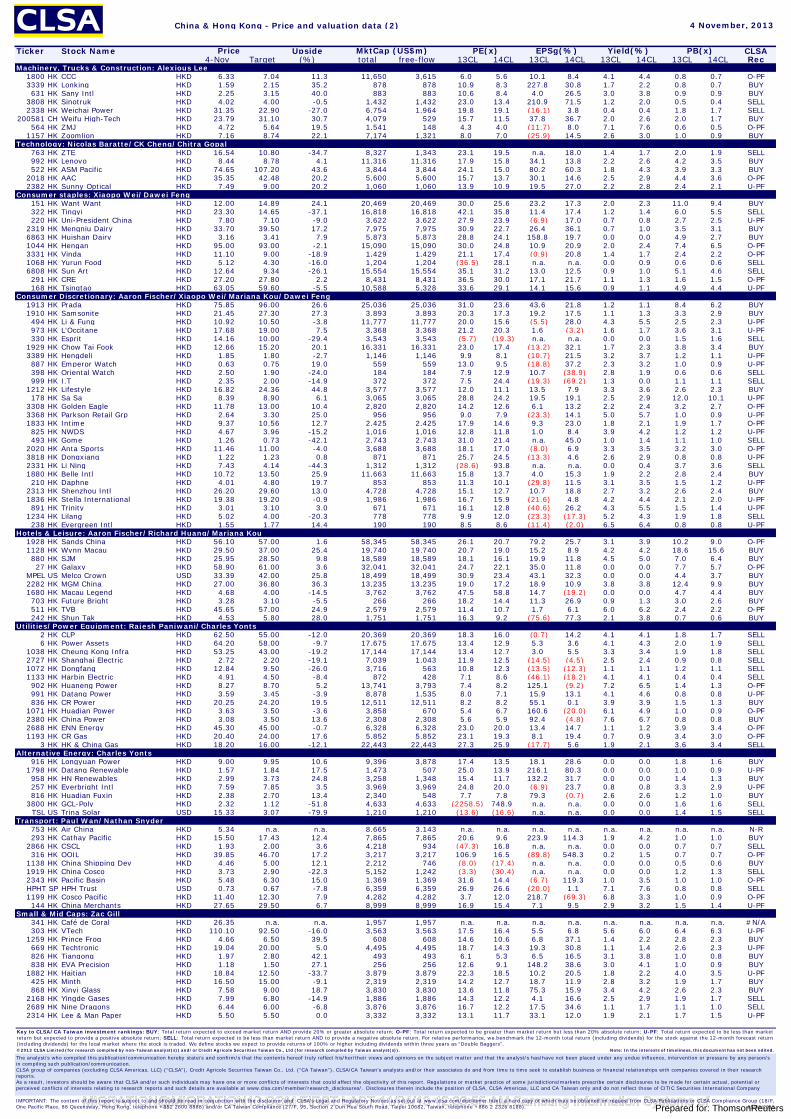
China & Hong Kong - Price and valuation data (2)
Ticker Stock Name Upside CLSA4-Nov Target (%) total free-flow 13CL 14CL 13CL 14CL 13CL 14CL 13CL 14CL Rec
Machinery, Trucks & Construction: Alexious Lee1800 HK CCC HKD 6.33 7.04 11.3 11,650 3,615 6.0 5.6 10.1 8.4 4.1 4.4 0.8 0.7 O-PF3339 HK Lonking HKD 1.59 2.15 35.2 878 878 10.9 8.3 227.8 30.8 1.7 2.2 0.8 0.7 BUY631 HK Sany Intl HKD 2.25 3.15 40.0 883 883 10.6 8.4 4.0 26.5 3.0 3.8 0.9 0.9 BUY
3808 HK Sinotruk HKD 4.02 4.00 -0.5 1,432 1,432 23.0 13.4 210.9 71.5 1.2 2.0 0.5 0.4 SELL2338 HK Weichai Power HKD 31.35 22.90 -27.0 6,754 1,964 19.8 19.1 (16.1) 3.8 0.4 0.4 1.8 1.7 SELL
200581 CH Weifu High-Tech HKD 23.79 31.10 30.7 4,079 529 15.7 11.5 37.8 36.7 2.0 2.6 2.0 1.7 BUY564 HK ZMJ HKD 4.72 5.64 19.5 1,541 148 4.3 4.0 (11.7) 8.0 7.1 7.6 0.6 0.5 O-PF
1157 HK Zoomlion HKD 7.16 8.74 22.1 7,174 1,321 8.0 7.0 (25.9) 14.5 2.6 3.0 1.0 0.9 BUYTechnology: Nicolas Baratte/CK Cheng/Chitra Gopal
763 HK ZTE HKD 16.54 10.80 -34.7 8,327 1,343 23.1 19.5 n.a. 18.0 1.4 1.7 2.0 1.9 SELL992 HK Lenovo HKD 8.44 8.78 4.1 11,316 11,316 17.9 15.8 34.1 13.8 2.2 2.6 4.2 3.5 BUY522 HK ASM Pacific HKD 74.65 107.20 43.6 3,844 3,844 24.1 15.0 80.2 60.3 1.8 4.3 3.9 3.3 BUY
2018 HK AAC HKD 35.35 42.48 20.2 5,600 5,600 15.7 13.7 30.1 14.6 2.5 2.9 4.4 3.6 O-PF2382 HK Sunny Optical HKD 7.49 9.00 20.2 1,060 1,060 13.9 10.9 19.5 27.0 2.2 2.8 2.4 2.1 U-PF
Consumer staples: Xiaopo Wei/Dawei Feng151 HK Want Want HKD 12.00 14.89 24.1 20,469 20,469 30.0 25.6 23.2 17.3 2.0 2.3 11.0 9.4 BUY322 HK Tingyi HKD 23.30 14.65 -37.1 16,818 16,818 42.1 35.8 11.4 17.4 1.2 1.4 6.0 5.5 SELL220 HK Uni-President China HKD 7.80 7.10 -9.0 3,622 3,622 27.9 23.9 (6.9) 17.0 0.7 0.8 2.7 2.5 U-PF
2319 HK Mengniu Dairy HKD 33.70 39.50 17.2 7,975 7,975 30.9 22.7 26.4 36.1 0.7 1.0 3.5 3.1 BUY6863 HK Huishan Dairy HKD 3.16 3.41 7.9 5,873 5,873 28.8 24.1 158.8 19.7 0.0 0.0 4.9 2.7 BUY1044 HK Hengan HKD 95.00 93.00 -2.1 15,090 15,090 30.0 24.8 10.9 20.9 2.0 2.4 7.4 6.5 O-PF3331 HK Vinda HKD 11.10 9.00 -18.9 1,429 1,429 21.1 17.4 (0.9) 20.8 1.4 1.7 2.4 2.2 O-PF1068 HK Yurun Food HKD 5.12 4.30 -16.0 1,204 1,204 (36.5) 28.1 n.a. n.a. 0.0 0.9 0.6 0.6 SELL6808 HK Sun Art HKD 12.64 9.34 -26.1 15,554 15,554 35.1 31.2 13.0 12.5 0.9 1.0 5.1 4.6 SELL291 HK CRE HKD 27.20 27.80 2.2 8,431 8,431 36.5 30.0 17.1 21.7 1.1 1.3 1.6 1.5 O-PF168 HK Tsingtao HKD 63.05 59.60 -5.5 10,588 5,328 33.6 29.1 14.1 15.6 0.9 1.1 4.9 4.4 U-PF
Consumer Discretionary: Aaron Fischer/Xiaopo Wei/Mariana Kou/Dawei Feng1913 HK Prada HKD 75.85 96.00 26.6 25,036 25,036 31.0 23.6 43.6 21.8 1.2 1.1 8.4 6.2 BUY1910 HK Samsonite HKD 21.45 27.30 27.3 3,893 3,893 20.3 17.3 19.2 17.5 1.1 1.3 3.3 2.9 BUY494 HK Li & Fung HKD 10.92 10.50 -3.8 11,777 11,777 20.0 15.6 (5.5) 28.0 4.3 5.5 2.5 2.3 U-PF973 HK L'Occitane HKD 17.68 19.00 7.5 3,368 3,368 21.2 20.3 1.6 (3.2) 1.6 1.7 3.6 3.1 U-PF330 HK Esprit HKD 14.16 10.00 -29.4 3,543 3,543 (5.7) (19.3) n.a. n.a. 0.0 0.0 1.5 1.6 SELL
1929 HK Chow Tai Fook HKD 12.66 15.20 20.1 16,331 16,331 23.0 17.4 (13.2) 32.1 1.7 2.3 3.8 3.4 BUY3389 HK Hengdeli HKD 1.85 1.80 -2.7 1,146 1,146 9.9 8.1 (10.7) 21.5 3.2 3.7 1.2 1.1 U-PF887 HK Emperor Watch HKD 0.63 0.75 19.0 559 559 13.0 9.5 (18.8) 37.2 2.3 3.2 1.0 0.9 U-PF398 HK Oriental Watch HKD 2.50 1.90 -24.0 184 184 7.9 12.9 10.7 (38.9) 2.8 1.9 0.6 0.6 SELL999 HK I.T HKD 2.35 2.00 -14.9 372 372 7.5 24.4 (19.3) (69.2) 1.3 0.0 1.1 1.1 SELL
1212 HK Lifestyle HKD 16.82 24.36 44.8 3,577 3,577 12.0 11.1 13.5 7.9 3.3 3.6 2.6 2.3 BUY178 HK Sa Sa HKD 8.39 8.90 6.1 3,065 3,065 28.8 24.2 19.5 19.1 2.5 2.9 12.0 10.1 U-PF
3308 HK Golden Eagle HKD 11.78 13.00 10.4 2,820 2,820 14.2 12.6 6.1 13.2 2.2 2.4 3.2 2.7 O-PF3368 HK Parkson Retail Grp HKD 2.64 3.30 25.0 956 956 9.0 7.9 (23.3) 14.1 5.0 5.7 1.0 0.9 U-PF1833 HK Intime HKD 9.37 10.56 12.7 2,425 2,425 17.9 14.6 9.3 23.0 1.8 2.1 1.9 1.7 O-PF825 HK NWDS HKD 4.67 3.96 -15.2 1,016 1,016 12.8 11.8 1.0 8.4 3.9 4.2 1.2 1.2 U-PF493 HK Gome HKD 1.26 0.73 -42.1 2,743 2,743 31.0 21.4 n.a. 45.0 1.0 1.4 1.1 1.0 SELL
2020 HK Anta Sports HKD 11.46 11.00 -4.0 3,688 3,688 18.1 17.0 (8.0) 6.9 3.3 3.5 3.2 3.0 O-PF3818 HK Dongxiang HKD 1.22 1.23 0.8 871 871 25.7 24.5 (13.3) 4.6 2.6 2.9 0.8 0.8 U-PF2331 HK Li Ning HKD 7.43 4.14 -44.3 1,312 1,312 (28.6) 93.8 n.a. n.a. 0.0 0.4 3.7 3.6 SELL1880 HK Belle Intl HKD 10.72 13.50 25.9 11,663 11,663 15.8 13.7 4.0 15.3 1.9 2.2 2.8 2.4 BUY210 HK Daphne HKD 4.01 4.80 19.7 853 853 11.3 10.1 (29.8) 11.5 3.1 3.5 1.5 1.2 U-PF
2313 HK Shenzhou Intl HKD 26.20 29.60 13.0 4,728 4,728 15.1 12.7 10.7 18.8 2.7 3.2 2.6 2.4 BUY1836 HK Stella International HKD 19.38 19.20 -0.9 1,986 1,986 16.7 15.9 (21.6) 4.8 4.2 4.4 2.1 2.0 U-PF891 HK Trinity HKD 3.01 3.10 3.0 671 671 16.1 12.8 (40.6) 26.2 4.3 5.5 1.5 1.4 U-PF
1234 HK Lilang HKD 5.02 4.00 -20.3 778 778 9.9 12.0 (23.3) (17.3) 5.2 4.3 1.9 1.8 SELL238 HK Evergreen Intl HKD 1.55 1.77 14.4 190 190 8.5 8.6 (11.4) (2.0) 6.5 6.4 0.8 0.8 U-PF
Hotels & Leisure: Aaron Fischer/Richard Huang/Mariana Kou 1928 HK Sands China HKD 56.10 57.00 1.6 58,345 58,345 26.1 20.7 79.2 25.7 3.1 3.9 10.2 9.0 O-PF1128 HK Wynn Macau HKD 29.50 37.00 25.4 19,740 19,740 20.7 19.0 15.2 8.9 4.2 4.2 18.6 15.6 BUY880 HK SJM HKD 25.95 28.50 9.8 18,589 18,589 18.1 16.1 19.9 11.8 4.5 5.0 7.0 6.4 BUY27 HK Galaxy HKD 58.90 61.00 3.6 32,041 32,041 24.7 22.1 35.0 11.8 0.0 0.0 7.7 5.7 O-PF
MPEL US Melco Crown USD 33.39 42.00 25.8 18,499 18,499 30.9 23.4 43.1 32.3 0.0 0.0 4.4 3.7 BUY2282 HK MGM China HKD 27.00 36.80 36.3 13,235 13,235 19.0 17.2 18.9 10.9 3.8 3.8 12.4 9.9 BUY1680 HK Macau Legend HKD 4.68 4.00 -14.5 3,762 3,762 47.5 58.8 14.7 (19.2) 0.0 0.0 4.7 4.4 BUY703 HK Future Bright HKD 3.28 3.10 -5.5 266 266 18.2 14.4 11.3 26.9 0.9 1.3 3.0 2.6 BUY511 HK TVB HKD 45.65 57.00 24.9 2,579 2,579 11.4 10.7 1.7 6.1 6.0 6.2 2.4 2.2 O-PF242 HK Shun Tak HKD 4.53 5.80 28.0 1,751 1,751 16.3 9.2 (75.6) 77.3 2.1 3.8 0.7 0.6 BUY
Utilities/Power Equipment: Rajesh Panjwani/Charles Yonts2 HK CLP HKD 62.50 55.00 -12.0 20,369 20,369 18.3 16.0 (0.7) 14.2 4.1 4.1 1.8 1.7 SELL6 HK Power Assets HKD 64.20 58.00 -9.7 17,675 17,675 13.4 12.9 5.3 3.6 4.1 4.3 2.0 1.9 SELL
1038 HK Cheung Kong Infra HKD 53.25 43.00 -19.2 17,144 17,144 13.4 12.7 3.0 5.5 3.3 3.4 1.9 1.8 SELL2727 HK Shanghai Electric HKD 2.72 2.20 -19.1 7,039 1,043 11.9 12.5 (14.5) (4.5) 2.5 2.4 0.9 0.8 SELL1072 HK Dongfang HKD 12.84 9.50 -26.0 3,716 563 10.8 12.3 (13.5) (12.3) 1.1 1.1 1.2 1.1 SELL1133 HK Harbin Electric HKD 4.91 4.50 -8.4 872 428 7.1 8.6 (46.1) (18.2) 4.1 4.1 0.4 0.4 SELL902 HK Huaneng Power HKD 8.27 8.70 5.2 13,741 3,793 7.4 8.2 125.1 (9.2) 7.2 6.5 1.4 1.3 O-PF991 HK Datang Power HKD 3.59 3.45 -3.9 8,878 1,535 8.0 7.1 15.9 13.1 4.1 4.6 0.8 0.8 U-PF836 HK CR Power HKD 20.25 24.20 19.5 12,511 12,511 8.2 8.2 55.1 0.1 3.9 3.9 1.5 1.3 BUY
1071 HK Huadian Power HKD 3.63 3.50 -3.6 3,858 670 5.4 6.7 160.6 (20.0) 6.1 4.9 1.0 0.9 O-PF2380 HK China Power HKD 3.08 3.50 13.6 2,308 2,308 5.6 5.9 92.4 (4.8) 7.6 6.7 0.8 0.8 BUY2688 HK ENN Energy HKD 45.30 45.00 -0.7 6,328 6,328 23.0 20.0 13.4 14.7 1.1 1.2 3.9 3.4 O-PF1193 HK CR Gas HKD 20.40 24.00 17.6 5,852 5,852 23.1 19.3 8.1 19.4 0.7 0.9 3.4 3.0 O-PF
3 HK HK & China Gas HKD 18.20 16.00 -12.1 22,443 22,443 27.3 25.9 (17.7) 5.6 1.9 2.1 3.6 3.4 SELLAlternative Energy: Charles Yonts
916 HK Longyuan Power HKD 9.00 9.95 10.6 9,396 3,878 17.4 13.5 18.1 28.6 0.0 0.0 1.8 1.6 BUY1798 HK Datang Renewable HKD 1.57 1.84 17.5 1,473 507 25.0 13.9 216.1 80.3 0.0 0.0 1.0 0.9 U-PF958 HK HN Renewables HKD 2.99 3.73 24.8 3,258 1,348 15.4 11.7 132.2 31.7 0.0 0.0 1.4 1.3 BUY257 HK Everbright Intl HKD 7.59 7.85 3.5 3,969 3,969 24.8 20.0 (6.9) 23.7 0.8 0.8 3.3 2.9 U-PF816 HK Huadian Fuxin HKD 2.38 2.70 13.4 2,340 548 7.7 7.8 79.3 (0.7) 2.6 2.6 1.2 1.0 BUY
3800 HK GCL-Poly HKD 2.32 1.12 -51.8 4,633 4,633 (2258.5) 748.9 n.a. n.a. 0.0 0.0 1.6 1.6 SELLTSL US Trina Solar USD 15.33 3.07 -79.9 1,210 1,210 (13.6) (16.6) n.a. n.a. 0.0 0.0 1.4 1.5 SELL
Transport: Paul Wan/Nathan Snyder 753 HK Air China HKD 5.34 n.a. n.a. 8,665 3,143 n.a. n.a. n.a. n.a. n.a. n.a. n.a. n.a. N-R293 HK Cathay Pacific HKD 15.50 17.43 12.4 7,865 7,865 20.6 9.6 223.9 114.3 1.9 4.2 1.0 1.0 BUY
2866 HK CSCL HKD 1.93 2.00 3.6 4,218 934 (47.3) 16.8 n.a. n.a. 0.0 0.0 0.7 0.7 SELL316 HK OOIL HKD 39.85 46.70 17.2 3,217 3,217 106.9 16.5 (89.8) 548.3 0.2 1.5 0.7 0.7 O-PF
1138 HK China Shipping Dev HKD 4.46 5.00 12.1 2,212 746 (8.0) (17.4) n.a. n.a. 0.0 0.0 0.5 0.6 BUY1919 HK China Cosco HKD 3.73 2.90 -22.3 5,152 1,242 (3.3) (30.4) n.a. n.a. 0.0 0.0 1.2 1.3 SELL2343 HK Pacific Basin HKD 5.48 6.30 15.0 1,369 1,369 31.6 14.4 (6.7) 119.3 1.0 3.5 1.0 1.0 O-PFHPHT SP HPH Trust USD 0.73 0.67 -7.8 6,359 6,359 26.9 26.6 (20.0) 1.1 7.1 7.6 0.8 0.8 SELL1199 HK Cosco Pacific HKD 11.40 12.30 7.9 4,282 4,282 3.7 12.0 218.7 (69.3) 6.8 3.3 1.0 0.9 O-PF144 HK China Merchants HKD 27.65 29.50 6.7 8,999 8,999 16.9 15.4 7.1 9.5 2.9 3.2 1.5 1.4 U-PF
Small & Mid Caps: Zac Gill341 HK Café de Coral HKD 26.35 n.a. n.a. 1,957 1,957 n.a. n.a. n.a. n.a. n.a. n.a. n.a. n.a. #N/A303 HK VTech HKD 110.10 92.50 -16.0 3,563 3,563 17.5 16.4 5.5 6.8 5.6 6.0 6.4 6.3 U-PF
1259 HK Prince Frog HKD 4.66 6.50 39.5 608 608 14.6 10.6 6.8 37.1 1.4 2.2 2.8 2.3 BUY669 HK Techtronic HKD 19.04 20.00 5.0 4,495 4,495 18.7 14.3 19.3 30.8 1.1 1.4 2.6 2.3 U-PF826 HK Tiangong HKD 1.97 2.80 42.1 493 493 6.1 5.3 6.5 16.5 3.1 3.8 1.0 0.8 BUY838 HK EVA Precision HKD 1.18 1.50 27.1 256 256 12.6 9.1 148.2 38.6 3.0 4.1 1.0 0.9 BUY
1882 HK Haitian HKD 18.84 12.50 -33.7 3,879 3,879 22.3 18.5 10.2 20.5 1.8 2.2 4.0 3.5 U-PF425 HK Minth HKD 16.50 15.00 -9.1 2,319 2,319 14.2 12.7 18.7 11.9 2.8 3.2 1.9 1.7 BUY868 HK Xinyi Glass HKD 7.58 9.00 18.7 3,830 3,830 13.6 11.8 75.3 15.9 3.4 4.2 2.6 2.3 BUY
2168 HK Yingde Gases HKD 7.99 6.80 -14.9 1,886 1,886 14.3 12.2 4.1 16.6 2.5 2.9 1.9 1.7 SELL2689 HK Nine Dragons HKD 6.44 6.00 -6.8 3,876 3,876 16.7 12.2 17.5 34.6 1.1 1.7 1.1 1.0 SELL2314 HK Lee & Man Paper HKD 5.50 5.50 0.0 3,332 3,332 13.1 11.7 33.1 12.0 1.9 2.1 1.7 1.5 U-PF
4 November, 2013
Yield(%) PB(x)EPSg(%)PE(x)MktCap (US$m)Price
Key to CLSA/CA Taiwan investment rankings: BUY: Total return expected to exceed market return AND provide 20% or greater absolute return; O-PF: Total return expected to be greater than market return but less than 20% absolute return; U-PF: Total return expected to be less than marketreturn but expected to provide a positive absolute return; SELL: Total return expected to be less than market return AND to provide a negative absolute return. For relative performance, we benchmark the 12-month total return (including dividends) for the stock against the 12-month forecast return(including dividends) for the local market where the stock is traded. We define stocks we expect to provide returns of 100% or higher including dividends within three years as “Double Baggers”.
The analyst/s who compiled this publication/communication hereby state/s and confirm/s that the contents hereof truly reflect his/her/their views and opinions on the subject matter and that the analyst/s has/have not been placed under any undue influence, intervention or pressure by any person/s in compiling such publication/communication.CLSA group of companies (excluding CLSA Americas, LLC) (“CLSA”), Credit Agricole Securities Taiwan Co., Ltd. (“CA Taiwan”), CLSA/CA Taiwan's analysts and/or their associates do and from time to time seek to establish business or financial relationships with companies covered in their research reports.As a result, investors should be aware that CLSA and/or such individuals may have one or more conflicts of interests that could affect the objectivity of this report. Regulations or market practice of some jurisdictions/markets prescribe certain disclosures to be made for certain actual, potential or perceived conflicts of interests relating to research reports and such details are available at www.clsa.com/member/research_disclosures/. Disclosures therein include the position of CLSA, CLSA Americas, LLC and CA Taiwan only and do not reflect those of CITIC Securities International Company
IMPORTANT: The content of this report is subject to and should be read in conjunction with the disclaimer and CLSA's Legal and Regulatory Notices as set out at www.clsa.com/disclaimer.html, a hard copy of which may be obtained on request from CLSA Publications or CLSA Compliance Group (18/F,One Pacific Place, 88 Queensway, Hong Kong, telephone +852 2600 8888) and/or CA Taiwan Compliance (27/F, 95, Section 2 Dun Hua South Road, Taipei 10682, Taiwan, telephone +886 2 2326 8188). 05/08/2013
©2013 CLSA Limited (for research compiled by non-Taiwan analyst(s)) and/or Credit Agricole Securities Taiwan Co., Ltd (for research compiled by Taiwan analyst(s)). Note: In the interests of timeliness, this document has not been edited.
Prepared for: [email protected] FIRST LAST 11/04/13 12:33:55 AM Samsung Information Systems of
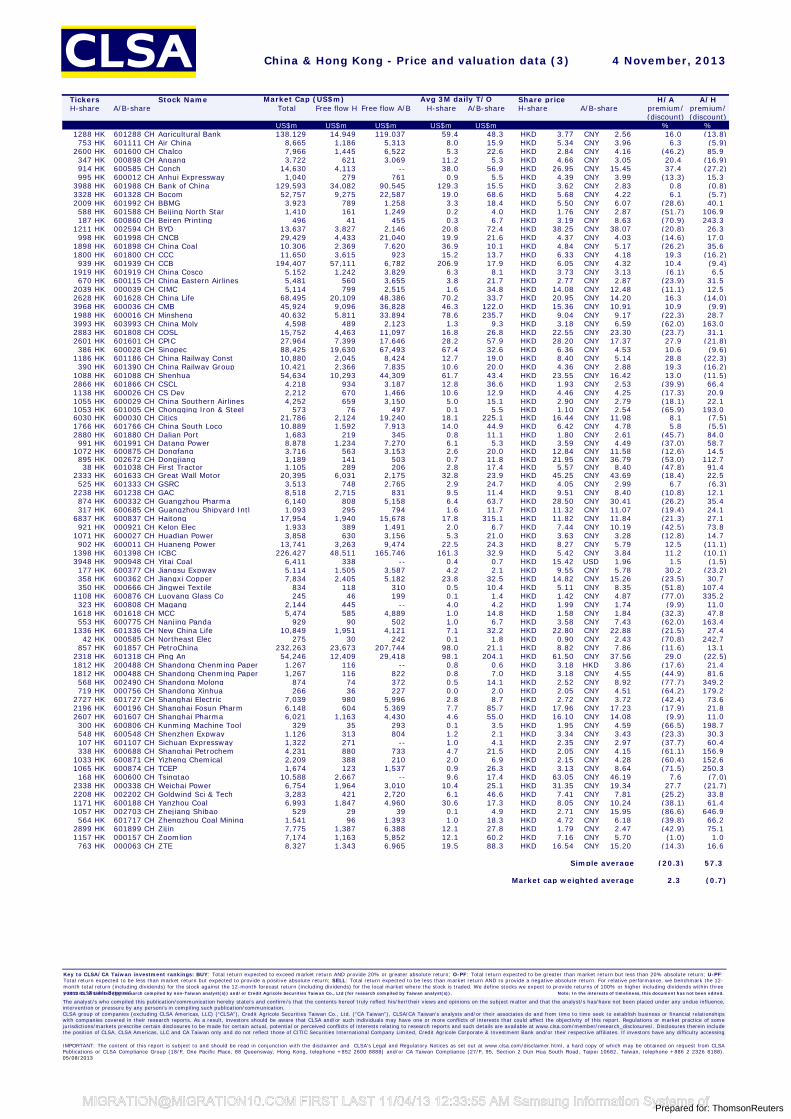
Tickers Stock Name Share price H/A A/HH-share A/B-share Total Free flow H Free flow A/B H-share A/B-share H-share A/B-share premium/ premium/
(discount) (discount)US$m US$m US$m US$m US$m % %
1288 HK 601288 CH Agricultural Bank 138,129 14,949 119,037 59.4 48.3 HKD 3.77 CNY 2.56 16.0 (13.8)753 HK 601111 CH Air China 8,665 1,186 5,313 8.0 15.9 HKD 5.34 CNY 3.96 6.3 (5.9)
2600 HK 601600 CH Chalco 7,966 1,445 6,522 5.3 22.6 HKD 2.84 CNY 4.16 (46.2) 85.9347 HK 000898 CH Angang 3,722 621 3,069 11.2 5.3 HKD 4.66 CNY 3.05 20.4 (16.9)914 HK 600585 CH Conch 14,630 4,113 -- 38.0 56.9 HKD 26.95 CNY 15.45 37.4 (27.2)995 HK 600012 CH Anhui Expressway 1,040 279 761 0.9 5.5 HKD 4.39 CNY 3.99 (13.3) 15.3
3988 HK 601988 CH Bank of China 129,593 34,082 90,545 129.3 15.5 HKD 3.62 CNY 2.83 0.8 (0.8)3328 HK 601328 CH Bocom 52,757 9,275 22,587 19.0 68.6 HKD 5.68 CNY 4.22 6.1 (5.7)2009 HK 601992 CH BBMG 3,923 789 1,258 3.3 18.4 HKD 5.50 CNY 6.07 (28.6) 40.1588 HK 601588 CH Beijing North Star 1,410 161 1,249 0.2 4.0 HKD 1.76 CNY 2.87 (51.7) 106.9187 HK 600860 CH Beiren Printing 496 41 455 0.3 6.7 HKD 3.19 CNY 8.63 (70.9) 243.3
1211 HK 002594 CH BYD 13,637 3,827 2,146 20.8 72.4 HKD 38.25 CNY 38.07 (20.8) 26.3998 HK 601998 CH CNCB 29,429 4,433 21,040 19.9 21.6 HKD 4.37 CNY 4.03 (14.6) 17.0
1898 HK 601898 CH China Coal 10,306 2,369 7,620 36.9 10.1 HKD 4.84 CNY 5.17 (26.2) 35.61800 HK 601800 CH CCC 11,650 3,615 923 15.2 13.7 HKD 6.33 CNY 4.18 19.3 (16.2)939 HK 601939 CH CCB 194,407 57,111 6,782 206.9 17.9 HKD 6.05 CNY 4.32 10.4 (9.4)
1919 HK 601919 CH China Cosco 5,152 1,242 3,829 6.3 8.1 HKD 3.73 CNY 3.13 (6.1) 6.5670 HK 600115 CH China Eastern Airlines 5,481 560 3,655 3.8 21.7 HKD 2.77 CNY 2.87 (23.9) 31.5
2039 HK 000039 CH CIMC 5,114 799 2,515 1.6 34.8 HKD 14.08 CNY 12.48 (11.1) 12.52628 HK 601628 CH China Life 68,495 20,109 48,386 70.2 33.7 HKD 20.95 CNY 14.20 16.3 (14.0)3968 HK 600036 CH CMB 45,924 9,096 36,828 46.3 122.0 HKD 15.36 CNY 10.91 10.9 (9.9)1988 HK 600016 CH Minsheng 40,632 5,811 33,894 78.6 235.7 HKD 9.04 CNY 9.17 (22.3) 28.73993 HK 603993 CH China Moly 4,598 489 2,123 1.3 9.3 HKD 3.18 CNY 6.59 (62.0) 163.02883 HK 601808 CH COSL 15,752 4,463 11,097 16.8 26.8 HKD 22.55 CNY 23.30 (23.7) 31.12601 HK 601601 CH CPIC 27,964 7,399 17,646 28.2 57.9 HKD 28.20 CNY 17.37 27.9 (21.8)386 HK 600028 CH Sinopec 88,425 19,630 67,493 67.4 32.6 HKD 6.36 CNY 4.53 10.6 (9.6)
1186 HK 601186 CH China Railway Const 10,880 2,045 8,424 12.7 19.0 HKD 8.40 CNY 5.14 28.8 (22.3)390 HK 601390 CH China Railway Group 10,421 2,366 7,835 10.6 20.0 HKD 4.36 CNY 2.88 19.3 (16.2)
1088 HK 601088 CH Shenhua 54,634 10,293 44,309 61.7 43.4 HKD 23.55 CNY 16.42 13.0 (11.5)2866 HK 601866 CH CSCL 4,218 934 3,187 12.8 36.6 HKD 1.93 CNY 2.53 (39.9) 66.41138 HK 600026 CH CS Dev 2,212 670 1,466 10.6 12.9 HKD 4.46 CNY 4.25 (17.3) 20.91055 HK 600029 CH China Southern Airlines 4,252 659 3,150 5.0 15.1 HKD 2.90 CNY 2.79 (18.1) 22.11053 HK 601005 CH Chongqing Iron & Steel 573 76 497 0.1 5.5 HKD 1.10 CNY 2.54 (65.9) 193.06030 HK 600030 CH Citics 21,786 2,124 19,240 18.1 225.1 HKD 16.44 CNY 11.98 8.1 (7.5)1766 HK 601766 CH China South Loco 10,889 1,592 7,913 14.0 44.9 HKD 6.42 CNY 4.78 5.8 (5.5)2880 HK 601880 CH Dalian Port 1,683 219 345 0.8 11.1 HKD 1.80 CNY 2.61 (45.7) 84.0991 HK 601991 CH Datang Power 8,878 1,234 7,270 6.1 5.3 HKD 3.59 CNY 4.49 (37.0) 58.7
1072 HK 600875 CH Dongfang 3,716 563 3,153 2.6 20.0 HKD 12.84 CNY 11.58 (12.6) 14.5895 HK 002672 CH Dongjiang 1,189 141 503 0.7 11.8 HKD 21.95 CNY 36.79 (53.0) 112.738 HK 601038 CH First Tractor 1,105 289 206 2.8 17.4 HKD 5.57 CNY 8.40 (47.8) 91.4
2333 HK 601633 CH Great Wall Motor 20,395 6,031 2,175 32.8 23.9 HKD 45.25 CNY 43.69 (18.4) 22.5525 HK 601333 CH GSRC 3,513 748 2,765 2.9 24.7 HKD 4.05 CNY 2.99 6.7 (6.3)
2238 HK 601238 CH GAC 8,518 2,715 831 9.5 11.4 HKD 9.51 CNY 8.40 (10.8) 12.1874 HK 600332 CH Guangzhou Pharma 6,140 808 5,158 6.4 63.7 HKD 28.50 CNY 30.41 (26.2) 35.4317 HK 600685 CH Guangzhou Shipyard Intl 1,093 295 794 1.6 11.7 HKD 11.32 CNY 11.07 (19.4) 24.1
6837 HK 600837 CH Haitong 17,954 1,940 15,678 17.8 315.1 HKD 11.82 CNY 11.84 (21.3) 27.1921 HK 000921 CH Kelon Elec 1,933 389 1,491 2.0 6.7 HKD 7.44 CNY 10.19 (42.5) 73.8
1071 HK 600027 CH Huadian Power 3,858 630 3,156 5.3 21.0 HKD 3.63 CNY 3.28 (12.8) 14.7902 HK 600011 CH Huaneng Power 13,741 3,263 9,474 22.5 24.3 HKD 8.27 CNY 5.79 12.5 (11.1)
1398 HK 601398 CH ICBC 226,427 48,511 165,746 161.3 32.9 HKD 5.42 CNY 3.84 11.2 (10.1)3948 HK 900948 CH Yitai Coal 6,411 338 -- 0.4 0.7 HKD 15.42 USD 1.96 1.5 (1.5)177 HK 600377 CH Jiangsu Expway 5,114 1,505 3,587 4.2 2.1 HKD 9.55 CNY 5.78 30.2 (23.2)358 HK 600362 CH Jiangxi Copper 7,834 2,405 5,182 23.8 32.5 HKD 14.82 CNY 15.26 (23.5) 30.7350 HK 000666 CH Jingwei Textile 834 118 310 0.5 10.4 HKD 5.11 CNY 8.35 (51.8) 107.4
1108 HK 600876 CH Luoyang Glass Co 245 46 199 0.1 1.4 HKD 1.42 CNY 4.87 (77.0) 335.2323 HK 600808 CH Magang 2,144 445 -- 4.0 4.2 HKD 1.99 CNY 1.74 (9.9) 11.0
1618 HK 601618 CH MCC 5,474 585 4,889 1.0 14.8 HKD 1.58 CNY 1.84 (32.3) 47.8553 HK 600775 CH Nanjing Panda 929 90 502 1.0 6.7 HKD 3.58 CNY 7.43 (62.0) 163.4
1336 HK 601336 CH New China Life 10,849 1,951 4,121 7.1 32.2 HKD 22.80 CNY 22.88 (21.5) 27.442 HK 000585 CH Northeast Elec 275 30 242 0.1 1.8 HKD 0.90 CNY 2.43 (70.8) 242.7
857 HK 601857 CH PetroChina 232,263 23,673 207,744 98.0 21.1 HKD 8.82 CNY 7.86 (11.6) 13.12318 HK 601318 CH Ping An 54,246 12,409 29,418 98.1 204.1 HKD 61.50 CNY 37.56 29.0 (22.5)1812 HK 200488 CH Shandong Chenming Paper 1,267 116 -- 0.8 0.6 HKD 3.18 HKD 3.86 (17.6) 21.41812 HK 000488 CH Shandong Chenming Paper 1,267 116 822 0.8 7.0 HKD 3.18 CNY 4.55 (44.9) 81.6568 HK 002490 CH Shandong Molong 874 74 372 0.5 14.1 HKD 2.52 CNY 8.92 (77.7) 349.2719 HK 000756 CH Shandong Xinhua 266 36 227 0.0 2.0 HKD 2.05 CNY 4.51 (64.2) 179.2
2727 HK 601727 CH Shanghai Electric 7,039 980 5,996 2.8 8.7 HKD 2.72 CNY 3.72 (42.4) 73.62196 HK 600196 CH Shanghai Fosun Pharm 6,148 604 5,369 7.7 85.7 HKD 17.96 CNY 17.23 (17.9) 21.82607 HK 601607 CH Shanghai Pharma 6,021 1,163 4,430 4.6 55.0 HKD 16.10 CNY 14.08 (9.9) 11.0300 HK 600806 CH Kunming Machine Tool 329 35 293 0.1 3.5 HKD 1.95 CNY 4.59 (66.5) 198.7548 HK 600548 CH Shenzhen Expway 1,126 313 804 1.2 2.1 HKD 3.34 CNY 3.43 (23.3) 30.3107 HK 601107 CH Sichuan Expressway 1,322 271 -- 1.0 4.1 HKD 2.35 CNY 2.97 (37.7) 60.4338 HK 600688 CH Shanghai Petrochem 4,231 880 733 4.7 21.5 HKD 2.05 CNY 4.15 (61.1) 156.9
1033 HK 600871 CH Yizheng Chemical 2,209 388 210 2.0 6.9 HKD 2.15 CNY 4.28 (60.4) 152.61065 HK 600874 CH TCEP 1,674 123 1,537 0.9 26.3 HKD 3.13 CNY 8.64 (71.5) 250.3168 HK 600600 CH Tsingtao 10,588 2,667 -- 9.6 17.4 HKD 63.05 CNY 46.19 7.6 (7.0)
2338 HK 000338 CH Weichai Power 6,754 1,964 3,010 10.4 25.1 HKD 31.35 CNY 19.34 27.7 (21.7)2208 HK 002202 CH Goldwind Sci & Tech 3,283 421 2,720 6.1 46.6 HKD 7.41 CNY 7.81 (25.2) 33.81171 HK 600188 CH Yanzhou Coal 6,993 1,847 4,960 30.6 17.3 HKD 8.05 CNY 10.24 (38.1) 61.41057 HK 002703 CH Zhejiang Shibao 529 29 39 0.1 4.9 HKD 2.71 CNY 15.95 (86.6) 646.9564 HK 601717 CH Zhengzhou Coal Mining 1,541 96 1,393 1.0 18.3 HKD 4.72 CNY 6.18 (39.8) 66.2
2899 HK 601899 CH Zijin 7,775 1,387 6,388 12.1 27.8 HKD 1.79 CNY 2.47 (42.9) 75.11157 HK 000157 CH Zoomlion 7,174 1,163 5,852 12.1 60.2 HKD 7.16 CNY 5.70 (1.0) 1.0763 HK 000063 CH ZTE 8,327 1,343 6,965 19.5 88.3 HKD 16.54 CNY 15.20 (14.3) 16.6
Simple average (20.3) 57.3
Market cap weighted average 2.3 (0.7)
Market Cap (US$m) Avg 3M daily T/O
China & Hong Kong - Price and valuation data (3) 4 November, 2013
Key to CLSA/CA Taiwan investment rankings: BUY: Total return expected to exceed market return AND provide 20% or greater absolute return; O-PF: Total return expected to be greater than market return but less than 20% absolute return; U-PF:Total return expected to be less than market return but expected to provide a positive absolute return; SELL: Total return expected to be less than market return AND to provide a negative absolute return. For relative performance, we benchmark the 12-month total return (including dividends) for the stock against the 12-month forecast return (including dividends) for the local market where the stock is traded. We define stocks we expect to provide returns of 100% or higher including dividends within threeyears as “Double Baggers”.
The analyst/s who compiled this publication/communication hereby state/s and confirm/s that the contents hereof truly reflect his/her/their views and opinions on the subject matter and that the analyst/s has/have not been placed under any undue influence,intervention or pressure by any person/s in compiling such publication/communication.CLSA group of companies (excluding CLSA Americas, LLC) (“CLSA”), Credit Agricole Securities Taiwan Co., Ltd. (“CA Taiwan”), CLSA/CA Taiwan's analysts and/or their associates do and from time to time seek to establish business or financial relationshipswith companies covered in their research reports. As a result, investors should be aware that CLSA and/or such individuals may have one or more conflicts of interests that could affect the objectivity of this report. Regulations or market practice of somejurisdictions/markets prescribe certain disclosures to be made for certain actual, potential or perceived conflicts of interests relating to research reports and such details are available at www.clsa.com/member/research_disclosures/. Disclosures therein includethe position of CLSA, CLSA Americas, LLC and CA Taiwan only and do not reflect those of CITIC Securities International Company Limited, Credit Agricole Corporate & Investment Bank and/or their respective affiliates. If investors have any difficulty accessing
IMPORTANT: The content of this report is subject to and should be read in conjunction with the disclaimer and CLSA's Legal and Regulatory Notices as set out at www.clsa.com/disclaimer.html, a hard copy of which may be obtained on request from CLSAPublications or CLSA Compliance Group (18/F, One Pacific Place, 88 Queensway, Hong Kong, telephone +852 2600 8888) and/or CA Taiwan Compliance (27/F, 95, Section 2 Dun Hua South Road, Taipei 10682, Taiwan, telephone +886 2 2326 8188).05/08/2013
©2013 CLSA Limited (for research compiled by non-Taiwan analyst(s)) and/or Credit Agricole Securities Taiwan Co., Ltd (for research compiled by Taiwan analyst(s)). Note: In the interests of timeliness, this document has not been edited.
Prepared for: [email protected] FIRST LAST 11/04/13 12:33:55 AM Samsung Information Systems of