Embed Size (px)
Citation preview
8/2/2019 China Labour Statistical Yearbook - 2004
http://slidepdf.com/reader/full/china-labour-statistical-yearbook-2004 1/464
CHINA LABOUR STATISTICAL YEARBOOK
2004
国家统计局人口和就业统计司
劳动和社会保障部规划财务司
Com piled By
Departm ent of Population,
and Em ploym ent statistics
National Bureau of Statistics,P.R.C
Departm ent of Planning and Finance,
Ministry of Labour and Social Security,P.R.C

8/2/2019 China Labour Statistical Yearbook - 2004
http://slidepdf.com/reader/full/china-labour-statistical-yearbook-2004 2/464
主 任: 张为民
副主任: 王爱文 马京奎
编 委(以姓氏笔划为序):
李慧民 张志斌 陈群洲
刘旭刚 明瑞峰 孟灿文 梁尔卫
总 编 辑:李慧民
副总编辑:陈群洲
编辑工作人员(以姓氏笔划为序):
于 丛 王艺桥 王 飞 王玉斌 冯振君 邝 瑜
刘 娟 刘泽波 李 苏 李祥伟 郑洪艳 张 达
欧阳琼 杨建春 黄 为 荆永胜 黄玉霞

8/2/2019 China Labour Statistical Yearbook - 2004
http://slidepdf.com/reader/full/china-labour-statistical-yearbook-2004 3/464
《中国劳动统计年鉴─2004》是一部全面反映中华人民共和国劳动经济情况的资料性年刊。本刊收
集了 2003 年全国和各省、自治区、直辖市、香港特别行政区、澳门特别行政区的有关劳动统计数据。主
要指标还编有历年统计数据。
全书共分为 14个部分:1.综合;2.就业与失业;3.城镇单位就业人员和劳动报酬;4.国有单位就业人员和劳动报酬;5.城镇集体单位就业人员和劳动报酬;6.其他单位就业人员和劳动报酬;7.乡镇企业
就业人员;8.职业培训与技能鉴定;9.劳动关系;10.劳动保障监察;11.社会保障; 12.工会工作;13.
香港资料;14.澳门资料。书末还附有国外有关资料和主要指标解释。
参与本书编辑或提供资料的单位除国家统计局、劳动和社会保障部外,还有农业部和全国总工会。
本书资料的取得形式主要有国家和部门的报表统计、行政纪录和抽样调查。全国劳动力、就业人员
等资料是运用有关资料推算的,有的资料分项相加不等于总计。望读者使用时予以注意。
恳请广大读者对本书提出宝贵意见。
《中国劳动统计年鉴》编辑部
二 0 0 四 年 七 月
China Labour Statistical Yearbook 2004 is an annual statistics publication, which is comprehensively reported the labour
economic situation for 2003 and some main indicators series for historically years at nation and provinces, autonomous regions
and municipalities levels and parts of cities, Hong Kong Special Administrative Region and Macao Special Administrative Region
in People's Republic of China.
The book is organized into 14 parts, which are:1.General Survey; 2.Employment and Unemployment; 3.Employment and Earnings
in Urban Units; 4.Employment and Earnings in State-owned Units; 5.Employment and Earnings in Urban Collective-owned Units;
6.Employment and Earnings in Other Ownership Units; 7.Employment in Township and Village Enterprises; 8. Vocational Trainingand Skill Appraisal; 9.Labour Relation; 10.Labour and Social Security Inspection; 11.Social Security; 12.Trade Union Works;
13.Main Indicators of Hong Kong; 14.Main Indicators of Macao. In addition, Main Indicators of Other Countries and Explanatory
Notes for Major Indicators are provided in the end of the book.
Besides National Bureau of Statistical and Ministry of Labour and Social Security, Ministry of Agriculture and All-China
Federation of Trade Unions also participate in the compiling work of this book.
Data resources of this book mainly come from state and departments reporting system, administration records and sampling
surveys. Since the information of labor resources and employment for the whole country are calculated according to relevant
data, they are not equal to the add-results of all sub-items.
8/2/2019 China Labour Statistical Yearbook - 2004
http://slidepdf.com/reader/full/china-labour-statistical-yearbook-2004 4/464
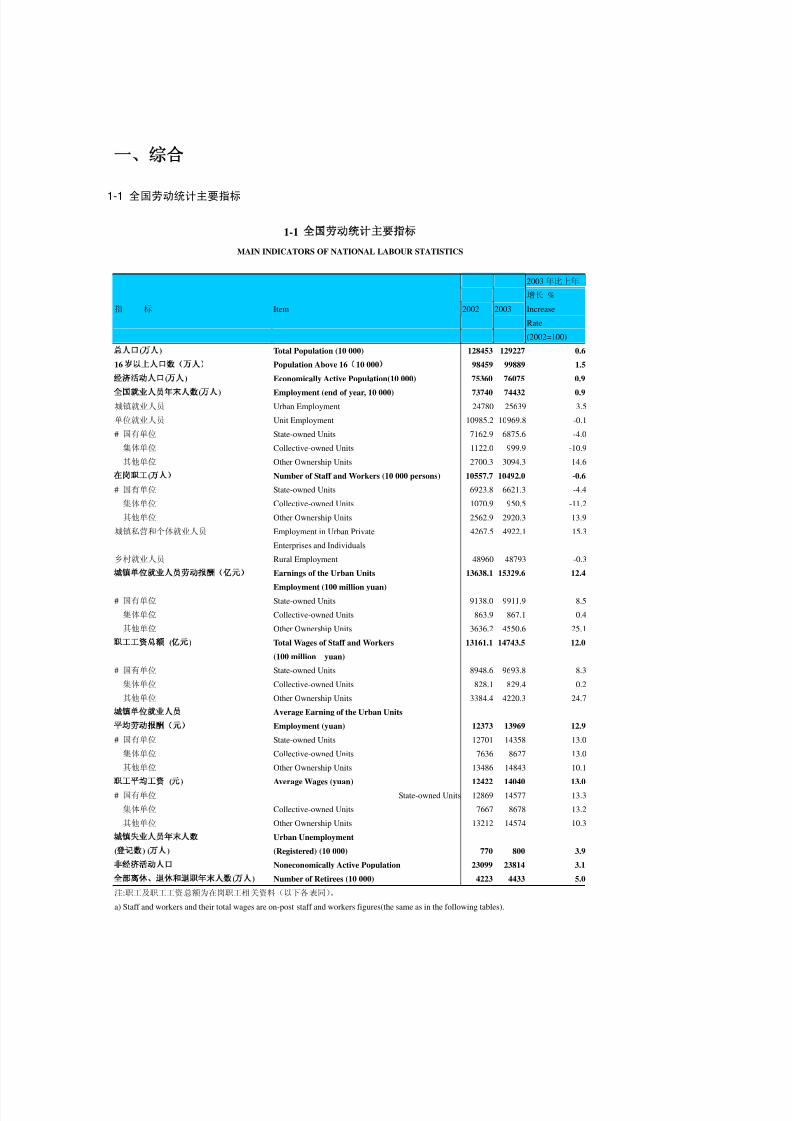
1-1 全国劳动统计主要指标
1-1
MAIN INDICATORS OF NATIONAL LABOUR STATISTICS
2003 年比上年
增长 %
指 标 Item 2002
2003
Increase
Rate
(2002=100)
( ) Total Population (10 000) 128453 129227 0.6
16 Population Above 16 10 000 98459 99889 1.5
( ) Economically Active Population(10 000) 75360 76075 0.9
( ) Employment (end of year, 10 000) 73740 74432 0.9
城镇就业人员 Urban Employment 24780 25639 3.5
单位就业人员 Unit Employment 10985.2 10969.8 -0.1
# 国有单位 State-owned Units 7162.9 6875.6 -4.0
集体单位 Collective-owned Units 1122.0 999.9 -10.9
其他单位 Other Ownership Units 2700.3 3094.3 14.6
( Number of Staff and Workers (10 000 persons) 10557.7 10492.0 -0.6
# 国有单位 State-owned Units 6923.8 6621.3 -4.4
集体单位 Collective-owned Units 1070.9 950.5 -11.2
其他单位 Other Ownership Units 2562.9 2920.3 13.9
城镇私营和个体就业人员 Employment in Urban Private 4267.5 4922.1 15.3
Enterprises and Individuals
乡村就业人员 Rural Employment 48960 48793 -0.3
Earnings of the Urban Units 13638.1 15329.6 12.4
Employment (100 million yuan)
# 国有单位 State-owned Units 9138.0 9911.9 8.5
集体单位 Collective-owned Units 863.9 867.1 0.4
其他单位 Other Ownership Units 3636.2 4550.6 25.1( ) Total Wages of Staff and Workers 13161.1 14743.5 12.0
(100 million yuan)
# 国有单位 State-owned Units 8948.6 9693.8 8.3
集体单位 Collective-owned Units 828.1 829.4 0.2
其他单位 Other Ownership Units 3384.4 4220.3 24.7
Average Earning of the Urban Units
Employment (yuan) 12373 13969 12.9
# 国有单位 State-owned Units 12701 14358 13.0
集体单位 Collective-owned Units 7636 8627 13.0
其他单位 Other Ownership Units 13486 14843 10.1
( ) Average Wages (yuan) 12422 14040 13.0
# 国有单位 State-owned Units 12869 14577 13.3
集体单位 Collective-owned Units 7667 8678 13.2
其他单位 Other Ownership Units 13212 14574 10.3
Urban Unemployment
( ) ( ) (Registered) (10 000) 770 800 3.9
Noneconomically Active Population 23099 23814 3.1
( ) Number of Retirees (10 000) 4223 4433 5.0
注:职工及职工工资总额为在岗职工相关资料(以下各表同)。
a) Staff and workers and their total wages are on-post staff and workers figures(the same as in the following tables).

8/2/2019 China Labour Statistical Yearbook - 2004
http://slidepdf.com/reader/full/china-labour-statistical-yearbook-2004 5/464
1-2 人口数及构成
1-2
( )
POPULATION AND COMPOSITION
(End of Year)
总 人 口 按 性 别 分 Grouped by Sex 按 城 乡 分 Grouped by Residence
(万 人)
年 份 Total男 Male 女 Female 市镇总人口数 Urban 乡村总人口数 Rural
Population 人 口 数 比 重(%) 人 口 数 比 重(%) 人 口 数 比 重(%) 人 口 数 比 重(%)
Year (10 000
persons) Population Proportion Population Proportion Population Proportion Population Proportion
1952 57482 29833 51.90 27649 48.10 7163 12.5 50319 87.5
1957 64653 33469 51.77 31184 48.23 9949 15.4 54704 84.6
1962 67295 34517 51.29 32778 48.71 11659 17.3 55636 82.7
1965 72538 37128 51.18 35410 48.82 13045 18.0 59493 82.01970 82992 42686 51.43 40306 48.57 14424 17.4 68568 82.6
1971 85229 43819 51.41 41410 48.59 14711 17.3 70518 82.7
1972 87177 44813 51.40 42364 48.60 14935 17.1 72242 82.9
1973 89211 45876 51.42 43335 48.58 15345 17.2 73866 82.8
1974 90859 46727 51.43 44132 48.57 15595 17.2 75264 82.8
1975 92420 47564 51.47 44856 48.53 16030 17.3 76390 82.7
1976 93717 48257 51.49 45460 48.51 16341 17.4 77376 82.6
1977 94974 48908 51.50 46066 48.50 16669 17.6 78305 82.4
1978 96259 49567 51.49 46692 48.51 17245 17.9 79014 82.1
1979 97542 50192 51.46 47350 48.54 18495 19.0 79047 81.0
1980 98705 50785 51.45 47920 48.55 19140 19.4 79565 80.6
1981 100072 51519 51.48 48553 48.52 20171 20.2 79901 79.8
1982 101654 52352 51.50 49302 48.50 21480 21.1 80174 78.9
1983 103008 53152 51.60 49856 48.40 22274 21.6 80734 78.4
1984 104357 53848 51.60 50509 48.40 24017 23.0 80340 77.0
1985 105851 54725 51.70 51126 48.30 25094 23.7 80757 76.3
1986 107507 55581 51.70 51926 48.30 26366 24.5 81141 75.5
1987 109300 56290 51.50 53010 48.50 27674 25.3 81626 74.7
1988 111026 57201 51.52 53825 48.48 28661 25.8 82365 74.2
1989 112704 58099 51.55 54605 48.45 29540 26.2 83164 73.8
1990 114333 58904 51.52 55429 48.48 30195 26.4 84138 73.6
1991 115823 59466 51.34 56357 48.66 31203 26.9 84620 73.1
1992 117171 59811 51.05 57360 48.95 32175 27.5 84996 72.5
1993 118517 60472 51.02 58045 48.98 33173 28.0 85344 72.0
1994 119850 61246 51.10 58604 48.90 34169 28.5 85681 71.5
1995 121121 61808 51.03 59313 48.97 35174 29.0 85947 71.0
1996 122389 62200 50.82 60189 49.18 37304 30.5 85085 69.5
1997 123626 63131 51.07 60495 48.93 39449 31.9 84177 68.1
1998 124761 63604 50.98 61157 49.02 41608 33.4 83153 66.6
1999 125786 64126 50.98 61660 49.02 43748 34.8 82038 65.2
2000 126743 65437 51.63 61306 48.37 45906 36.2 80837 63.8
2001 127627 65672 51.46 61955 48.54 48064 37.7 79563 62.3
2002 128453 66115 51.47 62338 48.53 50212 39.1 78241 60.9
2003 129227 66556 51.50 62671 48.50 52376 40.5 76851 59.5
8/2/2019 China Labour Statistical Yearbook - 2004
http://slidepdf.com/reader/full/china-labour-statistical-yearbook-2004 6/464
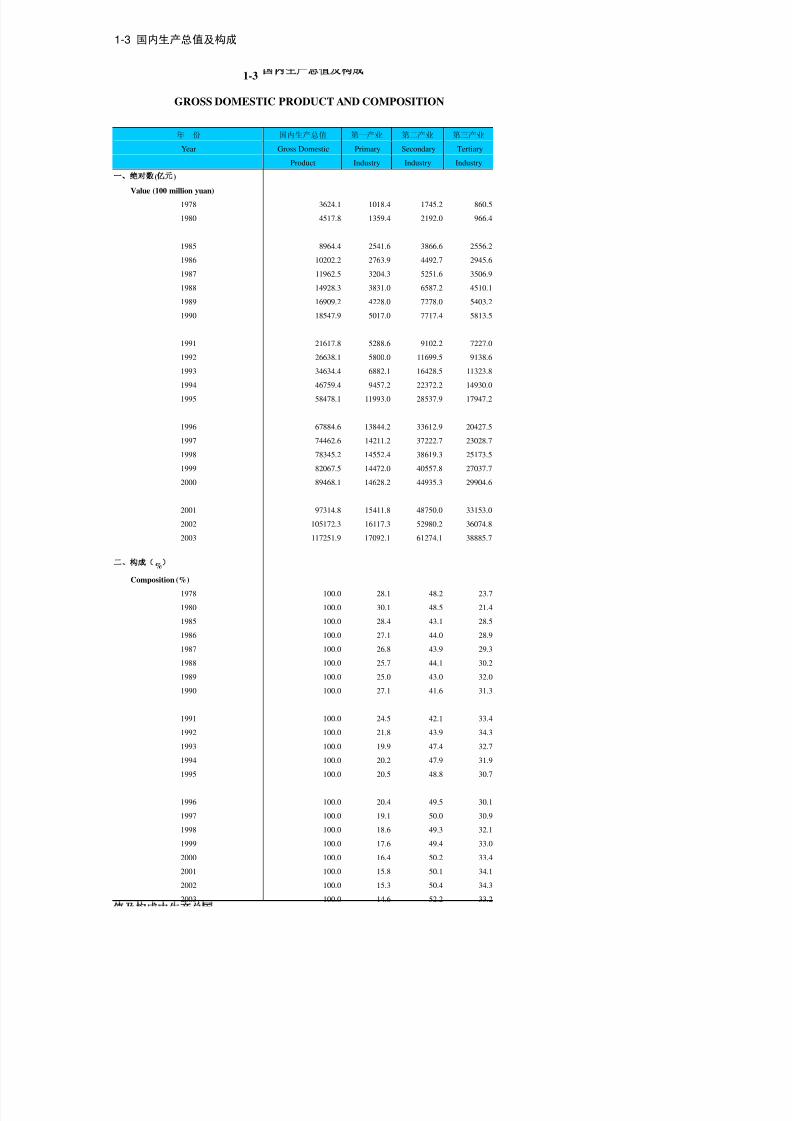
1-3 国内生产总值及构成
1-3
GROSS DOMESTIC PRODUCT AND COMPOSITION
年 份 国内生产总值 第一产业 第二产业 第三产业
Year Gross Domestic Primary Secondary Tertiary
Product Industry Industry Industry
( )
Value (100 million yuan)
1978 3624.1 1018.4 1745.2 860.5
1980 4517.8 1359.4 2192.0 966.4
1985 8964.4 2541.6 3866.6 2556.2
1986 10202.2 2763.9 4492.7 2945.6
1987 11962.5 3204.3 5251.6 3506.9
1988 14928.3 3831.0 6587.2 4510.1
1989 16909.2 4228.0 7278.0 5403.2
1990 18547.9 5017.0 7717.4 5813.5
1991 21617.8 5288.6 9102.2 7227.0
1992 26638.1 5800.0 11699.5 9138.6
1993 34634.4 6882.1 16428.5 11323.8
1994 46759.4 9457.2 22372.2 14930.0
1995 58478.1 11993.0 28537.9 17947.2
1996 67884.6 13844.2 33612.9 20427.5
1997 74462.6 14211.2 37222.7 23028.7
1998 78345.2 14552.4 38619.3 25173.5
1999 82067.5 14472.0 40557.8 27037.7
2000 89468.1 14628.2 44935.3 29904.6
2001 97314.8 15411.8 48750.0 33153.0
2002 105172.3 16117.3 52980.2 36074.8
2003 117251.9 17092.1 61274.1 38885.7
%
Composition (%)
1978 100.0 28.1 48.2 23.7
1980 100.0 30.1 48.5 21.4
1985 100.0 28.4 43.1 28.5
1986 100.0 27.1 44.0 28.9
1987 100.0 26.8 43.9 29.3
1988 100.0 25.7 44.1 30.2
1989 100.0 25.0 43.0 32.0
1990 100.0 27.1 41.6 31.3
1991 100.0 24.5 42.1 33.4
1992 100.0 21.8 43.9 34.3
1993 100.0 19.9 47.4 32.7
1994 100.0 20.2 47.9 31.9
1995 100.0 20.5 48.8 30.7
1996 100.0 20.4 49.5 30.1
1997 100.0 19.1 50.0 30.9
1998 100.0 18.6 49.3 32.1
1999 100.0 17.6 49.4 33.0
2000 100.0 16.4 50.2 33.4
2001 100.0 15.8 50.1 34.1
2002 100.0 15.3 50.4 34.3
2003 100.0 14.6 52.2 33.2

8/2/2019 China Labour Statistical Yearbook - 2004
http://slidepdf.com/reader/full/china-labour-statistical-yearbook-2004 7/464
1-4
1-4
INDICES OF GROSS DOMESTIC PRODUCT, AVERAGE WAGE
AND URBAN CONSUMER PRICE INDEX
(上年=100) (Preceding year=100)
国内生产 就业人员平均劳动报酬指数 职工平均工资指数 城镇居民消
总值指数 Index of Average Earning Index of Average Wage 费价格指数
of Employment of Staff and Workers
年 份 Year Indices of 货币报酬指数 实际报酬指数 货币工资指数 实际工资指数 Urban
Gross Domestic Consumer
Product Money Earning Real Earning Money Wage Real Wage Price Index
1979 107.6 - - 108.6 106.7 101.9
1980 107.8 - - 114.1 106.1 107.5
1981 105.2 - - 101.3 98.9 102.5
1982 109.1 - - 103.4 101.5 102.0
1983 110.9 - - 103.5 101.4 102.0
1984 115.2 - - 117.9 114.7 102.7
1985 113.5 - - 117.9 105.3 111.9
1986 108.8 - - 115.8 108.3 107.0
1987 111.6 - - 109.8 101.0 108.8
1988 111.3 - - 119.7 99.2 120.7
1989 104.1 - - 110.8 95.2 116.3
1990 103.8 - - 110.6 109.2 101.3
1991 109.2 - - 109.3 104.0 105.1
1992 114.2 - - 115.9 106.7 108.6
1993 113.5 - - 124.3 107.1 116.1
1994 112.6 - - 134.6 107.7 125.0
1995 110.5 118.9 101.8 121.2 103.8 116.8
1996 109.6 111.8 102.8 112.9 103.8 108.8
1997 108.8 107.8 104.5 104.2 101.1 103.1
1998 107.8 115.5 116.2 106.6 107.2 99.4
1999 107.1 111.7 113.2 111.6 113.1 98.7
2000 108.0 112.2 111.3 112.3 111.4 100.8
2001 107.5 116.1 115.3 116.0 115.2 100.7
2002 108.3 114.2 115.4 114.3 115.5 99.0
2003 109.1 112.9 111.9 113.0 112.0 100.9

8/2/2019 China Labour Statistical Yearbook - 2004
http://slidepdf.com/reader/full/china-labour-statistical-yearbook-2004 8/464
1-5
1-5
NUMBER OF EMPLOYMENT
End of Year)
单位: 万人 (10 000 persons)
就业人员 城 镇 乡 村 按三次产业分 构成(以合计为 100)
年 份 Employment 就业人员 就业人员
合 计 占人口% Urban Rural Group by Industry Percentage(total=100)
Year Percentage 第一产业 第二产业 第三产业 第一产业 第二产业 第三产业
Total of Total Employment Employment Primary Secondary Tertiary Primary Secondary Tertiary
Population Industry Industry Industry Industry Industry Industry
1952 20729 36.1 2486 18243 17317 1531 1881 83.5 7.4 9.1
1957 23771 36.8 3205 20566 19309 2142 2320 81.2 9.0 9.8
1962 25910 38.5 4537 21373 21276 2059 2575 82.1 8.0 9.9
1965 28670 39.5 5136 23534 23396 2408 2866 81.6 8.4 10.0
1970 34432 41.5 6312 28120 27811 3518 3103 80.8 10.2 9.0
1971 35620 41.8 6868 28752 28397 3990 3233 79.7 11.2 9.1
1972 35854 41.1 7200 28654 28283 4276 3295 78.9 11.9 9.2
1973 36652 41.1 7388 29264 28857 4492 3303 78.7 12.3 9.0
1974 37369 41.1 7687 29682 29218 4712 3439 78.2 12.6 9.2
1975 38168 41.3 8222 29946 29456 5152 3560 77.2 13.5 9.3
1976 38834 41.4 8692 30142 29443 5611 3780 75.8 14.5 9.7
1977 39377 41.5 9127 30250 29340 5831 4206 74.5 14.8 10.7
1978 40152 41.7 9514 30638 28318 6945 4890 70.5 17.3 12.2
1979 41024 42.1 9999 31025 28634 7214 5177 69.8 17.6 12.6
1980 42361 42.9 10525 31836 29122 7707 5532 68.7 18.2 13.1
1981 43725 43.7 11053 32672 29777 8003 5945 68.1 18.3 13.6
1982 45295 44.6 11428 33867 30859 8346 6090 68.1 18.4 13.5
1983 46436 45.1 11746 34690 31151 8679 6606 67.1 18.7 14.2
1984 48197 46.2 12229 35968 30868 9590 7739 64.0 19.9 16.1
1985 49873 47.1 12808 37065 31130 10384 8359 62.4 20.8 16.8
1986 51282 47.7 13292 37990 31254 11216 8811 60.9 21.9 17.2
1987 52783 48.3 13783 39000 31663 11726 9395 60.0 22.2 17.8
1988 54334 48.9 14267 40067 32249 12152 9933 59.3 22.4 18.3
1989 55329 49.1 14390 40939 33225 11976 10129 60.1 21.6 18.3
1990 64749 56.6 17041 47708 38914 13856 11979 60.1 21.4 18.5
1991 65491 56.5 17465 48026 39098 14015 12378 59.7 21.4 18.9
1992 66152 56.5 17861 48291 38699 14355 13098 58.5 21.7 19.8
1993 66808 56.4 18262 48546 37680 14965 14163 56.4 22.4 21.2
1994 67455 56.3 18653 48802 36628 15312 15515 54.3 22.7 23.0
1995 68065 56.2 19040 49025 35530 15655 16880 52.2 23.0 24.8
1996 68950 56.3 19922 49028 34820 16203 17927 50.5 23.5 26.0
1997 69820 56.5 20781 49039 34840 16547 18432 49.9 23.7 26.4
1998 70637 56.6 21616 49021 35177 16600 18860 49.8 23.5 26.7
1999 71394 56.8 22412 48982 35768 16421 19205 50.1 23.0 26.9
2000 72085 56.9 23151 48934 36043 16219 19823 50.0 22.5 27.5
2001 73025 57.2 23940 49085 36513 16284 20228 50.0 22.3 27.7
2002 73740 57.4 24780 48960 36870 15780 21090 50.0 21.4 28.6
2003 74432 57.6 25639 48793 36546 16077 21809 49.1 21.6 29.3
注:1990 年至 2000 年,就业人员总计、城镇和乡村就业人员小计资料根据第五次全国人口普查资料重新调整,2001 年及以后资料根据
人口变动抽样调查资料推算,因此分地区、分类型、分行业的资料相加不等于总计(下表同)。a)From 1990 to 2000, the total employed persons and the sub-total of employed persons in urban and rural areas
have been adjusted in accordance with the data obtained from the 5th National Population Census.Figures after
2001 are calculated according to the Population Changement Sampling Survey. As a result,the sum of the data
by region, by ownership or by sector is not equal to the total.The same as in the following tables.

8/2/2019 China Labour Statistical Yearbook - 2004
http://slidepdf.com/reader/full/china-labour-statistical-yearbook-2004 9/464
1-6
1-6
EMPLOYMENT BY SECTOR
单位:万人 (10 000 persons)
农、 林、 电力、煤气 地质勘查 交通运输、
牧、 渔业 采掘业 制造业 及水的生产 建筑业 业、水利 仓储及邮
合 计 和供应业 管 理 业 电通信业
年份 Farming, Mining Manufac- Production Constr- Geological Transport,
Total Forestry, and turing and Supply uction Prospect- Storage,
Year Animal Quarrying of Elec- ing & Water Post and
Husbandry tricity, Conservan- Telecommu-
and Fishery Gas and cy nications
Water
1978 40152 28318 652 5332 107 854 178 750
1980 42361 29122 697 5899 118 993 188 805
1985 49873 31130 795 7412 142 2035 197 1279
1986 51282 31254 809 8019 152 2236 197 1376
1987 52783 31663 819 8359 164 2384 200 1453 1988 54334 32249 832 8652 177 2491 204 1521
1989 55329 33225 842 8547 180 2407 199 1522
1990 64749 34117 882 8624 192 2424 197 1566
1991 65491 34956 905 8839 203 2482 199 1617
1992 66152 34795 898 9106 215 2660 202 1674
1993 66808 33966 932 9295 240 3050 144 1688
1994 67455 33386 915 9613 246 3188 139 1864
1995 68065 33018 932 9803 258 3322 135 1942
1996 68950 32909 902 9763 273 3408 129 2013
1997 69820 33095 868 9612 283 3449 129 2062
1998 70637 33232 721 8319 283 3327 116 2000
1999 71394 33493 667 8109 285 3412 111 2022
2000 72085 33355 597 8043 284 3552 110 2029
2001 73025 32974 561 8083 288 3669 105 2037
2002 73740 32487 558 8307 290 3893 98 2084
1-6 续表 continued
单位:万人 (10 000 persons)
批发和零 金融、 房 地 社会 卫生、体 教育、文化 科学研究 国家机关
售贸易、 育和社会 艺术和广播 和综合技 政党机关和
餐饮业 保险业 产 业 服务业 福利业 电影电视业 术服务业 社会团体 其他
年份 Wholesale
Health Education, Scientific Government
and Finance Real Social Care, Culture Research Agencies, Others
Year Retail and Estate Services Sporting and Arts, and Party Age-
Trade & Insurance Trade and Radio, Polytech- ncies and
Catering Social Film and nical Social Or-
Services Welfare Television Services ganizations
1978 1140 76 31 179 363 1093 92 467 521
1980 1363 99 37 276 389 1147 113 527 588
1985 2306 138 36 401 467 1273 144 799 1319
1986 2413 152 38 466 482 1324 152 873 1338
1987 2576 170 39 501 496 1375 158 925 1502
1988 2743 194 42 534 508 1403 161 971 1655
1989 2770 205 43 550 518 1426 165 1022 1709
1990 2839 218 44 594 536 1457 173 1079 1798
1991 2998 234 48 604 553 1497 179 1136 1910
1992 3209 248 54 643 565 1520 183 1148 2313
1993 3459 270 66 543 416 1210 173 1030 3740
1994 3921 264 74 626 434 1436 178 1033 4155
1995 4292 276 80 703 444 1476 182 1042 4484
1996 4511 292 84 747 458 1513 183 1093 4563
1997 4795 308 87 810 471 1557 186 1093 4862
1998 4645 314 94 868 478 1573 178 1097 5118
1999 4751 328 96 923 482 1568 173 1102 4969
2000 4686 327 100 921 488 1565 174 1104 5643
2001 4737 336 107 976 493 1568 165 1101 5852

8/2/2019 China Labour Statistical Yearbook - 2004
http://slidepdf.com/reader/full/china-labour-statistical-yearbook-2004 10/464
2002 4969 340 118 1094 493 1565 163 1075 6245
1-7
1-7
URBAN UNITS EMPLOYMENT BY SECTOR AND REGION
(2003)
单位:万人 (10 000 persons)
合 计 农、林、 采矿业 制造业 电力、燃气 建筑业
牧、渔业 及水的生产
和供应业
Total Agriculture, Mining Manufac- Production Construc-
地 区 Region Forestry, turing and Distri- tion
Farming of bution of
Animals Electricity,
and Gas and
Fishery Water
National 10969.7 484.5 488.3 2980.5 297.6 833.7
北 京 Beijing 491.2 2.9 2.5 102.2 3.8 65.1
天 津 Tianjin 191.0 1.0 7.0 77.1 3.5 9.9
河 北 Hebei 499.2 9.1 28.1 126.7 16.8 33.1
山 西 Shanxi 356.9 4.1 56.9 76.1 11.5 20.9
内 蒙 古 Inner Mongolia 244.4 32.3 16.9 45.0 8.9 13.0
辽 宁 Liaoning 500.2 26.8 30.7 151.1 17.0 30.9
吉 林 Jilin 291.9 20.9 15.0 73.9 8.1 16.5
黑 龙 江 Heilongjiang 515.3 89.7 38.7 113.7 15.6 40.6
上 海 Shanghai 342.1 1.7 0.0 127.0 5.6 14.1
江 苏 Jiangsu 608.5 18.1 16.6 225.5 12.7 26.4
浙 江 Zhejiang 392.8 2.7 1.7 111.5 9.0 51.9
安 徽 Anhui 354.6 12.2 29.6 79.5 8.7 29.2
福 建 Fujian 344.6 7.8 3.6 153.9 8.1 26.4
江 西 Jiangxi 267.7 16.6 9.8 60.7 9.3 18.1
山 东 Shandong 778.5 9.4 60.8 272.0 20.5 38.7
河 南 Henan 701.7 9.6 48.7 159.9 23.1 61.7
湖 北 Hubei 502.4 30.5 11.2 149.1 12.7 30.1
湖 南 Hunan 401.6 18.1 12.2 80.0 11.4 31.2
广 东 Guangdong 781.1 13.2 4.0 283.8 19.6 54.6
广 西 Guangxi 271.7 14.1 4.8 57.6 8.3 16.8
海 南 Hainan 73.5 20.5 1.2 7.0 2.0 4.5
重 庆 Chongqing 210.2 2.5 7.1 54.9 5.8 31.0
四 川 Sichuan 505.7 11.3 19.2 119.4 15.6 72.4
贵 州 Guizhou 197.5 4.4 9.0 42.4 6.0 18.6
云 南 Yunnan 253.3 17.6 5.9 46.9 7.1 17.3
西 藏 Tibet 17.4 0.5 0.2 1.0 0.7 0.8
陕 西 Shaanxi 330.3 6.6 17.3 88.6 8.5 20.4
甘 肃 Gansu 195.4 8.7 7.8 48.1 7.1 15.6
青 海 Qinghai 42.7 2.3 1.9 6.8 1.7 2.9
宁 夏 Ningxia 61.6 4.4 6.2 12.0 3.1 4.4
新 疆 Xinjiang 244.7 65.2 13.9 26.9 5.6 16.5

8/2/2019 China Labour Statistical Yearbook - 2004
http://slidepdf.com/reader/full/china-labour-statistical-yearbook-2004 11/464
1-8
1-8
URBAN EMPLOYMENT AND COMPOSITION BY
REGISTRATION STATUS AND REGION
(2003)单位:万人 (10 000 persons)
合 计 国 有 集 体 其 他 私营企业 构成 (以合计为 100)
单 位 单 位 单 位 个 体 Composition(Total=100)
国 有 集 体 其 他 私营企业
地 区 Region Total State- Collective- Other Private 单 位 单 位 单 位 个 体
owned owned Owner- Enter- State- Collective- Other Private
Units Units ship prises, owned owned Owner- Enterpri-
Units Indivi- Units Units ship ses, In-
duals Units dividuals
National 25639.0 6875.6 999.9 3094.3 4922.1 43.6 6.3 19.6 30.4
北 京 Beijing 689.0 212.8 30.0 248.4 197.8 30.9 4.4 36.1 28.7
天 津 Tianjin 246.0 90.7 14.0 86.4 54.9 36.9 5.7 35.1 22.3
河 北 Hebei 641.5 373.6 42.9 82.8 142.2 58.2 6.7 12.9 22.2
山 西 Shanxi 456.7 254.7 39.0 63.2 99.8 55.8 8.5 13.8 21.8
内 蒙 古 Inner Mongolia 352.9 169.2 15.8 59.4 108.5 47.9 4.5 16.8 30.8
辽 宁 Liaoning 844.9 317.8 50.2 132.1 344.8 37.6 5.9 15.6 40.8
吉 林 Jilin 375.6 207.6 28.2 56.1 83.7 55.3 7.5 14.9 22.3
黑 龙 江 Heilongjiang 686.2 342.7 55.9 116.6 171.0 49.9 8.1 17.0 24.9
0.0
上 海 Shanghai 521.5 163.7 21.1 157.3 179.4 31.4 4.0 30.2 34.4
江 苏 Jiangsu 961.2 317.4 55.1 236.0 352.7 33.0 5.7 24.6 36.7
浙 江 Zhejiang 742.0 179.0 32.2 181.6 349.2 24.1 4.3 24.5 47.1
安 徽 Anhui 554.2 222.0 43.2 89.4 199.6 40.1 7.8 16.1 36.0
福 建 Fujian 473.0 152.5 24.4 167.7 128.4 32.2 5.2 35.5 27.1
江 西 Jiangxi 383.9 204.4 21.1 42.2 116.2 53.2 5.5 11.0 30.3
山 东 Shandong 1132.3 496.7 75.6 206.2 353.8 43.9 6.7 18.2 31.2
河 南 Henan 840.7 398.6 116.5 186.6 139.0 47.4 13.9 22.2 16.5
湖 北 Hubei 704.8 341.2 40.1 121.1 202.4 48.4 5.7 17.2 28.7
湖 南 Hunan 601.6 313.2 34.4 54.1 199.9 52.1 5.7 9.0 33.2
广 东 Guangdong 1295.0 376.5 78.5 326.1 513.9 29.1 6.1 25.2 39.7
广 西 Guangxi 385.1 200.9 23.0 47.8 113.4 52.2 6.0 12.4 29.4
海 南 Hainan 113.5 58.6 4.1 10.8 40.0 51.6 3.6 9.5 35.3
重 庆 Chongqing 319.4 124.4 19.4 66.5 109.1 39.0 6.1 20.8 34.2
四 川 Sichuan 690.0 327.8 50.9 127.0 184.3 47.5 7.4 18.4 26.7
贵 州 Guizhou 243.4 148.4 14.4 34.6 46.0 61.0 5.9 14.2 18.9
云 南 Yunnan 346.9 187.7 16.0 49.6 93.6 54.1 4.6 14.3 27.0
西 藏 Tibet 27.0 16.1 0.5 0.7 9.7 59.7 1.9 2.6 35.9
陕 西 Shaanxi 515.1 254.4 24.8 51.1 184.8 49.4 4.8 9.9 35.9
甘 肃 Gansu 253.6 159.6 15.8 20.1 58.1 62.9 6.2 7.9 22.9
青 海 Qinghai 73.7 34.5 2.5 5.7 31.0 46.8 3.4 7.7 42.1
宁 夏 Ningxia 82.2 40.0 2.3 19.3 20.6 48.7 2.8 23.5 25.0
新 疆 Xinjiang 339.0 188.9 8.0 47.8 94.3 55.7 2.4 14.1 27.8

8/2/2019 China Labour Statistical Yearbook - 2004
http://slidepdf.com/reader/full/china-labour-statistical-yearbook-2004 12/464
1-9
1-9
EMPLOYMENT IN URBAN UNITS BY SECTOR
(End of Year)
单位:万人 (10 000 persons)
农、林、 电力、煤气 地质勘查 交通运输、
牧、渔业 采掘业 制造业 及水的生产 建筑业 业、水利 仓储及邮
合 计 和供应业 管理业 电通信业
年份 Farming, Mining Manufac- Production Constru- Geological Transport,
Total Forestry, and and Supply Prospect- Storage,
Year Animal Quarrying turing of Elec- ction ing and Post and
Husbandry tricity, Water Telecommu-
and Fishery Gas and Conservan- nications
Water cy
1994 15258.5 690.6 914.6 5491.6 245.9 1112.3 138.6 859.8
1995 15300.8 669.4 921.4 5493.1 257.9 1090.1 134.6 848.5 1996 15221.1 631.3 891.8 5344.0 272.8 1069.7 128.9 853.2
1997 15036.2 629.2 856.8 5129.9 283.3 1037.4 129.0 850.5
1998 12695.7 562.5 707.3 3826.1 282.9 878.1 116.2 721.5
1999 12130.2 536.5 655.2 3554.3 285.0 814.8 111.4 704.2
2000 11612.5 516.4 585.2 3300.7 283.8 780.1 110.2 680.4
2001 11165.8 483.2 548.2 3070.1 287.8 774.0 104.9 651.6
2002 10985.2 455.2 542.7 2980.7 289.6 803.2 97.7 639.5
1-9 续表 continued
单位:万人 (10 000 persons)
批发和零 金融、 房 地 社 会 卫生、体 教育、文化 科学研究 国家机关
售贸易、 育和社会 艺术和广播 和综合技 政党机关和
餐饮业 保险业 产 业 服务业 福利业 电影电视业 术服务业 社会团体 其 他
年份 Wholesale Health Education, Scientific Government
and Finance Real Social Care, Culture Research Agencies, Others
Year Retail and Estate Services Sporting and Arts, and Party Age-
Trade & Insurance Trade and Radio, Polytech- ncies and
Catering Social Film and nical Social Or-
Services Welfare Television Services ganizations
1994 1863.6 264.0 74.4 458.9 433.6 1435.9 177.5 1032.9 64.5
1995 1855.9 276.3 79.6 461.4 444.3 1476.1 181.9 1041.7 68.8
1996 1830.0 291.9 84.3 472.1 457.5 1512.6 182.7 1092.6 105.8
1997 1796.1 308.2 86.9 494.3 471.1 1556.7 185.8 1093.1 127.8
1998 1286.6 313.5 93.7 470.4 477.7 1573.3 177.5 1096.5 111.9
1999 1141.5 328.5 96.6 476.0 482.0 1567.8 173.6 1102.1 100.9
2000 1009.5 326.8 100.4 483.5 488.1 1565.8 174.5 1103.8 103.1
2001 874.2 335.9 107.5 491.4 493.0 1567.9 165.0 1100.9 110.1
2002 774.5 339.8 118.4 521.0 493.2 1565.1 162.7 1074.7 127.0

8/2/2019 China Labour Statistical Yearbook - 2004
http://slidepdf.com/reader/full/china-labour-statistical-yearbook-2004 13/464
1-10
1-10
FEMALE EMPLOYMENT IN URBAN UNITS BY REGISTRATION
STATUS AND REGION
(End of Year)单位:万人 (10 000 persons)
合 计 国 有 城镇集体 其 他
年份 地区 单 位 单 位 单 位
State-owned Urban Other
Year Region Total Collective- Ownership
Units owned Units Units
1994 5799.1 3982.5 1451.1 364.5
1995 5889.0 4059.0 1399.0 431.0
1996 5883.3 4088.3 1337.8 457.3
1997 5824.8 4030.2 1271.0 523.6
1999 4613.4 3128.0 702.8 782.7
2000 4411.3 2952.5 605.8 853.0
2001 4225.7 2788.2 509.9 927.5
2002 4156.2 2627.7 436.9 1091.5
2003 4156.1 2529.6 383.9 1242.6
北 京 Beijing 177.8 83.9 9.0 84.9
天 津 Tianjin 76.3 34.1 5.3 36.9
河 北 Hebei 193.6 147.1 15.8 30.7
山 西 Shanxi 126.3 91.2 15.8 19.3
内 蒙 古 Inner Mongolia 92.6 64.1 7.4 21.1
辽 宁 Liaoning 191.3 118.5 21.7 51.2
吉 林 Jilin 113.3 78.5 13.7 21.1
黑 龙 江 Heilongjiang 183.7 124.8 21.0 37.9
上 海 Shanghai 135.0 60.7 8.9 65.3
江 苏 Jiangsu 243.0 113.1 23.2 106.7
浙 江 Zhejiang 150.3 70.2 11.6 68.6
安 徽 Anhui 119.9 74.3 16.4 29.1
福 建 Fujian 151.3 55.8 8.2 87.3
江 西 Jiangxi 93.5 68.9 7.4 17.1
山 东 Shandong 313.0 179.8 33.2 100.0
河 南 Henan 262.5 147.5 48.5 66.5
湖 北 Hubei 197.6 127.5 15.1 55.0
湖 南 Hunan 142.6 111.3 11.8 19.6
广 东 Guangdong 335.2 145.8 28.5 160.9
广 西 Guangxi 103.5 77.4 7.5 18.6
海 南 Hainan 28.7 22.7 1.5 4.5
重 庆 Chongqing 70.8 43.7 6.5 20.6
四 川 Sichuan 172.5 115.6 15.6 41.3
贵 州 Guizhou 65.3 49.5 4.4 11.5
云 南 Yunnan 93.0 70.3 5.5 17.2
西 藏 Tibet 5.8 5.4 0.2 0.2
陕 西 Shaanxi 115.9 88.0 10.3 17.6
甘 肃 Gansu 64.1 52.0 5.1 6.9
青 海 Qinghai 15.5 12.5 1.0 2.0
宁 夏 Ningxia 21.9 14.9 0.9 6.2
新 疆 Xinjiang 100.3 80.5 2.8 17.1

8/2/2019 China Labour Statistical Yearbook - 2004
http://slidepdf.com/reader/full/china-labour-statistical-yearbook-2004 14/464
1-11
1-11
FEMALE EMPLOYMENT IN URBAN UNITS BY SECTOR
(End of Year)
单位:万人 (10 000 persons)
农、林、 电力、煤气 地质勘查 交通运输、
牧、渔业 采掘业 制造业 及水的生产 建筑业 业、水利 仓储及邮
合 计 和供应业 管理业 电通信业
年份 Farming, Mining Manufac- Production Constru- Geological Transport,
Total Forestry, and and Supply Prospect- Storage,
Year Animal Quarrying turing of Elec- ction ing and Post and
Husbandry tricity, Water Telecommu-
and Fishery Gas and Conservan- nications
Water cy
1994 5799.1 259.3 229.4 2460.7 75.8 205.9 34.3 219.7
1995 5889.0 252.6 238.9 2482.1 81.1 207.1 33.5 221.5 1996 5883.3 237.8 233.4 2391.7 86.3 208.1 32.2 227.9
1997 5824.8 238.4 222.5 2286.3 90.3 203.6 32.6 232.1
1999 4613.4 201.5 173.6 1541.9 91.6 150.8 29.4 197.2
2000 4411.3 195.6 152.8 1425.3 91.0 144.0 29.5 193.3
2001 4225.7 181.0 138.5 1318.4 91.7 136.8 28.4 184.4
2002 4156.2 169.0 137.2 1282.8 91.4 137.2 26.4 180.8
1-11 续表 continued
单位:万人 (10 000 persons)
批发和零 金融、 房 地 社 会 卫生、体 教育、文化 科学研究 国家机关
售贸易、 育和社会 艺术和广播 和综合技 政党机关和
餐饮业 保险业 产 业 服务业 福利业 电影电视业 术服务业 社会团体 其 他
年份 Wholesale
Health Education, Scientific Government
and Finance Real Social Care, Culture Research Agencies, Others
Year Retail and Estate Services Sporting and Arts, and Party Age-
Trade & Insurance Trade and Radio, Polytech- ncies and
Catering Social Film and nical Social Or-
Services Welfare Television Services ganizations
1994 853.5 104.5 24.3 213.1 239.1 561.3 60.5 234.3 23.4
1995 858.3 111.3 26.6 215.2 247.5 588.0 61.4 238.3 25.6
1996 855.3 120.1 28.9 221.6 257.0 622.1 61.8 258.6 40.5
1997 841.2 128.1 30.4 230.4 265.6 650.3 62.7 257.9 52.4
1999 528.0 140.4 32.6 211.5 274.4 680.6 57.1 266.1 36.7
2000 461.2 141.2 34.2 210.4 278.2 689.3 57.9 268.8 38.5
2001 394.1 149.6 36.1 209.7 283.5 704.5 54.1 273.5 41.4
2002 347.5 155.9 40.4 217.0 286.0 712.9 54.4 271.2 46.0

8/2/2019 China Labour Statistical Yearbook - 2004
http://slidepdf.com/reader/full/china-labour-statistical-yearbook-2004 15/464
1-12
1-12
FEMALE EMPLOYMENT IN URBAN UNITS BY SECTOR AND REGION
(2003)
单位:万人 (10 000 persons)
合 计 农、林、 采矿业 制造业 电力、燃气 建筑业
牧、渔业 及水的生产
和供应业
Total Agriculture, Mining Manufac- Production Construc-
地 区 Region Forestry, turing and Distri- tion
Farming of bution of
Animals Electricity,
and Gas and
Fishery Water
National 4156.1 176.1 119.7 1292.7 92.7 128.4
北 京 Beijing 177.8 1.1 0.5 38.8 1.2 6.4
天 津 Tianjin 76.3 0.3 2.3 33.2 0.9 2.1
河 北 Hebei 193.6 3.1 6.1 50.4 4.8 5.2
山 西 Shanxi 126.3 1.2 11.2 27.6 3.7 4.0
内 蒙 古 Inner Mongolia 92.6 11.3 4.7 18.2 3.0 2.8
辽 宁 Liaoning 191.3 10.8 6.9 57.6 5.0 7.8
吉 林 Jilin 113.3 7.0 3.8 29.9 2.2 4.5
黑 龙 江 Heilongjiang 183.7 29.9 7.8 43.3 4.7 9.9
上 海 Shanghai 135.0 0.4 51.5 1.5 2.2
江 苏 Jiangsu 243.0 6.8 4.5 105.3 3.4 4.2
浙 江 Zhejiang 150.3 0.8 0.4 52.1 2.4 4.0安 徽 Anhui 119.9 4.6 7.4 31.3 2.6 4.5
福 建 Fujian 151.3 2.9 1.0 85.4 2.4 3.9
江 西 Jiangxi 93.5 5.6 2.1 25.2 3.0 2.9
山 东 Shandong 313.0 2.9 17.3 134.0 6.3 6.0
河 南 Henan 262.5 3.1 13.2 68.7 7.3 7.7
湖 北 Hubei 197.6 12.5 3.2 63.6 4.4 5.5
湖 南 Hunan 142.6 6.8 2.9 30.1 4.0 4.4
广 东 Guangdong 335.2 4.9 0.9 152.9 5.8 6.6
广 西 Guangxi 103.5 5.3 1.4 22.7 2.8 2.5
海 南 Hainan 28.7 9.5 0.4 3.0 0.7 0.6
重 庆 Chongqing 70.8 0.6 1.6 20.9 2.1 4.0
四 川 Sichuan 172.5 2.9 4.6 45.6 5.4 10.3
贵 州 Guizhou 65.3 1.3 2.1 15.1 1.8 2.8
云 南 Yunnan 93.0 6.7 1.6 17.5 2.5 2.7
西 藏 Tibet 5.8 0.1 0.3 0.2 0.2
陕 西 Shaanxi 115.9 1.9 3.6 33.3 2.8 3.9
甘 肃 Gansu 64.1 2.7 1.7 16.9 2.5 2.4
青 海 Qinghai 15.5 0.6 0.4 2.4 0.5 0.7
宁 夏 Ningxia 21.9 1.9 1.6 4.2 1.0 0.7
新 疆 Xinjiang 100.3 26.8 4.7 11.8 1.9 3.2

8/2/2019 China Labour Statistical Yearbook - 2004
http://slidepdf.com/reader/full/china-labour-statistical-yearbook-2004 16/464
1-12 1 continued
单位:万人 (10 000 persons)
交通运输、仓储 信息传输、 批发和 住宿和 金融业 房地产业 租赁和商务
和邮政业 计算机服务 零售业 餐饮业 服务业
和软件业
Traffic, Information Wholesale Accommo- Finance Real Tenancy
地 区 Region Transport, Transfer, and dation Estate andStorage Computer Retail and Business
and post and Trade Restaurants Services
Software
National 182.5 42.1 280.3 95 164.5 40.4 62.7
北 京 Beijing 8.6 6.3 17.6 10.8 6.4 7.0 13.0
天 津 Tianjin 2.9 0.5 5.0 1.7 2.8 0.7 1.1
河 北 Hebei 7.3 1.4 15.7 2.7 7.8 1.0 1.0
山 西 Shanxi 5.3 1.1 10.9 2.1 5.5 0.5 1.4
内 蒙 古 Inner Mongolia 4.6 1.0 3.9 1.5 3.7 0.5 1.3
辽 宁 Liaoning 9.2 1.8 9.1 3.4 9.2 2.1 2.6
吉 林 Jilin 7.6 1.0 6.2 1.6 4.5 0.9 1.2
黑 龙 江 Heilongjiang 9.5 1.5 13.3 2.0 5.5 1.4 1.9
上 海 Shanghai 7.1 1.8 12.9 4.1 7.0 2.7 4.8
江 苏 Jiangsu 9.0 2.1 17.4 4.2 10.3 1.9 2.7
浙 江 Zhejiang 5.5 1.7 9.2 4.9 9.8 1.7 4.0
安 徽 Anhui 5.1 0.9 9.8 2.0 5.4 0.9 1.3
福 建 Fujian 4.1 1.3 5.0 2.5 4.4 1.1 1.2
江 西 Jiangxi 4.7 0.9 5.8 1.3 4.0 0.7 0.6
山 东 Shandong 8.7 1.9 20.4 4.8 11.7 1.9 2.9
河 南 Henan 10.4 1.9 25.7 5.6 10.1 1.5 3.1
湖 北 Hubei 12.8 1.1 14.3 7.2 6.2 1.4 2.7
湖 南 Hunan 8.1 1.8 8.4 3.1 6.5 1.1 1.4
广 东 Guangdong 11.9 4.2 16.8 11.1 12.6 4.6 4.8
广 西 Guangxi 4.6 1.0 6.6 3.0 3.5 0.8 2.0
海 南 Hainan 1.2 0.2 1.3 1.7 0.7 0.4 0.4
重 庆 Chongqing 4.3 0.6 4.7 1.4 3.1 1.0 0.7
四 川 Sichuan 7.8 1.8 8.9 2.6 7.7 1.3 1.0
贵
州Guizhou 3.1 0.4 5.1 1.4 2.2 0.7 0.9
云 南 Yunnan 4.5 1.3 6.8 2.4 3.0 0.6 0.8
西 藏 Tibet 0.3 0.1 0.3 0.2 0.2
陕 西 Shaanxi 5.0 0.9 9.4 2.3 3.9 0.5 1.3
甘 肃 Gansu 3.9 0.7 4.1 1.2 2.2 0.4 0.7
青 海 Qinghai 1.1 0.2 1.0 0.3 0.7 0.1 0.1
宁 夏 Ningxia 1.0 0.2 1.3 0.5 1.0 0.2 0.2
新 疆 Xinjiang 3.6 0.6 3.4 1.6 2.9 0.8 1.4
1-12 2 continued
单位:万人 (10 000 persons)
科学研究、 水利、环境 居民服务和 教育 卫生、社会 文化体育 公共管理和
技术服务和 和公共设施 其他服务业 保障和社会 和娱乐业 社会组织
地质勘查业 管理业 福利业
Scientific Management Resident Education Sanitation, Culture, Public
地 区 Region Research, of Water Services Social Sports Management
Technical Conservancy, and Security and and
Service Environment Other and Entertain- Social
and Geologic and Public Services Social ment Organization
Perambulation Establishment Welfare

8/2/2019 China Labour Statistical Yearbook - 2004
http://slidepdf.com/reader/full/china-labour-statistical-yearbook-2004 17/464
National 70.7 68.8 22.2 672.8 284.5 51.9 308.1
北 京 Beijing 12.5 2.2 3.2 18.8 9.2 5.1 9.0
天 津 Tianjin 1.8 1.1 1.6 9.5 4.4 1.0 3.5
河 北 Hebei 2.3 3.2 1.1 47.2 13.0 2.2 18.3
山 西 Shanxi 1.8 1.9 1.7 25.1 8.3 1.8 11.2
内 蒙 古 Inner Mongolia 1.4 2.4 0.5 16.1 6.0 1.4 8.5
辽 宁 Liaoning 2.9 4.6 0.8 29.4 13.8 2.3 12.0
吉 林 Jilin 2.0 2.8 0.5 19.9 8.5 1.7 7.4
黑 龙 江 Heilongjiang 2.6 2.9 1.7 23.5 10.5 1.5 10.4
上 海 Shanghai 3.7 1.9 2.0 14.4 9.4 1.9 5.4
江 苏 Jiangsu 2.4 3.9 0.8 35.1 16.3 2.1 10.9
浙 江 Zhejiang 1.9 2.0 0.3 25.7 13.5 1.8 8.9
安 徽 Anhui 1.4 2.4 0.5 19.1 9.0 1.7 9.9
福 建 Fujian 1.1 1.3 0.6 19.3 6.4 1.2 6.4
江 西 Jiangxi 1.5 1.8 0.4 16.0 6.8 1.3 8.9
山 东 Shandong 2.3 4.1 0.5 44.4 19.9 2.1 21.0
河 南 Henan 3.5 4.2 0.7 48.8 18.1 2.8 25.9湖 北 Hubei 3.1 3.5 0.7 25.7 14.1 2.1 13.5
湖 南 Hunan 2.3 2.7 0.3 27.5 13.0 2.7 15.7
广 东 Guangdong 2.7 4.7 1.3 46.7 21.1 3.0 18.6
广 西 Guangxi 1.4 2.0 0.3 24.4 9.3 1.2 8.8
海 南 Hainan 0.5 0.8 0.0 3.2 1.6 0.5 2.2
重 庆 Chongqing 1.9 1.0 0.1 12.6 4.5 0.6 5.1
四 川 Sichuan 3.6 3.1 0.9 31.7 13.9 2.1 17.4
贵 州 Guizhou 0.9 1.1 0.2 13.2 4.9 0.8 7.7
云 南 Yunnan 1.8 1.7 0.3 19.8 7.7 1.7 10.0
西 藏 Tibet 0.2 0.1 1.1 0.6 0.2 1.7
陕 西 Shaanxi 3.6 1.7 0.8 21.5 7.0 2.0 10.4
甘 肃 Gansu 1.5 1.3 0.2 9.5 4.1 1.4 6.7
青 海 Qinghai 0.5 0.5 0.1 2.7 1.3 0.2 2.0
宁 夏 Ningxia 0.4 0.7 3.2 1.5 0.3 2.0
新 疆 Xinjiang 1.4 1.6 0.3 17.5 6.8 1.2 8.8

8/2/2019 China Labour Statistical Yearbook - 2004
http://slidepdf.com/reader/full/china-labour-statistical-yearbook-2004 18/464
1-13
1-13
PROPORTION OF FEMALE EMPLOYMENT
IN URBAN UNITS BY SECTOR
(2003)以就业人员为 100 Total Employment=100
合 计 国 有 城镇集体 其 他
单 位 单 位 单 位
项 目 Item State- Urban Other
Total owned Collective- Ownership
Units owned Units Units
National Total 37.9 36.8 38.4 40.2
Grouped by Enterprises,Institutions
and Organizations
企业 Enterprises 37.0 34.0 37.0 40.1
事业 Institutions 45.0 44.9 47.8 49.7
机关 Organizations 25.7 25.7 32.4
Grouped by Sector
Agriculture,Forestry,Farming of Animals 36.3 36.5 31.9 35.3
and Fishing
农业 Agriculture 40.5 40.5 47.9 40.6
林业 Forestry 33.2 33.2 37.9 30.5
畜牧业 Farming of Animals 36.8 37.9 32.2 29.7
渔业 Fishing 29.1 31.1 24.6 22.3
农、林、牧、渔服务业 Service Activities for Agriculture, Forestry, 29.9 29.3 29.8 44.2
Farming of Animals and Fishing
Mining 24.5 24.5 39.9 22.4
煤炭开采和洗选业 Mining and Washing of Coal 21.9 21.1 43.1 20.0
石油和天然气开采业 Extraction of Petroleum and Natural Gas 33.1 32.6 28.1 34.2
黑色金属矿采选业 Mining of Ferrous Metal Ores 25.5 25.9 37.9 18.9
有色金属矿采选业 Mining of Non-ferrous Metal Ores 25.6 25.6 33.9 23.5
非金属矿采选业 Mining and Processing of Nonmetal Ores 27.4 28.9 29.4 24.6
其他矿采选业 Mining of Other Ores n.e.c 43.5 47.2 38.0 19.8
Manufacturing 43.4 36.8 47.5 45.8
农副食品加工业 Processing of Food from Agricultural Products 41.3 37.2 42.4 43.2
食品制造业 Manufacture of Foods 49.2 45.0 50.0 50.7
饮料制造业 Manufacture of Beverage 39.7 38.9 46.8 39.6
烟草制品业 Manufacture of Tobacco 42.6 41.1 49.3 51.1
纺织业 Manufacture of Textile 65.1 61.9 63.5 66.8
纺织服装、鞋、帽制造业 Manufacture of Textile Wearing Apparel, 72.0 60.9 69.8 73.2
Footware,and Caps
皮革、毛皮、羽毛(绒)及其 Manufacture of Leather,Fur,Feather and
制品业 Its Products 68.9 51.2 58.9 70.8
木材加工及木、竹、藤、棕、 Processing of Timbers,Manufacture of Wood,
草制品业 Bamboo,Rattan,Palm,and Straw Products 41.1 39.5 38.2 42.9
家具制造业 Manufacture of Furniture 35.4 33.2 38.8 34.7
造纸及纸制品业 Manufacture of Paper and Paper Products 39.3 38.1 48.6 38.1
印刷业和记录媒介的复制 Printing,Reproduction of Recording Media 48.1 46.1 56.0 45.9
文教体育用品制造业 Manufacture of Articles for Culture, 62.9 41.6 57.7 64.3
Education and Sport Activity

8/2/2019 China Labour Statistical Yearbook - 2004
http://slidepdf.com/reader/full/china-labour-statistical-yearbook-2004 19/464
1-13 1 continued
以就业人员为 100 Total Employment=100
合 计 国 有 城镇集体 其 他
单 位 单 位 单 位
项 目 Item State- Urban Other
Total owned Collective- Ownership
Units owned Units Units
石油加工、炼焦及核燃料加工业 Processing of Petroleum ,Coking,Processing 32.6 32.5 44.2 30.6
of Nucleus Fuel
化工原料及化学制品制造业 Manufacture of Chemical Raw Material and 33.5 33.1 42.5 32.6
Chemical Products
医药制造业 Manufacture of Medicines 47.9 48.0 49.0 47.7
化学纤维制造业 Manufacture of Chemical Fiber 40.4 40.8 50.2 39.7
橡胶制品业 Manufacture of Rubber 41.9 40.6 46.4 41.4
塑料制品业 Manufacture of Plastic 50.3 45.6 52.1 50.4
非金属矿物制品业 Manufacture of Non-metallic Mineral Products 32.7 31.8 37.6 32.2
黑色金属冶炼及压延加工业 Manufacture and Processing of Ferrous Metals 26.0 24.7 39.8 25.3
有色金属冶炼及压延加工业 Manufacture & Processing of Non-ferrous Metals 29.8 31.0 40.4 26.9
金属制品业 Manufacture of Metal Products 35.9 34.1 39.0 35.0
通用设备制造业 Manufacture of General Purpose Machinery 32.6 32.2 41.0 30.5
专用设备制造业 Manufacture of Special Purpose Machinery 32.2 31.6 39.4 31.5
交通运输设备制造业 Manufacture of Transport Equipment 31.9 31.2 42.5 30.4
电气机械及器材制造业 Manufacture of Electrical Machinery & Equipment 44.5 38.7 46.2 45.9
通信设备、计算机及其他电子 Manufacture of Communication Equipment,
设备制造业 Computer and Other Electronic Equipment 57.7 41.4 60.9 59.8
仪器仪表及文化、办公用机械 Manufacture of Measuring Instrument and
制造业 Machinery for Cultural Activity & Office Work 49.8 39.2 52.3 53.1
工艺品及其他制造业 Manufacture of Artwork,Other Manufacture n.e.c 57.6 44.6 56.6 59.3
废弃资源和废旧材料回收加工业 Recycling and Disposal of Waste 50.0 43.5 60.7 47.7
Production and Distribution of
Electricity, Gas and Water 31.1 31.4 33.4 30.0
电力、热力的生产和供应业 Production and Supply of Electric Power 28.7 28.5 31.6 29.1
and Heat Power
燃气生产和供应业 Production and Distribution of Gas 33.6 33.9 39.3 32.6
水的生产和供应业 Production and Distribution of Water 41.0 41.7 37.4 36.7
Construction 15.4 18.1 15.3 12.9
房屋和土木工程建筑业 Construction of Building & Civil Engineering 14.7 17.9 14.2 12.1
建筑安装业 Architectural Installation 20.5 20.3 24.4 18.1
建筑装饰业 Architectural Decoration 19.1 16.3 25.1 18.4
其他建筑业 Other Construction 19.2 20.5 28.1 12.1
Traffic,Transport,Storage and Post 28.7 28.5 31.2 28.3
铁路运输业 Transport Via Railway 22.7 22.0 53.4 23.7
道路运输业 Transport Via Road 31.2 30.9 29.8 32.9
城市公共交通业 Urban Public Traffic 33.3 38.1 25.5 25.8
水上运输业 Water Transport 19.7 18.7 26.3 19.5
航空运输业 Air Transport 33.3 32.6 36.5 34.7
管道运输业 Transport Via Pipeline 31.4 31.4 35.4 30.5
1-13 2 continued
以就业人员为 100 Total Employment=100
合 计 国 有 城镇集体 其 他
单 位 单 位 单 位项 目 Item State- Urban Other
Total owned Collective- Ownership
Units owned Units Units
装卸搬运和其他运输服务业 Loading,Unloading,Portage and Other Transport 27.3 26.3 29.9 25.8
Services
仓储业 Storage 32.1 32.1 33.1 32.0
邮政业 Post 39.0 39.1 39.8 36.0
Information Transfer, Computer Services 36.0 34.5 39.2 38.5
and Software
电信和其他信息传输服务业 Telecom & Other Information Transfer Services 36.6 34.5 37.6 43.2
计算机服务业 Computer Services 36.4 36.7 43.3 35.7

8/2/2019 China Labour Statistical Yearbook - 2004
http://slidepdf.com/reader/full/china-labour-statistical-yearbook-2004 20/464
软件业 Software Industry 32.6 34.1 36.5 32.4
Wholesale and Retail Trade 44.6 41.0 43.4 51.0
批发业 Wholesale 38.6 37.1 40.1 41.3
零售业 Retail Trade 51.8 48.6 46.1 58.0
Accommodation and Restaurants 55.2 53.9 58.8 55.6
住宿业 Accommodation 54.4 53.7 58.7 54.3
餐饮业 Restaurants 56.8 54.8 59.0 57.1
Finance 46.6 45.4 42.6 52.9
银行业 Bank 44.2 43.7 42.6 51.9
证券业 Securities 41.8 38.7 52.1 42.8
保险业 Insurance 54.5 54.1 57.9 54.7
其他金融活动 Other Financial Activities 38.3 39.1 37.9 36.9
Real Estate 33.6 35.4 32.9 32.2
# 房地产开发经营 Real Estate Exploitation Management 31.8 33.9 29.9 30.9
物业管理 Management Concerning Dwelling 34.0 34.7 36.1 33.3
房地产中介服务 Real Estate Agency Service 43.3 41.6 50.4 45.1
Tenancy and Business Services 34.2 31.0 36.5 39.7
租赁业 Tenancy 32.2 28.5 38.1 34.1
商务服务业 Business Service 34.2 31.1 36.5 39.9
Scientific Research,Technical Service
and Geologic Perambulation 31.9 32.0 29.7 31.5研究与实验发展 Research and Experimental Development 34.9 34.9 35.8 34.9
# 自然科学研究与实验发展 Research and Experimental Development 33.9 33.9 29.8 32.9
on Physical Science
工程和技术研究与实验发展 Research and Experimental Development 33.4 33.3 35.6 33.3
on Engineering and Technical Research
农业科学研究与实验发展 Research and Experimental Development 35.2 35.4 23.7 25.4
on Agricultural Science Research
医学研究与实验发展 Research and Experimental Development 49.9 50.5 49.8 44.1
on Medical Research
社会人文科学研究与实验发展 Research and Experimental Development 36.5 36.4 37.5 43.3
on Social Science and Humanities
专业技术服务业 Professional Technique Services 31.4 31.6 34.0 30.5
1-13 3 continued
以就业人员为 100 Total Employment=100
合 计 国 有 城镇集体 其 他
单 位 单 位 单 位
项 目 Item State- Urban Other
Total owned Collective- Ownership
Units owned Units Units
# 气象服务 Weather Services 36.3 36.2 39.3 44.0
地震服务 Earthquake Services 30.4 30.0 66.7 45.6
海洋服务 Ocean Services 21.1 20.3 38.4 33.8
测绘服务 Plotting Services 29.9 29.8 39.5 28.8
技术检测 Technique Detection 34.6 34.6 38.0 33.5
环境监测 Environmental Monitoring 36.8 36.8 34.8 37.6
工程技术与规划管理 Engineering Technic & Programming Management 29.2 29.9 29.6 25.5
科技交流和推广服务业 Services of Science and Technique 35.3 36.9 21.0 35.4
Intercommunion and Generalization
地质勘查业 Geologic Perambulation 25.0 24.6 45.3 32.6
Management of Water Conservancy, 39.9 39.4 48.1 36.2
Environment and Public Establishment
水利管理业 Management of Water Conservancy 26.9 27.0 22.7 24.1
环境管理业 Environmental Management 49.4 49.2 53.5 38.5
公共设施管理业 Management of Public Establishment 38.5 38.8 38.2 35.9
Resident Services and Other Services 42.0 36.3 48.9 43.5
居民服务业 Resident Services 45.7 39.4 52.2 53.3
其他服务业 Other Services 38.9 32.0 47.4 36.1
Education 46.6 46.5 48.1 51.8
# 初等教育 Primary Education 49.5 49.7 46.9 61.5
中等教育 Secondary Education 43.1 43.0 45.0 47.7
高等教育 Higher Education 42.3 42.2 52.0 44.4

8/2/2019 China Labour Statistical Yearbook - 2004
http://slidepdf.com/reader/full/china-labour-statistical-yearbook-2004 21/464
Sanitation,Social Security & Social Welfare 58.6 59.2 53.2 57.4
卫生 Sanitation 59.1 59.9 53.2 57.7
社会保障业 Social Security 43.6 43.3 48.5 61.5
社会福利业 Social Welfare 48.0 47.5 54.7 48.9
Culture, Sports and Entertainment 40.6 40.1 41.8 47.5
新闻出版业 Journalism and Publishing Activities 38.8 38.5 43.0 43.7
广播、电影、电视和音像业 Broadcasting,Movies,Television and 38.2 38.2 41.0 37.6
Audiovisual Activities
文化艺术业 Culture and Art 44.6 44.8 40.1 44.9
体育 Sports Activities 35.4 34.6 35.3 49.5
娱乐业 Entertainment 46.7 38.1 47.2 50.5
Public Management & Social Organization 26.3 26.2 36.0 57.8
# 中国共产党机关 Chinese Communist Party Organs 22.4 22.3 59.6
国家机构 Organ of State 26.1 26.1 29.6
人民政协和民主党派 People's Political Consultative Conference 23.4 23.4 43.8
and democratic parties
群众社团、社会团体和宗教 Mass communities, social communities and
组织 religion organizations 39.5 39.2 39.7 62.0
]

8/2/2019 China Labour Statistical Yearbook - 2004
http://slidepdf.com/reader/full/china-labour-statistical-yearbook-2004 22/464
1-14
1-14
STAFF AND WORKERS AND COMPOSITION BY REGISTRATION STATUS
(End of Year)
单位:万人 (10 000 persons)
合 计 国 有 集 体 其 他 构成(以合计为 100)
单 位 单 位 单 位 Composition(Total=100)
年 份 国 有 集 体 其 他
Yesr Total State- Collective- Other 单 位 单 位 单 位
owned owned Owner-ship State- Collective- Other
Units Units Units owned owned Owner-ship
Units Units Units
1952 1603 1580 23 98.6 1.4
1957 3101 2451 650 79.0 21.0
1962 4321 3309 1012 76.6 23.4
1965 4965 3738 1227 75.3 24.7
1970 6216 4792 1424 77.1 22.9
1971 6787 5318 1469 78.4 21.6
1972 7134 5610 1524 78.6 21.4
1973 7337 5758 1579 78.5 21.5
1974 7651 6007 1644 78.5 21.5
1975 8198 6426 1772 78.4 21.6
1976 8673 6860 1813 79.1 20.9
1977 9112 7196 1916 79.0 21.0
1978 9499 7451 2048 78.4 21.6
1979 9967 7693 2274 77.2 22.8
1980 10444 8019 2425 76.8 23.2
1981 10940 8372 2568 76.5 23.5
1982 11281 8630 2651 76.5 23.5
1983 11515 8771 2744 76.2 23.8
1984 11890 8637 3216 37 72.6 27.0 0.3
1985 12358 8990 3324 44 72.7 26.9 0.4
1986 12809 9333 3421 55 72.9 26.7 0.4
1987 13214 9654 3488 72 73.1 26.4 0.5
1988 13608 9984 3527 97 73.4 25.9 0.7
1989 13742 10108 3502 132 73.5 25.5 1.0
1990 14059 10346 3549 164 73.6 25.2 1.2
1991 14508 10664 3628 216 73.5 25.0 1.5
1992 14792 10889 3621 282 73.6 24.5 1.9
1993 14849 10920 3393 536 73.5 22.9 3.6
1994 14849 10890 3211 747 73.3 21.6 5.0
1995 14908 10955 3076 877 73.5 20.6 5.9
1996 14845 10949 2954 942 73.8 19.9 6.3
1997 14668 10766 2817 1085 73.4 19.2 7.4
1998 12337 8809 1900 1628 71.4 15.4 13.2
1999 11773 8336 1652 1785 70.8 14.0 15.2
2000 11259 7878 1447 1935 70.0 12.9 17.2
2001 10792 7409 1241 2142 68.7 11.5 19.8
2002 10558 6924 1071 2563 65.6 10.1 24.3
2003 10492 6621 951 2920 63.1 9.1 27.8
注:1998 年及以后为在岗职工数(以下各表同)。
a)Data since 1998 are on-post staff and workers figures(The same as in the following tables).

8/2/2019 China Labour Statistical Yearbook - 2004
http://slidepdf.com/reader/full/china-labour-statistical-yearbook-2004 23/464
1-15
1-15
STAFF AND WORKERS BY SECTOR
End of Year)
单位:万人 (10 000 persons)
农、 林、 电力、煤气 地质勘查 交通运输、
牧、 渔业 采掘业 制造业 及水的生产 建筑业 业、水利 仓储及邮
年份 合 计 和供应业 管 理 业 电通信业
Farming, Mining Manufac- Production Constr- Geological Transport,
Year Total Forestry, and turing and Supply uction Prospect- Storage,
Animal Quarrying of Elec- ing & Water Post and
Husbandry tricity, Conservan- Telecommu-
and Fishery Gas and cy nications
Water
1978 9499 830 652 3595 107 623 178 669
1980 10444 788 697 3947 118 710 188 714
1985 12358 777 795 4620 142 900 197 823 1986 12809 784 809 4820 152 922 197 846
1987 13214 792 819 4988 164 946 200 860
1988 13608 789 832 5149 177 955 204 874
1989 13742 782 842 5206 180 900 199 874
1990 14059 780 882 5304 192 896 197 895
1991 14508 769 905 5443 203 940 199 916
1992 14792 758 898 5508 215 995 202 921
1993 14849 708 925 5469 232 1153 144 826
1994 14849 680 904 5434 244 1072 137 835
1995 14908 660 914 5439 257 1053 134 824
1996 14845 617 886 5293 272 1035 128 830
1997 14668 612 851 5083 282 1004 128 824
1998 12337 546 702 3769 281 846 115 701
1999 11773 519 650 3496 283 778 110 682
2000 11259 494 581 3240 282 744 109 659
2001 10792 458 544 3010 284 733 104 629
2002 10558 430 537 2907 285 756 96 613
1-15 续表 continued
单位:万人 (10 000 persons)
批发和零 金融、 房 地 社会 卫生、体 教育、文化 科学研究 国家机关
售贸易、 育和社会 艺术和广播 和综合技 政党机关和
餐饮业 保险业 产 业 服务业 福利业 电影电视业 术服务业 社会团体 其他
年份 Wholesale Health Education, Scientific Government
and Finance Real Social Care, Culture Research Agencies, Others
Year Retail and Estate Services Sporting and Arts, and Party Age-
Trade & Insurance Trade and Radio, Polytech- ncies and
Catering Social Film and nical Social Or-
Services Welfare Television Services ganizations
1978 1079 65 31 166 247 736 92 430
1980 1239 89 37 218 287 817 105 490
1985 1518 126 36 271 342 962 131 718
1986 1544 138 38 289 354 1008 137 770
1987 1578 154 39 304 365 1059 142 8051988 1643 174 42 318 375 1091 144 843
1989 1675 184 43 327 382 1117 147 885
1990 1715 195 44 344 392 1143 152 929
1991 1786 208 48 369 410 1181 156 974
1992 1844 223 54 386 421 1212 159 996
1993 1796 239 66 422 416 1205 166 1030 55
1994 1833 261 72 447 428 1249 174 1017 63
1995 1828 273 77 449 438 1291 178 1027 66
1996 1807 288 82 458 451 1345 176 1075 103
1997 1774 298 84 480 464 1403 179 1080 125
1998 1256 301 89 451 469 1451 168 1084 108

8/2/2019 China Labour Statistical Yearbook - 2004
http://slidepdf.com/reader/full/china-labour-statistical-yearbook-2004 24/464
1999 1110 300 90 453 473 1480 165 1088 96
2000 977 294 93 457 476 1500 164 1091 99
2001 840 292 97 463 481 1512 154 1088 104
2002 733 287 107 483 480 1517 151 1056 120

8/2/2019 China Labour Statistical Yearbook - 2004
http://slidepdf.com/reader/full/china-labour-statistical-yearbook-2004 25/464
1-16
1-16
( )
STAFF AND WORKERS BY SECTOR
(State-owned Units,End of Year)单位:万人 (10 000 persons)
农、林、 电力、煤气 地质勘查 交通运输、
牧、渔业 采掘业 制造业 及水的生产 建筑业 业、水利 仓储及邮
年份 合 计 和供应业 管理业 电通信业
Farming, Mining Manufac- Production Constru- Geological Transport,
Year Total Forestry, and and Supply Prospect- Storage,
Animal Quarrying turing of Elec- ction ing and Post and
Husbandry tricity, Water Telecommu-
and Fishery Gas and Conservan- nications
Water cy
1978 7451 774 588 2449 102 447 177 465
1980 8019 740 621 2601 112 475 187 498
1985 8990 726 706 2975 134 545 196 585
1986 9333 736 715 3096 144 557 196 604
1987 9654 744 722 3209 155 566 200 618
1988 9983 743 735 3327 167 568 204 636
1989 10109 736 757 3344 172 541 199 640
1990 10346 737 786 3395 183 538 194 660
1991 10664 727 797 3482 193 557 196 682
1992 10889 717 792 3526 203 577 199 693
1993 10920 672 834 3444 220 663 142 664
1994 10890 653 820 3321 230 629 135 677
1995 10955 634 834 3326 237 605 132 677
1996 10949 592 809 3218 250 595 126 684
1997 10766 588 772 3011 257 577 125 681
1998 8809 525 596 1883 242 444 113 584
1999 8336 500 525 1648 239 399 108 568
2000 7878 475 448 1415 233 372 107 549
2001 7409 440 402 1194 229 336 102 518
2002 6924 410 347 979 220 302 94 498
1-16 续表 continued
单位:万人 (10 000 persons)
批发和零 金融、 房 地 社会 卫生、体 教育、文化 科学研究 国家机关
售贸易、 育和社会 艺术和广播 和综合技 政党机关和
餐饮业 保险业 产 业 服务业 福利业 电影电视业 术服务业 社会团体 其他
年份 Wholesale Health Education, Scientific Government
and Finance Real Social Care, Culture Research Agencies, Others
Year Retail and Estate Services Sporting and Arts, and Party Age-
Trade & Insurance Trade and Radio, Polytech- ncies and
Catering Social Film and nical Social Or-
Services Welfare Television Services ganizations
1978 907 42 28 107 183 674 91 417
1980 1005 63 33 130 217 757 104 476
1985 800 93 32 181 272 925 129 691
1986 824 101 34 193 283 973 135 742
1987 851 113 34 203 296 1025 140 778
1988 900 128 37 214 306 1059 142 817
1989 923 136 38 221 314 1086 144 859
1990 947 145 40 236 323 1112 148 903
1991 993 154 43 251 340 1151 151 946
1992 1037 166 48 269 356 1183 153 969
1993 1014 182 55 293 356 1180 153 1014 34
1994 1054 196 59 308 368 1227 165 1007 40
1995 1061 203 61 315 379 1265 167 1019 42
1996 1055 208 63 329 390 1322 166 1068 74

8/2/2019 China Labour Statistical Yearbook - 2004
http://slidepdf.com/reader/full/china-labour-statistical-yearbook-2004 26/464
1997 1037 210 64 345 402 1362 167 1074 95
1998 694 208 63 32 410 1408 155 1079 84
1999 608 205 61 319 415 1433 153 1084 72
2000 531 200 60 314 419 1447 147 1086 76
2001 447 193 59 310 425 1455 137 1084 80
2002 365 184 57 311 427 1452 133 1053 91

8/2/2019 China Labour Statistical Yearbook - 2004
http://slidepdf.com/reader/full/china-labour-statistical-yearbook-2004 27/464
1-17
1-17
( )
STAFF AND WORKERS BY SECTOR
(Urban Collective-owned Units,End of Year)单位:万人 (10 000 persons)
农、林、 电力、煤气 地质勘查 交通运输、
牧、渔业 采掘业 制造业 及水的生产 建筑业 业、水利 仓储及邮
合 计 和供应业 管理业 电通信业
年份 Farming, Mining Manufac- Production Constru- Geological Transport,
Total Forestry, and and Supply Prospect- Storage,
Year Animal Quarrying turing of Elec- ction ing and Post and
Husbandry tricity, Water Telecommu-
and Fishery Gas and Conservan- nications
Water cy
1978 2048 56 64 1146 5 176 0.5 204
1980 2425 48 76 1346 6 235 1.0 216
1985 3324 51 89 1608 8 354 1.0 237
1986 3421 48 93 1680 8 364 0.7 241
1987 3488 47 96 1724 8 379 0.3 241
1988 3527 45 96 1745 9 385 0.2 237
1989 3502 45 84 1754 7 357 0.4 232
1990 3549 42 95 1773 8 357 3.3 232
1991 3628 41 107 1782 9 380 3.4 232
1992 3621 39 105 1747 10 414 3.2 226
1993 3393 34 89 1595 8 479 2.0 154
1994 3211 24 81 1515 9 427 2.0 149
1995 3076 23 77 1417 9 427 1.9 138
1996 2954 22 72 1346 11 412 2.1 134
1997 2817 20 72 1244 11 393 3.0 125
1998 1900 16 49 742 11 311 2.1 79
1999 1652 14 42 622 10 278 1.9 67
2000 1447 14 35 519 9 261 1.9 56
2001 1241 12 30 425 8 243 2.0 47
2002 1071 11 30 346 7 218 1.4 39
1-17 续表 continued
单位:万人 (10 000 persons)
批发和零 金融、 房 地 社会 卫生、体 教育、文化 科学研究 国家机关
售贸易、 育和社会 艺术和广播 和综合技 政党机关和
餐饮业 保险业 产 业 服务业 福利业 电影电视业 术服务业 社会团体 其他
年份 Wholesale Health Education, Scientific Government
and Finance Real Social Care, Culture Research Agencies, Others
Year Retail and Estate Services Sporting and Arts, and Party Age-
Trade & Insurance Trade and Radio, Polytech- ncies and
Catering Social Film and nical Social Or-
Services Welfare Television Services ganizations
1978 172 23 3 59 64 62 0.6 13
1980 234 26 4 88 70 60 0.8 14
1985 716 33 4 87 70 37 1.5 27
1986 718 37 4 91 71 35 1.9 28
1987 722 41 5 93 69 34 2.0 27
1988 738 45 4 94 69 32 2.2 26
1989 748 49 4 94 68 32 2.5 26
1990 762 51 4 93 69 32 3.0 26
1991 786 54 5 98 70 30 4.0 28
1992 796 57 4 96 65 28 5.0 27
1993 744 55 5 101 60 24 9.0 15 20
1994 716 62 6 102 59 21 7.4 9 22
1995 693 67 6 94 59 26 7.6 8 23

8/2/2019 China Labour Statistical Yearbook - 2004
http://slidepdf.com/reader/full/china-labour-statistical-yearbook-2004 28/464
1996 667 73 7 86 60 22 7.4 7 27
1997 637 76 7 87 62 40 7.5 6 27
1998 414 71 7 68 58 41 6.5 5 20
1999 345 70 7 65 57 45 5.8 5 18
2000 285 68 6 61 56 49 5.4 5 16
2001 216 66 6 56 54 53 3.0 4 16
2002 167 64 7 49 51 56 2.4 3 19

8/2/2019 China Labour Statistical Yearbook - 2004
http://slidepdf.com/reader/full/china-labour-statistical-yearbook-2004 29/464
1-18
1-18
( )
STAFF AND WORKERS BY SECTOR
(Other Ownership Units,End of Year)单位:万人 (10 000 persons)
农、林、 电力、煤气 地质勘查 交通运输、
牧、渔业 采掘业 制造业 及水的生产 建筑业 业、水利 仓储及邮
合 计 和供应业 管理业 电通信业
年份 Farming, Mining Manufac- Production Constru- Geological Transport,
Total Forestry, and and Supply Prospect- Storage,
Year Animal Quarrying turing of Elec- ction ing and Post and
Husbandry tricity, Water Telecommu-
and Fishery Gas and Conservan- nications
Water cy
1984 36.7 33.1 0.5 0.9
1985 43.7 0.2 36.8 0.6 0.9
1986 55.3 0.2 45.6 0.6 0.9
1987 71.9 0.5 58.3 0.8 1.5
1988 96.7 0.6 1.0 77.0 1.0 1.3 1.0
1989 131.7 0.7 1.0 108.0 1.0 1.5 1.6
1990 163.8 1.1 1.0 135.0 1.0 1.6 0.04 1.6
1991 216.0 1.4 1.0 180.0 1.0 2.7 0.09 2.0
1992 281.8 1.5 1.0 236.0 2.0 4.1 0.10 2.4
1993 535.7 2.2 2.1 429.5 4.0 10.6 0.03 7.7
1994 747.4 2.6 3.2 598.1 5.9 16.3 0.05 9.0
1995 877.0 3.2 4.0 696.0 10.2 21.0 0.08 9.7
1996 941.7 3.9 4.3 728.4 10.7 28.2 0.05 11.8
1997 1085.5 4.1 6.8 826.7 13.8 33.7 0.05 17.1
1998 1627.6 5.1 57.0 1143.6 28.7 91.5 0.10 37.7
1999 1785.4 4.6 82.8 1225.2 34.8 101.4 0.18 47.8
2000 1934.5 6.1 98.0 1305.5 40.1 111.4 0.24 53.8
2001 2141.9 6.6 112.1 1390.8 47.0 153.9 0.46 63.8
2002 2562.9 9.3 159.8 1582.0 58.1 236.0 0.67 76.3
1-18 续表 continued
单位:万人 (10 000 persons)
批发和零 金融、 房 地 社 会 卫生、体 教育、文化 科学研究
售贸易、 育和社会 艺术和广播 和综合技
餐饮业 保险业 产 业 服务业 福利业 电影电视业 术服务业 其 他
年份 Wholesa- Health Education, Scientific
le and Finance Real Social Care, Culture Research Others
Year Retail and Estate Services Sporting and Arts, and
Trade & Insurance Trade and Radio, Polytech-
Catering Social Film and nical
Services Welfare Television Services
1984 2.1 0.3
1985 2.3 2.9
1986 2.6 5.2
1987 3.8 7.5
1988 4.4 0.08 10.6 0.04
1989 4.9 0.12 12.6 0.19
1990 6.0 0.05 0.51 15.0 0.05 0.26 0.20
1991 7.5 0.05 0.79 18.8 0.13 0.38 0.51
1992 11.0 0.03 1.43 21.1 0.11 0.71 0.86
1993 38.1 1.87 6.25 28.2 0.15 0.58 3.14 0.26
1994 62.9 2.30 7.22 36.6 0.37 0.66 1.41 0.75
1995 74.4 3.80 9.32 39.7 0.41 0.89 2.90 1.40
1996 85.0 7.72 11.21 44.1 0.51 1.15 3.24 1.43
1997 100.1 12.50 12.80 48.9 0.54 1.25 4.60 2.59
1998 148.9 21.90 19.30 61.0 1.00 1.50 6.40 4.00

8/2/2019 China Labour Statistical Yearbook - 2004
http://slidepdf.com/reader/full/china-labour-statistical-yearbook-2004 30/464
1999 157.0 25.14 22.14 69.1 1.05 2.02 6.38 5.66
2000 161.3 25.54 26.37 82.9 1.16 3.19 12.24 6.63
2001 176.9 32.06 32.43 97.5 1.72 3.78 14.11 8.72
2002 201.0 38.32 42.24 122.8 2.69 7.90 15.58 10.25
1

8/2/2019 China Labour Statistical Yearbook - 2004
http://slidepdf.com/reader/full/china-labour-statistical-yearbook-2004 31/464
1-19
1-19
STAFF AND WORKERS BY SECTOR
(2003)
单位:万人 (10 000 persons)
合 计 农、林、 采矿业 制造业 电力、燃气 建筑业 交通运输、仓
牧、渔业 及水的生产 储和邮政业
和供应业
登记注册类型 Total Agriculture, Mining Manufac- Production Construc- Traffic,
Forestry, turing & Distri- tion Transport,
Registration Status Farming of bution of Storage
Animals Electri- and post
and city, Gas
Fishery & Water
National 10492.0 459.7 481.0 2898.9 292.3 773.5 609.7
国有单位 6621.3 433.9 259.7 854.2 220.1 278.7 474.4
State-owned Units
集体单位 951.0 13.9 27.0 287.4 6.8 201.1 36.6
Collective-owned units
其他单位 2920.3 11.9 194.3 1757.4 65.4 293.8 98.7
Other Ownership units
1-19 续表 1 continued
单位:万人 (10 000 persons)
信息传输、 批发和 住宿和 金融业 房地产业 租赁和商务 科学研究、
计算机服务 零售业 餐饮业 服务业 技术服务和
和软件业 地质勘查业
登记注册类型 Information Wholesale Accommo- Finance Real Tenancy Scientific
Transfer, and dation Estate and Research,
Registration Status Computer Retail and Business Technical
and Trade Restaur- Services Service
Software ants & Geologic
Perambulation
National 104.0 592.0 159.4 286.2 108.3 167.6 206.3
国有单位 63.9 286.3 69.2 176.3 48.8 98.7 176.7
State-owned Units
集体单位 1.7 122.4 15.2 63.7 6.8 28.4 3.4
Collective-owned units
其他单位 38.4 183.3 75.0 46.2 52.6 40.6 26.2
Other Ownership units
1-19 续表 2 continued
单位:万人 (10 000 persons)
水利、环境 居民服务和 教育 卫生、社会 文化体育 公共管理和
和公共设施 其他服务业 保障和社会 和娱乐业 社会组织
管理业 福利业
登记注册类型 Management Resident Education Sanitation, Culture, Public
of Water Services Social Sports Management
Registration Status Conservancy, and Security and and
Environment Other and Entertain- Social
& Public Services Social ment Organiza-
Establishment Welfare tion
National 163.9 47.5 1401.7 471.7 122.0 1146.3
国有单位 147.9 19.9 1340.1 419.1 112.4 1141.1
State-owned Units
集体单位 9.8 14.0 55.6 49.3 3.0 4.5
Collective-owned units
其他单位 6.1 13.6 6.1 3.3 6.6 0.7
Other Ownership units

8/2/2019 China Labour Statistical Yearbook - 2004
http://slidepdf.com/reader/full/china-labour-statistical-yearbook-2004 32/464
1-20
1-20
RURAL EMPLOYMENT BY SECTOR AND REGION
(End of Year)
单位:万人 (10 000 persons)
农、 林、 交通运输、 批发和零
牧、 渔业 制造业 建筑业 仓储及邮 售贸易、
年份 地区 合 计 电通信业 餐饮业 其他
Farming, Manufac- Constru- Transport, Wholesale
Year Region Total Forestry, turing ction Storage, and Others
Animal Post and Retail
Husbandry Telecommu- Trade and
and Fishery nications Catering
Services
1978 30638 27488 1734 230 80 52 521
1980 31836 28334 1942 283 90 67 588
1985 37065 30351 2741 1130 434 463 1319
1986 37990 30468 3139 1309 506 532 1338
1987 39000 30870 3297 1431 562 607 1502
1988 40067 31456 3413 1526 607 657 1655
1989 40939 32441 3256 1502 614 652 1709
1990 47708 33336 3229 1523 635 693 1798
1991 48026 34186 3268 1534 655 723 1910
1992 48291 34037 3468 1659 706 814 2302
1993 48546 33258 3659 1887 800 949 3671
1994 48802 32690 3849 2057 908 1084 4065
1995 49025 32335 3971 2204 983 1170 4380
1996 49028 32261 4019 2304 1028 1262 4416
1997 49039 32434 4032 2373 1058 1382 4684
1998 49021 32626 3929 2394 1088 1462 4934
1999 48982 32912 3953 2532 1116 1585 4799
2000 48934 32798 4109 2692 1171 1752 5442
2001 49085 32451 4296 2797 1205 1865 5615
2002 48960 31991 4506 2959 1259 1997 5816
2003 48793 31260 4937 3201 1328 2110 6135
北 京 Beijing 169.6 59.5 32.5 16.4 16.1 18.9 26.2
天 津 Tianjin 173.8 81.2 45.1 12.9 11.9 14.7 8.0
河 北 Hebei 2748.0 1660.2 441.9 243.7 101.0 124.9 176.3
山 西 Shanxi 1012.8 646.0 129.8 57.5 56.6 41.6 81.4
内蒙古 Inner Mongo 652.3 514.4 21.3 25.3 12.6 19.3 59.5
辽 宁 Liaoning 1016.3 667.3 85.8 65.7 39.8 55.0 102.7
吉 林 Jilin 669.0 502.5 25.2 29.3 16.9 22.5 72.6
黑龙江 Heilongjiang 936.1 734.8 40.5 35.7 22.1 35.5 67.5
上 海 Shanghai 250.1 71.7 112.5 11.7 7.1 14.3 32.8
江 苏 Jiangsu 2649.1 1230.3 509.3 287.3 93.9 119.9 408.3
浙 江 Zhejiang 2219.9 873.0 647.4 130.9 79.6 191.2 297.9
安 徽 Anhui 2861.7 1860.6 228.8 229.5 72.8 122.4 347.8
福 建 Fujian 1283.7 735.9 174.5 85.0 38.8 68.4 181.1江 西 Jiangxi 1588.4 971.3 132.6 86.1 30.5 46.5 321.4
山 东 Shandong 3718.4 2264.6 431.1 330.3 133.5 192.1 366.7
河 南 Henan 4695.0 3321.2 432.0 331.6 126.9 210.4 272.9
湖 北 Hubei 1832.5 1110.7 112.6 113.3 48.3 73.2 374.3
湖 南 Hunan 2914.4 1997.7 224.9 148.0 62.0 150.1 331.7
广 东 Guangdong 2824.5 1543.4 467.0 199.7 74.4 149.8 390.3
广 西 Guangxi 2216.3 1541.0 78.1 93.7 38.5 62.4 402.5
海 南 Hainan 240.3 187.3 8.3 8.1 6.3 11.1 19.3
重 庆 Chongqing 1340.3 813.2 78.3 102.5 22.6 36.0 287.7

8/2/2019 China Labour Statistical Yearbook - 2004
http://slidepdf.com/reader/full/china-labour-statistical-yearbook-2004 33/464

8/2/2019 China Labour Statistical Yearbook - 2004
http://slidepdf.com/reader/full/china-labour-statistical-yearbook-2004 34/464
1-21
1-21
RURAL EMPLOYMENT IN URBAN UNITS BY REGION
(2003)
年末人数 占就业人员
(万人) 国 有 集 体 其 他 总数(%) 国 有 集 体 其 他
Total 单 位 单 位 单 位 Proportion 单 位 单 位 单 位
地 区 Region (10 000 State- Collective- Other (Total=100) State- Collective- Other
persons) owned owned Owner- owned owned Owner-
Units Units ship Units Units ship
Units Units
National 1143.18 290.62 163.78 688.77 10.4 4.2 16.4 22.3
北 京 Beijing 78.43 17.50 9.27 51.66 16.0 8.2 30.9 20.8
天 津 Tianjin 7.69 1.12 0.48 6.09 4.0 1.2 3.4 7.1
河 北 Hebei 39.23 13.90 8.92 16.41 7.9 3.7 20.8 19.8山 西 Shanxi 27.00 13.65 5.28 8.06 7.6 5.4 13.6 12.8
内 蒙 古 Inner Mongolia 8.63 3.30 0.61 4.72 3.5 2.0 3.9 7.9
辽 宁 Liaoning 33.48 14.28 3.40 15.80 6.7 4.5 6.8 12.0
吉 林 Jilin 5.47 2.25 0.72 2.50 1.9 1.1 2.6 4.5
黑 龙 江 Heilongjiang 9.38 3.17 2.85 3.36 1.8 0.9 5.1 2.9
上 海 Shanghai 39.16 6.69 2.55 29.92 11.5 4.1 12.1 19.0
江 苏 Jiangsu 55.58 10.01 5.76 39.81 9.1 3.2 10.5 16.9
浙 江 Zhejiang 87.44 9.14 10.11 68.18 22.3 5.1 31.4 37.5
安 徽 Anhui 26.63 6.37 6.95 13.32 7.5 2.9 16.1 14.9
福 建 Fujian 107.62 9.51 7.30 90.81 31.2 6.2 29.9 54.2
江 西 Jiangxi 17.11 7.20 3.58 6.33 6.4 3.5 17.0 15.0
山 东 Shandong 83.84 21.43 10.21 52.21 10.8 4.3 13.5 25.3
河 南 Henan 56.91 14.61 10.63 31.67 8.1 3.7 9.1 17.0
湖 北 Hubei 34.32 10.16 7.76 16.39 6.8 3.0 19.4 13.5
湖 南 Hunan 33.32 19.72 5.21 8.39 8.3 6.3 15.2 15.5
广 东 Guangdong 170.94 22.05 22.61 126.29 21.9 5.9 28.8 38.7
广 西 Guangxi 21.16 7.71 5.49 7.96 7.8 3.8 23.8 16.6
海 南 Hainan 3.80 1.85 0.43 1.52 5.2 3.2 10.7 14.0
重 庆 Chongqing 29.22 5.68 4.58 18.97 13.9 4.6 23.7 28.5
四 川 Sichuan 68.92 21.45 13.66 33.81 13.6 6.5 26.9 26.6
贵 州 Guizhou 17.90 8.69 3.60 5.61 9.1 5.9 24.9 16.2
云 南 Yunnan 25.73 12.45 3.16 10.11 10.2 6.6 19.8 20.4
西 藏 Tibet 1.19 0.98 0.12 0.09 6.8 6.1 22.2 11.7
陕 西 Shaanxi 14.96 7.34 2.52 5.10 4.5 2.9 10.2 10.0
甘 肃 Gansu 13.53 5.78 3.63 4.12 6.9 3.6 23.0 20.5
青 海 Qinghai 1.68 0.80 0.22 0.66 3.9 2.3 8.9 11.6
宁 夏 Ningxia 5.45 1.95 0.53 2.98 8.9 4.9 22.6 15.4
新 疆 Xinjiang 17.43 9.87 1.64 5.92 7.1 5.2 20.4 12.4
8/2/2019 China Labour Statistical Yearbook - 2004
http://slidepdf.com/reader/full/china-labour-statistical-yearbook-2004 35/464
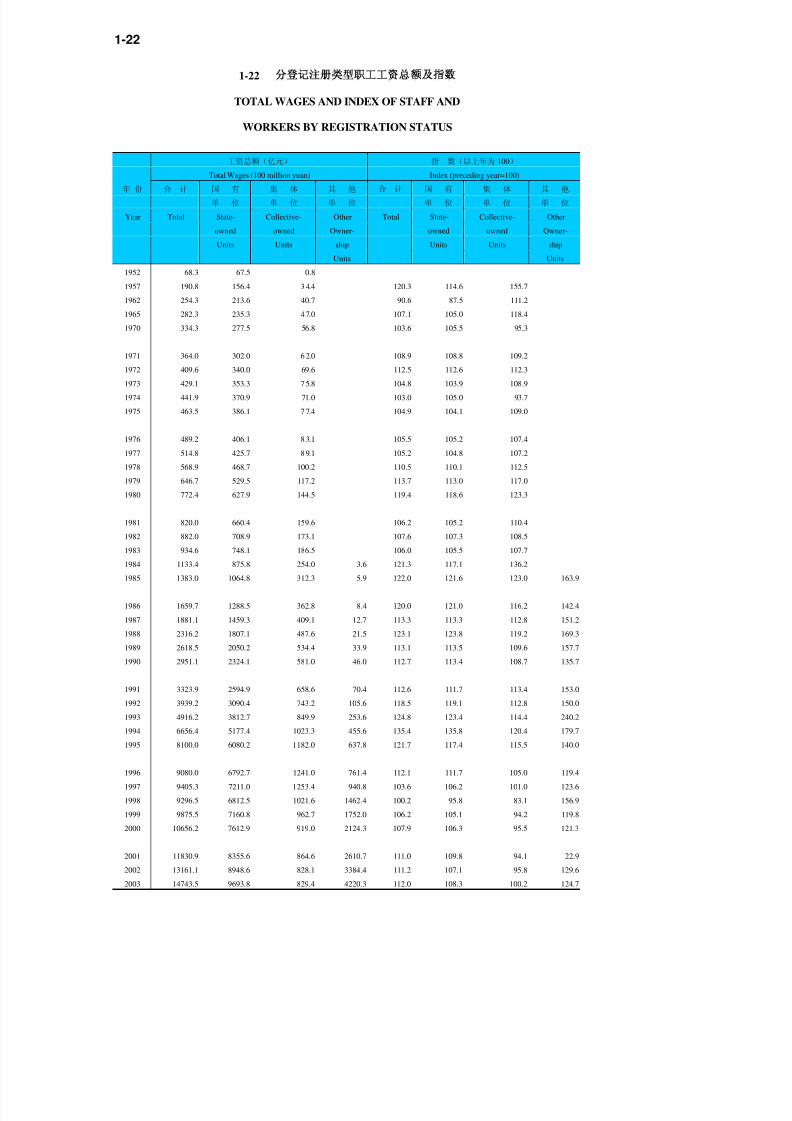
1-22
1-22
TOTAL WAGES AND INDEX OF STAFF AND
WORKERS BY REGISTRATION STATUS
工资总额(亿元) 指 数(以上年为 100)
Total Wages (100 million yuan) Index (preceding year=100)
年 份 合 计 国 有 集 体 其 他 合 计 国 有 集 体 其 他
单 位 单 位 单 位 单 位 单 位 单 位
Year Total State- Collective- Other Total State- Collective- Other
owned owned Owner- owned owned Owner-
Units Units ship Units Units ship
Units Units
1952 68.3 67.5 0.8
1957 190.8 156.4 3 4.4 120.3 114.6 155.7
1962 254.3 213.6 40.7 90.6 87.5 111.2
1965 282.3 235.3 4 7.0 107.1 105.0 118.4 1970 334.3 277.5 56.8 103.6 105.5 95.3
1971 364.0 302.0 6 2.0 108.9 108.8 109.2
1972 409.6 340.0 69.6 112.5 112.6 112.3
1973 429.1 353.3 7 5.8 104.8 103.9 108.9
1974 441.9 370.9 71.0 103.0 105.0 93.7
1975 463.5 386.1 7 7.4 104.9 104.1 109.0
1976 489.2 406.1 8 3.1 105.5 105.2 107.4
1977 514.8 425.7 8 9.1 105.2 104.8 107.2
1978 568.9 468.7 100.2 110.5 110.1 112.5
1979 646.7 529.5 117.2 113.7 113.0 117.0
1980 772.4 627.9 144.5 119.4 118.6 123.3
1981 820.0 660.4 159.6 106.2 105.2 110.4
1982 882.0 708.9 173.1 107.6 107.3 108.5
1983 934.6 748.1 186.5 106.0 105.5 107.7
1984 1133.4 875.8 254.0 3.6 121.3 117.1 136.2
1985 1383.0 1064.8 312.3 5.9 122.0 121.6 123.0 163.9
1986 1659.7 1288.5 362.8 8.4 120.0 121.0 116.2 142.4
1987 1881.1 1459.3 409.1 12.7 113.3 113.3 112.8 151.2
1988 2316.2 1807.1 487.6 21.5 123.1 123.8 119.2 169.3
1989 2618.5 2050.2 534.4 33.9 113.1 113.5 109.6 157.7
1990 2951.1 2324.1 581.0 46.0 112.7 113.4 108.7 135.7
1991 3323.9 2594.9 658.6 70.4 112.6 111.7 113.4 153.0
1992 3939.2 3090.4 743.2 105.6 118.5 119.1 112.8 150.0
1993 4916.2 3812.7 849.9 253.6 124.8 123.4 114.4 240.2
1994 6656.4 5177.4 1023.3 455.6 135.4 135.8 120.4 179.7
1995 8100.0 6080.2 1182.0 637.8 121.7 117.4 115.5 140.0
1996 9080.0 6792.7 1241.0 761.4 112.1 111.7 105.0 119.4
1997 9405.3 7211.0 1253.4 940.8 103.6 106.2 101.0 123.61998 9296.5 6812.5 1021.6 1462.4 100.2 95.8 83.1 156.9
1999 9875.5 7160.8 962.7 1752.0 106.2 105.1 94.2 119.8
2000 10656.2 7612.9 919.0 2124.3 107.9 106.3 95.5 121.3
2001 11830.9 8355.6 864.6 2610.7 111.0 109.8 94.1 22.9
2002 13161.1 8948.6 828.1 3384.4 111.2 107.1 95.8 129.6
2003 14743.5 9693.8 829.4 4220.3 112.0 108.3 100.2 124.7

8/2/2019 China Labour Statistical Yearbook - 2004
http://slidepdf.com/reader/full/china-labour-statistical-yearbook-2004 36/464

8/2/2019 China Labour Statistical Yearbook - 2004
http://slidepdf.com/reader/full/china-labour-statistical-yearbook-2004 37/464

8/2/2019 China Labour Statistical Yearbook - 2004
http://slidepdf.com/reader/full/china-labour-statistical-yearbook-2004 38/464
1991 213.5 35.1 10.3 61.9 80.6 255.6 38.5 211.4
1992 251.5 47.1 14.1 78.2 101.0 317.9 47.5 265.5
1993 291.5 67.6 22.3 104.9 122.2 383.4 59.0 353.3 12.9
1994 399.1 133.8 34.3 154.7 191.7 599.5 102.5 496.2 22.9
1995 472.7 151.4 41.1 185.0 224.8 678.9 114.2 555.2 28.3
1996 509.4 180.0 48.7 216.9 269.3 800.2 132.5 668.1 50.9
1997 524.9 209.0 53.4 253.1 309.3 910.1 150.2 740.4 64.2
1998 432.0 226.8 58.7 261.2 354.2 1047.5 158.6 831.8 68.3
1999 410.7 249.9 63.5 287.9 407.7 1217.1 177.5 967.2 69.3
2000 403.0 279.4 69.9 310.5 467.6 1378.4 195.6 1086.2 76.4
2001 375.7 323.8 76.8 348.0 563.4 1674.1 223.7 1314.1 91.1
2002 354.1 365.9 82.8 378.2 647.9 1944.4 253.9 1470.4 121.8

8/2/2019 China Labour Statistical Yearbook - 2004
http://slidepdf.com/reader/full/china-labour-statistical-yearbook-2004 39/464
1-25
1-25
TOTAL WAGES OF STAFF AND WORKERS BY SECTOR
(Urban Collective-owned Units)单位:亿元 (100 million yuan)
农、林、 电力、煤气 地质勘查 交通运输、
牧、渔业 采掘业 制造业 及水的生产 建筑业 业、水利 仓储及邮
合 计 和供应业 管理业 电通信业
年份 Farming, Mining Manufac- Production Constru- Geological Transport,
Total Forestry, and and Supply Prospect- Storage,
Year Animal Quarrying turing of Elec- ction ing and Post and
Husbandry tricity, Water Telecommu-
and Fishery Gas and Conservan- nications
Water cy
1978 100.2 1.7 2.7 55.5 0.2 10.1 12.9
1980 144.5 2.2 4.0 80.4 0.2 16.1 0.1 14.7
1985 312.3 3.7 7.5 151.9 0.5 37.6 0.1 23.7
1986 362.8 4.2 8.6 176.8 0.7 43.6 0.1 27.2
1987 409.1 4.6 9.6 200.8 1.0 50.5 29.8
1988 487.6 5.0 11.6 240.7 1.1 59.6 33.6
1989 534.4 5.3 12.9 266.5 1.3 62.4 36.9
1990 581.0 5.2 16.5 286.2 1.6 66.6 0.4 38.6
1991 658.6 5.6 19.8 319.6 2.2 81.0 0.6 43.1
1992 743.2 5.8 21.2 356.0 2.6 101.2 0.7 47.4
1993 849.9 5.7 20.0 380.7 2.8 147.9 0.6 40.4
1994 1023.3 5.9 21.9 456.6 5.0 165.0 0.7 45.5
1995 1182.0 6.7 26.8 513.8 6.7 196.8 0.8 48.1
1996 1241.0 8.0 27.6 525.3 8.8 205.9 1.0 51.3
1997 1253.4 7.7 29.3 504.7 9.8 212.3 1.9 50.1
1998 1021.6 6.8 21.9 381.1 10.0 181.3 1.4 41.0
1999 962.7 6.9 18.9 335.6 9.4 175.3 1.5 38.4
2000 919.0 7.7 17.2 301.5 9.8 180.8 1.4 33.2
2001 864.6 6.7 17.3 262.7 10.3 178.1 1.2 29.9
2002 828.1 6.8 18.3 237.0 8.9 169.4 1.3 27.4
1-25 续表 continued
单位:亿元 (100 million
批发和零 金融、 房 地 社 会 卫生、体 教育、文化 科学研究 国家机关
售贸易、 育和社会 艺术和广播 和综合技 政党机关和
餐饮业 保险业 产 业 服务业 福利业 电影电视业 术服务业 社会团体 其 他
年份 Wholesale Health Education, Scientific Government
and Finance Real Social Care, Culture Research Agencies, Others
Year Retail and Estate Services Sporting and Arts, and Party Age-
Trade & Insurance Trade and Radio, Polytech- ncies and
Catering Social Film and nical Social Or-
Services Welfare Television Services ganizations
1978 7.8 1.0 0.1 2.7 3.0 1.9 0.5
1980 12.7 1.6 0.3 4.8 4.2 2.6 0.7
1985 63.3 3.1 0.4 8.0 6.8 2.9 0.1 2.7
1986 72.3 4.1 0.5 9.4 8.5 3.3 0.2 3.3
1987 80.5 4.8 0.6 10.7 8.8 3.5 0.3 3.6
1988 97.5 6.3 0.6 12.4 10.7 3.9 0.3 4.2
1989 105.3 7.5 0.7 14.3 11.8 4.3 0.4 4.8
1990 116.8 9.0 0.8 15.4 13.3 4.8 0.6 5.2
1991 130.8 10.3 1.1 18.1 14.7 5.0 0.8 6.1
1992 144.5 13.4 1.1 20.2 15.4 5.7 1.2 6.8
1993 159.2 16.5 1.7 26.4 17.3 6.1 2.9 4.4 4.9
1994 199.6 34.1 3.3 37.4 24.9 7.3 3.4 4.0 8.7
1995 233.7 42.0 4.2 43.4 28.6 11.1 4.5 4.4 10.5
1996 249.0 48.9 4.8 42.2 33.4 10.8 5.2 4.0 14.8

8/2/2019 China Labour Statistical Yearbook - 2004
http://slidepdf.com/reader/full/china-labour-statistical-yearbook-2004 40/464
1997 244.0 57.3 5.5 47.9 38.3 19.7 5.7 3.6 15.7
1998 190.2 57.7 6.0 40.7 39.6 21.2 5.0 3.6 14.0
1999 169.2 63.1 7.5 43.5 44.1 25.4 5.1 3.8 15.0
2000 149.8 66.3 6.7 44.1 47.4 28.3 5.7 4.3 14.9
2001 121.1 72.8 6.8 44.9 52.3 38.1 3.4 3.6 15.4
2002 102.5 80.0 8.5 43.4 54.5 44.7 3.2 3.3 18.7
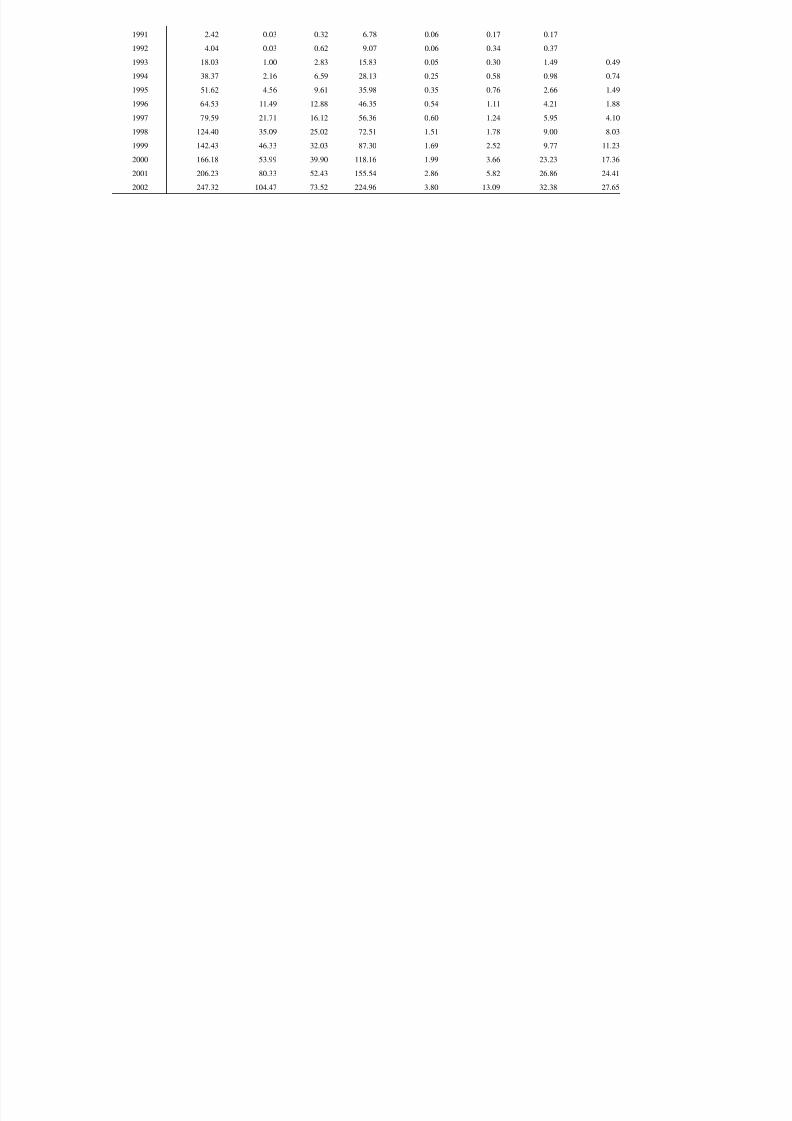
1-26 分行业职工工资总额
1-26
TOTAL WAGES OF STAFF AND WORKERS BY SECTOR
(Other Ownership Units)
单位:亿元 (100 million yuan)
农、林、 电力、煤气 地质勘查 交通运输、
牧、渔业 采掘业 制造业 及水的生产 建筑业 业、水利 仓储及邮
年份 合 计 和供应业 管理业 电通信业
Farming, Mining Manufac- Production Constru- Geological Transport,
Total Forestry, and and Supply Prospect- Storage,
Year Animal Quarrying turing of Elec- ction ing and Post and
Husbandry tricity, Water Telecommu-
and Fishery Gas and Conservan- nications
Water cy
1984 3.61 3.19 0.10 0.09
1985 5.91 0.05 4.59 0.03 0.12 0.17
1986 8.42 0.80 5.60 0.20 0.20 0.23
1987 12.59 0.08 1.20 8.38 0.20 0.20 0.24
1988 21.48 0.14 0.21 16.63 0.10 0.40 0.32
1989 33.87 0.19 0.24 26.63 0.21 0.50 0.50
1990 45.99 0.34 0.18 37.20 0.30 0.55 0.02 0.66
1991 70.43 0.47 0.32 57.12 0.38 0.97 0.03 1.10
1992 105.57 0.59 0.34 86.30 0.60 1.67 0.04 1.31
1993 253.60 0.80 0.60 200.06 2.14 4.83 0.02 4.70
1994 455.62 1.37 1.32 353.63 4.54 9.39 0.02 7.54
1995 637.78 2.10 1.98 492.34 10.59 13.88 0.04 9.81
1996 761.40 2.70 2.22 568.28 12.50 18.97 0.03 13.69
1997 940.80 2.92 3.57 684.36 16.52 25.00 0.03 22.75
1998 1462.43 2.83 37.98 984.80 34.61 80.11 0.07 44.65
1999 1752.00 3.19 62.96 1139.76 47.95 97.34 0.15 67.342000 2124.31 5.23 97.77 1330.77 61.76 116.68 0.32 87.32
2001 2610.70 5.71 125.26 1548.97 80.45 175.52 0.56 119.74
2002 3384.39 8.97 204.68 1895.87 111.57 276.11 1.30 158.70
1-26 续表 continued
单位:亿元 (100 million yuan)
批发和零 金融、 房地 社 会 卫生、体 教育、文化 科学研究
售贸易、 育和社会 艺术和广播 和综合技
餐饮业 保险业 产业 服务业 福利业 电影电视业 术服务业 其 他
年份 Wholesale Health Education, Scientific
and Finance Real Social Care, Culture Research Others
Year Retail and Estate Services Sporting and Arts, and
Trade & Insurance Trade and Radio, Polytech-
Catering Social Film and nical
Services Welfare Television Services
1984 0.23 0.05
1985 0.43 0.40 0.01
1986 0.45 0.03 0.95 0.01
1987 0.66 0.04 1.52 0.01 0.01 0.01
1988 1.03 0.02 0.10 2.60 0.01 0.02 0.01
1989 1.34 0.05 0.02 3.50 0.06 0.06 0.05
1990 1.79 0.03 0.19 4.68 0.02 0.10 0.06
8/2/2019 China Labour Statistical Yearbook - 2004
http://slidepdf.com/reader/full/china-labour-statistical-yearbook-2004 41/464
1991 2.42 0.03 0.32 6.78 0.06 0.17 0.17
1992 4.04 0.03 0.62 9.07 0.06 0.34 0.37
1993 18.03 1.00 2.83 15.83 0.05 0.30 1.49 0.49
1994 38.37 2.16 6.59 28.13 0.25 0.58 0.98 0.74
1995 51.62 4.56 9.61 35.98 0.35 0.76 2.66 1.49
1996 64.53 11.49 12.88 46.35 0.54 1.11 4.21 1.88
1997 79.59 21.71 16.12 56.36 0.60 1.24 5.95 4.10
1998 124.40 35.09 25.02 72.51 1.51 1.78 9.00 8.03
1999 142.43 46.33 32.03 87.30 1.69 2.52 9.77 11.23
2000 166.18 53.99 39.90 118.16 1.99 3.66 23.23 17.36
2001 206.23 80.33 52.43 155.54 2.86 5.82 26.86 24.41
2002 247.32 104.47 73.52 224.96 3.80 13.09 32.38 27.65

8/2/2019 China Labour Statistical Yearbook - 2004
http://slidepdf.com/reader/full/china-labour-statistical-yearbook-2004 42/464
1-27
1-27
TOTAL WAGES OF STAFF AND WORKERS BY SECTOR
(2003)
单位:亿元 (100 million yuan)
合 计 农、林、 采矿业 制造业 电力、燃气 建筑业 交通运输、仓
牧、渔业 及水的生产 储和邮政业
和供应业
登记注册类型 Total Agriculture, Mining Manufac- Production Construc- Traffic,
Forestry, turing & Distri- tion Transport,
Registration Status Farming of bution of Storage
Animals Electri- and post
and city, Gas
Fishery & Water
National 14743.5 322.6 655.6 3621.4 547.6 905.2 980.7
国有单位 9693.8 302.2 363.9 1098.4 401.0 363.6 776.5
State-owned Units
集体单位 829.4 8.5 19.3 220.7 10.1 167.9 30.4
Collective-owned units
其他单位 4220.3 12.0 272.4 2302.3 136.5 373.7 173.7
Other Ownership units
1-27 续表 1 continued
单位:亿元 (100 million y
信息传输、 批发和 住宿和 金融业 房地产业 租赁和商务 科学研究、
计算机服务 零售业 餐饮业 服务业 技术服务和
和软件业 地质勘查业
登记注册类型 Information Wholesale Accommo- Finance Real Tenancy Scientific
Transfer, and dation Estate and Research,
Registration Status Computer Retail and Business Technical
and Trade Restaur- Services Service
Software ants & Geologic
Perambulation
National 331.3 660.5 175.3 646.8 184.0 271.7 427.7
国有单位 169.4 326.0 72.5 413.0 78.5 150.5 356.2
State-owned Units
集体单位 2.1 82.8 12.9 91.5 8.3 30.9 4.9
Collective-owned units
其他单位 159.7 251.7 89.9 142.3 97.2 90.2 66.5
Other Ownership units
1-27 续表 2 continued
单位:亿元 (100 million yuan)
水利、环境 居民服务和 教育 卫生、社会 文化体育 公共管理和
和公共设施 其他服务业 保障和社会 和娱乐业 社会组织
管理业 福利业
登记注册类型 Management Resident Education Sanitation, Culture, Public
of Water Services Social Sports Management
Registration Status Conservancy, and Security and and
Environment Other and Entertain- Social
and Public Services Social ment Organiza-
Establishment Welfare tion
National 197.6 60.1 2007.3 767.6 210.3 1770.5
国有单位 178.6 30.0 1946.4 705.3 196.9 1765.0
State-owned Units
集体单位 10.0 12.1 51.5 57.6 2.8 4.9
Collective-owned units
其他单位 9.0 18.1 9.4 4.6 10.5 0.6
Other Ownership units

8/2/2019 China Labour Statistical Yearbook - 2004
http://slidepdf.com/reader/full/china-labour-statistical-yearbook-2004 43/464
1-28
1-28
AVERAGE WAGE AND INDEX OF STAFF AND WORKERS
BY REGISTRATION STATUS
平均工资(元) 指 数 (以上年为 100)
Average Wage (yuan) Index (preceding year=100)
年 份 合 计 国 有 城镇集体 其 他 合 计 国 有 城镇集体 其 他
单 位 单 位 单 位 单 位 单 位 单 位
Year Total State- Urban Other Total State- Urban Other
owned Collective-
Ownership owned Collective-
Ownership
Units owned Units
Units Units owned Units
Units
1952 445 446 348
1957 624 637 571 103.8 104.4 104.4
1962 551 592 405 108.0 110.2 106.6
1965 590 652 398 100.7 98.6 111.2
1970 561 609 405 97.6 98.5 92.3
1971 560 597 429 99.8 98.0 105.9
1972 588 622 465 105.0 104.2 108.4
1973 587 614 489 99.8 98.7 105.2
1974 584 622 441 99.5 101.3 90.2
1975 580 613 453 99.3 98.6 102.7
1976 575 605 464 99.1 98.7 102.4
1977 576 602 478 100.2 99.5 103.0
1978 615 644 506 106.8 107.0 105.9
1979 668 705 542 108.6 109.5 107.1
1980 762 803 623 114.1 113.9 114.9
1981 772 812 642 101.3 101.1 103.0
1982 798 836 671 103.4 103.0 104.5
1983 826 865 698 103.5 103.5 104.0
1984 974 1034 811 1048 117.9 119.5 116.2
1985 1148 1213 967 1436 117.9 117.3 119.2 137.0
1986 1329 1414 1092 1629 115.8 116.6 112.9 113.4
1987 1459 1546 1207 1879 109.8 109.3 110.5 115.31988 1747 1853 1426 2382 119.7 119.9 118.1 126.8
1989 1935 2055 1557 2707 110.8 110.9 109.2 113.6
1990 2140 2284 1681 2987 110.6 111.1 108.0 110.3
1991 2340 2477 1866 3468 109.3 108.5 111.0 116.1
1992 2711 2878 2109 3966 115.9 116.2 113.0 114.4
1993 3371 3532 2592 4966 124.3 122.7 122.9 125.2
1994 4538 4797 3245 6302 134.6 135.8 125.2 126.9
1995 5500 5625 3931 7463 121.2 117.3 121.1 118.4
1996 6210 6280 4302 8261 112.9 111.6 109.4 110.7
1997 6470 6747 4512 8789 104.2 107.4 104.9 106.4
1998 7479 7668 5331 8972 106.6 106.1 102.5 97.7
1999 8346 8543 5774 9829 111.6 111.4 108.3 109.6
2000 9371 9552 6262 10984 112.3 111.8 108.5 111.8
2001 10870 11178 6867 12140 116.0 117.0 109.7 110.5
2002 12422 12869 7667 13212 114.3 115.1 111.6 108.8
2003 14040 14577 8678 14574 113.0 113.3 113.2 110.3

8/2/2019 China Labour Statistical Yearbook - 2004
http://slidepdf.com/reader/full/china-labour-statistical-yearbook-2004 44/464
1-29
1-29
AVERAGE WAGE OF STAFF AND WORKERS BY SECTOR
单位:元 (yuan)
农、林、 电力、煤气 地质勘查 交通运输、
牧、渔业 采掘业 制造业 及水的生产 建筑业 业、水利 仓储及邮
年份 合 计 和供应业 管理业 电通信业
Farming, Mining Manufac- Production Constru- Geological Transport,
Total Forestry, and and Supply Prospect- Storage,
Year Animal Quarrying turing of Elec- ction ing and Post and
Husbandry tricity, Water Telecommu-
and Fishery Gas and Conservan- nications
Water cy
1978 615 470 676 597 850 714 708 694
1980 762 616 854 752 1035 855 895 832
1985 1148 878 1324 1112 1239 1362 1406 1275
1986 1329 1048 1569 1275 1497 1536 1604 1476
1987 1459 1143 1663 1418 1677 1684 1768 1621 1988 1747 1280 1964 1710 1971 1959 2025 1941
1989 1935 1389 2378 1900 2241 2166 2199 2197
1990 2140 1541 2718 2073 2656 2384 2465 2426
1991 2340 1652 2942 2289 2922 2649 2707 2686
1992 2711 1828 3209 2635 3392 3066 3222 3114
1993 3371 2042 3711 3348 4319 3779 3717 4273
1994 4538 2819 4679 4283 6155 4894 5450 5690
1995 5500 3522 5757 5169 7843 5785 5962 6948
1996 6210 4050 6482 5642 8816 6249 6581 7870
1997 6470 4311 6833 5933 9649 6655 7160 8600
1998 7479 4528 7242 7064 10478 7456 7951 9808
1999 8346 4832 7521 7794 11513 7982 8821 10991
2000 9371 5184 8340 8750 12830 8735 9622 12319
2001 10870 5741 9586 9774 14590 9484 10957 14167
2002 12422 6398 11017 11001 16440 10279 12303 16044
1-29 续表 continued
单位:元 (yuan)
批发和零 金融、 房 地 社 会 卫生、体 教育、文化 科学研究 国家机关
售贸易、 育和社会 艺术和广播 和综合技 政党机关和
餐饮业 保险业 产 业 服务业 福利业 电影电视业 术服务业 社会团体 其 他
年份 Wholesale Health Education, Scientific Government
and Finance Real Social Care, Culture Research Agencies, Others
Year Retail and Estate Services Sporting and Arts, and Party Age-
Trade & Insurance Trade and Radio, Polytech- ncies and
Catering Social Film and nical Social Or-
Services Welfare Television Services ganizations
1978 551 610 548 392 573 545 669 655
1980 692 720 694 475 718 700 851 800
1985 1007 1154 1028 777 1124 1166 1272 1127
1986 1148 1353 1216 980 1343 1330 1492 1356
1987 1270 1458 1327 1085 1446 1409 1620 1468
1988 1556 1739 1715 1719 1752 1747 1931 1707
1989 1660 1867 1925 1926 1959 1883 2118 1874
1990 1818 2097 2243 2170 2209 2117 2403 2113
1991 1981 2255 2507 2431 2370 2243 2573 2275
1992 2204 2829 3106 2844 2812 2715 3115 2768
1993 2679 3740 4320 3588 3413 3278 3904 3505 3371
1994 3537 6712 6288 5026 5126 4923 6162 4962 5213
1995 4248 7376 7330 5982 5860 5435 6846 5526 6295
1996 4661 8406 8337 6778 6790 6144 8048 6340 7184
1997 4845 9734 9190 7553 7599 6759 9049 6981 6838
1998 5865 10633 10302 8333 8493 7474 10241 7773 8481
1999 6417 12046 11505 9263 9664 8510 11601 8978 10068
2000 7190 13478 12616 10339 10930 9482 13620 10043 11098
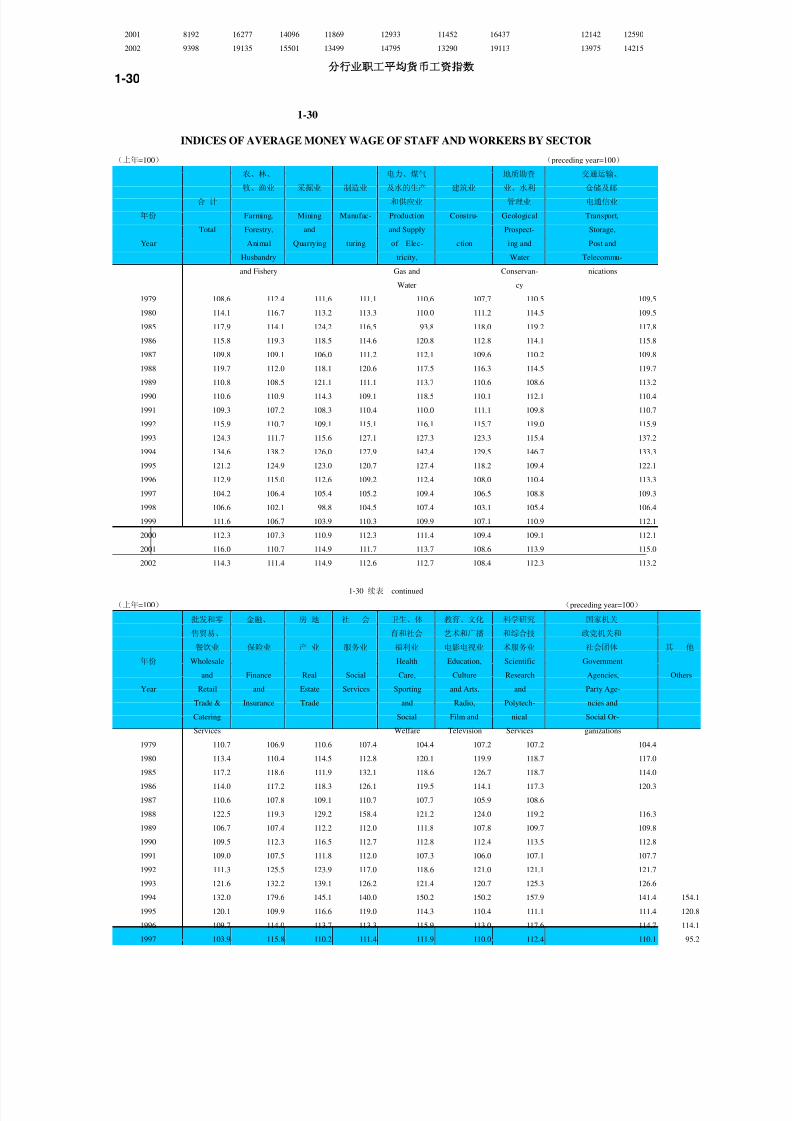
8/2/2019 China Labour Statistical Yearbook - 2004
http://slidepdf.com/reader/full/china-labour-statistical-yearbook-2004 45/464
2001 8192 16277 14096 11869 12933 11452 16437 12142 12590
2002 9398 19135 15501 13499 14795 13290 19113 13975 14215
1-30
1-30
INDICES OF AVERAGE MONEY WAGE OF STAFF AND WORKERS BY SECTOR
(上年=100) (preceding year=100)
农、林、 电力、煤气 地质勘查 交通运输、
牧、渔业 采掘业 制造业 及水的生产 建筑业 业、水利 仓储及邮
合 计 和供应业 管理业 电通信业
年份 Farming, Mining Manufac- Production Constru- Geological Transport,
Total Forestry, and and Supply Prospect- Storage,
Year Animal Quarrying turing of Elec- ction ing and Post and
Husbandry tricity, Water Telecommu-
and Fishery Gas and Conservan- nications
Water cy
1979 108.6 112.4 111.6 111.1 110.6 107.7 110.5 109.5
1980 114.1 116.7 113.2 113.3 110.0 111.2 114.5 109.5 1985 117.9 114.1 124.2 116.5 93.8 118.0 119.2 117.8
1986 115.8 119.3 118.5 114.6 120.8 112.8 114.1 115.8
1987 109.8 109.1 106.0 111.2 112.1 109.6 110.2 109.8
1988 119.7 112.0 118.1 120.6 117.5 116.3 114.5 119.7
1989 110.8 108.5 121.1 111.1 113.7 110.6 108.6 113.2
1990 110.6 110.9 114.3 109.1 118.5 110.1 112.1 110.4
1991 109.3 107.2 108.3 110.4 110.0 111.1 109.8 110.7
1992 115.9 110.7 109.1 115.1 116.1 115.7 119.0 115.9
1993 124.3 111.7 115.6 127.1 127.3 123.3 115.4 137.2
1994 134.6 138.2 126.0 127.9 142.4 129.5 146.7 133.3
1995 121.2 124.9 123.0 120.7 127.4 118.2 109.4 122.1
1996 112.9 115.0 112.6 109.2 112.4 108.0 110.4 113.3
1997 104.2 106.4 105.4 105.2 109.4 106.5 108.8 109.3
1998 106.6 102.1 98.8 104.5 107.4 103.1 105.4 106.4
1999 111.6 106.7 103.9 110.3 109.9 107.1 110.9 112.1
2000 112.3 107.3 110.9 112.3 111.4 109.4 109.1 112.1
2001 116.0 110.7 114.9 111.7 113.7 108.6 113.9 115.0
2002 114.3 111.4 114.9 112.6 112.7 108.4 112.3 113.2
1-30 续表 continued
(上年=100) (preceding year=100)
批发和零 金融、 房 地 社 会 卫生、体 教育、文化 科学研究 国家机关
售贸易、 育和社会 艺术和广播 和综合技 政党机关和
餐饮业 保险业 产 业 服务业 福利业 电影电视业 术服务业 社会团体 其 他
年份 Wholesale Health Education, Scientific Government
and Finance Real Social Care, Culture Research Agencies, Others
Year Retail and Estate Services Sporting and Arts, and Party Age-
Trade & Insurance Trade and Radio, Polytech- ncies and
Catering Social Film and nical Social Or-
Services Welfare Television Services ganizations
1979 110.7 106.9 110.6 107.4 104.4 107.2 107.2 104.4
1980 113.4 110.4 114.5 112.8 120.1 119.9 118.7 117.0
1985 117.2 118.6 111.9 132.1 118.6 126.7 118.7 114.0
1986 114.0 117.2 118.3 126.1 119.5 114.1 117.3 120.31987 110.6 107.8 109.1 110.7 107.7 105.9 108.6
1988 122.5 119.3 129.2 158.4 121.2 124.0 119.2 116.3
1989 106.7 107.4 112.2 112.0 111.8 107.8 109.7 109.8
1990 109.5 112.3 116.5 112.7 112.8 112.4 113.5 112.8
1991 109.0 107.5 111.8 112.0 107.3 106.0 107.1 107.7
1992 111.3 125.5 123.9 117.0 118.6 121.0 121.1 121.7
1993 121.6 132.2 139.1 126.2 121.4 120.7 125.3 126.6
1994 132.0 179.6 145.1 140.0 150.2 150.2 157.9 141.4 154.1
1995 120.1 109.9 116.6 119.0 114.3 110.4 111.1 111.4 120.8
1996 109.7 114.0 113.7 113.3 115.9 113.0 117.6 114.7 114.1
1997 103.9 115.8 110.2 111.4 111.9 110.0 112.4 110.1 95.2
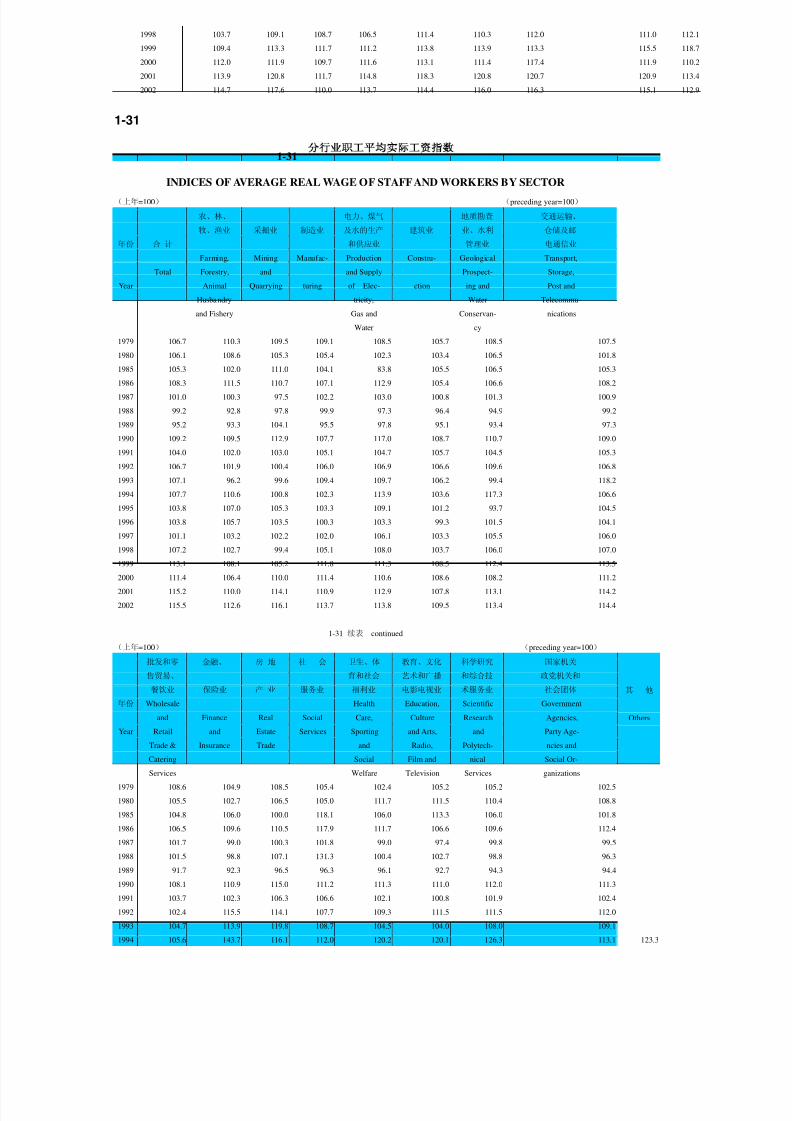
8/2/2019 China Labour Statistical Yearbook - 2004
http://slidepdf.com/reader/full/china-labour-statistical-yearbook-2004 46/464
1998 103.7 109.1 108.7 106.5 111.4 110.3 112.0 111.0 112.1
1999 109.4 113.3 111.7 111.2 113.8 113.9 113.3 115.5 118.7
2000 112.0 111.9 109.7 111.6 113.1 111.4 117.4 111.9 110.2
2001 113.9 120.8 111.7 114.8 118.3 120.8 120.7 120.9 113.4
2002 114.7 117.6 110.0 113.7 114.4 116.0 116.3 115.1 112.9
1-31
1-31
INDICES OF AVERAGE REAL WAGE OF STAFF AND WORKERS BY SECTOR
(上年=100) (preceding year=100)
农、林、 电力、煤气 地质勘查 交通运输、
牧、渔业 采掘业 制造业 及水的生产 建筑业 业、水利 仓储及邮
年份 合 计 和供应业 管理业 电通信业
Farming, Mining Manufac- Production Constru- Geological Transport,
Total Forestry, and and Supply Prospect- Storage,
Year Animal Quarrying turing of Elec- ction ing and Post and
Husbandry tricity, Water Telecommu-
and Fishery Gas and Conservan- nicationsWater cy
1979 106.7 110.3 109.5 109.1 108.5 105.7 108.5 107.5
1980 106.1 108.6 105.3 105.4 102.3 103.4 106.5 101.8
1985 105.3 102.0 111.0 104.1 83.8 105.5 106.5 105.3
1986 108.3 111.5 110.7 107.1 112.9 105.4 106.6 108.2
1987 101.0 100.3 97.5 102.2 103.0 100.8 101.3 100.9
1988 99.2 92.8 97.8 99.9 97.3 96.4 94.9 99.2
1989 95.2 93.3 104.1 95.5 97.8 95.1 93.4 97.3
1990 109.2 109.5 112.9 107.7 117.0 108.7 110.7 109.0
1991 104.0 102.0 103.0 105.1 104.7 105.7 104.5 105.3
1992 106.7 101.9 100.4 106.0 106.9 106.6 109.6 106.8
1993 107.1 96.2 99.6 109.4 109.7 106.2 99.4 118.2
1994 107.7 110.6 100.8 102.3 113.9 103.6 117.3 106.6
1995 103.8 107.0 105.3 103.3 109.1 101.2 93.7 104.5
1996 103.8 105.7 103.5 100.3 103.3 99.3 101.5 104.1
1997 101.1 103.2 102.2 102.0 106.1 103.3 105.5 106.0
1998 107.2 102.7 99.4 105.1 108.0 103.7 106.0 107.0
1999 113.1 108.1 105.2 111.8 111.3 108.5 112.4 113.5
2000 111.4 106.4 110.0 111.4 110.6 108.6 108.2 111.2
2001 115.2 110.0 114.1 110.9 112.9 107.8 113.1 114.2
2002 115.5 112.6 116.1 113.7 113.8 109.5 113.4 114.4
1-31 续表 continued
(上年=100) (preceding year=100)
批发和零 金融、 房 地 社 会 卫生、体 教育、文化 科学研究 国家机关
售贸易、 育和社会 艺术和广播 和综合技 政党机关和
餐饮业 保险业 产 业 服务业 福利业 电影电视业 术服务业 社会团体 其 他
年份 Wholesale Health Education, Scientific Government
and Finance Real Social Care, Culture Research Agencies, Others
Year Retail and Estate Services Sporting and Arts, and Party Age-
Trade & Insurance Trade and Radio, Polytech- ncies and
Catering Social Film and nical Social Or-
Services Welfare Television Services ganizations
1979 108.6 104.9 108.5 105.4 102.4 105.2 105.2 102.5 1980 105.5 102.7 106.5 105.0 111.7 111.5 110.4 108.8
1985 104.8 106.0 100.0 118.1 106.0 113.3 106.0 101.8
1986 106.5 109.6 110.5 117.9 111.7 106.6 109.6 112.4
1987 101.7 99.0 100.3 101.8 99.0 97.4 99.8 99.5
1988 101.5 98.8 107.1 131.3 100.4 102.7 98.8 96.3
1989 91.7 92.3 96.5 96.3 96.1 92.7 94.3 94.4
1990 108.1 110.9 115.0 111.2 111.3 111.0 112.0 111.3
1991 103.7 102.3 106.3 106.6 102.1 100.8 101.9 102.4
1992 102.4 115.5 114.1 107.7 109.3 111.5 111.5 112.0
1993 104.7 113.9 119.8 108.7 104.5 104.0 108.0 109.1
1994 105.6 143.7 116.1 112.0 120.2 120.1 126.3 113.1 123.3

8/2/2019 China Labour Statistical Yearbook - 2004
http://slidepdf.com/reader/full/china-labour-statistical-yearbook-2004 47/464
1995 102.8 94.1 99.8 101.9 97.9 94.5 95.1 95.3 103.4
1996 100.8 104.7 104.5 104.1 106.5 103.9 108.0 105.5 104.9
1997 100.8 112.3 106.9 108.1 108.5 106.7 109.0 106.8 92.3
1998 104.3 109.8 109.4 107.1 112.1 111.0 112.7 111.7 112.8
1999 110.9 114.8 113.1 112.6 115.3 115.4 114.8 117.0 120.3
2000 111.2 111.0 108.8 110.7 112.2 110.5 116.5 111.0 109.4
2001 113.1 119.9 111.0 114.0 117.5 119.9 119.8 120.1 112.7
2002 115.9 118.7 111.1 114.9 115.6 117.2 117.5 116.3 114.0
1-32
1-32
AVERAGE WAGE OF STAFF AND WORKERS BY SECTOR
(State-owned Units)
单位:元 (yuan)
农、林、 电力、煤气 地质勘查 交通运输、
牧、渔业 采掘业 制造业 及水的生产 建筑业 业、水利 仓储及邮
年份 合 计 和供应业 管理业 电通信业
Farming, Mining Manufac- Production Constru- Geological Transport,
Total Forestry, and and Supply Prospecting Storage,
Year Animal Quarrying turing of Elec- ction and Post and
Husbandry tricity, Water Telecommu-
and Fishery Gas and Conservancy nications
Water
1978 644 482 704 663 873 760 712 720
1980 803 628 891 821 1073 924 895 902
1985 1213 892 1384 1190 1272 1532 1408 1383
1986 1414 1062 1638 1382 1518 1731 1607 1610 1987 1546 1154 1734 1543 1692 1882 1773 1773
1988 1853 1291 2038 1872 1994 2192 2025 2140
1989 2055 1401 2449 2081 2248 2419 2199 2423
1990 2284 1559 2763 2289 2648 2667 2463 2697
1991 2477 1665 2982 2505 2883 2924 2718 2967
1992 2878 1845 3239 2889 3354 3406 3235 3452
1993 3532 2043 3856 3562 4317 4182 3729 4604
1994 4797 2821 4863 4508 6124 5498 5476 6212
1995 5625 3527 5944 5352 7734 6512 5987 7572
1996 6280 4038 6709 5798 8701 6992 6610 8546
1997 6747 4304 7091 6008 9541 7388 7180 9303 1998 7668 4522 7499 6981 10324 8171 7968 10302
1999 8543 4813 7732 7611 11239 8734 8843 11345
2000 9552 5132 8283 8554 12458 9512 9651 12613
2001 11178 5702 9446 9590 14132 10299 11005 14318
2002 12869 6326 10601 10876 15799 11231 12296 16030
1-32 续表 continued
单位:元 (yuan)
批发和零 金融、 房 地 社 会 卫生、体 教育、文化 科学研究 国家机关
售贸易、 育和社会 艺术和广播 和综合技 政党机关和
餐饮业 保险业 产 业 服务业 福利业 电影电视业 术服务业 社会团体 其 他
年份 Wholesale Health Education, Scientific Government
and Finance Real Social Care, Culture Research Agencies, Others
Year Retail and Estate Services Sporting and Arts, and Party Age-
Trade and Insurance Trade and Radio, Polytech- ncies and
Catering Social Film and nical Social Or-
Services Welfare Television Services ganizations
1978 569 650 630 607 605 566 670 661
1980 716 754 758 795 751 722 853 807
1985 1087 1234 1170 1208 1164 1184 1268 1133
1986 1268 1427 1364 1417 1376 1344 1494 1361
1987 1398 1540 1500 1545 1481 1422 1624 1472

8/2/2019 China Labour Statistical Yearbook - 2004
http://slidepdf.com/reader/full/china-labour-statistical-yearbook-2004 48/464
1988 1737 1842 1750 1842 1793 1764 1935 1709
1989 1851 1960 1992 2028 1999 1899 2123 1875
1990 2028 2200 2247 2307 2263 2134 2411 2115
1991 2201 2355 2476 2547 2417 2257 2580 2277
1992 2478 2967 3082 3008 2883 2732 3130 2774
1993 2933 3885 4278 3661 3494 3292 3898 3512 3793
1994 3856 7017 5997 5098 5267 4944 6212 4967 5744
1995 4568 7595 6884 5949 6009 5457 6835 5528 6854
1996 4940 8679 7897 6695 6967 6161 7984 6344 7643
1997 5134 10012 8570 7425 7794 6810 8974 6985 6891
1998 6150 10898 9441 8136 8704 7537 10146 7776 8258
1999 6678 12249 10475 9054 9899 8590 11543 8982 9762
2000 7414 13729 11626 9847 11234 9599 13221 10048 10198
2001 8220 16605 13111 11254 13340 11591 16218 12152 11488
2002 9444 19648 14465 12239 15281 13473 19006 13987 13559

8/2/2019 China Labour Statistical Yearbook - 2004
http://slidepdf.com/reader/full/china-labour-statistical-yearbook-2004 49/464
1-33
1-33
INDICES OF AVERAGE MONEY WAGE OF STAFF AND WORKERS BY SECTOR
(State-owned Units)(上年=100) (preceding year=100)
农、林、 电力、煤气 地质勘查 交通运输、
牧、渔业 采掘业 制造业 及水的生产 建筑业 业、水利 仓储及邮
合 计 和供应业 管理业 电通信业
年份 Farming, Mining Manufac- Production Constru- Geological Transport,
Total Forestry, and and Supply Prospect- Storage,
Year Animal Quarrying turing of Elec- ction ing and Post and
Husbandry tricity, Water Telecommu-
& Fishery Gas and Conservan- nications
Water cy
1979 109.5 111.3 111.7 109.4 111.3 107.8 110.5 112.1 1980 113.9 117.1 113.3 113.1 110.5 112.8 113.8 111.6
1985 117.3 113.7 124.4 115.7 93.7 120.1 119.3 118.7
1986 116.6 119.1 118.4 116.2 119.3 113.0 114.1 116.4
1987 109.3 108.7 105.9 111.6 111.5 108.7 110.3 110.1
1988 119.9 111.9 117.5 121.3 117.8 116.5 114.2 120.8
1989 110.9 108.5 120.1 111.2 112.7 110.4 108.6 113.2
1990 111.1 111.3 112.8 110.0 117.8 110.3 112.0 111.3
1991 108.5 106.8 107.9 109.5 108.9 109.6 110.3 110.0
1992 116.2 110.8 108.6 115.3 116.3 116.5 119.0 116.3
1993 122.7 110.7 119.1 123.3 128.7 122.8 115.2 133.4
1994 135.8 138.1 126.1 126.6 141.9 131.5 146.9 134.9
1995 117.3 125.0 122.2 118.7 126.3 118.4 109.3 121.9
1996 111.6 114.5 112.9 108.3 112.5 107.4 110.4 112.9
1997 107.4 106.6 105.7 103.6 109.7 105.7 108.6 108.9
1998 106.1 102.2 99.3 101.7 107.0 100.3 105.2 105.6
1999 111.4 106.4 103.1 109.0 108.9 106.9 111.0 110.1
2000 111.8 106.6 107.1 112.4 110.8 108.9 109.1 111.2
2001 117.0 111.1 114.0 112.1 113.4 108.3 114.0 113.5
2002 115.1 110.9 112.2 113.4 111.8 109.0 111.7 112.0
1-33 续表 continued
(上年=100)
批发和零 金融、 房 地 社 会 卫生、体 教育、文化 科学研究 国家机关
售贸易、 育和社会 艺术和广播 和综合技 政党机关和
餐饮业 保险业 产 业 服务业 福利业 电影电视业 术服务业 社会团体 其 他
年份 Wholesale Health Education, Scientific Government
and Finance Real Social Care, Culture Research Agencies, Others
Year Retail and Estate Services Sporting and Arts, and Party Age-
Trade & Insurance Trade and Radio, Polytech- ncies and
Catering Social Film and nical Social Or-
Services Welfare Television Services ganizations
1979 111.2 106.0 109.5 111.2 103.3 107.1 107.3 104.5
1980 113.2 109.4 109.9 117.7 120.2 119.1 118.6 116.8
1985 140.2 118.9 110.1 122.3 118.6 126.8 118.1 114.11986 116.6 115.6 116.6 117.3 118.3 113.5 117.8 120.2
1987 110.2 107.9 110.0 109.1 107.6 105.8 108.7 108.2
1988 124.3 119.6 116.7 119.2 121.1 124.1 119.2 116.1
1989 106.5 106.4 113.8 110.1 111.5 107.7 109.7 109.7
1990 109.6 112.2 112.8 113.8 113.2 112.4 113.6 112.8
1991 108.5 107.0 110.2 110.4 106.8 105.8 107.0 107.7
1992 112.6 126.0 124.5 118.1 119.3 121.0 121.3 121.8
1993 118.4 130.9 138.8 121.7 121.2 120.5 124.5 126.6
1994 131.5 180.6 140.2 139.3 150.8 150.2 159.4 141.3 151.4
1995 118.5 108.2 114.8 116.7 114.1 110.4 110.0 111.3 119.3
1996 108.1 114.3 114.7 112.5 115.9 112.9 116.8 114.8 111.5

8/2/2019 China Labour Statistical Yearbook - 2004
http://slidepdf.com/reader/full/china-labour-statistical-yearbook-2004 50/464
1997 103.9 115.4 108.5 110.9 111.9 110.5 112.4 110.1 90.2
1998 102.6 108.7 107.3 106.2 111.4 110.4 111.9 111.0 107.6
1999 108.6 112.4 111.0 111.3 113.7 114.0 113.8 115.5 118.2
2000 111.0 112.1 111.0 108.8 113.5 111.7 114.5 111.9 104.5
2001 110.9 120.9 112.8 114.3 118.7 120.8 122.7 120.9 112.6
2002 114.9 118.3 110.3 108.8 114.6 116.2 117.2 115.1 118.0
1-34
1-34
INDICES OF AVERAGE REAL WAGE OF STAFF AND WORKERS BY SECTOR
(State-owned Units)
(上年=100) (preceding year=100)
农、林、 电力、煤气 地质勘查 交通运输、
牧、渔业 采掘业 制造业 及水的生产 建筑业 业、水利 仓储及邮
年份 合 计 和供应业 管理业 电通信业
Farming, Mining Manufac- Production Constru- Geological Transport,
Total Forestry, and and Supply Prospect- Storage,
Year Animal Quarrying turing of Elec- ction ing and Post and
Husbandry tricity, Water Telecommu-
and Fishery Gas and Conservan- nications
Water cy
1979 107.5 109.2 109.6 107.4 109.2 105.8 108.5 110.0
1980 106.0 108.9 105.4 105.2 102.8 104.9 105.8 103.8
1985 104.8 101.6 111.2 103.4 83.8 107.4 106.6 106.1
1986 109.0 111.3 110.6 108.6 111.5 105.6 106.7 108.8
1987 100.5 99.9 97.3 102.6 102.5 100.0 101.4 101.2
1988 99.3 92.7 97.4 100.5 97.6 96.5 94.6 100.0
1989 95.4 93.3 103.3 95.6 96.9 94.9 93.4 97.3
1990 109.7 109.8 111.4 108.6 116.3 108.8 110.6 109.9
1991 103.2 101.7 102.7 104.1 103.6 104.3 105.0 104.7
1992 107.0 102.0 100.0 106.2 107.1 107.2 109.6 107.1
1993 105.7 95.4 102.6 106.2 110.9 105.8 99.3 114.9
1994 108.7 110.5 100.9 101.2 113.5 105.2 117.5 107.9
1995 100.4 107.0 104.6 101.6 108.1 101.4 93.6 104.4
1996 102.6 105.2 103.7 99.6 103.4 98.7 101.5 103.7
1997 104.2 103.4 102.5 100.5 106.4 102.5 105.3 105.6
1998 106.7 102.8 99.9 102.3 107.7 100.9 105.9 106.21999 112.9 107.8 104.5 110.5 110.3 108.3 112.4 111.6
2000 110.9 105.8 106.3 111.5 110.0 108.0 108.3 110.3
2001 116.2 110.3 113.2 111.3 112.6 107.5 113.2 112.7
2002 116.3 112.1 113.4 114.6 112.9 110.2 112.9 113.1
1-34 续表 continued
(上年=100) (preceding
批发和零 金融、 房 地 社 会 卫生、体 教育、文化 科学研究 国家机关
售贸易、 育和社会 艺术和广播 和综合技 政党机关和
餐饮业 保险业 产 业 服务业 福利业 电影电视业 术服务业 社会团体 其 他
年份 Wholesale Health Education, Scientific Government
le and Finance Real Social Care, Culture Research Agencies, Others
Year Retail and Estate Services Sporting and Arts, and Party Age-
Trade & Insurance Trade and Radio, Polytech- ncies and
Catering Social Film and nical Social Or-
Services Welfare Television Services ganizations
1979 109.1 104.0 107.4 109.2 101.4 105.1 105.3 102.6
1980 105.3 101.8 102.2 109.5 111.8 110.8 110.4 108.6
1985 125.3 106.2 98.4 109.3 106.0 113.3 105.5 101.9
1986 109.0 108.1 108.9 109.6 110.5 106.1 110.1 112.3
1987 101.3 99.2 101.1 100.2 98.9 97.2 99.9 99.4
1988 102.9 99.1 96.7 98.8 100.3 102.8 98.7 96.2

8/2/2019 China Labour Statistical Yearbook - 2004
http://slidepdf.com/reader/full/china-labour-statistical-yearbook-2004 51/464
1989 91.6 91.5 97.9 94.6 95.9 92.6 94.3 94.3
1990 108.2 110.8 111.4 112.3 111.8 110.9 112.1 111.4
1991 103.3 101.9 104.8 105.1 101.6 100.6 101.8 102.4
1992 103.7 116.0 114.6 108.7 109.8 111.5 111.7 112.2
1993 102.0 112.8 119.6 104.8 104.4 103.8 107.3 109.0
1994 105.2 144.5 112.1 111.4 120.6 120.1 127.5 113.1 121.
1995 101.4 92.7 98.3 99.9 97.7 94.5 94.2 95.3 102.
1996 99.4 105.0 105.4 103.4 106.6 103.8 107.4 105.5 102.
1997 100.8 111.9 105.2 107.6 108.5 107.2 109.0 106.8 87.
1998 103.2 109.4 107.9 106.8 112.1 111.1 112.6 111.7 108.
1999 110.0 113.9 112.4 112.7 115.2 115.5 115.3 117.0 119.
2000 110.1 111.2 110.1 107.9 112.6 110.9 113.6 111.0 103.
2001 110.1 120.1 112.0 113.5 117.9 119.9 121.8 120.1 111.
2002 116.1 119.5 111.4 109.9 115.7 117.4 118.4 116.3 119.
1-35
1-35
AVERAGE WAGE OF STAFF AND WORKERS BY SECTOR
(Urban Collective-owned Units)
单位:元 (yuan)
农、林、 电力、煤气 地质勘查 交通运输、
牧、渔业 采掘业 制造业 及水的生产 建筑业 业、水利 仓储及邮
合 计 和供应业 管理业 电通信业
年份 Farming, Mining Manufac- Production Constru- Geological Transport,
Total Forestry, and and Supply Prospect- Storage,
Year Animal Quarrying turing of Elec- ction ing and Post and
Husbandry tricity, Water Telecommu-
and Fishery Gas and Conservan- nications
Water cy
1978 506 304 443 503 333 594 600 632
1980 623 458 548 619 333 716 700 676
1985 967 725 852 963 667 1101 900 1009
1986 1092 875 945 1075 875 1232 1286 1139
1987 1207 979 1016 1180 1250 1380 1333 1236
1988 1426 1111 1208 1388 1294 1597 1500 1409
1989 1557 1178 1433 1523 1625 1763 1000 1575
1990 1681 1238 1844 1622 2133 1935 1212 16611991 1866 1366 1960 1798 2588 2216 1765 1854
1992 2109 1487 2000 2017 2737 2554 2188 2070
1993 2592 1887 2327 2469 3539 3182 2843 2711
1994 3245 2510 2793 3076 5734 3936 3692 3110
1995 3931 2927 3680 3717 7461 4677 4294 3584
1996 4302 3814 3968 4007 8324 5092 4784 3961
1997 4512 3945 4164 4120 9064 5466 6342 4057
1998 5331 4358 4567 5016 9470 5941 7017 5163
1999 5774 4878 4545 5327 9834 6296 7636 5707
2000 6262 5536 4857 5722 10707 6873 7509 5816
2001 6867 5654 5517 6088 12250 7260 7605 6322
2002 7667 6415 6067 6749 13051 7745 9599 6940

8/2/2019 China Labour Statistical Yearbook - 2004
http://slidepdf.com/reader/full/china-labour-statistical-yearbook-2004 52/464
1-35 续表 continued
单位:元 (yuan)
批发和零 金融、 房 地 社 会 卫生、体 教育、文化 科学研究 国家机关
售贸易、 育和社会 艺术和广播 和综合技 政党机关和
餐饮业 保险业 产 业 服务业 福利业 电影电视业 术服务业 社会团体 其 他
年份 Wholesale Health Education, Scientific Government
and Finance Real Social Care, Culture Research Agencies, Others
Year Retail and Estate Services Sporting and Arts, and Party Age-
Trade & Insurance Trade and Radio, Polytech- ncies and
Catering Social Film and nical Social Or-
Services Welfare Television Services ganizations
1978 453 526 467 451 484 317 500 455
1980 584 640 638 584 618 433 571 538
1985 912 945 1050 806 975 779 1052 1046
1986 1008 1150 1238 1057 1212 945 1286 1227
1987 1118 1235 1130 1167 1296 1033 1319 1368
1988 1335 1450 1602 1333 1570 1202 1636 1648
1989 1417 1597 1967 1521 1774 1352 1710 1860
1990 1548 1806 1969 1638 1956 1533 1997 2042
1991 1691 1965 2432 1905 2135 1689 2120 2206
1992 1827 2428 2763 2082 2416 1987 2392 2565
1993 2213 3182 4006 2727 2935 2539 3474 3071 254
1994 2823 5625 5290 3754 4238 3548 4719 4411 406
1995 3449 6407 6706 4707 4890 4291 6046 5314 493
1996 3818 6857 6820 5032 5603 4949 7206 5686 567
1997 3873 7634 7687 5663 6294 4955 7749 6244 578
1998 4517 8144 9144 5990 6883 5192 8116 7033 704
1999 4802 9088 10516 6621 7826 5750 8771 7985 813
2000 5089 9754 10371 7269 8521 5854 10434 8899 904
2001 5428 10914 10658 7950 9638 7304 12137 9487 962
2002 5983 12540 11504 8957 10738 8036 12976 10456 1003

8/2/2019 China Labour Statistical Yearbook - 2004
http://slidepdf.com/reader/full/china-labour-statistical-yearbook-2004 53/464
1-36
1-36
INDICES OF AVERAGE MONEY WAGE OF STAFF AND WORKERS BY SECTOR
(Urban Collective-owned Units)
(上年=100) (preceding year=100)
农、林、 电力、煤气 地质勘查 交通运输、
牧、渔业 采掘业 制造业 及水的生产 建筑业 业、水利 仓储及邮
年份 合 计 和供应业 管理业 电通信业
Farming, Mining Manufac- Production Constru- Geological Transport,
Total Forestry, and and Supply Prospect- Storage,
Year Animal Quarrying turing of Elec- ction ing and Post and
Husbandry tricity, Water Telecommu-
and Fishery Gas and Conservan- nications
Water cy
1979 107.1 139.4 107.9 106.4 109.1 109.7 95.2 103.2
1980 114.9 108.3 114.7 115.6 91.7 109.9 122.5 103.6
1985 119.2 117.4 121.4 119.6 108.3 114.8 100.0 114.9
1986 112.9 120.6 110.9 111.6 131.3 111.9 142.9 112.9
1987 110.5 111.9 107.5 109.7 142.9 112.0 103.7 108.6
1988 118.1 113.5 118.9 117.7 103.5 115.7 112.5 114.0
1989 109.2 106.0 118.6 109.7 125.6 110.4 66.7 111.8
1990 108.0 105.1 128.6 106.5 131.3 109.8 121.2 105.5
1991 111.0 110.3 106.3 110.8 121.3 114.5 145.6 111.6
1992 113.0 108.9 102.0 112.2 105.7 115.3 124.0 111.7
1993 122.9 126.9 116.3 122.4 129.3 124.6 130.0 130.9
1994 125.2 133.0 120.0 124.6 162.0 123.7 129.9 114.7
1995 121.1 116.6 131.8 120.8 130.1 118.8 116.3 115.2
1996 109.4 130.3 107.8 107.8 111.6 108.9 111.4 110.5
1997 104.9 103.4 104.9 102.8 108.9 107.3 132.6 102.4
1998 102.5 104.7 94.2 101.8 102.6 101.6 105.3 104.4
1999 108.3 111.9 99.5 106.2 103.8 106.0 108.8 110.5
2000 108.5 113.5 106.9 107.4 108.9 109.2 98.3 101.9
2001 109.7 102.1 113.6 106.4 114.4 105.6 101.3 108.7
2002 111.6 113.5 110.0 110.9 106.5 106.7 126.2 109.8
1-36 续表 continued
(上年=100) (preceding yea
批发和零 金融、 房 地 社 会 卫生、体 教育、文化 科学研究 国家机关
售贸易、 育和社会 艺术和广播 和综合技 政党机关和
餐饮业 保险业 产 业 服务业 福利业 电影电视业 术服务业 社会团体 其
年份 Wholesale Health Education, Scientific Government
and Finance Real Social Care, Culture Research Agencies, Other
Year Retail and Estate Services Sporting and Arts, and Party Age-
Trade & Insurance Trade and Radio, Polytech- ncies and
Catering Social Film and nical Social Or-
Services Welfare Television Services ganizations
1979 110.0 108.6 101.8 117.8 107.9 106.9 100.0 102.6
1980 117.1 112.1 134.2 110.0 118.4 127.7 114.2 115.2
1985 89.7 118.1 122.1 109.5 117.3 122.9 116.9 118.2
1986 110.5 121.7 117.9 131.1 124.3 121.3 122.2 117.3
1987 110.9 107.4 91.3 110.4 106.9 109.3 102.6 111.5
1988 119.4 117.4 141.8 114.3 121.1 116.4 124.0 120.5
1989 106.1 110.1 122.8 114.1 113.0 112.5 104.5 112.9
1990 109.2 113.1 100.1 107.7 110.3 113.4 116.8 109.8
1991 109.3 108.8 123.5 116.3 109.2 110.2 106.2 108.0
1992 108.0 123.6 113.6 109.3 113.2 117.6 112.8 116.3
1993 121.1 131.1 145.0 131.0 121.5 127.8 145.2 119.7

8/2/2019 China Labour Statistical Yearbook - 2004
http://slidepdf.com/reader/full/china-labour-statistical-yearbook-2004 54/464
1994 127.6 176.8 132.0 137.6 144.4 139.7 135.8 143.6
1995 122.2 113.9 126.8 125.4 115.4 120.9 128.1 120.5
1996 110.7 107.0 101.7 106.9 114.6 115.3 119.2 107.0
1997 101.4 111.3 112.7 112.5 112.3 100.1 107.5 109.8
1998 98.5 106.3 110.8 99.3 108.7 104.0 102.5 110.7
1999 106.3 111.6 115.0 110.5 113.7 110.7 108.1 113.5
2000 106.0 107.3 98.6 109.8 108.9 101.8 119.0 111.4
2001 106.7 111.9 102.8 109.4 113.1 124.8 116.3 106.6
2002 110.2 114.9 107.9 112.7 111.4 110.0 106.9 110.2
1-37
1-37
INDICES OF AVERAGE REAL WAGE OF STAFF AND WORKERS BY SECTOR
(Urban Collective-owned Units)
(上年=100) (preceding year=100)
农、林、 电力、煤气 地质勘查 交通运输、
牧、渔业 采掘业 制造业 及水的生产 建筑业 业、水利 仓储及邮
年份 合 计 和供应业 管理业 电通信业
Farming, Mining Manufac- Production Constru- Geological Transport,
Total Forestry, and and Supply Prospect- Storage,
Year Animal Quarrying turing of Elec- ction ing and Post and
Husbandry tricity, Water Telecommu-
and Fishery Gas and Conservan- nications
Water cy
1979 105.1 136.8 105.9 104.4 107.1 107.6 93.5 101.3
1980 106.9 100.8 106.7 107.5 85.3 102.2 114.0 96.4 1985 106.6 104.9 108.5 106.9 96.8 102.6 89.4 102.7
1986 105.5 112.7 103.6 104.3 122.7 104.5 133.5 105.5
1987 101.6 102.8 98.8 100.8 131.3 103.0 95.3 99.8
1988 97.9 94.1 98.5 97.5 85.8 95.9 93.2 94.4
1989 93.9 91.1 102.0 94.3 108.0 94.9 57.3 96.1
1990 106.6 103.8 127.0 105.2 129.6 108.4 119.7 104.1
1991 105.6 105.0 101.2 105.4 115.4 109.0 138.5 106.2
1992 104.1 100.3 93.9 103.3 97.4 106.1 114.1 102.8
1993 105.9 109.3 100.2 105.4 111.4 107.3 112.0 112.8
1994 100.2 106.4 96.0 99.7 129.6 99.0 103.9 91.8
1995 103.7 99.8 112.8 103.5 111.4 101.7 99.6 98.7 1996 100.6 119.8 99.1 99.1 102.5 100.1 102.4 101.6
1997 101.7 100.3 101.7 99.7 105.6 104.1 128.6 99.3
1998 103.1 105.3 94.8 102.4 103.3 102.2 106.0 105.0
1999 109.7 113.4 100.8 107.6 105.2 107.4 110.3 112.0
2000 107.6 112.6 106.0 106.6 108.0 108.3 97.6 101.1
2001 108.9 101.4 112.8 105.7 113.6 104.9 100.6 107.9
2002 112.7 114.6 111.1 112.0 107.6 107.8 127.5 110.9
1-37 续表 continued
(上年=100) (preceding yea
批发和零 金融、 房 地 社 会 卫生、体 教育、文化 科学研究 国家机关
售贸易、 育和社会 艺术和广播 和综合技 政党机关和
餐饮业 保险业 产 业 服务业 福利业 电影电视业 术服务业 社会团体 其 他
年份 Wholesale Health Education, Scientific Government
and Finance Real Social Care, Culture Research Agencies, Others
Year Retail and Estate Services Sporting and Arts, and Party Age-
Trade % Insurance Trade and Radio, Polytech- ncies and
Catering Social Film and nical Social Or-
Services Welfare Television Services ganizations
1979 107.9 106.5 99.9 115.6 105.8 104.9 98.1 100.7
1980 108.9 104.3 124.8 102.3 110.1 118.8 106.2 107.2
1985 80.2 105.6 109.1 97.9 104.9 109.8 104.5 105.6

8/2/2019 China Labour Statistical Yearbook - 2004
http://slidepdf.com/reader/full/china-labour-statistical-yearbook-2004 55/464
1986 103.3 113.7 110.1 122.5 116.2 113.4 114.2 109.6
1987 101.9 98.7 83.9 101.5 98.3 100.5 94.3 102.5
1988 98.9 97.3 117.5 94.7 100.4 96.4 102.8 99.8
1989 91.3 94.7 105.6 98.1 97.2 96.7 89.9 97.0
1990 107.8 111.6 98.8 106.3 108.8 111.9 115.3 108.4
1991 104.0 103.5 117.5 110.7 103.9 104.8 101.0 102.8
1992 99.5 113.8 104.6 100.6 104.2 108.3 103.9 107.1
1993 104.3 112.9 124.9 112.8 104.6 110.1 125.1 103.1
1994 102.1 141.4 105.6 110.1 115.5 111.8 108.7 114.9
1995 104.6 97.5 108.5 107.4 98.8 103.5 109.7 103.1
1996 101.7 98.4 93.5 98.3 105.3 106.0 109.5 98.3
1997 98.4 108.0 109.3 109.1 108.9 97.1 104.3 106.5
1998 99.1 107.0 111.5 99.9 109.3 104.7 103.1 111.4
1999 107.7 113.1 116.5 112.0 115.2 112.2 109.5 115.0
2000 105.1 106.5 97.8 108.9 108.0 101.0 118.0 110.6
2001 105.9 111.1 102.1 108.6 112.3 123.9 115.5 105.9
2002 111.3 116.1 109.0 113.8 112.5 111.1 108.0 111.3

8/2/2019 China Labour Statistical Yearbook - 2004
http://slidepdf.com/reader/full/china-labour-statistical-yearbook-2004 56/464
1-38
1-38
AVERAGE WAGE OF STAFF AND WORKERS BY SECTOR
(Other Ownership Units)单位:元 (yuan)
农、林、 电力、煤气 地质勘查 交通运输、
牧、渔业 采掘业 制造业 及水的生产 建筑业 业、水利 仓储及邮
合 计 和供应业 管理业 电通信业
年份 Farming, Mining Manufac- Production Constru- Geological Transport,
Total Forestry, and and Supply Prospect- Storage,
Year Animal Quarrying turing of Elec- ction ing and Post and
Husbandry tricity, Water Telecommu-
and Fishery Gas and Conservan- nications
Water cy
1984 1048 543 1007 1513 16961985 1436 1519 1270 1328 1270 1000 2429
1986 1629 1806 1528 2299 2543
1987 1879 2106 1789 2503 2760
1988 2382 2560 2239 2462 2104 4000 3368
1989 2707 2938 2427 2889 3232 5000 3846
1990 2987 3778 2270 3055 3088 3571 5714 3667
1991 3468 3760 3855 3626 3333 4641 4615 5500
1992 3966 4069 3579 4154 4238 5061 5263 5955
1993 4966 3905 3423 4874 6309 4464 7441 6450
1994 6303 5394 4233 6096 8005 5766 4362 8713
1995 7463 6992 5174 7245 10746 6798 5408 10492
1996 8261 7389 5217 7945 12030 6937 6464 11931
1997 8789 7061 5385 8367 12127 7517 5770 13734
1998 8972 5685 6749 8556 12158 8983 6909 11858
1999 9829 6740 7651 9316 13856 9540 8439 14241
2000 10984 8519 9842 10192 15486 10391 13064 16173
2001 12140 8473 11246 11074 17256 11139 11892 18737
2002 13212 9553 12870 12027 19271 11358 18553 20864
1-38 续表 continued
单位:元 (yuan)
批发和零 金融、 房 地 社 会 卫生、体 教育、文化 科学研究
售贸易、 育和社会 艺术和广播 和综合技
餐饮业 保险业 产 业 服务业 福利业 电影电视业 术服务业 其 他
年份 Wholesale Health Education, Scientific
and Finance Real Social Care, Culture Research Others
Year Retail and Estate Services Sporting and Arts, and
Trade & Insurance Trade and Radio, Polytech-
Catering Social Film and nical
Services Welfare Television Services1984 1428 2500 1741
1985 1955 2107 1904 3184 1728
1986 1971 2457 2126 1583 2245 2533
1987 2142 2745 2310 2793 2451 1967
1988 2512 3902 1296 2856 2903 2498 2544
1989 2882 4376 1776 3202 2945 3604 3241
1990 3284 5565 2517 3463 5430 4022 3425
1991 3585 6041 4923 4004 4817 4560 3906
1992 4368 9761 5561 4545 5461 5107 5033

8/2/2019 China Labour Statistical Yearbook - 2004
http://slidepdf.com/reader/full/china-labour-statistical-yearbook-2004 57/464
1993 4975 6073 4940 5934 3665 5289 5645 4953
1994 6460 10400 9610 8013 7051 8360 7882 9691
1995 7190 12949 10746 9274 8668 8968 9678 10502
1996 7862 15818 11801 10820 11014 10172 13358 13508
1997 8051 17970 13249 11812 11863 10017 14370 16423
1998 8320 16255 13636 12027 15124 11687 14847 20393
1999 9001 18648 14693 12785 16618 12871 15671 20548
2000 10250 21538 15485 14544 17883 12027 20299 26677
2001 11584 25662 16621 16142 17045 15951 19506 28156
2002 12202 27788 17630 18518 14548 17008 21017 27741
1-39
1-39
INDICES OF AVERAGE MONEY WAGE OF STAFF AND WORKERS BY SECTOR
(Other Ownership Units)
(上年=100) (preceding year=100)
农、林、 电力、煤气 地质勘查 交通运输、
牧、渔业 采掘业 制造业 及水的生产 建筑业 业、水利 仓储及邮
年份 合 计 和供应业 管理业 电通信业
Farming, Mining Manufac- Production Constru- Geological Transport,
Total Forestry, and and Supply Prospect- Storage,
Year Animal Quarrying turing of Elec- ction ing and Post and
Husbandry tricity, Water Telecommu-
and Fishery Gas and Conservan- nications
Water cy
1985 137.0 279.7 131.9 66.1 143.2
1986 113.4 118.9 115.1 229.9 104.7
1987 115.3 116.6 117.1 108.9 108.5
1988 126.8 121.6 137.6 159.8 122.0
1989 113.6 114.8 108.4 117.3 153.6 125.0 114.2
1990 110.3 128.6 93.5 105.7 95.5 71.4 95.3
1991 116.1 99.5 169.8 118.7 107.9 130.0 80.8 150.0
1992 114.4 108.2 92.8 114.6 127.2 109.0 114.0 108.3
1993 125.2 96.0 95.6 117.3 148.9 88.2 141.4 108.3
1994 126.9 138.1 123.7 125.1 126.9 129.2 58.6 135.1
1995 118.4 129.6 122.2 118.8 134.2 117.9 124.0 120.4
1996 110.7 105.7 100.8 109.7 111.9 102.0 119.5 113.7
1997 106.4 95.6 103.2 105.4 100.8 108.4 89.3 115.1
1998 97.7 78.1 117.9 97.6 98.9 113.5 118.8 82.7
1999 109.6 118.6 113.4 108.9 114.0 106.2 122.1 120.1
2000 111.8 126.4 128.6 109.4 111.8 108.9 154.8 113.6
2001 110.5 99.5 114.3 108.7 111.4 107.2 91.0 115.9
2002 108.8 112.7 114.4 108.6 111.7 102.0 156.0 111.4

8/2/2019 China Labour Statistical Yearbook - 2004
http://slidepdf.com/reader/full/china-labour-statistical-yearbook-2004 58/464
1-39 续表 continued
(上年=100) (preceding year=100)
批发和零 金融、 房 地 社 会 卫生、体 教育、文化 科学研究
售贸易、 育和社会 艺术和广播 和综合技
餐饮业 保险业 产 业 服务业 福利业 电影电视业 术服务业 其 他
年份 Wholesale Health Education, Scientific
and Finance Real Social Care, Culture Research Others
Year Retail and Estate Services Sporting and Arts, and
Trade & Insurance Trade and Radio, Polytech-
Catering Social Film and nical
Services Welfare Television Services
1985 136.9 84.3 109.4
1986 100.8 116.6 111.7 70.5 146.6
1987 108.7 111.7 108.7 176.4 109.2 77.7
1988 117.3 142.1 123.6 103.9 101.9 129.3
1989 114.7 112.1 137.0 112.1 101.4 144.3 127.4
1990 113.9 127.2 141.7 108.2 184.4 111.6 105.7
1991 109.2 108.6 195.6 115.6 88.7 113.4 114.0
1992 121.8 161.6 113.0 113.5 113.4 112.0 128.9
1993 113.9 62.2 88.8 130.6 67.1 103.6 112.2
1994 129.8 171.2 194.6 135.0 192.4 158.1 139.6 195.7
1995 111.3 124.5 111.8 115.7 122.9 107.3 122.8 108.4
1996 109.3 122.2 109.8 116.7 127.1 113.4 138.0 128.6
1997 102.4 113.6 112.3 109.2 107.7 98.5 107.6 121.6
1998 97.5 90.4 100.0 100.5 127.4 116.5 102.9 124.2
1999 108.2 114.7 107.8 106.3 109.9 110.1 105.5 100.8
2000 113.9 115.5 105.4 113.8 107.6 93.4 129.5 129.8
2001 113.0 119.1 107.3 111.0 95.3 132.6 96.1 105.5
2002 105.3 108.3 106.1 114.7 85.4 106.6 107.7 98.5

8/2/2019 China Labour Statistical Yearbook - 2004
http://slidepdf.com/reader/full/china-labour-statistical-yearbook-2004 59/464
1-40
1-40
INDICES OF AVERAGE REAL WAGE OF STAFF AND WORKERS BY SECTOR
(Other Ownership Units)(上年=100) (preceding year=100)
农、林、 电力、煤气 地质勘查 交通运输、
牧、渔业 采掘业 制造业 及水的生产 建筑业 业、水利 仓储及邮
年份 合 计 和供应业 管理业 电通信业
Farming, Mining Manufac- Production Constru- Geological Transport,
Total Forestry, and and Supply Prospect- Storage,
Year Animal Quarrying turing of Elec- ction ing and Post and
Husbandry tricity,Gas Water Telecommu-
and Fishery and Water Conservancy nications
1985 122.5 250.0 117.9 59.1 128.0
1986 106.0 111.1 107.5 214.9 97.8
1987 106.0 107.2 107.6 100.1 99.8
1988 105.0 100.7 114.0 132.4 101.1
1989 97.7 98.7 93.2 100.9 132.1 107.5 98.2
1990 108.9 126.9 92.3 104.4 94.3 70.5 94.1
1991 110.5 94.7 161.6 112.9 102.7 123.7 76.8 142.7
1992 105.3 99.6 85.5 105.5 117.1 100.4 105.0 99.7
1993 107.9 82.7 82.4 101.1 128.2 76.0 121.8 93.3
1994 101.5 110.5 98.9 100.1 101.5 103.3 46.9 108.1
1995 101.4 111.0 104.6 101.8 114.9 100.9 106.1 103.1
1996 101.7 97.1 92.7 100.8 102.9 93.8 109.9 104.5
1997 103.2 92.7 100.1 102.3 97.8 105.1 86.6 111.7
1998 98.3 78.6 118.6 98.2 99.5 114.2 119.5 83.2
1999 111.0 120.1 114.9 110.3 115.5 107.6 123.8 121.7
2000 110.9 125.4 127.6 108.5 110.9 108.1 153.6 112.7
2001 109.7 98.8 113.5 107.9 110.7 106.5 90.4 115.0
2002 109.9 113.9 115.6 109.7 112.8 103.0 157.6 112.5
1-40 续表 continued
(上年=100) (preceding year=100)
批发和零 金融、 房 地 社 会 卫生、体 教育、文化 科学研究
售贸易、 育和社会 艺术和广播 和综合技
餐饮业 保险业 产 业 服务业 福利业 电影电视业 术服务业 其 他
年份 Wholesale Health Education, Scientific
and Finance Real Social Care, Culture Research Others
Year Retail and Estate Services Sporting and Arts, and
Trade & Insurance Trade and Radio, Polytech-
Catering Social Film and nical
Services Welfare Television Services
1985 122.3 75.3 97.7
1986 94.2 109.0 104.4 65.9 137.0
1987 99.9 102.7 99.9 162.2 100.3 71.4
1988 97.2 117.8 102.4 86.1 84.4 107.2
1989 98.6 96.4 117.8 96.4 87.2 124.1 109.5
1990 112.5 125.5 139.9 106.8 182.0 110.2 104.3
1991 103.9 103.3 186.1 110.0 84.4 107.9 108.5
1992 112.2 148.8 104.0 104.5 104.4 103.1 118.6
1993 98.1 53.6 76.5 112.5 57.8 89.2 96.6
1994 103.9 137.0 155.6 108.0 153.9 126.5 111.7 156.5
1995 95.3 106.6 95.7 99.1 105.3 91.8 105.1 92.8

8/2/2019 China Labour Statistical Yearbook - 2004
http://slidepdf.com/reader/full/china-labour-statistical-yearbook-2004 60/464
1996 100.5 112.3 100.9 107.2 116.8 104.3 126.9 118.2
1997 99.3 110.2 108.9 105.9 104.5 95.5 104.3 117.9
1998 98.1 90.9 100.6 101.1 128.2 117.2 103.5 124.9
1999 109.6 116.2 109.2 107.7 111.3 111.6 106.9 102.1
2000 113.0 114.6 104.6 112.9 106.8 92.7 128.5 128.8
2001 112.2 118.3 106.6 110.2 94.7 131.7 95.4 104.8
2002 106.4 109.4 107.1 115.9 86.2 107.7 108.8 99.5

8/2/2019 China Labour Statistical Yearbook - 2004
http://slidepdf.com/reader/full/china-labour-statistical-yearbook-2004 61/464
1-41
1-41
AVERAGE WAGE OF STAFF AND WORKERS BY SECTOR
(2003)
单位:元 (yuan)
合 计 农、林、 采矿业 制造业 电力、燃气 建筑业 交通运输、仓
牧、渔业 及水的生产 储和邮政业
和供应业
登记注册类型 Total Agriculture, Mining Manufac- Production Construc- Traffic,
Forestry, turing & Distri- tion Transport,
Registration Status Farming of bution of Storage
Animals Electri- and post
and city, Gas
Fishery & Water
National 14040 6969 13682 12496 18752 11478 15973
国有单位 14577 6912 13888 12601 18226 12739 16234
State-owned Units
集体单位 8678 6125 7178 7600 14911 8375 8212
Collective-owned units
其他单位 14574 10022 14321 13263 20923 12345 17621
Other Ownership units
1-41 续表 1 continued
单位:元 (yuan)
信息传输、 批发和 住宿和 金融业 房地产业 租赁和商务 科学研究、
计算机服务 零售业 餐饮业 服务业 技术服务和
和软件业 地质勘查业
登记注册类型 Information Wholesale Accommo- Finance Real Tenancy Scientific
Transfer, and dation Estate and Research,
Registration Status Computer Retail and Business Technical
and Trade Restaur- Services Service
Software ants & Geologic
Perambulation
National 32244 10939 11083 22457 17182 16501 20636
国有单位 26572 11064 10525 23075 16064 15378 19975
State-owned Units
集体单位 12484 6593 8342 14370 12228 11042 14541
Collective-owned units
其他单位 42867 13710 12179 31370 18898 23281 26061
Other Ownership units
1-41 续表 2 continued
单位:元 (yuan)
水利、环境 居民服务和 教育 卫生、社会 文化体育 公共管理和
和公共设施 其他服务业 保障和社会 和娱乐业 社会组织
管理业 福利业
登记注册类型 Management Resident Education Sanitation, Culture, Public
of Water Services Social Sports Management
Registration Status Conservancy, and Security and and
Environment Other and Entertain- Social
& Public Services Social ment Organiza-
Establishment Welfare tion
National 12095 12900 14399 16352 17268 15533
国有单位 12104 15075 14602 16922 17544 15557
State-owned Units
集体单位 10380 8713 9308 11685 9429 10748
Collective-owned units
其他单位 14560 14046 16163 14102 16121 8765
Other Ownership units
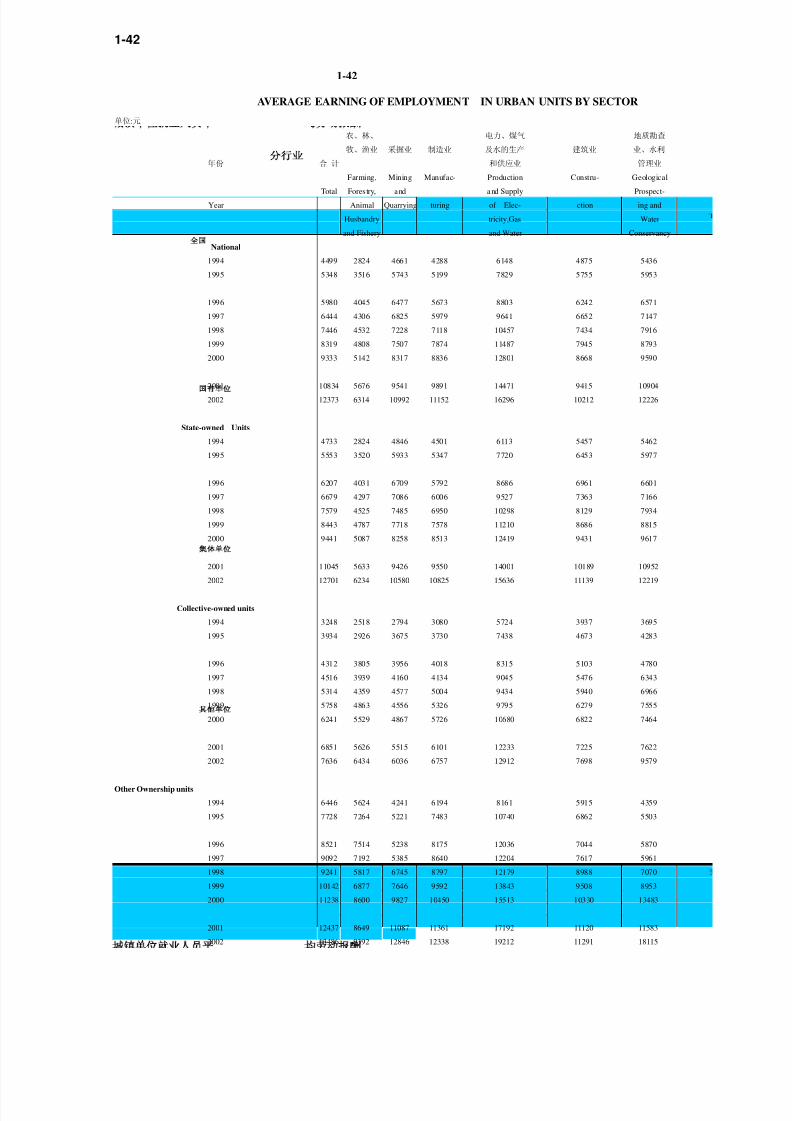
8/2/2019 China Labour Statistical Yearbook - 2004
http://slidepdf.com/reader/full/china-labour-statistical-yearbook-2004 62/464
1-42
1-42
AVERAGE EARNING OF EMPLOYMENT IN URBAN UNITS BY SECTOR
单位:元
农、林、 电力、煤气 地质勘查
牧、渔业 采掘业 制造业 及水的生产 建筑业 业、水利
年份 合 计 和供应业 管理业
Farming, Mining Manufac- Production Constru- Geological
Total Forestry, and and Supply Prospect-
Year Animal Quarrying
turing of Elec- ction ing and
Husbandry tricity,Gas Water
and Fishery and Water Conservancy
National
1994 4499 2824 4661 4288 6148 4875 5436
1995 5348 3516 5743 5199 7829 5755 5953
1996 5980 4045 6477 5673 8803 6242 6571
1997 6444 4306 6825 5979 9641 6652 7147
1998 7446 4532 7228 7118 10457 7434 7916
1999 8319 4808 7507 7874 11487 7945 8793
2000 9333 5142 8317 8836 12801 8668 9590
2001 10834 5676 9541 9891 14471 9415 10904
2002 12373 6314 10992 11152 16296 10212 12226
State-owned Units
1994 4733 2824 4846 4501 6113 5457 5462
1995 5553 3520 5933 5347 7720 6453 5977
1996 6207 4031 6709 5792 8686 6961 6601
1997 6679 4297 7086 6006 9527 7363 7166
1998 7579 4525 7485 6950 10298 8129 7934
1999 8443 4787 7718 7578 11210 8686 8815
2000 9441 5087 8258 8513 12419 9431 9617
2001 11045 5633 9426 9550 14001 10189 10952
2002 12701 6234 10580 10825 15636 11139 12219
Collective-owned units
1994 3248 2518 2794 3080 5724 3937 3695
1995 3934 2926 3675 3730 7438 4673 4283
1996 4312 3805 3956 4018 8315 5103 4780
1997 4516 3939 4160 4134 9045 5476 6343
1998 5314 4359 4577 5004 9434 5940 6966
1999 5758 4863 4556 5326 9795 6279 7555
2000 6241 5529 4867 5726 10680 6822 7464
2001 6851 5626 5515 6101 12233 7225 7622
2002 7636 6434 6036 6757 12912 7698 9579
Other Ownership units
1994 6446 5624 4241 6194 8161 5915 4359
1995 7728 7264 5221 7483 10740 6862 5503
1996 8521 7514 5238 8175 12036 7044 5870
1997 9092 7192 5385 8640 12204 7617 5961
1998 9241 5817 6745 8797 12179 8988 7070
1999 10142 6877 7646 9592 13843 9508 8953
2000 11238 8600 9827 10450 15513 10330 13483
2001 12437 8649 11087 11361 17192 11120 11583
2002 13486 9392 12846 12338 19212 11291 18115

8/2/2019 China Labour Statistical Yearbook - 2004
http://slidepdf.com/reader/full/china-labour-statistical-yearbook-2004 63/464
1-42 continued
单位:元
批发和零 金融、 房 地 社 会
卫生、体 教育、文化 科学研究
售贸易、 育和社会 艺术和广播 和综合技
餐饮业 保险业 产 业 服务业 福利业 电影电视业 术服务业
年份 Wholesale Health Education, Scientific
and Finance Real Social Care, Culture Research
Year Retail and Estate Services Sporting and Arts, and
Trade & Insurance Trade and Radio, Polytech-
Catering Social Film and nical
Services Welfare Television Services
National
1994 3542 6692 6277 5062 5098 4495 6127
1995 4260 7357 7351 6037 5831 4999 6818
1996 4674 8402 8405 6839 6758 5699 7981
1997 4872 9665 9269 7642 7566 6332 8953
1998 5884 10595 10402 8523 8445 7101 10112
1999 6436 11901 11579 9393 9625 8188 11501
2000 7188 13178 12551 10386 10832 9224 13374
2001 8207 15628 14074 11996 12821 11210 16220
2002 9439 18023 15384 13582 14652 13073 18792
State-owned Units
1994 3854 6979 5967 5081 5242 4511 6182
1995 4567 7558 6861 5932 5980 5026 6807
1996 4941 8638 7861 6676 6932 5714 7941
1997 5141 9904 8554 7406 7757 6402 8921
1998 6132 10801 9368 8142 8651 7182 10061
1999 6647 11865 10374 8975 9856 8278 11440
2000 7364 13215 11462 9709 11156 9341 13059
2001 8162 15678 12897 11130 13243 11339 16048
2002 9371 18313 14144 12067 15121 13237 18792
Collective-owned Units
1994 2833 5643 5239 3707 4211 3412 4678
1995 3461 6432 6643 4659 4869 3722 5871
1996 3838 6858 6740 4979 5602 4609 6738
1997 3901 7570 7654 5676 6264 4226 6805
1998 4530 8074 9056 6195 6846 4556 7000
1999 4820 8941 10391 6640 7775 5310 7921
2000 5110 9571 10270 7221 8347 5642 9198
2001 5450 10707 10516 7902 9474 7192 9522
2002 6017 12283 11315 8849 10680 8042 10228
Other Ownership Units
1994 6600 10796 9702 8808 7274 8244 8042
1995 7403 13035 10996 10189 9518 9149 10080
1996 7976 16495 12426 11708 12182 9592 13372
1997 8264 18194 13726 12747 13914 10386 14659
1998 8492 16419 14142 13012 16691 12367 14773
1999 9137 19375 15021 13777 18281 13477 16240
2000 10235 20904 15402 15086 18158 12413 18916
2001 11634 23300 16791 16839 18482 16449 19523
2002 12349 23772 17613 18947 16114 17854 20879

8/2/2019 China Labour Statistical Yearbook - 2004
http://slidepdf.com/reader/full/china-labour-statistical-yearbook-2004 64/464
1-43
1-43
AVERAGE EARNING OF EMPLOYMENT IN URBAN UNITS BY SECTOR
(2003)
单位:元 (yuan)
合 计 农、林、 采矿业 制造业 电力、燃气 建筑业 交通运输、仓
牧、渔业 及水的生产 储和邮政业
和供应业
登记注册类型 Total Agriculture, Mining Manufac- Production Construc- Traffic,
Forestry, turing & Distri- tion Transport,
Registration Status Farming of bution of Storage
Animals Electri- and post
and city, Gas
Fishery & Water
National 13969 6884 13627 12671 18574 11328 15753
国有单位 14358 6819 13819 12520 18030 12495 15973
State-owned Units
集体单位 8627 6127 7194 7594 14774 8311 8100
Collective-owned units
其他单位 14843 10077 14285 13596 20805 12227 17573
Other Ownership units
1-43 续表 1 continued
单位:元 (yuan)
信息传输、 批发和 住宿和 金融业 房地产业 租赁和商务 科学研究、
计算机服务 零售业 餐饮业 服务业 技术服务和
和软件业 地质勘查业
登记注册类型 Information Wholesale Accommo- Finance Real Tenancy Scientific
Transfer, and dation Estate and Research,
Registration Status Computer Retail and Business Technical
and Trade Restaur- Services Service
Software ants & Geologic
Perambulation
National 30897 10894 11198 20780 17085 17020 20442
国有单位 24969 10937 10482 21267 15749 15042 19775
State-owned Units
集体单位 12486 6610 8356 14023 12002 10896 12962
Collective-owned units
其他单位 41911 13665 12425 25374 18898 25742 25591
Other Ownership units
1-43 续表 2 continued
单位:元 (yuan)
水利、环境 居民服务和 教育 卫生、社会 文化体育 公共管理和
和公共设施 其他服务业 保障和社会 和娱乐业 社会组织
管理业 福利业
登记注册类型 Management Resident Education Sanitation, Culture, Public
of Water Services Social Sports Management
Registration Status Conservancy, and Security and and
Environment Other and Entertain- Social
and Public Services Social ment Organiza-
Establishment Welfare tion
National 11774 12665 14189 16185 17098 15355
国有单位 11782 14419 14371 16741 17340 15382
State-owned Units
集体单位 10030 8683 9330 11610 9424 10293
Collective-owned units
其他单位 14392 14038 17986 15110 16565 8763
Other Ownership units

8/2/2019 China Labour Statistical Yearbook - 2004
http://slidepdf.com/reader/full/china-labour-statistical-yearbook-2004 65/464
1-44
1-44
EDUCATIONAL ATTAINMENT COMPOSITION OF EMPLOYMENT BY REGION
单位:% (%)
合 计 不识字 小学 初中 高中 大专 大学本科 研究生
地 区 Region Total 男 女 Illiterate Primary Junior Senior College University Graduate
Male Female and Semi- School School School
illiterate
National 100.0 54.7 45.3 7.1 28.7 43.7 13.6 4.8 1.9 0.1
北 京 Beijing 100.0 61.1 38.9 0.8 5.8 38.6 28.7 12.4 11.9 1.9
天 津 Tianjin 100.0 58.4 41.6 1.8 15.2 43.2 26.3 8.6 4.5 0.4
河 北 Hebei 100.0 55.1 44.9 3.5 23.4 50.5 14.0 6.2 2.4 …
山 西 Shanxi 100.0 60.8 39.2 2.0 21.1 55.2 14.2 5.6 1.9 0.1
内蒙古 Inner Mongolia 100.0 57.0 43.0 9.9 27.6 41.7 13.7 5.3 1.9 0.1
辽 宁 Liaoning 100.0 56.5 43.5 1.7 19.5 51.9 16.0 7.6 3.2 0.1
吉 林 Jilin 100.0 55.3 44.7 1.5 25.5 48.1 17.2 5.4 2.2 0.1
黑龙江 Heilongjiang 100.0 58.4 41.6 2.5 23.2 53.6 14.5 4.7 1.5 0.1
上 海 Shanghai 100.0 59.1 40.9 1.0 5.7 36.9 36.1 12.4 7.3 0.6
江 苏 Jiangsu 100.0 52.9 47.1 8.3 26.7 43.7 15.2 4.1 2.0 0.1
浙 江 Zhejiang 100.0 56.8 43.2 7.8 29.8 40.1 14.3 5.4 2.6 0.2
安 徽 Anhui 100.0 54.3 45.7 10.0 30.0 45.2 9.5 3.8 1.5 …
福 建 Fujian 100.0 57.0 43.0 8.0 32.4 38.4 14.9 4.3 1.8 0.1
江 西 Jiangxi 100.0 56.5 43.5 3.9 28.5 41.4 17.0 7.0 2.2 0.1
山 东 Shandong 100.0 53.8 46.2 8.0 23.7 47.4 13.7 5.1 2.0 0.1
河 南 Henan 100.0 53.6 46.4 5.8 23.7 54.3 12.3 3.2 0.7 …
湖 北 Hubei 100.0 53.3 46.7 8.6 29.9 42.6 13.6 4.1 1.3 0.1
湖 南 Hunan 100.0 54.8 45.2 4.6 32.2 42.0 15.3 4.9 1.0 …
广 东 Guangdong 100.0 54.7 45.3 2.7 27.0 46.6 16.2 5.6 1.8 0.1
广 西 Guangxi 100.0 53.6 46.4 4.9 34.5 43.6 11.3 3.8 1.7 0.1
海 南 Hainan 100.0 54.2 45.8 5.8 23.0 44.6 18.5 6.0 2.1 0.1
重 庆 Chongqing 100.0 52.7 47.3 5.7 38.8 42.2 9.8 2.6 1.1 …
四 川 Sichuan 100.0 53.0 47.0 8.1 37.1 39.8 10.4 3.3 1.3 …
贵 州 Guizhou 100.0 54.6 45.4 16.3 37.7 30.4 8.4 4.7 2.4 0.1
云 南 Yunnan 100.0 53.7 46.3 17.3 51.2 24.8 4.6 1.4 0.6 …
西 藏 Tibet 100.0 48.6 51.4 55.1 36.6 6.1 1.5 0.5 0.1
陕 西 Shaanxi 100.0 53.8 46.2 9.2 24.7 41.0 17.0 5.8 2.2 0.1
甘 肃 Gansu 100.0 53.9 46.1 18.8 30.2 32.7 12.5 4.3 1.5 0.1
青 海 Qinghai 100.0 54.2 45.8 21.2 30.2 30.2 11.4 5.2 1.8 0.1
宁 夏 Ningxia 100.0 53.2 46.8 15.6 29.4 34.4 13.1 6.0 1.7 …
新 疆 Xinjiang 100.0 54.9 45.1 4.9 30.6 38.0 12.9 8.7 4.7 0.2
注:资料来源:2003 年人口变动情况抽样调查(下同)。
a) Data Resource: 2003 Population Changement Sampling Survey (the same as below).

8/2/2019 China Labour Statistical Yearbook - 2004
http://slidepdf.com/reader/full/china-labour-statistical-yearbook-2004 66/464
1-45
1-45
EDUCATIONAL ATTAINMENT COMPOSITION OF MALE EMPLOYMENT BY REGION
单位:% (%)
合 计 不识字 小学 初中 高中 大专 大学本科 研究生
地 区 Region Total Illiterate Primary Junior Senior College University Graduate
and Semi- School School School
illiterate
National 100.0 4.4 25.8 47.2 15.2 5.1 2.2 0.1
北 京 Beijing 100.0 0.8 6.7 42.9 25.5 10.4 11.7 2.1
天 津 Tianjin 100.0 1.5 14.6 45.6 25.2 8.1 4.6 0.4
河 北 Hebei 100.0 2.5 21.0 52.8 15.4 5.9 2.6 …
山 西 Shanxi 100.0 1.7 18.4 58.7 14.3 5.1 1.8 0.1
内蒙古 Inner Mongolia 100.0 6.5 25.5 46.2 14.7 5.1 1.9 0.1
辽 宁 Liaoning 100.0 1.1 18.2 53.8 16.3 7.2 3.2 0.2
吉 林 Jilin 100.0 1.2 23.9 49.1 17.9 5.2 2.5 0.1
黑龙江 Heilongjiang 100.0 1.8 21.1 55.8 15.0 4.6 1.5 0.1
上 海 Shanghai 100.0 0.7 5.2 38.6 35.0 12.3 7.5 0.7
江 苏 Jiangsu 100.0 4.4 23.9 46.3 18.0 4.7 2.5 0.1
浙 江 Zhejiang 100.0 5.7 28.8 42.7 14.4 5.3 2.8 0.2
安 徽 Anhui 100.0 6.2 25.8 50.5 11.1 4.3 2.1 0.1
福 建 Fujian 100.0 3.9 28.4 43.6 17.3 4.6 2.1 0.2
江 西 Jiangxi 100.0 2.5 23.4 44.2 19.0 8.1 2.7 0.1
山 东 Shandong 100.0 4.7 20.1 51.5 15.5 5.7 2.4 0.1
河 南 Henan 100.0 3.6 19.5 58.3 14.3 3.6 0.8 …
湖 北 Hubei 100.0 4.6 26.0 47.6 15.4 4.7 1.6 0.1
湖 南 Hunan 100.0 2.8 29.2 43.7 17.5 5.5 1.3 0.1
广 东 Guangdong 100.0 1.5 21.9 49.3 19.0 5.9 2.3 0.2
广 西 Guangxi 100.0 2.5 30.3 48.1 12.8 4.1 2.1 0.1
海 南 Hainan 100.0 2.8 18.0 47.1 21.9 7.4 2.8 0.1
重 庆 Chongqing 100.0 3.4 36.9 44.8 10.7 2.8 1.4 …
四 川 Sichuan 100.0 5.1 35.9 42.2 11.5 3.6 1.7 …
贵 州 Guizhou 100.0 9.5 36.7 36.8 9.1 4.9 2.8 0.2
云 南 Yunnan 100.0 10.8 50.7 30.9 5.5 1.4 0.7 …
西 藏 Tibet 100.0 47.2 42.5 7.8 1.8 0.6 0.2
陕 西 Shaanxi 100.0 6.1 21.7 44.3 19.0 6.3 2.5 0.1
甘 肃 Gansu 100.0 13.5 27.8 36.5 15.4 4.9 1.8 0.1
青 海 Qinghai 100.0 13.3 31.4 35.5 12.4 5.3 2.0 0.2
宁 夏 Ningxia 100.0 9.2 27.3 40.4 14.7 6.3 2.1 …
新 疆 Xinjiang 100.0 4.1 28.9 40.2 13.6 8.1 4.8 0.3

8/2/2019 China Labour Statistical Yearbook - 2004
http://slidepdf.com/reader/full/china-labour-statistical-yearbook-2004 67/464
1-46
1-46
EDUCATIONAL ATTAINMENT COMPOSITION OF FEMALE EMPLOYMENT BY REGION
单位:% (%)
合 计 不识字 小学 初中 高中 大专 大学本科 研究生
地 区 Region Total Illiterate Primary Junior Senior College University Graduate
and Semi- School School School
illiterate
National 100.0 10.4 32.2 39.5 11.7 4.5 1.5 0.1
北 京 Beijing 100.0 0.8 4.5 31.7 33.6 15.6 12.1 1.7
天 津 Tianjin 100.0 2.4 16.1 39.7 27.7 9.2 4.5 0.4
河 北 Hebei 100.0 4.8 26.5 47.7 12.4 6.6 2.1 …
山 西 Shanxi 100.0 2.4 25.3 49.8 13.9 6.5 2.1 …
内蒙古 Inner Mongolia 100.0 14.4 30.3 35.7 12.3 5.4 1.8 0.1
辽 宁 Liaoning 100.0 2.4 21.2 49.4 15.6 8.1 3.3 0.1
吉 林 Jilin 100.0 1.8 27.5 46.9 16.3 5.5 1.9 …
黑龙江 Heilongjiang 100.0 3.3 26.2 50.4 13.8 4.8 1.5 0.1
上 海 Shanghai 100.0 1.5 6.5 34.4 37.8 12.6 6.9 0.5
江 苏 Jiangsu 100.0 12.7 29.8 40.8 12.0 3.4 1.4 …
浙 江 Zhejiang 100.0 10.5 31.2 36.6 14.0 5.5 2.3 0.1
安 徽 Anhui 100.0 14.5 35.0 38.9 7.6 3.2 0.8 …
福 建 Fujian 100.0 13.5 37.8 31.5 11.9 3.9 1.4 0.1
江 西 Jiangxi 100.0 5.8 35.1 37.6 14.5 5.6 1.5 …
山 东 Shandong 100.0 11.9 27.9 42.7 11.5 4.5 1.5 0.1
河 南 Henan 100.0 8.3 28.6 49.7 10.0 2.8 0.6 …
湖 北 Hubei 100.0 13.1 34.4 36.9 11.5 3.3 0.9 …
湖 南 Hunan 100.0 6.7 35.8 40.0 12.5 4.3 0.8 …
广 东 Guangdong 100.0 4.2 33.2 43.4 12.7 5.2 1.2 0.1
广 西 Guangxi 100.0 7.7 39.4 38.5 9.6 3.6 1.3 …
海 南 Hainan 100.0 9.4 28.9 41.6 14.4 4.3 1.3 0.1
重 庆 Chongqing 100.0 8.2 40.8 39.2 8.8 2.3 0.7 …
四 川 Sichuan 100.0 11.6 38.4 37.1 9.1 3.0 0.9 …
贵 州 Guizhou 100.0 24.6 38.9 22.8 7.5 4.4 2.0 …
云 南 Yunnan 100.0 24.9 51.9 17.7 3.7 1.3 0.4 0.1
西 藏 Tibet 100.0 62.5 31.1 4.5 1.3 0.5 … …
陕 西 Shaanxi 100.0 12.9 28.1 37.2 14.8 5.2 1.8 0.1
甘 肃 Gansu 100.0 25.1 33.0 28.3 9.1 3.4 1.0 …
青 海 Qinghai 100.0 30.6 28.7 23.9 10.1 5.1 1.6 …
宁 夏 Ningxia 100.0 22.7 31.7 27.5 11.3 5.5 1.2 …
新 疆 Xinjiang 100.0 5.9 32.6 35.3 12.0 9.5 4.6 0.2

8/2/2019 China Labour Statistical Yearbook - 2004
http://slidepdf.com/reader/full/china-labour-statistical-yearbook-2004 68/464
1-47
1-47
EDUCATIONAL ATTAINMENT COMPOSITION OF E
BY AGE AND SEX
单位:%
合 计 不识字 小学 初中 高中
年龄 Total Illiterate Primary Junior Senior
Age and Semi- School School School
illiterate
Total 100.0 7.1 28.7 43.7
16-19 100.0 1.7 18.7 72.0
20-24 100.0 1.5 14.6 58.4
25-29 100.0 2.0 18.2 52.6
30-34 100.0 2.6 23.7 50.4
35-39 100.0 3.1 25.8 49.9
40-44 100.0 4.4 23.9 42.345-49 100.0 8.5 35.3 34.5
50-54 100.0 14.2 48.7 25.9
55-59 100.0 18.4 52.5 20.8
60-64 100.0 29.7 51.8 14.4
65+ 100.0 44.7 46.1 7.3
Male 100.0 4.4 25.8 47.2
16-19 100.0 1.4 16.9 74.0
20-24 100.0 1.1 12.9 60.8
25-29 100.0 1.3 15.5 55.4
30-34 100.0 1.5 19.3 53.7
35-39 100.0 1.5 20.0 54.1
40-44 100.0 1.9 17.4 46.5
45-49 100.0 3.8 28.5 41.4
50-54 100.0 6.8 44.8 33.9
55-59 100.0 9.3 51.6 27.0
60-64 100.0 18.3 56.8 19.3
65+ 100.0 33.9 53.8 9.7
Female 100.0 10.4 32.2 39.5
16-19 100.0 1.9 20.6 70.1
20-24 100.0 2.0 16.5 56.0
25-29 100.0 2.8 21.2 49.5
30-34 100.0 3.8 28.6 46.6
35-39 100.0 4.8 32.4 45.1
40-44 100.0 7.3 31.6 37.2
45-49 100.0 14.4 43.9 25.7
50-54 100.0 24.5 54.2 14.7
55-59 100.0 32.7 54.0 11.0
60-64 100.0 48.7 43.5 6.4
65+ 100.0 67.0 29.9 2.4

8/2/2019 China Labour Statistical Yearbook - 2004
http://slidepdf.com/reader/full/china-labour-statistical-yearbook-2004 69/464
1-48
1-48
AGE COMPOSITION OF EMPLOYMENT
BY EDUCATIONAL ATTAINMENT AND SEX
单位:% (%)
合 计 不识字 小学 初中 高中 大专 大学本科 研究生
年龄 Total Illiterate Primary Junior Senior College University Graduate
Age and Semi- School School School
illiterate
Total 100.0 100.0 100.0 100.0 100.0 100.0 100.0 100.0
16-19 4.8 1.1 3.1 7.9 2.5 0.4 0.1
20-24 9.3 2.0 4.7 12.4 12.4 10.8 8.3 1.0
25-29 11.9 3.4 7.5 14.3 14.1 19.7 18.9 13.9
30-34 15.8 5.8 13.1 18.3 16.2 21.6 22.9 25.1
35-39 15.9 6.9 14.3 18.1 15.4 17.7 20.6 31.4
40-44 11.5 7.1 9.6 11.1 18.6 12.4 12.7 16.445-49 11.3 13.5 13.9 8.9 13.5 9.5 7.9 8.3
50-54 8.7 17.3 14.7 5.1 4.6 5.1 4.8 3.2
55-59 5.2 13.4 9.4 2.5 2.0 2.3 2.7 0.3
60-64 2.9 12.0 5.2 1.0 0.6 0.4 0.7 0.1
65+ 2.8 17.7 4.5 0.5 0.3 0.2 0.5 0.3
Male 100.0 100.0 100.0 100.0 100.0 100.0 100.0 100.0
16-19 4.5 1.4 2.9 7.0 2.2 0.3 …
20-24 8.6 2.1 4.3 11.1 10.7 8.2 6.8 0.4
25-29 11.5 3.4 6.9 13.5 13.0 17.1 15.6 11.8
30-34 15.4 5.3 11.5 17.5 15.5 20.3 21.7 23.3
35-39 15.4 5.3 11.9 17.6 15.1 18.1 21.8 32.8
40-44 11.4 4.9 7.7 11.2 18.9 13.8 14.2 17.7
45-49 11.5 9.9 12.7 10.1 14.9 11.1 8.9 9.7
50-54 9.2 14.4 16.0 6.6 5.7 6.7 5.5 3.3
55-59 5.8 12.3 11.6 3.3 2.8 3.6 3.7 0.5
60-64 3.3 13.8 7.2 1.3 0.9 0.6 1.0 0.1
65+ 3.5 27.1 7.3 0.7 0.4 0.3 0.7 0.3
Female 100.0 100.0 100.0 100.0 100.0 100.0 100.0 100.0
16-19 5.2 1.0 3.3 9.3 3.1 0.6 0.2
20-24 10.1 1.9 5.2 14.3 15.0 14.4 11.0 2.5
25-29 12.4 3.4 8.1 15.5 15.8 23.2 24.5 19.1
30-34 16.4 6.0 14.6 19.4 17.1 23.3 25.1 29.4
35-39 16.5 7.7 16.6 18.8 15.7 17.0 18.4 28.0
40-44 11.6 8.2 11.4 10.9 18.2 10.5 9.9 13.1
45-49 11.0 15.3 15.0 7.2 11.4 7.3 6.2 4.8
50-54 8.0 18.7 13.4 3.0 2.9 2.9 3.6 2.8
55-59 4.4 13.9 7.4 1.2 0.6 0.5 0.9
60-64 2.4 11.1 3.2 0.4 0.2 0.2 0.2
65+ 2.0 13.0 1.9 0.1 0.1 0.1 0.1 0.3
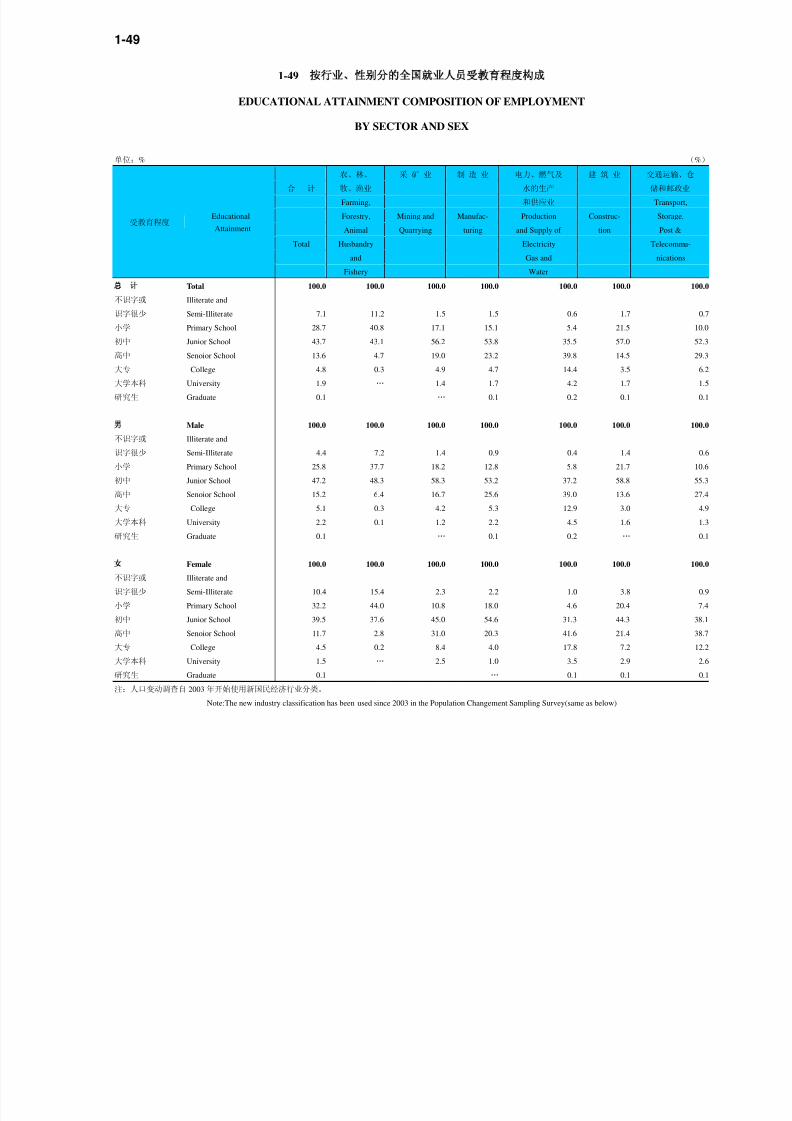
8/2/2019 China Labour Statistical Yearbook - 2004
http://slidepdf.com/reader/full/china-labour-statistical-yearbook-2004 70/464
1-49
1-49
EDUCATIONAL ATTAINMENT COMPOSITION OF EMPLOYMENT
BY SECTOR AND SEX
单位:% (%)
农、林、 采 矿 业 制 造 业 电力、燃气及 建 筑 业 交通运输、仓
合 计 牧、渔业 水的生产 储和邮政业
Farming, 和供应业 Transport,
Forestry, Mining and Manufac- Production Construc- Storage,
Animal Quarrying turing and Supply of tion Post &
Total Husbandry Electricity Telecommu-
and Gas and nications
受教育程度Educational
Attainment
Fishery Water
Total 100.0 100.0 100.0 100.0 100.0 100.0 100.0
不识字或 Illiterate and
识字很少 Semi-Illiterate 7.1 11.2 1.5 1.5 0.6 1.7 0.7
小学 Primary School 28.7 40.8 17.1 15.1 5.4 21.5 10.0
初中 Junior School 43.7 43.1 56.2 53.8 35.5 57.0 52.3
高中 Senoior School 13.6 4.7 19.0 23.2 39.8 14.5 29.3
大专 College 4.8 0.3 4.9 4.7 14.4 3.5 6.2
大学本科 University 1.9 … 1.4 1.7 4.2 1.7 1.5
研究生 Graduate 0.1 … 0.1 0.2 0.1 0.1
Male 100.0 100.0 100.0 100.0 100.0 100.0 100.0
不识字或 Illiterate and
识字很少 Semi-Illiterate 4.4 7.2 1.4 0.9 0.4 1.4 0.6
小学 Primary School 25.8 37.7 18.2 12.8 5.8 21.7 10.6
初中 Junior School 47.2 48.3 58.3 53.2 37.2 58.8 55.3
高中 Senoior School 15.2 6.4 16.7 25.6 39.0 13.6 27.4
大专 College 5.1 0.3 4.2 5.3 12.9 3.0 4.9
大学本科 University 2.2 0.1 1.2 2.2 4.5 1.6 1.3
研究生 Graduate 0.1 … 0.1 0.2 … 0.1
Female 100.0 100.0 100.0 100.0 100.0 100.0 100.0
不识字或 Illiterate and
识字很少 Semi-Illiterate 10.4 15.4 2.3 2.2 1.0 3.8 0.9
小学 Primary School 32.2 44.0 10.8 18.0 4.6 20.4 7.4
初中 Junior School 39.5 37.6 45.0 54.6 31.3 44.3 38.1
高中 Senoior School 11.7 2.8 31.0 20.3 41.6 21.4 38.7
大专 College 4.5 0.2 8.4 4.0 17.8 7.2 12.2
大学本科 University 1.5 … 2.5 1.0 3.5 2.9 2.6
研究生 Graduate 0.1 … 0.1 0.1 0.1
注:人口变动调查自 2003 年开始使用新国民经济行业分类。
Note:The new industry classification has been used since 2003 in the Population Changement Sampling Survey(same as below)

8/2/2019 China Labour Statistical Yearbook - 2004
http://slidepdf.com/reader/full/china-labour-statistical-yearbook-2004 71/464
1-49 1 continued
单位:% (%)
信息传输、 批发和零售业 住宿和餐饮业 金融业 房地产业 租赁和商务 科学研究、
计算机服务 服务业 技术服务和
和软件业 地质勘查业
Data Wholesale Hotel Banking Real Leasing Scientific
Transmission, and and Estate and Research,Computer Retail Catering Business Technical
Service & Trade Services Services Services,&
Software Geological
受教育程度
Educational
Attainment
Prospecting
Total 100.0 100.0 100.0 100.0 100.0 100.0 100.0
不识字或 Illiterate and
识字很少 Semi-Illiterate 0.3 1.9 2.1 0.9 1.0 1.1 0.1
小学 Primary School 1.8 14.5 14.9 3.5 3.4 10.2 2.1
初中 Junior School 18.8 52.5 59.6 11.5 22.4 45.0 18.1
高中 Senoior School 37.0 25.7 20.3 34.6 39.8 31.6 31.0
大专 College 25.6 4.4 2.6 34.6 23.9 9.2 27.8
大学本科 University 15.4 1.1 0.5 14.3 8.9 2.7 19.1
研究生 Graduate 1.1 0.1 0.0 0.6 0.5 0.2 1.9
Male 100.0 100.0 100.0 100.0 100.0 100.0 100.0
不识字或 Illiterate and
识字很少 Semi-Illiterate 0.3 1.2 1.0 0.8 0.5 0.9
小学 Primary School 1.4 13.8 13.0 3.2 3.8 9.4 2.2
初中 Junior School 18.8 52.6 59.8 11.5 24.6 44.8 19.4
高中 Senoior School 33.9 26.0 22.4 33.6 38.9 31.0 30.1
大专 College 25.8 4.9 3.1 35.0 22.1 10.3 25.0
大学本科 University 18.4 1.4 0.6 15.1 9.5 3.5 20.8
研究生 Graduate 1.4 0.1 … 0.8 0.7 0.2 2.5
Female 100.0 100.0 100.0 100.0 100.0 100.0 100.0
不识字或 Illiterate and
识字很少 Semi-Illiterate 0.2 2.6 2.9 1.1 1.7 1.4 0.3
小学 Primary School 2.3 15.0 16.4 3.8 3.0 10.9 1.8
初中 Junior School 18.9 52.4 59.5 11.5 19.3 45.3 15.4
高中 Senoior School 40.9 25.4 18.6 35.7 41.1 32.2 32.8
大专 College 25.5 3.8 2.3 34.2 26.7 8.2 33.3
大学本科 University 11.5 0.8 0.3 13.3 8.0 2.0 15.6
研究生 Graduate 0.8 … 0.3 0.3 0.1 0.7

8/2/2019 China Labour Statistical Yearbook - 2004
http://slidepdf.com/reader/full/china-labour-statistical-yearbook-2004 72/464
1-49 2 continued
单位:% (%)
水利、环境和 居民服务和 教育 卫生、社会 文化、体育 公共管理和 国际组织
公共设施管理业
其他服务业 保障和社会 和娱乐业 社会组织
Water 福利业 Culture
Conservancy, Public Education Public Heal- Sports Public Interna-Environment and th, Social and Adminis- tional
and public other Securities Entertain- trantion Organiza-
Utility Services & Social ment and Social tions
受教育程度 EducationalAttainment
Management Welfare Organizations
Total 100.0 100.0 100.0 100.0 100.0 100.0 100.0
不识字或 Illiterate and
识字很少 Semi-Illiterate 1.1 2.8 0.2 0.7 0.4 0.3 15.6
小学 Primary School 6.1 16.7 1.0 3.6 4.7 1.8 10.9
初中 Junior School 29.7 55.5 6.4 17.9 23.1 12.7 21.4
高中 Senoior School 36.1 20.8 29.2 41.5 35.4 32.8 25.0
大专 College 19.3 3.4 40.9 25.9 24.9 37.1 18.1
大学本科 University 7.6 0.8 21.1 10.0 10.9 14.7 6.4
研究生 Graduate 0.1 0.0 1.1 0.4 0.7 0.6 2.7
Male 100.0 100.0 100.0 100.0 100.0 100.0 100.0
不识字或 Illiterate and
识字很少 Semi-Illiterate 0.9 2.1 0.2 0.5 0.3 0.4 16.6
小学 Primary School 6.1 17.0 1.1 4.6 4.2 2.0 9.1
初中 Junior School 31.0 56.0 5.9 20.8 23.0 13.4 16.6
高中 Senoior School 36.0 20.5 26.6 34.6 36.2 32.6 29.5
大专 College 18.0 3.4 40.7 26.7 24.4 35.9 19.1
大学本科 University 7.7 0.9 24.0 12.2 11.2 15.0 5.2
研究生 Graduate 0.2 0.1 1.5 0.6 0.8 0.7 3.9
Female 100.0 100.0 100.0 100.0 100.0 100.0 100.0
不识字或 Illiterate and
识字很少 Semi-Illiterate 1.5 3.5 0.2 0.9 0.5 0.3 14.1
小学 Primary School 5.9 16.3 1.0 2.7 5.3 1.2 13.5
初中 Junior School 27.0 54.9 6.8 15.6 23.3 10.9 27.9
高中 Senoior School 36.4 21.2 31.6 47.0 34.4 33.3 18.8
大专 College 21.9 3.4 41.2 25.3 25.5 39.9 16.7
大学本科 University 7.3 0.7 18.4 8.3 10.5 14.1 8.0
研究生 Graduate … … 0.8 0.3 0.6 0.4 1.0

8/2/2019 China Labour Statistical Yearbook - 2004
http://slidepdf.com/reader/full/china-labour-statistical-yearbook-2004 73/464
1-50
1-50
EDUCATIONAL ATTAINMENT COMPOSITION OF EMPLOYMENT
BY OCCUPATION AND SEX
单位:% (%)
合计 单 位 专业技术 办事人员 商业服务 农林牧渔 生产运输设备 其他
负责人 人 员 和有关人员 人 员 水利业 操作人员及
生产人员 有关人员
Total Unit Professional Clerk Business Agriculture Production, Others
Head and and Service and Transport
Technical Related Personnel Water Equipment
Personnel Workers Conservancy Operators
Labors and Related
受教育程度Educational
Attainment
Workers
Total 100.0 100.0 100.0 100.0 100.0 100.0 100.0 100.0
不识字或 Illiterate and
识字很少 Semi-Illiterate 7.1 0.8 0.6 0.5 2.0 11.3 1.4 3.1
小学 Primary School 28.7 4.9 4.7 4.8 14.7 40.9 17.0 20.2
初中 Junior School 43.7 23.7 25.5 24.7 55.6 43.1 58.7 55.5
高中 Senoior School 13.6 28.7 30.5 37.3 24.2 4.5 20.7 17.1
大专 College 4.8 27.0 24.4 24.8 3.1 0.2 1.9 3.1
大学本科 University 1.9 13.6 13.6 7.8 0.5 … 0.3 1.0
研究生 Graduate 0.1 1.2 0.7 0.2 … 0.1
Male 100.0 100.0 100.0 100.0 100.0 100.0 100.0 100.0
不识字或 Illiterate and
识字很少 Semi-Illiterate 4.4 0.4 0.5 0.5 1.3 7.3 1.0 2.2
小学 Primary School 25.8 4.4 5.4 5.2 14.3 37.8 16.1 19.9
初中 Junior School 47.2 23.1 30.6 26.3 56.2 48.4 59.6 57.3
高中 Senoior School 15.2 28.9 28.9 35.8 24.3 6.3 21.1 16.9
大专 College 5.1 27.7 20.6 24.0 3.2 0.2 1.9 2.7
大学本科 University 2.2 14.3 13.2 8.0 0.6 … 0.3 0.9
研究生 Graduate 0.1 1.3 0.7 0.3 … 0.1
Female 100.0 100.0 100.0 100.0 100.0 100.0 100.0 100.0
不识字或 Illiterate and
识字很少 Semi-Illiterate 10.4 2.4 0.7 0.7 2.6 15.4 2.3 4.4
小学 Primary School 32.2 7.3 3.4 4.3 14.9 44.1 18.8 20.8初中 Junior School 39.5 26.2 16.8 22.6 55.1 37.7 56.8 52.6
高中 Senoior School 11.7 27.6 33.3 39.2 24.0 2.7 19.9 17.4
大专 College 4.5 24.3 30.9 25.8 3.0 0.1 2.0 3.7
大学本科 University 1.5 11.1 14.3 7.4 0.4 … 0.3 1.1
研究生 Graduate 0.1 1.1 0.7 0.1 … …

8/2/2019 China Labour Statistical Yearbook - 2004
http://slidepdf.com/reader/full/china-labour-statistical-yearbook-2004 74/464
1-51
1-51
OCCUPATION COMPOSITION OF EMPLOYMENT
BY EDUCATIONAL ATTAINMENT AND SEX
单位:% (%)
合计 单位 专业技术 办事人员 商业服务 农林牧渔 生产运输设备 其他
负责人 人员 和有关人员 人员 水利业 操作人员及
生产人员 有关人员
Total Unit Professional Clerk Business Agriculture Production, Others
Head and and Service and Transport
Technical Related Personnel Water Equipment
Personnel Workers Conservancy Operators
Labors and Related
受教育程度Educational
Attainment
Workers
Total 100.0 1.8 6.9 7.7 10.0 57.7 11.0 5.0
不识字或 Illiterate and
识字很少 Semi-Illiterate 100.0 0.2 0.6 0.6 2.8 91.5 2.2 2.2
小学 Primary School 100.0 0.3 1.1 1.3 5.1 82.2 6.5 3.5
初中 Junior School 100.0 1.0 4.0 4.3 12.8 56.9 14.7 6.3
高中 Senoior School 100.0 3.7 15.4 21.0 17.8 19.2 16.6 6.2
大专 College 100.0 10.0 34.8 39.4 6.4 1.9 4.4 3.2
大学本科 University 100.0 12.7 48.9 31.1 2.8 0.4 1.7 2.6
研究生 Graduate 100.0 24.3 54.0 17.0 1.4 0.3 0.2 2.8
Male 100.0 2.6 7.9 8.1 8.5 53.7 13.5 5.6
不识字或 Illiterate and
识字很少 Semi-Illiterate 100.0 0.3 0.9 0.8 2.5 89.5 3.1 2.9
小学 Primary School 100.0 0.4 1.7 1.6 4.7 78.8 8.5 4.3
初中 Junior School 100.0 1.3 5.1 4.5 10.1 55.1 17.1 6.8
高中 Senoior School 100.0 5.0 15.0 19.1 13.7 22.1 18.8 6.2
大专 College 100.0 14.3 32.0 38.2 5.4 2.2 5.0 3.0
大学本科 University 100.0 16.9 47.0 29.2 2.4 0.3 1.9 2.4
研究生 Graduate 100.0 28.3 49.9 17.7 1.1 0.2 2.9
Female 100.0 0.7 5.6 7.1 11.9 62.6 7.8 4.2
不识字或 Illiterate and
识字很少 Semi-Illiterate 100.0 0.2 0.4 0.5 2.9 92.5 1.7 1.8
小学 Primary School 100.0 0.2 0.6 0.9 5.5 85.5 4.6 2.7初中 Junior School 100.0 0.5 2.4 4.1 16.6 59.6 11.3 5.6
高中 Senoior School 100.0 1.8 15.9 23.9 24.3 14.6 13.3 6.3
大专 College 100.0 4.1 38.6 41.0 7.8 1.5 3.5 3.5
大学本科 University 100.0 5.4 52.1 34.5 3.4 0.4 1.3 2.9
研究生 Graduate 100.0 14.3 64.8 15.4 1.6 0.5 0.5 2.7

8/2/2019 China Labour Statistical Yearbook - 2004
http://slidepdf.com/reader/full/china-labour-statistical-yearbook-2004 75/464
1-52
1-52
REGISTRATION TYPE COMPOSITION OF EMPLOYMENT BY AGE AND SEX
单位:% (%)
户口在本地 户口在本省外地 户口在外省 其他
年龄 合计 Residence Card in Residence Card in Other Residence Card in
Age Total This Place Place of This Province Other Province Others
非农 农业 非农 农业 非农 农业
Non- Non- Non-
Agriculture Agriculture Agriculture Agriculture Agriculture Agriculture
Total 100.0 21.9 69.3 3.4 3.0 0.5 1.8 0.1
16-19 100.0 5.8 84.2 1.1 5.1 0.5 3.0 0.1
20-24 100.0 18.9 68.0 3.9 4.9 1.0 3.0 0.3
25-29 100.0 25.2 61.2 5.1 4.3 1.0 3.0 0.2
30-34 100.0 25.8 62.7 4.4 3.7 0.7 2.7 0.135-39 100.0 24.9 66.0 3.5 3.2 0.5 1.8 0.1
40-44 100.0 28.8 63.3 3.8 2.4 0.4 1.3 0.1
45-49 100.0 25.9 68.1 3.1 1.8 0.3 0.7 …
50-54 100.0 18.6 77.0 2.2 1.6 0.2 0.5 …
55-59 100.0 13.5 83.3 1.5 1.2 0.1 0.3 …
60-64 100.0 6.2 91.5 0.8 1.1 0.1 0.2 …
65+ 100.0 4.7 93.6 0.5 0.9 0.1 0.2 …
Male 100.0 23.3 67.6 3.6 3.0 0.6 1.9 0.1
16-19 100.0 5.8 85.8 0.9 4.2 0.5 2.7 0.1
20-24 100.0 18.3 69.7 3.7 3.9 1.0 3.1 0.2
25-29 100.0 24.9 61.6 4.9 4.2 1.0 3.3 0.1
30-34 100.0 26.2 61.6 4.6 3.9 0.8 2.9 0.1
35-39 100.0 26.3 63.5 4.0 3.5 0.6 2.1 0.1
40-44 100.0 30.9 60.1 4.2 2.7 0.5 1.5 0.1
45-49 100.0 28.9 64.2 3.5 2.0 0.4 0.9 0.1
50-54 100.0 23.4 71.2 2.8 1.6 0.3 0.6 …
55-59 100.0 18.3 77.7 2.1 1.3 0.2 0.4 0.1
60-64 100.0 7.7 89.6 1.0 1.3 0.1 0.2 0.1
65+ 100.0 5.2 92.8 0.6 1.0 0.1 0.2 …
Female 100.0 20.3 71.2 3.2 3.1 0.5 1.6 0.1
16-19 100.0 5.8 82.6 1.4 6.1 0.6 3.4 0.1
20-24 100.0 19.4 66.2 4.2 5.9 1.0 2.8 0.3
25-29 100.0 25.5 60.9 5.3 4.4 1.0 2.7 0.2
30-34 100.0 25.3 64.0 4.2 3.4 0.5 2.3 0.1
35-39 100.0 23.3 68.7 3.0 2.9 0.4 1.5 0.1
40-44 100.0 26.2 67.1 3.3 2.2 0.2 1.0 0.1
45-49 100.0 22.2 72.9 2.7 1.5 0.2 0.5 …
50-54 100.0 11.8 85.0 1.3 1.5 0.1 0.3 …
55-59 100.0 5.9 92.1 0.6 1.0 0.1 0.3 …
60-64 100.0 3.8 94.7 0.3 0.8 0.1 0.3 …
65+ 100.0 3.5 95.3 0.3 0.7 … 0.1 …
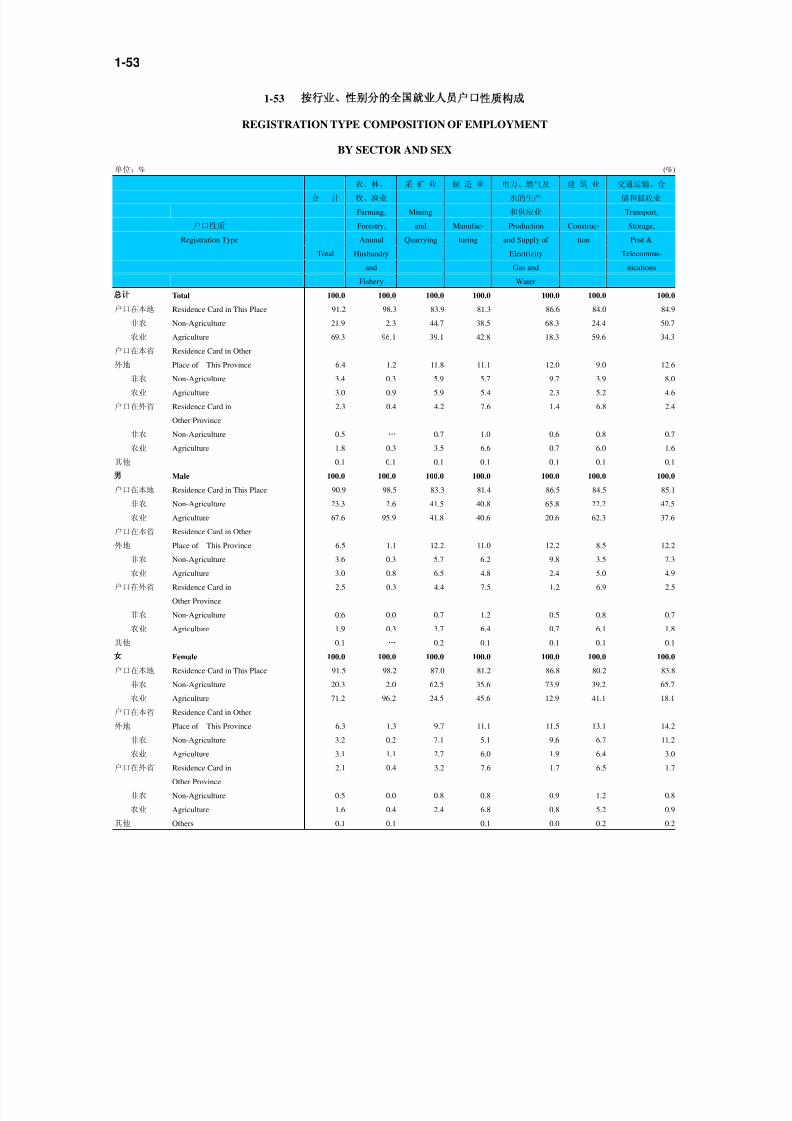
8/2/2019 China Labour Statistical Yearbook - 2004
http://slidepdf.com/reader/full/china-labour-statistical-yearbook-2004 76/464
1-53
1-53
REGISTRATION TYPE COMPOSITION OF EMPLOYMENT
BY SECTOR AND SEX
单位:% (%)
农、林、 采 矿 业 制 造 业 电力、燃气及 建 筑 业 交通运输、仓
合 计 牧、渔业 水的生产 储和邮政业
Farming, Mining 和供应业 Transport,
户口性质 Forestry, and Manufac- Production Construc- Storage,
Registration Type Animal Quarrying turing and Supply of tion Post &
Total Husbandry Electricity Telecommu-
and Gas and nications
Fishery Water
Total 100.0 100.0 100.0 100.0 100.0 100.0 100.0
户口在本地 Residence Card in This Place 91.2 98.3 83.9 81.3 86.6 84.0 84.9
非农 Non-Agriculture 21.9 2.3 44.7 38.5 68.3 24.4 50.7
农业 Agriculture 69.3 96.1 39.1 42.8 18.3 59.6 34.3
户口在本省 Residence Card in Other
外地 Place of This Province 6.4 1.2 11.8 11.1 12.0 9.0 12.6
非农 Non-Agriculture 3.4 0.3 5.9 5.7 9.7 3.9 8.0
农业 Agriculture 3.0 0.9 5.9 5.4 2.3 5.2 4.6
户口在外省 Residence Card in 2.3 0.4 4.2 7.6 1.4 6.8 2.4
Other Province
非农 Non-Agriculture 0.5 … 0.7 1.0 0.6 0.8 0.7
农业 Agriculture 1.8 0.3 3.5 6.6 0.7 6.0 1.6
其他 0.1 0.1 0.1 0.1 0.1 0.1 0.1
Male 100.0 100.0 100.0 100.0 100.0 100.0 100.0
户口在本地 Residence Card in This Place 90.9 98.5 83.3 81.4 86.5 84.5 85.1
非农 Non-Agriculture 23.3 2.6 41.5 40.8 65.8 22.2 47.5
农业 Agriculture 67.6 95.9 41.8 40.6 20.6 62.3 37.6
户口在本省 Residence Card in Other
外地 Place of This Province 6.5 1.1 12.2 11.0 12.2 8.5 12.2
非农 Non-Agriculture 3.6 0.3 5.7 6.2 9.8 3.5 7.3
农业 Agriculture 3.0 0.8 6.5 4.8 2.4 5.0 4.9
户口在外省 Residence Card in 2.5 0.3 4.4 7.5 1.2 6.9 2.5
Other Province
非农 Non-Agriculture 0.6 0.0 0.7 1.2 0.5 0.8 0.7
农业 Agriculture 1.9 0.3 3.7 6.4 0.7 6.1 1.8其他 0.1 … 0.2 0.1 0.1 0.1 0.1
Female 100.0 100.0 100.0 100.0 100.0 100.0 100.0
户口在本地 Residence Card in This Place 91.5 98.2 87.0 81.2 86.8 80.2 83.8
非农 Non-Agriculture 20.3 2.0 62.5 35.6 73.9 39.2 65.7
农业 Agriculture 71.2 96.2 24.5 45.6 12.9 41.1 18.1
户口在本省 Residence Card in Other
外地 Place of This Province 6.3 1.3 9.7 11.1 11.5 13.1 14.2
非农 Non-Agriculture 3.2 0.2 7.1 5.1 9.6 6.7 11.2
农业 Agriculture 3.1 1.1 2.7 6.0 1.9 6.4 3.0
户口在外省 Residence Card in 2.1 0.4 3.2 7.6 1.7 6.5 1.7
Other Province
非农 Non-Agriculture 0.5 0.0 0.8 0.8 0.9 1.2 0.8
农业 Agriculture 1.6 0.4 2.4 6.8 0.8 5.2 0.9
其他 Others 0.1 0.1 0.1 0.0 0.2 0.2

8/2/2019 China Labour Statistical Yearbook - 2004
http://slidepdf.com/reader/full/china-labour-statistical-yearbook-2004 77/464
1-53 1 continued
单位:% (%)
信息传输、 批发和零售业 住宿和 金融业 房地产业 租赁和商务 科学研究、
计算机服务 餐饮业 服务业 技术服务和
和软件业
户口性质 Data Wholesale Hotel Banking Real Leasing Scientific
Registration Type Transmission, and and Estate and Research,Computer Retail Catering Business Technical
Service & Trade Services Services Services,&
Software Geological
Prospecting
Total 100.0 100.0 100.0 100.0 100.0 100.0 100.0
户口在本地 Residence Card in This Place 72.2 76.4 74.5 81.3 78.6 76.4 81.0
非农 Non-Agriculture 58.0 44.4 36.5 71.6 71.0 50.1 74.3
农业 Agriculture 14.2 31.9 38.0 9.7 7.6 26.4 6.7
户口在本省 Residence Card in Other
外地 Place of This Province 20.2 17.5 18.2 17.9 17.3 18.1 15.3
非农 Non-Agriculture 16.3 7.3 6.3 16.5 15.2 10.7 13.4
农业 Agriculture 3.9 10.2 12.0 1.4 2.0 7.4 2.0
户口在外省 Residence Card in 7.4 6.0 7.1 0.6 4.0 5.4 3.5
Other Province
非农 Non-Agriculture 4.4 2.0 1.9 0.5 2.4 2.5 2.0
农业 Agriculture 2.9 4.0 5.2 0.1 1.6 2.9 1.5
其他 0.2 0.2 0.2 0.2 0.1 0.1 0.1
Male 100.0 100.0 100.0 100.0 100.0 100.0 100.0
户口在本地 Residence Card in This Place 70.6 75.3 73.8 81.3 78.5 76.4 80.6
非农 Non-Agriculture 57.1 42.1 36.1 71.3 70.9 49.4 73.4
农业 Agriculture 13.5 33.1 37.7 10.0 7.6 27.0 7.3
户口在本省 Residence Card in Other
外地 Place of This Province 21.6 17.6 18.5 17.8 16.6 17.3 15.2
非农 Non-Agriculture 17.5 7.2 6.3 16.5 14.6 10.3 12.8
农业 Agriculture 4.1 10.4 12.2 1.3 2.0 7.1 2.4
户口在外省 Residence Card in 7.7 7.0 7.5 0.7 4.6 6.1 4.1
Other Province
非农 Non-Agriculture 5.2 2.4 2.1 0.6 2.9 2.7 2.3
农业 Agriculture 2.5 4.5 5.4 0.1 1.7 3.4 1.8
其他 0.2 0.1 0.2 0.2 0.1 0.2 0.1
Female 100.0 100.0 100.0 100.0 100.0 100.0 100.0
户口在本地 Residence Card in This Place 74.4 77.4 75.1 81.3 78.8 76.4 81.8
非农 Non-Agriculture 59.2 46.5 36.8 72.0 71.1 50.6 76.3
农业
Agriculture 15.2 30.9 38.3 9.4 7.6 25.7 5.5户口在本省 Residence Card in Other
外地 Place of This Province 18.5 17.4 18.0 18.0 18.2 18.7 15.7
非农 Non-Agriculture 14.8 7.4 6.2 16.5 16.0 11.1 14.7
农业 Agriculture 3.7 10.0 11.8 1.5 2.2 7.7 1.0
户口在外省 Residence Card in 6.9 5.1 6.7 0.5 3.0 4.7 2.4
Other Province
非农 Non-Agriculture 3.5 1.7 1.7 0.4 1.7 2.3 1.5
农业 Agriculture 3.5 3.4 5.0 0.1 1.4 2.5 0.8
其他 Others 0.2 0.2 0.2 0.1 0.1 0.1

8/2/2019 China Labour Statistical Yearbook - 2004
http://slidepdf.com/reader/full/china-labour-statistical-yearbook-2004 78/464
1-53 2 continued
单位:% (%)
水利、环境和 居民服务和 教育 卫生、社会 文化、体育 公共管理和 国际组织
公共设施管理业
其他服务业 保障和社会 和娱乐业 社会组织
Water 福利业 Culture Public
户口性质 Conservancy, Public Educa- Public Heal- Sports Adminis- Interna-
Registration Type Environment and tion th, Social and trantion tional
and public other Securities Enter- and Social Organiza-
Utility Services & Social tainment Organiza- tions
Management Welfare tions
Total 100.0 100.0 100.0 100.0 100.0 100.0 100.0
户口在本地 Residence Card in This Place 86.8 77.3 88.1 85.1 82.8 87.2 74.2
非农 Non-Agriculture 76.1 41.1 82.2 71.5 70.3 81.0 51.6
农业 Agriculture 10.8 36.2 5.9 13.6 12.6 6.2 22.7
户口在本省 Residence Card in Other
外地 Place of This Province 12.0 16.2 11.0 13.0 13.5 12.3 23.4
非农 Non-Agriculture 10.7 5.9 10.2 10.8 10.9 11.5 19.5
农业 Agriculture 1.3 10.3 0.7 2.1 2.7 0.8 3.9
户口在外省 Residence Card in 0.9 6.3 0.7 1.5 3.4 0.3 2.3
Other Province
非农 Non-Agriculture 0.3 1.4 0.6 0.8 2.0 0.2 1.6
农业 Agriculture 0.6 5.0 0.1 0.7 1.5 0.1 0.8
其他 0.2 0.2 0.2 0.4 0.1 0.1
Male 100.0 100.0 100.0 100.0 100.0 100.0 100.0
户口在本地 Residence Card in This Place 86.9 78.6 89.4 86.0 83.7 87.5 71.6
非农 Non-Agriculture 74.4 39.7 84.6 66.8 71.1 79.9 55.4
农业 Agriculture 12.5 38.9 4.9 19.2 12.6 7.6 16.2
户口在本省 Residence Card in Other
外地 Place of This Province 11.9 14.9 9.9 12.1 12.8 12.0 28.4
非农 Non-Agriculture 10.3 5.0 9.3 9.7 10.7 11.1 23.0
农业 Agriculture 1.5 9.8 0.6 2.3 2.2 0.8 5.4
户口在外省 Residence Card in 1.0 6.3 0.6 1.5 3.3 0.3
Other Province
非农 Non-Agriculture 0.3 1.3 0.5 0.7 2.1 0.2
农业 Agriculture 0.7 5.0 0.1 0.8 1.3 0.2
其他 0.2 0.2 0.1 0.5 0.1 0.2
Female 100.0 100.0 100.0 100.0 100.0 100.0 100.0
户口在本地 Residence Card in This Place 86.8 75.9 87.0 84.3 81.8 86.5 77.8
非农 Non-Agriculture 79.3 42.6 80.0 75.3 69.3 83.5 46.3
农业 Agriculture 7.4 33.3 6.9 9.1 12.5 3.0 31.5
户口在本省 Residence Card in Other
外地 Place of This Province 12.4 17.6 11.9 13.7 14.4 13.2 16.7
非农 Non-Agriculture 11.4 6.8 11.1 11.7 11.1 12.4 14.8
农业 Agriculture 1.0 10.8 0.9 1.9 3.3 0.7 1.9
户口在外省 Residence Card in 0.8 6.3 0.8 1.6 3.6 0.3 5.6
Other Province
非农 Non-Agriculture 0.3 1.4 0.7 1.0 1.9 0.2 3.7
农业 Agriculture 0.5 4.9 0.2 0.6 1.7 0.1 1.9
其他 Others 0.1 0.2 0.3 0.3 0.2 …

8/2/2019 China Labour Statistical Yearbook - 2004
http://slidepdf.com/reader/full/china-labour-statistical-yearbook-2004 79/464
1-54
1-54
REGISTRATION TYPE COMPOSITION OF EMPLOYMENT
BY OCCUPATION AND SEX
单位:% (%)
合计 单 位 专业技术 生产运输 商业服务 农林牧渔 设备操作 其他
负责人 人 员 办事人员 人 员 水利业 人员及
和有关人员 生产人员 有关人员
户口性质 Profes- Produc- Agricul-
Registration Type Total Unit sional tion Business ture and Equipment Others
Head and Transport Service Water Operators
Technical & Related Person- Conservan- & Related
Personnel Workers nel cy Labors Workers
Total 100.0 100.0 100.0 100.0 100.0 100.0 100.0 100.0
户口在本地 Residence Card in This Place 91.2 79.8 83.5 84.5 76.4 98.4 83.0 80.2
非农 Non-Agriculture 21.9 63.3 64.3 71.1 41.6 2.0 35.4 34.7
农业 Agriculture 69.3 16.5 19.2 13.4 34.8 96.4 47.6 45.5
户口在本省 Residence Card in Other
外地 Place of This Province 6.4 16.7 13.5 13.6 17.4 1.2 9.9 12.8
非农 Non-Agriculture 3.4 13.0 10.7 11.4 6.6 0.3 4.5 4.7
农业 Agriculture 3.0 3.7 2.8 2.2 10.7 0.9 5.4 8.1
户口在外省 Residence Card in 2.3 3.3 2.8 1.8 6.1 0.4 7.0 6.8
Other Province
非农 Non-Agriculture 0.5 1.8 1.5 0.9 1.8 … 0.5 1.1
农业 Agriculture 1.8 1.5 1.3 0.9 4.3 0.3 6.5 5.6
其他 0.1 0.1 0.2 0.1 0.1 0.1 0.1 0.2
Male 100.0 100.0 100.0 100.0 100.0 100.0 100.0 100.0
户口在本地 Residence Card in This Place 90.9 80.3 83.2 85.1 76.2 98.6 83.6 81.4
非农 Non-Agriculture 23.3 63.7 60.3 70.5 39.4 2.2 35.2 32.7
农业 Agriculture 67.6 16.6 22.9 14.6 36.7 96.4 48.4 48.7
户口在本省 Residence Card in Other
外地 Place of This Province 6.5 16.4 13.4 13.1 16.9 1.1 9.5 11.9
非农 Non-Agriculture 3.6 12.9 10.0 11.0 6.1 0.3 4.6 4.1
农业 Agriculture 3.0 3.5 3.4 2.1 10.8 0.8 4.9 7.8
户口在外省 Residence Card in 2.5 3.2 3.2 1.7 6.8 0.3 6.8 6.4
Other Province
非农 Non-Agriculture 0.6 1.8 1.7 0.9 2.1 … 0.5 1.0
农业 Agriculture 1.9 1.4 1.6 0.8 4.6 0.3 6.3 5.4其他 0.1 0.1 0.2 0.1 0.1 … 0.1 0.2
Female 100.0 100.0 100.0 100.0 100.0 100.0 100.0 100.0
户口在本地 Residence Card in This Place 91.5 77.8 84.0 83.6 76.5 98.2 81.6 78.2
非农 Non-Agriculture 20.3 61.9 71.1 72.0 43.4 1.8 35.8 38.0
农业 Agriculture 71.2 16.0 13.0 11.7 33.1 96.4 45.9 40.2
户口在本省 Residence Card in Other
外地 Place of This Province 6.3 17.9 13.7 14.3 17.7 1.3 10.7 14.2
非农 Non-Agriculture 3.2 13.4 11.9 12.0 7.1 0.2 4.4 5.7
农业 Agriculture 3.1 4.6 1.8 2.3 10.7 1.1 6.4 8.6
户口在外省 Residence Card in 2.1 4.0 2.1 1.9 5.6 0.4 7.6 7.3
Other Province
非农 Non-Agriculture 0.5 2.0 1.2 1.0 1.6 … 0.6 1.3
农业 Agriculture 1.6 2.0 0.9 0.9 4.0 0.4 7.0 6.0
其他 Others 0.1 0.2 0.2 0.2 0.1 0.1 0.1 0.3

8/2/2019 China Labour Statistical Yearbook - 2004
http://slidepdf.com/reader/full/china-labour-statistical-yearbook-2004 80/464
1-55
1-55
OCCUPATION COMPOSITION OF EMPLOYMENT BY REGISTRATION TYPE AND SEX
单位:% (%)
合计 单 位 专业技术 生产运输 商业服务 农林牧渔 设备操作 其他
负责人 人 员 办事人员 人 员 水利业 人员及
和有关人员 生产人员 有关人员
户口性质 Profes- Produc- Agricul-
Registration Type Total Unit sional tion Business ture and Equipment Others
Head and Transport Service Water Operators
Technical & Related Person- Conservan- & Related
Personnel Workers nel cy Labors Workers
Total 100.0 1.8 6.9 7.7 10.0 57.7 11.0 5.0
户口在本地 Residence Card in This Place 100.0 1.6 6.3 7.1 8.4 62.3 10.0 4.4
非农
Non-Agriculture 100.0 5.1 20.1 24.9 19.1 5.2 17.7 7.9 农业 Agriculture 100.0 0.4 1.9 1.5 5.0 80.4 7.5 3.3
户口在本省 Residence Card in Other
外地 Place of This Province 100.0 4.6 14.4 16.2 27.1 10.7 16.9 9.9
非农 Non-Agriculture 100.0 6.8 21.7 25.9 19.6 4.3 14.7 6.9
农业 Agriculture 100.0 2.2 6.3 5.5 35.5 17.9 19.3 13.3
户口在外省 Residence Card in 100.0 2.6 8.3 5.9 26.6 8.9 33.2 14.5
Other Province
非农 Non-Agriculture 100.0 6.2 19.3 13.3 35.1 4.4 11.2 10.5
农业 Agriculture 100.0 1.5 5.1 3.7 24.1 10.3 39.7 15.7
其他 Others 100.0 2.6 13.3 10.8 14.1 37.7 10.0 11.5
Male 100.0 2.6 7.9 8.1 8.5 53.7 13.5 5.6
户口在本地 Residence Card in This Place 100.0 2.3 7.2 7.6 7.1 58.2 12.4 5.0
非农 Non-Agriculture 100.0 7.2 20.5 24.6 14.4 5.0 20.5 7.9
农业 Agriculture 100.0 0.6 2.7 1.8 4.6 76.6 9.7 4.0
户口在本省 Residence Card in Other
外地 Place of This Province 100.0 6.6 16.2 16.2 22.1 8.9 19.7 10.2
非农 Non-Agriculture 100.0 9.5 22.2 25.0 14.6 4.5 17.6 6.5
农业 Agriculture 100.0 3.1 9.0 5.7 31.0 14.3 22.2 14.7
户口在外省 Residence Card in 100.0 3.3 10.3 5.5 23.0 6.6 36.8 14.4
Other Province
非农 Non-Agriculture 100.0 8.2 22.7 12.3 31.2 3.4 12.3 9.9
农业 Agriculture 100.0 1.9 6.5 3.5 20.6 7.5 44.1 15.8
其他 Others 100.0 4.0 18.2 11.2 13.7 24.9 14.6 13.4
Female 100.0 0.7 5.6 7.1 11.9 62.6 7.8 4.2
户口在本地 Residence Card in This Place 100.0 0.6 5.2 6.5 9.9 67.2 7.0 3.6
非农 Non-Agriculture 100.0 2.3 19.7 25.3 25.5 5.5 13.8 7.9
农业 Agriculture 100.0 0.2 1.0 1.2 5.5 84.7 5.0 2.4
户口在本省 Residence Card in Other
外地 Place of This Province 100.0 2.1 12.2 16.3 33.5 13.0 13.4 9.5
非农 Non-Agriculture 100.0 3.2 21.0 27.0 26.4 4.1 10.8 7.5
农业 Agriculture 100.0 1.1 3.2 5.3 40.7 22.1 16.0 11.6
户口在外省 Residence Card in 100.0 1.4 5.6 6.4 31.6 12.3 28.1 14.5
Other Province
非农 Non-Agriculture 100.0 3.2 14.3 14.8 41.0 5.8 9.6 11.3
农业 Agriculture 100.0 0.9 3.1 3.9 29.0 14.2 33.4 15.5
其他 Others 100.0 1.4 8.8 10.4 14.5 49.3 5.8 9.9

8/2/2019 China Labour Statistical Yearbook - 2004
http://slidepdf.com/reader/full/china-labour-statistical-yearbook-2004 81/464
1-56
1-56
COMPOSITION OF EMPLOYMENT STATUS BY AGE AND SEX
单位:% (%)
城镇单位 乡镇企业 乡村农林牧 私营个体 私营个体 自营
年龄 合计 就业人员 就业人员 渔劳动者 雇员 雇主 劳动者 其他
Age Urban Units Township Agriculture Private Private Self-
Total Employment Enterprises Employment Sector Employer Employed Others
Employment Employee
Total 100.0 17.5 3.0 57.3 10.1 3.4 7.4 1.3
16-19 100.0 5.5 4.4 60.3 23.1 1.2 3.7 1.9
20-24 100.0 16.3 4.2 49.4 20.0 2.2 6.1 1.8
25-29 100.0 21.4 3.9 47.4 14.1 3.7 8.0 1.5
30-34 100.0 21.0 3.3 49.9 11.2 4.2 9.1 1.2
35-39 100.0 19.4 3.1 53.8 9.0 4.4 9.1 1.340-44 100.0 22.6 2.8 52.3 8.1 4.3 8.6 1.3
45-49 100.0 20.1 2.5 58.8 6.3 3.4 7.7 1.2
50-54 100.0 14.2 1.9 69.9 4.4 2.5 5.9 1.1
55-59 100.0 9.5 1.6 77.9 3.1 2.1 4.8 1.0
60-64 100.0 3.1 0.9 87.4 2.2 1.4 4.0 0.9
65+ 100.0 1.6 0.8 89.9 1.7 1.3 3.6 1.2
Male 100.0 19.0 3.2 53.3 10.6 3.9 8.5 1.5
16-19 100.0 4.9 3.9 63.1 20.6 1.2 4.6 1.8
20-24 100.0 15.7 4.3 48.0 20.0 2.4 7.4 2.1
25-29 100.0 21.4 4.1 44.2 15.2 4.2 9.2 1.7
30-34 100.0 22.0 3.5 45.4 12.3 4.8 10.5 1.5
35-39 100.0 21.3 3.4 48.3 9.8 5.1 10.5 1.7
40-44 100.0 25.0 3.2 46.8 8.9 5.1 9.6 1.5
45-49 100.0 23.4 2.9 52.0 7.3 4.0 8.9 1.4
50-54 100.0 18.8 2.5 61.6 5.8 3.1 6.9 1.3
55-59 100.0 13.9 2.1 70.1 4.2 2.6 5.8 1.2
60-64 100.0 4.1 1.4 84.4 2.9 1.7 4.6 1.0
65+ 100.0 2.0 0.9 88.2 2.1 1.5 4.1 1.3
Female 100.0 15.6 2.7 62.2 9.6 2.7 6.1 1.1
16-19 100.0 6.0 4.8 57.5 25.7 1.2 2.7 2.0
20-24 100.0 16.9 4.1 50.8 19.9 2.0 4.8 1.5
25-29 100.0 21.5 3.7 51.0 12.9 3.1 6.7 1.2
30-34 100.0 19.9 3.0 55.0 10.0 3.6 7.6 0.9
35-39 100.0 17.2 2.7 60.0 8.1 3.5 7.5 1.0
40-44 100.0 19.7 2.5 58.8 7.3 3.3 7.4 1.1
45-49 100.0 16.0 2.1 67.3 5.0 2.7 6.1 0.9
50-54 100.0 7.9 1.0 81.6 2.5 1.7 4.5 0.8
55-59 100.0 2.4 0.6 90.3 1.5 1.2 3.2 0.7
60-64 100.0 1.4 0.3 92.6 1.2 1.0 2.9 0.7
65+ 100.0 0.8 0.5 93.6 0.7 0.9 2.5 1.0

8/2/2019 China Labour Statistical Yearbook - 2004
http://slidepdf.com/reader/full/china-labour-statistical-yearbook-2004 82/464
1-57
1-57
AGE COMPOSITION OF EMPLOYMENT BY EMPLOYMENT STATUS AND SEX
单位:% (%)
城镇单位 乡镇企业 乡村农林牧 私营个体 私营个体 自营
年龄 合计 就业人员 就业人员 渔劳动者 雇员 雇主 劳动者 其他
Age Urban Units Township Agriculture Private Private Self-
Total Employment Enterprises Employment Sector Employer Employed Others
Employment Employee
Total 100.0 100.0 100.0 100.0 100.0 100.0 100.0 100.0
16-19 4.8 1.5 7.0 5.0 10.9 1.7 2.4 6.9
20-24 9.3 8.7 13.1 8.0 18.3 6.2 7.7 12.6
25-29 11.9 14.6 15.5 9.8 16.5 13.1 12.9 13.2
30-34 15.8 19.1 17.4 13.8 17.5 20.0 19.5 14.6
35-39 15.9 17.6 16.4 14.9 14.1 20.8 19.4 16.140-44 11.5 14.9 11.0 10.5 9.2 14.7 13.3 11.0
45-49 11.3 13.0 9.6 11.6 7.0 11.5 11.7 10.0
50-54 8.7 7.1 5.6 10.6 3.8 6.5 6.9 7.2
55-59 5.2 2.8 2.7 7.0 1.6 3.2 3.4 3.9
60-64 2.9 0.5 0.9 4.4 0.6 1.2 1.5 2.0
65+ 2.8 0.3 0.7 4.4 0.5 1.1 1.4 2.5
Male 100.0 100.0 100.0 100.0 100.0 100.0 100.0 100.0
16-19 4.5 1.1 5.4 5.3 8.7 1.4 2.4 5.3
20-24 8.6 7.1 11.7 7.8 16.3 5.5 7.5 11.8
25-29 11.5 13.0 14.6 9.5 16.5 12.5 12.5 12.9
30-34 15.4 17.8 16.7 13.1 17.8 19.1 18.9 14.7
35-39 15.4 17.3 16.2 13.9 14.3 20.5 18.9 16.6
40-44 11.4 15.0 11.3 10.0 9.6 15.1 12.9 10.8
45-49 11.5 14.2 10.4 11.2 8.0 12.0 12.1 10.5
50-54 9.2 9.1 7.4 10.7 5.0 7.4 7.5 7.9
55-59 5.8 4.2 3.9 7.6 2.3 3.8 4.0 4.5
60-64 3.3 0.7 1.4 5.2 0.9 1.4 1.8 2.2
65+ 3.5 0.4 1.0 5.8 0.7 1.4 1.7 2.8
Female 100.0 100.0 100.0 100.0 100.0 100.0 100.0 100.0
16-19 5.2 2.0 9.3 4.8 14.0 2.3 2.3 9.7
20-24 10.1 10.9 15.1 8.2 20.9 7.4 7.9 14.0
25-29 12.4 17.0 16.8 10.1 16.5 14.1 13.6 13.6
30-34 16.4 20.9 18.3 14.5 17.1 21.6 20.6 14.5
35-39 16.5 18.2 16.7 15.9 13.8 21.2 20.3 15.4
40-44 11.6 14.6 10.6 11.0 8.8 14.1 14.1 11.4
45-49 11.0 11.3 8.4 12.0 5.7 10.7 11.0 9.2
50-54 8.0 4.0 3.0 10.5 2.1 5.0 5.9 6.0
55-59 4.4 0.7 1.0 6.4 0.7 2.0 2.3 2.8
60-64 2.4 0.2 0.2 3.5 0.3 0.8 1.2 1.6
65+ 2.0 0.1 0.4 3.0 0.2 0.7 0.8 1.9

8/2/2019 China Labour Statistical Yearbook - 2004
http://slidepdf.com/reader/full/china-labour-statistical-yearbook-2004 83/464
1-58
1-58
COMPOSITION OF EMPLOYMENT STATUS BY EDUCATIONAL ATTAINMENT AND SEX
单位:% (%)
城镇单位 乡镇企业 乡村农林牧 私营个体 私营个体 自营
合计 就业人员 就业人员 渔劳动者 雇员 雇主 劳动者 其他
Urban Units Township Agriculture Private Private Self-
Total Employment Enterprises Employment Sector Employer Employed Others
受教育程度Educational
Attainment
Employment Employee
Total 100.0 17.5 3.0 57.3 10.1 3.4 7.4 1.3
不识字或 Illiterate and
识字很少 Semi-Illiterate 100.0 1.0 1.0 91.0 2.1 0.8 3.3 0.7
小学 Primary School 100.0 1.9 1.8 81.9 6.3 1.8 5.4 0.9
初中 Junior School 100.0 10.3 3.9 56.5 13.8 4.3 9.8 1.5
高中Senoior School 100.0 47.3 4.0 18.7 13.4 5.7 9.0 1.9
大专 College 100.0 84.8 2.1 1.7 5.6 2.3 1.9 1.5
大学本科 University 100.0 91.5 0.9 0.3 3.7 1.6 0.8 1.1
研究生 Graduate 100.0 93.1 0.8 0.3 2.2 2.5 0.3 0.8
Male 100.0 19.0 3.2 53.3 10.6 3.9 8.5 1.5
不识字或 Illiterate and
识字很少 Semi-Illiterate 100.0 1.5 1.2 89.2 2.8 0.7 3.7 0.9
小学 Primary School 100.0 2.5 2.1 78.4 7.2 2.1 6.5 1.2
初中 Junior School 100.0 10.9 3.9 54.7 13.5 4.6 10.8 1.7
高中 Senoior School 100.0 44.3 4.1 21.7 12.2 6.2 9.6 1.9
大专 College 100.0 83.9 2.2 2.0 5.3 2.7 2.1 1.7
大学本科 University 100.0 90.7 1.0 0.2 3.7 2.1 1.0 1.3
研究生 Graduate 100.0 92.5 0.9 0.2 2.0 3.1 0.4 0.9
Female 100.0 15.6 2.7 62.2 9.6 2.7 6.1 1.1
不识字或 Illiterate and
识字很少 Semi-Illiterate 100.0 0.7 0.9 92.0 1.8 0.8 3.1 0.7
小学 Primary School 100.0 1.3 1.6 85.3 5.4 1.5 4.2 0.7
初中 Junior School 100.0 9.3 3.9 59.2 14.1 3.8 8.5 1.3
高中 Senoior School 100.0 51.9 3.9 14.1 15.2 4.9 8.2 1.7
大专 College 100.0 86.0 2.0 1.4 6.1 1.7 1.6 1.3
大学本科 University 100.0 92.9 0.8 0.3 3.6 0.8 0.6 0.9
研究生 Graduate 100.0 94.0 0.5 0.5 2.7 1.6 0.5

8/2/2019 China Labour Statistical Yearbook - 2004
http://slidepdf.com/reader/full/china-labour-statistical-yearbook-2004 84/464
1-59
1-59
EDUCATIONAL ATTAINMENT COMPOSITION
BY EMPLOYMENT STATUS AND SEX
单位:% (%)
城镇单位 乡镇企业 乡村农林牧 私营个体 私营个体 自营
合计 就业人员 就业人员 渔劳动者 雇员 雇主 劳动者 其他
Urban Units Township Agriculture Private Private Self-
Total Employment Enterprises Employment Sector Employer Employed Others
受教育程度Educational
Attainment
Employment Employee
Total 100.0 100.0 100.0 100.0 100.0 100.0 100.0 100.0
不识字或 Illiterate and
识字很少 Semi-Illiterate 7.1 0.4 2.4 11.3 1.5 1.7 3.2 4.0
小学 Primary School 28.7 3.1 17.9 41.0 17.9 15.5 20.7 19.9
初中 Junior School 43.7 25.7 57.1 43.1 59.3 55.4 58.0 49.8
高中 Senoior School 13.6 36.9 18.6 4.5 17.9 23.1 16.6 19.0
大专 College 4.8 23.4 3.5 0.1 2.7 3.3 1.2 5.6
大学本科 University 1.9 10.0 0.6 … 0.7 0.9 0.2 1.7
研究生 Graduate 0.1 0.5 … … 0.1 0.1
Male 100.0 100.0 100.0 100.0 100.0 100.0 100.0 100.0
不识字或 Illiterate and
识字很少 Semi-Illiterate 4.4 0.4 1.6 7.3 1.1 0.8 1.9 2.6
小学 Primary School 25.8 3.4 16.9 37.9 17.7 14.2 19.8 19.6
初中 Junior School 47.2 27.1 57.5 48.4 60.4 55.8 59.7 51.3
高中 Senoior School 15.2 35.4 19.7 6.2 17.4 24.3 17.1 19.0
大专 College 5.1 22.6 3.6 0.2 2.6 3.6 1.3 5.7
大学本科 University 2.2 10.6 0.7 … 0.8 1.2 0.3 1.8
研究生 Graduate 0.1 0.6 … … 0.1 0.1
Female 100.0 100.0 100.0 100.0 100.0 100.0 100.0 100.0
不识字或 Illiterate and
识字很少 Semi-Illiterate 10.4 0.5 3.6 15.4 2.0 3.1 5.3 6.5
小学 Primary School 32.2 2.7 19.2 44.2 18.1 17.7 22.4 20.4
初中 Junior School 39.5 23.6 56.5 37.6 57.9 54.9 55.2 47.4
高中 Senoior School 11.7 39.0 16.9 2.7 18.6 21.1 15.8 19.0
大专 College 4.5 24.7 3.3 0.1 2.8 2.8 1.2 5.3大学本科 University 1.5 9.1 0.5 … 0.6 0.4 0.1 1.3
研究生 Graduate 0.1 0.4 … … … …

8/2/2019 China Labour Statistical Yearbook - 2004
http://slidepdf.com/reader/full/china-labour-statistical-yearbook-2004 85/464
1-60
1-60
COMPOSITION OF URBAN EMPLOYMENT STATUS BY AGE AND SEX
单位:% (%)
城镇单位 乡镇企业 乡村农林牧 私营个体 私营个体 自营
年龄 合计 就业人员 就业人员 渔劳动者 雇员 雇主 劳动者 其他
Age Urban Units Township Agriculture Private Private Self-
Total Employment Enterprises Employment Sector Employer Employed Others
Employment Employee
Total 100.0 44.0 3.8 15.0 15.5 6.5 13.3 2.0
16-19 100.0 15.3 6.4 19.4 44.3 3.0 7.8 3.8
20-24 100.0 37.9 4.9 11.2 29.7 4.0 9.8 2.4
25-29 100.0 46.2 4.5 9.8 19.2 6.3 12.1 1.8
30-34 100.0 47.0 3.6 10.6 15.5 7.4 14.4 1.6
35-39 100.0 45.6 3.6 12.9 13.0 7.9 15.2 1.940-44 100.0 49.1 3.3 13.2 11.9 7.2 13.4 1.9
45-49 100.0 48.3 3.3 16.8 9.8 6.3 13.7 1.8
50-54 100.0 43.4 3.3 24.3 8.3 5.7 13.2 1.8
55-59 100.0 36.2 2.9 32.7 7.1 5.8 13.0 2.3
60-64 100.0 17.1 2.1 50.8 7.0 5.5 14.6 2.9
65+ 100.0 9.4 2.1 57.1 6.2 6.0 15.3 3.9
Male 100.0 45.7 3.7 13.1 14.5 7.1 13.9 2.0
16-19 100.0 14.7 6.2 22.7 39.8 3.2 10.2 3.1
20-24 100.0 37.2 5.1 11.2 28.2 4.2 11.6 2.5
25-29 100.0 45.7 4.4 8.9 19.0 6.9 13.1 2.1
30-34 100.0 47.6 3.5 8.9 15.1 8.0 15.2 1.7
35-39 100.0 47.4 3.5 10.4 12.3 8.5 15.8 2.0
40-44 100.0 51.2 3.3 10.7 11.7 7.9 13.4 1.8
45-49 100.0 51.4 3.4 13.3 9.6 6.7 13.9 1.8
50-54 100.0 48.7 3.8 18.2 8.8 6.1 12.6 1.8
55-59 100.0 43.7 3.4 24.6 7.8 6.1 12.4 2.1
60-64 100.0 20.4 2.8 45.1 7.6 6.0 15.2 3.0
65+ 100.0 11.0 2.4 53.4 7.6 6.3 15.6 3.7
Female 100.0 41.8 3.8 17.4 16.8 5.8 12.5 1.9
16-19 100.0 15.8 6.6 16.4 48.4 2.8 5.5 4.4
20-24 100.0 38.7 4.7 11.2 31.1 3.9 8.1 2.3
25-29 100.0 46.8 4.6 10.9 19.5 5.6 11.0 1.6
30-34 100.0 46.3 3.7 12.6 15.9 6.6 13.4 1.5
35-39 100.0 43.3 3.7 15.9 13.7 7.1 14.4 1.8
40-44 100.0 46.4 3.3 16.5 12.2 6.1 13.5 1.9
45-49 100.0 43.6 3.1 22.1 10.0 5.9 13.5 1.8
50-54 100.0 32.1 2.4 37.2 7.1 4.9 14.3 1.9
55-59 100.0 14.5 1.5 56.2 5.3 5.0 14.7 2.8
60-64 100.0 9.5 0.4 64.1 5.7 4.3 13.2 2.8
65+ 100.0 5.1 1.2 67.3 2.1 5.4 14.3 4.6

8/2/2019 China Labour Statistical Yearbook - 2004
http://slidepdf.com/reader/full/china-labour-statistical-yearbook-2004 86/464
1-61
1-61
AGE COMPOSITION OF URBAN EMPLOYMENT
BY EMPLOYMENT STATUS AND SEX
单位:% (%)
城镇单位 乡镇企业 乡村农林牧 私营个体 私营个体 自营
年龄 合计 就业人员 就业人员 渔劳动者 雇员 雇主 劳动者 其他
Age Urban Units Township Agriculture Private Private Self-
Total Employment Enterprises Employment Sector Employer Employed Others
Employment Employee
Total 100.0 100.0 100.0 100.0 100.0 100.0 100.0 100.0
16-19 2.8 1.0 4.8 3.7 8.1 1.3 1.7 5.4
20-24 9.1 7.8 11.8 6.8 17.5 5.6 6.7 11.1
25-29 13.8 14.5 16.5 9.0 17.1 13.3 12.6 12.8
30-34 18.3 19.5 17.3 12.9 18.2 20.6 19.8 15.0
35-39 17.4 18.1 16.8 15.0 14.6 21.1 20.0 17.1
40-44 13.7 15.3 12.0 12.1 10.6 15.1 13.9 12.9
45-49 12.2 13.4 10.6 13.7 7.7 11.8 12.6 11.3
50-54 7.2 7.1 6.4 11.7 3.9 6.4 7.1 6.7
55-59 3.3 2.7 2.5 7.1 1.5 2.9 3.2 3.8
60-64 1.2 0.5 0.7 4.1 0.5 1.0 1.3 1.8
65+ 1.0 0.2 0.6 3.8 0.4 0.9 1.2 2.0
Male 100.0 100.0 100.0 100.0 100.0 100.0 100.0 100.0
16-19 2.4 0.8 3.9 4.1 6.5 1.1 1.7 3.6
20-24 7.9 6.4 10.7 6.8 15.4 4.7 6.6 10.0
25-29 12.8 12.8 15.1 8.7 16.8 12.6 12.1 13.2
30-34 17.4 18.1 16.1 11.9 18.1 19.8 19.1 14.9
35-39 17.1 17.7 16.1 13.6 14.5 20.6 19.4 17.1
40-44 13.8 15.5 12.0 11.3 11.1 15.5 13.4 12.3
45-49 12.9 14.5 11.6 13.1 8.5 12.2 12.9 11.8
50-54 8.6 9.2 8.7 12.0 5.3 7.5 7.8 7.9
55-59 4.3 4.1 3.9 8.1 2.3 3.7 3.9 4.6
60-64 1.5 0.7 1.1 5.1 0.8 1.3 1.6 2.2
65+ 1.3 0.3 0.9 5.3 0.7 1.2 1.5 2.4
Female 100.0 100.0 100.0 100.0 100.0 100.0 100.0 100.0
16-19 3.4 1.3 6.0 3.2 9.9 1.7 1.5 7.820-24 10.6 9.9 13.3 6.8 19.8 7.1 6.9 12.7
25-29 15.0 16.8 18.3 9.4 17.4 14.5 13.2 12.3
30-34 19.3 21.4 19.0 14.0 18.4 21.9 20.8 15.2
35-39 17.9 18.6 17.7 16.4 14.7 21.8 20.7 17.1
40-44 13.7 15.2 12.0 13.0 9.9 14.4 14.7 13.7
45-49 11.3 11.8 9.3 14.3 6.7 11.3 12.1 10.6
50-54 5.3 4.1 3.4 11.4 2.3 4.5 6.1 5.2
55-59 1.9 0.7 0.8 6.2 0.6 1.7 2.3 2.8
60-64 0.8 0.2 0.1 3.0 0.3 0.6 0.9 1.2
65+ 0.6 0.1 0.2 2.4 0.1 0.6 0.7 1.5

8/2/2019 China Labour Statistical Yearbook - 2004
http://slidepdf.com/reader/full/china-labour-statistical-yearbook-2004 87/464
1-62
1-62
COMPOSITION OF URBAN EMPLOYMENT STATUS
BY EDUCATIONAL ATTAINMENT AND SEX
单位:% (%)
城镇单位 乡镇企业 乡村农林牧 私营个体 私营个体 自营
合计 就业人员 就业人员 渔劳动者 雇员 雇主 劳动者 其他
Urban Units Township Agriculture Private Private Self-
Total Employment Enterprises Employment Sector Employer Employed Others
受教育程度Educational
Attainment
Employment Employee
Total 100.0 44.0 3.8 15.0 15.5 6.5 13.3 2.0
不识字或 Illiterate and
识字很少 Semi-Illiterate 100.0 5.4 2.5 62.8 7.6 3.3 15.3 3.0
小学 Primary School 100.0 9.0 3.9 42.3 15.5 6.7 19.8 2.7
初中 Junior School 100.0 26.6 4.9 17.5 21.3 8.7 18.7 2.2
高中 Senoior School 100.0 60.3 3.6 3.6 14.6 6.4 9.8 1.7
大专 College 100.0 86.9 1.8 0.3 5.6 2.3 1.8 1.3
大学本科 University 100.0 91.9 0.8 0.1 3.7 1.6 0.8 1.1
研究生 Graduate 100.0 93.5 0.6 2.2 2.5 0.3 0.8
Male 100.0 45.7 3.7 13.1 14.5 7.1 13.9 2.0
不识字或 Illiterate and
识字很少 Semi-Illiterate 100.0 8.2 3.2 58.2 9.2 2.8 15.2 3.1
小学 Primary School 100.0 11.3 4.2 37.4 15.8 7.4 21.1 2.8
初中 Junior School 100.0 28.5 4.8 16.3 19.6 9.1 19.6 2.3
高中 Senoior School 100.0 59.6 3.6 4.1 13.3 7.2 10.5 1.7
大专 College 100.0 86.4 1.8 0.3 5.3 2.8 2.0 1.4
大学本科 University 100.0 91.0 0.9 0.1 3.7 2.1 0.9 1.2
研究生 Graduate 100.0 92.9 0.7 2.0 3.1 0.4 0.9
Female 100.0 41.8 3.8 17.4 16.8 5.8 12.5 1.9
不识字或 Illiterate and
识字很少 Semi-Illiterate 100.0 3.9 2.2 65.2 6.8 3.5 15.4 2.9
小学 Primary School 100.0 6.6 3.6 47.7 15.1 6.0 18.3 2.6
初中 Junior School 100.0 24.1 5.2 19.2 23.6 8.2 17.5 2.2
高中 Senoior School 100.0 61.2 3.6 3.0 16.3 5.4 8.9 1.6
大专 College 100.0 87.5 1.7 0.3 6.1 1.7 1.5 1.1
大学本科 University 100.0 93.5 0.6 0.1 3.6 0.8 0.6 0.9研究生 Graduate 100.0 94.5 0.5 2.7 1.6 0.5

8/2/2019 China Labour Statistical Yearbook - 2004
http://slidepdf.com/reader/full/china-labour-statistical-yearbook-2004 88/464
1-63
1-63
EDUCATIONAL ATTAINMENT COMPOSITION OF URBAN EMPLOYMENT
BY EMPLOYMENT STATUS AND SEX
单位:% (%)
城镇单位 乡镇企业 乡村农林牧 私营个体 私营个体 自营
合计 就业人员 就业人员 渔劳动者 雇员 雇主 劳动者 其他
Urban Units Township Agriculture Private Private Self-
Total Employment Enterprises Employment Sector Employer Employed Others
受教育程度Educational
Attainment
Employment Employee
Total 100.0 100.0 100.0 100.0 100.0 100.0 100.0 100.0
不识字或 Illiterate and
识字很少 Semi-Illiterate 2.6 0.3 1.8 11.1 1.3 1.3 3.0 4.0
小学 Primary School 12.6 2.6 13.1 35.6 12.6 13.0 18.7 17.2
初中 Junior School 39.7 24.0 52.1 46.5 54.6 53.0 56.0 44.9
高中 Senoior School 27.4 37.5 26.1 6.6 25.8 26.9 20.3 23.0
大专 College 12.2 24.1 5.7 0.3 4.5 4.4 1.7 7.8
大学本科 University 5.2 10.9 1.1 … 1.2 1.3 0.3 2.9
研究生 Graduate 0.3 0.5 0.1 … 0.1 … 0.1
Male 100.0 100.0 100.0 100.0 100.0 100.0 100.0 100.0
不识字或 Illiterate and
识字很少 Semi-Illiterate 1.6 0.3 1.4 7.2 1.0 0.7 1.8 2.5
小学 Primary School 11.6 2.9 13.0 33.2 12.6 12.2 17.7 16.1
初中 Junior School 40.7 25.4 51.7 50.6 55.1 52.5 57.4 45.8
高中 Senoior School 27.6 35.9 26.6 8.6 25.2 28.0 20.9 23.3
大专 College 12.4 23.4 5.9 0.3 4.5 4.9 1.8 8.6
大学本科 University 5.8 11.6 1.4 0.1 1.5 1.8 0.4 3.6
研究生 Graduate 0.3 0.6 0.1 … 0.1 … 0.1
Female 100.0 100.0 100.0 100.0 100.0 100.0 100.0 100.0
不识字或 Illiterate and
识字很少 Semi-Illiterate 4.0 0.4 2.3 14.8 1.6 2.4 4.9 6.0
小学 Primary School 13.9 2.2 13.2 38.0 12.5 14.3 20.3 18.9
初中 Junior School 38.4 22.2 52.7 42.4 54.0 53.8 53.9 43.7
高中 Senoior School 27.2 39.9 25.5 4.7 26.5 25.3 19.3 22.7
大专 College 12.1 25.3 5.6 0.2 4.4 3.6 1.4 6.7
大学本科 University 4.4 9.8 0.7 … 0.9 0.6 0.2 2.1研究生 Graduate 0.2 0.4 … … … …

8/2/2019 China Labour Statistical Yearbook - 2004
http://slidepdf.com/reader/full/china-labour-statistical-yearbook-2004 89/464
1-64
1-64
SECTOR COMPOSITION OF URBAN EMPLOYMENT
BY AGE AND SEX
单位:% (%)
农、林、 采 矿 业 制 造 业 电力、燃气及 建 筑 业 交通运
合 计 牧、渔业 水的生产 储和邮
和供应业 Trans
年龄 Farming, Mining and Manufac- Production Construc- Stora
Age Forestry, Quarrying turing and Supply of tion Post
Total Animal Electricity Teleco
Husbandry Gas and nicat
and Fishery Water Servi
Total 100.0 16.4 1.6 16.6 2.9 4.616-19 100.0 19.9 0.6 23.4 0.9 2.9
20-24 100.0 12.1 1.0 17.1 2.3 3.4
25-29 100.0 11.0 1.6 17.4 2.9 4.1
30-34 100.0 11.8 2.0 17.9 3.6 4.9
35-39 100.0 14.4 2.1 17.2 3.2 5.4
40-44 100.0 14.8 1.8 17.1 3.2 5.0
45-49 100.0 18.6 1.6 15.4 2.7 4.9
50-54 100.0 26.0 1.4 13.9 2.5 4.8
55-59 100.0 34.7 1.0 11.0 1.7 4.0
60-64 100.0 52.3 0.3 6.4 0.9 2.8
65+ 100.0 58.6 0.3 4.1 0.6 2.1
Male 100.0 14.7 2.3 16.7 3.5 6.8
16-19 100.0 23.5 1.1 21.6 1.3 5.4
20-24 100.0 12.4 1.6 18.2 3.0 5.6
25-29 100.0 10.2 2.2 18.0 3.6 6.2
30-34 100.0 10.1 2.8 17.5 4.3 7.2
35-39 100.0 12.1 2.9 16.1 3.8 8.1
40-44 100.0 12.5 2.4 16.7 3.8 7.2
45-49 100.0 15.2 2.3 16.5 3.4 7.0
50-54 100.0 20.1 1.9 16.7 3.3 6.5
55-59 100.0 26.8 1.3 13.3 2.2 5.3
60-64 100.0 46.6 0.4 7.9 1.1 3.8
65+ 100.0 55.2 0.4 4.7 0.6 2.8
Female 100.0 18.6 0.8 16.5 2.1 1.7
16-19 100.0 16.6 0.2 24.9 0.6 0.6
20-24 100.0 11.7 0.3 16.0 1.6 1.3
25-29 100.0 11.8 0.9 16.8 2.2 1.7
30-34 100.0 13.7 1.0 18.3 2.8 2.0
35-39 100.0 17.2 1.1 18.6 2.5 2.0
40-44 100.0 17.9 1.0 17.6 2.5 2.1
45-49 100.0 23.8 0.6 13.8 1.7 1.8
50-54 100.0 38.5 0.4 7.8 1.0 1.1
55-59 100.0 57.7 4.5 0.4 0.3
60-64 100.0 65.2 0.1 2.9 0.4 0.465+ 100.0 67.7 2.4 0.6 0.2

8/2/2019 China Labour Statistical Yearbook - 2004
http://slidepdf.com/reader/full/china-labour-statistical-yearbook-2004 90/464
1-64 1 continued
单位:% (%
信息传输、 批发和零售业 住宿和餐饮业 金融业 房地产业 租赁和商务 科学研究、
计算机服务 服务业 技术服务和
和软件业 地质勘查业
年龄 Data Wholesale Hotel Banking Real Leasing Scientific
Age Transmission, and and Estate and Research,
Computer Retail Catering Business Technical
Service & Trade Services Services Services,&
Software Geological
Prospecting
Total 1.6 12.4 4.2 2.1 0.6 2.0 1.0
16-19 2.3 12.3 12.7 0.3 0.3 2.7 0.2
20-24 4.4 14.1 6.6 1.4 0.7 3.1 0.8
25-29 3.1 13.5 4.3 2.0 0.7 2.6 1.1
30-34 1.6 13.0 4.1 2.9 0.6 2.1 0.9
35-39 1.0 12.9 3.7 2.9 0.5 1.8 0.9
40-44 0.9 12.0 3.8 2.5 0.7 1.9 1.2
45-49 0.7 11.3 3.5 1.9 0.7 1.6 1.1
50-54 0.6 10.2 3.0 0.9 0.8 1.4 1.1
55-59 0.6 9.5 2.5 0.7 0.5 1.3 1.0
60-64 0.2 9.3 2.0 0.6 0.3 0.9 1.3
65+ 0.0 10.0 2.1 0.3 0.1 1.1 1.1
Male 1.6 10.2 3.4 2.0 0.7 1.7 1.2
16-19 1.7 10.1 11.8 0.4 0.1 1.7 0.3
20-24 4.2 10.9 5.9 1.2 0.7 2.4 0.9
25-29 3.6 10.6 3.6 1.7 0.8 2.1 1.3
30-34 1.7 10.6 3.2 2.7 0.6 1.8 1.1
35-39 1.0 10.8 2.8 2.8 0.5 1.6 1.1
40-44 1.0 10.0 2.9 2.4 0.7 1.5 1.4
45-49 0.8 9.4 2.7 2.0 0.8 1.5 1.3
50-54 0.7 9.3 2.6 0.8 0.9 1.3 1.3
55-59 0.7 8.8 2.4 0.8 0.6 1.3 1.2
60-64 0.2 8.9 1.8 0.7 0.3 0.9 1.7
65+ 9.9 1.7 0.3 0.1 1.2 1.3
Female 1.6 15.3 5.4 2.2 0.6 2.5 0.8
16-19 2.9 14.4 13.5 0.2 0.4 3.6 0.1
20-24 4.6 17.2 7.3 1.6 0.8 3.8 0.7
25-29 2.6 16.7 5.0 2.4 0.6 3.1 1.0
30-34 1.5 15.7 5.1 3.0 0.6 2.5 0.8
35-39 0.9 15.5 4.8 2.9 0.5 2.0 0.7
40-44 0.8 14.7 5.0 2.6 0.6 2.4 0.9
45-49 0.7 14.1 4.8 1.6 0.5 1.8 0.9
50-54 0.3 12.2 4.0 0.9 0.5 1.5 0.7
55-59 0.1 11.6 2.9 0.5 0.1 1.3 0.6
60-64 0.2 10.2 2.3 0.3 0.3 0.7 0.4
65+ 0.2 10.4 3.2 0.2 0.2 0.9 0.6

8/2/2019 China Labour Statistical Yearbook - 2004
http://slidepdf.com/reader/full/china-labour-statistical-yearbook-2004 91/464
1-64 2 continued
单位:% (%)
水利、环境和 居民服务和 教育 卫生、社会 文化、体育 公共管理和 国际组织
公共设施管理业
其他服务业 保障和社会 和娱乐业 社会组织
Water 福利业 Culture
年龄 Conservancy, Public Education Public Heal- Sports Public Interna-
Age Environment and th, Social and Adminis- tional
and public other Securities Entertain- trantion Organiza-
Utility Services & Social ment and Social tions
Management Welfare Organizations
Total 1.1 9.2 5.1 3.4 1.6 6.2
16-19 0.2 13.6 0.9 1.1 1.1 1.6
20-24 0.8 10.8 5.0 3.5 2.0 4.7 …
25-29 1.0 9.1 6.2 3.8 1.9 6.4 …
30-34 1.1 9.1 5.3 3.6 1.4 5.9 0.1
35-39 1.0 8.8 5.3 3.0 1.4 6.5 …
40-44 1.3 8.6 4.8 3.1 1.6 7.2 …
45-49 1.4 9.0 5.1 3.7 1.5 7.4 …
50-54 1.2 8.7 5.6 3.4 1.5 6.9 …
55-59 1.1 8.0 5.8 3.6 1.7 7.1 …
60-64 1.1 9.8 3.0 3.9 1.1 2.3 …
65+ 0.6 11.1 0.9 3.0 0.7 1.9 0.1
Male 1.2 8.3 4.1 2.5 1.4 7.6
16-19 0.1 10.9 0.5 0.6 1.2 2.8
20-24 1.1 9.6 3.2 2.4 1.6 5.8 …
25-29 1.2 8.2 4.0 2.6 1.7 7.3 …
30-34 1.2 8.3 3.9 2.5 1.2 7.3 0.1
35-39 1.2 7.7 4.6 2.2 1.3 7.9 …
40-44 1.4 7.5 4.3 2.3 1.6 8.9 …
45-49 1.5 8.1 4.3 2.5 1.3 8.8 …
50-54 1.3 8.4 4.3 2.7 1.5 8.2 …
55-59 1.3 7.6 6.5 3.7 2.0 8.9 0.1
60-64 1.3 10.4 3.5 3.9 1.3 2.9 …
65+ 0.8 11.7 1.0 3.3 0.8 2.4 0.1
Female 0.9 10.4 6.5 4.6 1.8 4.4
16-19 0.3 16.0 1.3 1.6 1.0 0.5
20-24 0.6 12.0 6.8 4.6 2.5 3.6 …
25-29 0.8 10.1 8.5 5.0 2.1 5.3 …
30-34 1.0 10.2 6.9 4.9 1.7 4.3 0.1
35-39 0.9 10.1 6.1 4.0 1.5 4.7 …
40-44 1.1 10.0 5.6 4.3 1.7 5.0 …
45-49 1.2 10.2 6.4 5.6 1.9 5.3 …
50-54 0.8 9.3 8.2 5.1 1.5 4.2 …
55-59 0.3 9.3 3.9 3.1 0.7 1.9 …
60-64 0.4 8.4 1.8 3.7 0.7 0.8 0.1
65+ 0.2 9.3 0.5 2.3 0.3 0.8 0.3

8/2/2019 China Labour Statistical Yearbook - 2004
http://slidepdf.com/reader/full/china-labour-statistical-yearbook-2004 92/464
1-65
1-65
AGE COMPOSITION OF URBAN EMPLOYMENT
BY SECTOR AND SEX
单位:% (%)
农、林、 采 矿 业 制 造 业 电力、燃气及 建 筑 业 交通运输、仓
合 计 牧、渔业 水的生产 储和邮政业
Farming, 和供应业 Transport,
年龄 Forestry, Mining and Manufac- Production Construc- Storage,
Age Animal Quarrying turing and Supply of tion Post &
Total Husbandry Electricity Telecommu-
and Gas and nications
Fishery Water
Total 100.0 100.0 100.0 100.0 100.0 100.0 100.0
16-19 2.8 3.4 1.1 4.0 0.9 1.8 1.1
20-24 9.1 6.7 5.4 9.4 7.2 6.8 7.6
25-29 13.8 9.2 13.4 14.5 14.0 12.3 13.9
30-34 18.3 13.1 21.9 19.7 22.8 19.2 20.6
35-39 17.4 15.4 22.1 18.1 19.3 20.4 19.4
40-44 13.7 12.4 15.1 14.2 15.5 14.9 16.0
45-49 12.2 13.9 12.2 11.3 11.4 13.1 13.1
50-54 7.2 11.5 6.4 6.0 6.3 7.5 6.1
55-59 3.3 7.0 2.0 2.2 1.9 2.8 1.8
60-64 1.2 3.8 0.2 0.5 0.4 0.7 0.3
65+ 1.0 3.6 0.2 0.3 0.2 0.5 0.2
Male 100.0 100.0 100.0 100.0 100.0 100.0 100.0
16-19 2.4 3.8 1.2 3.1 0.9 1.9 1.1
20-24 7.9 6.7 5.6 8.6 6.8 6.6 7.3
25-29 12.8 8.9 12.5 13.8 13.2 11.8 13.8
30-34 17.4 12.0 21.2 18.3 21.5 18.5 20.0
35-39 17.1 14.1 21.5 16.5 18.4 20.3 19.2
40-44 13.8 11.7 14.6 13.8 15.1 14.6 15.6
45-49 12.9 13.4 13.2 12.8 12.5 13.3 13.5
50-54 8.6 11.9 7.4 8.7 8.2 8.3 6.9
55-59 4.3 7.9 2.5 3.4 2.7 3.3 2.2
60-64 1.5 4.7 0.3 0.7 0.5 0.8 0.365+ 1.3 4.9 0.2 0.4 0.3 0.5 0.2
Female 100.0 100.0 100.0 100.0 100.0 100.0 100.0
16-19 3.4 3.0 0.9 5.2 1.1 1.2 1.2
20-24 10.6 6.7 4.7 10.4 8.1 8.1 9.0
25-29 15.0 9.5 17.0 15.4 15.7 14.9 14.2
30-34 19.3 14.3 24.7 21.5 25.7 22.8 22.6
35-39 17.9 16.7 24.4 20.3 21.3 20.8 20.5
40-44 13.7 13.2 17.3 14.6 16.3 16.4 17.4
45-49 11.3 14.4 8.1 9.4 8.9 12.0 11.6
50-54 5.3 11.1 2.8 2.5 2.4 3.4 3.0
55-59 1.9 6.0 … 0.5 0.3 0.3 0.4
60-64 0.8 2.9 0.1 0.1 0.2 0.2 0.1
65+ 0.6 2.2 0.1 0.2 … …

8/2/2019 China Labour Statistical Yearbook - 2004
http://slidepdf.com/reader/full/china-labour-statistical-yearbook-2004 93/464
1-65 1 continued
单位:% (%)
信息传输、 批发和零售业 住宿和餐饮业 金融业 房地产业 租赁和商务 科学研究、
计算机服务 服务业 技术服务和
和软件业 地质勘查业
年龄 Data Wholesale Hotel Banking Real Leasing Scientific
Age Transmission, and and Estate and Research,
Computer Retail Catering Business Technical
Service & Trade Services Services Services,&
Software Geological
Prospecting
Total 100.0 100.0 100.0 100.0 100.0 100.0 100.0
16-19 4.0 2.8 8.5 0.4 1.2 3.8 0.6
20-24 24.6 10.3 14.2 6.1 10.3 14.0 7.3
25-29 26.1 15.0 13.9 13.4 16.3 17.6 15.6
30-34 18.1 19.1 17.6 24.9 18.0 18.8 17.1
35-39 10.6 18.1 15.1 23.8 14.6 15.1 16.1
40-44 7.4 13.3 12.4 16.2 14.4 12.8 15.8
45-49 5.4 11.1 10.1 10.8 13.2 9.8 13.7
50-54 2.6 6.0 5.2 3.0 8.8 5.0 7.8
55-59 1.1 2.5 2.0 1.1 2.6 2.1 3.4
60-64 0.2 0.9 0.6 0.4 0.6 0.5 1.6
65+ 0.0 0.8 0.5 0.1 0.2 0.6 1.1
Male 100.0 100.0 100.0 100.0 100.0 100.0 100.0
16-19 2.4 2.3 8.3 0.5 0.5 2.4 0.6
20-24 20.5 8.4 13.9 4.9 8.0 11.2 5.925-29 28.0 13.4 13.8 11.0 15.9 16.2 13.8
30-34 18.4 18.1 16.6 24.0 16.3 18.2 16.1
35-39 10.8 18.1 14.0 24.2 13.4 15.9 16.2
40-44 8.1 13.6 11.9 16.6 14.4 12.6 16.2
45-49 5.9 12.0 10.2 13.0 15.0 11.6 14.0
50-54 3.8 7.9 6.7 3.5 11.8 6.9 9.2
55-59 1.9 3.7 3.1 1.6 4.0 3.3 4.4
60-64 0.2 1.3 0.8 0.5 0.6 0.8 2.2
65+ 0.0 1.3 0.7 0.2 0.2 1.0 1.5
Female 100.0 100.0 100.0 100.0 100.0 100.0 100.0
16-19 6.0 3.2 8.6 0.3 2.3 5.0 0.5
20-24 30.1 12.0 14.5 7.4 13.8 16.4 10.1
25-29 23.6 16.5 13.9 16.1 16.7 18.9 19.2
30-34 17.7 19.9 18.3 25.9 20.5 19.3 19.1
35-39 10.3 18.2 16.1 23.4 16.3 14.5 15.9
40-44 6.3 13.1 12.7 15.8 14.3 13.0 15.1
45-49 4.6 10.4 10.1 8.2 10.5 8.2 13.1
50-54 1.1 4.3 3.9 2.3 4.3 3.2 4.9
55-59 0.2 1.5 1.0 0.5 0.5 1.0 1.4
60-64 0.1 0.6 0.4 0.1 0.5 0.2 0.4
65+ 0.1 0.4 0.4 0.1 0.2 0.5
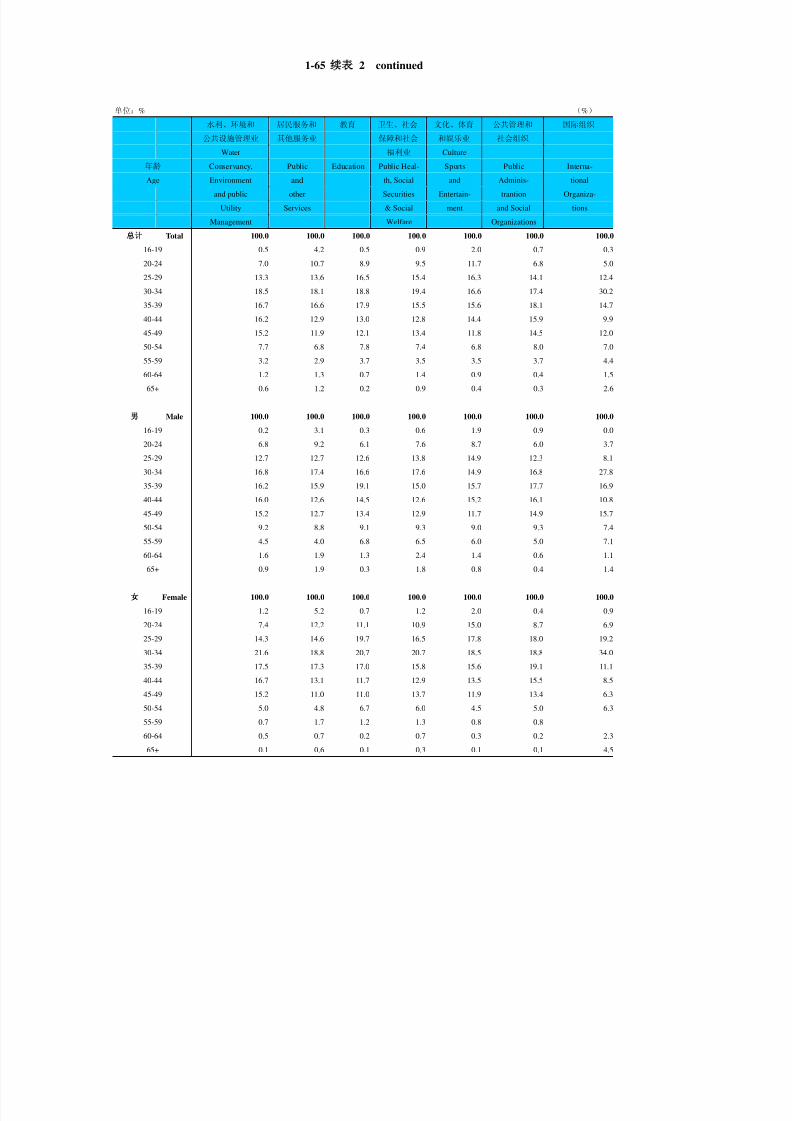
8/2/2019 China Labour Statistical Yearbook - 2004
http://slidepdf.com/reader/full/china-labour-statistical-yearbook-2004 94/464
1-65 2 continued
单位:% (%)
水利、环境和 居民服务和 教育 卫生、社会 文化、体育 公共管理和 国际组织
公共设施管理业 其他服务业 保障和社会 和娱乐业 社会组织
Water 福利业 Culture
年龄 Conservancy, Public Education Public Heal- Sports Public Interna-
Age Environment and th, Social and Adminis- tional
and public other Securities Entertain- trantion Organiza-
Utility Services & Social ment and Social tions
Management Welfare Organizations
Total 100.0 100.0 100.0 100.0 100.0 100.0 100.0
16-19 0.5 4.2 0.5 0.9 2.0 0.7 0.3
20-24 7.0 10.7 8.9 9.5 11.7 6.8 5.0
25-29 13.3 13.6 16.5 15.4 16.3 14.1 12.4
30-34 18.5 18.1 18.8 19.4 16.6 17.4 30.2
35-39 16.7 16.6 17.9 15.5 15.6 18.1 14.7
40-44 16.2 12.9 13.0 12.8 14.4 15.9 9.9
45-49 15.2 11.9 12.1 13.4 11.8 14.5 12.0
50-54 7.7 6.8 7.8 7.4 6.8 8.0 7.0
55-59 3.2 2.9 3.7 3.5 3.5 3.7 4.4
60-64 1.2 1.3 0.7 1.4 0.9 0.4 1.5
65+ 0.6 1.2 0.2 0.9 0.4 0.3 2.6
Male 100.0 100.0 100.0 100.0 100.0 100.0 100.0
16-19 0.2 3.1 0.3 0.6 1.9 0.9 0.0
20-24 6.8 9.2 6.1 7.6 8.7 6.0 3.7
25-29 12.7 12.7 12.6 13.8 14.9 12.3 8.1
30-34 16.8 17.4 16.6 17.6 14.9 16.8 27.8
35-39 16.2 15.9 19.1 15.0 15.7 17.7 16.9
40-44 16.0 12.6 14.5 12.6 15.2 16.1 10.8
45-49 15.2 12.7 13.4 12.9 11.7 14.9 15.7
50-54 9.2 8.8 9.1 9.3 9.0 9.3 7.4
55-59 4.5 4.0 6.8 6.5 6.0 5.0 7.1
60-64 1.6 1.9 1.3 2.4 1.4 0.6 1.1
65+ 0.9 1.9 0.3 1.8 0.8 0.4 1.4
Female 100.0 100.0 100.0 100.0 100.0 100.0 100.0
16-19 1.2 5.2 0.7 1.2 2.0 0.4 0.9
20-24 7.4 12.2 11.1 10.9 15.0 8.7 6.9
25-29 14.3 14.6 19.7 16.5 17.8 18.0 19.2
30-34 21.6 18.8 20.7 20.7 18.5 18.8 34.0
35-39 17.5 17.3 17.0 15.8 15.6 19.1 11.1
40-44 16.7 13.1 11.7 12.9 13.5 15.5 8.5
45-49 15.2 11.0 11.0 13.7 11.9 13.4 6.3
50-54 5.0 4.8 6.7 6.0 4.5 5.0 6.3
55-59 0.7 1.7 1.2 1.3 0.8 0.8
60-64 0.5 0.7 0.2 0.7 0.3 0.2 2.3
65+ 0.1 0.6 0.1 0.3 0.1 0.1 4.5

8/2/2019 China Labour Statistical Yearbook - 2004
http://slidepdf.com/reader/full/china-labour-statistical-yearbook-2004 95/464
1-66
1-66
SECTOR COMPOSITION OF URBAN EMPLOYMENT
BY EDUCATIONAL ATTAINMENT AND SEX
单位:% (%)
农、林、 采 矿 业 制 造 业 电力、燃气及 建 筑 业 交通运输、仓
合 计 牧、渔业 水的生产 储和邮政业
Farming, 和供应业 Transport,
Forestry, Mining and Manufac- Production Construc- Storage,
Animal Quarrying turing and Supply of tion Post &
Total Husbandry Electricity Telecommu-
and Gas and nications
受教育程度Educational
Attainment
Fishery Water
Total 100.0 16.4 1.6 16.6 2.9 4.6 7.3
不识字或 Illiterate and
识字很少 Semi-Illiterate 100.0 64.2 0.6 6.6 0.3 2.5 1.4
小学 Primary School 100.0 43.8 1.0 13.0 0.7 5.7 4.2
初中 Junior School 100.0 18.9 2.2 20.0 2.2 5.8 8.5
高中 Senoior School 100.0 5.1 1.6 19.1 4.6 3.8 9.5
大专 College 100.0 1.6 1.1 9.7 4.0 2.6 4.9
大学本科 University 100.0 1.1 0.8 8.2 2.8 3.2 2.9
研究生 Graduate 100.0 0.9 0.2 4.7 2.2 1.7 2.5
Male 100.0 14.7 2.3 16.7 3.5 6.8 10.3
不识字或 Illiterate and
识字很少 Semi-Illiterate 100.0 59.6 1.3 7.0 0.5 5.3 3.2
小学 Primary School 100.0 39.2 1.7 12.4 1.1 9.4 7.0
初中 Junior School 100.0 17.8 3.2 18.9 2.8 8.7 12.4
高中 Senoior School 100.0 5.7 2.0 20.1 5.4 5.1 12.6
大专 College 100.0 2.0 1.4 10.6 4.3 3.4 5.6
大学本科 University 100.0 1.3 0.9 9.5 3.3 3.9 3.1
研究生 Graduate 100.0 1.1 0.2 4.9 2.4 1.8 2.9
Female 100.0 18.6 0.8 16.5 2.1 1.7 3.4
不识字或 Illiterate and
识字很少 Semi-Illiterate 100.0 66.7 0.3 6.4 0.2 1.0 0.5
小学 Primary School 100.0 48.9 0.3 13.6 0.4 1.6 1.2初中 Junior School 100.0 20.5 0.9 21.4 1.5 1.7 3.0
高中 Senoior School 100.0 4.2 1.1 17.7 3.5 2.0 5.4
大专 College 100.0 1.1 0.7 8.5 3.5 1.6 4.0
大学本科 University 100.0 0.9 0.6 5.9 2.0 1.8 2.4
研究生 Graduate 100.0 0.6 3.9 1.7 1.7 1.7

8/2/2019 China Labour Statistical Yearbook - 2004
http://slidepdf.com/reader/full/china-labour-statistical-yearbook-2004 96/464
1-66 1 continued
单位:% (%)
信息传输、 批发和零售业 住宿和餐饮业 金融业 房地产业 租赁和商务 科学研究、
计算机服务 服务业 技术服务和
和软件业 地质勘查业
Data Wholesale Hotel Banking Real Leasing Scientific
Transmission, and and Estate and Research,
Computer Retail Catering Business Technical
Service & Trade Services Services Services,&
Software Geological
受教育程度Educational
Attainment
Prospecting
Total 1.6 12.4 4.2 2.1 0.6 2.0 1.0
不识字或 Illiterate and
识字很少 Semi-Illiterate 0.2 7.7 3.2 0.4 0.1 0.7 …
小学 Primary School 0.1 12.2 4.1 0.2 0.1 1.4 0.1
初中 Junior School 0.6 15.3 6.0 0.4 0.3 2.0 0.4
高中 Senoior School 2.2 13.5 3.9 2.8 1.0 2.7 1.1
大专 College 3.7 5.5 1.2 6.5 1.3 1.8 2.3
大学本科 University 5.4 3.3 0.5 6.4 1.2 1.3 4.0
研究生 Graduate 8.4 3.0 5.2 1.4 1.6 8.4
Male 1.6 10.2 3.4 2.0 0.7 1.7 1.2
不识字或 Illiterate and
识字很少 Semi-Illiterate 0.4 5.9 1.6 0.5 0.1 0.6
小学 Primary School 0.1 10.4 3.2 0.1 0.2 1.1 0.2
初中 Junior School 0.6 12.2 4.7 0.4 0.4 1.6 0.5
高中 Senoior School 2.0 11.1 3.3 2.5 1.0 2.1 1.3
大专 College 3.7 5.2 1.1 6.2 1.3 1.7 2.4
大学本科 University 5.8 3.3 0.5 5.8 1.2 1.3 4.6
研究生 Graduate 8.2 2.9 5.3 1.5 1.5 10.2
Female 1.6 15.3 5.4 2.2 0.6 2.5 0.8
不识字或 Illiterate and
识字很少 Semi-Illiterate 0.1 8.6 4.0 0.4 0.1 0.7 …
小学 Primary School 0.1 14.1 5.1 0.2 0.1 1.6 0.1
初中 Junior School 0.6 19.6 7.8 0.5 0.3 2.6 0.3
高中 Senoior School 2.5 16.7 4.8 3.1 0.9 3.4 0.9
大专 College 3.8 6.0 1.4 6.8 1.4 2.0 2.2
大学本科 University 4.8 3.4 0.6 7.4 1.2 1.4 3.0
研究生 Graduate 8.9 3.3 5.0 1.1 1.7 3.9

8/2/2019 China Labour Statistical Yearbook - 2004
http://slidepdf.com/reader/full/china-labour-statistical-yearbook-2004 97/464
1-67
1-67
EDUCATIONAL ATTAINMENT COMPOSITION OF
URBAN EMPLOYMENT BY SECTOR AND SEX
单位:% (%)
农、林、 采 矿 业 制 造 业 电力、燃气及 建 筑 业 交通运输、仓
合 计 牧、渔业 水的生产 储和邮政业
Farming, 和供应业 Transport,
Forestry, Mining and Manufac- Production Construc- Storage,
Animal Quarrying turing and Supply of tion Post &
Total Husbandry Electricity Telecommu-
and Gas and nications
受教育程度Educational
Attainment
Fishery Water
Total 100.0 100.0 100.0 100.0 100.0 100.0 100.0
不识字或 Illiterate and
识字很少 Semi-Illiterate 2.6 10.3 1.0 1.1 0.3 1.4 0.5
小学 Primary School 12.6 33.7 7.9 9.8 3.2 15.6 7.3
初中 Junior School 39.7 45.9 53.9 47.8 30.7 49.7 46.1
高中 Senoior School 27.4 8.5 26.6 31.6 43.7 22.5 35.7
大专 College 12.2 1.2 8.2 7.1 16.9 7.0 8.3
大学本科 University 5.2 0.4 2.4 2.6 5.0 3.6 2.0
研究生 Graduate 0.3 … … 0.1 0.2 0.1 0.1
Male 100.0 100.0 100.0 100.0 100.0 100.0 100.0
不识字或 Illiterate and
识字很少 Semi-Illiterate 1.6 6.6 0.9 0.7 0.2 1.3 0.5
小学 Primary School 11.6 31.0 8.5 8.6 3.5 16.1 7.9
初中 Junior School 40.7 49.4 57.0 46.2 32.3 52.2 49.1
高中 Senoior School 27.5 10.8 23.8 33.3 42.8 20.8 33.8
大专 College 12.4 1.7 7.5 7.8 15.4 6.2 6.8
大学本科 University 5.8 0.5 2.2 3.3 5.5 3.4 1.8
研究生 Graduate 0.3 … … 0.1 0.2 0.1 0.1
Female 100.0 100.0 100.0 100.0 100.0 100.0 100.0
不识字或 Illiterate and
识字很少 Semi-Illiterate 3.9 14.2 1.3 1.5 0.3 2.2 0.5
小学 Primary School 13.9 36.5 5.5 11.4 2.6 13.1 4.8初中 Junior School 38.4 42.3 42.3 49.9 27.2 37.2 34.3
高中 Senoior School 27.2 6.2 37.0 29.3 45.5 31.5 43.1
大专 College 12.1 0.7 10.7 6.2 20.1 11.3 14.1
大学本科 University 4.4 0.2 3.3 1.6 4.1 4.5 3.1
研究生 Graduate 0.2 … … 0.1 0.2 0.1

8/2/2019 China Labour Statistical Yearbook - 2004
http://slidepdf.com/reader/full/china-labour-statistical-yearbook-2004 98/464
1-68
1-68
OCCUPATION COMPOSITION OF URBAN EMPLOYMENT
BY AGE AND SEX
单位:% (%)
合计 单 位 专业技术 办事人员 商业服务 农林牧渔 生产运输设备 其他
负责人 人 员 和有关人员 人 员 水利业 操作人员及
生产人员 有关人员
Total Unit Professional Clerk Business Agriculture Production, Others
年龄 Head and and Service and Transport
Age Technical Related Personnel Water Equipment
Personnel Workers Conservancy Operators
Labors and Related
Workers
Total 100.0 4.1 15.1 18.2 20.9 15.8 17.8 8.2
16-19 100.0 0.2 6.6 6.9 33.5 19.8 22.4 10.6
20-24 100.0 0.8 15.7 17.7 27.9 11.7 17.9 8.2
25-29 100.0 2.0 18.2 20.5 22.6 10.4 18.4 7.8
30-34 100.0 3.1 17.2 19.1 21.6 11.3 19.3 8.3
35-39 100.0 4.5 15.4 18.6 20.3 13.7 19.1 8.4
40-44 100.0 5.7 14.2 19.6 19.2 14.1 19.0 8.1
45-49 100.0 6.5 13.8 19.1 17.9 17.8 17.0 7.8
50-54 100.0 7.6 12.4 16.6 16.1 25.2 14.5 7.6
55-59 100.0 7.6 12.9 14.2 14.6 33.8 9.1 7.7
60-64 100.0 3.0 9.2 7.0 15.8 51.8 5.1 8.2
65+ 100.0 1.9 5.4 4.0 16.8 58.2 4.4 9.3
Male 100.0 5.9 16.1 18.2 16.7 13.9 20.8 8.4
16-19 100.0 0.2 7.9 7.1 26.9 23.4 23.6 10.8
20-24 100.0 1.0 16.7 17.1 21.9 11.9 22.5 8.9
25-29 100.0 2.7 19.2 19.8 17.7 9.6 22.8 8.2
30-34 100.0 4.2 18.5 18.9 17.4 9.7 22.5 8.7
35-39 100.0 6.4 17.2 18.6 16.3 11.3 21.8 8.5
40-44 100.0 8.2 15.5 19.5 15.4 11.7 21.8 8.0
45-49 100.0 9.1 14.2 19.2 14.6 14.2 20.8 7.9
50-54 100.0 9.6 12.7 18.2 14.2 19.2 18.4 7.7
55-59 100.0 9.8 15.0 17.1 13.6 25.7 11.0 7.8
60-64 100.0 3.9 11.0 8.5 15.4 46.4 6.3 8.565+ 100.0 2.2 6.4 4.5 16.4 54.6 5.4 10.5
Female 100.0 1.9 13.7 18.1 26.4 18.1 13.8 7.9
16-19 100.0 0.2 5.3 6.6 39.5 16.6 21.3 10.4
20-24 100.0 0.7 14.7 18.3 33.7 11.5 13.5 7.6
25-29 100.0 1.4 17.1 21.3 28.1 11.3 13.5 7.4
30-34 100.0 1.7 15.7 19.3 26.6 13.3 15.6 7.8
35-39 100.0 2.2 13.2 18.5 25.3 16.8 15.7 8.3
40-44 100.0 2.4 12.5 19.7 24.4 17.4 15.4 8.2
45-49 100.0 2.7 13.0 19.1 22.9 23.2 11.3 7.7
50-54 100.0 3.2 11.9 13.2 20.2 38.0 6.2 7.3
55-59 100.0 1.5 7.0 5.9 17.3 57.2 3.6 7.4
60-64 100.0 0.8 4.9 3.5 16.5 64.4 2.2 7.6
65+ 100.0 1.3 2.5 2.4 18.0 67.8 1.8 6.1

8/2/2019 China Labour Statistical Yearbook - 2004
http://slidepdf.com/reader/full/china-labour-statistical-yearbook-2004 99/464
1-69
1-69
AGE COMPOSITION OF URBAN EMPLOYMENT BY OCCUPATION AND SEX
单位:% (%)
合计 单位负责人 专业技术 生产运输 商业服务 农林牧渔 设备操作 其他
人 员 办事人员 人 员 水利业 人员及
年龄 和有关人员 生产人员 有关人员
Age Total Unit Professional Production Business Agriculture Equipment Others
Head and Transport Service and Water Operators
Technical and Related Personnel Conservancy and Related
Personnel Workers Labors Workers
Total 100.0 100.0 100.0 100.0 100.0 100.0 100.0 100.0
16-19 2.8 0.2 1.2 1.1 4.5 3.5 3.5 3.7
20-24 9.1 1.9 9.5 8.9 12.1 6.7 9.2 9.2
25-29 13.8 6.8 16.7 15.6 14.9 9.1 14.3 13.230-34 18.2 13.6 20.9 19.2 18.9 13.1 19.8 18.6
35-39 17.4 19.0 17.9 17.8 16.9 15.2 18.7 17.9
40-44 13.7 18.8 13.0 14.8 12.6 12.3 14.7 13.7
45-49 12.2 19.3 11.1 12.8 10.5 13.8 11.7 11.7
50-54 7.2 13.2 5.9 6.6 5.6 11.5 5.9 6.7
55-59 3.3 6.0 2.8 2.6 2.3 7.0 1.7 3.1
60-64 1.2 0.9 0.7 0.5 0.9 3.9 0.3 1.2
65+ 1.0 0.5 0.4 0.2 0.8 3.7 0.2 1.1
Male 100.0 100.0 100.0 100.0 100.0 100.0 100.0 100.0
16-19 2.4 0.1 1.2 0.9 3.8 4.0 2.7 3.0
20-24 7.9 1.3 8.2 7.5 10.4 6.7 8.6 8.4
25-29 12.8 5.8 15.3 14.0 13.6 8.8 14.1 12.6
30-34 17.4 12.6 20.1 18.1 18.1 12.1 18.8 18.1
35-39 17.0 18.5 18.2 17.4 16.6 13.8 17.8 17.3
40-44 13.8 19.2 13.3 14.8 12.7 11.6 14.4 13.3
45-49 12.9 19.9 11.4 13.6 11.3 13.2 12.9 12.2
50-54 8.6 14.1 6.8 8.6 7.3 11.9 7.6 7.9
55-59 4.3 7.1 4.0 4.0 3.5 7.9 2.3 4.0
60-64 1.5 1.0 1.0 0.7 1.4 4.9 0.5 1.5
65+ 1.3 0.5 0.5 0.3 1.3 5.1 0.3 1.6
Female 100.0 100.0 100.0 100.0 100.0 100.0 100.0 100.0
16-19 3.4 0.4 1.3 1.3 5.1 3.1 5.2 4.5
20-24 10.6 4.2 11.4 10.8 13.6 6.7 10.3 10.3
25-29 15.0 11.0 18.8 17.6 16.0 9.3 14.6 14.1
30-34 19.3 17.8 22.1 20.6 19.5 14.2 21.8 19.2
35-39 17.9 20.9 17.3 18.3 17.2 16.6 20.4 18.8
40-44 13.7 17.6 12.4 14.9 12.6 13.1 15.2 14.3
45-49 11.3 16.6 10.7 11.8 9.8 14.4 9.2 10.9
50-54 5.3 9.1 4.6 3.9 4.1 11.1 2.4 4.9
55-59 1.9 1.6 1.0 0.6 1.3 6.1 0.5 1.8
60-64 0.8 0.3 0.3 0.2 0.5 2.9 0.1 0.8
65+ 0.6 0.4 0.1 0.1 0.4 2.3 0.1 0.5
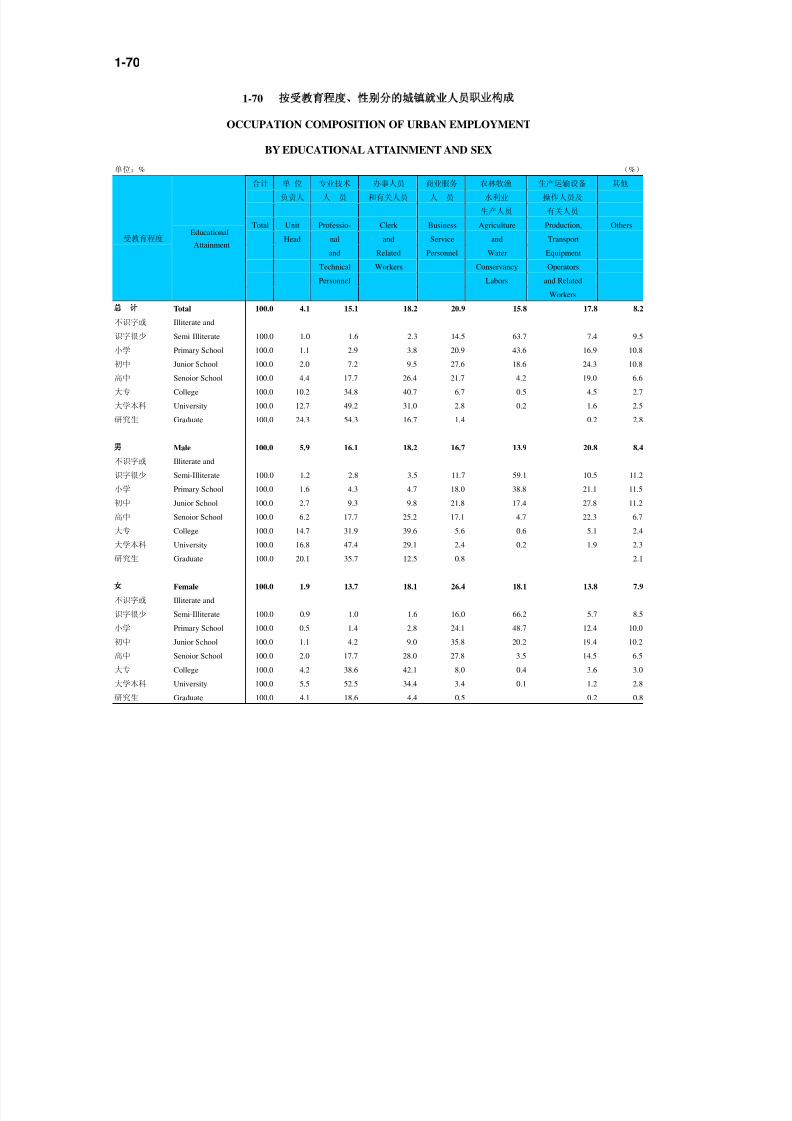
8/2/2019 China Labour Statistical Yearbook - 2004
http://slidepdf.com/reader/full/china-labour-statistical-yearbook-2004 100/464
1-70
1-70
OCCUPATION COMPOSITION OF URBAN EMPLOYMENT
BY EDUCATIONAL ATTAINMENT AND SEX
单位:% (%)
合计 单 位 专业技术 办事人员 商业服务 农林牧渔 生产运输设备 其他
负责人 人 员 和有关人员 人 员 水利业 操作人员及
生产人员 有关人员
Total Unit Professio- Clerk Business Agriculture Production, Others
Head nal and Service and Transport
and Related Personnel Water Equipment
Technical Workers Conservancy Operators
Personnel Labors and Related
受教育程度Educational
Attainment
Workers
Total 100.0 4.1 15.1 18.2 20.9 15.8 17.8 8.2
不识字或 Illiterate and
识字很少 Semi-Illiterate 100.0 1.0 1.6 2.3 14.5 63.7 7.4 9.5
小学 Primary School 100.0 1.1 2.9 3.8 20.9 43.6 16.9 10.8
初中 Junior School 100.0 2.0 7.2 9.5 27.6 18.6 24.3 10.8
高中 Senoior School 100.0 4.4 17.7 26.4 21.7 4.2 19.0 6.6
大专 College 100.0 10.2 34.8 40.7 6.7 0.5 4.5 2.7
大学本科 University 100.0 12.7 49.2 31.0 2.8 0.2 1.6 2.5
研究生 Graduate 100.0 24.3 54.3 16.7 1.4 0.2 2.8
Male 100.0 5.9 16.1 18.2 16.7 13.9 20.8 8.4
不识字或 Illiterate and
识字很少 Semi-Illiterate 100.0 1.2 2.8 3.5 11.7 59.1 10.5 11.2
小学 Primary School 100.0 1.6 4.3 4.7 18.0 38.8 21.1 11.5
初中 Junior School 100.0 2.7 9.3 9.8 21.8 17.4 27.8 11.2
高中 Senoior School 100.0 6.2 17.7 25.2 17.1 4.7 22.3 6.7
大专 College 100.0 14.7 31.9 39.6 5.6 0.6 5.1 2.4
大学本科 University 100.0 16.8 47.4 29.1 2.4 0.2 1.9 2.3
研究生 Graduate 100.0 20.1 35.7 12.5 0.8 2.1
Female 100.0 1.9 13.7 18.1 26.4 18.1 13.8 7.9
不识字或 Illiterate and
识字很少 Semi-Illiterate 100.0 0.9 1.0 1.6 16.0 66.2 5.7 8.5
小学 Primary School 100.0 0.5 1.4 2.8 24.1 48.7 12.4 10.0初中 Junior School 100.0 1.1 4.2 9.0 35.8 20.2 19.4 10.2
高中 Senoior School 100.0 2.0 17.7 28.0 27.8 3.5 14.5 6.5
大专 College 100.0 4.2 38.6 42.1 8.0 0.4 3.6 3.0
大学本科 University 100.0 5.5 52.5 34.4 3.4 0.1 1.2 2.8
研究生 Graduate 100.0 4.1 18.6 4.4 0.5 0.2 0.8

8/2/2019 China Labour Statistical Yearbook - 2004
http://slidepdf.com/reader/full/china-labour-statistical-yearbook-2004 101/464
1-71
1-71
EDUCATIONAL ATTAINMENT COMPOSITION OF URBAN EMPLOYMENT
BY OCCUPATION AND SEX
单位:% (%)
合计 单 位 专业技术 办事人员 商业服务 农林牧渔 生产运输设备 其他
负责人 人 员 和有关人员 人 员 水利业 操作人员及
生产人员 有关人员
Total Unit Professio- Clerk Business Agricul- Production, Others
Head nal and Service ture Transport
and Related Personnel and Equipment
Technical Workers Water Operators
Personnel Conservancy and Related
受教育程度Educational
Attainment
Labors Workers
Total 100.0 100.0 100.0 100.0 100.0 100.0 100.0 100.0
不识字或 Illiterate and
识字很少 Semi-Illiterate 2.6 0.6 0.3 0.3 1.8 10.6 1.1 3.1
小学 Primary School 12.6 3.3 2.4 2.6 12.6 34.7 12.0 16.6
初中 Junior School 39.7 19.4 19.0 20.7 52.5 46.8 54.2 52.5
高中 Senoior School 27.4 29.1 32.2 39.8 28.5 7.3 29.2 22.2
大专 College 12.2 30.1 28.2 27.4 3.9 0.4 3.1 4.0
大学本科 University 5.2 16.0 17.0 8.9 0.7 0.1 0.5 1.6
研究生 Graduate 0.3 1.5 0.9 0.2 … … 0.1
Male 100.0 100.0 100.0 100.0 100.0 100.0 100.0 100.0
不识字或 Illiterate and
识字很少 Semi-Illiterate 1.6 0.3 0.3 0.3 1.1 6.9 0.8 2.2
小学 Primary School 11.6 3.1 3.1 3.0 12.5 32.3 11.7 15.9
初中 Junior School 40.7 18.5 23.6 22.0 53.1 50.9 54.3 54.5
高中 Senoior School 27.5 29.0 30.3 38.2 28.2 9.3 29.5 22.2
大专 College 12.4 30.9 24.5 26.9 4.2 0.5 3.0 3.6
大学本科 University 5.8 16.7 17.2 9.3 0.8 0.1 0.5 1.6
研究生 Graduate 0.4 1.5 1.0 0.3 … 0.1
Female 100.0 100.0 100.0 100.0 100.0 100.0 100.0 100.0
不识字或 Illiterate and
识字很少 Semi-Illiterate 4.0 1.9 0.3 0.3 2.4 14.4 1.6 4.3
小学 Primary School 13.9 4.1 1.4 2.2 12.6 37.2 12.4 17.6初中 Junior School 38.4 23.2 11.8 19.0 52.0 42.8 53.9 49.7
高中 Senoior School 27.2 29.6 35.1 42.0 28.7 5.2 28.6 22.3
大专 College 12.1 27.0 33.9 28.0 3.7 0.3 3.1 4.6
大学本科 University 4.4 12.9 16.7 8.3 0.6 … 0.4 1.6
研究生 Graduate 0.6 1.3 0.8 0.1 … … 0.1

8/2/2019 China Labour Statistical Yearbook - 2004
http://slidepdf.com/reader/full/china-labour-statistical-yearbook-2004 102/464
1-72
1-72
UNEMPLOYED REASON COMPOSITION OF URBAN UNEMPLOYMENT
BY AGE AND SEX
单位:% (%)
下岗 失去工作 毕业后未 其他
年龄 合 计 工作
Laid-off lost Job-off Others
Age Total job after
Graduated
Total 100.0 40.0 32.2 20.0 7.8
16-19 100.0 0.6 5.3 88.6 5.6
20-24 100.0 3.8 18.3 69.1 8.8
25-29 100.0 25.2 35.9 28.4 10.5
30-34 100.0 42.3 39.0 8.8 9.8
35-39 100.0 49.7 38.6 3.2 8.5
40-44 100.0 55.8 37.4 1.2 5.6
45-49 100.0 61.9 32.5 0.4 5.2
50-54 100.0 61.7 31.7 0.6 6.0
55-59 100.0 65.9 26.5 1.5 6.1
60-64 100.0 27.5 41.9 30.7
65+ 100.0 13.4 38.0 48.6
Male 100.0 37.7 32.2 21.6 8.6
16-19 100.0 0.2 4.2 89.5 6.1
20-24 100.0 2.5 17.6 70.9 9.0
25-29 100.0 23.5 35.7 30.7 10.0
30-34 100.0 39.2 39.1 9.4 12.3
35-39 100.0 49.5 37.2 3.5 9.8
40-44 100.0 50.4 41.2 1.0 7.4
45-49 100.0 54.5 38.8 0.3 6.4
50-54 100.0 62.0 32.5 0.4 5.2
55-59 100.0 66.9 26.7 0.9 5.5
60-64 100.0 24.2 40.0 35.8
65+ 100.0 7.2 41.9 50.9
Female 100.0 42.1 32.2 18.5 7.2
16-19 100.0 1.1 6.6 87.4 4.920-24 100.0 5.2 18.9 67.3 8.6
25-29 100.0 26.6 36.0 26.6 10.9
30-34 100.0 44.4 39.0 8.4 8.2
35-39 100.0 49.8 39.5 3.1 7.6
40-44 100.0 60.0 34.5 1.3 4.2
45-49 100.0 69.0 26.5 0.5 4.1
50-54 100.0 60.3 26.8 1.8 11.1
55-59 100.0 43.5 21.7 14.6 20.3
60-64 100.0 46.9 53.1
65+ 100.0 41.3 20.6 38.1

8/2/2019 China Labour Statistical Yearbook - 2004
http://slidepdf.com/reader/full/china-labour-statistical-yearbook-2004 103/464
1-73
AGE COMPOSITION OF URBAN UNEMPLOYMENT
BY UNEMPLOYED REASON AND SEX
单位:% (%)
下岗 失去工作 毕业后未 其他
年龄 合 计 工作
Age Laid-off lost Job-off Others
Total job after
Graduated
Total 100.0 100.0 100.0 100.0 100.0
16-19 6.2 0.1 1.0 27.4 4.4
20-24 12.6 1.2 7.1 43.4 14.1
25-29 12.4 7.8 13.8 17.7 16.6
30-34 17.1 18.1 20.7 7.5 21.4
35-39 16.2 20.1 19.4 2.6 17.5
40-44 15.4 21.5 17.9 0.9 11.0
45-49 12.6 19.5 12.7 0.2 8.4
50-54 5.7 8.8 5.6 0.2 4.3
55-59 1.7 2.8 1.4 0.1 1.3
60-64 0.1 0.1 0.2 0.6
65+ 0.1 … 0.1 0.5
Male 100.0 100.0 100.0 100.0 100.0
16-19 7.3 0.0 1.0 30.2 5.2
20-24 13.4 0.9 7.3 44.1 14.1
25-29 11.4 7.1 12.6 16.2 13.3
30-34 14.3 14.9 17.3 6.3 20.6
35-39 13.1 17.2 15.1 2.1 15.0
40-44 13.9 18.6 17.8 0.7 12.0
45-49 12.7 18.4 15.3 0.2 9.6
50-54 10.1 16.7 10.2 0.2 6.1
55-59 3.4 6.0 2.8 0.2 2.2
60-64 0.3 0.2 0.3 1.1
65+ 0.1 0.0 0.2 0.9
Female 100.0 100.0 100.0 100.0 100.0
16-19 5.1 0.1 1.1 24.3 3.5
20-24 11.8 1.5 6.9 42.8 14.1
25-29 13.4 8.5 14.9 19.2 20.2
30-34 19.7 20.7 23.9 8.9 22.3
35-39 19.1 22.5 23.4 3.2 20.2
40-44 16.8 24.0 18.1 1.2 9.8
45-49 12.5 20.4 10.3 0.3 7.0
50-54 1.5 2.2 1.3 0.2 2.3
55-59 0.1 0.1 0.1 0.1 0.4
60-64 … … 0.1
65+ … … … 0.2

8/2/2019 China Labour Statistical Yearbook - 2004
http://slidepdf.com/reader/full/china-labour-statistical-yearbook-2004 104/464
1-73
1-73
AGE COMPOSITION OF URBAN UNEMPLOYMENT
BY UNEMPLOYED REASON AND SEX
单位:% (%)
下岗 失去工作 毕业后未 其他
年龄 合 计 工作
Age Laid-off lost Job-off Others
Total job after
Graduated
Total 100.0 100.0 100.0 100.0 100.0
16-19 6.2 0.1 1.0 27.4 4.4
20-24 12.6 1.2 7.1 43.4 14.1
25-29 12.4 7.8 13.8 17.7 16.6
30-34 17.1 18.1 20.7 7.5 21.4
35-39 16.2 20.1 19.4 2.6 17.5
40-44 15.4 21.5 17.9 0.9 11.0
45-49 12.6 19.5 12.7 0.2 8.4
50-54 5.7 8.8 5.6 0.2 4.3
55-59 1.7 2.8 1.4 0.1 1.3
60-64 0.1 0.1 0.2 0.6
65+ 0.1 … 0.1 0.5
Male 100.0 100.0 100.0 100.0 100.0
16-19 7.3 0.0 1.0 30.2 5.2
20-24 13.4 0.9 7.3 44.1 14.1
25-29 11.4 7.1 12.6 16.2 13.3
30-34 14.3 14.9 17.3 6.3 20.6
35-39 13.1 17.2 15.1 2.1 15.0
40-44 13.9 18.6 17.8 0.7 12.0
45-49 12.7 18.4 15.3 0.2 9.6
50-54 10.1 16.7 10.2 0.2 6.1
55-59 3.4 6.0 2.8 0.2 2.2
60-64 0.3 0.2 0.3 1.1
65+ 0.1 0.0 0.2 0.9
Female 100.0 100.0 100.0 100.0 100.016-19 5.1 0.1 1.1 24.3 3.5
20-24 11.8 1.5 6.9 42.8 14.1
25-29 13.4 8.5 14.9 19.2 20.2
30-34 19.7 20.7 23.9 8.9 22.3
35-39 19.1 22.5 23.4 3.2 20.2
40-44 16.8 24.0 18.1 1.2 9.8
45-49 12.5 20.4 10.3 0.3 7.0
50-54 1.5 2.2 1.3 0.2 2.3
55-59 0.1 0.1 0.1 0.1 0.4
60-64 … … 0.1
65+ … … … 0.2
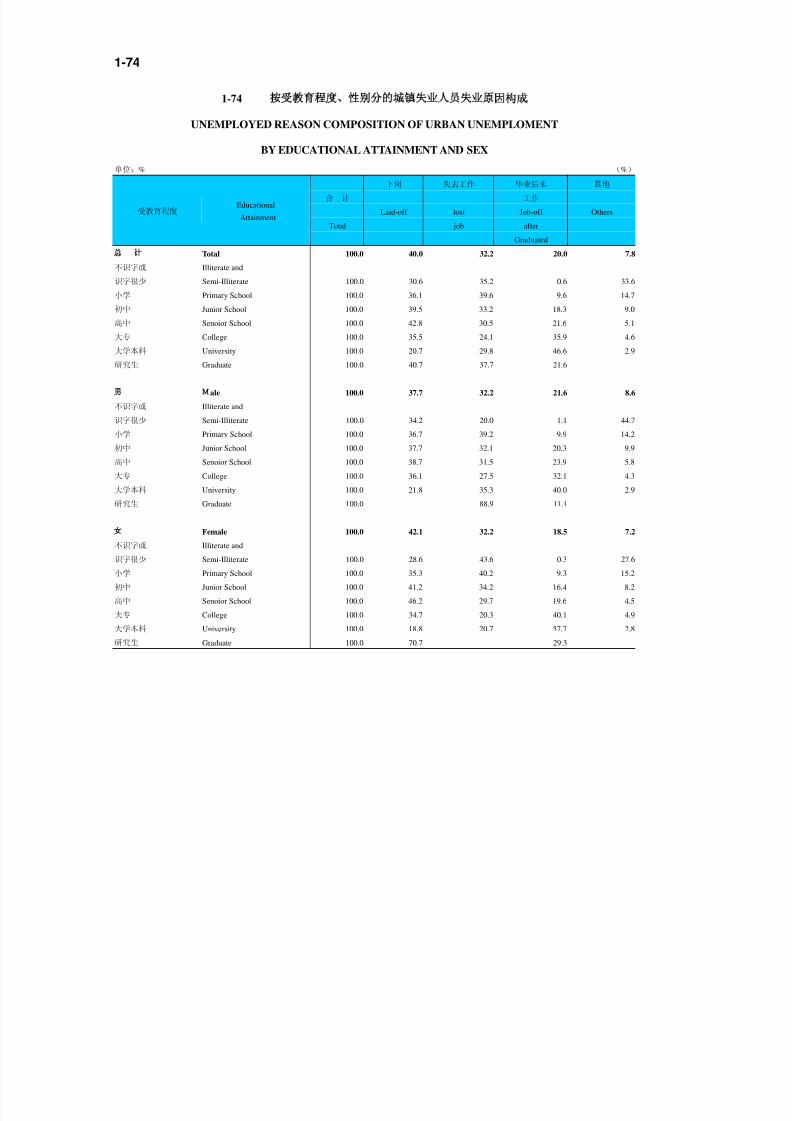
8/2/2019 China Labour Statistical Yearbook - 2004
http://slidepdf.com/reader/full/china-labour-statistical-yearbook-2004 105/464
1-74
1-74
UNEMPLOYED REASON COMPOSITION OF URBAN UNEMPLOMENT
BY EDUCATIONAL ATTAINMENT AND SEX
单位:% (%)
下岗 失去工作 毕业后未 其他
合 计 工作
Laid-off lost Job-off Others
Total job after
受教育程度Educational
Attainment
Graduated
Total 100.0 40.0 32.2 20.0 7.8
不识字或 Illiterate and
识字很少 Semi-Illiterate 100.0 30.6 35.2 0.6 33.6
小学 Primary School 100.0 36.1 39.6 9.6 14.7
初中 Junior School 100.0 39.5 33.2 18.3 9.0
高中 Senoior School 100.0 42.8 30.5 21.6 5.1
大专 College 100.0 35.5 24.1 35.9 4.6
大学本科 University 100.0 20.7 29.8 46.6 2.9
研究生 Graduate 100.0 40.7 37.7 21.6
ale 100.0 37.7 32.2 21.6 8.6
不识字或 Illiterate and
识字很少 Semi-Illiterate 100.0 34.2 20.0 1.1 44.7
小学 Primary School 100.0 36.7 39.2 9.9 14.2
初中 Junior School 100.0 37.7 32.1 20.3 9.9
高中 Senoior School 100.0 38.7 31.5 23.9 5.8
大专 College 100.0 36.1 27.5 32.1 4.3
大学本科 University 100.0 21.8 35.3 40.0 2.9
研究生 Graduate 100.0 88.9 11.1
Female 100.0 42.1 32.2 18.5 7.2
不识字或 Illiterate and
识字很少 Semi-Illiterate 100.0 28.6 43.6 0.3 27.6
小学 Primary School 100.0 35.3 40.2 9.3 15.2
初中 Junior School 100.0 41.2 34.2 16.4 8.2
高中 Senoior School 100.0 46.2 29.7 19.6 4.5
大专 College 100.0 34.7 20.3 40.1 4.9
大学本科 University 100.0 18.8 20.7 57.7 2.8研究生 Graduate 100.0 70.7 29.3

8/2/2019 China Labour Statistical Yearbook - 2004
http://slidepdf.com/reader/full/china-labour-statistical-yearbook-2004 106/464
1-75
1-75
EDUCATIONAL ATTAINMENT COMPOSITION OF URBAN UNEMPLOYMENT
BY UNEMPLOYED REASON AND SEX
单位:% (%)
下岗 失去工作 毕业后未 其他
合 计 工作
Laid-off lost Job-off Others
Total job after
受教育程度Educational
Attainment
Graduated
Total 100.0 100.0 100.0 100.0 100.0
不识字或 Illiterate and
识字很少 Semi-Illiterate 0.5 0.4 0.6 … 2.2
小学 Primary School 7.4 6.7 9.1 3.6 13.8
初中 Junior School 49.4 48.9 51.0 45.1 56.8
高中 Senoior School 36.1 38.5 34.2 39.0 23.5
大专 College 5.6 4.9 4.2 10.0 3.3
大学本科 University 1.0 0.5 0.9 2.4 0.4
研究生 Graduate … … … …
ale 100.0 100.0 100.0 100.0 100.0
不识字或 Illiterate and
识字很少 Semi-Illiterate 0.4 0.4 0.2 0.0 2.0
小学 Primary School 8.4 8.2 10.2 3.9 14.0
初中 Junior School 49.1 49.2 48.9 46.2 56.8
高中 Senoior School 34.7 35.7 34.0 38.5 23.7
大专 College 6.1 5.8 5.2 9.0 3.1
大学本科 University 1.3 0.8 1.4 2.4 0.5
研究生 Graduate … 0.1 …
Female 100.0 100.0 100.0 100.0 100.0
不识字或 Illiterate and
识字很少 Semi-Illiterate 0.7 0.4 0.9 0.0 2.5
小学 Primary School 6.5 5.4 8.1 3.2 13.7
初中 Junior School 49.8 48.7 53.0 44.0 56.8
高中 Senoior School 37.3 40.9 34.3 39.5 23.3
大专 College 5.1 4.2 3.2 11.0 3.5
大学本科 University 0.7 0.3 0.5 2.3 0.3研究生 Graduate … 0.1 0.1

8/2/2019 China Labour Statistical Yearbook - 2004
http://slidepdf.com/reader/full/china-labour-statistical-yearbook-2004 107/464
1-76
1-76
EDUCATIONAL ATTAINMENT COMPOSITION OF URBAN UNEMPLOYMENT
BY AGE AND SEX
单位:% (%)
合 计 不识字 小学 初中 高中 大专 大学本科 研究生
年龄 Total Illiterate Primary Junior Senior College University Graduate
Age and Semi- School School School
illiterate
Total 100.0 0.5 7.4 49.4 36.1 5.6 1.0
16-19 100.0 … 5.1 62.1 30.4 2.2 0.2
20-24 100.0 0.1 3.0 37.2 43.9 12.8 3.0 …
25-29 100.0 0.2 4.8 47.1 38.6 8.1 1.2 …
30-34 100.0 0.3 5.7 53.7 34.2 5.3 0.9
35-39 100.0 0.6 7.5 55.1 32.2 4.0 0.7 …
40-44 100.0 0.4 5.6 42.7 47.1 3.7 0.5
45-49 100.0 1.2 11.4 50.8 33.5 2.5 0.5 0.1
50-54 100.0 1.6 19.5 56.9 16.9 4.8 0.5
55-59 100.0 0.9 24.9 43.1 23.0 5.9 2.2
60-64 100.0 11.5 36.2 40.7 3.4 8.3
65+ 100.0 20.6 47.0 29.1 3.4
Male 100.0 0.4 8.4 49.1 34.7 6.1 1.3 …
16-19 100.0 … 4.4 64.1 29.3 1.8 0.3
20-24 100.0 3.0 37.0 44.9 11.9 3.2
25-29 100.0 0.2 4.7 45.4 39.7 8.8 1.1 …
30-34 100.0 6.5 51.2 35.3 5.8 1.2
35-39 100.0 0.1 7.6 53.0 32.3 5.6 1.3 0.1
40-44 100.0 0.2 6.2 42.4 45.3 5.0 1.0
45-49 100.0 1.1 11.4 51.9 31.7 3.2 0.7 0.1
50-54 100.0 1.0 19.5 58.0 16.2 4.9 0.5
55-59 100.0 1.0 23.7 43.8 23.7 5.7 2.2
60-64 100.0 4.5 34.4 47.5 3.9 9.7
65+ 100.0 16.6 50.0 31.0 2.4
Female 100.0 0.7 6.5 49.8 37.3 5.1 0.7
16-19 100.0 6.0 59.6 31.7 2.6 0.120-24 100.0 0.3 3.0 37.4 42.7 13.8 2.8 0.1
25-29 100.0 0.1 5.0 48.3 37.8 7.6 1.2 …
30-34 100.0 0.5 5.2 55.3 33.4 4.9 0.6
35-39 100.0 0.8 7.5 56.4 32.1 3.0 0.3
40-44 100.0 0.6 5.2 43.0 48.5 2.7 0.1
45-49 100.0 1.3 11.5 49.8 35.2 1.8 0.3 0.2
50-54 100.0 4.8 19.3 49.9 20.8 4.7 0.6
55-59 100.0 53.2 26.2 7.5 10.8 2.4
60-64 100.0 53.1 46.9
65+ 100.0 38.1 33.2 20.6 8.1

8/2/2019 China Labour Statistical Yearbook - 2004
http://slidepdf.com/reader/full/china-labour-statistical-yearbook-2004 108/464
1-77
1-77
AGE COMPOSITION OF URBAN UNEMPLOYMENT
BY EDUCATIONAL ATTAINMENT AND SEX
单位:% (%)
合 计 不识字 小学 初中 高中 大专 大学本科 研究生
年龄 Total Illiterate Primary Junior Senior College University Graduate
Age and Semi- School School School
illiterate
Total 100.0 100.0 100.0 100.0 100.0 100.0 100.0 100.0
16-19 6.2 0.2 4.3 7.8 5.2 2.4 1.4
20-24 12.6 3.1 5.1 9.4 15.3 29.0 37.5 10.7
25-29 12.4 3.5 8.1 11.8 13.3 18.1 14.7 10.9
30-34 17.1 9.2 13.2 18.5 16.2 16.2 14.6
35-39 16.2 17.2 16.4 18.0 14.4 11.7 10.9 18.7
40-44 15.4 12.3 11.7 13.3 20.1 10.3 7.3
45-49 12.6 28.2 19.4 12.9 11.7 5.6 6.0 59.7
50-54 5.7 16.8 14.9 6.5 2.7 4.9 2.8
55-59 1.7 3.1 5.7 1.5 1.1 1.8 3.7
60-64 0.1 3.1 0.7 0.1 … 1.2
65+ 0.1 3.3 0.5 0.1 …
Male 100.0 100.0 100.0 100.0 100.0 100.0 100.0 100.0
16-19 7.3 0.6 3.8 9.5 6.2 2.2 1.7
20-24 13.4 4.8 10.1 17.3 26.2 32.9
25-29 11.4 5.9 6.4 10.6 13.0 16.4 10.0 11.1
30-34 14.3 11.0 14.9 14.5 13.7 13.2
35-39 13.1 4.9 11.7 14.1 12.2 12.0 13.4 44.1
40-44 13.9 7.8 10.2 12.0 18.1 11.4 10.6
45-49 12.7 35.7 17.2 13.5 11.6 6.7 7.0 44.8
50-54 10.1 27.3 23.4 12.0 4.7 8.1 3.7
55-59 3.4 8.7 9.6 3.0 2.3 3.2 5.6
60-64 0.3 3.0 1.0 0.3 … 1.9
65+ 0.1 6.3 0.9 0.1 …
Female 100.0 100.0 100.0 100.0 100.0 100.0 100.0 100.0
16-19 5.1 4.8 6.2 4.4 2.6 0.820-24 11.8 4.8 5.4 8.8 13.5 32.1 45.2 18.5
25-29 13.4 2.2 10.2 13.0 13.6 20.0 22.5 10.7
30-34 19.7 14.3 15.9 21.9 17.6 18.9 16.8
35-39 19.1 23.9 22.1 21.6 16.4 11.3 6.7
40-44 16.8 14.8 13.5 14.5 21.9 9.0 1.9
45-49 12.5 24.1 22.1 12.5 11.8 4.5 4.5 70.7
50-54 1.5 11.0 4.5 1.5 0.8 1.4 1.1
55-59 0.1 1.1 0.1 … 0.3 0.4
60-64 … 3.2 0.3
65+ … 1.8 0.2 … …

8/2/2019 China Labour Statistical Yearbook - 2004
http://slidepdf.com/reader/full/china-labour-statistical-yearbook-2004 109/464
1-78
1-78
SEEKING JOB METHOD COMPOSITION OF URBAN UNEMPLOYMENT
BY AGE AND SEX
单位:% (%)
合计 在职业介绍 委托亲友 应答或刊登 为自己经营 下岗等待 其他
年龄 机构登记 找工作 广告 作准备 安置
Age Register in Ask Friends Answer Prepare Wait For Others
Total Employment Relatives or For Own Relocation
Agency Office About Jobs Advertise Business After Laid-off
Total 100.0 17.9 36.9 1.0 5.9 17.5 20.8
16-19 100.0 18.2 51.1 1.2 4.3 0.1 25.2
20-24 100.0 22.6 43.3 2.4 5.5 2.7 23.6
25-29 100.0 18.3 38.8 1.2 7.7 13.2 20.9
30-34 100.0 16.2 36.5 0.9 5.8 19.4 21.2
35-39 100.0 16.1 33.9 0.6 6.8 22.7 19.8
40-44 100.0 19.0 32.7 0.5 5.1 25.0 17.8
45-49 100.0 17.4 33.5 0.5 5.4 24.1 19.1
50-54 100.0 15.6 32.3 1.0 6.1 23.0 22.1
55-59 100.0 14.5 34.3 0.5 4.3 20.0 26.4
60-64 100.0 5.8 49.9 9.7 6.8 27.9
65+ 100.0 1.9 57.2 17.2 23.7
Male 100.0 18.1 36.8 0.9 6.7 16.2 21.3
16-19 100.0 18.4 50.9 1.2 5.3 0.1 24.1
20-24 100.0 23.4 41.5 2.1 5.9 2.2 24.9
25-29 100.0 17.6 37.9 1.4 8.9 12.0 22.2
30-34 100.0 15.7 37.9 0.6 6.3 17.5 21.9
35-39 100.0 15.6 33.7 0.6 7.6 23.1 19.5
40-44 100.0 20.4 32.5 0.2 5.9 21.3 19.7
45-49 100.0 18.3 33.0 0.6 7.5 22.9 17.8
50-54 100.0 16.6 32.5 1.1 6.2 23.5 20.2
55-59 100.0 14.4 34.3 0.5 4.4 20.8 25.5
60-64 100.0 6.8 53.8 11.3 7.9 20.2
65+ 100.0 2.4 54.0 21.0 22.6
Female 100.0 17.6 37.1 1.1 5.1 18.7 20.4
16-19 100.0 17.9 51.5 1.2 2.9 26.520-24 100.0 21.7 45.2 2.6 5.0 3.3 22.1
25-29 100.0 18.8 39.5 1.1 6.7 14.1 19.8
30-34 100.0 16.6 35.6 1.1 5.4 20.7 20.7
35-39 100.0 16.5 34.1 0.7 6.3 22.5 19.9
40-44 100.0 17.9 32.8 0.7 4.4 27.8 16.4
45-49 100.0 16.6 34.1 0.4 3.4 25.2 20.4
50-54 100.0 9.4 31.5 0.3 5.0 19.9 34.0
55-59 100.0 16.6 34.8 1.1 47.5
60-64 100.0 26.6 73.5
65+ 100.0 71.3 28.7

8/2/2019 China Labour Statistical Yearbook - 2004
http://slidepdf.com/reader/full/china-labour-statistical-yearbook-2004 110/464
1-79
1-79
SEEKING JOB METHOD COMPOSITION OF URBAN UNEMPLOYMENT
BY EDUCATIONAL ATTAINMENT AND SEX
单位:% (%)
合计 在职业介绍 委托亲友 应答或刊登 为自己经营 下岗等待 其他
机构登记 找工作 广告 作准备 安置
Register in Ask Friends Answer Prepare Wait For Others
Total Employment Relatives or For Own Relocation
Agency About Advertise Business After
受教育程度Educational
Attainment
Office Job Laid-off
Total 100.0 17.9 36.9 1.0 5.9 17.5 20.8
不识字或 Illiterate and
识字很少 Semi-Illiterate 100.0 10.5 32.2 7.9 18.3 31.1
小学 Primary School 100.0 10.5 41.2 0.5 5.8 16.0 26.1
初中 Junior School 100.0 15.8 39.0 0.8 6.0 16.9 21.5
高中 Senoior School 100.0 20.4 34.7 1.1 6.0 19.3 18.5
大专 College 100.0 25.9 30.5 2.0 4.3 15.0 22.3
大学本科 University 100.0 39.9 22.7 6.8 6.5 5.2 18.9
研究生 Graduate 100.0 19.0 18.7 6.2 40.7 15.4
Male 100.0 18.1 36.8 0.9 6.7 16.2 21.3
不识字或 Illiterate and
识字很少 Semi-Illiterate 100.0 38.4 9.4 13.4 38.8
小学 Primary School 100.0 9.8 42.8 0.5 5.6 15.7 25.6
初中 Junior School 100.0 15.7 38.9 0.6 6.9 15.7 22.2
高中 Senoior School 100.0 21.5 34.2 1.1 7.1 17.7 18.5
大专 College 100.0 25.9 28.7 1.7 4.2 15.1 24.5
大学本科 University 100.0 42.8 24.1 6.7 7.5 3.6 15.4
研究生 Graduate 100.0 44.8 44.1 11.1
Female 100.0 17.6 37.1 1.1 5.1 18.7 20.4
不识字或 Illiterate and
识字很少 Semi-Illiterate 100.0 16.2 28.8 7.1 21.0 26.9
小学 Primary School 100.0 11.4 39.2 0.4 5.9 16.2 26.8
初中 Junior School 100.0 15.9 39.1 0.9 5.1 18.1 21.0
高中 Senoior School 100.0 19.6 35.1 1.1 5.1 20.8 18.4
大专 College 100.0 25.9 32.5 2.4 4.5 14.9 19.8大学本科 University 100.0 35.1 20.4 7.2 5.0 7.8 24.6
研究生 Graduate 100.0 10.7 70.7 18.5

8/2/2019 China Labour Statistical Yearbook - 2004
http://slidepdf.com/reader/full/china-labour-statistical-yearbook-2004 111/464
1-80
1-80
SECTOR COMPOSITION OF URBAN UNEMPLOYMENT
BY AGE AND SEX
单位:% (%)
农、林、 采 矿 业 制 造 业 电力、燃气及 建 筑 业 交通运输、仓
合 计 牧、渔业 水的生产 储和邮政业
Farming, 和供应业 Transport,
年龄 Forestry, Mining and Manufac- Production Construc- Storage,
Age Animal Quarrying turing and Supply of tion Post &
Total Husbandry Electricity Telecommu-
and Gas and nications
Fishery Water
Total 100.0 5.6 2.0 37.5 3.0 5.5 7.5
16-19 100.0 11.4 1.4 17.1 1.9 6.7
20-24 100.0 7.6 1.7 17.6 1.3 3.5 6.0
25-29 100.0 6.6 2.2 28.0 1.5 4.1 7.2
30-34 100.0 6.0 2.0 38.2 2.4 4.8 7.5
35-39 100.0 6.5 2.2 38.8 3.2 4.8 7.6
40-44 100.0 4.1 1.5 42.0 3.7 6.5 7.2
45-49 100.0 3.6 1.8 43.4 3.9 7.2 7.5
50-54 100.0 5.3 3.6 41.4 3.8 6.5 9.8
55-59 100.0 4.8 3.2 39.0 7.3 9.5 8.6
60-64 100.0 17.2 24.1 10.3 10.3 13.8
65+ 100.0 21.4 28.6 7.1 7.1
Male 100.0 5.7 2.3 38.2 3.2 7.2 10.3
16-19 100.0 9.6 1.7 19.1 1.7 8.7
20-24 100.0 8.4 1.5 15.2 1.3 4.8 9.9
25-29 100.0 7.0 2.7 27.8 1.4 5.7 10.6
30-34 100.0 6.3 1.9 39.6 2.9 5.9 11.7
35-39 100.0 6.1 2.4 38.6 3.8 6.6 10.4
40-44 100.0 4.5 1.7 43.0 4.0 8.3 8.9
45-49 100.0 4.1 1.6 44.3 3.1 9.2 10.7
50-54 100.0 5.1 4.0 42.5 3.6 7.2 10.5
55-59 100.0 4.6 3.3 39.5 7.6 9.9 8.9
60-64 100.0 16.0 28.0 4.0 12.0 12.0
65+ 100.0 18.2 36.4 9.1
Female 100.0 5.5 1.8 36.8 2.9 4.1 5.0
16-19 100.0 12.6 1.1 14.7 0.0 2.1 4.2
20-24 100.0 7.0 1.9 19.7 1.4 2.1 2.1
25-29 100.0 6.4 1.8 28.2 1.5 3.0 4.6
30-34 100.0 5.8 2.0 37.3 2.2 4.1 4.8
35-39 100.0 6.7 2.1 39.0 2.8 3.7 5.9
40-44 100.0 3.8 1.4 41.1 3.4 5.2 5.845-49 100.0 3.1 2.0 42.7 4.7 5.2 4.5
50-54 100.0 6.2 0.7 34.5 4.8 2.1 5.5
55-59 100.0 10.0 20.0
60-64 100.0 25.0 50.0 25.0
65+ 100.0 33.3 33.3

8/2/2019 China Labour Statistical Yearbook - 2004
http://slidepdf.com/reader/full/china-labour-statistical-yearbook-2004 112/464
1-80 1 continued
单位:% (%)
信息传输、 批发和零售业 住宿和餐饮业 金融业 房地产业 租赁和商务 科学研究、
计算机服务 服务业 技术服务和
和软件业 地质勘查业
年龄 Data Wholesale Hotel Banking Real Leasing Scientific
Age Transmission, and and Estate and Research,
Computer Retail Catering Business Technical
Service & Trade Services Services Services,&
Software Geological
Prospecting
Total 1.0 13.6 4.9 1.2 0.4 3.1 0.8
16-19 6.2 19.5 6.7 1.4 2.9 0.5
20-24 4.4 17.2 11.9 2.4 1.1 3.1 0.1
25-29 1.7 17.9 7.1 0.9 0.4 4.1 0.6
30-34 0.9 13.5 5.2 1.1 0.6 3.3 0.6
35-39 0.4 13.1 4.9 1.4 0.3 2.3 0.5
40-44 0.6 12.6 3.9 1.0 0.3 3.7 1.3
45-49 0.5 12.5 3.3 1.3 0.3 2.6 1.0
50-54 0.4 12.0 2.0 1.4 0.6 2.2 0.8
55-59 1.6 7.0 3.2 3.5 2.2
60-64 3.4 3.4
65+ 14.3 14.3
Male 0.9 10.6 3.7 1.1 0.5 2.8 0.9
16-19 5.2 17.4 7.0 1.7 1.7 0.9
20-24 3.5 12.9 11.4 3.0 0.8 3.8 0.325-29 1.9 13.5 5.3 0.5 0.5 3.8 0.7
30-34 0.7 10.6 3.1 1.0 0.4 3.1 0.6
35-39 0.3 10.1 3.8 1.7 0.5 1.5 1.0
40-44 0.7 9.3 2.9 0.7 0.4 3.2 1.4
45-49 0.4 9.7 2.5 0.8 0.4 2.8 0.8
50-54 0.4 11.1 1.8 1.3 0.7 2.0 0.9
55-59 1.6 6.9 3.3 3.6 2.3
60-64 4.0 4.0
65+ 18.2 9.1
Female 1.1 16.4 6.1 1.3 0.4 3.4 0.6
16-19 7.4 23.2 6.3 1.1 4.2 0.0
20-24 5.2 21.4 12.4 1.9 1.4 2.3 0.0
25-29 1.5 21.2 8.4 1.2 0.4 4.4 0.5
30-34 1.0 15.4 6.6 1.1 0.6 3.3 0.5
35-39 0.6 15.0 5.6 1.1 0.2 2.8 0.2
40-44 0.5 15.2 4.6 1.2 0.2 4.1 1.1
45-49 0.5 15.1 4.1 1.7 0.2 2.5 1.2
50-54 17.9 2.8 2.1 4.1 0.7
55-59 10.0
60-64
65+ 33.3

8/2/2019 China Labour Statistical Yearbook - 2004
http://slidepdf.com/reader/full/china-labour-statistical-yearbook-2004 113/464
1-80 2 continued
单位:% (%)
水利、环境和 居民服务和 教育 卫生、社会 文化、体育 公共管理和 国际组织
公共设施管理业
其他服务业 保障和社会 和娱乐业 社会组织
Water 福利业 Culture
年龄 Conservancy, Public Education Public Heal- Sports Public Interna-
Age Environment and th, Social and Adminis- tional
and public other Securities Entertain- trantion Organiza-
Utility Services & Social ment and Social tions
Management Welfare Organizations
Total 0.5 9.2 0.5 1.1 0.9 1.5 0.1
16-19 18.1 1.0 1.4 2.4 0.5 1.0
20-24 0.6 13.0 0.5 1.6 2.7 3.5 0.1
25-29 0.4 11.0 0.4 1.2 1.6 2.8 0.2
30-34 0.2 9.6 0.7 1.2 0.9 1.3 0.1
35-39 0.5 9.3 0.5 1.4 0.5 1.4 0.2
40-44 0.6 8.7 0.3 0.7 0.5 0.9
45-49 0.6 7.4 0.6 1.1 0.5 0.9
50-54 0.8 6.7 0.6 0.8 0.7 0.8 0.3
55-59 0.3 4.4 0.6 1.0 1.0 2.9
60-64 3.4 6.9 6.9
65+ 7.1
Male 0.5 7.9 0.3 0.8 1.0 1.9 0.1
16-19 20.0 1.7 2.6 0.9
20-24 0.8 10.4 0.5 1.3 4.1 6.3
25-29 0.7 9.1 0.1 1.5 2.2 4.5 0.3
30-34 0.4 7.9 0.3 0.8 1.1 1.7
35-39 0.4 8.3 0.5 1.2 0.5 2.0 0.3
40-44 0.4 8.3 0.2 0.6 1.4
45-49 0.3 6.8 0.3 0.9 0.3 0.9
50-54 0.8 6.0 0.4 0.4 0.5 0.5 0.3
55-59 0.3 3.9 0.7 0.7 1.0 2.0
60-64 4.0 8.0 8.0
65+ 9.1
Female 0.5 10.3 0.7 1.4 0.7 1.1 0.1
16-19 15.8 3.2 2.1 2.1
20-24 0.5 15.5 0.5 1.9 1.6 0.9 0.2
25-29 0.1 12.4 0.5 0.9 1.1 1.5 0.2
30-34 0.2 10.7 0.9 1.4 0.7 1.1 0.2
35-39 0.6 10.0 0.4 1.5 0.6 1.1 0.2
40-44 0.7 9.0 0.6 1.1 0.4 0.6
45-49 0.9 7.9 0.8 1.3 0.6 0.9
50-54 10.3 2.1 2.8 0.7 2.8
55-59 20.0 10.0 30.0
60-64
65+

8/2/2019 China Labour Statistical Yearbook - 2004
http://slidepdf.com/reader/full/china-labour-statistical-yearbook-2004 114/464
1-81
1-81
SECTOR COMPOSITION OF URBAN UNEMPLOYMENT
BY EDUCATIONAL ATTAINMENT AND SEX
单位:% (%)
农、林、 采 矿 业 制 造 业 电力、燃气及 建 筑 业 交通运输、仓
合 计 牧、渔业 水的生产 储和邮政业
Farming, 和供应业 Transport,
Forestry, Mining and Manufac- Production Construc- Storage,
Animal Quarrying turing and Supply of tion Post &
Total Husbandry Electricity Telecommu-
and Gas and nications
受教育程度Educational
Attainment
Fishery Water
Total 100.0 5.6 2.0 37.5 3.0 5.5 7.
不识字或 Illiterate and
识字很少 Semi-Illiterate 100.0 17.4 3.3 19.6 3.3 7.6 6.
小学 Primary School 100.0 13.7 2.6 36.4 3.1 6.8 7.
初中 Junior School 100.0 6.2 2.3 38.0 2.7 5.7 7.
高中 Senoior School 100.0 3.1 1.8 38.3 3.5 4.9 7.
大专 College 100.0 1.9 0.9 32.2 2.9 6.0 7.
大学本科 University 100.0 2.8 28.0 2.8 6.5 4.
研究生 Graduate 100.0 20.0 40.0
Male 100.0 5.7 2.3 38.2 3.2 7.2 10.
不识字或 Illiterate and
识字很少 Semi-Illiterate 100.0 6.7 10.0 26.7 3.3 13.3 10.
小学 Primary School 100.0 13.4 3.2 36.0 3.5 8.1 10.
初中 Junior School 100.0 6.1 2.6 38.5 3.0 7.7 11.
高中 Senoior School 100.0 3.5 1.8 39.7 3.7 6.2 9.
大专 College 100.0 1.8 1.1 32.5 2.6 7.1 10.
大学本科 University 100.0 2.7 32.4 2.7 5.4 5.
研究生 Graduate 100.0 50.0
Female 100.0 5.5 1.8 36.8 2.9 4.1 5.
不识字或 Illiterate and
识字很少 Semi-Illiterate 100.0 23.3 16.7 3.3 5.0 3.
小学 Primary School 100.0 14.0 1.9 36.9 2.7 5.3 4.
初中 Junior School 100.0 6.3 2.0 37.5 2.5 4.0 5.高中 Senoior School 100.0 2.7 1.8 37.1 3.3 3.8 5.
大专 College 100.0 1.9 0.6 31.9 3.4 4.7 4.
大学本科 University 100.0 3.2 19.4 3.2 9.7 3.
研究生 Graduate 100.0 66.7
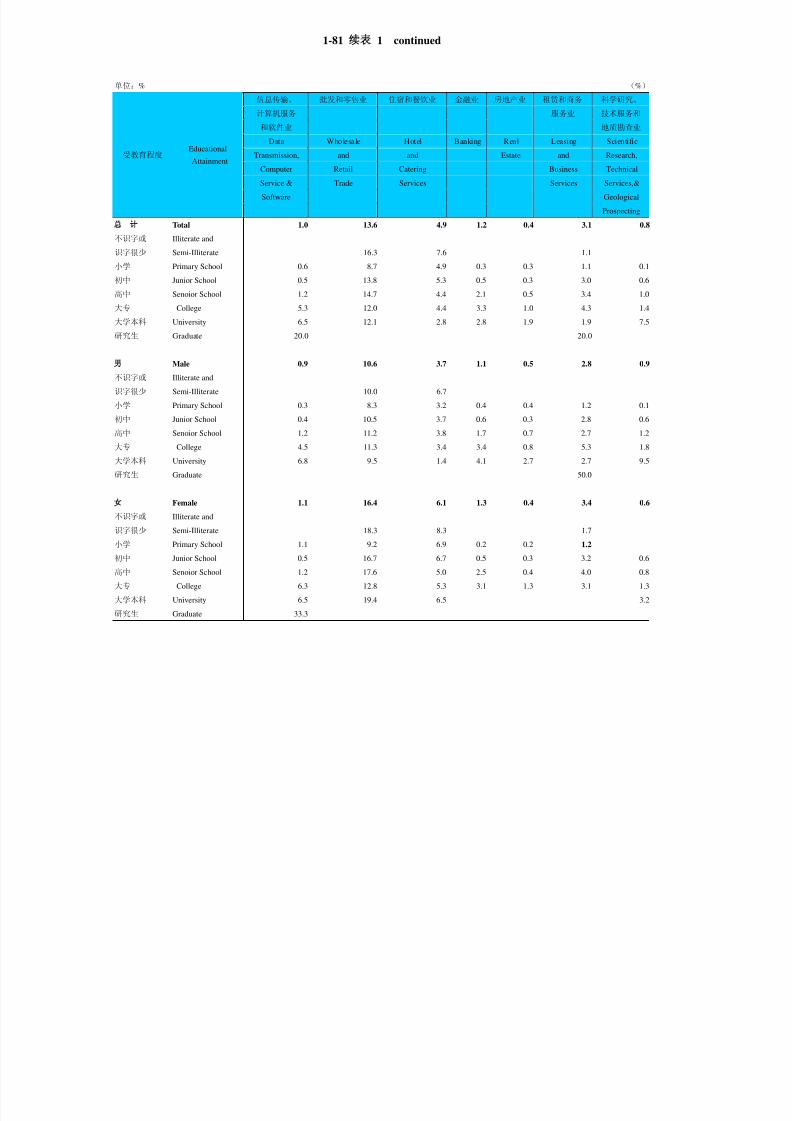
8/2/2019 China Labour Statistical Yearbook - 2004
http://slidepdf.com/reader/full/china-labour-statistical-yearbook-2004 115/464
1-81 1 continued
单位:% (%)
信息传输、 批发和零售业 住宿和餐饮业 金融业 房地产业 租赁和商务 科学研究、
计算机服务 服务业 技术服务和
和软件业 地质勘查业
Data Wholesale Hotel Banking Real Leasing Scientific
Transmission, and and Estate and Research,Computer Retail Catering Business Technical
Service & Trade Services Services Services,&
Software Geological
受教育程度
Educational
Attainment
Prospecting
Total 1.0 13.6 4.9 1.2 0.4 3.1 0.8
不识字或 Illiterate and
识字很少 Semi-Illiterate 16.3 7.6 1.1
小学 Primary School 0.6 8.7 4.9 0.3 0.3 1.1 0.1
初中 Junior School 0.5 13.8 5.3 0.5 0.3 3.0 0.6
高中 Senoior School 1.2 14.7 4.4 2.1 0.5 3.4 1.0
大专 College 5.3 12.0 4.4 3.3 1.0 4.3 1.4
大学本科 University 6.5 12.1 2.8 2.8 1.9 1.9 7.5
研究生 Graduate 20.0 20.0
Male 0.9 10.6 3.7 1.1 0.5 2.8 0.9
不识字或 Illiterate and
识字很少 Semi-Illiterate 10.0 6.7
小学 Primary School 0.3 8.3 3.2 0.4 0.4 1.2 0.1
初中 Junior School 0.4 10.5 3.7 0.6 0.3 2.8 0.6
高中 Senoior School 1.2 11.2 3.8 1.7 0.7 2.7 1.2
大专 College 4.5 11.3 3.4 3.4 0.8 5.3 1.8
大学本科 University 6.8 9.5 1.4 4.1 2.7 2.7 9.5
研究生 Graduate 50.0
Female 1.1 16.4 6.1 1.3 0.4 3.4 0.6
不识字或 Illiterate and
识字很少 Semi-Illiterate 18.3 8.3 1.7
小学 Primary School 1.1 9.2 6.9 0.2 0.2 1.2
初中 Junior School 0.5 16.7 6.7 0.5 0.3 3.2 0.6
高中 Senoior School 1.2 17.6 5.0 2.5 0.4 4.0 0.8
大专 College 6.3 12.8 5.3 3.1 1.3 3.1 1.3
大学本科 University 6.5 19.4 6.5 3.2
研究生 Graduate 33.3

8/2/2019 China Labour Statistical Yearbook - 2004
http://slidepdf.com/reader/full/china-labour-statistical-yearbook-2004 116/464
1-81 2 continued
单位:%
水利、环境和 居民服务和 教育 卫生、社会 文化、体育 公共管理和
公共设施管理业
其他服务业 保障和社会 和娱乐业 社会组织
Water 福利业 Culture
Conservancy,
Public Education Public Heal- Sports PublicEnvironment and th, Social and Adminis-
and public other Securities Entertain- trantion
Utility Services & Social ment and Social
受教育程度 EducationalAttainment
Management Welfare Organizations
Total 0.5 9.2 0.5 1.1 0.9 1
不识字或 Illiterate and
识字很少 Semi-Illiterate 2.2 15.2
小学 Primary School 0.7 10.8 0.2 0.6 0.5
初中 Junior School 0.4 9.9 0.2 0.9 0.8
高中 Senoior School 0.5 8.1 0.8 1.3 1.0
大专 College 0.4 6.3 2.1 3.0 1.3 3
大学本科 University 6.5 3.7 3.7 1.9
研究生 Graduate
Male 0.5 7.9 0.3 0.8 1.0 1
不识字或 Illiterate and
识字很少 Semi-Illiterate 13.3
小学 Primary School 0.6 9.2 0.1 0.3 0.4
初中 Junior School 0.5 8.9 0.1 0.8 0.9
高中 Senoior School 0.4 6.7 0.6 0.9 1.3 3
大专 College 0.5 4.0 1.3 1.8 1.8
大学本科 University 5.4 2.7 2.7
研究生 Graduate
Female 0.5 10.3 0.7 1.4 0.7 1
不识字或 Illiterate and
识字很少 Semi-Illiterate 3.3 16.7
小学 Primary School 0.7 12.9 0.2 0.9 0.5 1
初中 Junior School 0.4 10.8 0.3 1.0 0.7
高中 Senoior School 0.6 9.2 0.9 1.7 0.7 1
大专 College 9.1 3.1 4.1 0.6
大学本科 University 6.5 9.7 3.2 3.2
研究生 Graduate

8/2/2019 China Labour Statistical Yearbook - 2004
http://slidepdf.com/reader/full/china-labour-statistical-yearbook-2004 117/464
1-82
1-82
OCCUPATION COMPOSITION OF URBAN UNEMPLOYMENT
BY AGE AND SEX
单位:% (%)
合计 单位 专业技术 办事人员 商业服务 农林牧渔 生产运输设备 其他
负责人 人员 和有关人员 人员 水利业 操作人员及
生产人员 有关人员
年龄 Total Unit Professional Clerk Business Agriculture Production, Others
Head and and Service and Transport
Age Technical Related Personnel Water Equipment
Personnel Workers Conservancy Operators
Labors and Related
Workers
Total 100.0 1.6 9.0 14.3 22.8 4.8 36.4 11.2
16-19 100.0 4.4 6.3 5.8 36.4 11.2 13.6 22.3
20-24 100.0 2.3 7.4 12.7 34.9 7.2 17.4 18.1
25-29 100.0 0.6 7.2 12.5 32.2 5.9 30.3 11.4
30-34 100.0 0.9 8.2 14.4 24.4 5.1 35.0 12.0
35-39 100.0 1.1 8.5 15.2 22.1 5.9 36.0 11.2
40-44 100.0 1.0 10.0 14.3 20.5 3.1 40.9 10.1
45-49 100.0 1.4 9.3 15.3 17.7 2.7 43.7 9.9
50-54 100.0 5.8 11.6 14.4 14.4 4.3 41.0 8.4
55-59 100.0 6.3 16.5 15.6 12.1 4.4 39.0 6.0
60-64 100.0 17.9 10.7 7.1 17.9 28.6 17.9
65+ 100.0 14.3 28.6 21.4 7.1 28.6
Male 100.0 2.4 11.4 14.7 16.6 4.8 38.0 12.1
16-19 100.0 4.5 6.3 8.1 28.8 11.7 18.0 22.5
20-24 100.0 2.3 8.8 14.5 28.0 6.7 16.8 22.8
25-29 100.0 0.7 8.8 12.7 24.7 6.2 34.8 12.2
30-34 100.0 1.0 9.6 13.5 17.8 5.2 39.3 13.5
35-39 100.0 1.7 11.3 17.2 15.7 5.2 35.5 13.4
40-44 100.0 1.6 13.1 14.6 13.5 3.3 42.4 11.6
45-49 100.0 2.1 12.5 14.7 14.1 3.3 42.5 10.9
50-54 100.0 6.5 12.1 15.1 12.7 4.3 42.2 7.1
55-59 100.0 6.5 16.7 15.4 11.8 4.2 39.5 5.960-64 100.0 20.8 12.5 8.3 16.7 25.0 16.7
65+ 100.0 18.2 27.3 18.2 36.4
Female 100.0 0.9 6.9 13.9 28.3 4.8 34.9 10.4
16-19 100.0 4.2 7.4 3.2 44.2 10.5 8.4 22.1
20-24 100.0 2.3 6.1 11.0 41.2 7.5 18.0 13.8
25-29 100.0 0.6 6.1 12.3 37.8 5.6 26.9 10.7
30-34 100.0 0.7 7.2 15.0 28.7 5.0 32.3 11.0
35-39 100.0 0.8 6.8 13.9 26.2 6.4 36.3 9.8
40-44 100.0 0.6 7.6 14.1 26.0 3.0 39.7 8.9
45-49 100.0 0.8 6.3 15.8 21.0 2.1 44.9 9.0
50-54 100.0 1.4 8.3 10.3 24.8 4.1 33.8 17.2
55-59 100.0 11.1 33.3 11.1 11.1 22.2 11.1
60-64 100.0 50.0 25.0
65+ 100.0 33.3 33.3 33.3

8/2/2019 China Labour Statistical Yearbook - 2004
http://slidepdf.com/reader/full/china-labour-statistical-yearbook-2004 118/464
1-83
1-83
OCCUPATION COMPOSITION OF URBAN UNEMPLOYMENT
BY EDUCATIONAL ATTAINMENT AND SEX
单位:% (%)
合计 单 位 专业技术 办事人员 商业服务 农林牧渔 生产运输设备 其他
负责人 人 员 和有关人员 人 员 水利业 操作人员及
生产人员 有关人员
Total Unit Professio- Clerk Business Agriculture Production, Others
Head nal and Service and Transport
and Related Personnel Water Equipment
Technical Workers Conservancy Operators
Personnel Labors and Related
受教育程度Educational
Attainment
Workers
Total 100.0 1.6 9.0 14.3 22.8 4.8 36.4 11.2
不识字或 Illiterate and
识字很少 Semi-Illiterate 100.0 8.6 6.5 24.7 14.0 26.9 19.4
小学 Primary School 100.0 0.8 5.8 9.8 17.2 12.5 39.8 14.2
初中 Junior School 100.0 1.6 6.8 11.6 23.9 5.4 39.0 11.7
高中 Senoior School 100.0 1.4 10.6 17.0 23.4 2.5 35.2 10.0
大专 College 100.0 3.9 21.8 29.4 17.8 0.7 15.9 10.5
大学本科 University 100.0 7.3 37.6 31.2 11.0 7.3 5.5
研究生 Graduate 100.0 20.0 40.0 20.0 20.0
Male 100.0 2.4 11.4 14.7 16.6 4.8 38.0 12.1
不识字或 Illiterate and
识字很少 Semi-Illiterate 100.0 15.6 6.3 15.6 6.3 37.5 18.8
小学 Primary School 100.0 1.3 7.4 10.2 12.8 12.7 40.4 15.0
初中 Junior School 100.0 2.4 9.3 11.8 17.2 5.1 41.8 12.3
高中 Senoior School 100.0 2.0 12.6 17.8 17.3 2.7 36.2 11.4
大专 College 100.0 6.6 23.3 28.0 14.0 0.5 15.6 11.9
大学本科 University 100.0 9.6 46.6 27.4 6.8 6.8 2.7
研究生 Graduate 100.0 50.0 50.0
Female 100.0 0.9 6.9 13.9 28.3 4.8 34.9 10.4
不识字或 Illiterate and
识字很少 Semi-Illiterate 100.0 4.8 6.5 29.0 17.7 22.6 19.4
小学 Primary School 100.0 0.2 3.9 9.2 22.5 12.2 38.8 13.1初中 Junior School 100.0 0.9 4.7 11.4 29.7 5.6 36.6 11.1
高中 Senoior School 100.0 0.9 8.9 16.4 28.3 2.3 34.3 8.8
大专 College 100.0 0.6 20.4 31.0 21.9 0.9 16.3 8.8
大学本科 University 100.0 3.0 21.2 39.4 18.2 9.1 9.1
研究生 Graduate 100.0 33.3 66.7

8/2/2019 China Labour Statistical Yearbook - 2004
http://slidepdf.com/reader/full/china-labour-statistical-yearbook-2004 119/464
1-84
1-84
WEEKLY WORKING HOURS IN URBAN AREA
单位:小时/周 (hours/per week)
分 组 Group 2001 年 10 月 2002 年 11 月 2003 年 11 月
Total 44.9 45.2 45.4
By Age
16-19 46.9 47.7 48.4
20-24 45.5 46.3 46.2
25-29 45.2 45.7 45.7
30-34 45.2 45.7 45.7
35-39 45.1 45.4 45.7
40-44 44.8 44.8 45.1
45-49 44.5 44.5 44.9
50-54 43.7 44.0 44.5
55-59 43.3 43.4 44.2
60-64 43.1 41.6 42.7
65+ 40.5 38.7 40.7
By Employment Status
城镇单位从业人员 Urban Units Employment 41.9 42.2 42.1
乡镇企业从业人员 Township Enterprises Employment 44.7 48.3 47.1
私营个体雇员 PrivateSector Employee 49.5 49.5 49.3
私营个体雇主 Private Employer 51.3 51.1 50.6自营劳动者 Self-Employed 50.5 50.2 50.5
其他 Others 44.8 44.2 44.8
By Educational Attaiment
不识字或识字很少 Illiterate and Semi-Illiterate 45.0 43.8 44.9
小学 Primary School 46.3 46.0 47.2
初中 Junior School 46.5 47.0 47.4
高中 Senoior School 44.0 44.5 44.4
大专 College 41.6 41.6 41.6
大学本科 University 41.4 40.8 41.1
研究生 Graduate 40.9 40.6 40.9
By Residence Card
本省非农 Non-Agriculture in This Place 44.0 44.1 44.0
本省农业 Agriculture in This Place 46.2 45.8 47.3
外省非农 Non-Agriculture in Other Place 48.7 48.1 48.5
外省农业 Agriculture in Other Place 51.2 53.8 54.8
其他 Other 45.6 44.1 45.9

8/2/2019 China Labour Statistical Yearbook - 2004
http://slidepdf.com/reader/full/china-labour-statistical-yearbook-2004 120/464
1-84 1 continued
单位:小时/周 (hours/per week)
分组 Group 2001 年 10 月 2002 年 11 月 2003 年 11 月
By Sector
农、林、牧、渔业 Farming, Forestry, Animal Husbandry 43.2 43.0 44.1
and Fishing
采 矿 业 Mining and Quarrying 44.8 44.4 44.1
制 造 业 Manufacturing 44.7 46.0 46.4
电力、燃气及水的生产和供应业 Productionand Supply of Electricity, 41.6 42.1 42.2
Gas and Water
建 筑 业 Construction 46.5 48.4 48.4
交通运输、仓储和邮政业 Transport, Storage, Post and 45.1 46.0 46.1
Telecommunication Services
信息传输、计算机服务和软件业 Data Transmission, Computer Service 43.0 43.1
and Software
批发和零售业 Wholesale and Retail Trade 49.5 49.4 49.2
住宿和餐饮业 Hotel and Catering Services 49.8 50.1
金融业 Banking 41.1 40.9 41.1
房地产业 Real Estate 41.8 42.0 42.2
租赁和商务服务业 Leasing and Business Service 45.9 46.3
科学研究、技术服务和地质勘 Scientific Research, Technical 42.3 41.4 42.2
Services and Geological Prospecting
水利、环境和公共设施管理业 Water Conservancy, Environment and 42.1 41.6
Public Utility Management
居民服务和其他服务业 Personal and Other Services 47.2 47.6 47.5
教育 Education 41.2 41.1 41.0 卫生、社会保障和社会福利业 Public Health, Social Securities 42.0 42.3 42.0
and Social Welfare
文化、体育和娱乐业 Cultrue, Sports and Entertainment 42.8 43.2
公共管理和社会组织 Public Adminis tration and Social 40.9 40.8 40.9
Organizations
国际组织 International Organizations 38.4 34.6
By Occupation
单位负责人 Unit Head 43.9 43.9 44.3
专业技术人员 Professional and Technical Personnel 42.5 42.7 42.8
办事人员和有关人员 Clerk and Related Workers 41.6 41.8 41.8
商业服务人员 Business Service Personnel 49.4 49.4 49.4
农林牧渔水利业生产人员 Agrecultrre and Water Conservancy Lab 43.3 43.1 44.2
生产、运输设备操作人员及有 Production, Transport Equipment 45.8 47.2 47.5
Operators and Related Workers
其他 Others 46.4 46.7 46.7
注 1:因自 2002 年开始使用 GB2002 行业分类标准,2002 年以前执行 GB1994 行业分类标准,故 2001 年数字仅列出可基本对应的相近行业。
Note1: Data in 2001(acoording to GB1994 Industry Classification) are the similar series in GB2002
(GB2002 Industry Classification has been used s ince 2003).

8/2/2019 China Labour Statistical Yearbook - 2004
http://slidepdf.com/reader/full/china-labour-statistical-yearbook-2004 121/464
1-85
1-85
MALE WEEKLY WORKING HOURS IN URBAN AREA
单位:小时/周 (hours/per week)
分 组 Group 2001 年 10 月 2002 年 11 月 2003 年 11 月
Total 45.2 45.6 45.8
By Age
16-19 46.9 47.1 48.3
20-24 45.8 46.8 46.5
25-29 45.7 46.3 46.3
30-34 45.6 46.3 46.2
35-39 45.5 45.8 46.2
40-44 45.1 45.3 45.545-49 44.8 44.9 45.3
50-54 44.1 44.5 44.9
55-59 43.4 43.7 44.5
60-64 43.9 42.7 43.8
65+ 41.0 40.0 41.3
By Employment Status
城镇单位从业人员 Urban Units Employment 42.1 42.3 42.3
乡镇企业从业人员 Township Enterprises Employment 45.0 48.4 47.2
私营个体雇员 PrivateSector Employee 49.8 50.2 49.7
私营个体雇主 Private Employer 51.5 51.2 50.8
自营劳动者 Self-Employed 50.6 50.4 50.6
其他 Others 45.1 44.4 45.2
By Educational Attaiment
不识字或识字很少 Illiterate and Semi-Illiterate 44.5 44.1 45.0
小学 Primary School 47.0 46.7 48.0
初中 Junior School 46.9 47.4 47.8
高中 Senoior School 44.4 44.9 44.8
大专 College 41.7 41.8 41.7
大学本科 University 41.5 40.9 41.3
研究生 Graduate 40.7 40.8 41.2
By Residence Card
本省非农 Non-Agriculture in This Place 44.1 44.3 44.1
本省农业 Agriculture in This Place 47.1 46.7 48.2
外省非农 Non-Agriculture in Other Place 48.5 48.3 49.2
外省农业 Agriculture in Other Place 51.1 53.7 55.7
其他 Other 45.4 44.9 46.6

8/2/2019 China Labour Statistical Yearbook - 2004
http://slidepdf.com/reader/full/china-labour-statistical-yearbook-2004 122/464
1-86
1-86
FEMALE WEEKLY WORKING HOURS IN URBAN AREA
单位:小时/周 (hours/per week)
分组 Group Group 2001 年 10 月 2002 年 11 月 2003 年 11 月
Total 44.5 44.7 44.9
By Age
16-19 46.8 48.2 48.5
20-24 45.1 45.8 45.8
25-29 44.6 45.0 44.9
30-34 44.7 45.0 45.2
35-39 44.6 44.9 45.1
40-44 44.3 44.2 44.6
45-49 43.9 43.9 44.3
50-54 42.8 43.2 43.7
55-59 42.9 42.6 43.5
60-64 41.4 39.4 40.2
65+ 39.5 36.1 39.1
By Employment Status
城镇单位从业人员 Urban Units Employment 41.7 42.1 41.8
乡镇企业从业人员 Township Enterprises Employment 44.2 48.2 46.8
私营个体雇员 PrivateSector Employee 49.2 48.7 48.7
私营个体雇主 Private Employer 51.1 51.0 50.3
自营劳动者 Self-Employed 50.3 49.8 50.3
其他 Others 44.4 43.9 44.1
By Educational Attaiment
不识字或识字很少 Illiterate and Semi-Illiterate 45.3 43.7 44.8
小学 Primary School 45.5 45.4 46.2
初中 Junior School 45.9 46.4 46.8
高中 Senoior School 43.5 43.9 44.0
大专 College 41.4 41.3 41.3
大学本科 University 41.1 40.7 40.8
研究生 Graduate 41.4 40.0 40.2
By Residence Card
本省非农 Non-Agriculture in This Place 43.8 43.9 43.8
本省农业 Agriculture in This Place 45.1 44.8 46.2
外省非农 Non-Agriculture in Other Place 48.9 47.8 47.5
外省农业 Agriculture in Other Place 51.4 53.9 53.4
其他 Other 45.9 43.2 45.0

8/2/2019 China Labour Statistical Yearbook - 2004
http://slidepdf.com/reader/full/china-labour-statistical-yearbook-2004 123/464
1-86 1 continued
单位:小时/周 (hours/per week)
分组 Group Group 2001 年 10 月 2002 年 11 月 2003 年 11 月
By Sector农、林、牧、渔业 Farming, Forestry, Animal Husbandry 41.9 41.9 42.8
and Fishing
采 矿 业 Mining and Quarrying 42.9 42.7 42.9
制 造 业 Manufacturing 44.7 46.5 46.6
电力、燃气及水的生产和供应业 Productionand Supply of Electricity, 41.0 41.3 41.6
Gas and Water
建 筑 业 Construction 44.0 44.1 45.2
交通运输、仓储和邮政业 Transport, Storage, Post and 42.7 43.2 43.5
Telecommunication Services
信息传输、计算机服务和软件业 Data Transmission, Computer Service 42.5 42.8
and Software
批发和零售业 Wholesale and Retail Trade 49.3 49.1 48.9
住宿和餐饮业 Hotel and Catering Services 49.2 49.6
金融业 Banking 41.1 40.9 40.9
房地产业 Real Estate 41.5 41.8 41.8
租赁和商务服务业 Leasing and Business Service 45.8 46.3
科学研究、技术服务和地质勘查业 Scientific Research, Technical 41.6 40.8 41.7
Services and Geological Prospecting
水利、环境和公共设施管理业 Water Conservancy, Environment and 42.2 41.3
Public Utility Management
居民服务和其他服务业 Personal and Other Services 46.6 46.9 47.1
教育 Education 41.0 41.1 40.8
卫生、社会保障和社会福利业 Public Health, Social Securities 41.8 42.0 41.7
and Social Welfare
文化、体育和娱乐业 Cultrue, Sports and Entertainment 42.3 43.1
公共管理和社会组织 Public Administration and Social 40.6 40.5 40.5
Organizations
国际组织 International Organizations 39.4 34.6
By Occupation
单位负责人 Unit Head 44.9 44.3 44.8
专业技术人员 Professional and Technical Personnel 41.7 41.9 41.8
办事人员和有关人员 Clerk and Related Workers 41.5 41.6 41.6
商业服务人员 Business Service Personnel 48.8 48.8 48.9
农林牧渔水利业生产人员 Agrecultrre and Water Conservancy Labor 41.9 41.9 42.8
生产、运输设备操作人员及有关人员 Production, Transport Equipment 45.2 46.8 47.1
Operators and Related Workers
其他 Others 45.6 45.8 46.2
注 1:因自 2002 年开始使用 GB2002 行业分类标准,2002 年以前执行 GB1994 行业分类标准,故 2001 年数字仅列出可基本对应的相近行业。
Note1: Data in 2001(acoording to GB1994 Industry Classification) are the similar series in GB2002
(GB2002 Industry Classification has been used since 2003).
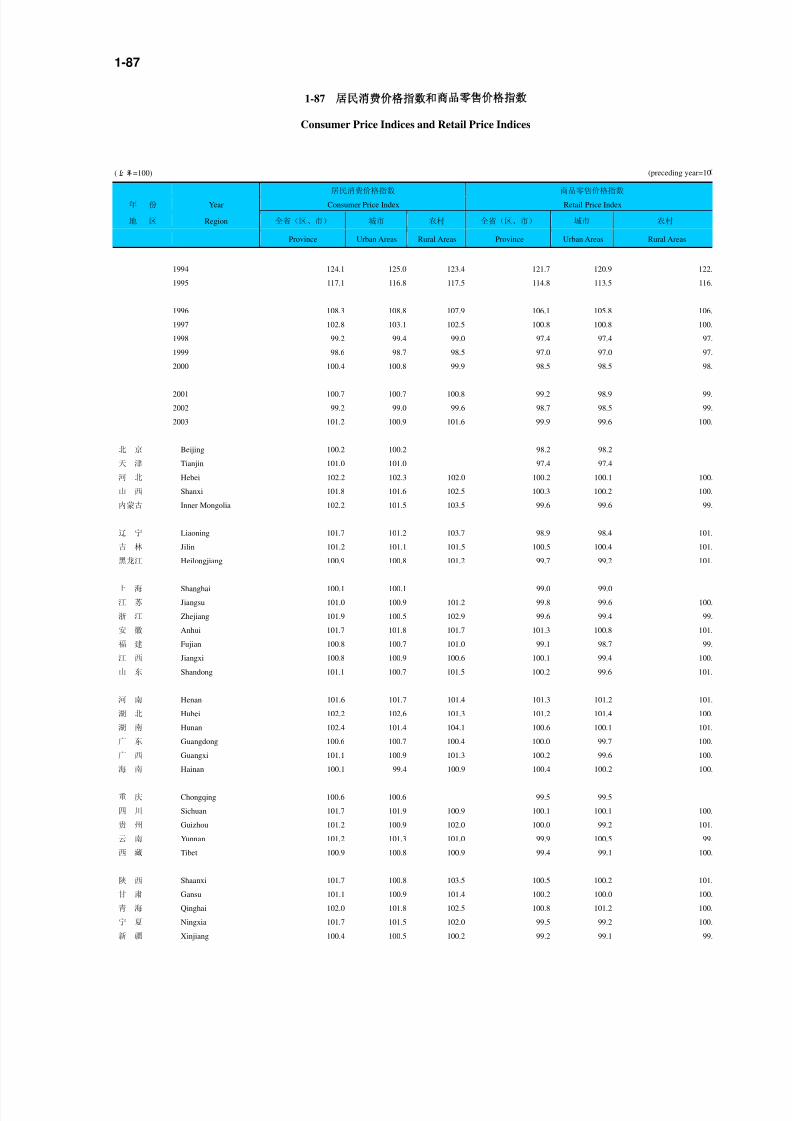
8/2/2019 China Labour Statistical Yearbook - 2004
http://slidepdf.com/reader/full/china-labour-statistical-yearbook-2004 124/464
1-87
1-87
Consumer Price Indices and Retail Price Indices
(上年=100) (preceding year=10
居民消费价格指数 商品零售价格指数
年 份 Year Consumer Price Index Retail Price Index
地 区 Region 全省(区、市) 城市 农村 全省(区、市) 城市 农村
Province Urban Areas Rural Areas Province Urban Areas Rural Areas
1994 124.1 125.0 123.4 121.7 120.9 122.
1995 117.1 116.8 117.5 114.8 113.5 116.
1996 108.3 108.8 107.9 106.1 105.8 106.
1997 102.8 103.1 102.5 100.8 100.8 100.
1998 99.2 99.4 99.0 97.4 97.4 97.
1999 98.6 98.7 98.5 97.0 97.0 97.
2000 100.4 100.8 99.9 98.5 98.5 98.
2001 100.7 100.7 100.8 99.2 98.9 99.
2002 99.2 99.0 99.6 98.7 98.5 99.
2003 101.2 100.9 101.6 99.9 99.6 100.
北 京 Beijing 100.2 100.2 98.2 98.2
天 津 Tianjin 101.0 101.0 97.4 97.4
河 北 Hebei 102.2 102.3 102.0 100.2 100.1 100.
山 西 Shanxi 101.8 101.6 102.5 100.3 100.2 100.
内蒙古 Inner Mongolia 102.2 101.5 103.5 99.6 99.6 99.
辽 宁 Liaoning 101.7 101.2 103.7 98.9 98.4 101.
吉 林 Jilin 101.2 101.1 101.5 100.5 100.4 101.
黑龙江 Heilongjiang 100.9 100.8 101.2 99.7 99.2 101.
上 海 Shanghai 100.1 100.1 99.0 99.0
江 苏 Jiangsu 101.0 100.9 101.2 99.8 99.6 100.
浙 江 Zhejiang 101.9 100.5 102.9 99.6 99.4 99.
安 徽 Anhui 101.7 101.8 101.7 101.3 100.8 101.
福 建 Fujian 100.8 100.7 101.0 99.1 98.7 99.
江 西 Jiangxi 100.8 100.9 100.6 100.1 99.4 100.
山 东 Shandong 101.1 100.7 101.5 100.2 99.6 101.
河 南 Henan 101.6 101.7 101.4 101.3 101.2 101.
湖 北 Hubei 102.2 102.6 101.3 101.2 101.4 100.
湖 南 Hunan 102.4 101.4 104.1 100.6 100.1 101.
广 东 Guangdong 100.6 100.7 100.4 100.0 99.7 100.
广 西 Guangxi 101.1 100.9 101.3 100.2 99.6 100.
海 南 Hainan 100.1 99.4 100.9 100.4 100.2 100.
重 庆 Chongqing 100.6 100.6 99.5 99.5
四 川 Sichuan 101.7 101.9 100.9 100.1 100.1 100.
贵 州 Guizhou 101.2 100.9 102.0 100.0 99.2 101.
云 南 Yunnan 101.2 101.3 101.0 99.9 100.5 99.
西 藏 Tibet 100.9 100.8 100.9 99.4 99.1 100.
陕 西 Shaanxi 101.7 100.8 103.5 100.5 100.2 101.
甘 肃 Gansu 101.1 100.9 101.4 100.2 100.0 100.
青 海 Qinghai 102.0 101.8 102.5 100.8 101.2 100.
宁 夏 Ningxia 101.7 101.5 102.0 99.5 99.2 100.
新 疆 Xinjiang 100.4 100.5 100.2 99.2 99.1 99.

8/2/2019 China Labour Statistical Yearbook - 2004
http://slidepdf.com/reader/full/china-labour-statistical-yearbook-2004 125/464
1-88 (2003)
1-88 (2003)
Retail Price Indices by Category (2003)
(上年=100) (preceding year=100)
全国 城市 农村
National Urban Rural项 目 Item
Indices Indices Indices
商品零售价格总指数 Retail Price Index 99.9 99.6 100.5
食品类 Food 103.4 103.2 103.7
粮食 Grain 102.2 102.0 102.6
油脂 Oil or Fat 112.5 111.6 113.5
肉禽及其制品 Meat, Poultry and Their Products 103.0 102.5 103.9
蛋 Eggs 98.5 98.6 98.3
水产品 Aquatic Products 100.3 100.8 99.2
菜 Vegetables 116.3 116.4 116.1
调味品 Flavoring 100.3 100.0 100.7
食糖 Sugar 91.1 93.2 88.9
糖果 Candy 103.1 103.9 102.3
干鲜瓜果 Dried and Fresh, Melon and Fruits 102.2 102.4 101.8
糕点 Cake 99.8 99.8 99.8
奶及奶制品 Milk and Its Products 99.7 99.4 100.7
在外用膳食品 Outward Dinner Food 100.0 100.0 100.2
主食 Staple Food 100.7 100.7 100.7
炒菜 Fried Dishes 99.7 99.7 99.6
地方小吃 Local Snack 100.3 100.1 100.8
其它食品
Other Foods 99.2 99.3 99.1 饮料、烟酒 Beverages, Tobacco and Liquor 99.9 99.8 99.9
茶及饮料 Tea and Beverages 99.3 99.5 99.0
烟草 Tobacco 99.8 99.6 100.1
酒 Liquor 100.3 100.3 100.2
服装、鞋帽 Garments, Shoes and Hats 97.5 97.0 98.5
服装 Garments 97.5 96.9 98.6
鞋袜帽 Footgear and Hats 97.4 96.8 98.5
纺织品 Textiles 99.3 98.9 99.8
棉布 Cotton Cloth 99.9 98.7 101.1
棉花化纤混纺布 Blend Cloth 99.6 98.9 100.1
化纤布 Chemical Fiber Cloth 100.2 99.6 100.7
毛织品 Wool 98.5 98.8 98.0
丝织品 Silk 99.2 99.1 99.3
家用电器及音像器材 Household Appliances, Music and Video Equipments 94.2 93.7 95.2
文化办公用品 Cultural and Office Appliances 95.8 95.3 97.0
日用品 Articles for Daily Use 98.5 98.2 98.9
日用百货 General Merchandise for Daily Use 98.0 97.7 98.7
日用杂品 Grocery for Daily Use 99.7 100.0 99.3
体育娱乐用品 Sports and Recreation Articles 98.1 97.6 99.1
交通、通信用品 Transportation and Communication Appliances 91.1 90.8 91.8
家具 Fornitures 97.8 97.6 98.4
化妆品 Cosmetics 98.9 98.8 99.3
金银珠宝 Gold, Silver and Jewelry 108.6 108.9 108.0
中西药品及医疗保健用品 Traditional Chinese and Western Medicines and Health 98.4 98.2 98.8
Care Articles
医疗器具及用品 Medical Apparatus and Article 100.6 100.5 100.7
中药材及中成药 Tradtional Chinese Medicinal Materials and Medicines 104.4 104.0 105.2
西药 Western Medicines 94.3 94.2 94.4
书报杂志及电子出版物 Books, Newspapers, Magazines and Electronic Publications 100.3 100.4 100.2
燃料 Fuels 109.3 109.2 109.5
建筑材料及五金电料 Building Materials and Hardware 99.7 99.4 100.1
建筑装璜材料 Building Decoration Materials 99.7 99.4 100.1
五金电料 Hardware 99.7 99.5 100.0

8/2/2019 China Labour Statistical Yearbook - 2004
http://slidepdf.com/reader/full/china-labour-statistical-yearbook-2004 126/464
1-89
1-89
Retail Price Indices by Category of Commodities
(上年=100) (preceding year=100)
总 指 数 食 品
# 粮 食 # 油 脂 #肉禽及 # 蛋 # 水产品 # 菜 #干 鲜
年 份 Year 其制品
瓜 果
General Food Grain Oil Meat, Eggs Aquatic Vegetables Fresh
地 区 Region Index or Fat Poultry Products and
and Their Dried
Products Fruits
1994 121.7 135.2 148.7 161.4 120.7
1995 114.8 124.7 134.4 116.3 114.2
1996 106.1 107.7 107.5 92.1 105.6
1997 100.8 99.8 92.1 101.6 101.2
1998 97.4 96.8 96.9 100.7 94.2
1999 97.0 95.8 96.4 94.4 93.6
2000 98.5 97.5 90.1 86.2 102.7
2001 99.2 100.6 101.5 89.3 96.3
2002 98.7 99.9 98.6 100.1 96.2
2003 99.9 103.4 102.2 112.5 103.0 98.5 100.3 116.3 102.2
北 京 Beijing 98.2 103.0 99.1 114.1 100.8 97.0 102.6 137.1 108.2
天 津 Tianjin 97.4 103.7 102.1 111.5 102.0 102.1 111.0 123.7 100.3
河 北 Hebei 100.2 103.9 102.4 113.8 104.3 96.2 99.3 120.4 96.7
山 西 Shanxi 100.3 105.0 101.9 111.1 106.6 98.3 100.0 128.8 95.8
内蒙古 Inner Mongolia 99.6 102.5 100.2 104.2 101.8 95.8 96.2 118.3 105.9
辽 宁 Liaoning 98.9 104.0 98.2 123.0 102.0 96.1 101.0 122.2 102.6
吉 林 Jilin 100.5 103.4 99.1 111.7 102.2 95.1 100.5 119.3 97.4
黑龙江 Heilongjiang 99.7 103.6 99.5 115.0 101.6 96.9 96.4 124.5 100.0
上 海 Shanghai 99.0 101.5 100.5 106.8 101.7 101.0 103.9 101.5 97.6
江 苏 Jiangsu 99.8 103.5 102.0 112.7 103.9 99.0 98.9 117.0 102.6
浙 江 Zhejiang 99.6 102.7 102.4 111.7 105.5 99.1 99.4 109.6 103.2
安 徽 Anhui 101.3 106.0 100.5 115.3 107.6 100.8 99.4 129.3 102.3
福 建 Fujian 99.1 101.9 106.2 109.2 101.5 96.7 100.6 101.3 109.2
江 西 Jiangxi 100.1 103.5 104.0 112.5 105.0 99.8 97.1 111.4 100.3
山 东 Shandong 100.2 105.6 105.6 115.5 106.1 100.4 101.0 125.9 95.8
河 南 Henan 101.3 105.2 104.8 118.6 105.0 97.6 97.5 122.1 99.8
湖 北 Hubei 101.2 104.7 106.9 113.0 105.5 101.2 98.3 116.1 99.8
湖 南 Hunan 100.6 104.2 102.2 110.5 106.0 99.8 97.9 117.2 108.2
广 东 Guangdong 100.0 102.0 101.1 108.9 100.6 99.4 100.8 108.2 105.9
广 西 Guangxi 100.2 103.1 107.1 111.1 102.2 99.0 98.0 109.8 107.2
海 南 Hainan 100.4 102.9 102.2 103.0 103.0 98.9 101.8 108.4 111.2
重 庆 Chongqing 99.5 104.4 100.5 114.2 99.2 98.3 104.6 120.7 122.6
四 川 Sichuan 100.1 102.7 101.2 107.9 100.4 97.1 97.4 124.0 103.5
贵 州 Guizhou 100.0 103.5 103.9 108.2 102.6 98.9 97.0 113.4 112.1
云 南 Yunnan 99.9 101.9 100.7 108.2 100.3 95.2 98.9 104.5 103.3
西 藏 Tibet 99.4 101.9 98.8 97.8 103.3 102.1 97.8 107.2 103.8
陕 西 Shaanxi 100.5 105.2 104.9 110.3 104.5 98.0 100.4 129.9 99.1
甘 肃 Gansu 100.2 102.5 101.2 108.1 100.1 96.5 98.7 117.2 97.0
青 海 Qinghai 100.8 104.0 101.7 112.5 103.6 98.1 100.5 120.3 106.6
宁 夏 Ningxia 99.5 104.3 101.1 106.1 102.2 97.6 99.1 122.8 109.8
新 疆 Xinjiang 99.2 99.9 97.1 119.1 96.5 96.2 92.8 103.2 101.3

8/2/2019 China Labour Statistical Yearbook - 2004
http://slidepdf.com/reader/full/china-labour-statistical-yearbook-2004 127/464
1-89 1 continued
(上年=100) (preceding year=100)
饮料烟酒 服装鞋帽 纺 织 品 家用电器及 文化办公 日 用 品 体育娱乐 交 通、
音像器材 用 品 用 品 通信用品
年 份 Year Beverages, Clothing, Textiles Household Cultural Articles Sports and Transportation
Tobacco Shoes and Appliances, and Office for Recreation and
地 区 Region and Liquor Hats Music and Appliances Daily Use Articles Communication
Video Appliances
Equipments
1994 111.3 119.6 114.7 113.9
1995 107.8 116.8 115.4 109.7
1996 105.1 108.5 106.4 105.3
1997 101.2 103.5 101.9 102.3
1998 98.8 99.3 99.1 99.0
1999 97.3 97.3 98.0 97.9
2000 98.0 99.2 98.6 98.1
2001 99.5 98.9 99.1 98.3
2002 99.9 97.9 99.4 98.7
2003 99.9 97.5 99.3 94.2 95.8 98.5 98.1 91.1
北 京 Beijing 100.7 97.1 99.5 94.6 93.0 93.4 98.7 92.7
天 津 Tianjin 98.8 87.4 95.3 90.9 98.1 96.8 99.2 90.0
河 北 Hebei 100.2 97.8 99.0 94.0 98.0 98.6 98.0 90.9
山 西 Shanxi 100.4 97.6 99.7 94.7 96.2 98.0 98.5 90.2
内蒙古 Inner Mongolia 99.6 98.9 96.9 97.0 98.7 98.7 100.0 92.3
辽 宁 Liaoning 98.4 95.3 99.9 90.1 95.7 96.0 94.4 87.8
吉 林 Jilin 100.3 99.2 100.4 94.7 97.9 99.4 99.4 89.3
黑龙江 Heilongjiang 99.2 98.8 98.5 93.0 96.3 98.2 99.2 88.0
上 海 Shanghai 99.5 96.7 99.8 95.8 93.7 99.1 97.4 91.2
江 苏 Jiangsu 99.7 99.5 99.6 93.2 93.6 98.7 96.4 87.3
浙 江 Zhejiang 100.6 96.6 97.6 94.1 95.7 98.3 98.3 92.4
安 徽 Anhui 99.7 98.3 99.0 95.0 95.5 99.5 100.4 92.9
福 建 Fujian 100.5 96.2 97.2 92.9 94.5 98.8 98.5 90.4
江 西 Jiangxi 99.3 96.8 99.7 94.6 97.3 98.9 98.4 90.9
山 东 Shandong 99.8 96.8 99.6 94.9 94.4 98.7 98.2 91.6
河 南 Henan 99.8 98.2 100.0 95.7 97.3 98.1 99.3 93.4
湖 北 Hubei 99.5 99.0 100.9 95.4 99.3 99.7 97.9 89.3 湖 南 Hunan 99.5 99.4 99.3 94.6 98.0 99.4 98.9 93.4
广 东 Guangdong 100.6 97.1 99.0 94.0 94.8 99.1 98.3 90.2
广 西 Guangxi 99.6 99.6 98.9 91.8 93.4 98.1 99.0 88.9
海 南 Hainan 99.4 95.7 99.4 97.4 99.1 99.0 99.8 92.8
重 庆 Chongqing 98.6 94.0 100.5 93.5 98.2 94.9 98.9 90.8
四 川 Sichuan 100.3 98.6 100.0 95.2 95.0 99.6 98.6 94.1
贵 州 Guizhou 99.9 98.8 94.6 95.4 99.1 98.9 98.6 92.4
云 南 Yunnan 98.8 96.6 96.5 95.7 97.2 100.4 98.0 93.7
西 藏 Tibet 103.8 102.0 101.8 98.1 97.8 98.6 95.8 89.7
陕 西 Shaanxi 99.8 99.8 100.8 93.0 98.5 98.3 97.1 92.4
甘 肃 Gansu 100.6 98.1 100.4 96.7 97.6 99.1 98.8 89.8
青 海 Qinghai 99.2 102.0 99.0 94.6 93.6 99.6 97.4 94.7
宁 夏 Ningxia 100.2 99.5 94.4 91.3 94.3 98.0 97.5 89.4
新 疆 Xinjiang 99.1 99.7 99.5 97.8 98.9 99.3 100.0 94.9

8/2/2019 China Labour Statistical Yearbook - 2004
http://slidepdf.com/reader/full/china-labour-statistical-yearbook-2004 128/464
1-89 2 continued
(上年=100) (preceding year=100)
家 具 化妆品 金银珠宝 中西药品及医 书报杂志及 燃料 建筑材料及
年 份 Year 疗保健用品 电子出版物 五金电料
地 区 Region Traditional Books, Fuels Building
Fornitures Cosmetics Gold, Chinese and Newspapers, Materials
Silver Western Magazines and
and Medicines and Hardware
Jewelry and Health Electronic
Care Articles Publications
1994 116.4 115.1
1995 109.9 107.4
1996 105.0 105.0
1997 102.3 107.3
1998 100.5 96.1
1999 99.6 100.4
2000 98.9 117.7
2001 98.8 102.4
2002 98.4 102.0
2003 97.8 98.9 108.6 98.4 100.3 109.3 99.7
北 京 Beijing 97.5 98.6 108.6 99.9 97.2 109.9 94.2
天 津 Tianjin 99.2 99.2 115.5 90.1 99.5 109.9 99.1
河 北 Hebei 98.6 100.6 109.7 98.6 101.6 108.6 99.7
山 西 Shanxi 99.4 96.7 107.5 97.1 103.3 114.8 98.8
内蒙古 Inner Mongolia 99.3 98.9 108.6 97.5 101.2 104.8 98.2
辽 宁 Liaoning 94.8 96.9 108.8 98.6 99.0 108.3 94.9
吉 林 Jilin 95.9 98.2 112.8 99.8 101.4 106.7 98.6
黑龙江 Heilongjiang 97.3 97.3 107.6 94.7 100.1 106.2 99.6
上 海 Shanghai 99.5 100.4 106.5 98.3 98.3 108.6 100.8
江 苏 Jiangsu 98.2 99.4 112.5 100.8 99.7 110.0 99.3
浙 江 Zhejiang 97.1 99.2 109.3 97.4 99.8 108.8 100.6
安 徽 Anhui 97.6 99.0 107.1 98.9 102.6 109.3 99.4
福 建 Fujian 98.8 97.5 103.8 98.3 103.3 109.6 99.9
江 西 Jiangxi 97.9 98.2 108.8 94.4 101.1 108.7 101.5
山 东 Shandong 96.6 98.2 104.9 99.1 101.0 108.9 99.2
河 南 Henan 97.8 99.6 109.3 104.0 100.3 108.9 100.4 湖 北 Hubei 99.4 99.0 110.0 99.4 101.6 108.6 101.4
湖 南 Hunan 98.1 99.9 110.0 94.0 99.5 109.2 100.9
广 东 Guangdong 98.7 99.6 108.9 100.4 100.4 113.1 101.3
广 西 Guangxi 99.1 98.9 105.8 101.5 99.6 112.5 100.1
海 南 Hainan 97.9 96.5 107.8 98.1 99.4 109.5 100.6
重 庆 Chongqing 98.2 97.1 110.5 97.8 100.2 105.3 100.1
四 川 Sichuan 99.0 99.3 108.3 101.2 102.2 104.3 99.2
贵 州 Guizhou 95.9 101.0 106.4 98.0 101.3 107.6 98.6
云 南 Yunnan 99.9 100.2 108.4 98.0 98.4 108.3 99.9
西 藏 Tibet 96.6 96.7 98.5 99.7 99.6 95.0 100.0
陕 西 Shaanxi 93.9 99.7 106.8 95.7 97.3 109.9 99.9
甘 肃 Gansu 97.5 99.7 106.1 102.0 99.3 107.2 98.0
青 海 Qinghai 98.0 100.0 101.5 97.3 100.2 107.6 97.4
宁 夏 Ningxia 92.6 100.0 111.6 98.2 100.9 106.3 97.8
新 疆 Xinjiang 98.0 99.7 104.4 93.7 99.4 105.7 97.6

8/2/2019 China Labour Statistical Yearbook - 2004
http://slidepdf.com/reader/full/china-labour-statistical-yearbook-2004 129/464
1-90 (2003 )
1-90 (2003 )
Consumer Price Indices by Category (2003)
(上年=100) (preceding year=100)
全国 城市 农村
National Urban Rural项 目 Item
Indices Indices Indices
居民消费价格指数 Consumer Price Index 101.2 100.9 101.6
食品 Food 103.4 103.4 103.4
粮食 Grain 102.3 102.3 102.2
#大米 Rice 103.1 103.2 102.9
面粉 Flour 101.8 101.6 102.0
淀粉及薯类 Starches and Tubers 100.6 100.4 100.9
干豆类及豆制品 Bean and Its Products 106.5 106.3 106.7
油脂 Oil or Fat 112.6 112.0 113.4 肉禽及其制品 Meal, Poultry and Their Products 103.3 102.8 104.2
蛋 Eggs 98.6 98.3 99.0
水产品 Aquatic Products 100.3 100.5 99.9
菜 Vegetables 117.7 119.2 113.4
#鲜菜 Fresh Vegetables 120.5 121.1 118.0
调味品 Flavoring 100.1 99.5 100.8
糖 Carbohydrate 97.5 98.9 95.5
茶及饮料 Tea and Beverages 99.2 99.2 98.9
茶 Tea 99.7 99.5 99.9
饮料 Beverages 98.9 99.1 98.2
干鲜瓜果 Dried and Fresh Melons and Fruits 103.0 102.6 104.2
#鲜果 Fresh Fruits 101.8 101.6 102.5
糕点饼干面包 Cake, Biscuit and Bread 99.3 99.2 99.6
奶及奶制品 Milk and Its Products 99.2 99.2 99.0
在外用膳食品 Outward Dinner 100.1 100.1 100.2
其它食品及加工服务费 Other Foods and Manufacturing Services 99.1 99.0 99.2
烟酒及用品 Tobacco, Liquor and Articles 99.8 99.8 99.9
烟草 Tobacco 99.8 99.7 99.9
酒 Liquor 100.1 100.2 100.1
吸烟、饮酒用品 Articles for Smoking and Drinking 99.3 99.2 99.4
衣着 Clothing 97.8 97.4 98.6
服装 Garments 97.6 97.3 98.5
衣着材料 Clothing Material 99.2 98.7 99.8
鞋袜帽 Footgear and Hats 97.7 97.4 98.4
衣着加工服务费 Clothing Manufacturing Services 100.1 99.9 100.8
家庭设备用品及服务 Household Facilities, Articles and Services 97.4 97.0 98.3
耐用消费品 Durable Consumer Goods 95.8 95.3 97.1
家具 Furniture 97.9 97.5 98.5
家庭设备 Household Facilities 94.6 94.3 95.8
1-90 continued
(上年=100) (preceding year=100)
全国 城市 农村
National Urban Rural项 目 Item
Indices Indices Indices
室内装饰品 Interior Decorations 98.8 98.6 99.3
床上用品 Bed Articles 98.4 97.9 99.5
家庭日用杂品 Daily Use Household Articles 98.3 98.0 98.7
家庭服务及 Other Household Service 101.1 101.1 101.1
加工维修服务费 and Manufacturing Upkeep
医疗保健和个人用品 Health Cares & Personal Articles 100.9 99.8 102.5
医疗保健 Medical Appliances and Articles 101.2 99.8 103.5

8/2/2019 China Labour Statistical Yearbook - 2004
http://slidepdf.com/reader/full/china-labour-statistical-yearbook-2004 130/464
医疗器具及用品 Medical Instrument and Articles 101.0 100.8 101.2
中药材及中成药 Traditional Chinese Medicine 105.0 104.0 107.4
西药 Western Medicine 94.5 94.1 95.2
保健器具及用品 Health Care Appliances and Articles 98.2 98.2 98.2
医疗保健服务 Health Care Services 108.9 107.6 110.0
个人用品及服务 Personal Articles and Services 100.2 100.0 100.4
化妆美容用品 Cosmetic 99.5 99.7 98.9
卫生用品 Sanitation Article 97.1 96.3 98.4
个人饰品 Personal Decorations 102.9 104.5 101.2
个人服务 Personal Service 100.8 100.2 101.2
交通和通信 Transportation and Communication 97.8 97.4 98.6
交通 Transportation 99.5 99.6 99.4
交通工具 Transportation Facility 95.9 95.5 96.2
车用燃料及零配件 Fuels and Parts 108.3 108.8 107.4
车辆使用及维修费 Using and Upkeeping Fare 98.9 99.5 97.8
市内公共交通费 Incity Traffic Fare 100.6 100.6 100.6
城市间交通费 Intercity Traffic Fare 101.4 100.2 102.6
通信 Telecommunication 96.1 95.7 97.4
通信工具 Telecommunication Facility 82.1 79.8 87.6
通信服务 Telecommunication Service 99.4 99.1 100.1
娱乐教育文化 Recreation, Education and Culture Articles 101.3 100.5 102.8文娱用耐用消费品及服务 Durable Consumer Goods for Recreational Use 92.7 92.0 94.1
教育 Education 104.3 103.9 104.8
教材及参考书 Teaching Materials and Reference Books 101.7 102.0 101.0
学杂托幼费 Tuition and Children Care 104.5 104.1 105.0
文化娱乐用品 Cultural and Recreational Articles 101.3 101.7 99.6
文化用品 Cultural Articles 98.7 98.7 98.7
书报杂志 Newspapers and Magazines 100.4 100.5 100.1
文娱费 Expenditure of Entertainment 104.6 105.0 101.5
旅游及外出 Touring and Outgoing 95.4 95.1 99.0
居住 Residence 102.1 102.8 101.0
建房及装修材料 Building and Building Decoration Materials 99.5 99.2 99.7
租房 Rent 103.5 103.8 101.5
自有住房 Private Housing 99.1 98.8 100.1
水电燃料 Water, Electricity and Fuels 105.7 106.5 103.9

8/2/2019 China Labour Statistical Yearbook - 2004
http://slidepdf.com/reader/full/china-labour-statistical-yearbook-2004 131/464
1-91 (2003 )
1-91 (2003 )
Consumer Price Indices by Category and by Region (2003)
(上年=100) (preceding year=100)
总 指 数
食 品 #粮食 #油脂 #肉禽及 #蛋 #水产品 #菜
地 区 Region General Food Grain Oil 其制品 Eggs Aquatic Vegetables #鲜菜
Index or Fat Meal, and Products Fresh
Poultry Vegetables
全 国 National 101.2 103.4 102.3 112.6 103.3 98.6 100.3 117.7 120.5
北 京 Beijing 100.2 103.2 99.1 114.1 100.9 96.9 102.5 139.8 145.4
天 津 Tianjin 101.0 103.3 102.1 111.5 102.2 102.0 111.0 121.6 123.8
河 北 Hebei 102.2 104.5 102.4 113.1 104.3 98.6 97.6 122.8 128.8
山 西 Shanxi 101.8 104.7 101.5 110.3 106.9 98.0 100.1 129.4 134.7
内蒙古 Inner Mongolia 102.2 102.8 100.2 105.3 101.8 94.1 94.4 125.1 131.6
辽 宁 Liaoning 101.7 105.3 99.0 125.5 103.5 96.5 101.5 128.0 131.7
吉 林 Jilin 101.2 104.0 98.5 113.3 102.2 95.1 100.7 125.1 127.5
黑龙江 Heilongjiang 100.9 103.3 99.9 112.6 101.7 97.1 96.6 124.9 129.1
上 海 Shanghai 100.1 101.3 100.8 106.1 101.7 101.0 105.6 99.2 98.9
江 苏 Jiangsu 101.0 103.3 102.1 112.8 104.5 99.2 97.7 117.9 120.2
浙 江 Zhejiang 101.9 102.8 103.2 112.9 105.3 98.4 100.2 107.4 107.9
安 徽 Anhui 101.7 106.0 104.5 116.8 108.1 100.6 99.5 126.3 128.7
福 建 Fujian 100.8 102.0 106.7 110.5 101.7 96.5 100.1 100.9 101.1
江 西 Jiangxi 100.8 102.9 103.6 115.4 103.5 99.8 97.8 112.8 116.6
山 东 Shandong 101.1 104.9 105.2 113.1 106.3 99.6 102.1 128.3 131.5
河 南 Henan 101.6 104.7 103.5 119.2 105.0 98.0 98.4 123.7 129.5
湖 北 Hubei 102.2 104.3 107.1 115.0 104.9 101.4 98.4 118.2 120.2
湖 南 Hunan 102.4 105.8 103.4 113.7 109.4 100.5 98.5 118.4 120.4
广 东 Guangdong 100.6 102.3 101.9 108.6 100.6 99.8 101.3 109.7 111.7
广 西 Guangxi 101.1 102.9 106.8 113.1 101.9 99.2 97.9 109.4 111.1
海 南 Hainan 100.1 102.9 101.8 103.6 103.2 98.0 101.7 105.9 106.6
重 庆 Chongqing 100.6 104.3 100.5 114.2 99.2 98.3 104.7 120.6 122.8
四 川 Sichuan 101.7 102.7 101.5 107.5 100.7 97.3 97.0 124.9 130.0
贵 州 Guizhou 101.2 103.2 103.6 108.9 102.1 99.8 96.5 114.0 116.2
云 南 Yunnan 101.2 101.7 100.5 107.9 100.3 95.6 99.6 106.0 106.5
西 藏 Tibet 100.9 100.5 98.0 96.1 102.1 95.8 94.5 100.3 100.5
陕 西 Shaanxi 101.7 105.2 105.0 110.3 103.9 98.1 100.5 133.0 137.0
甘 肃 Gansu 101.1 103.0 101.6 108.1 100.0 96.1 100.2 120.9 128.5
青 海 Qinghai 102.0 104.1 101.5 112.1 104.5 98.6 101.2 121.1 123.8
宁 夏 Ningxia 101.7 104.5 101.1 106.2 102.5 98.2 99.2 124.7 127.7
新 疆 Xinjiang 100.4 102.5 96.7 114.8 98.1 97.8 93.0 129.1 131.2
1-91 1 continued
(上年=100) (preceding year=100)
#干鲜瓜果 #在外用膳 烟酒及用品 衣 着
地 区 Region Dried and #鲜 果 食品 Tobacco, #烟 草 #酒 Clothing 服 装
Fresh Melons Fresh Outward Liquor and Tobacco Liquor Garments
and Fruits Fruits Dinner Articles
全 国 National 103.0 101.8 100.1 99.8 99.8 100.1 97.8 97.6

8/2/2019 China Labour Statistical Yearbook - 2004
http://slidepdf.com/reader/full/china-labour-statistical-yearbook-2004 132/464
北 京 Beijing 109.0 111.4 98.1 100.2 99.7 101.1 97.1 98.3
天 津 Tianjin 99.8 95.5 100.0 98.8 98.4 99.1 88.1 87.6
河 北 Hebei 98.0 95.1 99.8 100.1 99.7 100.5 97.8 98.0
山 西 Shanxi 94.9 92.4 101.7 100.7 100.3 102.4 97.5 97.2
内蒙古 Inner Mongolia 107.8 108.6 99.1 99.4 98.9 100.0 98.7 98.6
辽 宁 Liaoning 100.8 98.7 99.1 98.6 97.2 100.6 97.8 98.1
吉 林 Jilin 102.0 97.2 101.3 100.4 100.3 100.4 99.6 99.8
黑龙江 Heilongjiang 101.9 101.1 99.3 98.8 98.7 99.2 98.4 98.3
上 海 Shanghai 97.2 94.0 100.8 99.8 99.3 100.3 97.5 97.9
江 苏 Jiangsu 101.0 98.5 100.9 99.5 99.2 99.9 99.0 98.8
浙 江 Zhejiang 103.0 98.3 99.9 101.2 101.6 100.7 96.7 96.9
安 徽 Anhui 100.8 98.4 100.0 99.9 100.0 99.8 97.3 97.9
福 建 Fujian 108.8 109.1 99.7 100.4 100.9 99.8 96.5 96.3
江 西 Jiangxi 101.7 97.4 99.4 99.8 99.6 99.9 97.2 96.6
山 东 Shandong 96.7 95.5 100.7 99.6 98.8 100.3 96.9 96.1
河 南 Henan 96.7 92.7 100.7 100.3 100.6 100.1 98.0 97.6
湖 北 Hubei 102.3 101.4 100.6 99.8 99.8 100.0 101.0 101.1湖 南 Hunan 111.2 114.2 99.4 99.8 100.5 98.1 98.8 99.0
广 东 Guangdong 106.9 107.8 99.9 101.4 101.7 100.9 97.7 97.6
广 西 Guangxi 105.1 104.9 99.5 100.0 98.5 102.3 98.5 96.3
海 南 Hainan 114.8 116.7 101.3 100.1 100.4 100.4 95.9 95.2
重 庆 Chongqing 122.6 130.5 101.3 98.2 97.0 101.1 94.2 93.9
四 川 Sichuan 104.8 103.3 100.2 100.2 99.5 101.3 98.5 98.5
贵 州 Guizhou 110.4 108.9 98.6 99.6 100.0 99.7 97.6 98.7
云 南 Yunnan 103.0 100.0 103.7 99.9 99.9 100.4 97.2 97.0
西 藏 Tibet 105.2 106.8 99.6 103.0 104.4 100.6 101.5 101.3
陕 西 Shaanxi 98.8 97.2 100.5 99.6 99.3 100.0 99.0 97.8
甘 肃 Gansu 99.7 98.4 101.1 99.8 101.1 99.4 98.4 98.3
青 海 Qinghai 108.7 110.2 99.7 99.0 98.8 98.9 101.9 102.2
宁 夏 Ningxia 109.2 109.5 100.0 101.1 101.6 99.3 99.4 98.6
新 疆 Xinjiang 104.8 104.5 100.3 99.8 99.7 99.8 99.2 99.2
1-91 2 continued
(上年=100) (preceding year=100)
家庭设备
鞋袜帽 衣着加工 用品及服务 耐用消费品 室内装饰品 床上用品 家庭日 家庭服务及加服务费 用杂品 工维修服务费
地 区 Region Footgear Clothing Household Durable Interior Bed Daily Use Other Household
and Hats Manufacturing Facilities Consumer Decorations Articles Household Service and
Service and Articles Goods Articles Manufacturing
Upkeep
全 国 National 97.7 100.1 97.4 95.8 98.8 98.4 98.3 101.1
北 京 Beijing 93.3 109.0 97.7 95.8 98.6 99.8 97.5 107.6
天 津 Tianjin 86.0 100.0 96.5 95.9 100.6 90.7 95.0 103.0
河 北 Hebei 97.1 100.3 97.0 95.7 98.9 99.1 98.4 100.5
山 西 Shanxi 98.3 100.6 98.8 98.1 98.2 101.9 98.3 102.1
内蒙古 Inner Mongolia 99.5 96.5 98.1 98.4 98.4 96.0 97.5 100.2
辽 宁 Liaoning 96.8 99.1 96.4 94.0 97.1 100.9 97.6 100.6
吉 林 Jilin 98.9 99.5 97.9 96.8 99.3 99.0 97.6 99.9
黑龙江 Heilongjiang 98.7 97.2 97.0 95.4 98.8 99.3 97.7 97.7
上 海 Shanghai 95.9 100.1 98.4 98.9 99.1 99.6 96.3 98.9
江 苏 Jiangsu 98.8 105.4 96.6 94.7 99.1 99.4 97.7 100.9
浙 江 Zhejiang 95.8 100.6 96.9 94.6 97.8 95.8 99.9 100.9
安 徽 Anhui 95.6 100.0 97.7 95.9 99.3 98.1 98.5 101.2

8/2/2019 China Labour Statistical Yearbook - 2004
http://slidepdf.com/reader/full/china-labour-statistical-yearbook-2004 133/464
福 建 Fujian 96.7 102.0 97.3 95.3 99.1 96.3 99.1 100.8
江 西 Jiangxi 98.1 103.2 97.5 95.0 95.9 99.3 99.1 102.5
山 东 Shandong 97.5 100.2 98.0 96.6 99.4 99.7 98.8 101.9
河 南 Henan 98.6 99.6 97.7 96.6 98.4 99.0 98.0 100.2
湖 北 Hubei 101.0 99.9 97.3 95.1 100.2 99.6 99.0 101.7
湖 南 Hunan 97.8 101.4 97.2 95.4 99.8 99.4 99.3 99.9
广 东 Guangdong 97.1 99.9 98.0 96.2 99.8 98.7 98.1 102.6
广 西 Guangxi 104.0 99.4 97.4 94.6 97.2 100.1 97.7 106.2
海 南 Hainan 97.1 101.3 98.1 98.7 98.4 97.9 98.8 93.6
重 庆 Chongqing 94.3 98.9 95.5 94.2 99.6 99.0 94.0 99.8
四 川 Sichuan 98.1 98.6 98.3 96.4 99.7 99.0 99.7 101.8
贵 州 Guizhou 94.6 102.5 97.2 96.3 99.4 93.8 98.6 99.8
云 南 Yunnan 97.5 100.8 98.4 97.9 100.6 98.5 99.0 96.8
西 藏 Tibet 100.9 101.1 101.4 100.5 99.9 102.8 103.4 100.3
陕 西 Shaanxi 102.0 99.7 97.1 95.3 96.8 98.8 99.2 99.5
甘 肃 Gansu 97.7 97.4 98.5 97.6 98.5 99.4 98.6 101.8
青 海 Qinghai 103.3 98.6 100.1 99.2 105.7 101.0 98.6 104.0
宁 夏 Ningxia 101.9 99.2 95.7 92.6 97.9 91.6 100.5 103.0新 疆 Xinjiang 99.1 100.4 98.9 98.3 98.5 99.4 99.5 99.9
1-91 3 continued
(上年=100)
医疗保健
和个人用品
医疗保健 医疗器具 中药材及 西药 保健器具 医疗保健
地 区 Region Health 及用品 中成药 及用品 服 务
Care & Health Medical Traditional Western Health Care Health
Personal Care Appliances Chinese Medicine Appliances Care
Articles and Articles Medicine and Articles Services
全 国 National 100.9 101.2 101.0 105.0 94.5 98.2 108.9
北 京 Beijing 100.1 99.9 100.3 99.3 100.4 99.6 100.0
天 津 Tianjin 94.0 92.1 103.1 96.4 84.9 95.2 100.0
河 北 Hebei 106.0 108.8 92.8 108.2 94.5 98.3 144.9
山 西 Shanxi 99.0 97.9 100.3 103.4 93.0 97.8 101.3
内蒙古 Inner Mongolia 98.9 97.9 101.9 100.0 93.2 98.7 104.8
辽 宁 Liaoning 103.5 104.9 100.2 106.1 95.2 99.0 131.5
吉 林 Jilin 101.8 101.9 97.8 108.9 95.6 99.7 106.4
黑龙江 Heilongjiang 99.4 98.6 95.8 98.0 93.5 93.4 110.9
上 海 Shanghai 100.0 99.1 104.8 103.7 96.3 98.1 99.1
江 苏 Jiangsu 100.3 99.9 100.5 106.4 94.4 98.6 101.9
浙 江 Zhejiang 100.1 100.1 98.0 113.9 91.4 98.6 101.0
安 徽 Anhui 99.9 99.8 101.5 108.9 93.8 98.8 103.5
福 建 Fujian 98.7 98.2 106.8 104.9 91.3 97.9 100.2
江 西 Jiangxi 97.8 96.6 101.9 99.2 90.5 96.4 100.5
山 东 Shandong 100.3 101.0 102.7 109.8 95.6 98.8 101.9
河 南 Henan 102.5 103.2 110.3 110.8 96.5 100.4 104.2
湖 北 Hubei 99.6 99.4 96.0 104.5 95.2 102.5 100.5
湖 南 Hunan 105.9 108.6 92.8 101.4 93.9 99.4 143.2
广 东 Guangdong 100.4 100.6 102.5 104.1 97.5 98.4 102.0
广 西 Guangxi 102.8 103.9 102.0 106.6 97.1 98.0 114.2
海 南 Hainan 100.1 101.2 102.6 103.1 97.5 101.0 103.8
重 庆 Chongqing 99.3 99.2 104.7 97.2 97.7 98.7 104.3
四 川 Sichuan 102.9 103.8 100.1 107.8 98.0 97.1 111.2
贵 州 Guizhou 104.3 107.3 96.8 100.0 97.6 99.4 132.9
云 南 Yunnan 99.3 98.6 101.2 101.2 95.7 100.4 100.7
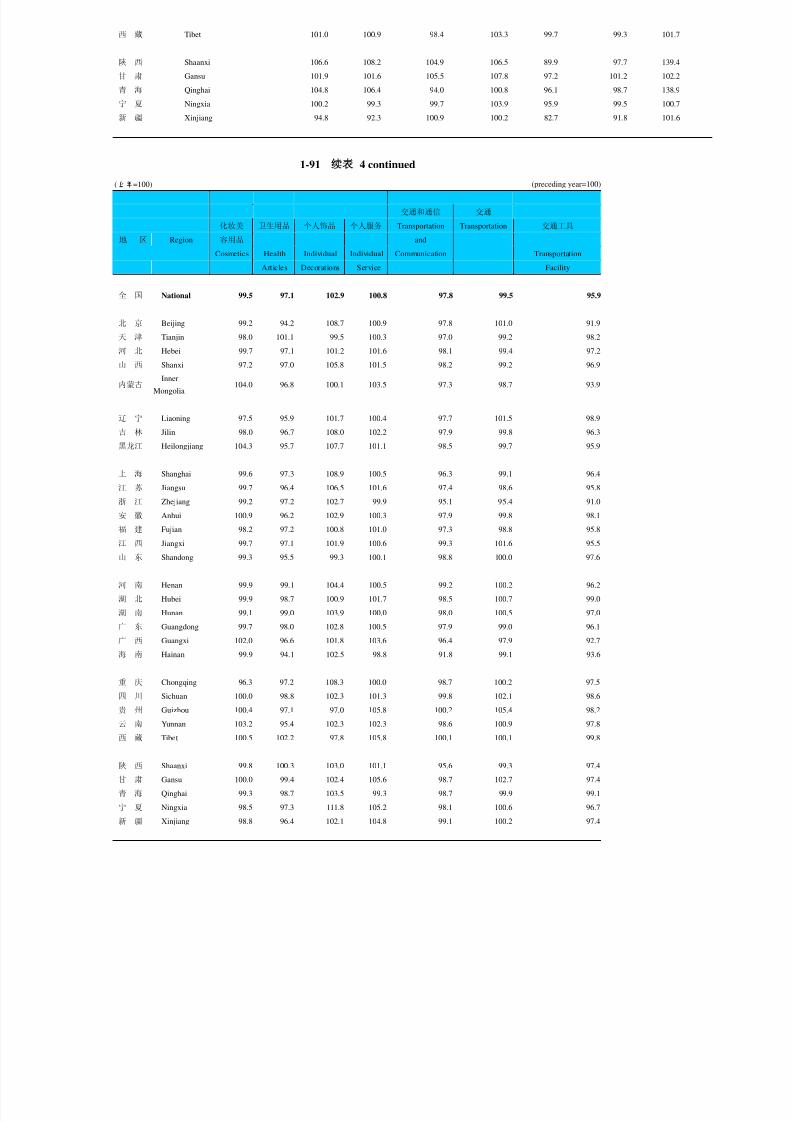
8/2/2019 China Labour Statistical Yearbook - 2004
http://slidepdf.com/reader/full/china-labour-statistical-yearbook-2004 134/464
西 藏 Tibet 101.0 100.9 98.4 103.3 99.7 99.3 101.7
陕 西 Shaanxi 106.6 108.2 104.9 106.5 89.9 97.7 139.4
甘 肃 Gansu 101.9 101.6 105.5 107.8 97.2 101.2 102.2
青 海 Qinghai 104.8 106.4 94.0 100.8 96.1 98.7 138.9
宁 夏 Ningxia 100.2 99.3 99.7 103.9 95.9 99.5 100.7
新 疆 Xinjiang 94.8 92.3 100.9 100.2 82.7 91.8 101.6
1-91 4 continued
(上年=100) (preceding year=100)
交通和通信 交通
化妆美 卫生用品 个人饰品 个人服务 Transportation Transportation 交通工具
地 区 Region 容用品 and
Cosmetics Health Individual Individual Communication Transportation
Articles Decorations Service Facility
全 国 National 99.5 97.1 102.9 100.8 97.8 99.5 95.9
北 京 Beijing 99.2 94.2 108.7 100.9 97.8 101.0 91.9
天 津 Tianjin 98.0 101.1 99.5 100.3 97.0 99.2 98.2
河 北 Hebei 99.7 97.1 101.2 101.6 98.1 99.4 97.2
山 西 Shanxi 97.2 97.0 105.8 101.5 98.2 99.2 96.9
内蒙古 Inner
Mongolia104.0 96.8 100.1 103.5 97.3 98.7 93.9
辽 宁 Liaoning 97.5 95.9 101.7 100.4 97.7 101.5 98.9
吉 林 Jilin 98.0 96.7 108.0 102.2 97.9 99.8 96.3
黑龙江 Heilongjiang 104.3 95.7 107.7 101.1 98.5 99.7 95.9
上 海 Shanghai 99.6 97.3 108.9 100.5 96.3 99.1 96.4
江 苏 Jiangsu 99.7 96.4 106.5 101.6 97.4 98.6 95.8
浙 江 Zhejiang 99.2 97.2 102.7 99.9 95.1 95.4 91.0
安 徽 Anhui 100.9 96.2 102.9 100.3 97.9 99.8 98.1
福 建 Fujian 98.2 97.2 100.8 101.0 97.3 98.8 95.8
江 西 Jiangxi 99.7 97.1 101.9 100.6 99.3 101.6 95.5
山 东 Shandong 99.3 95.5 99.3 100.1 98.8 100.0 97.6
河 南 Henan 99.9 99.1 104.4 100.5 99.2 100.2 96.2
湖 北 Hubei 99.9 98.7 100.9 101.7 98.5 100.7 99.0
湖 南 Hunan 99.1 99.0 103.9 100.0 98.0 100.5 97.0
广 东 Guangdong 99.7 98.0 102.8 100.5 97.9 99.0 96.1
广 西 Guangxi 102.0 96.6 101.8 103.6 96.4 97.9 92.7
海 南 Hainan 99.9 94.1 102.5 98.8 91.8 99.1 93.6
重 庆 Chongqing 96.3 97.2 108.3 100.0 98.7 100.2 97.5
四 川 Sichuan 100.0 98.8 102.3 101.3 99.8 102.1 98.6
贵 州 Guizhou 100.4 97.1 97.0 105.8 100.2 105.4 98.2
云 南 Yunnan 103.2 95.4 102.3 102.3 98.6 100.9 97.8
西 藏 Tibet 100.5 102.2 97.8 105.8 100.1 100.1 99.8
陕 西 Shaanxi 99.8 100.3 103.0 101.1 95.6 99.3 97.4
甘 肃 Gansu 100.0 99.4 102.4 105.6 98.7 102.7 97.4
青 海 Qinghai 99.3 98.7 103.5 99.3 98.7 99.9 99.1
宁 夏 Ningxia 98.5 97.3 111.8 105.2 98.1 100.6 96.7
新 疆 Xinjiang 98.8 96.4 102.1 104.8 99.1 100.2 97.4

8/2/2019 China Labour Statistical Yearbook - 2004
http://slidepdf.com/reader/full/china-labour-statistical-yearbook-2004 135/464
1-91 5 continued
(上年=100) (preceding year=100)
通信
车用燃料 车辆使用 市内公共 城市间 通信工具 通信服务
地 区 Region 及零配件 及维修费 交 通 费 交通费 Communication
Fuels Using Incity Intercity Communication Communication
and and Upkeep Traffic Traffic Facility Services
Parts Fare Fare Fare
全 国 National 108.3 98.9 100.6 101.4 96.1 82.1 99.4
北 京 Beijing 104.6 112.2 100.0 101.0 95.5 79.2 99.8
天 津 Tianjin 104.4 100.6 100.0 96.1 95.3 73.7 99.6
河 北 Hebei 112.8 99.8 101.3 101.5 96.9 82.2 99.8
山 西 Shanxi 107.7 95.0 100.5 101.8 97.5 83.8 99.8
内蒙古 Inner Mongolia 116.3 98.2 99.3 101.5 95.6 86.3 98.3
辽 宁 Liaoning 106.2 102.6 101.0 103.3 95.4 73.2 99.8
吉 林 Jilin 105.5 101.8 100.3 99.5 95.9 78.0 98.6
黑龙江 Heilongjiang 103.6 101.7 100.0 100.2 97.5 80.0 99.8
上 海 Shanghai 105.8 98.5 100.0 99.8 93.7 70.4 100.0
江 苏 Jiangsu 107.2 95.3 101.6 102.9 96.2 76.5 100.0
浙 江 Zhejiang 105.3 94.9 100.3 100.2 94.8 81.4 99.9
安 徽 Anhui 106.4 98.2 100.9 99.6 96.2 82.2 99.5
福 建 Fujian 108.6 95.6 99.7 101.1 96.2 77.6 100.2
江 西 Jiangxi 107.7 101.2 102.1 105.8 97.2 83.1 99.9
山 东 Shandong 112.4 98.1 101.0 100.7 97.5 83.9 101.0
河 南 Henan 108.5 100.1 101.6 102.8 98.1 86.7 99.8
湖 北 Hubei 104.1 100.5 100.4 102.2 95.0 80.7 97.2
湖 南 Hunan 106.2 99.5 99.7 103.6 95.8 88.4 98.2
广 东 Guangdong 108.4 98.2 98.9 98.3 96.7 84.1 99.7
广 西 Guangxi 105.3 98.5 100.1 100.6 94.4 81.6 97.7
海 南 Hainan 107.0 98.6 100.0 100.2 82.2 84.2 81.7
重 庆 Chongqing 111.2 96.9 99.2 102.2 97.7 78.6 100.0
四 川 Sichuan 106.1 101.0 106.5 101.3 97.9 90.2 100.1
贵 州 Guizhou 107.8 102.8 102.1 125.5 94.8 91.7 95.7
云 南 Yunnan 109.8 96.5 98.7 106.2 97.1 89.7 99.2
西 藏 Tibet 102.0 100.7 96.3 99.9 100.4 87.3 103.0
陕 西 Shaanxi 107.1 99.1 99.5 99.9 91.8 81.5 93.9
甘 肃 Gansu 104.2 100.0 110.9 101.2 95.0 83.9 97.5
青 海 Qinghai 109.9 99.3 100.8 99.8 97.2 83.2 100.0
宁 夏 Ningxia 106.3 100.0 99.6 105.6 96.1 80.9 99.8
新 疆 Xinjiang 106.5 99.1 100.5 100.4 97.8 89.2 99.4
1-91 6 continued
(上年=100) (preceding year=100)
娱乐教育 文娱用耐用 教育 文化娱乐
文 化 消费品及服务 教材及参考书 学杂托幼费 用品 文化用品
地 区 Region Recreation, Durable Consumer Teaching Tuition Cultural and Cultural
Education Goods and Service Education Materials and and Recreational Articles
& Culture for Recreational Use Reference Books Child Care Articles
全 国 National 101.3 92.7 104.3 101.7 104.5 101.3 98.7
北 京 Beijing 98.3 89.5 99.7 95.0 100.0 103.1 97.6
天 津 Tianjin 110.7 93.2 118.5 97.0 120.4 121.4 100.1

8/2/2019 China Labour Statistical Yearbook - 2004
http://slidepdf.com/reader/full/china-labour-statistical-yearbook-2004 136/464
河 北 Hebei 100.7 92.1 102.5 102.8 102.5 101.5 99.2
山 西 Shanxi 100.4 94.0 102.4 107.7 102.0 98.9 96.7
内蒙古 Inner Mongolia 112.0 95.9 117.7 102.6 118.2 103.0 98.8
辽 宁 Liaoning 99.6 89.2 102.8 100.7 103.0 99.6 96.9
吉 林 Jilin 99.2 93.8 100.1 105.5 99.3 100.9 99.3
黑龙江 Heilongjiang 101.9 90.7 104.2 101.1 104.4 100.8 99.2
上 海 Shanghai 100.3 92.4 104.6 101.2 105.1 102.8 98.9
江 苏 Jiangsu 102.5 90.0 105.9 103.8 106.0 100.3 97.5
浙 江 Zhejiang 111.2 92.2 120.7 98.8 121.6 101.1 98.9
安 徽 Anhui 100.9 94.1 102.3 111.0 102.1 99.9 99.0
福 建 Fujian 104.3 92.3 110.0 109.5 110.0 100.7 99.1
江 西 Jiangxi 100.1 92.9 101.1 101.9 101.1 101.5 99.1
山 东 Shandong 100.1 95.3 101.3 103.0 101.3 100.4 99.2
河 南 Henan 99.4 94.8 100.4 100.6 100.3 100.7 99.5
湖 北 Hubei 102.7 92.5 105.3 104.8 105.3 102.1 99.5
湖 南 Hunan 100.4 95.2 102.5 101.2 102.5 101.1 98.0
广 东 Guangdong 98.0 92.1 100.2 101.4 100.0 100.8 99.5
广 西 Guangxi 100.6 87.8 104.8 95.2 105.5 100.9 99.0海 南 Hainan 98.7 94.9 101.1 97.9 101.0 100.5 98.6
重 庆 Chongqing 99.6 93.0 102.2 103.9 102.0 98.8 99.4
四 川 Sichuan 100.7 95.0 102.8 103.1 102.7 100.9 99.8
贵 州 Guizhou 100.7 92.3 102.2 104.1 102.0 103.6 98.7
云 南 Yunnan 106.4 95.8 115.2 100.9 115.9 98.2 96.7
西 藏 Tibet 99.7 98.7 99.4 100.0 99.3 100.1 99.0
陕 西 Shaanxi 98.9 91.0 101.3 96.0 101.8 100.3 99.6
甘 肃 Gansu 100.5 92.9 101.5 101.9 101.5 100.9 97.8
青 海 Qinghai 100.9 89.1 105.0 99.6 105.1 98.1 99.0
宁 夏 Ningxia 105.6 89.8 117.1 104.9 119.4 99.1 97.6
新 疆 Xinjiang 99.1 95.8 100.6 100.0 100.6 100.7 99.5
1-91 7 continued
(上年=100)
旅游及外出 居 住 建 房 及 租 房 自有住房
书报杂志 文娱费 装修材料
地 区 Region Newspapers Cultural and Touring and Residence Building Rent Private
and Recreation Outgoing Decoration HousingMagazines Materials
全 国 National 100.4 104.6 95.4 102.1 99.5 103.5 99.1
北 京 Beijing 100.0 109.4 95.9 101.6 92.5 100.0 97.8
天 津 Tianjin 102.0 164.6 83.5 101.7 98.8 104.6 99.0
河 北 Hebei 100.5 108.3 96.5 104.5 100.1 108.8 99.5
山 西 Shanxi 100.0 100.4 96.8 106.7 98.4 100.5 99.0
内蒙古 Inner Mongolia 102.0 109.1 100.0 99.7 97.9 100.6 98.2
辽 宁 Liaoning 100.3 102.4 94.4 101.7 95.8 100.3 98.3
吉 林 Jilin 99.3 103.9 97.8 100.4 98.1 105.2 97.0
黑龙江 Heilongjiang 98.7 103.6 100.5 101.2 100.4 101.1 97.4
上 海 Shanghai 100.2 104.8 91.0 101.1 100.9 100.0 98.4
江 苏 Jiangsu 100.4 103.9 97.0 101.0 98.7 107.5 98.9
浙 江 Zhejiang 101.6 102.8 92.2 101.2 100.9 104.2 99.2
安 徽 Anhui 100.5 100.6 93.9 100.7 99.8 104.8 98.6
福 建 Fujian 100.4 102.3 96.8 102.8 98.9 100.6 98.8
江 西 Jiangxi 101.2 104.7 95.7 102.1 100.9 102.7 100.0
山 东 Shandong 100.8 101.7 97.8 101.0 99.1 101.0 98.7

8/2/2019 China Labour Statistical Yearbook - 2004
http://slidepdf.com/reader/full/china-labour-statistical-yearbook-2004 137/464
河 南 Henan 100.4 103.3 97.5 102.3 99.9 103.0 98.7
湖 北 Hubei 100.0 105.4 98.9 103.5 99.5 103.5 100.7
湖 南 Hunan 99.2 105.6 95.2 103.1 100.1 100.5 101.0
广 东 Guangdong 101.5 101.5 94.7 103.1 101.4 105.3 100.0
广 西 Guangxi 103.6 100.7 98.1 102.3 99.9 108.7 99.4
海 南 Hainan 100.4 101.6 87.6 101.7 100.8 118.1 98.7
重 庆 Chongqing 97.3 99.3 98.7 102.2 100.0 99.9 98.5
四 川 Sichuan 100.4 102.3 93.9 102.9 99.0 103.1 99.8
贵 州 Guizhou 100.8 110.2 96.5 101.0 98.2 100.0 98.1
云 南 Yunnan 100.3 98.4 102.9 101.9 101.0 101.1 98.0
西 藏 Tibet 99.7 101.8 101.4 98.8 99.1 99.5 98.6
陕 西 Shaanxi 99.6 101.6 90.0 101.0 99.0 100.5 97.5
甘 肃 Gansu 100.4 104.7 107.0 101.5 97.6 100.1 98.7
青 海 Qinghai 99.9 97.2 99.5 99.9 96.3 100.2 98.7
宁 夏 Ningxia 100.2 100.4 99.5 100.0 94.3 101.7 101.3
新 疆 Xinjiang 100.6 101.9 93.3 104.2 101.1 98.7 98.9
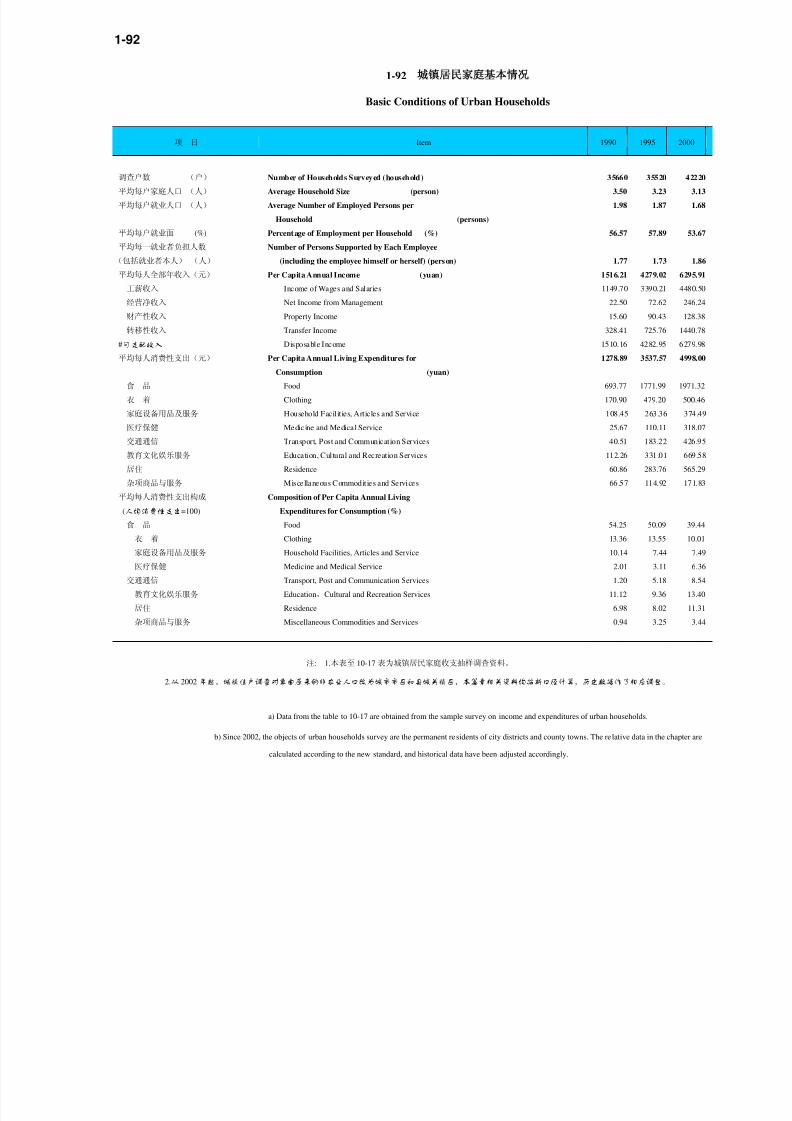
8/2/2019 China Labour Statistical Yearbook - 2004
http://slidepdf.com/reader/full/china-labour-statistical-yearbook-2004 138/464
1-92
1-92
Basic Conditions of Urban Households
项 目 Item 1990 1995 2000
调查户数 (户) Number of Households Surveyed (household) 35660 35520 42220
平均每户家庭人口 (人) Average Household Size (person) 3.50 3.23 3.13
平均每户就业人口 (人) Average Number of Employed Persons per 1.98 1.87 1.68
Household (persons)
平均每户就业面 (%) Percentage of Employment per Household (%) 56.57 57.89 53.67
平均每一就业者负担人数 Number of Persons Supported by Each Employee
(包括就业者本人) (人) (including the employee himself or herself) (person) 1.77 1.73 1.86
平均每人全部年收入(元) Per Capita Annual Income (yuan) 1516.21 4279.02 6295.91
工薪收入 Income of Wages and Salaries 1149.70 3390.21 4480.50
经营净收入 Net Income from Management 22.50 72.62 246.24
财产性收入 Property Income 15.60 90.43 128.38
转移性收入 Transfer Income 328.41 725.76 1440.78
#可支配收入 Disposable Income 1510.16 4282.95 6279.98
平均每人消费性支出(元) Per Capita Annual Living Expenditures for 1278.89 3537.57 4998.00
Consumption (yuan)
食 品 Food 693.77 1771.99 1971.32
衣 着 Clothing 170.90 479.20 500.46
家庭设备用品及服务 Household Facilities, Articles and Service 108.45 263.36 374.49
医疗保健 Medicine and Medical Service 25.67 110.11 318.07
交通通信 Transport, Post and Communication Services 40.51 183.22 426.95
教育文化娱乐服务 Education, Cultural and Recreation Services 112.26 331.01 669.58
居住
Residence 60.86 283.76 565.29
杂项商品与服务 Miscellaneous Commodities and Services 66.57 114.92 171.83
平均每人消费性支出构成 Composition of Per Capita Annual Living
(人均消费性支出=100) Expenditures for Consumption (%)
食 品 Food 54.25 50.09 39.44
衣 着 Clothing 13.36 13.55 10.01
家庭设备用品及服务 Household Facilities, Articles and Service 10.14 7.44 7.49
医疗保健 Medicine and Medical Service 2.01 3.11 6.36
交通通信 Transport, Post and Communication Services 1.20 5.18 8.54
教育文化娱乐服务 Education,Cultural and Recreation Services 11.12 9.36 13.40
居住 Residence 6.98 8.02 11.31
杂项商品与服务 Miscellaneous Commodities and Services 0.94 3.25 3.44
注: 1.本表至 10-17 表为城镇居民家庭收支抽样调查资料。
2.从 2002年起,城镇住户调查对象由原来的非农业人口改为城市市区和县城关镇区,本篇章相关资料均按新口径计算,历史数据作了相应调整。
a) Data from the table to 10-17 are obtained from the sample survey on income and expenditures of urban households.
b) Since 2002, the objects of urban households survey are the permanent residents of city districts and county towns. The relative data in the chapter are
calculated according to the new standard, and historical data have been adjusted accordingly.

8/2/2019 China Labour Statistical Yearbook - 2004
http://slidepdf.com/reader/full/china-labour-statistical-yearbook-2004 139/464
1-93 2003
1-93 2003
Per Capita Annual Income of Urban Residents by Source and by Region (2003)
单位: 元 (y
可支配 总收入
收 入 工薪收入 经营净收入 财产性收入 转移性收入
Disposable Total Income of Wages Net Income from Property Transfer
地 区 Region
Income Income and Salaries Management Income Income
全 国 National Average 8472.20 9061.22 6410.22 403.82 134.98 211
北 京 Beijing 13882.62 14959.30 10152.14 314.19 174.67 431
天 津 Tianjin 10312.91 10971.57 6663.54 468.96 96.41 374
河 北 Hebei 7239.06 7608.43 4924.32 279.23 118.82 228 山 西 Shanxi 7005.03 7446.89 5527.89 302.37 87.23 152
内蒙古 Inner Mongolia 7012.90 7351.58 5235.96 614.22 83.73 141
辽 宁 Liaoning 7240.58 7832.70 5204.18 314.61 63.26 225
吉 林 Jilin 7005.17 7311.23 4828.31 575.10 100.76 180
黑龙江 Heilongjiang 6678.90 6968.01 4489.37 511.68 38.03 192
上 海 Shanghai 14867.49 16380.24 11525.99 376.71 130.05 434
江 苏 Jiangsu 9262.46 9912.14 6091.04 638.82 151.13 303
浙 江 Zhejiang 13179.53 14295.38 9692.52 1171.51 373.97 305
安 徽 Anhui 6778.03 7155.91 4878.30 371.10 114.37 179
福 建 Fujian 9999.54 10816.32 7499.01 547.79 285.75 248
江 西 Jiangxi 6901.42 7153.65 5108.21 366.43 63.76 161
山 东 Shandong 8399.91 9057.58 7418.42 227.91 109.78 130
河 南 Henan 6926.12 7245.00 4757.86 362.92 84.64 203
湖 北 Hubei 7321.98 7745.77 5847.66 238.62 85.03 157
湖 南 Hunan 7674.20 8145.07 5984.74 356.17 100.65 170
广 东 Guangdong 12380.43 13451.13 10413.47 621.51 307.52 210
广 西 Guangxi 7785.04 8293.90 6149.78 402.44 169.18 157
海 南 Hainan 7259.25 7605.69 5020.58 243.14 288.08 205
重 庆 Chongqing 8093.67 8671.91 6288.55 114.13 80.80 218
四 川 Sichuan 7041.87 7488.49 4910.82 351.14 183.45 204
贵 州 Guizhou 6569.23 6746.36 4668.50 379.61 55.12 164
云 南 Yunnan 7643.57 8202.58 5854.39 286.92 86.43 197
西 藏 Tibet 8765.45 9696.79 9466.39 7.15 22
陕 西 Shaanxi 6806.35 7314.44 5170.32 139.83 138.06 186
甘 肃 Gansu 6657.24 7132.82 5269.23 269.66 41.40 155
青 海 Qinghai 6745.32 7155.13 4493.36 276.19 50.87 233
宁 夏 Ningxia 6530.48 6991.26 4670.76 441.47 82.48 179
新 疆 Xinjiang 7173.54 7866.85 6219.72 291.63 76.01 127

8/2/2019 China Labour Statistical Yearbook - 2004
http://slidepdf.com/reader/full/china-labour-statistical-yearbook-2004 140/464
1-94
1-94
Basic Conditions of Rural Households
2000 2002
全 国 西部 12 省 全 国 西部 12 省 全
(区、市) (区、市)
National 12 Western National 12 Western Nat
项 目 Item
Total Provinces Total Provinces T
调查户数 (户) Number of Households Surveyed (household) 68116 21986 68190 22060
调查户人口 (人) Number of Residents Surveyed (person)
常住人口 Number of Permanent Residents in the
Households Surveyed 286162 98712 281674 97122
平均每户常住人口 Average Number of Permanent Residents
per Household 4.20 4.49 4.13 4.40
平均每户整半劳力 Average Number of Able-bodied and
Semi-able-bodied Laborers per Household 2.76 2.83 2.76 2.82
平均每个劳动力负 Average Number of Persons Supported by a
担人口(含本人) Laborer (including the laborer himself or herself) 1.52 1.59 1.50 1.56
平均每人年收入(元) Per Capita Annual Income (yuan)
总收入 Total Revenue 3146.21 2496.42 3448.62 2718.13 3
工资性收入 Wages Income 702.30 390.93 840.22 483.87
家庭经营收入 Household Business Income 2251.28 1976.01 2380.51 2076.21 2
财产性收入 Property Income 45.04 31.23 50.68 30.80
转移性收入 Transfer Income 147.59 98.25 177.21 127.25
现金收入 Cash Income 2381.60 1722.50 2712.95 1928.18 2
工资性收入 Wages Income 700.41 390.31 839.17 483.44
家庭经营收入 Household Business Income 1498.81 1210.64 1653.65 1293.51 1
财产性收入 Property Income 38.89 26.18 47.65 28.57
转移性收入 Transfer Income 143.49 95.37 172.48 122.66
平均每人年支出 (元) Per Capita Annual Expenditures (yuan)
总支出 Total Expenditure 2652.42 2211.35 2923.60 2412.11 3
家庭经营费用支出 Expenditure for Household Business 654.27 643.57 731.01 707.20
购置生产性固定资产 Purchasing Productive Fixed Assets 63.90 63.64 85.50 93.43
税费支出 Expenditure for Tax and Fee 95.52 79.45 78.70 57.36
生活消费支出 Expenditure for Consumption 1670.13 1325.85 1834.31 1438.90 1
转移性和财产性支出 Expenditure for Transfer and Property 168.60 98.84 194.08 115.22
现金支出 Cash Expenditure 2140.37 1621.29 2437.72 1833.06 2
家庭经营费用支出 Expenditure for Household Business 544.49 483.47 617.41 532.83
购买生产性固定资产 Purchasing Productive Fixed Assets 63.91 63.64 85.50 93.43
税费支出 Expenditure for Tax and Fee 89.81 74.40 75.58 53.98
生活消费支出 Expenditure for Consumption 1284.74 907.03 1467.62 1039.43 1
转移性和财产性支出 Expenditure for Transfer and Property 157.42 92.75 191.61 113.39
平均每人年纯收入(元) Per Capita Annual Net Income (yuan) 2253.42 1661.03 2475.63 1820.87 2
工资性收入 Wages Income 702.30 390.93 840.22 483.87
家庭经营纯收入 Household Business Income 1427.27 1182.43 1486.54 1230.52 1
财产性收入 Property Income 45.04 31.23 50.68 30.97
转移性收入 Transfer Income 78.81 56.44 98.19 75.50
注:本表至 10-34 表为农村住户抽样调查资料。
a) Data from Tables 10-17 to 10-34 are obtained from the sample surveys on rural households.

8/2/2019 China Labour Statistical Yearbook - 2004
http://slidepdf.com/reader/full/china-labour-statistical-yearbook-2004 141/464
1-95 (2003 )
1-95 (2003 )
Per Capita Net Income of Rural Households
by Source and by Region (2003)
单位: 元
纯收入
工资性收入 家庭经营纯收入 财产性收入 转移性收
Net Income Wage Family Business Property Transfer地 区 Region
Income Income Income Income
全 国 National Average 2622.24 918.38 1541.28 65.75
北 京 Beijing 5601.55 3480.30 1450.82 305.92
天 津 Tianjin 4566.01 2152.55 2162.87 140.74
河 北
Hebei 2853.38 1072.33 1645.17 75.31山 西 Shanxi 2299.17 897.50 1316.55 24.16
内蒙古 Inner Mongolia 2267.65 344.60 1818.78 51.66
辽 宁 Liaoning 2934.44 1056.59 1709.99 66.33
吉 林 Jilin 2530.41 425.51 1991.17 66.40
黑龙江 Heilongjiang 2508.94 394.24 1950.17 139.07
上 海 Shanghai 6653.92 5251.58 813.08 236.21
江 苏 Jiangsu 4239.26 2189.06 1794.28 94.29
浙 江 Zhejiang 5389.04 2574.85 2332.11 250.41
安 徽 Anhui 2127.48 818.92 1199.94 36.21
福 建 Fujian 3733.89 1353.79 2015.36 78.38
江 西 Jiangxi 2457.53 1022.14 1357.37 28.93
山 东 Shandong 3150.49 1095.45 1874.45 63.92
河 南 Henan 2235.68 635.59 1487.82 38.58
湖 北 Hubei 2566.76 706.79 1785.27 15.76
湖 南 Hunan 2532.87 988.35 1427.21 32.34
广 东 Guangdong 4054.58 1965.78 1761.02 184.36
广 西 Guangxi 2094.51 784.60 1229.88 16.77
海 南 Hainan 2588.06 329.87 2122.12 53.28
重 庆 Chongqing 2214.55 858.50 1185.12 34.17
四 川 Sichuan 2229.86 765.76 1347.09 31.26
贵 州 Guizhou 1564.66 458.84 988.48 36.77
云 南 Yunnan 1697.12 318.22 1242.65 67.21
西 藏 Tibet 1690.76
陕 西 Shaanxi 1675.66 615.92 919.69 49.19
甘 肃 Gansu 1673.05 488.73 1108.52 16.98
青 海 Qinghai 1794.13 454.06 1200.32 51.49
宁 夏 Ningxia 2043.30 592.30 1255.35 68.76
新 疆 Xinjiang 2106.19 140.27 1875.03 58.91

8/2/2019 China Labour Statistical Yearbook - 2004
http://slidepdf.com/reader/full/china-labour-statistical-yearbook-2004 142/464
2-1
2-1
URBAN LABOUR FORCE RESOURCES AND ASSIGNMENT BY REGION
(2003)
单位: 人 (person)
(一)本年城镇劳动力供求总数 Total Urban Labour Force Resources
合计 1.高等学校 2.复员、转
3.中等职业 4.未能升学的 5.直接从农村
毕业生 业 军 人 学校毕业生 初高中毕业生 招收的人员
Demobilized Graduates Recruited
and Non-entering from
Transferred
Higher School Rural
Armymen of High Areas
地 区 Region
Total
Graduates of
Technical
Secondary
SchoolsSchools
Graduates of
Colleges and
Universities
National 28963819 2220308 427004 2508299 3024526 2832706
北 京 Beijing 419876 112100 6908 89000 11720 71000
天 津 Tianjin 301293 36600 3000 57800 2300 27800
河 北 Hebei 1876053 115400 29488 159800 97760 60589
山 西 Shanxi 533611 48742 12303 29834 65567 25759
内 蒙 古 Inner Mongolia 537285 27135 6821 29068 72181 102202
辽 宁 Liaoning 1862000 168000 21000 123000 175000 20000
吉 林 Jilin 1104064 80400 15000 30129 80375
黑 龙 江 Heilongjiang 2013675 55253 19681 59000 219803 119383
上 海 Shanghai 888134 81300 3582 71200 4000 125000
江 苏 Jiangsu 1343685 219978 20029 145970 79897 330646
浙 江 Zhejiang 1086355 103309 10494 65005 42563 272160
安 徽 Anhui 926776 61509 17346 111607 156885 35315
福 建 Fujian 724067 47674 7850 85154 130351 205014
江 西 Jiangxi 1200581 64713 14589 111264 99392 121800
山 东 Shandong 1661917 177035 39822 243800 193665 201578
河 南 Henan 1680130 95223 44557 148849 222152 79389
湖 北 Hubei 1585077 128197 34342 161934 219368 128450
湖 南 Hunan 1388000 115800 21509 66481 134117 88802
广 东 Guangdong 1699195 131779 25566 170372 322710 320911
广 西 Guangxi 716915 40593 5116 84737 140776
海 南 Hainan 135870 10451 2283 2754 23405 8259
重 庆 Chongqing 597995 45400 9600 51400 15000 13000
四 川 Sichuan 1478912 66900 19165 150456 35896 122587
贵 州 Guizhou 450471 25745 4395 62163 65268 24418
云 南 Yunnan 617963 32506 5380 79161 181225 85285
西 藏 Tibet 24570 1759 490 1973 5464
陕 西 Shaanxi 788774 53664 12848 40619 92148 26906
甘 肃 Gansu 405221 30931 6300 19685 47338
青 海 Qinghai 83100 5700 1400 5600 5000
宁 夏 Ningxia 247054 10712 1540 11584 23500 26053
新 疆 Xinjiang 585200 25800 4600 38900 59700 190400

8/2/2019 China Labour Statistical Yearbook - 2004
http://slidepdf.com/reader/full/china-labour-statistical-yearbook-2004 143/464
2-1 2 continued
单位: 人
(二)本年城镇劳动力配置总数
Urban Labour Assignment
(三)年末城镇登记失
业人员
2.城镇集体单位 3.其他单位 4.城镇私营企业 5. 其他
Urban Collec- Other 和个体劳动者 Others
tively-owned Units Employment in
Units Urban Private &
Individual Units
地 区 Region Registered Urban
Unemployment at Last
Year-end
National 1094122 3119060 6987849 2007408 7074314
北 京 Beijing 21261 162632 76315 69600
天 津 Tianjin 2689 69109 60600 120264
河 北 Hebei 19954 74111 147100 226800 256917
山 西 Shanxi 17259 25191 181977 21574 130514
内 蒙 古 Inner Mongol 17160 43605 198876 38443 176932
辽 宁 Liaoning 30000 142000 543000 100000 720000
吉 林 Jilin 11235 30872 176235 85660 284324
黑 龙 江 Heilongjiang 85657 149026 579921 87449 349782
上 海 Shanghai 16800 232900 209100 47400 301134
江 苏 Jiangsu 27503 190510 348818 31703 418442
浙 江 Zhejiang 26687 260408 403850 20966 282740
安 徽 Anhui 26687 91077 290249 65599 350206
福 建 Fujian 28400 206806 165098 72819 146406
江 西 Jiangxi 15640 66801 365645 77327 204300
山 东 Shandong 78817 327323 456770 103577 430093
河 南 Henan 60948 108901 511095 118562 263070
湖 北 Hubei 13329 41730 172688 173671 499769
湖 南 Hunan 88463 85206 316770 88614 371322
广 东 Guangdong 272124 292912 447006 117959 354611
广 西 Guangxi 24709 37509 225887 71324 148581
海 南 Hainan 3774 19810 37425 6621 50962
重 庆 Chongqing 80908 17000 119370 16959 161583
四 川 Sichuan 26548 145855 240108 83279 330984
贵 州 Guizhou 6801 16658 108537 38126 111784云 南 Yunnan 15634 102372 144845 96788 121156
西 藏 Tibet 460 5728 396 12340
陕 西 Shaanxi 25089 63657 176306 53792 146855
甘 肃 Gansu 5946 12219 74430 18000 93000
青 海 Qinghai 3000 14800 33800 30000
宁 夏 Ningxia 3500 18000 54000 27000 37543
新 疆 Xinjiang 37600 69600 116300 117000 99100

8/2/2019 China Labour Statistical Yearbook - 2004
http://slidepdf.com/reader/full/china-labour-statistical-yearbook-2004 144/464
2-2 ( )
2-2 ( )
URBAN REGISTERED UNEMPLOYMENT AND UNEMPLOYMENT RATE AT THE REAR-END
城镇失业人数(万人) 比上年增长(%) 失业率
Urban Unemployment(10000 persons) Increase over Preceeding year(%) (%)
年 份 合 计 合 计 Unemployment
Year Total #失业青年 失业青年 Total 失业青年 Rate
Youth Youth Youth
1 9 7 8 530.0 249.1 5.3
1 9 7 9 567.6 258.2 7.1 3.7 5.4
1 9 8 0 541.5 382.5 -4.6 48.1 4.9
1 9 8 1 439.5 343.0 -18.8 -10.3 3.8
1 9 8 2 379.4 293.8 -13.7 -14.3 3.2
1 9 8 3 271.4 222.0 -28.5 -24.4 2.3
1 9 8 4 235.7 195.9 -13.2 -11.8 1.9
1 9 8 5 238.5 196.9 1.2 0.5 1.8
1 9 8 6 264.4 209.3 10.9 6.3 2.0
1 9 8 7 276.6 235.1 4.6 12.3 2.0
1 9 8 8 296.2 245.3 7.1 4.3 2.0
1 9 8 9 377.9 309.0 27.6 26.0 2.6
1 9 9 0 383.2 312.7 1.4 1.2 2.5
1 9 9 1 352.2 288.4 -8.1 -7.8 2.3
1 9 9 2 363.9 299.8 3.3 4.0 2.3
1 9 9 3 420.1 331.9 15.4 10.7 2.6
1 9 9 4 476.4 301.0 13.4 -9.3 2.8
1 9 9 5 519.6 310.2 9.1 3.1 2.9
1 9 9 6 552.8 6.3 3.0
1 9 9 7 576.8 4.3 3.1
1 9 9 8 571.0 -1.0 3.1
1 9 9 9 575.0 0.7 3.1
2 0 0 0 595.0 3.5 3.1
2 0 0 1 681.0 14.4 3.6
2 0 0 2 770.0 13.1 4.0
2 0 0 3 800.0 3.9 4.3

8/2/2019 China Labour Statistical Yearbook - 2004
http://slidepdf.com/reader/full/china-labour-statistical-yearbook-2004 145/464
2-3
2-3
URBAN REGISTERED UNEMPLOYMENT AND UNEMPLOYMENT RATE BY REGION
失业人员(万人) 失业率(%)
Unemployment (10000 persons) Unemployment Rate (%) 地 区 Region
1990 2002 2003 1990 2002 2003
北 京 Beijing 1.7 6.0 7.0 0.4 1.4 1.4
天 津 Tianjin 8.1 12.9 12.0 2.7 3.9 3.8
河 北 Hebei 7.7 22.2 25.7 1.1 3.6 3.9
山 西 Shanxi 5.5 14.5 13.1 1.2 3.4 3.0
内 蒙 古 Inner Mongolia 15.2 16.3 17.6 3.8 4.1 4.5
辽 宁 Liaoning 23.7 75.6 72.0 2.2 6.5 6.5
吉 林 Jilin 10.5 23.8 28.4 1.9 3.6 4.3
黑 龙 江 Heilongjiang 20.4 41.6 35.0 2.2 4.9 4.2
上 海 Shanghai 7.7 28.8 30.1 1.5 4.8 4.9
江 苏 Jiangsu 22.5 42.2 41.8 2.4 4.2 4.1
浙 江 Zhejiang 11.2 27.7 28.3 2.2 4.2 4.2
安 徽 Anhui 15.2 22.6 25.1 2.8 4.0 4.1
福 建 Fujian 9.0 15.0 14.6 2.6 4.2 4.1
江 西 Jiangxi 10.3 17.8 21.6 2.4 3.4 3.6
山 东 Shandong 26.2 39.7 41.3 3.2 3.6 3.6
河 南 Henan 25.1 25.4 26.3 3.3 2.9 3.1
湖 北 Hubei 12.7 44.7 49.3 1.7 4.3 4.3
湖 南 Hunan 15.9 30.4 37.1 2.7 4.0 4.5
广
东Guangdong 19.2 36.5 14.9 2.2 3.1 3.6
广 西 Guangxi 13.9 14.7 3.6 3.9 3.7 3.4
海 南 Hainan 3.5 4.0 16.2 3.0 3.1 4.1
重 庆 Chongqing 16.2 33.1 4.1 4.4
四 川 Sichuan 38.0 33.8 11.2 3.7 4.5 4.0
贵 州 Guizhou 10.7 11.1 12.1 4.1 4.1 4.1
云 南 Yunnan 7.8 9.8 13.9 2.5 4.0 3.5
西 藏 Tibet 1.3 9.3 4.9 3.4
陕 西 Shaanxi 11.2 13.5 3.1 2.8 3.3 3.8
甘 肃 Gansu 12.5 8.7 3.8 4.9 3.2 4.4
青 海 Qinghai 4.2 2.9 9.9 5.6 3.6 3.5
宁 夏 Ningxia 4.0 3.5 2.8 5.4 4.4 3.0
新 疆 Xinjiang 9.6 9.9 35.5 3.0 3.7 2.9
新疆生产建设兵团 Xinjiang Production and Construction Crops 2.8 3.1

8/2/2019 China Labour Statistical Yearbook - 2004
http://slidepdf.com/reader/full/china-labour-statistical-yearbook-2004 146/464
2-4
2-4
BASIC CONDITIONS OF URBAN REGISTERED UNEMPLOYMENT BY REGION
(2003)
单位:人 (person)
上年末结 本年新登 本年失业人
转登记失 记的失业 女 性 由就业转 员就业人数 女 性
业 人 员 人 数 Female 失业人数 Employment Female
地 区 Region Unemployment Unemployment Unemploy- from the
at Last Newly Regis- Unemployed
Year-end tered This Year Employed This Year
北 京 Beijing 60152 203123 86866 138059 179240 74777
天 津 Tianjin 128993 76071 39557 56043 84800 41552
河 北 Hebei 221642 248957 117278 105552 203818 76518
山 西 Shanxi 145243 111245 36777 26140 125974 50027
内 蒙 古 Inner Mongolia 162671 244084 109172 105785 215118 101254
辽 宁 Liaoning 755715 848496 365081 668211 729504 349769
吉 林 Jilin 238160 268731 123656 106068 222567 105541
黑 龙 江 Heilongjiang 416103 314135 163784 127020 380456 161205
上 海 Shanghai 287807 488445 205057 408844 448574 196751
江 苏 Jiangsu 421650 607656 290590 408169 532430 263037
浙 江 Zhejiang 277306 392841 183754 219802 356024 168013
安 徽 Anhui 234351 331993 164098 193645 296621 142485
福 建 Fujian 149647 251793 115539 91703 250270 116977
江 西 Jiangxi 177572 306696 143628 63592 264697 122499
山 东 Shandong 397434 669491 318185 269191 632290 302545
河 南 Henan 253993 233784 115656 117370 213590 102418
湖 北 Hubei 446627 495056 258662 172939 446955 201956
湖 南 Hunan 303905 300799 145979 129511 260286 125108
广 东 Guangdong 147116 239565 119507 99024 223898 114501
广 西 Guangxi 39959 33711 22004 11133 37218 11899
海 南 Hainan 161775 137670 66626 72253 109942 59277
重 庆 Chongqing 338165 433472 205344 258704 381456 172290
四 川 Sichuan 110843 128542 63345 38121 123033 58640
贵 州 Guizhou 98035 188346 89156 95777 164839 73987
云 南 Yunnan 135094 142986 94550 48117 138590 67680
西 藏 Tibet 86559 110310 53967 52125 103372 46502
陕 西 Shaanxi 28534 47591 21496 26399 45382 18995
甘 肃 Gansu 35408 47171 22439 15055 45036 20830
青 海 Qinghai 98972 224998 100358 76971 225235 90265
宁 夏 Ningxia 27876 17300 8787 12536 16293 9778
新 疆 Xinjiang 364946 716657 326127 356337 679145 324736
2-4 1 continued
单位:人 ( person)
本年末实 本年末从业 登 记
有登记失 女 性 长期失 人员 总 数 失业率
业 人 数 Female 业 者 Total (%)
Unemployment Long-term Number of Unemployment
地 区 Region at the Unemployment Employment Rate
Year-end This Year
北 京 Beijing 69579 28707 39245 4804801 1.4
天 津 Tianjin 120264 62537 48106 3040000 3.8
河 北 Hebei 256917 124008 69161 6330705 3.9
山 西 Shanxi 130514 39196 44000 4234525 3.0
内 蒙 古 Inner Mongolia 175889 93556 77514 3767811 4.5

8/2/2019 China Labour Statistical Yearbook - 2004
http://slidepdf.com/reader/full/china-labour-statistical-yearbook-2004 147/464
辽 宁 Liaoning 720049 459809 43202 10319000 6.5
吉 林 Jilin 284324 138977 96328 6356000 4.3
黑 龙 江 Heilongjiang 349782 178456 84296 7883542 4.2
上 海 Shanghai 301134 122533 205207 5820000 4.9
江 苏 Jiangsu 418448 221545 212786 9834700 4.1
浙 江 Zhejiang 282740 135711 174510 6460624 4.2
安 徽 Anhui 251477 135195 111790 5926348 4.1
福 建 Fujian 146218 69491 78799 3455400 4.1
江 西 Jiangxi 216198 94299 42147 5791700 3.6
山 东 Shandong 412792 204926 209504 10900000 3.6
河 南 Henan 263070 117557 85297 8134010 3.1
湖 北 Hubei 493498 259087 108012 10961042 4.3
湖 南 Hunan 371322 142180 101516 7944071 4.5
广 东 Guangdong 148581 72300 56165 4015329 3.6
广 西 Guangxi 36452 16801 12136 1035666 3.4
海 南 Hainan 161583 80184 86151 3791250 4.1
重 庆 Chongqing 330984 157239 128146 7120000 4.4四 川 Sichuan 111784 49509 35114 2648847 4.0
贵 州 Guizhou 121156 59377 56393 2844519 4.1
云 南 Yunnan 139490 61587 59114 3846851 3.5
西 藏 Tibet 93095 46677 34981 2659043 3.4
陕 西 Shaanxi 30743 17057 17193 788655 3.8
甘 肃 Gansu 37543 15462 10912 806580 4.4
青 海 Qinghai 99135 46750 31361 2765585 3.5
宁 夏 Ningxia 28414 14424 13718 929225 3.0
新 疆 Xinjiang 354611 161687 136839 12046153 2.9

8/2/2019 China Labour Statistical Yearbook - 2004
http://slidepdf.com/reader/full/china-labour-statistical-yearbook-2004 148/464
2-5
2-5
URBAN EMPLOYMENT AND REGISTERED UNEMPLOYMENT BY CITY
(2003)
城镇从业人员年 年末尚有失业人 登记失业率
末人数(万人) 员人数(万人) (%)
城市名称 City Urban Employment Unemployment Unemployment
(10000 persons) at the Year-end Rate
(10000 persons)
石 家 庄 Shijiazhuang 88.8 2.6 2.9
太 原 Taiyuan 109.8 4.0 3.5
呼和浩特 Huhhot 60.5 2.3 3.7
大 连 Dalian 189.5 9.9 5.0
长 春 Changchun 160.0 5.7 3.4
南 京 Nanjing 150.0 6.5 4.2
杭 州 Hangzhou 154.5 7.1 4.4
合 肥 Hefei 71.6 3.3 4.4
福 州 Fuzhou 75.5 2.5 3.2
南 昌 Nanchang 95.4 3.3 3.3
济 南 Jinan 142.2 5.6 3.8
郑 州 Zhengzhou 108.5 3.2 2.8
武 汉 Wuhan 246.4 12.0 4.6
长 沙 Changsha 119.3 5.2 4.2
广 州 Guangzhou 262.5 7.3 2.7
贵 阳 Guiyang 76.5 3.1 3.9
昆 明 Kunming 74.2 1.9 2.5
兰 州 Lanzhou 63.8 1.9 2.9
西 宁 Xining 44.5 1.8 3.8
银 川 Yingchuan 34.8 1.2 3.1
乌鲁木齐 Urumqi 60.5 2.3 3.7
宁 波 Ningbo 97.9 4.1 4.0
厦 门 Xiamen 42.0 1.9 4.3
青 岛 Qingdao 184.7 7.2 3.8
深 圳 Shenzhen 81.8 2.2 2.6

8/2/2019 China Labour Statistical Yearbook - 2004
http://slidepdf.com/reader/full/china-labour-statistical-yearbook-2004 149/464
2-6
2-6
HISTORIC FIGURES OF LAID-OFF WORKERS IN STATE-OWNED ENTERPRISES JOINT
STATE-STATE ENTERPRISES AND COMPANIES WITH SOLE STATE OWNERSHIP AT TEAR-END
BY REGION
单位: 万人 (10000 persons)
年末实有下岗职工人数 Laid-off Workers at this Year-end
地 区 Region
1 9 9 8 1 9 9 9 2 0 0 0 2 0 0 1 2 0 0 2 2 0 0 3
National 594.8 652.5 657.2 515.4 409.9 260.2
北 京 Beijing 5.7 2.9 6.7 1.6
天 津 Tianjin 6.0 14.8 12.1 7.1 8.0
河 北 Hebei 18.3 20.7 20.8 23.6 26.8 25.7
山 西 Shanxi 18.0 20.9 22.3 18.0 19.2 19.5
内 蒙 古 Inner Mongolia 14.9 13.1 10.0 7.9 2.5 2.0
辽 宁 Liaoning 58.9 70.8 67.2 37.0 7.4
吉 林 Jilin 34.0 34.4 41.9 27.4 19.3 6.7
黑 龙 江 Heilongjiang 52.8 74.1 69.9 49.1 44.2 34.1
上 海 Shanghai 10.8 11.1 5.6 0.5
江 苏 Jiangsu 24.5 17.6 14.4 8.4 1.9 0.5
浙 江 Zhejiang 11.4 6.5 3.6 1.3 0.3
安 徽 Anhui 24.9 30.6 25.2 16.4 7.1 3.1
福 建 Fujian 3.1 2.9 2.0 1.2
江 西 Jiangxi 24.7 26.2 32.4 34.4 30.1 23.7
山 东 Shandong 18.4 14.9 13.2 4.9 1.7
河 南 Henan 25.5 28.8 30.1 25.9 25.0 17.5
湖 北 Hubei 38.6 45.5 50.7 48.1 46.7 32.2
湖 南 Hunan 48.1 52.5 50.0 49.1 42.1 19.5
广 东 Guangdong 23.4 16.8 10.1 4.3 0.5
广 西 Guangxi 7.1 12.8 15.7 10.9 5.3 1.2
海 南 Hainan 7.1 3.9 2.5 2.0 0.8 0.3
重 庆 Chongqing 11.1 13.5 14.5 13.0 11.3 0.9
四 川 Sichuan 28.8 29.9 38.7 36.3 31.3 13.6
贵 州 Guizhou 10.6 11.0 12.0 9.1 9.6 8.8
云 南 Yunnan 5.5 5.9 5.6 5.4 3.6 2.5
西 藏 Tibet 0.1
陕 西 Shaanxi 30.6 32.5 28.8 29.8 29.2 24.9
甘 肃 Gansu 13.7 15.7 18.2 16.6 15.0 11.4
青 海 Qinghai 3.8 6.1 9.5 6.6 5.3 3.4
宁 夏 Ningxia 3.4 4.0 4.3 4.0 2.7 1.8
新 疆 Xinjiang 7.6 8.7 9.6 8.7 7.8 4.2
新疆生产建设兵团 Xinjiang Production and Construction Crops 3.6 3.4 9.4 6.4 5.2 2.8

8/2/2019 China Labour Statistical Yearbook - 2004
http://slidepdf.com/reader/full/china-labour-statistical-yearbook-2004 150/464
2-7
BASIC CONDITION OF LAID-OFF WORKERS OF ENTERPRISES
2003
单位:万人 (10000 persons)
上年末结转 本年新增 本年减少下 年末实有下
下岗职工 下岗职工 岗职工人数 岗职工人数 男性 女性
Laid-off 人数 Laid-off Laid-off Male 50岁以上 Female 40 岁以上
Workers Laid-off Workers Workers50 Years and
over
40 Years and
over
at Last Workers Decreased At this
Year-end Newly this Year Year-end
Added
this Year
National 614.9 127.9 322.1 420.7 232.6 74.0 188.0 72.
一、国有企业、 State-owned Enterprises, 406.2 103.0 249.0 260.2 146.4 47.2 113.8 45.
国有联营企业、 Joint State-State
国有独资公司 Enterprises, Companies
With Sole State Ownership
#国有企业 State-Owned Enterprises 394.0 96.2 238.8 251.4 140.4 46.2 111.0 43.
#中央直属企业 Enterprises Directly Under 37.7 3.2 16.8 24.1 13.7 4.5 10.5 4.
Central Government
#亏损企业 Deficit Enterprises 318.1 50.6 172.9 195.8 110.6 36.5 85.2 32.
二、城镇集体企业Urban Collective-owned 188.0 21.5 65.2 144.3 78.0 24.3 66.4 25.Enterprises
三、其他企业 Other Enterprises 20.7 3.4 7.9 16.1 8.3 2.5 7.9 2.

8/2/2019 China Labour Statistical Yearbook - 2004
http://slidepdf.com/reader/full/china-labour-statistical-yearbook-2004 151/464
2-8
LAID-OFF WORKERS OF ENTERPRISES BY REGION
(2003)
单位:万人 (10000 persons)
上年末结 本年新增 本年减少
转下岗职 下岗职工 下岗职工
工 人 数 人 数 人 数
Laid-off Laid-off Laid-off
Workers Workers workers
at Last Newly Decreased
Year-end Added this Year
this
地 区 Region
Year
National 614.9 127.9 322.1
北 京 Beijing 天 津 Tianjin 14.6 1.5 9.9
河 北 Hebei 36.8 13.1 17.2
山 西 Shanxi 23.5 14.2 13.6
内 蒙 古 Inner Mongolia 2.5 0.5
辽 宁 Liaoning 44.6 4.3 32.6
吉 林 Jilin 24.7 13.6
黑 龙 江 Heilongjiang 69.9 41.9 50.5
上 海 Shanghai
江 苏 Jiangsu 2.6 2.0
浙 江 Zhejiang 0.3 0.3
安 徽 Anhui 16.4 0.3 8.0
福 建 Fujian
江 西 Jiangxi 33.9 16.0 22.8
山 东 Shandong 3.0 3.0
河 南 Henan 49.4 8.2 17.7
湖 北 Hubei 66.8 17.8 39.1
湖 南 Hunan 66.9 28.7
广 东 Guangdong 6.8 0.5 1.1
广 西 Guangxi 5.9 4.4
海 南 Hainan 0.9 0.6
重 庆 Chongqing 17.7 4.1 15.6
四 川 Sichuan 37.4 2.5 23.0
贵 州 Guizhou 11.6 2.1 2.5
云 南 Yunnan 4.8 1.2
西 藏 Tibet
陕 西 Shanxi 35.9
甘 肃 Gansu 16.7 3.9
青 海 Qinghai 5.3 1.8
宁 夏 Ningxia 3.0 0.7 1.8新 疆 Xinjiang 7.8 0.7 4.4
新疆生产建设兵团 Xinjiang Production
and Construction Crops 5.2 2.3

8/2/2019 China Labour Statistical Yearbook - 2004
http://slidepdf.com/reader/full/china-labour-statistical-yearbook-2004 152/464
2-8 continued
单位:万人 (10000 persons)
年末实有
下岗职工 男性 女性
人 数 Male 50 岁以上 Female 40 岁以上
Laid-off
Workers
50 Years and
over40 Years and over
at this
地 区 Region
Year-end
National 420.7 232.6 74.0 188.0 72.9
北 京 Beijing
天 津 Tianjin 6.2 3.8 2.4
河 北 Hebei 32.7 18.8 4.8 14.0 5.1
山 西 Shanxi 24.1 14.2 3.6 9.9 3.3
内 蒙 古 Inner Mongolia 2.0 1.2 0.5 0.8 0.4
辽 宁 Liaoning 16.3 8.9 2.7 7.4 2.7
吉 林 Jilin 11.1 6.8 0.8 4.2 1.1
黑 龙 江 Heilongjiang 61.3 32.6 9.7 28.8 11.8
上 海 Shanghai
江 苏 Jiangsu 0.6 0.2 0.1 0.4 0.2
浙 江 Zhejiang
安 徽 Anhui 8.6 4.9 1.1 3.7 1.2
福 建 Fujian
江 西 Jiangxi 27.1 15.2 4.9 12.0 4.4
山 东 Shandong
河 南 Henan 39.9 22.3 5.8 17.6 5.6
湖 北 Hubei 45.6 22.2 10.0 23.4 12.4
湖 南 Hunan 38.2 20.8 8.2 17.4 6.5
广 东 Guangdong 6.1 3.5 1.5 2.6 1.4
广 西 Guangxi 1.5 0.9 0.3 0.6 0.3
海 南 Hainan 0.4 0.3 0.1 0.1 0.1
重 庆 Chongqing 6.2 4.1 1.9 2.1 1.1
四 川 Sichuan 16.8 9.5 2.6 7.4 2.7
贵 州 Guizhou 11.2 6.4 1.7 4.8 1.9
云 南 Yunnan 3.6 2.0 0.7 1.6 0.5
西 藏 Tibet
陕 西 Shanxi 35.9 21.0 10.1 14.9 7.0
甘 肃 Gansu 12.8 6.8 1.8 6.0 1.8
青 海 Qinghai 3.4 2.0 0.2 1.4 0.4
宁 夏 Ningxia 2.0 1.0 0.2 1.0 0.3
新 疆 Xinjiang 4.2 2.0 0.3 2.1 0.4
新 疆 生 产 建 设 兵 团
Xinjiang Production and
Construction Crops
2.8 1.3 0.2 1.5 0.3

8/2/2019 China Labour Statistical Yearbook - 2004
http://slidepdf.com/reader/full/china-labour-statistical-yearbook-2004 153/464
2-9
LAID-OFF WORKERS IN STATE-OWNED ENTERPRISES JOINT STATE-STATE
ENTERPRISES AND COMPANIES WITH SOLE STATE OWNERSHIP BY REGION
2003单位:万人 (10000 persons)
上年末结 本年新增 本年减少
转下岗职 下岗职工 进入再就 下岗职工 从再就业服务
工人数 人数 业服务中 人数 中心转出人数 #解除终止劳
Laid-off Laid-off 心人数 Laid-off Number of 动关系人数
Workers Workers In Re- workers Persons Trans- Number of
on Last Newly emplo- Decreased ferred Re-empl- Persons
Year-end Added yment this Year oyment Service Termina-
this Service Centers ted Labour
地 区 Region
Year Centers this Year Contracts
National 406.2 103.0 21.7 249.0 153.6 72.3
北 京 Beijing
天 津 Tianjin 8.0 8.0 4.0 2.6
河 北 Hebei 27.3 12.5 2.3 14.0 10.5 0.8
山 西 Shanxi 19.2 13.4 5.6 13.0 8.5 1.1
内 蒙 古 Inner Mongolia 2.5 0.5 0.5 0.1
辽 宁 Liaoning 7.4 1.5 8.8 4.3 3.7
吉 林 Jilin 19.3 12.6 12.1 3.1
黑 龙 江 Heilongjiang 44.2 37.1 47.2 2.7 1.1
上 海 Shanghai
江 苏 Jiangsu 1.9 1.4 1.4 0.8
浙 江 Zhejiang 0.3 0.3 0.3
安 徽 Anhui 7.1 3.9 3.9 2.4
福 建 Fujian
江 西 Jiangxi 30.1 13.7 20.1 6.2 1.6
山 东 Shandong 1.7 1.7 1.6 0.6
河 南 Henan 25.4 4.9 3.0 12.8 12.1 1.5
湖 北 Hubei 46.7 12.8 6.9 27.3 14.3 10.7
湖 南 Hunan 42.1 22.7 20.0 3.4
广 东 Guangdong 0.5 0.5 0.5 0.1
广 西 Guangxi 5.3 4.1 4.1 3.1
海 南 Hainan 0.8 0.5 0.5 0.1
重 庆 Chongqing 11.3 2.9 2.9 13.3 13.3 13.3
四 川 Sichuan 31.3 1.3 19.1 16.6 11.6
贵 州 Guizhou 9.6 1.5 0.2 2.2 1.8 0.6
云 南 Yunnan 3.6 1.2 1.2 0.5
西 藏 Tibet
陕 西 Shaanxi 24.9
甘 肃 Gansu 15.0 3.7 3.6 1.1
青 海 Qinghai 5.3 1.8 1.8 1.7
宁 夏 Ningxia 2.7 0.7 1.7 1.2 0.9
新 疆 Xinjiang 7.8 0.7 0.7 4.3 4.3 4.2
新疆生产建设兵团 Xinji 5.2 2.3 2.3 1.6

8/2/2019 China Labour Statistical Yearbook - 2004
http://slidepdf.com/reader/full/china-labour-statistical-yearbook-2004 154/464
2-9 1 continued
单位:万人 (10000 persons)
年末实有
下岗职工 男性
#再就业 # 协议到期 人 数 Male 50 岁以上
人 数 人 数 # 再就业 # 登记失 Laid-off
Re-em- End the 人 数 业人数 Workers50 Years and over
ployed Duration Re-em- Unemp- at this
of Re-emp- ployed oyment Year-end
loyment Regis-
地 区 Region
Agreement tered
National 85.3 98.5 51.0 18.6 260.2 146.4 47.2
北 京 Beijing
天 津 Tianjin 2.1 3.8 2.0 1.6
河 北 Hebei 4.7 5.9 1.5 0.5 25.7 15.2 3.9
山 西 Shanxi 5.6 3.0 1.6 0.2 19.5 11.7 3.1
内 蒙 古 Inner Mongolia 0.5 0.4 0.4 2.0 1.2 0.5
辽 宁 Liaoning 0.7 1.1
吉 林 Jilin 4.4 10.8 3.8 1.0 6.7 3.8 0.6
黑 龙 江 Heilongjiang 1.0 2.7 1.0 34.1 19.1 5.7
上 海 Shanghai
江 苏 Jiangsu 0.8 1.1 0.6 0.3 0.5 0.2 0.1
浙 江 Zhejiang
安 徽 Anhui 2.3 3.6 2.0 1.1 3.1 2.0 0.2
福 建 Fujian
江 西 Jiangxi 2.9 5.8 2.8 0.8 23.7 13.7 4.5
山 东 Shandong 0.5 0.7 0.3 0.5
河 南 Henan 11.3 7.8 7.1 0.5 17.5 9.9 2.3
湖 北 Hubei 7.7 8.7 7.3 1.1 32.2 15.7 7.1
湖 南 Hunan 9.7 14.5 6.7 1.7 19.5 10.8 4.8
广 东 Guangdong
广 西 Guangxi 3.1 2.7 1.5 1.1 1.2 0.7 0.3
海 南 Hainan 0.2 0.3 0.1 0.3 0.2 0.1
重 庆 Chongqing 5.5 7.8 1.5 4.4 0.9 0.6 0.3
四 川 Sichuan 12.0 9.1 6.1 1.1 13.6 7.9 2.2
贵 州 Guizhou 0.9 1.3 0.4 0.2 8.8 5.2 1.3
云 南 Yunnan 0.5 0.7 0.5 0.1 2.5 1.6 0.7西 藏 Tibet
陕 西 Shaanxi 24.9 14.6 7.0
甘 肃 Gansu 2.8 1.0 0.8 0.1 11.4 6.3 1.7
青 海 Qinghai 1.6 3.4 2.0 0.2
宁 夏 Ningxia 0.7 0.5 0.2 0.2 1.8 0.9 0.2
新 疆 Xinjiang 1.8 3.3 1.2 1.9 4.2 2.0 0.3
新疆生产建设兵团 Xinjiang
Production and Construction Crops 2.1 1.9 1.7 0.2 2.8 1.3 0.2

8/2/2019 China Labour Statistical Yearbook - 2004
http://slidepdf.com/reader/full/china-labour-statistical-yearbook-2004 155/464
2-9 2 continued
单位:万人 (10000 persons)
女性 进入再就
Female 40 岁以上 业服务中 签协议
心人数 人 数 足额发生活 足额代缴40 Years and over
In Re- Person 费人数 保险费人数
employment
signed All Basic
Service Re-empl- Living
Centers oyment Expenses
地 区 Region
Agreement Received
All Social Insurance Funds Contributed by Units
National 113.8 45.0 195.0 195.0 195.0 195.0
北 京 Beijing
天 津 Tianjin
河 北 Hebei 10.6 3.4 15.8 15.8 15.8 15.8
山 西 Shanxi 7.9 2.6 15.0 15.0 15.0 15.0
内 蒙 古 Inner Mongo 0.8 0.4 2.0 2.0 2.0 2.0
辽
宁Liaoning
吉 林 Jilin 2.9 0.7 2.9 2.9 2.9 2.9
黑 龙 江 Heilongjian 15.0 6.8 17.4 17.4 17.4 17.4
上 海 Shanghai
江 苏 Jiangsu 0.3 0.2 0.5 0.5 0.5 0.5
浙 江 Zhejiang
安 徽 Anhui 1.2 0.3 3.1 3.1 3.1 3.1
福 建 Fujian
江 西 Jiangxi 10.0 3.8 12.3 12.3 12.3 12.3
山 东 Shandong
河 南 Henan 7.6 2.2 16.3 16.3 16.3 16.3
湖 北 Hubei 16.5 8.7 20.1 20.1 20.1 20.1
湖 南 Hunan 8.7 3.3 19.5 19.5 19.5 19.5
广 东 Guangdong
广 西 Guangxi 0.5 0.2 1.2 1.2 1.2 1.2
海 南 Hainan 0.1 0.1 0.3 0.3 0.3 0.3
重 庆 Chongqing 0.3 0.2 0.9 0.9 0.9 0.9
四 川 Sichuan 5.7 2.2 10.9 10.9 10.9 10.9
贵 州 Guizhou 3.6 1.4 6.3 6.3 6.3 6.3
云 南 Yunnan 0.9 0.5 2.5 2.5 2.5 2.5
西 藏 Tibet
陕 西 Shaanxi 10.3 4.9 24.9 24.9 24.9 24.9
甘 肃 Gansu 5.1 1.6 11.0 11.0 11.0 11.0
青 海 Qinghai 1.4 0.4 3.4 3.4 3.4 3.4
宁 夏 Ningxia 0.9 0.3 0.6 0.6 0.6 0.6
新 疆 Xinjiang 2.1 0.4 4.2 4.2 4.2 4.2
新疆生产建设兵团
Xinjiang Production
and Construction Crops
1.5 0.3 2.8 2.8 2.8 2.8

8/2/2019 China Labour Statistical Yearbook - 2004
http://slidepdf.com/reader/full/china-labour-statistical-yearbook-2004 156/464
2-10
LAID-OFF WORKERS IN STATE-OWNED ENTERPRISES BY REGION
(2003)
单位:万人 (10000 persons)
上年末结 本年新增 本年减少
转下岗职 下岗职工 进入再就 下岗职工 从再就业服务
工 人 数 人 数 业服务中 人 数 中心转出人数 #解除终止劳
Laid-off Laid-off 心 人 数 Laid-off Number of 动关系人数
Workers Workers In Re- workers Persons Trans- Number of
at Last Newly emplo- Decreased ferred Re-empl- Persons
Year-end Added yment this Year oyment Service Terminated
this Service Centers Labour
地 区 Region
Year Centers this Year Contracts
National 394.0 96.2 20.7 238.8 148.6 69.2
北 京 Beijing 天 津 Tianjin 8.0 8.0 3.9 2.6
河 北 Hebei 27.1 12.1 2.0 13.9 10.5 0.8
山 西 Shanxi 17.6 8.2 5.5 9.8 8.1 1.1
内 蒙 古 Inner Mongo 2.5 0.5 0.5 0.1
辽 宁 Liaoning 7.4 1.5 8.8 2.9 2.3
吉 林 Jilin 19.3 12.6 12.1 3.1
黑 龙 江 Heilongjian 44.2 37.1 47.2 2.7 1.1
上 海 Shanghai
江 苏 Jiangsu 1.6 1.3 1.3 0.8
浙 江 Zhejiang
安 徽 Anhui 6.3 3.5 3.5 2.1
福 建 Fujian
江 西 Jiangxi 30.1 13.7 20.1 6.2 1.6
山 东 Shandong 1.7 1.7 1.4 0.5
河 南 Henan 23.5 4.9 3.0 12.0 11.2 1.4
湖 北 Hubei 42.5 11.6 6.3 24.8 13.0 9.7
湖 南 Hunan 39.5 20.0 20.0 3.4
广 东 Guangdong 0.5 0.5 0.5 0.1
广 西 Guangxi 5.3 4.1 4.1 3.1
海 南 Hainan 0.8 0.5 0.5 0.1
重 庆 Chongqing 11.3 2.9 2.9 13.3 13.3 13.3
四 川 Sichuan 31.2 1.3 19.0 16.5 11.6
贵 州 Guizhou 9.6 1.5 0.2 2.2 1.8 0.6
云 南 Yunnan 3.4 1.1 1.1 0.4
西 藏 Tibet
陕 西 Shaanxi 24.9
甘 肃 Gansu 15.0 3.7 3.6 1.1
青 海 Qinghai 5.3 1.8 1.8 1.7
宁 夏 Ningxia 2.7 0.7 1.7 1.2 0.9新 疆 Xinjiang 7.8 0.7 0.7 4.3 4.3 4.2
新疆生产建设兵团 5.2 2.3 2.3 1.6

8/2/2019 China Labour Statistical Yearbook - 2004
http://slidepdf.com/reader/full/china-labour-statistical-yearbook-2004 157/464
2-10 1 continued
单位:万人 (10000 persons)
年末实有
下岗职工 男性
#再就业 # 协议到期 人 数 Male 50 岁以上
人 数 人 数 # 再就业 # 登记失 Laid-off
地 区 Region Re-em- End the 人 数 业人数 Workers
50 Years and
over
ployed Duration Re-em- Unemp- at this
of Re-emp- ployed oyment Year-end
loyment Regis-
Agreement tered
National 83.1 96.3 49.1 18.0 251.4 140.4 46.2
北 京 Beijing
天 津 Tianjin 2.1 3.5 1.6 1.4
河 北 Hebei 4.7 5.9 1.5 0.5 25.3 14.9 3.8
山 西 Shanxi 5.2 2.8 1.4 0.2 16.0 8.3 3.0
内 蒙 古 Inner Mongolia 0.5 0.4 0.4 2.0 1.2 0.5
辽 宁 Liaoning 0.7 1.1
吉 林 Jilin 4.4 10.8 3.8 1.0 6.7 3.8 0.6
黑 龙 江 Heilongjiang 1.0 2.7 1.0 34.1 19.1 5.7
上 海 Shanghai
江 苏 Jiangsu 0.8 1.1 0.6 0.3 0.3 0.1 0.1
浙 江 Zhejiang
安 徽 Anhui 2.1 3.3 1.8 1.1 2.7 1.8 0.2
福 建 Fujian
江 西 Jiangxi 2.9 5.8 2.8 0.8 23.7 13.7 4.5
山 东 Shandong 0.4 0.6 0.2 0.4
河 南 Henan 10.4 7.3 6.7 0.4 16.4 9.4 2.2
湖 北 Hubei 7.0 7.9 6.6 1.0 29.3 14.3 6.4
湖 南 Hunan 9.7 14.5 6.7 1.7 19.5 10.8 4.8
广 东 Guangdong
广 西 Guangxi 3.1 2.7 1.5 1.1 1.2 0.7 0.3
海 南 Hainan 0.2 0.2 0.1 0.3 0.2 0.1
重 庆 Chongqing 5.5 7.8 1.5 4.4 0.9 0.6 0.3
四 川 Sichuan 12.0 9.0 6.1 1.1 13.5 7.8 2.2
贵 州 Guizhou 0.9 1.3 0.4 0.2 8.8 5.2 1.3
云 南 Yunnan 0.5 0.7 0.5 0.1 2.3 1.5 0.6
西 藏 Tibet
陕 西 Shaanxi 24.9 14.6 7.0
甘 肃 Gansu 2.8 1.0 0.8 0.1 11.4 6.3 1.7
青 海 Qinghai 1.6 3.4 2.0 0.2
宁 夏 Ningxia 0.7 0.5 0.2 0.2 1.8 0.9 0.2
新 疆 Xinjiang 1.8 3.3 1.2 1.9 4.2 2.0 0.3
新疆生产建设兵团 Xinjiang
Production and Construction Crops 2.1 1.9 1.7 0.2 2.8 1.3 0.2
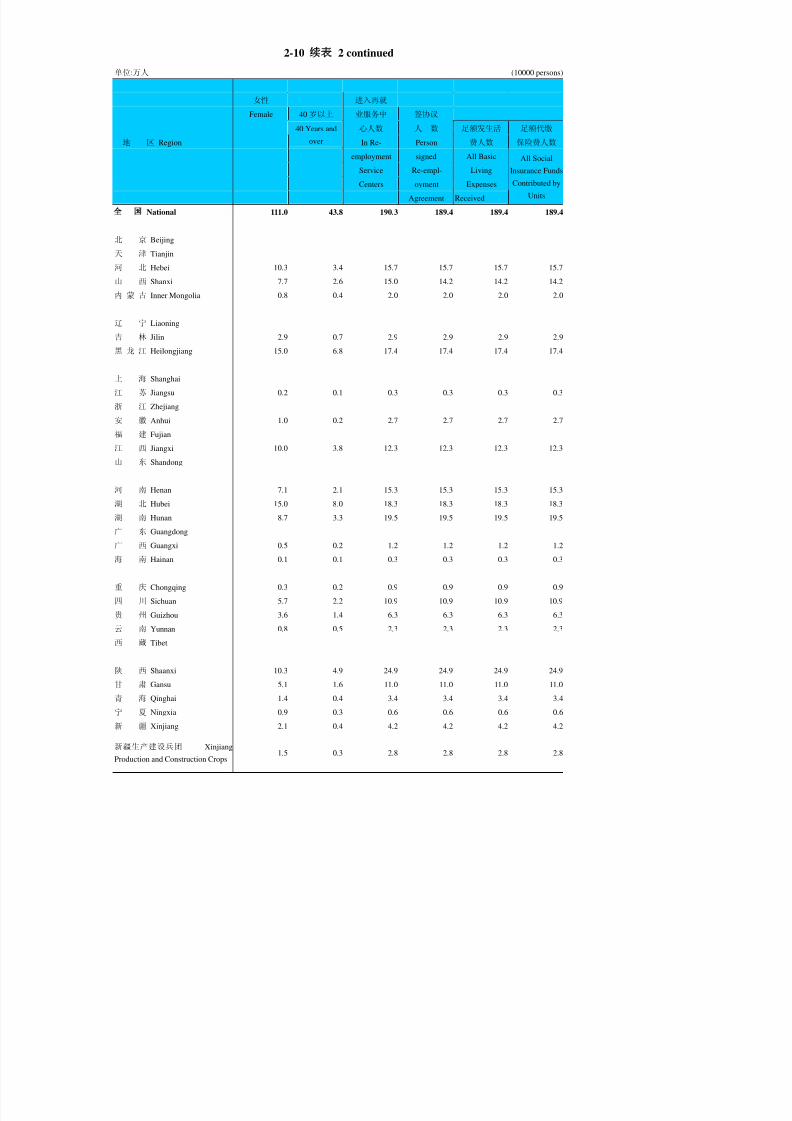
8/2/2019 China Labour Statistical Yearbook - 2004
http://slidepdf.com/reader/full/china-labour-statistical-yearbook-2004 158/464
2-10 2 continued
单位:万人 (10000 persons)
女性 进入再就
Female 40 岁以上 业服务中 签协议
心人数 人 数 足额发生活 足额代缴
地 区 Region
40 Years and
over In Re- Person 费人数 保险费人数
employment signed All Basic
Service Re-empl- Living
Centers oyment Expenses
Agreement Received
All Social
Insurance Funds
Contributed by
Units
National 111.0 43.8 190.3 189.4 189.4 189.4
北 京 Beijing
天 津 Tianjin
河 北 Hebei 10.3 3.4 15.7 15.7 15.7 15.7
山 西 Shanxi 7.7 2.6 15.0 14.2 14.2 14.2
内 蒙 古 Inner Mongolia 0.8 0.4 2.0 2.0 2.0 2.0
辽 宁 Liaoning
吉 林 Jilin 2.9 0.7 2.9 2.9 2.9 2.9
黑 龙 江 Heilongjiang 15.0 6.8 17.4 17.4 17.4 17.4
上 海 Shanghai
江 苏 Jiangsu 0.2 0.1 0.3 0.3 0.3 0.3
浙 江 Zhejiang
安 徽 Anhui 1.0 0.2 2.7 2.7 2.7 2.7
福 建 Fujian
江 西 Jiangxi 10.0 3.8 12.3 12.3 12.3 12.3
山 东 Shandong
河 南 Henan 7.1 2.1 15.3 15.3 15.3 15.3
湖 北 Hubei 15.0 8.0 18.3 18.3 18.3 18.3
湖 南 Hunan 8.7 3.3 19.5 19.5 19.5 19.5
广 东 Guangdong
广 西 Guangxi 0.5 0.2 1.2 1.2 1.2 1.2
海 南 Hainan 0.1 0.1 0.3 0.3 0.3 0.3
重 庆 Chongqing 0.3 0.2 0.9 0.9 0.9 0.9
四 川 Sichuan 5.7 2.2 10.9 10.9 10.9 10.9
贵 州 Guizhou 3.6 1.4 6.3 6.3 6.3 6.3
云 南 Yunnan 0.8 0.5 2.3 2.3 2.3 2.3西 藏 Tibet
陕 西 Shaanxi 10.3 4.9 24.9 24.9 24.9 24.9
甘 肃 Gansu 5.1 1.6 11.0 11.0 11.0 11.0
青 海 Qinghai 1.4 0.4 3.4 3.4 3.4 3.4
宁 夏 Ningxia 0.9 0.3 0.6 0.6 0.6 0.6
新 疆 Xinjiang 2.1 0.4 4.2 4.2 4.2 4.2
新疆生产建设兵团 Xinjiang
Production and Construction Crops 1.5 0.3 2.8 2.8 2.8 2.8
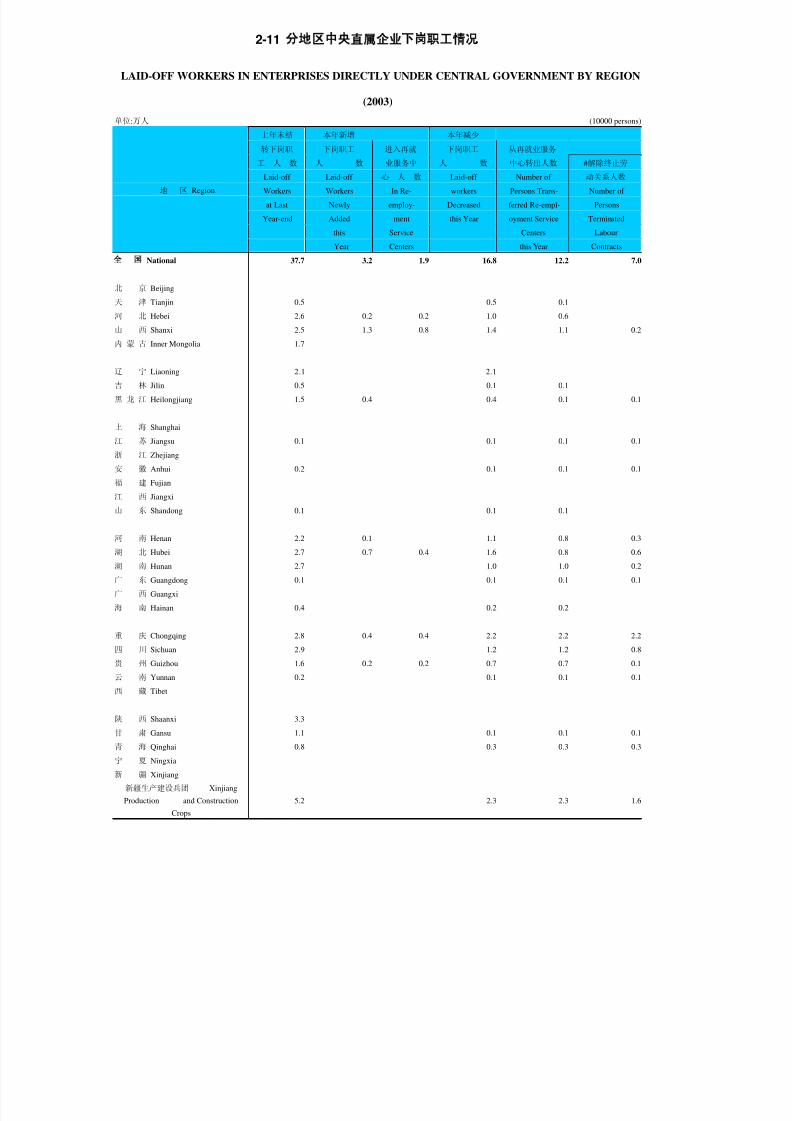
8/2/2019 China Labour Statistical Yearbook - 2004
http://slidepdf.com/reader/full/china-labour-statistical-yearbook-2004 159/464
2-11
LAID-OFF WORKERS IN ENTERPRISES DIRECTLY UNDER CENTRAL GOVERNMENT BY REGION
(2003)
单位:万人 (10000 persons)
上年末结 本年新增 本年减少
转下岗职 下岗职工 进入再就 下岗职工 从再就业服务
工 人 数 人 数 业服务中 人 数 中心转出人数 #解除终止劳
Laid-off Laid-off 心 人 数 Laid-off Number of 动关系人数
Workers Workers In Re- workers Persons Trans- Number of
at Last Newly employ- Decreased ferred Re-empl- Persons
Year-end Added ment this Year oyment Service Terminated
this Service Centers Labour
地 区 Region
Year Centers this Year Contracts
National 37.7 3.2 1.9 16.8 12.2 7.0
北 京 Beijing
天 津 Tianjin 0.5 0.5 0.1
河 北 Hebei 2.6 0.2 0.2 1.0 0.6
山 西 Shanxi 2.5 1.3 0.8 1.4 1.1 0.2
内 蒙 古 Inner Mongolia 1.7
辽 宁 Liaoning 2.1 2.1
吉 林 Jilin 0.5 0.1 0.1
黑 龙 江 Heilongjiang 1.5 0.4 0.4 0.1 0.1
上 海 Shanghai
江 苏 Jiangsu 0.1 0.1 0.1 0.1
浙 江 Zhejiang
安 徽 Anhui 0.2 0.1 0.1 0.1
福 建 Fujian
江 西 Jiangxi
山 东 Shandong 0.1 0.1 0.1
河 南 Henan 2.2 0.1 1.1 0.8 0.3
湖 北 Hubei 2.7 0.7 0.4 1.6 0.8 0.6
湖 南 Hunan 2.7 1.0 1.0 0.2
广 东 Guangdong 0.1 0.1 0.1 0.1
广 西 Guangxi
海 南 Hainan 0.4 0.2 0.2
重 庆 Chongqing 2.8 0.4 0.4 2.2 2.2 2.2
四 川 Sichuan 2.9 1.2 1.2 0.8
贵 州 Guizhou 1.6 0.2 0.2 0.7 0.7 0.1
云 南 Yunnan 0.2 0.1 0.1 0.1
西 藏 Tibet
陕 西 Shaanxi 3.3
甘 肃 Gansu 1.1 0.1 0.1 0.1
青 海 Qinghai 0.8 0.3 0.3 0.3
宁 夏 Ningxia
新 疆 Xinjiang
新疆生产建设兵团 XinjiangProduction and Construction
Crops
5.2 2.3 2.3 1.6

8/2/2019 China Labour Statistical Yearbook - 2004
http://slidepdf.com/reader/full/china-labour-statistical-yearbook-2004 160/464
2-11 1 continued
单位:万人 (10000 persons)
年末实有
下岗职工 男性
#再就业 # 协议到期 人 数 Male 50 岁以上
人 数 人 数 # 再就业 # 登记失 Laid-off
地 区 Region Re-em- End the 人 数 业人数 Workers50 Years and over
ployed Duration Re-em- Unemp- at this
of Re-emp- ployed oyment Year-end
loyment Regis-
Agreement tered
National 8.0 6.6 4.1 0.7 24.1 13.7 4.5
北 京 Beijing
天 津 Tianjin
河 北 Hebei 0.5 0.1 0.1 1.8 1.1 0.3
山 西 Shanxi 0.8 0.2 0.1 0.1 2.4 1.3 0.4
内 蒙 古 Inner Mongolia 1.7 0.9 0.4
辽 宁 Liaoning
吉 林 Jilin 0.1 0.4 0.2
黑 龙 江 Heilongjiang 0.1 0.1 0.1 1.5 0.8 0.2
上 海 Shanghai
江 苏 Jiangsu 0.1
浙 江 Zhejiang
安 徽 Anhui 0.1 0.1 0.1
福 建 Fujian
江 西 Jiangxi
山 东 Shandong
河 南 Henan 0.7 0.6 0.4 1.2 0.8 0.2
湖 北 Hubei 0.4 0.5 0.4 0.1 1.8 0.9 0.4
湖 南 Hunan 0.2 0.9 0.6 1.7 1.0 0.4
广 东 Guangdong
广 西 Guangxi
海 南 Hainan 0.1 0.1 0.1 0.3 0.2 0.1
重 庆 Chongqing 1.3 0.8 0.3 0.2 0.9 0.6 0.3
四 川 Sichuan 0.7 0.2 1.7 0.9 0.2
贵 州 Guizhou 0.3 0.5 0.1 1.1 0.6 0.1
云 南 Yunnan 0.1 0.1 0.1 0.1西 藏 Tibet
陕 西 Shaanxi 3.3 2.0 0.9
甘 肃 Gansu 0.1 0.9 0.6 0.3
青 海 Qinghai 0.3 0.5 0.3
宁 夏 Ningxia
新 疆 Xinjiang
新疆生产建设兵团
Xinjiang Production and
Construction Crops
2.1 1.9 1.7 0.2 2.8 1.3 0.2

8/2/2019 China Labour Statistical Yearbook - 2004
http://slidepdf.com/reader/full/china-labour-statistical-yearbook-2004 161/464
2-11 2 continued
单位:万人 (10000 persons)
女性 进入再就
Female 40 岁以上 业服务中 签协议
心人数 人 数 足额发生活 足额代缴40 Years and
over In Re- Person 费人数 保险费人数
employment signed All Basic
Service Re-empl- Living
Centers oyment Expenses
地 区 Region
Agreement Received
All Social InsuranceFunds Contributed
by Units
National 10.5 4.0 19.3 19.3 19.3 19.3
北 京 Beijing
天 津 Tianjin
河 北 Hebei 0.7 0.2 0.8 0.8 0.8 0.8
山 西 Shanxi 1.1 0.4 2.4 2.4 2.4 2.4
内 蒙 古 Inner Mongolia 0.8 0.3 1.7 1.7 1.7 1.7
辽 宁 Liaoning 吉 林 Jilin 0.2 0.4 0.4 0.4 0.4
黑 龙 江 Heilongjiang 0.7 0.2 0.7 0.7 0.7 0.7
上 海 Shanghai
江 苏 Jiangsu
浙 江 Zhejiang
安 徽 Anhui
福 建 Fujian
江 西 Jiangxi
山 东 Shandong
河 南 Henan 0.4 0.1 0.8 0.8 0.8 0.8
湖 北 Hubei 0.9 0.5 1.2 1.1 1.1 1.1
湖 南 Hunan 0.6 0.3
广 东 Guangdong
广 西 Guangxi
海 南 Hainan 0.1 0.1 0.3 0.3 0.3 0.3
重 庆 Chongqing 0.3 0.2 0.9 0.9 0.9 0.9
四 川 Sichuan 0.8 0.2 1.5 1.5 1.5 1.5
贵 州 Guizhou 0.5 0.3 0.9 0.9 0.9 0.9
云 南 Yunnan 0.1 0.1 0.1 0.1
西 藏 Tibet
陕 西 Shaanxi 1.4 0.7 3.3 3.3 3.3 3.3
甘 肃 Gansu 0.3 0.1 0.9 0.9 0.9 0.9
青 海 Qinghai 0.2 0.1 0.5 0.5 0.5 0.5
宁 夏 Ningxia
新 疆 Xinjiang
新疆生产建设兵团 Xinjiang
Production and Construction Crops 1.5 0.3 2.8 2.8 2.8 2.8

8/2/2019 China Labour Statistical Yearbook - 2004
http://slidepdf.com/reader/full/china-labour-statistical-yearbook-2004 162/464
2-12
LAID-OFF WORKERS IN DEFICIT ENTERPRISES BY REGION
2003
单位:万人 (10000 persons)
上年末结 本年新增 本年减少
转下岗职 下岗职工 进入再就 下岗职工 从再就业服务
工 人 数 人 数 业服务中 人 数 中心转出人数 #解除终止劳
Laid-off Laid-off 心 人 数 Laid-off Number of 动关系人数
Workers Workers In Re- workers Persons Trans- Number of
at Last Newly emplo- Decreased ferred Re-empl- Persons
Year-end Added yment this Year oyment Service Terminated
this Service Centers Labour
地 区 Region
Year Centers this Year Contracts
National 318.1 50.6 16.3 172.9 124.3 59.6
北 京 Beijing 天 津 Tianjin 7.8 7.8 3.3 2.3
河 北 Hebei 22.8 10.2 1.7 12.4 8.9 0.7
山 西 Shanxi 16.8 6.4 3.9 8.3 5.8 0.9
内 蒙 古 Inner Mongolia 2.4 0.4 0.4 0.0
辽 宁 Liaoning 7.4 1.3 8.6 4.0 3.3
吉 林 Jilin 17.6 11.7 11.7 3.1
黑 龙 江 Heilongjiang 1.5 0.4 0.4 0.1 0.1
上 海 Shanghai
江 苏 Jiangsu 1.4 1.0 1.0 0.6
浙 江 Zhejiang 0.0
安 徽 Anhui 7.0 3.8 3.8 2.4
福 建 Fujian
江 西 Jiangxi 30.1 13.7 20.1 6.2 1.6
山 东 Shandong 1.4 1.4 0.3
河 南 Henan 23.5 4.5 2.9 11.6 10.8 1.1
湖 北 Hubei 30.9 7.7 4.6 18.1 9.5 7.1
湖 南 Hunan 34.9 17.6 12.1 1.7
广 东 Guangdong 0.5 0.5 0.5 0.1
广 西 Guangxi 5.2 4.1 4.1 3.1
海 南 Hainan 0.8 0.5 0.5
重 庆 Chongqing 9.9 2.4 2.4 11.7 11.7 11.7
四 川 Sichuan 28.1 1.1 0.0 17.1 14.8 10.0
贵 州 Guizhou 9.0 1.5 0.2 2.1 1.7 0.5
云 南 Yunnan 0.2 0.1 0.1 0.1
西 藏 Tibet
陕 西 Shaanxi 24.8
甘 肃 Gansu 14.4 3.7 3.6 1.1
青 海 Qinghai 4.4 1.6 1.6 1.4
宁 夏 Ningxia 2.4 0.6 1.5 1.1 0.8新 疆 Xinjiang 7.8 0.7 0.7 4.3 4.3 4.2
新疆生产建设兵团 Xinjiang
Production and Construction
Crops
5.2 2.3 2.3 1.6

8/2/2019 China Labour Statistical Yearbook - 2004
http://slidepdf.com/reader/full/china-labour-statistical-yearbook-2004 163/464
2-12 1 continued
单位:万人 (10000 persons)
年末实有
下岗职工 男性
#再就业 # 协议到期 人 数 Male 50 岁以上
人 数 人 数 # 再就业 # 登记失 Laid-off
地 区 Region Re-em- End the 人 数 业人数 Workers 50 Years and over
ployed Duration Re-em- Unemp- at this
of Re-emp- ployed oyment Year-end
loyment Regis-
Agreement tered
National 66.9 82.0 40.3 15.9 195.8 110.6 36.5
北 京 Beijing
天 津 Tianjin 2.0 3.2 1.8 1.1
河 北 Hebei 3.6 5.4 1.3 0.5 20.7 12.3 3.4
山 西 Shanxi 3.6 1.9 0.7 0.2 14.9 8.3 2.6
内 蒙 古 Inner Mongolia 0.4 0.3 0.3 2.0 1.2 0.5
辽 宁 Liaoning 0.5 1.1
吉 林 Jilin 4.4 10.4 3.8 1.0 5.9 3.8 0.6
黑 龙 江 Heilongjiang 0.1 0.1 0.1 1.5 0.8 0.2
上 海 Shanghai
江 苏 Jiangsu 0.6 0.8 0.5 0.2 0.3 0.1 0.1
浙 江 Zhejiang
安 徽 Anhui 2.2 3.5 1.9 1.0 3.1 2.0 0.2
福 建 Fujian
江 西 Jiangxi 2.9 5.8 2.8 0.8 23.7 13.7 4.5
山 东 Shandong 0.3 0.1
河 南 Henan 10.2 7.0 6.3 0.4 16.4 9.2 2.2
湖 北 Hubei 5.1 5.8 4.8 0.7 20.5 10.0 4.5
湖 南 Hunan 3.0 10.0 2.9 1.2 17.3 9.7 4.7
广 东 Guangdong
广 西 Guangxi 3.1 2.7 1.5 1.1 1.2 0.7 0.3
海 南 Hainan 0.1 0.1 0.1 0.3 0.2 0.1
重 庆 Chongqing 4.7 7.3 1.3 4.1 0.6 0.4 0.2
四 川 Sichuan 10.6 8.5 5.7 1.1 12.0 7.0 2.0
贵 州 Guizhou 0.9 1.2 0.4 0.2 8.4 4.9 1.2
云 南 Yunnan 0.1 0.1 0.1 0.1西 藏 Tibet
陕 西 Shaanxi 24.8 14.5 7.0
甘 肃 Gansu 2.8 1.0 0.8 0.1 10.7 5.9 1.5
青 海 Qinghai 1.4 2.9 1.7 0.2
宁 夏 Ningxia 0.6 0.4 0.2 0.2 1.4 0.7 0.1
新 疆 Xinjiang 1.8 3.3 1.2 1.9 4.2 2.0 0.3
新疆生产建设兵团 Xinjiang Production and Construction Crops 2.1 1.9 1.7 0.2 2.8 1.3 0.2

8/2/2019 China Labour Statistical Yearbook - 2004
http://slidepdf.com/reader/full/china-labour-statistical-yearbook-2004 164/464
2-12 2 continued
单位:万人 (10000 persons)
女性 进入再就
Female 40 岁以上 业服务中 签协议
心人数 人 数 足额发生活 足额代缴40 Years and over
In Re- Person 费人数 保险费人数
employment
signed All Basic
Service Re-empl- Living
Centers oyment Expenses
地 区 Region
Agreement Received
All Social
Insurance Funds
Contributed by
Units
National 85.2 32.3 139.0 138.3 138.3 138.3
北 京 Beijing
天 津 Tianjin
河 北 Hebei 8.4 3.1 12.3 12.3 12.3 12.3
山 西 Shanxi 6.6 2.1 12.5 12.5 12.5 12.5
内 蒙 古 Inner Mongolia 0.8 0.4 2.0 2.0 2.0 2.0
辽 宁 Liaoning
吉 林 Jilin 2.1 0.7 2.9 2.9 2.9 2.9
黑 龙 江 Heilongjiang 0.7 0.2 0.7 0.7 0.7 0.7
上 海 Shanghai
江 苏 Jiangsu 0.2 0.1 0.3 0.3 0.3 0.3
浙 江 Zhejiang
安 徽 Anhui 1.2 0.3 3.1 3.1 3.1 3.1
福 建 Fujian
江 西 Jiangxi 10.0 3.8 12.3 12.3 12.3 12.3
山 东 Shandong
河 南 Henan 7.2 2.0 15.6 15.6 15.6 15.6
湖 北 Hubei 10.5 5.6 14.0 13.3 13.3 13.3
湖 南 Hunan 7.6 2.7
广 东 Guangdong
广 西 Guangxi 0.5 0.2 1.2 1.2 1.2 1.2
海 南 Hainan 0.1 0.1 0.3 0.3 0.3 0.3
重 庆 Chongqing 0.2 0.1 0.6 0.6 0.6 0.6
四 川 Sichuan 5.0 1.9 9.5 9.5 9.5 9.5
贵 州 Guizhou 3.5 1.3 5.9 5.9 5.9 5.9
云 南 Yunnan 0.1 0.1 0.1 0.1
西 藏 Tibet
陕 西 Shaanxi 10.3 4.9 24.8 24.8 24.8 24.8
甘 肃 Gansu 4.8 1.5 10.5 10.5 10.5 10.5
青 海 Qinghai 1.2 0.3 2.9 2.9 2.9 2.9
宁 夏 Ningxia 0.7 0.2 0.6 0.6 0.6 0.6
新 疆 Xinjiang 2.1 0.4 4.2 4.2 4.2 4.2
新疆生产建设兵团 Xinjiang Production and Construction Crops 1.5 0.3 2.8 2.8 2.8 2.8

8/2/2019 China Labour Statistical Yearbook - 2004
http://slidepdf.com/reader/full/china-labour-statistical-yearbook-2004 165/464
2-13
FINANCING AND EXPENDITURE OF RE-EMPLOYMENT SERVICE IN ENTERPRISES
(2003)
单位: 亿元 (100 million Yuan)
本期资金筹集额 Financing in this Year
上期末资金
结转额
Balance at Last
Year-end 合计 Total
企业自筹 From
Enterprises
社会筹集 From
Society
失业保险基金调
剂 From
Unemploy-ment
Insurance Fund
财政安排 From
Government
Finance
总计 Total 7.5 120.0 19.4 17.3 14.2 83.3
#中央直属企业 Directly Under the
Central Government13.8 2.7 1.3 1.1 9.7
#亏损企业 Deficit
Enterprises
6.2 102.4 14.7 14.8 12.3 72.9
本期资金使用额 Expenditure in this Year
合计 Total 基本生活费 Basic
Living Expense
养老保险费
Old-Age Insurance
Expense
医疗保险费
Medical Insurance
Expense
失业保险
Unemploy-ment
Insurance Expense
本期资金结余数
Balance at this
Year-end
总计 Total 121.4 71.8 35.0 6.3 5.2 6.1
#中央直属企业 Directly Under the
Central Government13.7 7.8 3.8 0.9 0.5 0.1
#亏损企业 Deficit
Enterprises101.9 59.2 28.8 5.3 4.5 6.7
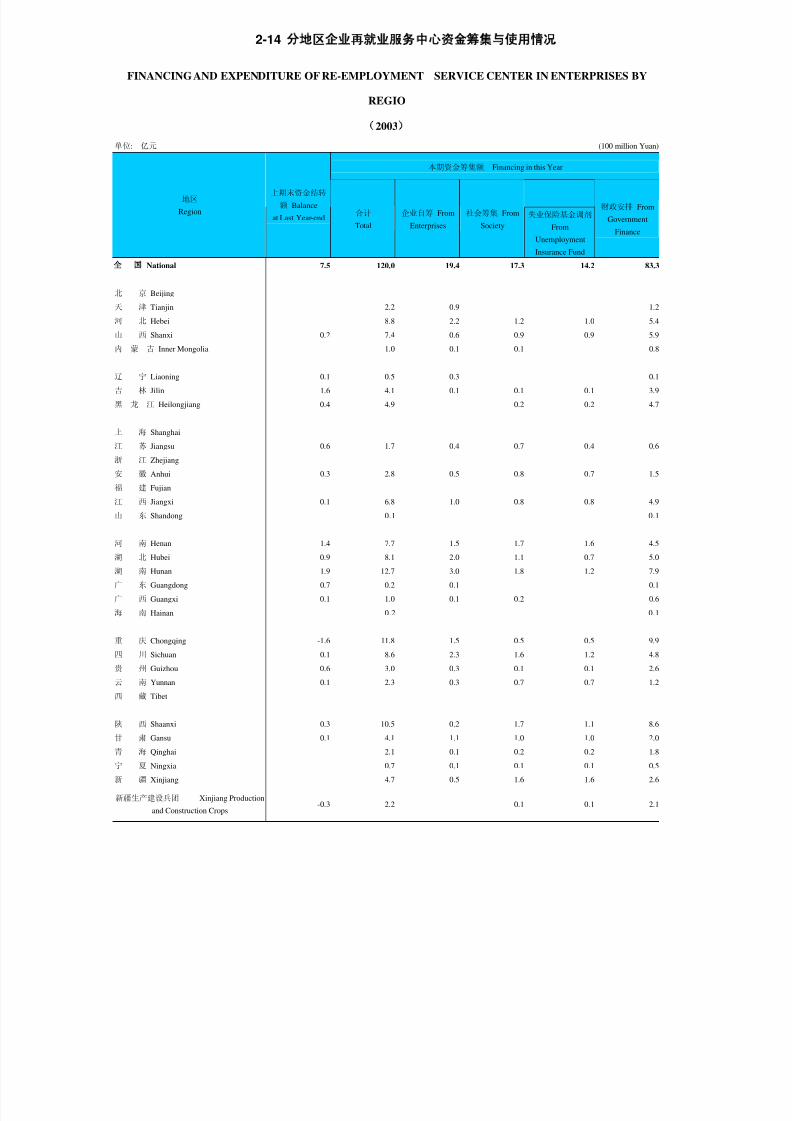
8/2/2019 China Labour Statistical Yearbook - 2004
http://slidepdf.com/reader/full/china-labour-statistical-yearbook-2004 166/464
2-14
FINANCING AND EXPENDITURE OF RE-EMPLOYMENT SERVICE CENTER IN ENTERPRISES BY
REGIO
2003
单位: 亿元 (100 million Yuan)
本期资金筹集额 Financing in this Year
地区
Region
上期末资金结转
额 Balance
at Last Year-end合计
Total
企业自筹 From
Enterprises
社会筹集 From
Society
失业保险基金调剂
From
Unemployment
Insurance Fund
财政安排 From
Government
Finance
National 7.5 120.0 19.4 17.3 14.2 83.3
北 京 Beijing
天 津 Tianjin 2.2 0.9 1.2
河 北 Hebei 8.8 2.2 1.2 1.0 5.4
山 西 Shanxi 0.2 7.4 0.6 0.9 0.9 5.9
内 蒙 古 Inner Mongolia 1.0 0.1 0.1 0.8
辽 宁 Liaoning 0.1 0.5 0.3 0.1
吉 林 Jilin 1.6 4.1 0.1 0.1 0.1 3.9
黑 龙 江 Heilongjiang 0.4 4.9 0.2 0.2 4.7
上 海 Shanghai
江 苏 Jiangsu 0.6 1.7 0.4 0.7 0.4 0.6
浙 江 Zhejiang
安 徽 Anhui 0.3 2.8 0.5 0.8 0.7 1.5
福 建 Fujian
江 西 Jiangxi 0.1 6.8 1.0 0.8 0.8 4.9
山 东 Shandong 0.1 0.1
河 南 Henan 1.4 7.7 1.5 1.7 1.6 4.5
湖 北 Hubei 0.9 8.1 2.0 1.1 0.7 5.0
湖 南 Hunan 1.9 12.7 3.0 1.8 1.2 7.9
广 东 Guangdong 0.7 0.2 0.1 0.1
广 西 Guangxi 0.1 1.0 0.1 0.2 0.6
海 南 Hainan 0.2 0.1
重 庆 Chongqing -1.6 11.8 1.5 0.5 0.5 9.9
四 川 Sichuan 0.1 8.6 2.3 1.6 1.2 4.8
贵 州 Guizhou 0.6 3.0 0.3 0.1 0.1 2.6
云 南 Yunnan 0.1 2.3 0.3 0.7 0.7 1.2
西 藏 Tibet
陕 西 Shaanxi 0.3 10.5 0.2 1.7 1.1 8.6
甘 肃 Gansu 0.1 4.1 1.1 1.0 1.0 2.0
青 海 Qinghai 2.1 0.1 0.2 0.2 1.8
宁 夏 Ningxia 0.7 0.1 0.1 0.1 0.5
新 疆 Xinjiang 4.7 0.5 1.6 1.6 2.6
新疆生产建设兵团 Xinjiang Production
and Construction Crops -0.3 2.2 0.1 0.1 2.1
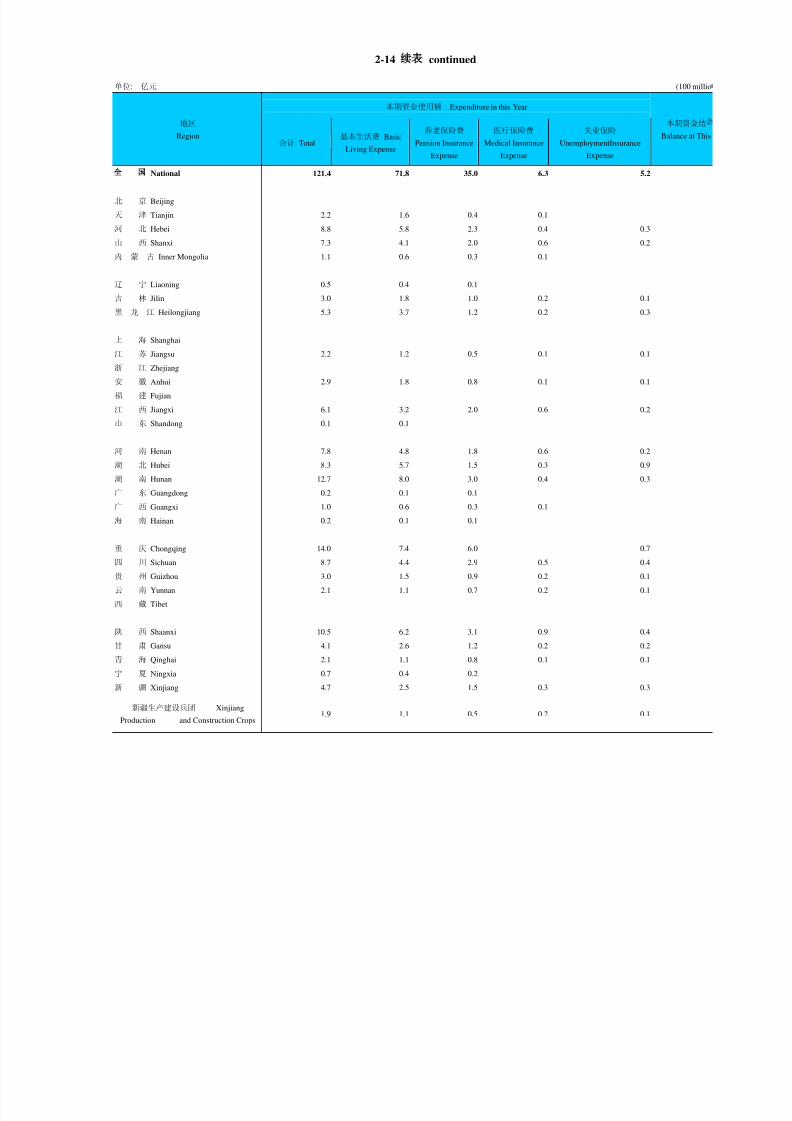
8/2/2019 China Labour Statistical Yearbook - 2004
http://slidepdf.com/reader/full/china-labour-statistical-yearbook-2004 167/464
2-14 continued
单位: 亿元 (100 millio
本期资金使用额 Expenditure in this Year
地区
Region 合计 Total
基本生活费 Basic
Living Expense
养老保险费
Pension Insurance
Expense
医疗保险费
Medical Insurance
Expense
失业保险
UnemploymentInsurance
Expense
本期资金结
Balance at This
National 121.4 71.8 35.0 6.3 5.2
北 京 Beijing
天 津 Tianjin 2.2 1.6 0.4 0.1
河 北 Hebei 8.8 5.8 2.3 0.4 0.3
山 西 Shanxi 7.3 4.1 2.0 0.6 0.2
内 蒙 古 Inner Mongolia 1.1 0.6 0.3 0.1
辽 宁 Liaoning 0.5 0.4 0.1
吉 林 Jilin 3.0 1.8 1.0 0.2 0.1
黑 龙 江 Heilongjiang 5.3 3.7 1.2 0.2 0.3
上 海 Shanghai
江 苏 Jiangsu 2.2 1.2 0.5 0.1 0.1
浙 江 Zhejiang
安 徽 Anhui 2.9 1.8 0.8 0.1 0.1
福 建 Fujian
江 西 Jiangxi 6.1 3.2 2.0 0.6 0.2
山 东 Shandong 0.1 0.1
河 南 Henan 7.8 4.8 1.8 0.6 0.2
湖 北 Hubei 8.3 5.7 1.5 0.3 0.9
湖 南 Hunan 12.7 8.0 3.0 0.4 0.3
广 东 Guangdong 0.2 0.1 0.1
广 西 Guangxi 1.0 0.6 0.3 0.1
海 南 Hainan 0.2 0.1 0.1
重 庆 Chongqing 14.0 7.4 6.0 0.7
四 川 Sichuan 8.7 4.4 2.9 0.5 0.4
贵 州 Guizhou 3.0 1.5 0.9 0.2 0.1
云 南 Yunnan 2.1 1.1 0.7 0.2 0.1
西 藏 Tibet
陕 西 Shaanxi 10.5 6.2 3.1 0.9 0.4
甘 肃 Gansu 4.1 2.6 1.2 0.2 0.2
青 海 Qinghai 2.1 1.1 0.8 0.1 0.1
宁 夏 Ningxia 0.7 0.4 0.2
新 疆 Xinjiang 4.7 2.5 1.5 0.3 0.3
新疆生产建设兵团 Xinjiang
Production and Construction Crops 1.9 1.1 0.5 0.2 0.1

8/2/2019 China Labour Statistical Yearbook - 2004
http://slidepdf.com/reader/full/china-labour-statistical-yearbook-2004 168/464
2-15
BASIC CONDITIONS OF LABOUR EXCHANGES
(2003)
单位:万人 (10000 Persons)
本年末职 本年末职 本年登记 本年登记求职
业介绍机 业介绍机 招聘人数 Total #女 性
构 个 数 构 人 数 Total Registered Female
(个) Staff and Registered Jobseekers
Number Workers of Job This
of Labor Labor Vacancies Year
Exchanges Exchanges This Year
Total 31109 9.7 3832.0 3060.2 1356.3
劳动保障部门办 21515 6.5 2909.2 2169.5 971.0
Run by Labor Departments
# 县(区)及以上 3886 2.7 2504.8 1712.4 765.0
Of which:by counties and above
街 道 by Subdistrict office 4293 1.1 143.1 179.0 88.0
乡 镇 by Small Towns 13336 2.6 261.2 278.1 118.0
其他组织办 Run by Other Organs 3107 1.2 206.1 249.5 111.7
公民个人办 Run by Private 6487 2.0 716.6 641.2 273.6
本年职业
下 岗 失 业 获得职 指导人数
职 工 人 员 业资格 Persontimes
Laid-off 人 员 of
Workers Unemployment Person with Vocational
Certificates Guidance
Total 386.8 1049.9 460.4 1611.0
劳动保障部门办 288.5 856.9 340.5 1294.1
Run by Labor Departments
# 县(区)及以上 243.7 742.5 303.0 1048.4
Of which:by counties and above
街 道 by Subdistrict office 30.8 63.2 18.3 108.8
乡 镇 by Small Towns 14.0 51.3 19.2 136.9
其他组织办 Run by Other Organs 43.3 64.8 36.0 103.1
公民个人办 Run by Private 55.0 128.2 83.9 213.8
本年介绍
成功人数 #女 性 #下 岗 #失 业 #获得职业
Placed Female 职 工 人 员 资格人员
Jobseekers Laid-off Unemployment Person with
Workers Certificates
Total 1586 730.5 194 574.4 306.6
劳动保障部门办 1155.5 535.6 148.5 481.4 228.8
Run by Labor Departments
# 县(区)及以上 891.7 417.5 125.4 406.3 194.9
Of which:by counties and above
街 道 by Subdistrict office 94.1 45.5 15.9 47.6 13.7
乡 镇 by Small Towns 169.6 72.7 7.2 27.6 20.2
其他组织办 Run by Other Organs 121.5 53.8 18.6 34 23.7
公民个人办 Run by Private 309.1 141 26.9 59 54.1
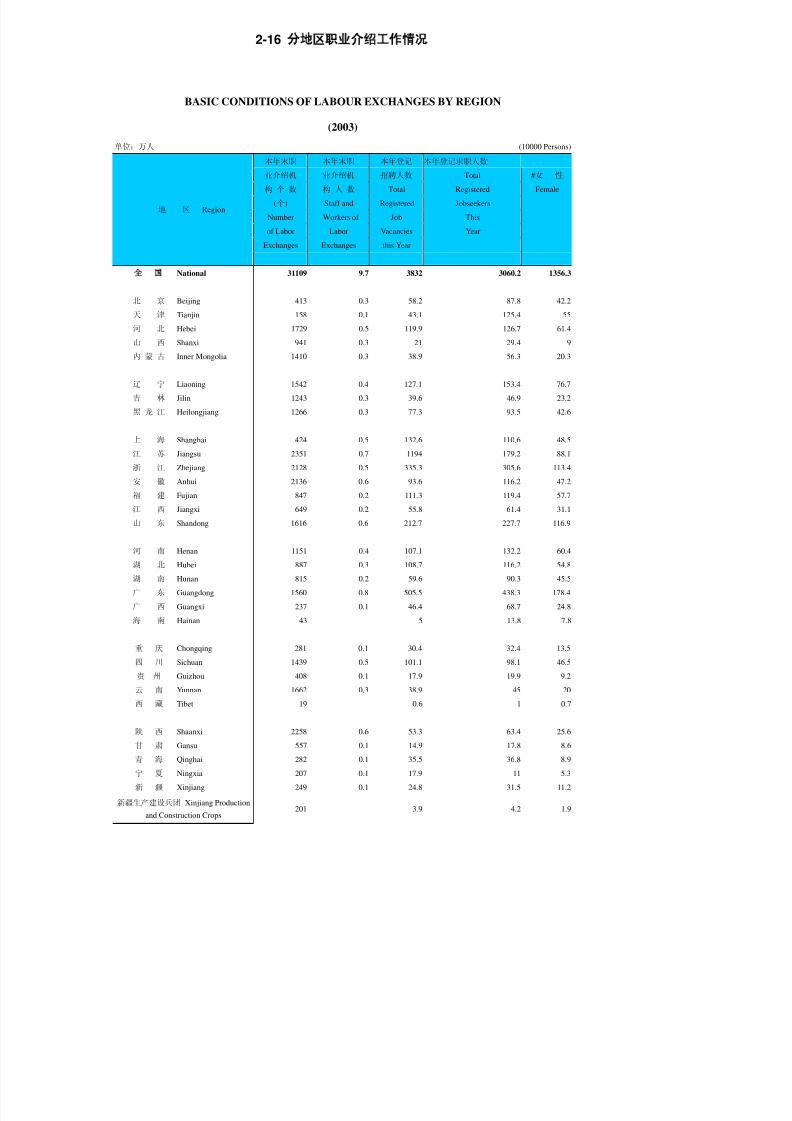
8/2/2019 China Labour Statistical Yearbook - 2004
http://slidepdf.com/reader/full/china-labour-statistical-yearbook-2004 169/464
2-16
BASIC CONDITIONS OF LABOUR EXCHANGES BY REGION
(2003)
单位:万人 (10000 Persons)
本年末职 本年末职 本年登记 本年登记求职人数
业介绍机 业介绍机 招聘人数 Total #女 性
构 个 数 构 人 数 Total Registered Female
(个) Staff and Registered Jobseekers
Number Workers of Job This
of Labor Labor Vacancies Year
Exchanges Exchanges this Year
地 区 Region
National 31109 9.7 3832 3060.2 1356.3
北 京 Beijing 413 0.3 58.2 87.8 42.2
天 津 Tianjin 158 0.1 43.1 125.4 55
河 北 Hebei 1729 0.5 119.9 126.7 61.4
山 西 Shanxi 941 0.3 21 29.4 9
内 蒙 古 Inner Mongolia 1410 0.3 38.9 56.3 20.3
辽 宁 Liaoning 1542 0.4 127.1 153.4 76.7
吉 林 Jilin 1243 0.3 39.6 46.9 23.2
黑 龙 江 Heilongjiang 1266 0.3 77.3 93.5 42.6
上 海 Shanghai 424 0.5 132.6 110.6 48.5
江 苏 Jiangsu 2351 0.7 1194 179.2 88.1
浙 江 Zhejiang 2128 0.5 335.3 305.6 113.4
安 徽 Anhui 2136 0.6 93.6 116.2 47.2
福 建 Fujian 847 0.2 111.3 119.4 57.7
江 西 Jiangxi 649 0.2 55.8 61.4 31.1
山 东 Shandong 1616 0.6 212.7 227.7 116.9
河 南 Henan 1151 0.4 107.1 132.2 60.4
湖 北 Hubei 887 0.3 108.7 116.2 54.8
湖 南 Hunan 815 0.2 59.6 90.3 45.5
广 东 Guangdong 1560 0.8 505.5 438.3 178.4
广 西 Guangxi 237 0.1 46.4 68.7 24.8
海 南 Hainan 43 5 13.8 7.8
重 庆 Chongqing 281 0.1 30.4 32.4 13.5
四 川 Sichuan 1439 0.5 101.1 98.1 46.5
贵 州 Guizhou 408 0.1 17.9 19.9 9.2
云 南 Yunnan 1662 0.3 38.9 45 20
西 藏 Tibet 19 0.6 1 0.7
陕 西 Shaanxi 2258 0.6 53.3 63.4 25.6
甘 肃 Gansu 557 0.1 14.9 17.8 8.6
青 海 Qinghai 282 0.1 35.5 36.8 8.9
宁 夏 Ningxia 207 0.1 17.9 11 5.3
新 疆 Xinjiang 249 0.1 24.8 31.5 11.2
新疆生产建设兵团 Xinjiang Production
and Construction Crops 201 3.9 4.2 1.9

8/2/2019 China Labour Statistical Yearbook - 2004
http://slidepdf.com/reader/full/china-labour-statistical-yearbook-2004 170/464
2-16 1 continued
单位:万人 (10000 Person)
本年职业
#下 岗 #失 业 #获得职 指导人数
职 工 人 员 业资格 Persontimes
Laid-off Unemployment 人 员 of
Workers Person Vocational
with Guidance
地 区 Region
Certificates
National 386.8 1049.9 460.4 1611.0
北 京 Beijing 2.4 22.7 9.0 35.1
天 津 Tianjin 46.2 28.6 6.3 41.8
河 北 Hebei 9.6 27.2 32.5 83.7
山 西 Shanxi 5.6 6.3 1.4 13.7
内 蒙 古 Inner Mongolia 5.2 26.8 2.6 19.4
辽 宁 Liaoning 26.5 80.8 20.2 111.9
吉 林 Jilin 13.0 18.8 7.5 33.4
黑 龙 江 Heilongjiang 34.4 33.1 7.3 43.1
上 海 Shanghai 13.9 55.7 7.9 78.8
江 苏 Jiangsu 7.9 94.3 45.3 88.0
浙 江 Zhejiang 19.3 71.5 41.6 108.0
安 徽 Anhui 13.6 26.4 8.9 57.4
福 建 Fujian 5.6 23.5 6.7 48.7
江 西 Jiangxi 15.4 24.8 7.2 33.0
山 东 Shandong 13.0 63.9 25.5 117.0
河 南 Henan 35.9 24.7 18.9 66.0
湖 北 Hubei 24.8 48.2 24.4 79.4
湖 南 Hunan 29.6 45.0 28.0 55.1
广 东 Guangdong 12.8 163.7 102.0 162.5
广 西 Guangxi 3.0 23.5 5.9 30.9
海 南 Hainan 0.9 1.0 0.4 7.4
重 庆 Chongqing 3.6 16.4 5.5 21.3
四 川 Sichuan 16.4 48.3 15.7 102.6
贵 州 Guizhou 4.1 7.5 1.6 13.1
云 南 Yunnan 3.7 17.4 6.9 43.1
西 藏 Tibet 0.7 0.1 0.7
陕 西 Shaanxi 10.1 16.8 11.6 39.1
甘 肃 Gansu 4.0 7.7 2.3 14.3
青 海 Qinghai 1.8 5.8 1.8 33.1
宁 夏 Ningxia 1.1 4.2 0.9 9.4
新 疆 Xinjiang 2.3 13.5 3.6 17.3
新疆生产建设兵团 Xinjiang Production and Construction Crops 1.1 1.1 0.7 2.7

8/2/2019 China Labour Statistical Yearbook - 2004
http://slidepdf.com/reader/full/china-labour-statistical-yearbook-2004 171/464
2-16 2 continued
单位:万人 (10000 Persons)
本年介绍
成功人数 #女 性 #下 岗 #失 业 #获得职
Placed Female 职 工 人 员 业资格
地 区 Region Jobseekers Laid-off Unemployment 人 员
Workers Person
with
Certificates
National 1586 730.5 194 574.4 306.6
北 京 Beijing 32.2 14.2 1.2 12.1 6.2
天 津 Tianjin 64.9 25.3 12.1 16.5 3.3
河 北 Hebei 66.6 31.5 5 15.3 25.8
山 西 Shanxi 17.9 6.3 3.6 4.4 1.3
内 蒙 古 Inner Mongolia 30.2 11 3.7 17.3 2.2
辽 宁 Liaoning 84.2 40.4 12.9 45.2 9.3
吉 林 Jilin 28.2 13.2 7.9 12.2 5
黑 龙 江 Heilongjiang 52.2 23.5 19.3 17.8 4.7
上 海 Shanghai 38.7 18.5 6.7 20.3 7.5
江 苏 Jiangsu 95.5 57.8 3.2 52.6 27.3
浙 江 Zhejiang 156.2 57.5 9.9 37.9 25.2
安 徽 Anhui 64.7 29.6 8.1 16.5 6.4
福 建 Fujian 49.3 26.5 3 12.9 4.6
江 西 Jiangxi 39.9 19.7 8.3 11.4 4.1
山 东 Shandong 132.1 63.9 8.8 40.4 14.6
河 南 Henan 75.9 29.3 19.5 17.2 11.9
湖 北 Hubei 74.1 35.1 14.9 28.7 17.7
湖 南 Hunan 35.1 17.7 12.1 18.4 18.2
广 东 Guangdong 200.2 104 6.7 81 67.4
广 西 Guangxi 34.6 17.3 1.6 15.5 3.3
海 南 Hainan 3.3 1.7 0.5 0.3 0.1
重 庆 Chongqing 16.1 8.3 2.3 9.5 3.6
四 川 Sichuan 57.1 25.3 8 29.9 11.8
贵 州 Guizhou 10.5 4.9 2.1 4.5 1.2
云 南 Yunnan 28.1 12.1 1.5 11.5 4
西 藏 Tibet 0.8 0.6 0.6 0.1
陕 西 Shaanxi 32.8 13.8 5 7.1 7.3
甘 肃 Gansu 10.1 4.6 2.6 3.8 1.2
青 海 Qinghai 33.3 7.5 1 3.7 7
宁 夏 Ningxia 5 2.3 0.6 2.8 0.9
新 疆 Xinjiang 13.9 5.2 1.1 6.5 2.5
新疆生产建设兵团 Xinjiang Production and Construction Crops 2.7 1.7 0.8 0.7 0.7
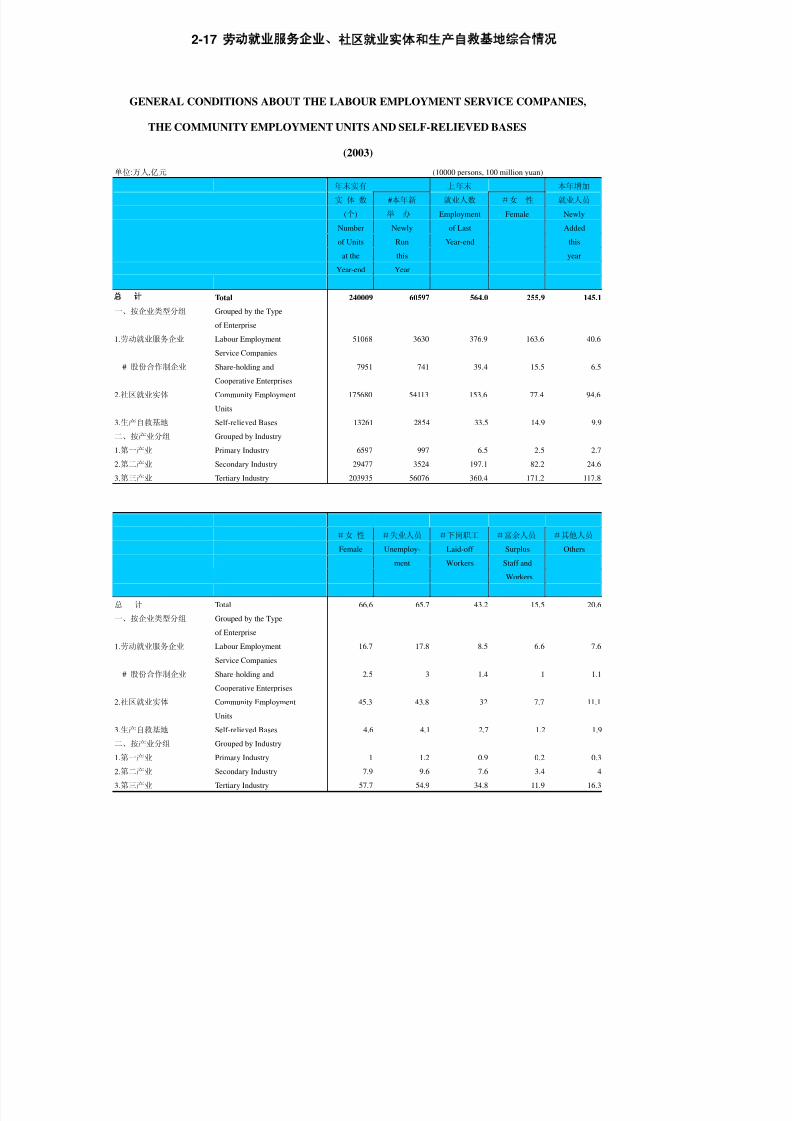
8/2/2019 China Labour Statistical Yearbook - 2004
http://slidepdf.com/reader/full/china-labour-statistical-yearbook-2004 172/464
2-17
GENERAL CONDITIONS ABOUT THE LABOUR EMPLOYMENT SERVICE COMPANIES,
THE COMMUNITY EMPLOYMENT UNITS AND SELF-RELIEVED BASES
(2003)单位:万人,亿元 (10000 persons, 100 million yuan)
年末实有 上年末 本年增加
实 体 数 #本年新 就业人数 #女 性 就业人员
(个) 举 办 Employment Female Newly
Number Newly of Last Added
of Units Run Year-end this
at the this year
Year-end Year
Total 240009 60597 564.0 255.9 145.1
一、按企业类型分组 Grouped by the Type
of Enterprise
1.劳动就业服务企业 Labour Employment 51068 3630 376.9 163.6 40.6
Service Companies
# 股份合作制企业 Share-holding and 7951 741 39.4 15.5 6.5
Cooperative Enterprises
2.社区就业实体 Community Employment 175680 54113 153.6 77.4 94.6
Units
3.生产自救基地 Self-relieved Bases 13261 2854 33.5 14.9 9.9
二、按产业分组 Grouped by Industry
1.第一产业 Primary Industry 6597 997 6.5 2.5 2.7
2.第二产业 Secondary Industry 29477 3524 197.1 82.2 24.6
3.第三产业 Tertiary Industry 203935 56076 360.4 171.2 117.8
#女 性 #失业人员 #下岗职工 #富余人员 #其他人员
Female Unemploy- Laid-off Surplus Others
ment Workers Staff and
Workers
总 计 Total 66.6 65.7 43.2 15.5 20.6
一、按企业类型分组 Grouped by the Type
of Enterprise
1.劳动就业服务企业 Labour Employment 16.7 17.8 8.5 6.6 7.6
Service Companies
# 股份合作制企业 Share-holding and 2.5 3 1.4 1 1.1
Cooperative Enterprises
2.社区就业实体 Community Employment 45.3 43.8 32 7.7 11.1
Units
3.生产自救基地 Self-relieved Bases 4.6 4.1 2.7 1.2 1.9
二、按产业分组 Grouped by Industry
1.第一产业 Primary Industry 1 1.2 0.9 0.2 0.3
2.第二产业 Secondary Industry 7.9 9.6 7.6 3.4 4
3.第三产业
Tertiary Industry 57.7 54.9 34.8 11.9 16.3

8/2/2019 China Labour Statistical Yearbook - 2004
http://slidepdf.com/reader/full/china-labour-statistical-yearbook-2004 173/464
2-17 1 continued
单位:万人,亿元
本年减少 年末实有
就业人数 就业人数 #女 性 #残疾人
Employment Employment Female The Disabled
Decreased at This
This Year-end
Year
Total 134.9 574.1 267.2 6.7
一、按企业类型分组 Grouped by the Type
of Enterprise
1.劳动就业服务企业 Labour Employment 86.1 331.4 144.7 3.0
Service Companies
# 股份合作制企业 Share-holding and 5.7 40.3 16.1 0.3
Cooperative Enterprises
2.社区就业实体 Community Employment 37.8 210.4 107.8 3.2
Units
3.生产自救基地 Self-relieved Bases 11.1 32.3 14.6 0.5
二、按产业分组 Grouped by Industry
1.第一产业 Primary Industry 1.8 7.3 2.4 0.1
2.第二产业 Secondary Industry 52.0 169.6 71.7 1.7
3.第三产业 Tertiary Industry 81.1 397.1 193.0 4.9
工资总额 增加值 上缴税金
Total Added Taxes #所得税
Wages Value Turned Income
Of Staff Over to Tax
and Workers the State
总 计 Total 271.9 424.8 97.1 24
一、按企业类型分组 Grouped by the Type
of enterprise
1.劳动就业服务企业 Labour Employment 207.9 390.1 90.8 22.7
Service Companies
# 股份合作制企业 Share-holding and 27.7 44.9 15 4
Cooperative Enterprises
2.社区就业实体 Community Employment 55.5 29.3 4.7 1Units
3.生产自救基地 Self-relieved Bases 8.5 5.4 1.6 0.4
二、按产业分组 Grouped by Industry
1.第一产业 Primary Industry 3.1 5.8 1.6 0.5
2.第二产业 Secondary Industry 98 184.1 42.1 10
3.第三产业 Tertiary Industry 170.7 234.9 53.4 13.5

8/2/2019 China Labour Statistical Yearbook - 2004
http://slidepdf.com/reader/full/china-labour-statistical-yearbook-2004 174/464
2-17 1 continued
单位:万人,亿元
本年减少 年末实有
就业人数 就业人数 #女 性 #残疾人
Employment Employment Female The Disabled
Decreased at This
This Year-end
Year
Total 134.9 574.1 267.2 6.7
一、按企业类型分组 Grouped by the Type
of Enterprise
1.劳动就业服务企业 Labour Employment 86.1 331.4 144.7 3.0
Service Companies
# 股份合作制企业 Share-holding and 5.7 40.3 16.1 0.3
Cooperative Enterprises
2.社区就业实体 Community Employment 37.8 210.4 107.8 3.2
Units
3.生产自救基地 Self-relieved Bases 11.1 32.3 14.6 0.5
二、按产业分组 Grouped by Industry
1.第一产业 Primary Industry 1.8 7.3 2.4 0.1
2.第二产业 Secondary Industry 52.0 169.6 71.7 1.7
3.第三产业 Tertiary Industry 81.1 397.1 193.0 4.9
工资总额 增加值 上缴税金
Total Added Taxes #所得税
Wages Value Turned Income
Of Staff Over to Tax
and Workers the State
总 计 Total 271.9 424.8 97.1 24
一、按企业类型分组 Grouped by the Type
of enterprise
1.劳动就业服务企业 Labour Employment 207.9 390.1 90.8 22.7
Service Companies
# 股份合作制企业 Share-holding and 27.7 44.9 15 4
Cooperative Enterprises
2.社区就业实体 Community Employment 55.5 29.3 4.7 1Units
3.生产自救基地 Self-relieved Bases 8.5 5.4 1.6 0.4
二、按产业分组 Grouped by Industry
1.第一产业 Primary Industry 3.1 5.8 1.6 0.5
2.第二产业 Secondary Industry 98 184.1 42.1 10
3.第三产业 Tertiary Industry 170.7 234.9 53.4 13.5

8/2/2019 China Labour Statistical Yearbook - 2004
http://slidepdf.com/reader/full/china-labour-statistical-yearbook-2004 175/464
2-17 2 continued
单位:万人,亿元 (10000 persons, 100 million yuan)
利 润 资产总计
Profits Total 流动资产 固定资
Assets Circulating 产净值
Assets Net Value
of Fixed
Assets
Total 73.8 2682.7 1574.6 656.4
一、按企业类型分组 Grouped by the Type
of Enterprise
1.劳动就业服务企业 Labour Employment 68.9 2535 1511.5 596.1
Service Companies
# 股份合作制企业 Share-holding and 11.4 419 208.6 139.9
Cooperative Enterprises
2.社区就业实体 Community Employment 3.5 98.1 39.2 42.2
Units
3.生产自救基地 Self-relieved Bases 1.4 49.6 23.9 18.1
二、按产业分组 Grouped by Industry
1.第一产业 Primary Industry 1.1 46.5 25.3 18.3
2.第二产业 Secondary Industry 25.7 1163.7 702.8 288.2
3.第三产业 Tertiary Industry 47 1472.6 846.6 349.8
负债及所有者权益总
其他资产 Total 负 债 所有者
Other Liabilities Liabilities 权 益
Assets and Creditors'
Creditors' Equity
Equity
Total 451.8 2682.7 1684.9 997.9
一、按企业类型分组 Grouped by the Type
of Enterprise
1.劳动就业服务企业 Labour Employment 427.5 2535.0 1616.5 918.6
Service Companies
# 股份合作制企业 Share-holding and 70.5 419.0 246.1 172.9
Cooperative Enterprises
2.社区就业实体 Community Employment 16.7 98.1 46.8 51.4
Units
3.生产自救基地
Self-relieved Bases 7.6 49.6 21.6 27.9二、按产业分组 Grouped by Industry
1.第一产业 Primary Industry 2.9 46.5 30.0 16.5
2.第二产业 Secondary Industry 172.7 1163.7 762.9 400.8
3.第三产业 Tertiary Industry 276.2 1472.6 892.0 580.6

8/2/2019 China Labour Statistical Yearbook - 2004
http://slidepdf.com/reader/full/china-labour-statistical-yearbook-2004 176/464
2-18
GENERAL CONDITIONS ABOUT THE LABOUR EMPLOYMENT SERVICE COMPANIES
THE COMMUNITY EMPLOYMENT UNITS AND SELF-RELIEVED BASES BY REGION
(2003)
单位:人,亿元 (person,100 million yuan)
年末实有 上年末 本年增加
实 体 数 #本年新 就业人数 #女 性 就业人数 #女 性
(个) 举 办 Employ- Female Newly Female
Number of Newly ment of Added
Units at the Run Last This
地 区 Region
Year-end This Year Year-end year
National 240009 60597 5639751 2558698 1450559 666067
北 京 Beijing 5008 160 150027 77535 42296 21355
天 津 Tianjin 5206 2168 79488 29894 37785 19451
河 北 Hebei 11885 3474 222520 108898 57748 15477
山 西 Shanxi 1827 25 193618 90256 4116 451
内 蒙 古 Inner Mongolia 33260 10539 225218 89234 76696 38258
辽 宁 Liaoning 38002 8381 464020 258895 267001 145934
吉 林 Jilin 17577 978 342037 159337 50042 10236
黑 龙 江 Heilongjiang 4120 87 261905 98112 58436 24546
上 海 Shanghai 23831 7107 325139 145054 137990 62524
江 苏 Jiangsu 10627 1823 309618 125644 72582 30432
浙
江Zhejiang 3186 464 109391 45120 26886 10436
安 徽 Anhui 4138 1005 388479 163161 13172 5911
福 建 Fujian 2795 456 31523 15097 17805 9715
江 西 Jiangxi 1947 128 100328 43013 9370 2901
山 东 Shandong 7920 905 416419 172255 61929 37616
河 南 Henan 5675 822 239662 129720 26378 13457
湖 北 Hubei 12101 1309 388132 180601 74572 30798
湖 南 Hunan 6879 3542 226936 112185 223220 106913
广 东 Guangdong 1826 1352 33705 15407 10520 4381
广 西 Guangxi 496 8 43129 21180 3249 1420
海 南 Hainan 33 1 3007 1735 65 28
重 庆 Chongqing 800 14 62355 22349 10540 2399
四 川 Sichuan 30801 14079 296545 157741 93513 37040
贵 州 Guizhou 299 85 33931 13114 5216 1481
云 南 Yunnan 1093 50 66000 27186 9358 2954
西 藏 Tibet
陕 西 Shaanxi 4824 952 127120 71498 34788 18606
甘 肃 Gansu 1276 462 399910 139968 10954 5554
青 海 Qinghai 134 12 11775 5253 3946 1193
宁 夏 Ningxia 1914 147 46186 17673 2717 938
新 疆 Xinjiang 512 62 40874 21238 7593 3616
新疆生产建设兵团 Xinjiang Production and Construction Crops 17 754 345 76 46

8/2/2019 China Labour Statistical Yearbook - 2004
http://slidepdf.com/reader/full/china-labour-statistical-yearbook-2004 177/464
2-18 1 continued
单位:人,亿元 (person,100 million yuan)
本年减少
失业人员 下岗职工 富余人员 其他人员 从业人数
Unemployment Laid-off Surplus Others Employment
Workers Staff and Decreased
地 区 Region
Workers This Year
National 657171 432282 155284 205822 1349428
北 京 Beijing 10151 25569 6576 39237
天 津 Tianjin 20171 9161 8453 13221
河 北 Hebei 20380 24479 5036 7853 26279
山 西 Shanxi 923 999 185 2009 64575
内 蒙 古 Inner Mongolia 37522 21777 5558 11839 38660
辽 宁 Liaoning 132902 96113 624 37362 118111
吉 林 Jilin 5545 42067 1175 1255 144908
黑 龙 江 Heilongjiang 38497 14538 2418 2983 67067
上
海Shanghai 52996 28734 21896 34364 144940
江 苏 Jiangsu 45269 9823 9101 8389 73813
浙 江 Zhejiang 10463 2641 3004 10778 15408
安 徽 Anhui 5794 2774 3490 1114 8082
福 建 Fujian 11291 936 94 5484 14751
江 西 Jiangxi 2827 4798 1100 645 10537
山 东 Shandong 35710 14202 6845 5172 31360
河 南 Henan 7318 7633 4611 6816 25187
湖 北 Hubei 29029 14563 27300 3680 32008
湖 南 Hunan 89411 90349 23391 20069 20097
广 东 Guangdong 7020 896 40 2564 12175
广 西 Guangxi 1694 272 245 1038 12496
海 南 Hainan 20 8 37 451
重 庆 Chongqing 3512 1981 1306 3741 11996
四 川 Sichuan 55211 25995 6104 6203 31270
贵 州 Guizhou 3346 724 316 830 6802
云 南 Yunnan 1845 1290 1082 5141 9080
西 藏 Tibet
陕 西 Shaanxi 17681 7839 2200 7068 16728
甘 肃 Gansu 5791 3778 768 617 335446
青 海 Qinghai 594 1808 29 1515 3560
宁 夏 Ningxia 1342 811 242 322 4142
新 疆 Xinjiang 2886 1293 1555 1859 16710
新疆生产建设兵团 Xinjiang Production and Construction Crops 30 46 331
2-18 2 continued
单位:人,亿元 (person,100 million yuan)
年末实有 工资总额 增加值
就业人数 #女 性 #残疾人
Employment Female The Total Added地 区 Region at This Disabled Wages of Value
Year-end Staff and
Workers
National 5740882 2671586 67157 2719 4248
北 京 Beijing 153086 79116 3524 182.4 722.5
天 津 Tianjin 104052 43124 279 68.2 206.7
河 北 Hebei 253989 113293 1912 101 182.4
山 西 Shanxi 133159 70795 513 63.1 66.9
内 蒙 古 Inner Mongolia 263254 116230 1821 101.2 116.3

8/2/2019 China Labour Statistical Yearbook - 2004
http://slidepdf.com/reader/full/china-labour-statistical-yearbook-2004 178/464
辽 宁 Liaoning 612910 378330 3481 180.7 92.9
吉 林 Jilin 247171 122352 799 49.7 124
黑 龙 江 Heilongjiang 253274 89339 887 84.2 96.1
上 海 Shanghai 318189 135070 1552 160.8 354.7
江 苏 Jiangsu 308387 122638 1069 0.2 0.4
浙 江 Zhejiang 120869 46062 367 151.4 483.2
安 徽 Anhui 393569 163565 3728 242 252.1
福 建 Fujian 34577 17299 236 33.1 15.6
江 西 Jiangxi 99161 40018 698 54.5 78.3
山 东 Shandong 446988 176457 3668 173.3 299.8
河 南 Henan 240853 130175 2763 83.7 122.4
湖 北 Hubei 430696 187548 28084 181.6 58.6
湖 南 Hunan 430059 218028 4447 184.1 240.1
广 东 Guangdong 32050 12200 183 34.4 44.9
广 西 Guangxi 33882 15776 101 20.2 35
海 南 Hainan 2621 1960 5 2.1
重 庆 Chongqing 60899 22246 374 40.3 72.6四 川 Sichuan 358788 177580 1481 176.5 228.6
贵 州 Guizhou 32345 12594 59 18.9 32.3
云 南 Yunnan 66278 25657 603 155.5 98.7
西 藏 Tibet
陕 西 Shaanxi 145180 80005 3343 60.6 59.9
甘 肃 Gansu 75418 28641 396 43.6 73.4
青 海 Qinghai 12161 5413 100 9.6 11.3
宁 夏 Ningxia 44761 23620 219 28.1 47
新 疆 Xinjiang 31757 16191 453 33.4 30.9
新疆生产建设兵团 Xinjiang Production and Construction Crops 499 264 12 0.2 0.1
2-18 3 continued
单位:人,亿元 (person,100 million yuan)
上缴税金 利 润 资产总计
Taxes #所得税 Profits Total 流动资产
Turned Income Assets Circulating
地 区 Region Over to Tax Assets
the State
National 97.1 24.0 73.8 2682.7 1574.6
北 京 Beijing 10.1 2.6 9.7 186.6 139.2
天 津 Tianjin 4.8 1.1 5.1 271.1 234.3
河 北 Hebei 4.1 1.3 1.3 83.5 48.2
山 西 Shanxi 1.8 0.2 0.8 136.0 69.7
内 蒙 古 Inner Mongolia 2.3 0.2 1.0 55.1 28.3
辽 宁 Liaoning 5.0 0.9 1.0 200.7 102.1
吉 林 Jilin 3.2 0.9 0.1 84.0 27.6
黑 龙 江 Heilongjiang 3.5 0.9 0.4 71.7 42.8
上 海 Shanghai 11.4 3.2 17.2 419.8 201.9
江 苏 Jiangsu 0.3 0.2
浙 江 Zhejiang 11.1 3.9 9.2 175.6 125.0
安 徽 Anhui 2.6 0.8 4.6 119.4 46.7
福 建 Fujian 0.5 0.2 0.4 8.4 6.7
江 西 Jiangxi 1.4 0.5 1.1 44.7 28.2
山 东 Shandong 8.6 2.1 5.5 186.8 108.8
河 南 Henan 3.1 0.5 1.3 46.3 26.7
湖 北 Hubei 1.6 0.3 1.5 26.5 10.7
湖 南 Hunan 4.6 0.6 1.6 53.4 29.0

8/2/2019 China Labour Statistical Yearbook - 2004
http://slidepdf.com/reader/full/china-labour-statistical-yearbook-2004 179/464
广 东 Guangdong 1.5 0.4 2.0 31.1 22.5
广 西 Guangxi 0.6 0.1 0.2 44.5 27.8
海 南 Hainan 1.1 0.7
重 庆 Chongqing 1.9 0.7 1.9 60.9 37.5
四 川 Sichuan 3.5 0.5 1.4 142.7 81.9
贵 州 Guizhou 0.5 0.2 0.8 15.1 8.5
云 南 Yunnan 4.0 0.8 2.8 75.0 41.1
西 藏 Tibet
陕 西 Shaanxi 1.3 0.2 0.6 43.9 23.4
甘 肃 Gansu 2.0 0.5 0.9 40.5 23.3
青 海 Qinghai 0.2 -0.1 10.1 3.8
宁 夏 Ningxia 1.0 0.1 0.7 23.0 12.4
新 疆 Xinjiang 0.9 0.2 0.6 24.6 15.2
新疆生产建设兵团 Xinjiang
Production and Construction Crops 0.1 0.6 0.4
2-18 4 continued
单位:人,亿元 (person,100 million yuan)
负债及所有者
固定资 其他资产 Total 负 债 所有者
产净值 Other Liabilities Liabilities 权 益
Net Value Assets Creditors' Creditors'
of Fixed Equity Equity
Assets
地 区 Region
National 656.4 451.8 2682.7 1684.9 997.9
北 京 Beijing 23.2 24.3 186.6 122.4 64.2
天 津 Tianjin 25.5 11.3 271.1 156.4 114.7
河 北 Hebei 23.8 11.4 83.5 53.5 29.9
山 西 Shanxi 54.5 11.8 136.0 79.7 56.3
内 蒙 古 Inner Mongolia 22.2 4.6 55.1 26.2 29.0
辽 宁 Liaoning 65.6 33.0 200.7 143.5 57.2
吉 林 Jilin 22.4 34.0 84.0 63.3 20.7
黑 龙 江 Heilongjiang 23.9 5.0 71.7 45.4 26.3
上 海 Shanghai 43.6 174.3 419.8 323.5 96.2
江 苏 Jiangsu 0.3 0.2 0.1
浙 江 Zhejiang 34.6 16.0 175.6 98.4 77.2
安 徽 Anhui 65.3 7.3 119.4 62.2 57.2
福 建 Fujian 1.3 0.5 8.4 5.1 3.3
江 西 Jiangxi 7.1 9.3 44.7 29.2 15.5
山 东 Shandong 54.2 23.8 186.8 112.3 74.5
河 南 Henan 16.0 3.7 46.3 23.1 23.2
湖 北 Hubei 14.2 1.6 26.5 15.1 11.4
湖 南 Hunan 14.0 10.5 53.4 29.0 24.4
广 东 Guangdong 6.0 2.6 31.1 15.2 15.9
广 西 Guangxi 15.4 1.3 44.5 25.3 19.1
海 南 Hainan 0.3 0.1 1.1 0.3 0.8
重 庆 Chongqing 12.8 10.6 60.9 37.1 23.8
四 川 Sichuan 38.5 22.2 142.7 87.5 55.2
贵 州 Guizhou 5.8 0.8 15.1 8.4 6.7
云 南 Yunnan 16.9 16.9 75.0 41.0 34.0
西 藏 Tibet
陕 西 Shaanxi 13.8 6.7 43.9 29.0 14.8
甘 肃 Gansu 14.7 2.5 40.5 21.8 18.7
青 海 Qinghai 6.2 0.1 10.1 5.4 4.7
宁 夏 Ningxia 7.9 2.7 23.0 12.7 10.3

8/2/2019 China Labour Statistical Yearbook - 2004
http://slidepdf.com/reader/full/china-labour-statistical-yearbook-2004 180/464
新 疆 Xinjiang 6.5 2.9 24.6 12.4 12.2
新疆生产建设兵团 Xinjiang
Production and Construction Crops 0.1 0.6 0.4 0.2

8/2/2019 China Labour Statistical Yearbook - 2004
http://slidepdf.com/reader/full/china-labour-statistical-yearbook-2004 181/464
3-1
EMPLOYMENT AND EARNINGS BY SECTOR
(2003)
年末人数 劳动报酬 平均劳动
(千人) # 女 性
(亿元) 报 酬
Year-end Earnings (元)
项 目 Item Figures Female Average
(1 000 (100 million Earning
persons) yuan ) (yuan)
National Total 109697 41561 15329.6 13969
其中:国有控股 State-owned & Controlling Share Hold Enterprises 46925 16397 6818.5 14391
Grouped by Enterprises,Institutions
and Agencies
企业 Enterprises 71724 26537 9773.3 13585
事业 Institutions 27242 12263 3895.7 14363
机关 Agencies and Organizations 10716 2756 1659.4 15560
Grouped by Sector
Agriculture,Forestry,Farming of Animals 4845 1761 335.8 6884
and Fishing
农业 Agriculture 2405 974 153.3 6278
林业 Forestry 1181 392 71.4 6104
畜牧业 Farming of Animals 268 99 17.8 6561
渔业 Fishing 85 25 8.3 9528
农、林、牧、渔服务业 Service Activities for Agriculture, Forestry, 906 271 84.9 9367
Farming of Animals and Fishing
Mining 4883 1197 662.9 13627
煤炭开采和洗选业 Mining and Washing of Coal 3315 725 391.0 11894
石油和天然气开采业 Extraction of Petroleum and Natural Gas 862 285 198.2 23082
黑色金属矿采选业 Mining of Ferrous Metal Ores 158 40 19.5 12208
有色金属矿采选业 Mining of Non-ferrous Metal Ores 291 75 30.6 10394
非金属矿采选业 Mining and Processing of Nonmetal Ores 246 68 22.8 8980
其它采矿业 Mining of Other Ores n.e.c 11 5 0.8 7546
Manufacturing 29805 12927 3772.7 12671
农副食品加工业 Processing of Food from Agricultural Products 950 392 82.2 8727
食品制造业 Manufacture of Foods 657 324 71.3 11157
饮料制造业 Manufacture of Beverage 749 297 79.7 10746
烟草制品业 Manufacture of Tobacco 222 95 60.1 27143
纺织业 Manufacture of Textile 2718 1769 222.2 8079
纺织服装、鞋、帽制造业 Manufacture of Textile Wearing Apparel, 1391 1002 137.4 10090
Footware,and Caps
皮革、毛皮、羽毛(绒)及其 Manufacture of Leather,Fur,Feather & Its Products
制品业 635 438 61.2 9883
木材加工及木、竹、藤、棕、草 Processing of Timbers,Manufacture of Wood,
制品业 Bamboo,Rattan,Palm,and Straw Products 294 121 23.2 7879
家具制造业 Manufacture of Furniture 189 67 17.4 9501
造纸及纸制品业 Manufacture of Paper and Paper Products 575 226 58.3 10067
印刷业和记录媒介的复制 Printing,Reproduction of Recording Media 477 230 56.7 11707
文教体育用品制造业 Manufacture of Articles for Culture, 333 209 38.0 11432
Education and Sport Activity
注:不含城镇私营和个体就业
a)Exclude urban Private and individuals Employment.(same as below)

8/2/2019 China Labour Statistical Yearbook - 2004
http://slidepdf.com/reader/full/china-labour-statistical-yearbook-2004 182/464
3-1 2 continued
年末人数 劳动报酬 平均劳动
(千人) # 女 性
(亿元) 报 酬
Year-end Earnings (元)
项 目 Item Figures Female Average
(1 000 (100 million Earningpersons) yuan ) (yuan)
装卸搬运和其他运输服务业 Loading,Unloading,Portage and Other Transport 306 84 43.6 14512
Services
仓储业 Storage 376 121 40.6 10426
邮政业 Post 517 202 90.3 17642
Information Transfer, Computer Services 1168 421 356 30897
and Software
电信和其他信息传输服务业 Telecom & Other Information Transfer Services 914 335 258.9 28574
计算机服务业 Computer Services 92 34 39.2 43143
软件业 Software Industry 162 53 57.9 37276
Wholesale and Retail Trade 6281 2803 696.3 10894
批发业 Wholesale 3417 1320 427.7 12231
零售业 Retail Trade 2864 1483 268.6 9280
Accommodation and Restaurants 1721 950 190.9 11198
住宿业 Accommodation 1128 613 131 11688
餐饮业 Restaurants 593 337 59.9 10258
Finance 3533 1645 734.4 20780
银行业 Bank 2581 1141 556.8 21336
证券业 Securities 65 27 28.2 42920
保险业 Insurance 847 461 136.6 16676
其他金融活动 Other Financial Activities 40 15 12.9 32254
Real Estate 1202 404 202.7 17085
房地产开发经营 Real Estate Exploitation Management 595 189 105.0 17710
物业管理 Management Concerning Dwelling 454 154 71.9 16285
房地产中介服务 Real Estate Agency Service 47 20 9.0 19534
Tenancy and Business Services 1835 627 305.2 17020
租赁业 Tenancy 36 12 4.7 13117
商务服务业 Business Service 1799 615 300.5 17099
Scientific Research,Technical Service 2219 707 454.4 20442
and Geologic Perambulation
研究与试验发展 Research and Experimental Development 638 222 140.8 22051
# 自然科学研究与试验发展 Research and Experimental Development 180 61 40.5 22337
on Physical Science
工程和技术研究与试验发展 Research and Experimental Development 260 87 64.2 24668
on Engineering and Technical Research
农业科学研究与试验发展 Research and Experimental Development 96 34 14.8 15497
on Agricultural Science Research
医学研究与试验发展 Research and Experimental Development 27 14 5.1 18909
on Medical Research
社会人文科学研究与试验发展 Research and Experimental Development 74 27 16.1 21778
on Social Science and Humanities
专业技术服务业 Professional Technique Services 1041 327 228.5 21880

8/2/2019 China Labour Statistical Yearbook - 2004
http://slidepdf.com/reader/full/china-labour-statistical-yearbook-2004 183/464
3-1 3 continued
年末人数 劳动报酬 平均劳动
(千人) # 女 性
(亿元) 报 酬
Year-end Earnings (元)
项 目 Item Figures Female Average
(1 000 (100 million Earningpersons) yuan ) (yuan)
# 气象服务 Weather Services 50 18 9.2 18406
地震服务 Earthquake Services 14 4 2.3 16764
海洋服务 Ocean Services 6 1 1.4 23153
测绘服务 Plotting Services 40 12 7.8 19447
技术检测 Technique Detection 154 53 28.2 18395
环境监测 Environmental Monitoring 46 17 7.5 16591
工程技术与规划管理 Engineering Technic & Programming Management 523 153 121.4 22849
科技交流和推广服务业 Services of Science and Technique 224 79 36.6 16527
Intercommunion and Generalization
地质勘查业 Geologic Perambulation 317 79 48.5 15231
Management of Water Conservancy, 1725 688 202.6 11774
Environment and Public Establishment
水利管理业 Management of Water Conservancy 482 130 54.1 11223
环境管理业 Environmental Management 723 358 76.5 10736
公共设施管理业 Management of Public Establishment 520 200 72 13685
Resident Services and Other Services 528 222 66.4 12665
居民服务业 Resident Services 241 110 30.3 12692
其他服务业 Other Services 287 112 36.1 12642
Education 14428 6728 2035.9 14189
#初等教育 Primary Education 6259 3099 748.7 11957
中等教育 Secondary Education 6031 2598 854.7 14308
高等教育 Higher Education 1414 598 323.8 23307
Sanitation,Social Security & Social Welfare 4858 2845 782.1 16185
卫生 Sanitation 4643 2746 749.4 16226
社会保障业 Social Security 96 42 14.8 15541
社会福利业 Social Welfare 119 57 17.9 15107
Culture, Sports and Entertainment 1278 519 217.9 17098
新闻出版业 Journalism and Publishing Activities 232 90 60.2 26102
广播、电影、电视和音像业 Broadcasting,Movies,Television and 488 187 73.1 14978
Audiovisual Activities
文化艺术业 Culture and Art 400 178 58.7 14759
体育 Sports Activities 87 31 16.4 18934
娱乐业 Entertainment 71 33 9.5 13336
Public Management & Social Organization 11710 3081 1787.6 15355
# 中国共产党机关 Chinese Communist Party Organs 472 106 72.1 15396
国家机构 Organ of State 10832 2826 1652.7 15336
人民政协和民主党派 People's Political Consultative Conference 87 20 14.8 17159
and democratic parties
群众社团、社会团体和宗教 Mass communities, social communities and
组织 religion organizations 189 75 32.3 17112

8/2/2019 China Labour Statistical Yearbook - 2004
http://slidepdf.com/reader/full/china-labour-statistical-yearbook-2004 184/464
3-2
ON-POST STAFF AND WORKERS AND WAGES BY SECTOR
(2003)
年末人数 工资总额 平均人数 平均工资
(千人) (亿元) (千人) (元)
项 目 Item Year-end Total Average Average
Figures Wages Figures Wage
(1 000 (100 million (1 000
persons) yuan) persons) (yuan)
National Total 104920 14743.5 105014 14040
其中:国有控股 State-owned & Controlling Share Hold Enterprises 44614 6562.5 45078 14558
Grouped by Enterprises,Institutions
and Agencies
企业 Enterprises 67968 9263.8 68225 13578
事业 Institutions 26437 3833.8 26324 14564
机关 Agencies and Organizations 10501 1644.7 10452 15736
Grouped by SectorAgriculture,Forestry,Farming of Animals 4597 322.6 4630 6969
and Fishing
农业 Agriculture 2212 143.1 2250 6360
林业 Forestry 1157 70.4 1146 6139
畜牧业 Farming of Animals 258 17.1 260 6585
渔业 Fishing 82 8.0 85 9489
农、林、牧、渔服务业 Service Activities for Agriculture, Forestry, 888 84.0 888 9453
Farming of Animals and Fishing
Mining 4810 655.6 4791 13682
煤炭开采和洗选业 Mining and Washing of Coal 3284 388.2 3255 11926
石油和天然气开采业 Extraction of Petroleum and Natural Gas 835 195.0 834 23388
黑色金属矿采选业 Mining of Ferrous Metal Ores 155 19.2 157 12254
有色金属矿采选业 Mining of Non-ferrous Metal Ores 284 29.9 286 10457
非金属矿采选业 Mining and Processing of Nonmetal Ores 241 22.4 248 9005
其他采矿业 Mining of Other Ores n.e.c 11 0.8 11 7592
Manufacturing 28989 3621.4 28980 12496
农副食品加工业 Processing of Food from Agricultural Products 915 79.0 912 8663
食品制造业 Manufacture of Foods 625 65.9 607 10870
饮料制造业 Manufacture of Beverage 733 77.5 725 10696
烟草制品业 Manufacture of Tobacco 220 59.9 219 27335
纺织业 Manufacture of Textile 2675 216.4 2707 7993
纺织服装、鞋、帽制造业 Manufacture of Textile Wearing Apparel, 1349 130.6 1319 9903
Footware,and Caps
皮革、毛皮、羽毛(绒) Manufacture of Leather,Fur,Feather and
及其制品业 Its Products 625 58.7 609 9641
木材加工及木、竹、藤、棕、 Processing of Timbers,Manufacture of Wood,
草制品业 Bamboo,Rattan,Palm,and Straw Products 284 22.1 284 7761
家具制造业 Manufacture of Furniture 182 16.3 176 9282
造纸及纸制品业 Manufacture of Paper and Paper Products 559 55.1 564 9781
印刷业和记录媒介的复制 Printing,Reproduction of Recording Media 463 54.8 469 11673
文教体育用品制造业 Manufacture of Articles for Culture, 325 35.9 324 11088
Education and Sport Activity
3-2 1 continued
年末人数 工资总额 平均人数 平均工资
(千人) (亿元) (千人) (元)
项 目 Item Year-end Total Average Average
Figures Wages Figures Wage
(1 000 (100 million (1 000
persons) yuan) persons) (yuan)
石油加工、炼焦及核燃料加工业 Processing of Petroleum ,Coking,Processing 517 109.4 524 20865
of Nucleus Fuel

8/2/2019 China Labour Statistical Yearbook - 2004
http://slidepdf.com/reader/full/china-labour-statistical-yearbook-2004 185/464
化工原料及化学制品制造业 Manufacture of Chemical Raw Material and 2121 258.2 2138 12073
Chemical Products
医药制造业 Manufacture of Medicines 866 124.2 859 14458
化学纤维制造业 Manufacture of Chemical Fiber 202 25.1 205 12266
橡胶制品业 Manufacture of Rubber 364 40 372 10757
塑料制品业 Manufacture of Plastic 610 65.5 602 10882
非金属矿物制品业 Manufacture of Non-metallic Mineral Products 2036 187 2051 9118
黑色金属冶炼及压延加工业 Manufacture and Processing of Ferrous Metals 1883 344.2 1907 18052
有色金属冶炼及压延加工业 Manufacture & Processing of Non-ferrous Metals 775 107.5 786 13689
金属制品业 Manufacture of Metal Products 784 84.7 780 10861
通用设备制造业 Manufacture of General Purpose Machinery 1830 234.5 1855 12639
专用设备制造业 Manufacture of Special Purpose Machinery 1613 193.8 1627 11911
交通运输设备制造业 Manufacture of Transport Equipment 2239 362.4 2249 16114
电气机械及器材制造业 Manufacture of Electrical Machinery & Equipment 1374 179.6 1376 13055
通信设备、计算机及其他电子 Manufacture of Communication Equipment,
设备制造业 Computer and Other Electronic Equipment 1744 303.2 1673 18117
仪器仪表及文化、办公用机械 Manufacture of Measuring Instrument and
制造业 Machinery for Cultural Activity & Office Work 530 76.4 525 14564
工艺品及其他制造业 Manufacture of Artwork,Other Manufacture n.e.c 518 50.1 510 9827
废弃资源和废旧材料回收加工业 Recycling and Disposal of Waste 26 3.3 27 12296
Production and Distribution of Electricity, Gas and Water 2923 547.6 2920 18752
电力、热力的生产和供应业 Production and Supply of Electric Power 2243 448.2 2240 20013
and Heat Power
燃气生产和供应业 Production and Distribution of Gas 181 28.6 182 15700
水的生产和供应业 Production and Distribution of Water 499 70.7 498 14200
Construction 7735 905.2 7886 11478
房屋和土木工程建筑业 Construction of Building & Civil Engineering 6760 758.7 6875 11036
建筑安装业 Architectural Installation 684 109.2 716 15253
建筑装饰业 Architectural Decoration 183 23 187 12282
其他建筑业 Other Construction 109 14.3 108 13214
Traffic,Transport,Storage and Post 6097 980.7 6140 15973
铁路运输业 Transport Via Railway 1728 313.5 1728 18140
道路运输业 Transport Via Road 1625 183.3 1643 11157
城市公共交通业 Urban Public Traffic 889 123.7 885 13977
水上运输业 Water Transport 570 131.2 583 22506
航空运输业 Air Transport 179 59.6 179 33377
管道运输业 Transport Via Pipeline 21 5.4 21 25761
3-2 2 continued
年末人数 工资总额 平均人数 平均工资
(千人) (亿元) (千人) (元)
项 目 Item Year-end Total Average Average
Figures Wages Figures Wage
(1 000 (100 million (1 000
persons) yuan) persons) (yuan)
装卸搬运和其他运输服务业 Loading,Unloading,Portage and Other Transport 277 40.9 278 14695
Services
仓储业 Storage 367 39.3 380 10359
邮政业 Post 442 83.7 443 18907
Information Transfer, Computer Services 1040 331.3 1027 32244
and Software
电信和其他信息传输服务业 Telecom & Other Information Transfer Services 813 245.9 807 30481
计算机服务业 Computer Services 84 34.4 82 41722
软件业 Software Industry 143 51.0 138 36873
Wholesale and Retail Trade 5920 660.5 6038 10939
批发业 Wholesale 3244 408.8 3325 12295
零售业 Retail Trade 2676 251.6 2712 9277
Accommodation and Restaurants 1594 175.3 1582 11083
住宿业 Accommodation 1063 121.6 1056 11524
餐饮业Restaurants 531 53.7 526 10200

8/2/2019 China Labour Statistical Yearbook - 2004
http://slidepdf.com/reader/full/china-labour-statistical-yearbook-2004 186/464
Finance 2862 646.8 2880 22457
银行业 Bank 2441 537.0 2465 21783
证券业 Securities 63 27.1 64 42582
保险业 Insurance 320 71.0 315 22576
其他金融活动 Other Financial Activities 37 11.7 37 31651
Real Estate 1083 184.0 1071.0 17182
# 房地产开发经营 Real Estate Exploitation Management 547 95.5 545.0 17514
物业管理 Management Concerning Dwelling 391 64.1 382.0 16799
房地产中介服务 Real Estate Agency Service 43 8.1 42.0 19242
Tenancy and Business Services 1676 271.7 1647.0 16501
租赁业 Tenancy 32 4.2 32.0 13196
商务服务业 Business Service 1644 267.5 1614.0 16566
Scientific Research,Technical Service
and Geologic Perambulation 2063 427.7 2072 20636
研究与试验发展 Research and Experimental Development 611 137.1 612.0 22391
# 自然科学研究与试验发展 Research and Experimental Development 172 39.4 174 22665
on Physical Science
工程和技术研究与试验发展 Research and Experimental Development 249 62.5 249 25062
on Engineering and Technical Research
农业科学研究与试验发展 Research and Experimental Development 93 14.6 93 15659
on Agricultural Science Research医学研究与试验发展 Research and Experimental Development 24 4.8 24 19857
on Medical Research
社会人文科学研究与试验发展 Research and Experimental Development 72 15.8 71 22056
on Social Science and Humanities
专业技术服务业 Professional Technique Services 945 209.7 951 22046
3-2 3 continued
年末人数 工资总额 平均人数 平均工资
(千人) (亿元) (千人) (元)
项 目 Item Year-end Total Average Average
Figures Wages Figures Wage
(1 000 (100 million (1 000
persons) yuan) persons) (yuan)
# 气象服务 Weather Services 49 9.1 49 18542
地震服务 Earthquake Services 13 2.3 13 16918
海洋服务 Ocean Services 6 1.4 6 23169
测绘服务 Plotting Services 39 7.6 39 19830
技术检测 Technique Detection 147 27.1 146 18507
环境监测 Environmental Monitoring 45 7.4 44 16830
工程技术与规划管理 Engineering Technic & Programming Management 470 111.4 480 23222
科技交流和推广服务业 Services of Science and Technique 196 33.0 195 16877
Intercommunion and Generalization
地质勘查业 Geologic Perambulation 311 48.0 314 15277
Management of Water Conservancy, 1639 197.6 1634 12095
Environment and Public Establishment
水利管理业 Management of Water Conservancy 474 53.7 474 11322
环境管理业 Environmental Management 661 73.2 650 11255
公共设施管理业 Management of Public Establishment 504 70.8 510 13885
Resident Services and Other Services 475 60.1 466 12900
居民服务业 Resident Services 219 28.1 216 13009
其他服务业 Other Services 256 32.0 250 12806
Education 14017 2007.3 13941 14399
# 初等教育 Primary Education 6057 740.4 6058 12223
中等教育 Secondary Education 5906 843.3 5850 14415
高等教育 Higher Education 1368 318.2 1346 23639
Sanitation,Social Security & Social Welfare 4717 767.6 4694 16352
卫生 Sanitation 4511 735.6 4489 16389
社会保障业 Social Security 93 14.6 93 15729
社会福利业 Social Welfare 113 17.3 113 15396
Culture, Sports and Entertainment 1220 210.3 1218 17268
新闻出版业 Journalism and Publishing Activities 216 57.9 215 26917
广播、电影、电视和音像业 Broadcasting,Movies,Television and 469 70.9 470 15098

8/2/2019 China Labour Statistical Yearbook - 2004
http://slidepdf.com/reader/full/china-labour-statistical-yearbook-2004 187/464
Audiovisual Activities
文化艺术业 Culture and Art 386 57.3 384 14919
体育 Sports Activities 83 15.7 83 18934
娱乐业 Entertainment 66 8.5 66 12875
Public Management & Social Organization 11463 1770.5 11398 15533
# 中国共产党机关 Chinese Communist Party Organs 468 71.8 465 15456
国家机构 Organ of State 10603 1637.1 10551 15517
人民政协和民主党派 People's Political Consultative Conference 85 14.7 85 17327
and democratic parties
群众社团、社会团体和宗教 Mass communities, social communities and
组织 religion organizations 181 31.4 180 17481
3-3
EMPLOYMENT AND EARNINGS BY SECTOR AND REGION
(2003)
总 计 企 业Total Enterprises
年末人数 劳动报酬 平均劳动 年末人数 劳动报酬 平均劳动
地 区 Region (人) # 女 性
(千元) 报 酬 (人) # 女 性
(千元) 报 酬
Year-end Earnings (元) Year-end Earnings (元)
Figures Female Average Figures Female Average
(1 000 Earning (1 000 Earning
(person) yuan) (yuan) (person) yuan) (yuan)
National 109696966 41561314 1532964411 13969 71723648 26536618 977330628 13585
北 京 Beijing 4912329 1777655 122029894 25008 3886653 1293026 91947568 23813
天 津 Tianjin 1910163 762780 35060360 18511 1454092 558587 26459419 18347
河 北 Hebei 4992452 1935833 55926384 11105 3025691 1061170 33644055 10939
山 西 Shanxi 3569271 1262706 37718753 10620 2335854 733863 24205101 10410
内蒙古 Inner Mongolia 2443525 925843 27538313 11208 1482285 530783 15304511 10175
辽 宁 Liaoning 5001608 1913367 66658382 12921 3466301 1242832 46129988 12750
吉 林 Jilin 2918560 1133290 32635178 11048 1886436 689756 20727097 10763
黑龙江 Heilongjiang 5152706 1837024 55444015 10787 3877369 1317814 39272627 10155
上 海 Shanghai 3421139 1350101 87306289 25565 2671305 996628 67379671 25267
江 苏 Jiangsu 6085126 2429843 95627818 15619 4107196 1688416 60076833 14498
浙 江 Zhejiang 3928059 1503209 81573596 21116 2612080 953676 46733170 18232
安 徽 Anhui 3545710 1199081 37244502 10419 2136806 730942 20899104 9638
福 建 Fujian 3446293 1513006 48457009 14343 2471041 1138961 33406462 13885
江 西 Jiangxi 2676879 934579 27868524 10382 1508250 542315 14832717 9749
山 东 Shandong 7784927 3129903 97439958 12554 5157800 2148968 61839489 12008
河 南 Henan 7016920 2625086 73273744 10639 4395597 1575742 45338621 10557
湖 北 Hubei 5023952 1976210 53162077 10575 3253785 1324622 32485585 9978
湖 南 Hunan 4016367 1425914 48291387 12002 2256828 769035 25692830 11340
广 东 Guangdong 7811366 3351636 155512438 20052 5473319 2373535 103037115 18951
广 西 Guangxi 2717362 1035239 31436605 11611 1494458 541453 16791453 11258
海 南 Hainan 735419 287315 7737892 10396 491492 198843 4454709 8894
重 庆 Chongqing 2102163 708213 25965923 12409 1411683 449407 16833695 11979
四 川 Sichuan 5056792 1725276 62249889 12320 3016498 968486 34891919 11525
贵 州 Guizhou 1974507 653276 21445067 10801 1110827 356547 12223105 10853
云 南 Yunnan 2532534 930040 32055896 12629 1335089 469671 16494148 12260
西 藏 Tibet 173696 57827 4090114 23730 52055 17290 921317 17977
陕 西 Shaanxi 3302938 1159123 37279125 11276 1998791 672850 22671187 11303
甘 肃 Gansu 1954235 640636 23408862 12062 1135903 371735 12853757 11410
青 海 Qinghai 426758 154644 6457507 15044 229486 78144 3352437 14409
宁 夏 Ningxia 616436 219268 8124173 12811 392529 132732 5042495 12270
新 疆 Xinjiang 2446774 1003391 33944737 13185 1596149 608789 21388443 12409

8/2/2019 China Labour Statistical Yearbook - 2004
http://slidepdf.com/reader/full/china-labour-statistical-yearbook-2004 188/464
3-3 1 continued
事 业 机 关
Institutions Agencies and Organizations
年末人数 劳动报酬 平均劳动 年末人数 劳动报酬 平均劳动
地 区 Region (人) # 女 性
(千元) 报 酬 (人) # 女 性
(千元) 报 酬
Year-end Earnings (元) Year-end Earnings (元)
Figures Female Average Figures Female Average
(1 000 Earning (1 000 Earning
(person) yuan) (yuan) (person) yuan) (yuan)
National 27242381 12263085 389571426 14363 10715918 2755681 165940995 15560
北 京 Beijing 786365 405976 23021701 29467 239311 78653 7060625 29788
天 津 Tianjin 332519 172190 6217253 18717 123552 32003 2383688 19915
河 北 Hebei 1389311 722273 15350678 11088 577450 152390 6931651 12035
山 西 Shanxi 846766 423938 9167337 10897 386651 104905 4346315 11280
内蒙古 Inner Mongolia 682847 315445 8426518 12460 278393 79615 3807284 13764
辽 宁 Liaoning 1146613 571704 14802514 12866 388694 98831 5725880 14672
吉 林 Jilin 794796 384576 9037994 11386 234791 58951 2825556 12149
黑龙江 Heilongjiang 929242 426666 11396149 12300 346095 92544 4775239 13801
上 海 Shanghai 591077 305280 15325610 25969 158757 48193 4601008 29077
江 苏 Jiangsu 1537087 650988 25785554 16750 440843 90439 9765431 22230
浙 江 Zhejiang 951638 466175 24226297 25831 364341 83358 10614129 29326
安 徽 Anhui 1040502 383298 11601677 11180 368402 84841 4743721 12879
福 建 Fujian 688074 310240 10327423 15053 287178 63805 4723124 16486
江 西 Jiangxi 829412 310322 9051252 10960 339217 81942 3984555 11823
山 东 Shandong 1870400 801882 25229049 13572 756727 179053 10371420 13773
河 南 Henan 1769489 812863 18701131 10679 851834 236481 9233992 10971
湖 北 Hubei 1283187 530927 14440736 11262 485495 119924 6224625 12769
湖 南 Hunan 1210065 517176 15593597 12900 549158 139576 7002603 12759
广 东 Guangdong 1644234 809939 34628624 21203 693813 168162 17846699 26055
广 西 Guangxi 948550 421759 10842441 11499 274243 71934 3801668 13933
海 南 Hainan 166904 69455 2137537 12840 77023 19017 1145646 14890
重 庆 Chongqing 515284 215149 6631150 12914 175196 43657 2501078 14397
四 川 Sichuan 1466397 599618 19226001 13244 573897 157172 8131969 14182
贵 州 Guizhou 559753 214050 5823890 10476 303927 82679 3398072 11202
云 南 Yunnan 826474 358620 10842066 13143 360443 96797 4657830 13030
西 藏 Tibet 60921 23417 1481090 24468 60720 17120 1687707 27861
陕 西 Shaanxi 922850 395115 10347277 11242 381297 91158 4260661 11210
甘 肃 Gansu 577676 209716 7267208 12646 240656 59185 3287897 13729
青 海 Qinghai 131946 56119 2026086 15460 65326 20381 1078984 16469
宁 夏 Ningxia 159541 68641 2215200 13901 64366 17895 866478 13572
新 疆 Xinjiang 582461 309568 8400386 14386 268122 85020 4155460 15564
3-3 2 continued
农、林、牧、渔业 Agriculture 农 业
Forestry,Farming of Animals & Fishing Agriculture
年末人数 劳动报酬 平均劳动 年末人数 劳动报酬 平均劳动
地 区 Region (人) # 女 性
(千元) 报 酬 (人) # 女 性
(千元) 报 酬
Year-end Earnings (元) Year-end Earnings (元)
Figures Female Average Figures Female Average
(1 000 Earning (1 000 Earning
(person) yuan) (yuan) (person) yuan) (yuan)
National 4845416 1761176 33579506 6884 2405071 974047 15334772 6278
北 京 Beijing 29114 11009 441959 15034 5398 2274 66706 11364
天 津 Tianjin 9747 2828 131863 13257 2139 761 21713 9798

8/2/2019 China Labour Statistical Yearbook - 2004
http://slidepdf.com/reader/full/china-labour-statistical-yearbook-2004 189/464
河 北 Hebei 90863 30610 442259 4858 50413 18049 137643 2734
山 西 Shanxi 41080 11885 315175 7736 6210 1708 49850 8145
内蒙古 Inner Mongolia 323278 112696 2203779 6829 128785 49219 785431 6144
辽 宁 Liaoning 267643 107778 1349707 4990 189276 81634 668316 3517
吉 林 Jilin 209069 70076 1168677 5503 46437 16449 202392 4353
黑龙江 Heilongjiang 896888 298780 4738006 5403 468911 178362 2753888 5857
上 海 Shanghai 16686 4443 252778 15450 6393 2021 70988 12172
江 苏 Jiangsu 181408 67569 1368633 7399 109434 44407 739130 6636
浙 江 Zhejiang 26974 7537 446762 16367 4707 1746 47220 9728
安 徽 Anhui 121655 46238 716269 5872 62763 26509 303698 4870
福 建 Fujian 77502 28670 609053 7781 38828 17288 198547 5116
江 西 Jiangxi 165955 56499 919954 5492 81193 31420 384729 4691
山 东 Shandong 93708 29389 814059 8617 8248 2440 60780 6966
河 南 Henan 96324 31383 583915 6115 28652 10152 153168 5369
湖 北 Hubei 304805 124922 1608718 5299 225181 101176 1127314 5043
湖 南 Hunan 181408 67759 952757 5291 122515 49856 533926 4412
广 东 Guangdong 132348 48636 1201056 8990 69288 29741 468317 6742
广 西 Guangxi 140544 52950 938420 6643 71498 30711 375006 5187海 南 Hainan 204669 95043 992579 4784 17598 6955 76387 4303
重 庆 Chongqing 24646 6446 221343 8875 1254 433 10323 8077
四 川 Sichuan 112681 29073 1017989 8902 5344 1991 60130 10856
贵 州 Guizhou 44030 12630 365778 8263 8701 3300 59942 6655
云 南 Yunnan 175983 66633 1625624 9212 46304 19718 244849 5305
西 藏 Tibet 4881 930 63747 13149 948 378 13039 13769
陕 西 Shaanxi 65538 18769 535737 8177 10412 3125 81954 7740
甘 肃 Gansu 86691 26721 763887 8874 32132 11801 214460 6642
青 海 Qinghai 22930 6183 242126 10577 7657 1616 45960 5956
宁 夏 Ningxia 44268 18835 372362 8269 29764 13909 178535 5990
新 疆 Xinjiang 652100 268256 6174535 8984 518688 214898 5200431 9396
3-3 3 continued
林 业 畜牧业
Forestry Farming of Animals
年末人数 劳动报酬 平均劳动 年末人数 劳动报酬 平均劳动
地 区 Region (人) # 女 性
(千元) 报 酬 (人) # 女 性
(千元) 报 酬
Year-end Earnings (元) Year-end Earnings (元)Figures Female Average Figures Female Average
(1 000 Earning (1 000 Earning
(person) yuan) (yuan) (person) yuan) (yuan)
National 1181263 392421 7142587 6104 268281 98791 1777490 6561
北 京 Beijing 3134 1000 49273 12987 11411 4456 163818 14504
天 津 Tianjin 671 168 10642 15468 1750 593 22300 12293
河 北 Hebei 7430 1716 53053 7148 5108 2091 34032 6354
山 西 Shanxi 10725 2494 82933 7703 3826 1122 16743 4372
内蒙古 Inner Mongolia 111774 35051 725225 6441 33954 11468 219745 6357
辽 宁 Liaoning 14361 4810 90402 6217 13303 5210 47066 3393
吉 林 Jilin 108827 35994 627833 5603 12640 4188 48412 3802
黑龙江 Heilongjiang 364070 98798 1606458 4679 31643 11235 151396 4735
上 海 Shanghai 907 349 13843 15030 2107 700 29450 13071
江 苏 Jiangsu 14193 4667 109730 7575 3672 1393 27485 7329
浙 江 Zhejiang 4295 1326 50078 11544 1556 607 21009 13230
安 徽 Anhui 15899 6009 95571 5928 2464 792 13910 5595
福 建 Fujian 16503 4271 160717 9401 1497 516 11838 7845
江 西 Jiangxi 52569 16042 297506 5628 5708 2042 46963 8251
山 东 Shandong 8245 2277 78920 9644 3037 1244 25823 8634
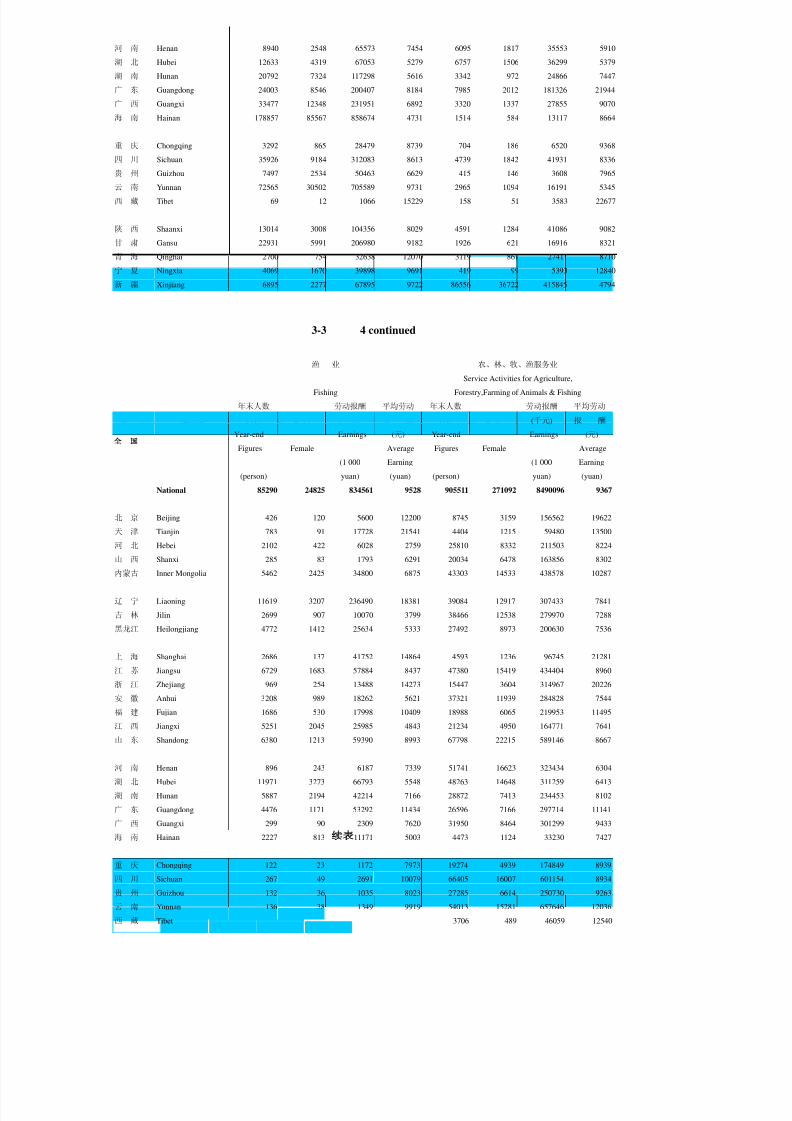
8/2/2019 China Labour Statistical Yearbook - 2004
http://slidepdf.com/reader/full/china-labour-statistical-yearbook-2004 190/464
河 南 Henan 8940 2548 65573 7454 6095 1817 35553 5910
湖 北 Hubei 12633 4319 67053 5279 6757 1506 36299 5379
湖 南 Hunan 20792 7324 117298 5616 3342 972 24866 7447
广 东 Guangdong 24003 8546 200407 8184 7985 2012 181326 21944
广 西 Guangxi 33477 12348 231951 6892 3320 1337 27855 9070
海 南 Hainan 178857 85567 858674 4731 1514 584 13117 8664
重 庆 Chongqing 3292 865 28479 8739 704 186 6520 9368
四 川 Sichuan 35926 9184 312083 8613 4739 1842 41931 8336
贵 州 Guizhou 7497 2534 50463 6629 415 146 3608 7965
云 南 Yunnan 72565 30502 705589 9731 2965 1094 16191 5345
西 藏 Tibet 69 12 1066 15229 158 51 3583 22677
陕 西 Shaanxi 13014 3008 104356 8029 4591 1284 41086 9082
甘 肃 Gansu 22931 5991 206980 9182 1926 621 16916 8321
青 海 Qinghai 2700 754 32638 12070 3119 861 27411 8710
宁 夏 Ningxia 4069 1670 39898 9691 419 99 5393 12840
新 疆 Xinjiang 6895 2277 67895 9722 86556 36722 415845 4794
3-3 4 continued
渔 业 农、林、牧、渔服务业
Service Activities for Agriculture,
Fishing Forestry,Farming of Animals & Fishing
年末人数 劳动报酬 平均劳动 年末人数 劳动报酬 平均劳动
地 区 Region (人) # 女 性
(千元) 报 酬 (人) # 女 性
(千元) 报 酬
Year-end Earnings (元) Year-end Earnings (元)
Figures Female Average Figures Female Average
(1 000 Earning (1 000 Earning
(person) yuan) (yuan) (person) yuan) (yuan)
National 85290 24825 834561 9528 905511 271092 8490096 9367
北 京 Beijing 426 120 5600 12200 8745 3159 156562 19622
天 津 Tianjin 783 91 17728 21541 4404 1215 59480 13500
河 北 Hebei 2102 422 6028 2759 25810 8332 211503 8224
山 西 Shanxi 285 83 1793 6291 20034 6478 163856 8302
内蒙古 Inner Mongolia 5462 2425 34800 6875 43303 14533 438578 10287
辽 宁 Liaoning 11619 3207 236490 18381 39084 12917 307433 7841
吉 林 Jilin 2699 907 10070 3799 38466 12538 279970 7288
黑龙江 Heilongjiang 4772 1412 25634 5333 27492 8973 200630 7536
上 海 Shanghai 2686 137 41752 14864 4593 1236 96745 21281
江 苏 Jiangsu 6729 1683 57884 8437 47380 15419 434404 8960
浙 江 Zhejiang 969 254 13488 14273 15447 3604 314967 20226
安 徽 Anhui 3208 989 18262 5621 37321 11939 284828 7544
福 建 Fujian 1686 530 17998 10409 18988 6065 219953 11495
江 西 Jiangxi 5251 2045 25985 4843 21234 4950 164771 7641
山 东 Shandong 6380 1213 59390 8993 67798 22215 589146 8667
河 南 Henan 896 243 6187 7339 51741 16623 323434 6304
湖 北 Hubei 11971 3273 66793 5548 48263 14648 311259 6413
湖 南 Hunan 5887 2194 42214 7166 28872 7413 234453 8102
广 东 Guangdong 4476 1171 53292 11434 26596 7166 297714 11141
广 西 Guangxi 299 90 2309 7620 31950 8464 301299 9433
海 南 Hainan 2227 813 11171 5003 4473 1124 33230 7427
重 庆 Chongqing 122 23 1172 7973 19274 4939 174849 8939
四 川 Sichuan 267 49 2691 10079 66405 16007 601154 8934
贵 州 Guizhou 132 36 1035 8023 27285 6614 250730 9263
云 南 Yunnan 136 38 1349 9919 54013 15281 657646 12036
西 藏 Tibet 3706 489 46059 12540

8/2/2019 China Labour Statistical Yearbook - 2004
http://slidepdf.com/reader/full/china-labour-statistical-yearbook-2004 191/464
陕 西 Shaanxi 191 52 2028 10618 37330 11300 306313 8230
甘 肃 Gansu 112 31 1638 14625 29590 8277 323893 11128
青 海 Qinghai 66 19 685 10224 9388 2933 135432 14629
宁 夏 Ningxia 2971 1128 63464 18838 7045 2029 85072 11622
新 疆 Xinjiang 480 147 5631 11150 39481 14212 484733 12253
3-3 5 continued
采矿业 煤炭开采和洗选业
Mining Mining and Washing of Coal
年末人数 劳动报酬 平均劳动 年末人数 劳动报酬 平均劳动
地 区 Region (人) # 女 性
(千元) 报 酬 (人) # 女 性
(千元) 报 酬
Year-end Earnings (元) Year-end Earnings (元)
Figures Female Average Figures Female Average
(1 000 Earning (1 000 Earning
(person) yuan) (yuan) (person) yuan) (yuan)
National 4882573 1197065 66286428 13627 3315037 724792 39102275 11894
北 京 Beijing 24602 4917 471643 18777 20407 4075 419510 20109
天 津 Tianjin 69738 23104 1581666 22784 128 43 2051 16950
河 北 Hebei 281011 60619 3985622 14050 206404 42535 2723653 13106
山 西 Shanxi 569349 112490 7232390 12878 561060 111386 7179688 12971
内蒙古 Inner Mongolia 168516 46669 1511523 9725 138219 40222 1215996 9737
辽 宁 Liaoning 307408 68532 4263521 13714 166202 27986 1981450 11984
吉 林 Jilin 149916 38206 1859939 11849 72379 15348 630159 7903
黑龙江 Heilongjiang 386961 77843 4844835 13452 274623 39892 2046403 8228
上 海 Shanghai 323 93 11166 36851
江 苏 Jiangsu 165596 44790 2416709 14496 102635 24183 1526705 15033
浙 江 Zhejiang 17159 3674 245398 13979 7283 1769 107399 14482
安 徽 Anhui 295648 73753 3899646 12638 258413 62301 3403167 12559
福 建 Fujian 35773 9553 391266 10811 19288 2770 230241 11671
江 西 Jiangxi 98465 21348 943528 9366 67972 13381 657376 9604
山 东 Shandong 607939 172516 10839145 17705 376212 106426 5662438 14864
河 南 Henan 487152 131914 6825060 14256 362544 88168 4427897 12482
湖 北 Hubei 112073 32327 1294975 11647 19215 2700 160223 8330
湖 南 Hunan 121555 28512 1112252 9101 92851 19861 839099 9004
广 东 Guangdong 40198 9466 531996 12979 5184 702 54357 9717
广 西 Guangxi 47509 14316 519147 10768 12295 2732 133618 10294
海 南 Hainan 11505 3824 97579 8233 311 53 1890 5906
重 庆 Chongqing 70538 16101 719438 9713 57812 12696 537729 8817
四 川 Sichuan 191906 45976 2043768 10591 133088 28667 1056471 7954
贵 州 Guizhou 89981 20667 1020915 11480 73189 15817 823493 11358
云 南 Yunnan 58696 15528 661662 10789 28558 7860 290574 9814
西 藏 Tibet 1713 336 22197 13316 29 3 330 11379
陕 西 Shaanxi 173366 36089 2108685 12393 89618 15041 840851 9483
甘 肃 Gansu 78225 17359 941122 12052 56979 11816 665046 11810
青 海 Qinghai 18713 4212 277817 14889 9485 1498 95190 10228
宁 夏 Ningxia 61652 15568 879347 14546 61652 15568 879347 14546
新 疆 Xinjiang 139387 46763 2732471 19606 41002 9293 509924 12529
3-3 6 continued
石油和天然气开采业 黑色金属矿采选业
Extraction of Petroleum and Natural Gas Mining of Ferrous Metal Ores
年末人数 劳动报酬 平均劳动 年末人数 劳动报酬 平均劳动
地 区 Region (人) # 女 性
(千元) 报 酬 (人) # 女 性
(千元) 报 酬
Year-end Earnings (元) Year-end Earnings (元)

8/2/2019 China Labour Statistical Yearbook - 2004
http://slidepdf.com/reader/full/china-labour-statistical-yearbook-2004 192/464
Figures Female Average Figures Female Average
(1 000 Earning (1 000 Earning
(person) yuan) (yuan) (person) yuan) (yuan)
National 861570 285056 19818391 23082 157576 40196 1946817 12208
北 京 Beijing 164 66 5984 37168 2196 311 25472 11853
天 津 Tianjin 58702 20466 1401149 24200
河 北 Hebei 33286 9341 803907 23807 15353 3481 216721 13766
山 西 Shanxi 3572 208 26297 7638
内蒙古 Inner Mongolia 2429 615 42128 18182 5374 889 55460 10093
辽 宁 Liaoning 93617 29589 1771127 18757 19424 5226 269830 13107
吉 林 Jilin 53219 16537 1016813 19273 8539 1828 95131 11424
黑龙江 Heilongjiang 93707 32077 2689176 28981 919 202 4672 5382
上 海 Shanghai 173 57 8398 57917
江 苏 Jiangsu 21024 6750 522900 24535 4336 1441 45290 10200
浙 江 Zhejiang 1562 282 27341 17538
安 徽 Anhui 24087 7841 391120 15911
福 建 Fujian 58 33 562 9690 2358 581 39143 16778
江 西 Jiangxi 736 243 5988 8237山 东 Shandong 162215 51419 4359306 26940 11485 2253 172212 14827
河 南 Henan 93472 34187 2122573 22730 2398 486 26899 11278
湖 北 Hubei 45708 18436 765842 16794 20845 5081 185439 9114
湖 南 Hunan 1994 780 12901 6269
广 东 Guangdong 6257 1895 100325 16091 4261 1085 65626 15059
广 西 Guangxi 3994 1416 30295 7514
海 南 Hainan 5 3 85 17000 7896 2956 79046 9681
重 庆 Chongqing 9156 2559 144865 15812 471 51 3413 7387
四 川 Sichuan 29172 8650 692490 23400 6002 1490 51719 8652
贵 州 Guizhou 204 57 4707 23074 185 28 1879 8464
云 南 Yunnan 239 78 5223 21672 4144 808 42448 10406
西 藏 Tibet 615 133 7395 12024
陕 西 Shaanxi 59764 14369 1012481 17614 938 161 7374 7836
甘 肃 Gansu 8872 2613 174770 18811 427 41 2820 5732
青 海 Qinghai 2796 734 98741 35127 550 98 6906 13675
宁 夏 Ningxia
新 疆 Xinjiang 87331 34525 2074839 23810 2915 796 47980 16144
3-3 7 continued
有色金属矿采选业 非金属矿采选业
Mining of Non-ferrous Metal Ores Mining and Processing of Nonmetal Ores
年末人数 劳动报酬 平均劳动 年末人数 劳动报酬 平均劳动
地 区 Region (人) # 女 性
(千元) 报 酬 (人) # 女 性
(千元) 报 酬
Year-end Earnings (元) Year-end Earnings (元)
Figures Female Average Figures Female Average
(1 000 Earning (1 000 Earning
(person) yuan) (yuan) (person) yuan) (yuan)
National 291335 74719 3058307 10394 246152 67558 2278088 8980
北 京 Beijing 45 8 605 13152 1790 457 20072 10564
天 津 Tianjin 10882 2589 178466 15691
河 北 Hebei 8996 1501 85092 9486 16972 3761 156249 8983
山 西 Shanxi 2063 358 11921 5846 2638 533 14394 5586
内蒙古 Inner Mongolia 14176 2621 106842 7607 8318 2322 91097 10481
辽 宁 Liaoning 14528 2484 111165 7638 13635 3247 129939 8133
吉 林 Jilin 10288 3032 82672 7796 4848 1159 30996 6319
黑龙江 Heilongjiang 9103 3287 59544 6527 8594 2382 44880 5186
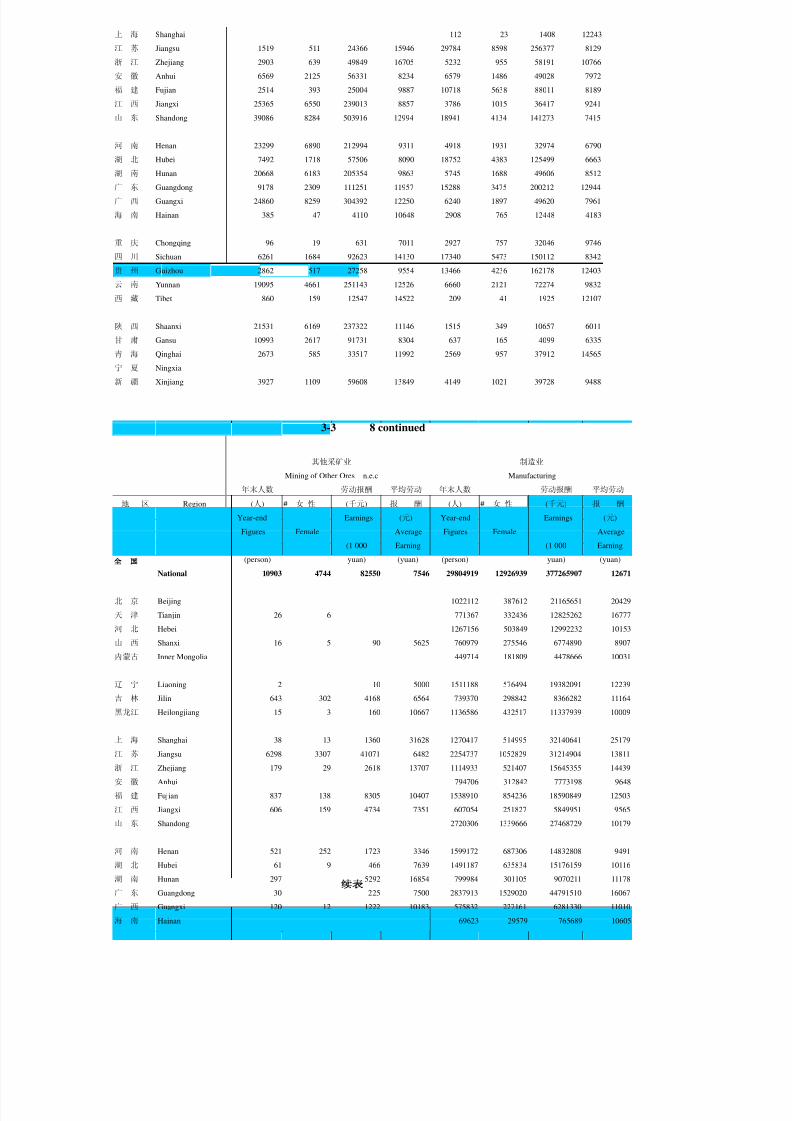
8/2/2019 China Labour Statistical Yearbook - 2004
http://slidepdf.com/reader/full/china-labour-statistical-yearbook-2004 193/464
上 海 Shanghai 112 23 1408 12243
江 苏 Jiangsu 1519 511 24366 15946 29784 8598 256377 8129
浙 江 Zhejiang 2903 639 49849 16705 5232 955 58191 10766
安 徽 Anhui 6569 2125 56331 8234 6579 1486 49028 7972
福 建 Fujian 2514 393 25004 9887 10718 5638 88011 8189
江 西 Jiangxi 25365 6550 239013 8857 3786 1015 36417 9241
山 东 Shandong 39086 8284 503916 12994 18941 4134 141273 7415
河 南 Henan 23299 6890 212994 9311 4918 1931 32974 6790
湖 北 Hubei 7492 1718 57506 8090 18752 4383 125499 6663
湖 南 Hunan 20668 6183 205354 9863 5745 1688 49606 8512
广 东 Guangdong 9178 2309 111251 11957 15288 3475 200212 12944
广 西 Guangxi 24860 8259 304392 12250 6240 1897 49620 7961
海 南 Hainan 385 47 4110 10648 2908 765 12448 4183
重 庆 Chongqing 96 19 631 7011 2927 757 32046 9746
四 川 Sichuan 6261 1684 92623 14130 17340 5473 150112 8342
贵 州 Guizhou 2862 517 27258 9554 13466 4236 162178 12403
云 南 Yunnan 19095 4661 251143 12526 6660 2121 72274 9832
西 藏 Tibet 860 159 12547 14522 209 41 1925 12107
陕 西 Shaanxi 21531 6169 237322 11146 1515 349 10657 6011
甘 肃 Gansu 10993 2617 91731 8304 637 165 4099 6335
青 海 Qinghai 2673 585 33517 11992 2569 957 37912 14565
宁 夏 Ningxia
新 疆 Xinjiang 3927 1109 59608 13849 4149 1021 39728 9488
3-3 8 continued
其他采矿业 制造业
Mining of Other Ores n.e.c Manufacturing
年末人数 劳动报酬 平均劳动 年末人数 劳动报酬 平均劳动
地 区 Region (人) # 女 性
(千元) 报 酬 (人) # 女 性
(千元) 报 酬
Year-end Earnings (元) Year-end Earnings (元)
Figures Female Average Figures Female Average
(1 000 Earning (1 000 Earning
(person) yuan) (yuan) (person) yuan) (yuan)
National 10903 4744 82550 7546 29804919 12926939 377265907 12671
北 京 Beijing 1022112 387612 21165651 20429
天 津 Tianjin 26 6 771367 332436 12825262 16777
河 北 Hebei 1267156 503849 12992232 10153山 西 Shanxi 16 5 90 5625 760979 275546 6774890 8907
内蒙古 Inner Mongolia 449714 181809 4478666 10031
辽 宁 Liaoning 2 10 5000 1511188 576494 19382091 12239
吉 林 Jilin 643 302 4168 6564 739370 298842 8366282 11164
黑龙江 Heilongjiang 15 3 160 10667 1136586 432517 11337939 10009
上 海 Shanghai 38 13 1360 31628 1270417 514995 32140641 25179
江 苏 Jiangsu 6298 3307 41071 6482 2254737 1052829 31214904 13811
浙 江 Zhejiang 179 29 2618 13707 1114933 521407 15645355 14439
安 徽 Anhui 794706 312842 7773198 9648
福 建 Fujian 837 138 8305 10407 1538910 854236 18590849 12503
江 西 Jiangxi 606 159 4734 7351 607054 251827 5849951 9565
山 东 Shandong 2720306 1339666 27468729 10179
河 南 Henan 521 252 1723 3346 1599172 687306 14832808 9491
湖 北 Hubei 61 9 466 7639 1491187 635834 15176159 10116
湖 南 Hunan 297 5292 16854 799984 301105 9070211 11178
广 东 Guangdong 30 225 7500 2837913 1529020 44791510 16067
广 西 Guangxi 120 12 1222 10183 575832 227161 6281330 11010
海 南 Hainan 69623 29579 765689 10605

8/2/2019 China Labour Statistical Yearbook - 2004
http://slidepdf.com/reader/full/china-labour-statistical-yearbook-2004 194/464
重 庆 Chongqing 76 19 754 9921 549374 209120 6541778 11857
四 川 Sichuan 43 12 353 8209 1194494 455936 13343740 11126
贵 州 Guizhou 75 12 1400 18919 424431 150585 4440401 10170
云 南 Yunnan 469231 174985 6065063 12615
西 藏 Tibet 9674 3351 110287 11685
陕 西 Shaanxi 885985 333089 9113994 10225
甘 肃 Gansu 317 107 2656 8853 480550 169031 5352085 11530
青 海 Qinghai 640 340 5551 8701 68410 24236 821689 12079
宁 夏 Ningxia 120411 41989 1261270 10350
新 疆 Xinjiang 63 19 392 6222 269113 117705 3291253 12167
3-3 9 continued
农副食品加工业 食品制造业
Processing of Food from Agricultural Products Manufacture of Foods
年末人数 劳动报酬 平均劳动 年末人数 劳动报酬 平均劳动
地 区 Region (人) # 女 性
(千元) 报 酬 (人) # 女 性
(千元) 报 酬
Year-end Earnings (元) Year-end Earnings (元)
Figures Female Average Figures Female Average
(1 000 Earning (1 000 Earning
(person) yuan) (yuan) (person) yuan) (yuan)
National 949907 392377 8217065 8727 657164 323509 7128600 11157
北 京 Beijing 23994 9839 405177 16650 32254 15702 675201 20489
天 津 Tianjin 13630 5318 169995 12577 17906 8490 273674 14961
河 北 Hebei 33589 14068 230331 7079 21067 10000 168486 8063
山 西 Shanxi 11562 3913 53623 4700 8842 3770 43264 4822
内蒙古 Inner Mongolia 19777 7375 135363 6683 24265 9691 236647 10581
辽 宁 Liaoning 29154 14811 258230 9006 15940 8490 171923 10543
吉 林 Jilin 36940 17222 286100 7765 9491 4796 59432 5529
黑龙江 Heilongjiang 64002 21752 491352 7821 37273 16531 414419 11417
上 海 Shanghai 13033 4702 245300 18053 26750 11543 706083 25477
江 苏 Jiangsu 39929 15594 333934 7836 34600 15125 390689 10948
浙 江 Zhejiang 28388 12349 345015 12156 37106 23385 359195 12957
安 徽 Anhui 19341 8069 111041 5382 21179 8743 139192 6561
福 建 Fujian 44755 25948 394062 9331 34183 20954 298304 9628
江 西 Jiangxi 15497 6096 98949 6172 13877 6997 83876 6073
山 东 Shandong 132539 66206 952068 7205 54059 27270 424162 8162
河 南 Henan 69164 27187 502242 7460 64204 37643 355712 5881
湖 北 Hubei 43413 17686 266031 6133 40504 18172 275513 7171
湖 南 Hunan 22134 6881 194936 8647 13917 6716 140886 11043
广 东 Guangdong 69564 27015 768533 11008 56664 27790 1043976 18387
广 西 Guangxi 85100 31460 830604 10691 12747 6476 131614 10487
海 南 Hainan 13353 5011 89210 6950 1710 605 18090 9778
重 庆 Chongqing 9383 4395 84269 8906 7717 3513 84727 11014
四 川 Sichuan 23495 8386 190668 8331 18923 8761 198802 10524
贵 州 Guizhou 9643 3495 62938 6513 4527 2029 34445 7475
云 南 Yunnan 35265 12241 381841 10054 9581 4323 91385 9143
西 藏 Tibet 276 104 2781 9968 157 52 1548 9797
陕 西 Shaanxi 10949 3993 61562 5798 18750 7579 148435 7885
甘 肃 Gansu 7884 2909 48429 6080 5977 3129 32952 5232
青 海 Qinghai 2070 816 12312 5933 1260 381 7428 7894
宁 夏 Ningxia 2440 1137 15093 6371 2408 1150 19062 8081
新 疆 Xinjiang 19644 6399 195076 10456 9326 3703 99478 9593

8/2/2019 China Labour Statistical Yearbook - 2004
http://slidepdf.com/reader/full/china-labour-statistical-yearbook-2004 195/464
3-3 10 continued
饮料制造业 烟草制品业
Manufacture of Beverage Manufacture of Tobacco
年末人数 劳动报酬 平均劳动 年末人数 劳动报酬 平均劳动
地 区 Region (人) # 女 性
(千元) 报 酬 (人) # 女 性
(千元) 报 酬
Year-end Earnings (元) Year-end Earnings (元)
Figures Female Average Figures Female Average
(1 000 Earning (1 000 Earning
(person) yuan) (yuan) (person) yuan) (yuan)
National 749406 297343 7971851 10746 222476 94720 6013591 27143
北 京 Beijing 19488 7057 335727 16788 819 333 56488 68888
天 津 Tianjin 15252 5095 257617 17489 1756 640 60856 34363
河 北 Hebei 28341 11995 215018 7320 7594 3237 156983 20475
山 西 Shanxi 14480 5451 127036 8501 1783 861 37639 22351
内蒙古 Inner Mongolia 19494 7901 145621 7359 2598 867 48780 18747
辽 宁 Liaoning 19702 8507 204404 10143 3109 1217 88106 27908
吉 林
Jilin 20720 8182 160942 7703 5329 2154 130591 23602黑龙江 Heilongjiang 33273 13418 254804 7971 5936 2328 101842 17022
上 海 Shanghai 9722 2820 376058 39345 5900 2367 356678 58848
江 苏 Jiangsu 42493 17116 375061 8784 7300 3290 298638 42748
浙 江 Zhejiang 23816 7731 455888 19185 2965 1186 142074 47692
安 徽 Anhui 49900 19207 350229 7072 10475 3416 262814 24773
福 建 Fujian 17362 8306 224842 12625 4292 1841 205962 37468
江 西 Jiangxi 16264 6852 137326 8141 8261 4364 124253 14575
山 东 Shandong 92739 39460 813504 8664 10958 4326 366324 28639
河 南 Henan 49498 19168 315573 6660 19624 8206 465324 24337
湖 北 Hubei 34111 14062 289151 8959 18094 8003 315108 17257
湖 南 Hunan 11735 4507 121582 10046 11436 4678 366379 30499
广 东 Guangdong 31023 11205 807605 25754 8860 4060 464074 54100
广 西 Guangxi 12187 5691 131134 11216 4246 1949 72596 17195
海 南 Hainan 6617 2979 80774 13070 650 286 15118 22941
重 庆 Chongqing 11528 4905 134661 12274 5216 2251 111508 22468
四 川 Sichuan 79256 30498 882935 12138 6734 3077 164598 24913
贵 州 Guizhou 17236 6493 194050 10675 22437 10520 358009 15600
云 南 Yunnan 23769 10264 119390 5001 34454 15265 1045330 35493
西 藏 Tibet 316 92 4007 12680
陕 西 Shaanxi 15281 5550 132963 8682 8341 2647 136580 15770
甘 肃 Gansu 17054 6248 143689 8396 2299 858 40249 17607
青 海 Qinghai 1606 297 17934 11167
宁 夏 Ningxia 2741 1338 21130 7686 413 291 5917 12807
新 疆 Xinjiang 12402 4948 141196 11717 597 202 14773 22417
3-3 11 continued
纺织业 纺织服装、鞋、帽制造业
Manufacture of Textile Wearing
Manufacture of Textile Apparel, Footware and Caps
年末人数 劳动报酬 平均劳动 年末人数 劳动报酬 平均劳动
地 区 Region (人) # 女 性
(千元) 报 酬 (人) # 女 性
(千元) 报 酬
Year-end Earnings (元) Year-end Earnings (元)
Figures Female Average Figures Female Average
(1 000 Earning (1 000 Earning
(person) yuan) (yuan) (person) yuan) (yuan)
National 2718148 1768637 22222792 8079 1390683 1001955 13735189 10090
北 京 Beijing 43935 29172 518908 11505 73317 55633 777338 10536

8/2/2019 China Labour Statistical Yearbook - 2004
http://slidepdf.com/reader/full/china-labour-statistical-yearbook-2004 196/464
天 津 Tianjin 50136 29593 512642 10056 39060 24849 347494 9319
河 北 Hebei 151490 94360 1059242 6890 23405 16180 132269 5606
山 西 Shanxi 46282 30507 236437 5056 8787 5745 45546 5238
内蒙古 Inner Mongolia 52131 37755 389088 7386 7171 5293 57485 7918
辽 宁 Liaoning 61300 40761 414793 5933 59785 46495 554655 8877
吉 林 Jilin 35726 22235 198772 5242 16490 11017 94539 5828
黑龙江 Heilongjiang 65886 37108 461318 7152 6326 3810 32789 5632
上 海 Shanghai 71186 42598 1124086 14649 67964 51342 1029925 15337
江 苏 Jiangsu 309240 203520 2928043 9211 137675 104667 1345305 9695
浙 江 Zhejiang 120643 78440 1412197 11577 95302 70090 1155208 12558
安 徽 Anhui 97760 64485 654932 6502 21323 16696 135874 6800
福 建 Fujian 102757 65800 1107288 11281 237978 152354 2523656 11382
江 西 Jiangxi 55612 36937 382081 6837 15211 10354 78047 5386
山 东 Shandong 464545 312856 3455870 7574 157510 123784 1361375 8769
河 南 Henan 216282 144277 1446857 6735 20376 14053 126828 6818
湖 北 Hubei 215531 143830 1366952 6240 70509 53730 442705 6527
湖 南 Hunan 52625 34420 344534 6366 8371 6372 70796 8529
广 东 Guangdong 150883 91541 1623130 10681 281256 200288 3063126 11036广 西 Guangxi 33971 23487 242088 6969 5451 4480 31827 5580
海 南 Hainan 2715 1322 27194 9943 5015 4539 54227 11705
重 庆 Chongqing 38114 25137 259600 6797 3059 1856 22598 7238
四 川 Sichuan 83662 52961 563323 6672 6207 4204 65128 8443
贵 州 Guizhou 9441 6417 58752 5960 2663 1365 20087 7246
云 南 Yunnan 13961 9088 112020 6944 4182 2988 26593 6083
西 藏 Tibet 407 359 1285 3157 173 150 830 4798
陕 西 Shaanxi 89471 54071 688899 7657 9378 4690 80067 8598
甘 肃 Gansu 13555 9456 87555 6632 2835 2284 21504 7874
青 海 Qinghai 2726 2053 16048 6132 830 472 9730 12395
宁 夏 Ningxia 547 410 3493 10037 1042 720 10451 9916
新 疆 Xinjiang 65628 43681 525365 7642 2032 1455 17187 8138
3-3 12 continued
皮革、毛皮、羽毛(绒)及其制品业 木材加工及木、竹、藤、棕、草制品业
Manufacture of Leather, Fur, Processing of Timbers,Manufacture of Wood,
Feather and Its Products Bamboo, Rattan, Palm, and Straw Products
年末人数 劳动报酬 平均劳动 年末人数 劳动报酬 平均劳动地 区 Region (人) # 女 性
(千元) 报 酬 (人) # 女 性
(千元) 报 酬
Year-end Earnings (元) Year-end Earnings (元)
Figures Female Average Figures Female Average
(1 000 Earning (1 000 Earning
(person) yuan) (yuan) (person) yuan) (yuan)
National 635176 437908 6119331 9883 294322 120881 2316208 7879
北 京 Beijing 4966 2406 63316 12686 3760 986 106230 27393
天 津 Tianjin 16169 10198 180812 11747 4139 1862 50906 12216
河 北 Hebei 6207 3777 35685 5512 3619 1518 28703 7914
山 西 Shanxi 1302 672 3682 2804 1028 341 9210 8924
内蒙古 Inner Mongolia 1997 1060 12062 6110 11253 5425 52014 5017
辽 宁 Liaoning 13688 10263 127459 8503 11428 5191 109334 9587
吉 林 Jilin 2536 1451 12713 4635 41951 20120 291448 6705
黑龙江 Heilongjiang 5093 2209 19674 3918 62345 25285 227760 3808
上 海 Shanghai 11263 7108 147799 12542 7376 2979 118070 15663
江 苏 Jiangsu 17749 11800 164414 9456 4947 1705 51037 10203
浙 江 Zhejiang 71334 39716 749694 11584 8262 3850 90605 10851
安 徽 Anhui 6186 4889 36236 5788 6349 2857 43206 6847
福 建 Fujian 151233 110892 1623878 10835 27498 12639 262191 9839

8/2/2019 China Labour Statistical Yearbook - 2004
http://slidepdf.com/reader/full/china-labour-statistical-yearbook-2004 197/464
江 西 Jiangxi 11013 6684 60045 6280 8565 2968 53488 5970
山 东 Shandong 100343 79378 873192 8869 10489 3916 113584 9202
河 南 Henan 8683 4517 47354 5620 6567 3204 37721 5762
湖 北 Hubei 7209 5012 40178 5471 11343 3945 81840 7253
湖 南 Hunan 4663 2853 32550 6966 6466 2135 46772 7336
广 东 Guangdong 166398 117544 1697635 10540 19210 7240 227109 11791
广 西 Guangxi 4080 2539 24638 6414 8569 2789 61387 7260
海 南 Hainan 469 292 3647 7309 2291 992 19481 8230
重 庆 Chongqing 2313 1106 19578 8779 1549 639 13927 9385
四 川 Sichuan 11642 7331 81825 7114 5457 1564 55804 10080
贵 州 Guizhou 370 147 1852 5005 2612 754 18683 7512
云 南 Yunnan 994 582 4627 4641 10196 3573 95380 9199
西 藏 Tibet 128 43 1484 11594 1590 432 15171 10216
陕 西 Shaanxi 2441 993 19093 7812 3067 1284 17568 5749
甘 肃 Gansu 2724 1492 18641 6774 1050 205 4857 4679
青 海 Qinghai 50 20 240 4800 33 6 350 10938
宁 夏 Ningxia 781 525 6799 9126 38 13 257 6590
新 疆 Xinjiang 1152 409 8529 7410 1275 464 12115 9570
3-3 13 continued
家具制造业 造纸及纸制品业
Manufacture of Furniture Manufacture of Paper and Paper Products
年末人数 劳动报酬 平均劳动 年末人数 劳动报酬 平均劳动
地 区 Region (人) # 女 性
(千元) 报 酬 (人) # 女 性
(千元) 报 酬
Year-end Earnings (元) Year-end Earnings (元)
Figures Female Average Figures Female Average
(1 000 Earning (1 000 Earning
(person) yuan) (yuan) (person) yuan) (yuan)
National 189110 66984 1742809 9501 574859 225774 5827440 10067
北 京 Beijing 15781 4491 197793 13127 11008 5195 167825 15095
天 津 Tianjin 10588 3685 133563 14844 9129 3234 110937 12036
河 北 Hebei 5538 2306 32644 5989 28883 11195 235955 7833
山 西 Shanxi 5420 2384 12084 2216 4315 1750 19383 4608
内蒙古 Inner Mongolia 989 378 6770 6790 10251 2725 79971 7552
辽 宁 Liaoning 12743 4155 106620 9449 25730 10914 182038 6754
吉 林 Jilin 2535 935 16148 6333 17925 6541 108108 5657黑龙江 Heilongjiang 20373 8754 111796 5517 27683 9160 220824 7871
上 海 Shanghai 8683 2244 125119 14426 12317 4821 243515 19656
江 苏 Jiangsu 7849 3454 91984 9716 32895 11759 540136 16467
浙 江 Zhejiang 5751 1754 55607 11365 19164 5374 308209 16287
安 徽 Anhui 1340 399 7628 5089 13899 5712 110620 7996
福 建 Fujian 24621 8093 292174 12073 36084 15677 437257 12173
江 西 Jiangxi 1898 635 9660 4997 11941 6064 99479 7064
山 东 Shandong 14271 5759 117138 8424 88143 35197 723294 8372
河 南 Henan 3159 1148 20418 6606 32206 13312 224263 7244
湖 北 Hubei 5231 1420 31941 5962 25433 10111 197265 7791
湖 南 Hunan 712 146 4367 6347 25957 9681 279367 11032
广 东 Guangdong 25297 8973 240935 10399 43724 18756 676562 15427
广 西 Guangxi 1518 629 8349 5496 20365 8165 185567 9089
海 南 Hainan 398 155 4212 8475 2690 671 68899 23636
重 庆 Chongqing 1000 354 7315 7061 3005 1388 21720 7211
四 川 Sichuan 3668 1350 33010 9205 22195 8895 201446 9244
贵 州 Guizhou 1254 450 8877 7182 4152 1523 33214 5795
云 南 Yunnan 1544 516 11058 7125 7348 2996 68568 8841
西 藏 Tibet 172 43 1053 6194

8/2/2019 China Labour Statistical Yearbook - 2004
http://slidepdf.com/reader/full/china-labour-statistical-yearbook-2004 198/464
陕 西 Shaanxi 2630 1024 17564 6500 11482 4326 58771 5079
甘 肃 Gansu 1415 487 7312 5124 4761 1786 26315 5861
青 海 Qinghai 31 9 174 5613 569 108 5183 9173
宁 夏 Ningxia 347 126 2882 7352 13541 5358 117471 8826
新 疆 Xinjiang 2354 728 26614 11325 8064 3380 75278 9265
3-3 14 continued
印刷业和记录媒介的复制 文教体育用品制造业
Printing, Reproduction of Manufacture of Articles for
Recording Media Culture, Education and Sport Activity
年末人数 劳动报酬 平均劳动 年末人数 劳动报酬 平均劳动
地 区 Region (人) # 女 性
(千元) 报 酬 (人) # 女 性
(千元) 报 酬
Year-end Earnings (元) Year-end Earnings (元)
Figures Female Average Figures Female Average
(1 000 Earning (1 000 Earning
(person) yuan) (yuan) (person) yuan) (yuan)
National 477071 229598 5668654 11707 332826 209260 3803635 11432
北 京 Beijing 46849 20840 847724 17964 9372 4242 148235 14984
天 津 Tianjin 8825 3939 129085 14478 12569 5818 143321 11179
河 北 Hebei 20859 10548 214524 9846 1029 517 6972 7014
山 西 Shanxi 11676 6685 82049 6986 2407 852 14266 5992
内蒙古 Inner Mongolia 6674 3609 45196 7107 65 39 550 7857
辽 宁 Liaoning 18632 9948 187072 8944 4482 2191 47466 10027
吉 林 Jilin 12325 7257 87766 7200 369 177 1718 4881
黑龙江 Heilongjiang 17957 8842 140019 7813 3809 1725 18162 4747
上 海 Shanghai 19497 8144 436032 22047 24881 13082 387035 15330
江 苏 Jiangsu 22586 10092 274353 11959 19427 13338 188644 9912
浙 江 Zhejiang 17969 7678 244939 13721 15227 8902 208410 14058
安 徽 Anhui 7882 3917 56942 7154 6325 3816 35698 5608
福 建 Fujian 15404 7999 196372 12668 43224 28325 474436 11306
江 西 Jiangxi 11004 5119 125375 11498 1446 1052 8973 6642
山 东 Shandong 28088 14705 269181 9449 51990 40011 492220 9682
河 南 Henan 23569 11616 181495 7903 2233 1177 14772 6708
湖 北 Hubei 23504 11442 201763 8410 3837 1900 28617 7398
湖 南 Hunan 13566 6134 143072 10498 1074 556 10912 9839
广 东 Guangdong 43222 19985 657348 15309 122326 78635 1522668 12268广 西 Guangxi 10914 5435 93727 8390 607 345 4068 6814
海 南 Hainan 2173 977 22373 10142
重 庆 Chongqing 8184 3622 79995 9308 431 206 4215 9941
四 川 Sichuan 21050 9278 251692 11962 3915 1561 32916 8376
贵 州 Guizhou 10430 4850 98934 8226 370 139 2457 6641
云 南 Yunnan 14143 6954 185858 12759 283 112 2131 7298
西 藏 Tibet 414 198 5694 13787 30 29 430 14333
陕 西 Shaanxi 23649 10938 245055 10244 434 182 1276 2933
甘 肃 Gansu 6312 3465 53367 8390 648 319 2987 4660
青 海 Qinghai 1450 859 12068 8149
宁 夏 Ningxia 1689 1090 12356 7311 16 12 80 5000
新 疆 Xinjiang 6575 3433 87228 12921
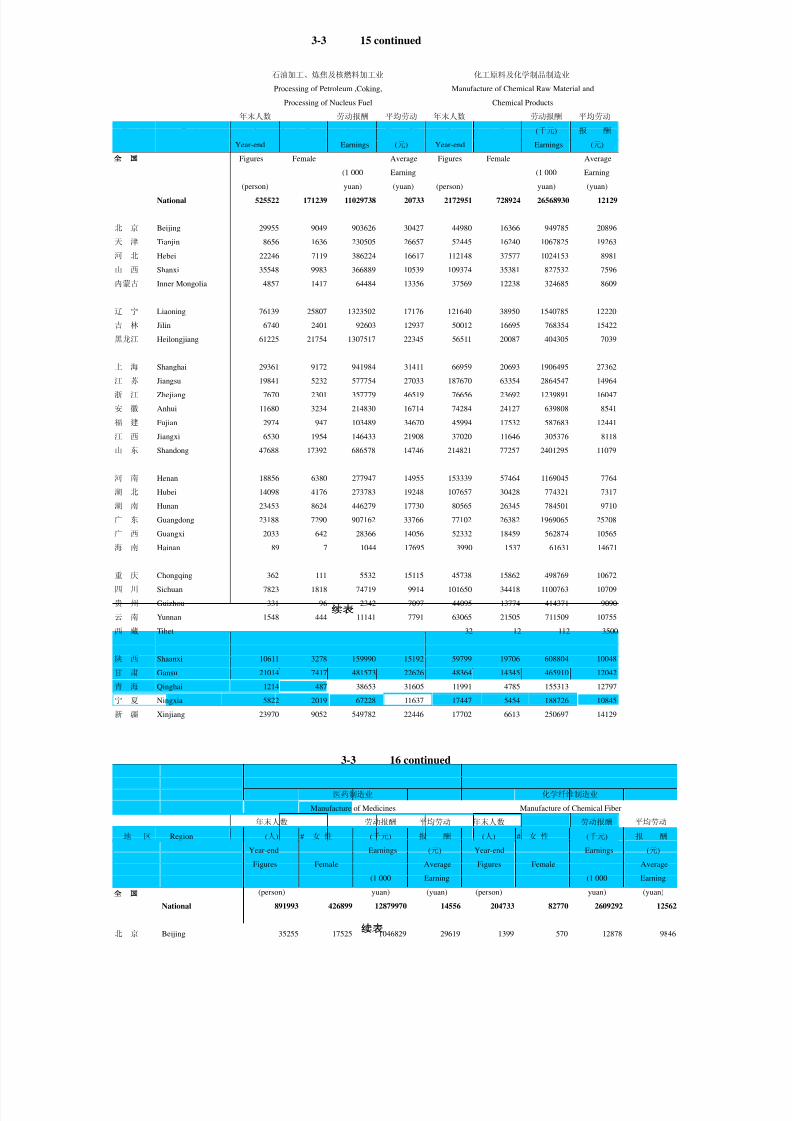
8/2/2019 China Labour Statistical Yearbook - 2004
http://slidepdf.com/reader/full/china-labour-statistical-yearbook-2004 199/464
3-3 15 continued
石油加工、炼焦及核燃料加工业 化工原料及化学制品制造业
Processing of Petroleum ,Coking, Manufacture of Chemical Raw Material and
Processing of Nucleus Fuel Chemical Products
年末人数 劳动报酬 平均劳动 年末人数 劳动报酬 平均劳动
地 区 Region (人) # 女 性
(千元) 报 酬 (人) # 女 性
(千元) 报 酬
Year-end Earnings (元) Year-end Earnings (元)
Figures Female Average Figures Female Average
(1 000 Earning (1 000 Earning
(person) yuan) (yuan) (person) yuan) (yuan)
National 525522 171239 11029738 20733 2172951 728924 26568930 12129
北 京 Beijing 29955 9049 903626 30427 44980 16366 949785 20896
天 津 Tianjin 8656 1636 230505 26657 52445 16240 1067825 19263
河 北 Hebei 22246 7119 386224 16617 112148 37577 1024153 8981
山 西 Shanxi 35548 9983 366889 10539 109374 35381 827532 7596
内蒙古 Inner Mongolia 4857 1417 64484 13356 37569 12238 324685 8609
辽 宁
Liaoning 76139 25807 1323502 17176 121640 38950 1540785 12220吉 林 Jilin 6740 2401 92603 12937 50012 16695 768354 15422
黑龙江 Heilongjiang 61225 21754 1307517 22345 56511 20087 404305 7039
上 海 Shanghai 29361 9172 941984 31411 66959 20693 1906495 27362
江 苏 Jiangsu 19841 5232 577754 27033 187670 63354 2864547 14964
浙 江 Zhejiang 7670 2301 357779 46519 76656 23692 1239891 16047
安 徽 Anhui 11680 3234 214830 16714 74284 24127 639808 8541
福 建 Fujian 2974 947 103489 34670 45994 17532 587683 12441
江 西 Jiangxi 6530 1954 146433 21908 37020 11646 305376 8118
山 东 Shandong 47688 17392 686578 14746 214821 77257 2401295 11079
河 南 Henan 18856 6380 277947 14955 153339 57464 1169045 7764
湖 北 Hubei 14098 4176 273783 19248 107657 30428 774321 7317
湖 南 Hunan 23453 8624 446279 17730 80565 26345 784501 9710
广 东 Guangdong 23188 7290 907162 33766 77102 26382 1969065 25208
广 西 Guangxi 2033 642 28366 14056 52332 18459 562874 10565
海 南 Hainan 89 7 1044 17695 3990 1537 61631 14671
重 庆 Chongqing 362 111 5532 15115 45738 15862 498769 10672
四 川 Sichuan 7823 1818 74719 9914 101650 34418 1100763 10709
贵 州 Guizhou 331 96 2342 7097 44095 13774 414371 9090
云 南 Yunnan 1548 444 11141 7791 63065 21505 711509 10755
西 藏 Tibet 32 12 112 3500
陕 西 Shaanxi 10611 3278 159990 15192 59799 19706 608804 10048
甘 肃 Gansu 21014 7417 481573 22626 48364 14345 465910 12042
青 海 Qinghai 1214 487 38653 31605 11991 4785 155313 12797
宁 夏 Ningxia 5822 2019 67228 11637 17447 5454 188726 10845
新 疆 Xinjiang 23970 9052 549782 22446 17702 6613 250697 14129
3-3 16 continued
医药制造业 化学纤维制造业
Manufacture of Medicines Manufacture of Chemical Fiber
年末人数 劳动报酬 平均劳动 年末人数 劳动报酬 平均劳动
地 区 Region (人) # 女 性
(千元) 报 酬 (人) # 女 性
(千元) 报 酬
Year-end Earnings (元) Year-end Earnings (元)
Figures Female Average Figures Female Average
(1 000 Earning (1 000 Earning
(person) yuan) (yuan) (person) yuan) (yuan)
National 891993 426899 12879970 14556 204733 82770 2609292 12562
北 京 Beijing 35255 17525 1046829 29619 1399 570 12878 9846

8/2/2019 China Labour Statistical Yearbook - 2004
http://slidepdf.com/reader/full/china-labour-statistical-yearbook-2004 200/464
天 津 Tianjin 32761 15949 798095 24677 2292 1013 23874 10425
河 北 Hebei 60427 30304 823340 13782 8213 3712 65209 7991
山 西 Shanxi 21333 11837 132593 6537 1214 360 1268 1059
内蒙古 Inner Mongolia 11560 5716 101063 8482
辽 宁 Liaoning 29168 13868 383243 12824 9256 4244 107646 10561
吉 林 Jilin 38488 20551 309080 8091 10747 3859 106755 9900
黑龙江 Heilongjiang 48905 24693 631727 13066 4562 1851 45772 10304
上 海 Shanghai 37065 17001 1081815 27789 5034 2034 128781 24013
江 苏 Jiangsu 58539 26771 903993 15538 33245 13000 606797 17556
浙 江 Zhejiang 41782 18131 686529 16756 9775 3707 157234 15689
安 徽 Anhui 26713 12550 196225 7547 4021 1307 47203 12289
福 建 Fujian 12184 6374 190793 15942 8312 3072 128869 15413
江 西 Jiangxi 37390 16340 361504 9853 13564 5282 96608 6950
山 东 Shandong 60281 29706 706366 11995 17018 8577 192993 11355
河 南 Henan 56880 29092 487788 8892 23728 10452 282033 12057
湖 北 Hubei 35751 17078 329366 9089 10007 3659 100517 9805
湖 南 Hunan 20205 9372 203658 9931 7986 2770 79669 9872
广 东 Guangdong 56068 27915 1411498 25468 8823 3558 117822 13012广 西 Guangxi 23939 12499 296782 12242 1189 580 11582 8624
海 南 Hainan 5500 2673 73041 13407 1188 545 13853 11612
重 庆 Chongqing 20218 8919 269528 13443 8022 3114 132468 15701
四 川 Sichuan 36032 14330 433097 11849 8901 3337 88383 10656
贵 州 Guizhou 13390 6503 138168 10637 344 144 2570 7199
云 南 Yunnan 13020 5745 209541 16575 428 81 11195 26782
西 藏 Tibet 808 361 10278 13453
陕 西 Shaanxi 42325 17370 485967 11636 1435 459 9266 6448
甘 肃 Gansu 7774 3813 77516 10201 3090 1141 30388 9780
青 海 Qinghai 2484 1070 28977 11798
宁 夏 Ningxia 2437 1477 31693 14334 240 113 2076 8797
新 疆 Xinjiang 3311 1366 39877 11729 700 229 5583 7976
3-3 17 continued
橡胶制品业 塑料制品业
Manufacture of Rubber Manufacture of Plastic
年末人数 劳动报酬 平均劳动 年末人数 劳动报酬 平均劳动
地 区 Region (人) # 女 性
(千元) 报 酬 (人) # 女 性
(千元) 报 酬Year-end Earnings (元) Year-end Earnings (元)
Figures Female Average Figures Female Average
(1 000 Earning (1 000 Earning
(person) yuan) (yuan) (person) yuan) (yuan)
National 375154 157289 4218164 11024 629700 316726 7000356 11317
北 京 Beijing 6067 2383 98317 14771 20105 9259 271438 13643
天 津 Tianjin 11938 4222 150981 12588 28643 15776 440166 16324
河 北 Hebei 15594 7870 103078 6379 25996 14501 195637 7677
山 西 Shanxi 12733 3971 107899 8526 4785 2352 22421 4745
内蒙古 Inner Mongolia 1043 370 7741 6802 4445 1237 16014 6014
辽 宁 Liaoning 27692 10924 277528 7840 26046 13074 269547 10290
吉 林 Jilin 4814 1834 36098 7506 11644 5604 79912 6776
黑龙江 Heilongjiang 12066 3862 82173 6341 14837 6014 126181 8282
上 海 Shanghai 21897 8218 484605 22611 37780 20858 583020 16002
江 苏 Jiangsu 24094 8968 332764 13992 43526 20732 592868 13699
浙 江 Zhejiang 24850 9321 287879 12285 40963 20966 510552 12587
安 徽 Anhui 11134 3234 121454 11093 12541 5739 111086 8569
福 建 Fujian 38438 21550 472991 12881 74987 44194 814257 11329
江 西 Jiangxi 3207 1196 21622 6964 6852 2546 50174 7281

8/2/2019 China Labour Statistical Yearbook - 2004
http://slidepdf.com/reader/full/china-labour-statistical-yearbook-2004 201/464
山 东 Shandong 45142 19925 479860 10615 46017 24645 505243 10912
河 南 Henan 19377 8511 172906 9018 27205 10156 202934 7594
湖 北 Hubei 8638 3835 54249 6477 20646 10213 144479 6925
湖 南 Hunan 7552 2960 73541 9239 8588 3838 72564 8225
广 东 Guangdong 26052 11333 371156 14700 117457 58096 1534688 13205
广 西 Guangxi 7601 3296 70074 8597 8321 4902 71080 8413
海 南 Hainan 1223 498 12687 5626 1458 708 14545 9482
重 庆 Chongqing 4899 2181 37804 7027 4391 1915 37033 8063
四 川 Sichuan 9103 5133 73788 8018 13153 6057 110083 8333
贵 州 Guizhou 11370 4160 123391 10636 4928 2303 37460 7687
云 南 Yunnan 4414 1942 30072 6428 5204 2466 48466 8970
西 藏 Tibet
陕 西 Shaanxi 5795 2551 43285 7426 4654 2309 33235 7138
甘 肃 Gansu 850 379 5544 6492 4518 2221 28425 6257
青 海 Qinghai 8 3 38 4750
宁 夏 Ningxia 4837 1584 54391 11365 1648 948 10758 6528
新 疆 Xinjiang 2726 1075 30248 11084 8362 3097 66090 11470
3-3 18 continued
非金属矿物制品业 黑色金属冶炼及压延加工业
Manufacture of Non-metallic Mineral Products Manufacture & Processing of Ferrous Metals
年末人数 劳动报酬 平均劳动 年末人数 劳动报酬 平均劳动
地 区 Region (人) # 女 性
(千元) 报 酬 (人) # 女 性
(千元) 报 酬
Year-end Earnings (元) Year-end Earnings (元)
Figures Female Average Figures Female Average
(1 000 Earning (1 000 Earning
(person) yuan) (yuan) (person) yuan) (yuan)
National 2092946 683933 19365083 9173 1900466 493856 34580839 17989
北 京 Beijing 65547 15934 1077327 15706 82304 16810 1886429 21554
天 津 Tianjin 18628 5056 265588 14014 46247 9770 856113 19063
河 北 Hebei 142199 52753 1092220 7468 188410 47619 3271804 17487
山 西 Shanxi 60834 17813 373631 6133 94461 22898 1402588 14757
内蒙古 Inner Mongolia 38577 10926 336489 9018 74147 23629 1122607 14957
辽 宁 Liaoning 70383 21896 678985 8885 219959 47239 3741218 16440
吉 林 Jilin 55327 18537 373618 6733 37619 10559 447316 11894
黑龙江 Heilongjiang 80550 25566 569263 6866 34513 9009 235101 6920
上 海 Shanghai 34809 9306 787481 22159 89947 15443 3812119 41230
江 苏 Jiangsu 88411 29139 1061063 11552 63941 14672 1176009 17657
浙 江 Zhejiang 33121 10077 506552 14610 16034 2865 363842 22309
安 徽 Anhui 67868 22125 535016 7498 68504 14919 1286042 18585
福 建 Fujian 89443 33914 1027170 11641 22786 6029 432116 18447
江 西 Jiangxi 60941 22853 465777 7500 54731 19130 902423 16760
山 东 Shandong 153936 51473 1303087 8473 102988 30751 1761205 17367
河 南 Henan 172834 61734 1514556 9026 84795 25030 1397212 16625
湖 北 Hubei 120318 40751 832523 6899 117184 26138 2444594 20345
湖 南 Hunan 85015 28140 649309 7380 62775 19136 1042486 16672
广 东 Guangdong 131696 43326 1579482 12163 26118 6612 616051 24089
广 西 Guangxi 74200 30964 547358 7422 31239 8963 554472 17293
海 南 Hainan 7240 2248 55964 7653 631 208 9586 15240
重 庆 Chongqing 48181 14781 444968 8971 39216 10959 720035 17399
四 川 Sichuan 123701 39665 1028120 8274 161559 53230 2473308 15220
贵 州 Guizhou 49833 13742 365355 7103 46808 12861 517500 10888
云 南 Yunnan 39501 12688 386893 9473 34012 10815 641593 18240
西 藏 Tibet 4470 1064 60045 13700

8/2/2019 China Labour Statistical Yearbook - 2004
http://slidepdf.com/reader/full/china-labour-statistical-yearbook-2004 202/464
陕 西 Shaanxi 65351 16332 508237 7699 24597 6983 286470 11729
甘 肃 Gansu 57029 14163 389888 8092 40206 11579 633825 15434
青 海 Qinghai 7899 2308 81322 10405 8563 1798 100094 11809
宁 夏 Ningxia 11885 3833 104353 8160 10331 2698 101087 10103
新 疆 Xinjiang 33219 10826 363443 10713 15841 5504 345594 23502
3-3 19 continued
有色金属冶炼及压延加工业 金属制品业
Manufacture and Processing of
Non-ferrous Metals Manufacture of Metal Products
年末人数 劳动报酬 平均劳动 年末人数 劳动报酬 平均劳动
地 区 Region (人) # 女 性
(千元) 报 酬 (人) # 女 性
(千元) 报 酬
Year-end Earnings (元) Year-end Earnings (元)
Figures Female Average Figures Female Average
(1 000 Earning (1 000 Earning
(person) yuan) (yuan) (person) yuan) (yuan)
National 790666 235962 10905998 13661 809559 290441 8916639 11073
北 京 Beijing 4586 1378 77691 17139 46752 11591 668251 14478
天 津 Tianjin 4794 917 61695 12768 32852 9927 430200 13101
河 北 Hebei 10625 2555 120327 11836 37010 12270 302724 8061
山 西 Shanxi 49533 15316 695122 14216 19204 7949 109670 5891
内蒙古 Inner Mongolia 27551 7962 283458 10486 5101 1796 31353 5991
辽 宁 Liaoning 42896 13241 402633 9538 43924 14079 484825 11057
吉 林 Jilin 9590 2837 91149 9390 9817 4037 82754 8314
黑龙江 Heilongjiang 12879 4110 106925 8222 40228 12498 203028 5036
上 海 Shanghai 15759 3723 278631 16865 42011 14501 819369 19769
江 苏 Jiangsu 17674 5760 212888 11769 64439 21172 885985 13778
浙 江 Zhejiang 7893 1852 100188 13353 41691 14459 450446 11188
安 徽 Anhui 33442 8067 403461 11588 8615 3721 60552 6902
福 建 Fujian 10387 2323 222416 21924 32371 11536 394882 12555
江 西 Jiangxi 27316 7595 428163 15332 11053 3606 92092 7649
山 东 Shandong 31601 9831 497456 15642 61837 20920 584245 9505
河 南 Henan 63395 19510 914342 14625 30304 12404 213475 7469
湖 北 Hubei 25971 7582 343246 11283 43922 16995 348866 7776
湖 南 Hunan 55563 16918 815783 14310 10564 3468 88206 8537
广 东 Guangdong 19715 5298 344476 17097 118702 54810 1646228 14181
广 西 Guangxi 26414 6858 393913 15081 11723 4270 97097 8180海 南 Hainan 182 55 2781 11398 1147 265 13668 11834
重 庆 Chongqing 16507 5859 237243 14327 10425 3172 89178 8621
四 川 Sichuan 28956 9493 350485 12410 23083 9365 210388 8766
贵 州 Guizhou 35429 9990 510213 14358 11228 2973 114902 10241
云 南 Yunnan 55654 16870 717300 12600 7776 2415 66074 8176
西 藏 Tibet 20 3 680 34000 49 11 340 6939
陕 西 Shaanxi 19964 6077 217853 10835 26776 9780 283345 10572
甘 肃 Gansu 106286 36484 1608986 15089 7512 2635 51428 6662
青 海 Qinghai 14210 4250 227498 16221 3193 1454 27049 8419
宁 夏 Ningxia 9989 1608 153280 14034 1884 632 14272 6647
新 疆 Xinjiang 5885 1640 85716 14951 4366 1730 51747 11428

8/2/2019 China Labour Statistical Yearbook - 2004
http://slidepdf.com/reader/full/china-labour-statistical-yearbook-2004 203/464
3-3 20 continued
通用设备制造业 专用设备制造业
Manufacture of General Purpose Machinery Manufacture of Special Purpose Machinery
年末人数 劳动报酬 平均劳动 年末人数 劳动报酬 平均劳动
地 区 Region (人) # 女 性
(千元) 报 酬 (人) # 女 性
(千元) 报 酬
Year-end Earnings (元) Year-end Earnings (元)
Figures Female Average Figures Female Average
(1 000 Earning (1 000 Earning
(person) yuan) (yuan) (person) yuan) (yuan)
National 1884852 614388 24390048 12777 1661521 534418 20174292 12040
北 京 Beijing 62741 16660 1291843 20136 57647 15737 1288395 22066
天 津 Tianjin 39801 11268 633994 15444 37151 11381 584211 15932
河 北 Hebei 85298 28373 724483 8354 83156 24371 841143 9969
山 西 Shanxi 49400 17151 381862 7613 99710 36522 859088 8608
内蒙古 Inner Mongolia 20358 7429 166808 8014 40896 14924 582108 14244
辽 宁 Liaoning 154157 49281 1849220 11287 96960 30090 1157090 11205
吉 林
Jilin 33753 13422 212937 6139 34546 11158 242327 6559黑龙江 Heilongjiang 146205 58601 2355665 15859 90579 26996 748391 8128
上 海 Shanghai 103769 27714 2679825 25777 76627 25412 1688922 21431
江 苏 Jiangsu 208296 67738 2922497 13924 108568 35059 1575271 14509
浙 江 Zhejiang 87884 25937 1429862 16377 36275 10407 515957 14541
安 徽 Anhui 51680 16483 497693 9359 33253 10239 264728 7744
福 建 Fujian 28933 8744 424774 14718 36488 13197 559584 16062
江 西 Jiangxi 32711 12461 280544 8530 20204 6469 139905 6901
山 东 Shandong 176244 54504 1889602 10822 153517 46376 1575674 10177
河 南 Henan 112915 38728 938415 8488 139140 49406 1467195 10683
湖 北 Hubei 85313 30817 732129 8514 38739 12814 324342 8168
湖 南 Hunan 53542 17374 558200 10237 64514 21521 702072 10755
广 东 Guangdong 62352 17978 1110262 18080 54837 17959 917182 16561
广 西 Guangxi 38152 9669 562952 14619 26403 7079 252026 9296
海 南 Hainan 86 21 510 5930 1603 375 15275 9429
重 庆 Chongqing 41092 13597 473064 11459 61486 22289 806688 14006
四 川 Sichuan 76309 27244 887755 11443 70869 21685 946766 13259
贵 州 Guizhou 16295 5915 128619 7522 19355 5754 139265 6796
云 南 Yunnan 17936 5800 226366 12082 28113 8927 340394 11849
西 藏 Tibet 14 2 243 17357 37 6 308 8324
陕 西 Shaanxi 55926 18257 599871 10337 106918 33529 1171890 10943
甘 肃 Gansu 19914 5860 148605 7445 30386 10266 316750 10336
青 海 Qinghai 4922 1902 45820 8921 997 324 12460 12168
宁 夏 Ningxia 13081 3878 156360 11656 7523 2481 86760 11350
新 疆 Xinjiang 5773 1580 79268 13438 5024 1665 52125 10193
3-3 21 continued
交通运输设备制造业 电气机械及器材制造业 Manufacture
Manufacture of Transport Equipment of Electrical Machinery and Equipment
年末人数 劳动报酬 平均劳动 年末人数 劳动报酬 平均劳动
地 区 Region (人) # 女 性
(千元) 报 酬 (人) # 女 性
(千元) 报 酬
Year-end Earnings (元) Year-end Earnings (元)
Figures Female Average Figures Female Average
(1 000 Earning (1 000 Earning
(person) yuan) (yuan) (person) yuan) (yuan)
National 2316516 740101 37917918 16313 1414331 628805 19017486 13435
北 京 Beijing 100380 25928 2239676 22207 47754 18068 982295 20615
天 津 Tianjin 67192 24056 1118912 17076 41420 16783 643367 15799

8/2/2019 China Labour Statistical Yearbook - 2004
http://slidepdf.com/reader/full/china-labour-statistical-yearbook-2004 204/464
河 北 Hebei 76498 22460 867731 11403 31911 13536 322864 10002
山 西 Shanxi 39663 11866 428693 10792 19699 7860 188034 9530
内蒙古 Inner Mongolia 10484 3361 108268 10463 5365 2353 46711 8960
辽 宁 Liaoning 153362 44949 2616493 16109 74313 34139 925302 11825
吉 林 Jilin 193528 67968 3640861 18754 14689 5730 160900 10675
黑龙江 Heilongjiang 84994 30981 1129503 13521 62528 20742 647608 10349
上 海 Shanghai 140077 36455 4487299 31981 85187 36012 2071905 23806
江 苏 Jiangsu 150309 44735 2586246 16913 126468 55890 1800106 14284
浙 江 Zhejiang 52941 16616 850762 16487 73654 31985 1092769 15268
安 徽 Anhui 75249 20848 950712 12864 31713 13227 325938 10210
福 建 Fujian 44950 14104 680616 15650 71101 33901 956805 13350
江 西 Jiangxi 65270 20340 857735 13192 13662 5057 105863 7549
山 东 Shandong 133402 41443 1773818 13576 106095 46502 1254284 11882
河 南 Henan 65980 21967 802960 12483 55420 20240 574080 10494
湖 北 Hubei 228995 77533 3688655 16006 47160 24290 373958 7720
湖 南 Hunan 73549 25369 1036726 13834 42419 17026 426765 10051
广 东 Guangdong 101520 29379 2249543 22470 281490 157977 4022616 14699
广 西 Guangxi 42420 12069 723459 17594 15394 6132 157840 10022海 南 Hainan 4405 1337 49127 11125 1384 549 17351 12591
重 庆 Chongqing 112686 39422 1457445 12992 17520 6601 177416 9588
四 川 Sichuan 110782 37598 1402542 12197 40789 15594 567260 13467
贵 州 Guizhou 58312 23185 775015 12943 7893 3147 54610 6922
云 南 Yunnan 15904 5126 221702 13323 12815 4524 159235 11900
西 藏 Tibet 57 24 650 11607
陕 西 Shaanxi 91542 33532 968151 10466 56636 20740 650875 11268
甘 肃 Gansu 14386 4977 117622 8144 21862 7286 216527 9848
青 海 Qinghai 1557 463 17647 11305 201 123 1268 5712
宁 夏 Ningxia 651 216 5473 8132 2405 1001 24566 10292
新 疆 Xinjiang 5471 1794 63876 11478 5384 1790 68368 12310
3-3 22 continued
通信设备、计算机及其他电子设备制造业 仪器仪表及文化、办公用机械制造业
Manufacture of Communication Equipment, Manufacture of Measuring Instrument and
Computer and Other Electronic Equipment Machinery for Cultural Activity & Office Work
年末人数 劳动报酬 平均劳动 年末人数 劳动报酬 平均劳动
地 区 Region (人) # 女 性
(千元) 报 酬 (人) # 女 性
(千元) 报 酬Year-end Earnings (元) Year-end Earnings (元)
Figures Female Average Figures Female Average
(1 000 Earning (1 000 Earning
(person) yuan) (yuan) (person) yuan) (yuan)
National 1825847 1053985 33030256 18922 553854 275928 8240686 15044
北 京 Beijing 88986 37350 3201982 36462 30604 11397 716052 22856
天 津 Tianjin 106862 63010 2649126 25138 21463 10665 294745 14129
河 北 Hebei 12417 5964 187735 14872 10143 4531 67048 6503
山 西 Shanxi 10269 3770 86996 7934 3809 1911 22235 5818
内蒙古 Inner Mongolia 4895 2555 34909 7379 229 116 1786 7765
辽 宁 Liaoning 53657 32443 775601 14632 24200 12734 286559 11586
吉 林 Jilin 13039 5321 124436 10599 7500 3123 91629 12007
黑龙江 Heilongjiang 10286 4327 71798 6790 19062 6660 132920 6932
上 海 Shanghai 136894 83130 3098823 24505 46942 20463 1573819 35822
江 苏 Jiangsu 306398 191666 4984197 17743 45461 21948 806273 18202
浙 江 Zhejiang 61396 37358 935888 16044 28689 15195 349184 12362
安 徽 Anhui 11514 5587 88397 8113 5512 2785 53851 9210
福 建 Fujian 117952 80971 1581592 14543 41823 26572 697493 16893
江 西 Jiangxi 8032 3489 54218 6687 18036 9138 132679 7373
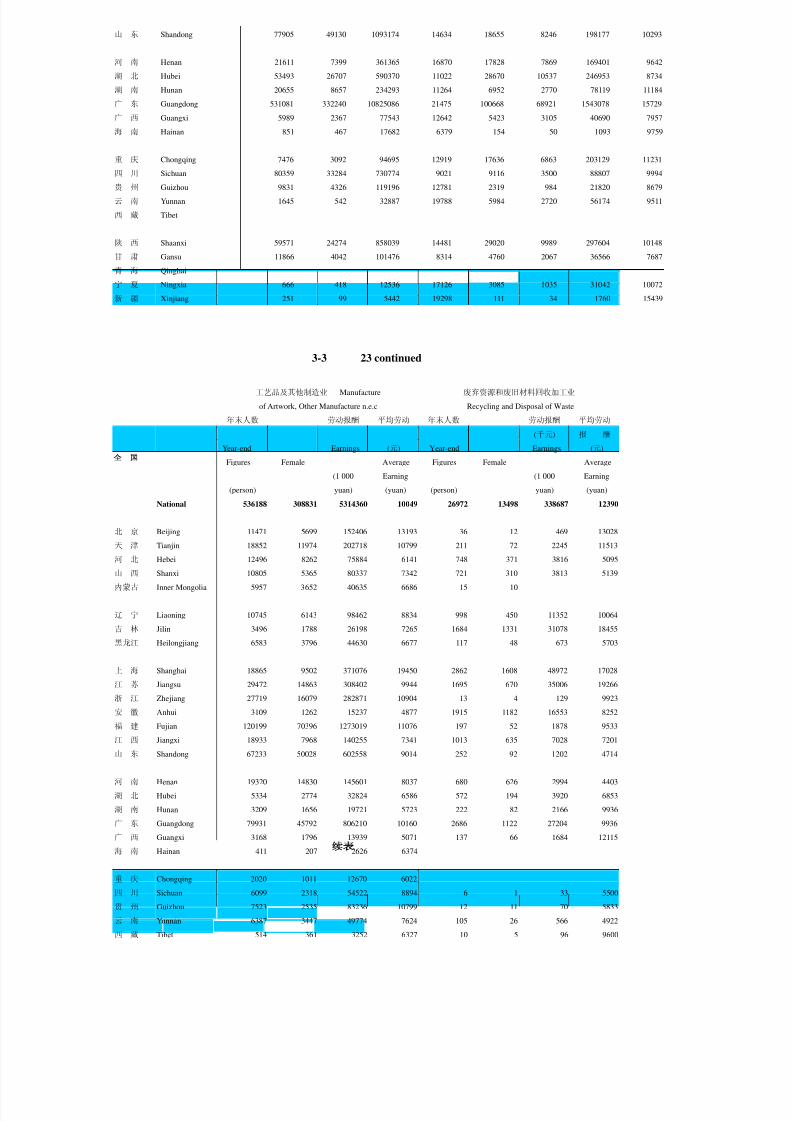
8/2/2019 China Labour Statistical Yearbook - 2004
http://slidepdf.com/reader/full/china-labour-statistical-yearbook-2004 205/464
山 东 Shandong 77905 49130 1093174 14634 18655 8246 198177 10293
河 南 Henan 21611 7399 361365 16870 17828 7869 169401 9642
湖 北 Hubei 53493 26707 590370 11022 28670 10537 246953 8734
湖 南 Hunan 20655 8657 234293 11264 6952 2770 78119 11184
广 东 Guangdong 531081 332240 10825086 21475 100668 68921 1543078 15729
广 西 Guangxi 5989 2367 77543 12642 5423 3105 40690 7957
海 南 Hainan 851 467 17682 6379 154 50 1093 9759
重 庆 Chongqing 7476 3092 94695 12919 17636 6863 203129 11231
四 川 Sichuan 80359 33284 730774 9021 9116 3500 88807 9994
贵 州 Guizhou 9831 4326 119196 12781 2319 984 21820 8679
云 南 Yunnan 1645 542 32887 19788 5984 2720 56174 9511
西 藏 Tibet
陕 西 Shaanxi 59571 24274 858039 14481 29020 9989 297604 10148
甘 肃 Gansu 11866 4042 101476 8314 4760 2067 36566 7687
青 海 Qinghai
宁 夏 Ningxia 666 418 12536 17126 3085 1035 31042 10072
新 疆 Xinjiang 251 99 5442 19298 111 34 1760 15439
3-3 23 continued
工艺品及其他制造业 Manufacture 废弃资源和废旧材料回收加工业
of Artwork, Other Manufacture n.e.c Recycling and Disposal of Waste
年末人数 劳动报酬 平均劳动 年末人数 劳动报酬 平均劳动
地 区 Region (人) # 女 性
(千元) 报 酬 (人) # 女 性
(千元) 报 酬
Year-end Earnings (元) Year-end Earnings (元)
Figures Female Average Figures Female Average
(1 000 Earning (1 000 Earning
(person) yuan) (yuan) (person) yuan) (yuan)
National 536188 308831 5314360 10049 26972 13498 338687 12390
北 京 Beijing 11471 5699 152406 13193 36 12 469 13028
天 津 Tianjin 18852 11974 202718 10799 211 72 2245 11513
河 北 Hebei 12496 8262 75884 6141 748 371 3816 5095
山 西 Shanxi 10805 5365 80337 7342 721 310 3813 5139
内蒙古 Inner Mongolia 5957 3652 40635 6686 15 10
辽 宁 Liaoning 10745 6143 98462 8834 998 450 11352 10064
吉 林 Jilin 3496 1788 26198 7265 1684 1331 31078 18455黑龙江 Heilongjiang 6583 3796 44630 6677 117 48 673 5703
上 海 Shanghai 18865 9502 371076 19450 2862 1608 48972 17028
江 苏 Jiangsu 29472 14863 308402 9944 1695 670 35006 19266
浙 江 Zhejiang 27719 16079 282871 10904 13 4 129 9923
安 徽 Anhui 3109 1262 15237 4877 1915 1182 16553 8252
福 建 Fujian 120199 70396 1273019 11076 197 52 1878 9533
江 西 Jiangxi 18933 7968 140255 7341 1013 635 7028 7201
山 东 Shandong 67233 50028 602558 9014 252 92 1202 4714
河 南 Henan 19320 14830 145601 8037 680 626 2994 4403
湖 北 Hubei 5334 2774 32824 6586 572 194 3920 6853
湖 南 Hunan 3209 1656 19721 5723 222 82 2166 9936
广 东 Guangdong 79931 45792 806210 10160 2686 1122 27204 9936
广 西 Guangxi 3168 1796 13939 5071 137 66 1684 12115
海 南 Hainan 411 207 2626 6374
重 庆 Chongqing 2020 1011 12670 6022
四 川 Sichuan 6099 2318 54522 8894 6 1 33 5500
贵 州 Guizhou 7523 2535 83236 10799 12 11 70 5833
云 南 Yunnan 6387 3447 49774 7624 105 26 566 4922
西 藏 Tibet 514 361 3252 6327 10 5 96 9600

8/2/2019 China Labour Statistical Yearbook - 2004
http://slidepdf.com/reader/full/china-labour-statistical-yearbook-2004 206/464
陕 西 Shaanxi 28451 10347 318334 11498 741 299 4945 6593
甘 肃 Gansu 4984 3543 23405 4685 9235 4175 129794 14108
青 海 Qinghai 546 248 4083 7492
宁 夏 Ningxia 477 424 1678 3563
新 疆 Xinjiang 1879 765 27797 14500 89 44 1001 11247
3-3 24 continued
电力、燃气及水的生产和供应业 电力、热力的生产和供应业
Production and Distribution Production and Supply of
of Electricity,Gas and Water Electric Power and Heat Power
年末人数 劳动报酬 平均劳动 年末人数 劳动报酬 平均劳动
地 区 Region (人) # 女 性
(千元) 报 酬 (人) # 女 性
(千元) 报 酬
Year-end Earnings (元) Year-end Earnings (元)
Figures Female Average Figures Female Average
(1 000 Earning (1 000 Earning
(person) yuan) (yuan) (person) yuan) (yuan)
National 2975674 926819 55198525 18574 2283770 656566 45134177 19796
北 京 Beijing 37764 12385 1437991 36867 23661 7556 1101454 45599
天 津 Tianjin 35481 8718 902300 25790 24567 4839 661569 27185
河 北 Hebei 167531 48059 2814274 16888 132728 33971 2375839 17984
山 西 Shanxi 114585 36905 1414621 12444 86627 25168 1194183 13919
内蒙古 Inner Mongolia 88954 29797 1591064 17903 73553 22980 1430950 19461
辽 宁 Liaoning 170382 49819 3138569 18399 118574 30291 2505482 21256
吉 林 Jilin 81342 22319 1213236 15147 60877 14786 967897 16238
黑龙江 Heilongjiang 156309 47305 2445989 15581 123743 34700 2027192 16419
上 海 Shanghai 56388 15206 1839545 32347 29908 6567 1115427 37089
江 苏 Jiangsu 127061 33713 3173123 24786 91251 20280 2547094 27647
浙 江 Zhejiang 90239 23520 3104911 34417 69403 16224 2632707 37764
安 徽 Anhui 86848 26220 1170420 13470 63810 17628 915337 14329
福 建 Fujian 80725 24341 1628868 20256 65850 18739 1360651 20771
江 西 Jiangxi 93414 29717 1171430 12490 74926 22768 999802 13280
山 东 Shandong 205455 63026 3579894 17589 155973 43343 2917770 18939
河 南 Henan 231431 72686 3308898 14504 190307 53975 2875899 15312
湖 北 Hubei 127255 43987 1800238 14158 91141 29433 1433885 15731
湖 南 Hunan 113836 39598 1699220 14898 86347 28037 1313670 15169
广 东 Guangdong 195846 58390 5664160 28522 144532 38976 4485235 30446广 西 Guangxi 82958 27611 1425073 17285 67266 21287 1216196 18205
海 南 Hainan 20344 6659 313414 15341 14256 3915 253056 17593
重 庆 Chongqing 57952 20871 952677 16331 42894 14638 711914 16446
四 川 Sichuan 156184 54171 2355483 15099 121392 41671 1879197 15448
贵 州 Guizhou 59656 18115 1102923 18490 48521 13784 987096 20304
云 南 Yunnan 70722 24687 1281454 18256 58653 20102 1110735 19086
西 藏 Tibet 6805 2081 143012 21206 4888 1605 90090 18687
陕 西 Shaanxi 84538 27972 1339534 16086 67593 20858 1142492 17223
甘 肃 Gansu 71398 24868 1230051 17328 60991 20281 1103005 18172
青 海 Qinghai 17277 5182 368820 21261 14851 4298 341636 22870
宁 夏 Ningxia 31450 9574 598528 18722 27180 7673 548082 19733
新 疆 Xinjiang 55544 19317 988805 17658 47507 16193 888635 18485
3-3 25 continued
燃气生产和供应业 水的生产和供应业
Production and Distribution of Gas Production and Distribution of Water
年末人数 劳动报酬 平均劳动 年末人数 劳动报酬 平均劳动

8/2/2019 China Labour Statistical Yearbook - 2004
http://slidepdf.com/reader/full/china-labour-statistical-yearbook-2004 207/464
地 区 Region (人) # 女 性
(千元) 报 酬 (人) # 女 性
(千元) 报 酬
Year-end Earnings (元) Year-end Earnings (元)
Figures Female Average Figures Female Average
(1 000 Earning (1 000 Earning
(person) yuan) (yuan) (person) yuan) (yuan)
National 185200 62279 2900129 15573 506704 207974 7164219 14168
北 京 Beijing 7637 2625 171679 21495 6466 2204 164858 24021
天 津 Tianjin 6854 2357 153634 22176 4060 1522 87097 23394
河 北 Hebei 11170 4162 157296 14271 23633 9926 281139 11959
山 西 Shanxi 11985 4892 70856 5930 15973 6845 149582 9388
内蒙古 Inner Mongolia 2111 634 27105 12100 13290 6183 133009 10152
辽 宁 Liaoning 15521 5769 202910 12719 36287 13759 430177 11703
吉 林 Jilin 4041 1128 58326 13002 16424 6405 187013 11685
黑龙江 Heilongjiang 9921 3385 104740 10646 22645 9220 314057 13260
上 海 Shanghai 12061 3026 290648 23922 14419 5613 433470 29598
江 苏 Jiangsu 9522 3205 181523 18826 26288 10228 444506 16932
浙 江 Zhejiang 3417 1210 68232 20051 17419 6086 403972 23628
安 徽 Anhui 5222 1764 61759 11615 17816 6828 193324 10927福 建 Fujian 2014 384 46817 23200 12861 5218 221400 17176
江 西 Jiangxi 4528 1020 41800 9262 13960 5929 129828 9278
山 东 Shandong 12926 4900 184594 14307 36556 14783 477530 13059
河 南 Henan 6799 2945 101234 15047 34325 15766 331765 9877
湖 北 Hubei 8575 2616 92842 10879 27539 11938 273511 9959
湖 南 Hunan 4346 1442 55223 12622 23143 10119 330327 14309
广 东 Guangdong 8356 2433 231785 28447 42958 16981 947140 21965
广 西 Guangxi 1295 415 18388 14134 14397 5909 190489 13283
海 南 Hainan 748 175 13915 19140 5340 2569 46443 8732
重 庆 Chongqing 6343 2515 122703 19539 8715 3718 118060 13462
四 川 Sichuan 15536 4625 221625 14179 19256 7875 254661 13602
贵 州 Guizhou 3275 907 37571 11683 7860 3424 78256 10008
云 南 Yunnan 2946 934 46323 15676 9123 3651 124396 13753
西 藏 Tibet 1517 302 43564 28717 400 174 9358 23049
陕 西 Shaanxi 3616 1418 54224 14852 13329 5696 142818 10751
甘 肃 Gansu 161 41 1313 8695 10246 4546 125733 12403
青 海 Qinghai 115 41 1287 11191 2311 843 25897 11289
宁 夏 Ningxia 1282 519 14846 11717 2988 1382 35600 12163
新 疆 Xinjiang 1360 490 21367 16602 6677 2634 78803 11873
3-3 26 continued
建筑业 房屋和土木工程建筑业
Construction of Building
Construction and Civil Engineering
年末人数 劳动报酬 平均劳动 年末人数 劳动报酬 平均劳动
地 区 Region (人) # 女 性
(千元) 报 酬 (人) # 女 性
(千元) 报 酬
Year-end Earnings (元) Year-end Earnings (元)
Figures Female Average Figures Female Average
(1 000 Earning (1 000 Earning
(person) yuan) (yuan) (person) yuan) (yuan)
National 8337110 1283845 96588643 11328 7289343 1073567 81124088 10901
北 京 Beijing 650722 63911 10722473 16474 527518 45820 8553953 16379
天 津 Tianjin 99424 20676 1966433 19050 67458 13219 1313388 18512
河 北 Hebei 331328 52015 3234572 9021 289522 42826 2726056 8645
山 西 Shanxi 208716 39520 1910671 9066 186984 34615 1712844 9170
内蒙古 Inner Mongolia 130495 27604 1373891 8228 118137 25098 1195636 7951
辽 宁 Liaoning 308744 77840 3361350 9563 246070 59825 2566716 8923

8/2/2019 China Labour Statistical Yearbook - 2004
http://slidepdf.com/reader/full/china-labour-statistical-yearbook-2004 208/464
吉 林 Jilin 165404 45194 1575198 8754 140240 36870 1313485 8478
黑龙江 Heilongjiang 405633 98852 4469914 10434 351530 83367 3718756 10003
上 海 Shanghai 141015 22328 3326927 23147 99378 15378 2282371 22843
江 苏 Jiangsu 263755 42417 3503044 12921 211605 31893 2565498 11796
浙 江 Zhejiang 518550 40200 8221541 16227 482419 35397 7439970 15824
安 徽 Anhui 291515 44825 2436435 8417 256023 38097 2105792 8286
福 建 Fujian 264008 38681 3402211 13580 231881 33741 2909713 13266
江 西 Jiangxi 181401 29228 1580213 8861 160971 25161 1306225 8342
山 东 Shandong 387290 60392 3905678 9977 324217 47930 3166840 9708
河 南 Henan 617075 77404 5438015 9219 545485 63164 4655894 9072
湖 北 Hubei 301104 54719 2918901 9691 270666 47795 2550403 9408
湖 南 Hunan 312460 43761 2757023 9154 295724 40626 2534314 8926
广 东 Guangdong 546082 66127 7973158 14468 496148 57323 6831211 13625
广 西 Guangxi 168081 25250 1726270 10180 146662 21861 1440734 9893
海 南 Hainan 44523 6035 415547 9058 38157 5224 349005 8834
重 庆 Chongqing 310358 39916 2994926 10034 284362 35799 2737173 9990
四 川 Sichuan 723558 103290 6596687 9202 668994 92563 5887012 8889
贵 州 Guizhou 186229 27590 1641928 8757 175887 25342 1520595 8574云 南 Yunnan 173378 27030 1653671 10397 147182 21855 1328342 9982
西 藏 Tibet 7978 1633 113896 15174 7978 1633 113896 15174
陕 西 Shaanxi 203811 38514 2017569 9716 176890 30809 1667198 9268
甘 肃 Gansu 156288 23974 1497802 9083 133074 20736 1236668 8750
青 海 Qinghai 29407 6572 328556 10298 26758 5712 288555 9760
宁 夏 Ningxia 43821 6637 647925 10413 40548 6097 593611 10568
新 疆 Xinjiang 164957 31710 2876218 11494 140875 27791 2512234 11312
3-3 27 continued
建筑安装业 建筑装饰业
Architectural Installation Architectural Decoration
年末人数 劳动报酬 平均劳动 年末人数 劳动报酬 平均劳动
地 区 Region (人) # 女 性
(千元) 报 酬 (人) # 女 性
(千元) 报 酬
Year-end Earnings (元) Year-end Earnings (元)
Figures Female Average Figures Female Average
(1 000 Earning (1 000 Earning
(person) yuan) (yuan) (person) yuan) (yuan)
National 726791 148824 11383309 14982 202819 38803 2559910 12283
北 京 Beijing 75803 11577 1470639 18045 38205 5682 576984 14855
天 津 Tianjin 26725 6389 590971 21604 3210 719 36685 12716
河 北 Hebei 33609 7063 378039 10829 2419 750 18270 7578
山 西 Shanxi 18972 4448 176873 8697 2444 401 19164 5793
内蒙古 Inner Mongolia 10464 2207 160033 11246 501 107 4516 8701
辽 宁 Liaoning 52806 15750 673076 12554 7411 1690 86407 11266
吉 林 Jilin 17425 5485 175777 10212 2563 398 23735 9153
黑龙江 Heilongjiang 32298 7776 472230 13668 19142 6999 251587 12930
上 海 Shanghai 29965 4751 804575 26445 8231 1648 178561 18174
江 苏 Jiangsu 40147 7971 785269 18750 7063 1481 72260 10357
浙 江 Zhejiang 25549 3243 646093 25129 7363 1205 91228 12046
安 徽 Anhui 27364 4912 269346 10058 6847 1448 48221 6627
福 建 Fujian 12247 2037 198440 16123 8349 1303 113927 14569
江 西 Jiangxi 11698 2494 186419 14430 4242 825 35645 8471
山 东 Shandong 46748 9280 562485 11607 9648 1956 94045 9260
河 南 Henan 41571 9423 502619 10855 16551 2085 163719 9021
湖 北 Hubei 26606 6004 328507 12467 2704 597 29134 11141
湖 南 Hunan 13876 2711 194844 13464 1575 143 14689 9754
广 东 Guangdong 29388 5043 753891 25786 19797 3664 374312 18994

8/2/2019 China Labour Statistical Yearbook - 2004
http://slidepdf.com/reader/full/china-labour-statistical-yearbook-2004 209/464
广 西 Guangxi 11163 2388 152425 11854 1348 337 13758 9372
海 南 Hainan 1451 385 17460 10193 4912 425 49059 10541
重 庆 Chongqing 17009 2901 167113 10644 4686 646 53094 11859
四 川 Sichuan 45720 9258 627291 13726 7866 1314 73329 9233
贵 州 Guizhou 8675 1928 105461 12469 1265 156 13053 9785
云 南 Yunnan 17214 3402 251719 14005 7709 1410 50744 7395
西 藏 Tibet
陕 西 Shaanxi 16308 4087 212472 12196 1974 716 14039 7116
甘 肃 Gansu 15611 2346 194850 12541 2991 297 29438 8653
青 海 Qinghai 1203 274 21624 17975 157 64 676 4306
宁 夏 Ningxia 2333 383 41512 8322 760 132 10520 13117
新 疆 Xinjiang 16843 2908 261256 13262 886 205 19111 10403
3-3 28 continued
其他建筑业 交通运输、仓储和邮政业
Other Construction Traffic, Transport, Storage and Post
年末人数 劳动报酬 平均劳动 年末人数 劳动报酬 平均劳动
地 区 Region (人) # 女 性
(千元) 报 酬 (人) # 女 性
(千元) 报 酬
Year-end Earnings (元) Year-end Earnings (元)
Figures Female Average Figures Female Average
(1 000 Earning (1 000 Earning
(person) yuan) (yuan) (person) yuan) (yuan)
National 118157 22651 1521336 13053 6365174 1824675 100801522 15753
北 京 Beijing 9196 832 120897 14606 306787 86496 5946002 19618
天 津 Tianjin 2031 349 25389 12458 134642 28697 3079896 23353
河 北 Hebei 5778 1376 112207 18992 270880 72665 3445291 12678
山 西 Shanxi 316 56 1790 5665 218380 52888 2991008 13755
内蒙古 Inner Mongolia 1393 192 13706 7389 164931 45698 2242088 13429
辽 宁 Liaoning 2457 575 35151 13688 336682 92453 5097801 14607
吉 林 Jilin 5176 2441 62201 11939 256349 75963 2820674 10853
黑龙江 Heilongjiang 2663 710 27341 10349 325849 94916 4185579 12668
上 海 Shanghai 3441 551 61420 17219 348139 71427 8402805 24072
江 苏 Jiangsu 4940 1072 80017 16800 344743 90289 5860718 16798
浙 江 Zhejiang 3219 355 44250 13845 197247 54718 4380434 22254
安 徽 Anhui 1281 368 13076 10394 171202 51135 1614691 9310
福 建 Fujian 11531 1600 180131 16263 141942 40577 2533432 17874江 西 Jiangxi 4490 748 51924 11246 162946 47273 2231117 13645
山 东 Shandong 6677 1226 82308 12407 307797 87038 4956583 16025
河 南 Henan 13468 2732 115783 9459 329390 103748 4063962 12447
湖 北 Hubei 1128 323 10857 9400 317975 127889 3781727 11757
湖 南 Hunan 1285 281 13176 10278 255213 81118 3186607 12251
广 东 Guangdong 749 97 13744 18252 437376 118519 11170343 25703
广 西 Guangxi 8908 664 119353 12422 174543 45868 2280670 13311
海 南 Hainan 3 1 23 7667 36131 11648 554929 15286
重 庆 Chongqing 4301 570 37546 8738 146220 42686 1837977 12453
四 川 Sichuan 978 155 9055 9472 225183 78390 2975425 12997
贵 州 Guizhou 402 164 2819 7640 99557 30508 1275016 12830
云 南 Yunnan 1273 363 22866 20164 145805 44555 2049087 13617
西 藏 Tibet 8061 2699 172431 21511
陕 西 Shaanxi 8639 2902 123860 14814 204219 49625 2915664 14257
甘 肃 Gansu 4612 595 36846 7982 125303 39196 1831032 14695
青 海 Qinghai 1289 522 17701 18044 29067 10780 513971 18028
宁 夏 Ningxia 180 25 2282 8743 32055 9662 471603 15056
新 疆 Xinjiang 6353 806 83617 12656 110560 35551 1932959 17298

8/2/2019 China Labour Statistical Yearbook - 2004
http://slidepdf.com/reader/full/china-labour-statistical-yearbook-2004 210/464
3-3 29 continued
铁路运输业 道路运输业
Transport Via Railway Transport Via Road
年末人数 劳动报酬 平均劳动 年末人数 劳动报酬 平均劳动
地 区 Region (人) # 女 性
(千元) 报 酬 (人) # 女 性
(千元) 报 酬
Year-end Earnings (元) Year-end Earnings (元)
Figures Female Average Figures Female Average
(1 000 Earning (1 000 Earning
(person) yuan) (yuan) (person) yuan) (yuan)
National 1778153 403450 31907830 17873 1657251 517265 18600625 11102
北 京 Beijing 51732 7826 1055770 20490 23628 5689 415773 17348
天 津 Tianjin 33843 6880 680894 19970 15895 3685 242894 14691
河 北 Hebei 87519 14495 1145260 13062 86762 25185 767464 8809
山 西 Shanxi 114575 18599 2029427 17863 52479 14302 440504 8380
内蒙古 Inner Mongolia 89116 18557 1453667 16273 33858 11185 353619 10343
辽 宁 Liaoning 106367 20447 1843985 17006 71655 22326 692422 8953
吉 林 Jilin 84164 20463 1322978 15749 39964 13135 298515 7287
黑龙江 Heilongjiang 116337 22291 1975700 16604 71529 24330 622427 8663
上 海 Shanghai 36955 6847 821726 21864 21880 3817 384710 17375
江 苏 Jiangsu 65098 13771 1154368 17953 89516 24439 1260839 13688
浙 江 Zhejiang 27632 3975 665058 23835 69886 21035 1283459 18321
安 徽 Anhui 29459 5296 405319 13695 61824 19037 499024 7997
福 建 Fujian 28561 5574 570816 20188 33836 9669 477251 13883
江 西 Jiangxi 67647 16518 1194158 17738 45703 14319 506094 10903
山 东 Shandong 62664 9543 1084727 17334 103575 34751 1151760 11166
河 南 Henan 111897 24661 2107824 18862 124562 41765 1044932 8514
湖 北 Hubei 86412 50288 1494698 17388 103019 36802 907104 8712
湖 南 Hunan 85997 25123 1399418 15584 76705 24359 758978 9851
广 东 Guangdong 61868 13580 1513078 24638 115797 35187 2106925 18308
广 西 Guangxi 47023 8102 877092 18983 54442 17848 599561 10988
海 南 Hainan 2130 440 31234 14521 9297 3253 124807 13581
重 庆 Chongqing 36066 9550 619714 17002 35421 10241 354739 9898
四 川 Sichuan 43075 12037 780309 17694 90406 30130 909481 9884
贵 州 Guizhou 36257 9524 605262 16629 29701 9090 265616 8804
云 南 Yunnan 48575 11462 861981 17440 58572 19181 636450 10255
西 藏 Tibet 4960 1584 96603 19567
陕 西 Shaanxi 93809 14920 1729253 18303 46556 12819 417949 8908
甘 肃 Gansu 57448 15458 1090597 19229 29174 8788 295128 10224
青 海 Qinghai 14874 5096 311391 21897 9843 3912 135761 13698
宁 夏 Ningxia 14129 3621 252257 18270 11021 3499 129282 12224
新 疆 Xinjiang 36924 8506 829869 22370 35785 11903 420554 11627
3-3 30 continued
城市公共交通业 水上运输业
Urban Public Traffic Water Transport
年末人数 劳动报酬 平均劳动 年末人数 劳动报酬 平均劳动
地 区 Region (人) # 女 性
(千元) 报 酬 (人) # 女 性
(千元) 报 酬
Year-end Earnings (元) Year-end Earnings (元)
Figures Female Average Figures Female Average
(1 000 Earning (1 000 Earning
(person) yuan) (yuan) (person) yuan) (yuan)
National 948320 316111 12965979 13769 579355 114265 13310874 22499
北 京 Beijing 165889 48147 2395572 14662 32 9 2500 78125

8/2/2019 China Labour Statistical Yearbook - 2004
http://slidepdf.com/reader/full/china-labour-statistical-yearbook-2004 211/464
天 津 Tianjin 19382 5947 245954 12815 27623 4006 1121011 40292
河 北 Hebei 19564 8881 180585 9125 22293 5560 650486 29381
山 西 Shanxi 16871 7548 127475 7622 120 28 881 7342
内蒙古 Inner Mongolia 11211 4802 66284 6097 49 14 691 13820
辽 宁 Liaoning 45855 18265 449904 9689 33984 6452 777904 22159
吉 林 Jilin 17754 6783 192207 10713 751 116 5387 6960
黑龙江 Heilongjiang 29526 13053 378909 12638 5994 1066 60674 9976
上 海 Shanghai 151572 27221 2049186 13568 63296 8673 2598037 40313
江 苏 Jiangsu 39497 13771 665272 17163 87142 18500 1492185 16592
浙 江 Zhejiang 29825 10713 541209 18466 26000 4943 822344 31480
安 徽 Anhui 24034 9878 198081 8122 21858 6261 150735 6750
福 建 Fujian 21317 6573 253689 12017 15942 3032 325393 20349
江 西 Jiangxi 13336 4504 142261 10831 6800 1401 46617 6766
山 东 Shandong 36998 15040 520880 14193 48418 8583 1227419 24871
河 南 Henan 31025 13823 275659 8987 2961 922 14996 5109
湖 北 Hubei 36612 14294 341443 9081 39858 7783 430075 10288
湖 南 Hunan 24931 10339 264334 10619 14205 3747 112003 7725
广 东 Guangdong 75654 19597 2082151 28281 88893 15192 2678437 29779广 西 Guangxi 12165 4151 180020 15651 20169 5620 227043 11000
海 南 Hainan 1709 602 15585 8967 10308 2639 157485 14750
重 庆 Chongqing 19012 7546 205240 10819 30852 5961 309541 9715
四 川 Sichuan 32239 14319 405380 12360 8569 2915 72294 8268
贵 州 Guizhou 9892 4092 125478 12957 2341 564 17713 7319
云 南 Yunnan 10484 4130 108380 10387 589 206 5695 9523
西 藏 Tibet 362 165 3470 9666 12 1 254 23091
陕 西 Shaanxi 19328 7417 208088 11212 191 45 1486 7660
甘 肃 Gansu 15478 7403 166753 10735 83 21 1297 15817
青 海 Qinghai 629 324 5115 8081 19 5 259 15235
宁 夏 Ningxia 1802 785 19683 10935 3 32 10667
新 疆 Xinjiang 14367 5998 151732 10760
3-3 31 continued
航空运输业 管道运输业
Air Transport Transport Via Pipeline
年末人数 劳动报酬 平均劳动 年末人数 劳动报酬 平均劳动
地 区 Region (人) # 女 性
(千元) 报 酬 (人) # 女 性
(千元) 报 酬Year-end Earnings (元) Year-end Earnings (元)
Figures Female Average Figures Female Average
(1 000 Earning (1 000 Earning
(person) yuan) (yuan) (person) yuan) (yuan)
National 181968 60683 6016879 33121 21451 6726 541694 25752
北 京 Beijing 17861 7147 787153 45112 114 29 4232 37123
天 津 Tianjin 2754 765 98091 34478
河 北 Hebei 1168 324 13574 11397 3781 1205 97784 26608
山 西 Shanxi 3518 1180 63412 18118
内蒙古 Inner Mongolia 2761 750 67099 25206
辽 宁 Liaoning 11128 4097 215380 17954 3480 1030 84605 24277
吉 林 Jilin 3371 1022 102184 30686 900 237 24435 27579
黑龙江 Heilongjiang 4223 1164 111939 26703 541 167 12726 23523
上 海 Shanghai 21768 7427 1175042 55539
江 苏 Jiangsu 4710 1334 171397 34218 8759 2718 232961 27615
浙 江 Zhejiang 6256 1680 203494 33153 18 7 272 15111
安 徽 Anhui 2139 574 39422 18251
福 建 Fujian 7912 2852 248568 31520
江 西 Jiangxi 2021 498 48475 24421
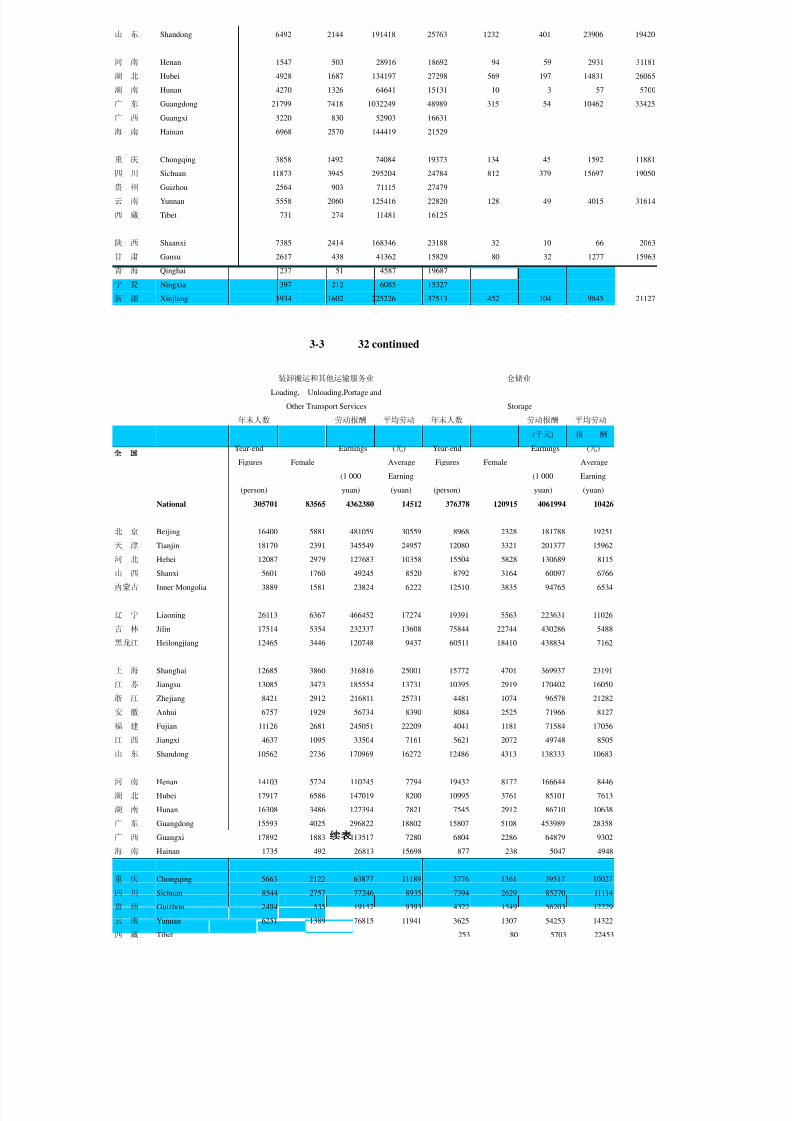
8/2/2019 China Labour Statistical Yearbook - 2004
http://slidepdf.com/reader/full/china-labour-statistical-yearbook-2004 212/464
山 东 Shandong 6492 2144 191418 25763 1232 401 23906 19420
河 南 Henan 1547 503 28916 18692 94 59 2931 31181
湖 北 Hubei 4928 1687 134197 27298 569 197 14831 26065
湖 南 Hunan 4270 1326 64641 15131 10 3 57 5700
广 东 Guangdong 21799 7418 1032249 48989 315 54 10462 33425
广 西 Guangxi 3220 830 52903 16631
海 南 Hainan 6968 2570 144419 21529
重 庆 Chongqing 3858 1492 74084 19373 134 45 1592 11881
四 川 Sichuan 11873 3945 295204 24784 812 379 15697 19050
贵 州 Guizhou 2564 903 71115 27479
云 南 Yunnan 5558 2060 125416 22820 128 49 4015 31614
西 藏 Tibet 731 274 11481 16125
陕 西 Shaanxi 7385 2414 168346 23188 32 10 66 2063
甘 肃 Gansu 2617 438 41362 15829 80 32 1277 15963
青 海 Qinghai 237 51 4587 19687
宁 夏 Ningxia 397 212 6085 15327
新 疆 Xinjiang 5934 1602 225226 37513 452 104 9845 21127
3-3 32 continued
装卸搬运和其他运输服务业 仓储业
Loading, Unloading,Portage and
Other Transport Services Storage
年末人数 劳动报酬 平均劳动 年末人数 劳动报酬 平均劳动
地 区 Region (人) # 女 性
(千元) 报 酬 (人) # 女 性
(千元) 报 酬
Year-end Earnings (元) Year-end Earnings (元)
Figures Female Average Figures Female Average
(1 000 Earning (1 000 Earning
(person) yuan) (yuan) (person) yuan) (yuan)
National 305701 83565 4362380 14512 376378 120915 4061994 10426
北 京 Beijing 16400 5881 481059 30559 8968 2328 181788 19251
天 津 Tianjin 18170 2391 345549 24957 12080 3321 201377 15962
河 北 Hebei 12087 2979 127683 10358 15504 5828 130689 8115
山 西 Shanxi 5601 1760 49245 8520 8792 3164 60097 6766
内蒙古 Inner Mongolia 3889 1581 23824 6222 12510 3835 94765 6534
辽 宁 Liaoning 26113 6367 466452 17274 19391 5563 223631 11026
吉 林 Jilin 17514 5354 232337 13608 75844 22744 430286 5488黑龙江 Heilongjiang 12465 3446 120748 9437 60511 18410 438834 7162
上 海 Shanghai 12685 3860 316816 25001 15772 4701 369937 23191
江 苏 Jiangsu 13085 3473 185554 13731 10395 2919 170402 16050
浙 江 Zhejiang 8421 2912 216811 25731 4481 1074 96578 21282
安 徽 Anhui 6757 1929 56734 8390 8084 2525 71966 8127
福 建 Fujian 11126 2681 245051 22209 4041 1181 71584 17056
江 西 Jiangxi 4637 1095 33504 7161 5621 2072 49748 8505
山 东 Shandong 10562 2736 170969 16272 12486 4313 138333 10683
河 南 Henan 14103 5724 110245 7794 19432 8172 166644 8446
湖 北 Hubei 17917 6586 147019 8200 10995 3761 85101 7613
湖 南 Hunan 16308 3486 127394 7821 7545 2912 86710 10638
广 东 Guangdong 15593 4025 296822 18802 15807 5108 453989 28358
广 西 Guangxi 17892 1883 113517 7280 6804 2286 64879 9302
海 南 Hainan 1735 492 26813 15698 877 238 5047 4948
重 庆 Chongqing 5663 2122 63877 11189 3776 1361 39517 10027
四 川 Sichuan 8544 2757 77246 8935 7394 2629 85270 11114
贵 州 Guizhou 2494 535 19152 9393 4322 1549 56203 12229
云 南 Yunnan 6251 1389 76815 11941 3625 1307 54253 14322
西 藏 Tibet 253 80 5703 22453

8/2/2019 China Labour Statistical Yearbook - 2004
http://slidepdf.com/reader/full/china-labour-statistical-yearbook-2004 213/464
陕 西 Shaanxi 9879 3138 91743 9102 9169 3284 77534 8497
甘 肃 Gansu 6767 1942 99842 14064 6519 2375 61944 9530
青 海 Qinghai 77 10 858 11143 838 293 11488 13358
宁 夏 Ningxia 1650 273 21364 13303 718 258 11113 13421
新 疆 Xinjiang 1316 758 17337 11738 3824 1324 66584 14829
3-3 33 continued
邮政业 信息传输、计算机服务和软件业 Information
Post Transfer, Computer Services & Software
年末人数 劳动报酬 平均劳动 年末人数 劳动报酬 平均劳动
地 区 Region (人) # 女 性
(千元) 报 酬 (人) # 女 性
(千元) 报 酬
Year-end Earnings (元) Year-end Earnings (元)
Figures Female Average Figures Female Average
(1 000 Earning (1 000 Earning
(person) yuan) (yuan) (person) yuan) (yuan)
National 516597 201695 9033267 17642 1168199 421099 35597305 30897
北 京 Beijing 22163 9440 622155 29025 177571 63080 9069987 52398
天 津 Tianjin 4895 1702 144126 29211 15382 5253 503334 33442
河 北 Hebei 22202 8208 331766 15280 38318 13605 854235 22227
山 西 Shanxi 16424 6307 219967 13523 26649 10883 455348 17293
内蒙古 Inner Mongolia 11537 4974 182139 15801 25116 10306 422380 17174
辽 宁 Liaoning 18709 7906 343518 18158 48470 17876 1557120 32271
吉 林 Jilin 16087 6109 212345 12857 26061 10267 544609 21340
黑龙江 Heilongjiang 24723 10989 463622 18767 39833 14730 1042753 25646
上 海 Shanghai 24211 8881 687351 28539 42267 18287 2186479 53756
江 苏 Jiangsu 26541 9364 527740 20135 57177 20645 1689631 30512
浙 江 Zhejiang 24728 8379 551209 22655 48027 17345 1957108 41091
安 徽 Anhui 17047 5635 193410 11413 27363 9226 468086 17441
福 建 Fujian 19207 9015 341080 18077 36745 12567 1075385 29966
江 西 Jiangxi 17181 6866 210260 12203 24903 8678 385563 15610
山 东 Shandong 25370 9527 447171 17607 58472 18899 1310119 23045
河 南 Henan 23769 8119 311815 13619 53134 18736 867391 16944
湖 北 Hubei 17665 6491 227259 12936 37013 11371 590236 15954
湖 南 Hunan 25242 9823 373072 14841 47575 17949 961724 20284
广 东 Guangdong 41650 18358 996230 24091 117411 42193 4907798 41665
广 西 Guangxi 12828 5148 165655 13065 27023 9632 590099 22012海 南 Hainan 3107 1414 49539 15929 6331 2055 178975 27603
重 庆 Chongqing 11438 4368 169673 15608 18988 6057 457144 24349
四 川 Sichuan 22271 9279 334544 15058 46547 17582 1010381 22057
贵 州 Guizhou 11986 4251 114477 9967 11023 3566 195329 17882
云 南 Yunnan 12023 4771 176082 14535 31005 12766 579892 19147
西 藏 Tibet 1743 595 54920 31509 2477 921 98396 40626
陕 西 Shaanxi 17870 5578 221199 12388 28978 8515 712548 24560
甘 肃 Gansu 7137 2739 72832 10232 19955 6965 249260 12598
青 海 Qinghai 2550 1089 44512 17401 7029 2456 182516 23544
宁 夏 Ningxia 2335 1014 31787 13779 6019 2399 147270 25278
新 疆 Xinjiang 11958 5356 211812 17740 15337 6289 346209 23118

8/2/2019 China Labour Statistical Yearbook - 2004
http://slidepdf.com/reader/full/china-labour-statistical-yearbook-2004 214/464
3-3 34 continued
电信和其他信息传输服务业 计算机服务业
Telecom and Other Information
Transfer Services Computer Services
年末人数 劳动报酬 平均劳动 年末人数 劳动报酬 平均劳动
地 区 Region (人) # 女 性
(千元) 报 酬 (人) # 女 性
(千元) 报 酬
Year-end Earnings (元) Year-end Earnings (元)
Figures Female Average Figures Female Average
(1 000 Earning (1 000 Earning
(person) yuan) (yuan) (person) yuan) (yuan)
National 914469 334827 25886479 28574 92095 33523 3922897 43143
北 京 Beijing 47963 20138 2355861 49712 46015 16060 2957521 65743
天 津 Tianjin 11408 3877 392305 34674 1206 442 26701 24142
河 北 Hebei 36914 13034 842445 22766 843 335 7349 8447
山 西 Shanxi 24851 10214 439868 17906 663 258 5351 8258
内蒙古 Inner Mongolia 24596 10146 415003 17232 236 78 3892 16632
辽 宁
Liaoning 41441 15788 1362655 32907 2392 683 84342 35275吉 林 Jilin 21633 8458 484105 23108 1972 945 16530 8353
黑龙江 Heilongjiang 35743 13391 983275 26897 2117 683 27139 12559
上 海 Shanghai 27311 11107 1596596 60061 4248 1940 168421 39314
江 苏 Jiangsu 49925 17897 1569416 31592 1963 788 30244 15810
浙 江 Zhejiang 42828 15746 1818294 42487 587 182 12560 22270
安 徽 Anhui 26615 9018 456279 17471 119 23 6235 61733
福 建 Fujian 32672 11439 943754 29592 1251 387 27142 22789
江 西 Jiangxi 23367 8107 368770 15928 1102 417 12674 11596
山 东 Shandong 56755 18373 1272576 23095 660 187 13861 19145
河 南 Henan 45758 16330 804596 18300 6002 1981 42075 7095
湖 北 Hubei 29638 10201 493061 16668 869 313 9855 11315
湖 南 Hunan 36805 13363 820427 22398 4602 1871 54653 11845
广 东 Guangdong 103225 36760 4303444 41363 5534 2705 251405 46565
广 西 Guangxi 25066 8995 565975 22764 747 245 11124 15536
海 南 Hainan 5719 1926 172999 29427 355 65 2133 5925
重 庆 Chongqing 17945 5728 441891 24894 412 109 4307 10304
四 川 Sichuan 43345 16493 964735 22716 1095 247 14749 11856
贵 州 Guizhou 9838 3204 180972 18554 638 276 8174 13163
云 南 Yunnan 27792 11757 526877 19524 1381 408 19673 13284
西 藏 Tibet 2477 921 98396 40626
陕 西 Shaanxi 19578 6259 338840 17257 2312 768 75880 32358
甘 肃 Gansu 16068 5477 210957 13173 2289 931 22556 10211
青 海 Qinghai 6995 2442 182027 23585 34 14 489 14382
宁 夏 Ningxia 5650 2276 142359 26092 241 92 3285 14159
新 疆 Xinjiang 14548 5962 337721 23807 210 90 2577 12389
3-3 35 continued
软件业 批发和零售业
Software Industry Wholesale and Retail Trade
年末人数 劳动报酬 平均劳动 年末人数 劳动报酬 平均劳动
地 区 Region (人) # 女 性
(千元) 报 酬 (人) # 女 性
(千元) 报 酬
Year-end Earnings (元) Year-end Earnings (元)
Figures Female Average Figures Female Average
(1 000 Earning (1 000 Earning
(person) yuan) (yuan) (person) yuan) (yuan)
National 161635 52749 5787929 37276 6281474 2803449 69634488 10894
北 京 Beijing 83593 26882 3756605 46538 376117 176378 8263856 21947
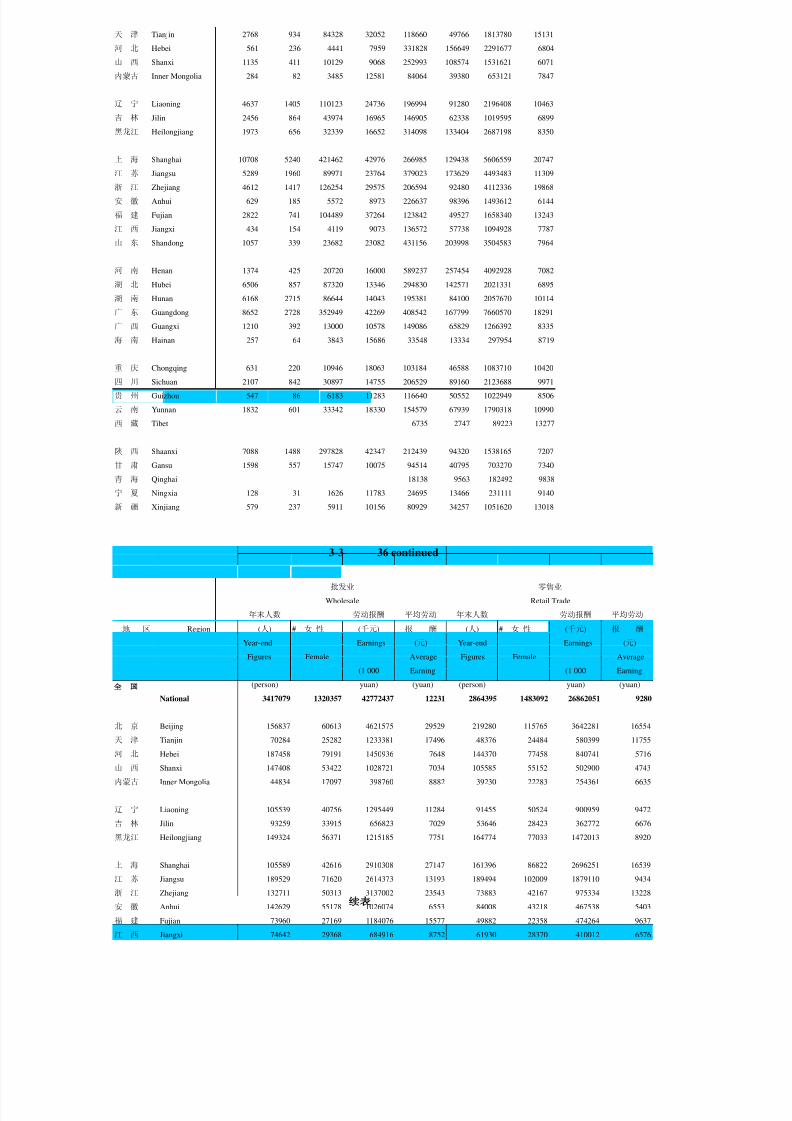
8/2/2019 China Labour Statistical Yearbook - 2004
http://slidepdf.com/reader/full/china-labour-statistical-yearbook-2004 215/464
天 津 Tianjin 2768 934 84328 32052 118660 49766 1813780 15131
河 北 Hebei 561 236 4441 7959 331828 156649 2291677 6804
山 西 Shanxi 1135 411 10129 9068 252993 108574 1531621 6071
内蒙古 Inner Mongolia 284 82 3485 12581 84064 39380 653121 7847
辽 宁 Liaoning 4637 1405 110123 24736 196994 91280 2196408 10463
吉 林 Jilin 2456 864 43974 16965 146905 62338 1019595 6899
黑龙江 Heilongjiang 1973 656 32339 16652 314098 133404 2687198 8350
上 海 Shanghai 10708 5240 421462 42976 266985 129438 5606559 20747
江 苏 Jiangsu 5289 1960 89971 23764 379023 173629 4493483 11309
浙 江 Zhejiang 4612 1417 126254 29575 206594 92480 4112336 19868
安 徽 Anhui 629 185 5572 8973 226637 98396 1493612 6144
福 建 Fujian 2822 741 104489 37264 123842 49527 1658340 13243
江 西 Jiangxi 434 154 4119 9073 136572 57738 1094928 7787
山 东 Shandong 1057 339 23682 23082 431156 203998 3504583 7964
河 南 Henan 1374 425 20720 16000 589237 257454 4092928 7082
湖 北 Hubei 6506 857 87320 13346 294830 142571 2021331 6895
湖 南 Hunan 6168 2715 86644 14043 195381 84100 2057670 10114
广 东 Guangdong 8652 2728 352949 42269 408542 167799 7660570 18291广 西 Guangxi 1210 392 13000 10578 149086 65829 1266392 8335
海 南 Hainan 257 64 3843 15686 33548 13334 297954 8719
重 庆 Chongqing 631 220 10946 18063 103184 46588 1083710 10420
四 川 Sichuan 2107 842 30897 14755 206529 89160 2123688 9971
贵 州 Guizhou 547 86 6183 11283 116640 50552 1022949 8506
云 南 Yunnan 1832 601 33342 18330 154579 67939 1790318 10990
西 藏 Tibet 6735 2747 89223 13277
陕 西 Shaanxi 7088 1488 297828 42347 212439 94320 1538165 7207
甘 肃 Gansu 1598 557 15747 10075 94514 40795 703270 7340
青 海 Qinghai 18138 9563 182492 9838
宁 夏 Ningxia 128 31 1626 11783 24695 13466 231111 9140
新 疆 Xinjiang 579 237 5911 10156 80929 34257 1051620 13018
3-3 36 continued
批发业 零售业
Wholesale Retail Trade
年末人数 劳动报酬 平均劳动 年末人数 劳动报酬 平均劳动
地 区 Region (人) # 女 性
(千元) 报 酬 (人) # 女 性
(千元) 报 酬Year-end Earnings (元) Year-end Earnings (元)
Figures Female Average Figures Female Average
(1 000 Earning (1 000 Earning
(person) yuan) (yuan) (person) yuan) (yuan)
National 3417079 1320357 42772437 12231 2864395 1483092 26862051 9280
北 京 Beijing 156837 60613 4621575 29529 219280 115765 3642281 16554
天 津 Tianjin 70284 25282 1233381 17496 48376 24484 580399 11755
河 北 Hebei 187458 79191 1450936 7648 144370 77458 840741 5716
山 西 Shanxi 147408 53422 1028721 7034 105585 55152 502900 4743
内蒙古 Inner Mongolia 44834 17097 398760 8882 39230 22283 254361 6635
辽 宁 Liaoning 105539 40756 1295449 11284 91455 50524 900959 9472
吉 林 Jilin 93259 33915 656823 7029 53646 28423 362772 6676
黑龙江 Heilongjiang 149324 56371 1215185 7751 164774 77033 1472013 8920
上 海 Shanghai 105589 42616 2910308 27147 161396 86822 2696251 16539
江 苏 Jiangsu 189529 71620 2614373 13193 189494 102009 1879110 9434
浙 江 Zhejiang 132711 50313 3137002 23543 73883 42167 975334 13228
安 徽 Anhui 142629 55178 1026074 6553 84008 43218 467538 5403
福 建 Fujian 73960 27169 1184076 15577 49882 22358 474264 9637
江 西 Jiangxi 74642 29368 684916 8752 61930 28370 410012 6576

8/2/2019 China Labour Statistical Yearbook - 2004
http://slidepdf.com/reader/full/china-labour-statistical-yearbook-2004 216/464
山 东 Shandong 223738 88244 2011537 8743 207418 115754 1493046 7111
河 南 Henan 366451 144525 2723639 7557 222786 112929 1369289 6295
湖 北 Hubei 129733 51086 973681 7370 165097 91485 1047650 6505
湖 南 Hunan 116503 45107 1372787 11314 78878 38993 684883 8340
广 东 Guangdong 266703 98930 5388121 19606 141839 68869 2272449 15781
广 西 Guangxi 77456 30578 728000 9227 71630 35251 538392 7372
海 南 Hainan 18446 7082 200151 10689 15102 6252 97803 6332
重 庆 Chongqing 54027 19810 638726 11477 49157 26778 444984 9205
四 川 Sichuan 121218 47702 1314693 10478 85311 41458 808995 9245
贵 州 Guizhou 63222 23203 666345 10219 53418 27349 356604 6477
云 南 Yunnan 82248 32007 1180545 13509 72331 35932 609773 8074
西 藏 Tibet 3382 1442 51610 15211 3353 1305 37613 11305
陕 西 Shaanxi 103598 41882 811337 7773 108841 52438 726828 6665
甘 肃 Gansu 46789 18554 384945 8210 47725 22241 318325 6505
青 海 Qinghai 7754 3493 97769 12307 10384 6070 84723 7989
宁 夏 Ningxia 9886 4229 106156 10178 14809 9237 124955 8411
新 疆 Xinjiang 51922 19572 664816 12862 29007 14685 386804 13295
3-3 37 continued
住宿和餐饮业 住宿业
Accommodation and Restaurants Accommodation
年末人数 劳动报酬 平均劳动 年末人数 劳动报酬 平均劳动
地 区 Region (人) # 女 性
(千元) 报 酬 (人) # 女 性
(千元) 报 酬
Year-end Earnings (元) Year-end Earnings (元)
Figures Female Average Figures Female Average
(1 000 Earning (1 000 Earning
(person) yuan) (yuan) (person) yuan) (yuan)
National 1721152 950117 19091042 11198 1128167 613477 13101413 11688
北 京 Beijing 212208 108247 3431110 16471 120056 60693 2241682 18531
天 津 Tianjin 35093 17107 424030 12447 16573 8257 218454 12957
河 北 Hebei 47659 26672 392566 7964 34434 18726 284203 8133
山 西 Shanxi 36941 20526 227625 6207 27123 15255 180805 6717
内蒙古 Inner Mongolia 26095 15410 191535 7488 20543 12049 150928 7517
辽 宁 Liaoning 61038 34054 655419 10364 37067 20014 419357 11023
吉 林 Jilin 28142 16055 242709 8448 20427 11721 191309 9058
黑龙江 Heilongjiang 47579 19741 314713 8522 36682 13876 181557 6915
上 海 Shanghai 85191 40956 1546705 18338 50727 22079 1026848 20128
江 苏 Jiangsu 78914 41659 933243 11558 52833 27320 672701 12349
浙 江 Zhejiang 88419 48786 1176293 13469 65076 36296 904699 14019
安 徽 Anhui 35855 20473 265751 7296 25084 14541 203555 7957
福 建 Fujian 41632 24892 439897 10464 27112 16379 308649 11274
江 西 Jiangxi 21521 13142 178346 8259 16503 9990 138390 8405
山 东 Shandong 91790 48026 858418 9274 64909 33237 637200 9732
河 南 Henan 98017 56421 759735 7876 63827 36298 514421 8166
湖 北 Hubei 100974 71960 692171 7277 49731 34613 369928 7908
湖 南 Hunan 54663 30740 519282 9524 40341 23076 399004 9892
广 东 Guangdong 198513 110533 2974263 14898 101785 56013 1741234 16887
广 西 Guangxi 50863 30134 408367 7961 42678 25246 359797 8327
海 南 Hainan 30895 16912 261718 8405 27119 14724 234506 8573
重 庆 Chongqing 25137 13732 240600 9634 19705 10786 198741 10198
四 川 Sichuan 45546 26168 419897 9202 30787 17917 306391 9954
贵 州 Guizhou 24494 13799 208980 8627 15068 8157 133472 8980
云 南 Yunnan 42280 23987 373010 8779 36048 20413 326042 8970
西 藏 Tibet 4618 2006 47751 10278 4455 1882 46177 10300

8/2/2019 China Labour Statistical Yearbook - 2004
http://slidepdf.com/reader/full/china-labour-statistical-yearbook-2004 217/464
陕 西 Shaanxi 46894 23032 353810 7566 34718 16623 277001 8010
甘 肃 Gansu 19137 11565 138982 7340 14788 8955 107887 7385
青 海 Qinghai 5216 2635 61807 11609 4592 2405 54207 11627
宁 夏 Ningxia 8063 4973 63766 7868 5344 3409 45367 8367
新 疆 Xinjiang 27765 15774 288543 10420 22032 12527 226901 10408
3-3 38 continued
餐饮业 金融业
Restaurants Finance
年末人数 劳动报酬 平均劳动 年末人数 劳动报酬 平均劳动
地 区 Region (人) # 女 性
(千元) 报 酬 (人) # 女 性
(千元) 报 酬
Year-end Earnings (元) Year-end Earnings (元)
Figures Female Average Figures Female Average
(1 000 Earning (1 000 Earning
(person) yuan) (yuan) (person) yuan) (yuan)
National 592985 336640 5989629 10258 3533350 1645053 73441929 20780
北 京 Beijing 92152 47554 1189428 13618 140187 63864 6175563 45409
天 津 Tianjin 18520 8850 205576 11947 52016 28041 1254248 24061
河 北 Hebei 13225 7946 108363 7553 177850 77504 2540984 14156
山 西 Shanxi 9818 5271 46820 4799 117168 55373 1597311 13759
内蒙古 Inner Mongolia 5552 3361 40607 7383 75733 36517 1042301 13653
辽 宁 Liaoning 23971 14040 236062 9369 187659 92048 3493473 18337
吉 林 Jilin 7715 4334 51400 6755 95569 45177 1422278 14843
黑龙江 Heilongjiang 10897 5865 133156 12475 116501 55495 2025229 17263
上 海 Shanghai 34464 18877 519857 15598 148430 70257 5579546 39446
江 苏 Jiangsu 26081 14339 260542 9919 215092 102618 4579667 21325
浙 江 Zhejiang 23343 12490 271594 11914 183401 97612 5213364 28445
安 徽 Anhui 10771 5932 62196 5736 118977 54349 1490313 12858
福 建 Fujian 14520 8513 131248 8952 94607 43921 2328633 24394
江 西 Jiangxi 5018 3152 39956 7790 86346 39837 1262713 14222
山 东 Shandong 26881 14789 221218 8168 254284 116931 4412134 17430
河 南 Henan 34190 20123 245314 7329 211082 100967 3086053 14839
湖 北 Hubei 51243 37347 322243 6666 133150 62187 1886032 13965
湖 南 Hunan 14322 7664 120278 8477 141064 64919 2339591 16481
广 东 Guangdong 96728 54520 1233029 12774 281826 125787 9233522 32365
广 西 Guangxi 8185 4888 48570 6004 80444 35185 1356052 16696
海 南 Hainan 3776 2188 27212 7189 19013 7105 391579 19674
重 庆 Chongqing 5432 2946 41859 7629 65603 31246 1329311 20499
四 川 Sichuan 14759 8251 113506 7642 161165 77079 3174798 19452
贵 州 Guizhou 9426 5642 75508 8065 48769 21663 761890 15362
云 南 Yunnan 6232 3574 46968 7648 71466 29748 1059111 14774
西 藏 Tibet 163 124 1574 9656 5911 2189 191213 32110
陕 西 Shaanxi 12176 6409 76809 6305 98457 39446 1594011 16066
甘 肃 Gansu 4349 2610 31095 7188 52708 22216 715090 13488
青 海 Qinghai 624 230 7600 11480 15034 6668 271842 18027
宁 夏 Ningxia 2719 1564 18399 6860 23027 10466 426233 18910
新 疆 Xinjiang 5733 3247 61642 10467 60811 28638 1207844 19705
3-3 39 continued
银行业 证券业
Bank Securities
年末人数 劳动报酬 平均劳动 年末人数 劳动报酬 平均劳动
地 区 Region (人) # 女 性
(千元) 报 酬 (人) # 女 性
(千元) 报 酬

8/2/2019 China Labour Statistical Yearbook - 2004
http://slidepdf.com/reader/full/china-labour-statistical-yearbook-2004 218/464
Year-end Earnings (元) Year-end Earnings (元)
Figures Female Average Figures Female Average
(1 000 Earning (1 000 Earning
(person) yuan) (yuan) (person) yuan) (yuan)
National 2581391 1141114 55677400 21336 65251 27290 2816736 42920
北 京 Beijing 68447 36276 3871890 57437 3270 1220 405110 123246
天 津 Tianjin 35532 16751 881348 24649 1198 495 35874 30146
河 北 Hebei 139598 57202 2117724 14941 1311 599 29334 22935
山 西 Shanxi 90794 39499 1307921 14228 1512 598 30206 20044
内蒙古 Inner Mongolia 65094 30283 914675 13848 485 220 5245 10726
辽 宁 Liaoning 134054 60236 2648025 19278 3489 1482 101832 29170
吉 林 Jilin 83687 38818 1285358 15258 805 355 15098 18548
黑龙江 Heilongjiang 90941 39274 1631007 17693 897 396 28340 29800
上 海 Shanghai 65616 33746 2831662 43967 11337 4810 699864 61738
江 苏 Jiangsu 141844 60931 3307568 23059 3575 1490 114993 32130
浙 江 Zhejiang 133644 67706 4147522 31140 2305 998 85468 37371
安 徽 Anhui 79759 32723 1121367 13871 1208 434 26897 22527
福 建 Fujian 73611 31859 1966072 26270 1666 633 49413 29536江 西 Jiangxi 67800 29352 1039563 14672 1728 840 27422 15733
山 东 Shandong 166095 68034 3322912 19761 2515 1014 71348 26241
河 南 Henan 162243 72923 2599299 16104 1881 752 61791 33132
湖 北 Hubei 105966 47253 1519612 14120 3076 1719 79908 25860
湖 南 Hunan 108256 47668 1921137 17464 1782 665 43798 24537
广 东 Guangdong 217591 97211 7026382 31787 11541 4682 696296 59234
广 西 Guangxi 67764 28336 1176991 17143 585 260 16520 27905
海 南 Hainan 16830 6085 349984 19818 593 282 13965 21452
重 庆 Chongqing 43907 19936 954406 21641 1617 670 60082 36150
四 川 Sichuan 125530 57035 2563247 19984 509 230 10878 21246
贵 州 Guizhou 39910 16910 663267 16180 456 173 12545 27632
云 南 Yunnan 61788 25349 928477 14875 1212 517 23930 23256
西 藏 Tibet 5475 2016 180283 32696 131 68 2966 22641
陕 西 Shaanxi 73619 28654 1351019 18533 3068 1029 30960 10091
甘 肃 Gansu 44247 17453 617786 13831 122 64 1566 13050
青 海 Qinghai 12674 5512 235211 18497 62 29 1147 16155
宁 夏 Ningxia 17155 7632 324257 19110 355 161 6868 19456
新 疆 Xinjiang 41920 18451 871428 20646 960 405 27072 28497
3-3 40 continued
保险业 其他金融活动
Insurance Other Financial Activities
年末人数 劳动报酬 平均劳动 年末人数 劳动报酬 平均劳动
地 区 Region (人) # 女 性
(千元) 报 酬 (人) # 女 性
(千元) 报 酬
Year-end Earnings (元) Year-end Earnings (元)
Figures Female Average Figures Female Average
(1 000 Earning (1 000 Earning
(person) yuan) (yuan) (person) yuan) (yuan)
National 846801 461353 13662616 16676 39907 15296 1285177 32254
北 京 Beijing 62298 23952 1600258 27062 6172 2416 298305 48379
天 津 Tianjin 14939 10677 314332 21204 347 118 22694 63391
河 北 Hebei 35125 19018 371516 10714 1816 685 22410 12443
山 西 Shanxi 24471 15151 253266 11378 391 125 5918 14982
内蒙古 Inner Mongolia 9289 5537 111324 12454 865 477 11057 12797
辽 宁 Liaoning 48351 29649 709140 14799 1765 681 34476 19746
吉 林 Jilin 10714 5840 111818 10742 363 164 10004 28022

8/2/2019 China Labour Statistical Yearbook - 2004
http://slidepdf.com/reader/full/china-labour-statistical-yearbook-2004 219/464
黑龙江 Heilongjiang 24128 15604 352313 14903 535 221 13569 25174
上 海 Shanghai 66282 29974 1663519 27488 5195 1727 384501 74071
江 苏 Jiangsu 67560 39440 1084797 16525 2113 757 72309 34482
浙 江 Zhejiang 46000 28328 933896 20144 1452 580 46478 32299
安 徽 Anhui 36449 20447 328411 10164 1561 745 13638 8748
福 建 Fujian 17830 10894 276199 15807 1500 535 36949 25084
江 西 Jiangxi 16183 9352 187647 12078 635 293 8081 12337
山 东 Shandong 81065 46327 933375 12033 4609 1556 84499 18021
河 南 Henan 45861 26795 398391 9136 1097 497 26572 24423
湖 北 Hubei 23482 13041 280925 11851 626 174 5587 8771
湖 南 Hunan 29948 16157 361190 12426 1078 429 13466 12264
广 东 Guangdong 51255 23401 1449128 28345 1439 493 61716 45180
广 西 Guangxi 10200 5774 131356 13113 1895 815 31185 15960
海 南 Hainan 1451 683 25654 17620 139 55 1976 14529
重 庆 Chongqing 19335 10343 300414 16377 744 297 14409 19498
四 川 Sichuan 34479 19552 584771 17299 647 262 15902 24886
贵 州 Guizhou 8196 4479 83177 10478 207 101 2901 13749
云 南 Yunnan 7716 3633 98296 13073 750 249 8408 11662西 藏 Tibet 270 89 6776 24640 35 16 1188 33943
陕 西 Shaanxi 21098 9475 202859 8984 672 288 9173 13630
甘 肃 Gansu 7932 4545 90008 11456 407 154 5730 15321
青 海 Qinghai 1894 933 29294 15549 404 194 6190 15134
宁 夏 Ningxia 5319 2603 86460 17216 198 70 8648 43898
新 疆 Xinjiang 17681 9660 302106 16880 250 122 7238 30158
3-3 41 continued
房地产业 房地产开发经营
Real Estate Real Estate Exploitation Management
年末人数 劳动报酬 平均劳动 年末人数 劳动报酬 平均劳动
地 区 Region (人) # 女 性
(千元) 报 酬 (人) # 女 性
(千元) 报 酬
Year-end Earnings (元) Year-end Earnings (元)
Figures Female Average Figures Female Average
(1 000 Earning (1 000 Earning
(person) yuan) (yuan) (person) yuan) (yuan)
National 1202293 404440 20272319 17085 595360 189408 10496428 17710
北 京 Beijing 189309 69743 4666567 25426 56427 19908 2054952 37336天 津 Tianjin 19043 6639 363419 20280 11970 4116 268057 23317
河 北 Hebei 24426 9586 257018 10771 12382 4653 130291 10514
山 西 Shanxi 13616 5273 128277 9465 7564 2738 65078 8569
内蒙古 Inner Mongolia 14585 4932 161522 10841 7741 2258 89347 10992
辽 宁 Liaoning 61981 21463 838107 13197 22749 7252 342446 14195
吉 林 Jilin 28285 9298 317209 11404 10055 3086 108557 10723
黑龙江 Heilongjiang 44189 14445 473384 10771 16316 5078 180309 11038
上 海 Shanghai 83268 26979 2094728 25315 29845 9492 1020386 33603
江 苏 Jiangsu 66979 18648 1085308 16266 40615 9587 629957 15669
浙 江 Zhejiang 50269 16750 1085785 22066 23377 7829 608613 26253
安 徽 Anhui 24893 8648 269823 11025 16082 5187 172937 11035
福 建 Fujian 35472 10836 598975 17034 20859 6139 386237 18551
江 西 Jiangxi 19919 7162 197318 9833 11561 3947 115856 9988
山 东 Shandong 52254 19291 723197 14209 32367 11714 462870 14471
河 南 Henan 45617 15317 501623 11199 30482 8850 354315 11825
湖 北 Hubei 44084 13865 461902 10494 32708 9381 336364 10309
湖 南 Hunan 32358 11369 408106 12803 19541 6251 235992 12321
广 东 Guangdong 144964 45726 3170257 22360 54868 19310 1337411 24475
广 西 Guangxi 23491 8190 291268 12541 14558 5034 182328 12785

8/2/2019 China Labour Statistical Yearbook - 2004
http://slidepdf.com/reader/full/china-labour-statistical-yearbook-2004 220/464
海 南 Hainan 10688 3618 133600 12059 6035 2098 81480 12377
重 庆 Chongqing 30671 9676 378275 12385 23406 7033 286056 12324
四 川 Sichuan 42104 13155 527258 12461 29131 8040 332228 11302
贵 州 Guizhou 25058 7241 254113 10314 22260 6540 221184 10119
云 南 Yunnan 16777 5753 203317 12378 9447 2875 121907 13044
西 藏 Tibet 313 123 6327 20214 155 46 3266 21208
陕 西 Shaanxi 15243 5259 163484 10887 8374 2487 93238 11302
甘 肃 Gansu 12521 4217 137350 11112 7490 2228 67997 9210
青 海 Qinghai 1648 741 26751 13904 1046 443 13532 13062
宁 夏 Ningxia 6485 2215 65952 10542 4348 1481 48418 11210
新 疆 Xinjiang 21783 8282 282099 13001 11601 4327 144819 12667
3-3 42 continued
物业管理 房地产中介服务
Management Concerning Dwelling Real Estate Agency Service
年末人数 劳动报酬 平均劳动 年末人数 劳动报酬 平均劳动
地 区 Region (人) # 女 性
(千元) 报 酬 (人) # 女 性
(千元) 报 酬
Year-end Earnings (元) Year-end Earnings (元)
Figures Female Average Figures Female Average
(1 000 Earning (1 000 Earning
(person) yuan) (yuan) (person) yuan) (yuan)
National 453735 154423 7190724 16285 46520 20132 902980 19534
北 京 Beijing 120393 44449 2312577 19932 7402 3380 186787 24892
天 津 Tianjin 6311 2210 80193 13981 235 122 6091 28731
河 北 Hebei 7541 3108 70238 10057 928 419 9578 10400
山 西 Shanxi 3136 1064 35490 11678 626 292 5458 8803
内蒙古 Inner Mongolia 3047 1093 25777 8744 738 325 10025 13313
辽 宁 Liaoning 27140 9889 340503 12428 1678 681 20228 12208
吉 林 Jilin 12961 4139 145866 11694 596 306 6256 10514
黑龙江 Heilongjiang 19166 6399 189964 10056 591 224 5666 9603
上 海 Shanghai 43313 13553 767860 18114 3785 1807 122334 31448
江 苏 Jiangsu 15421 5406 249225 16151 2057 846 40200 19467
浙 江 Zhejiang 17433 5524 244002 14533 1615 782 36567 23714
安 徽 Anhui 5535 2059 61747 11212 669 263 6801 10181
福 建
Fujian 10400 3074 148258 14623 991 400 15220 15281江 西 Jiangxi 3897 1464 38799 10041 2749 1060 23626 8201
山 东 Shandong 10674 3953 131924 13513 1649 746 25404 15443
河 南 Henan 7431 3169 69346 9599 2399 1117 21236 9021
湖 北 Hubei 6091 2410 64334 10597 1329 514 15567 11731
湖 南 Hunan 6515 2455 82955 12855 1240 498 17200 13905
广 东 Guangdong 80701 22263 1551463 19876 6676 3005 226429 35703
广 西 Guangxi 5586 1874 69340 12011 838 332 9252 13586
海 南 Hainan 3974 1279 44045 11488 285 94 3050 11051
重 庆 Chongqing 5752 2019 70604 12146 610 274 9188 15137
四 川 Sichuan 5355 2131 80257 15357 3244 1152 36109 11070
贵 州 Guizhou 1862 340 20213 10967 802 312 10901 13678
云 南 Yunnan 5682 2158 62733 11511 543 211 5372 10431
西 藏 Tibet 66 34 815 12164
陕 西 Shaanxi 4463 1684 44837 10322 742 338 7751 10589
甘 肃 Gansu 3701 1433 53142 14575 384 152 5461 14039
青 海 Qinghai 354 170 9931 15566 117 54 1652 13653
宁 夏 Ningxia 1550 508 11516 8121 310 139 3558 11860
新 疆 Xinjiang 8284 3112 112770 13559 692 287 10013 13404
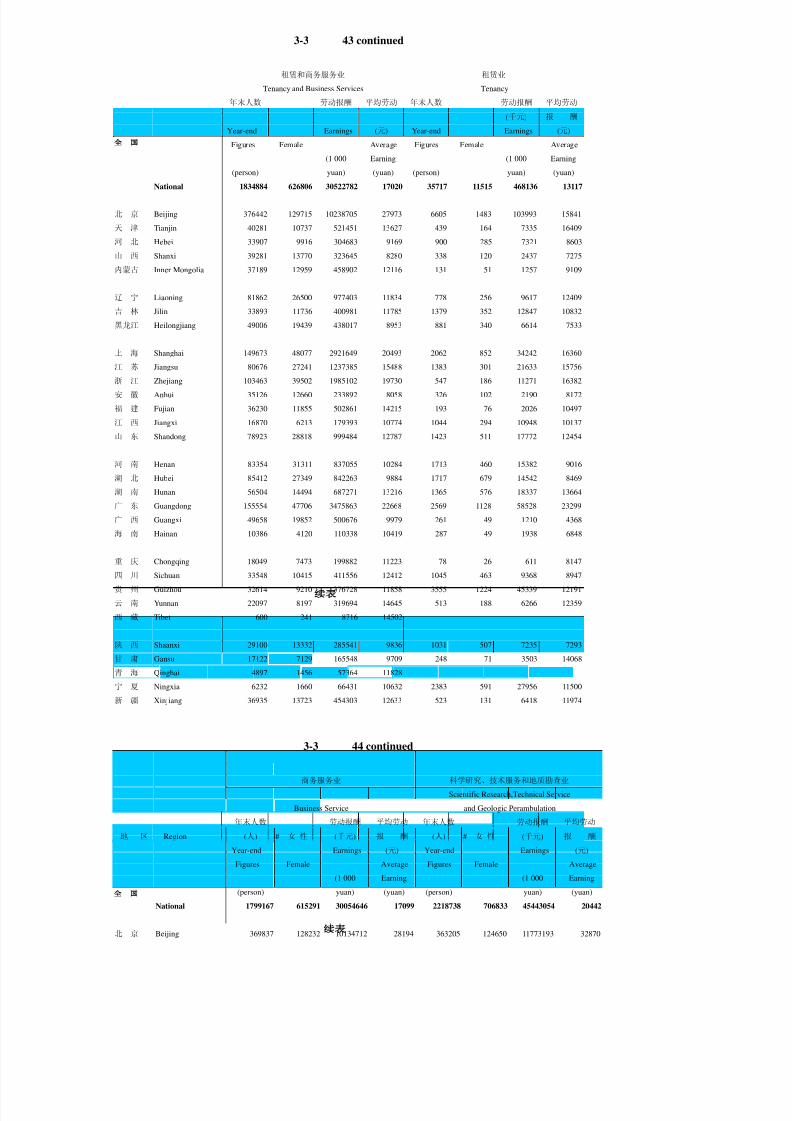
8/2/2019 China Labour Statistical Yearbook - 2004
http://slidepdf.com/reader/full/china-labour-statistical-yearbook-2004 221/464
3-3 43 continued
租赁和商务服务业 租赁业
Tenancy and Business Services Tenancy
年末人数 劳动报酬 平均劳动 年末人数 劳动报酬 平均劳动
地 区 Region (人) # 女 性
(千元) 报 酬 (人) # 女 性
(千元) 报 酬
Year-end Earnings (元) Year-end Earnings (元)
Figures Female Average Figures Female Average
(1 000 Earning (1 000 Earning
(person) yuan) (yuan) (person) yuan) (yuan)
National 1834884 626806 30522782 17020 35717 11515 468136 13117
北 京 Beijing 376442 129715 10238705 27973 6605 1483 103993 15841
天 津 Tianjin 40281 10737 521451 13627 439 164 7335 16409
河 北 Hebei 33907 9916 304683 9169 900 285 7321 8603
山 西 Shanxi 39281 13770 323645 8280 338 120 2437 7275
内蒙古 Inner Mongolia 37189 12959 458902 12116 131 51 1257 9109
辽 宁 Liaoning 81862 26500 977403 11834 778 256 9617 12409
吉 林
Jilin 33893 11736 400981 11785 1379 352 12847 10832黑龙江 Heilongjiang 49006 19439 438017 8953 881 340 6614 7533
上 海 Shanghai 149673 48077 2921649 20493 2062 852 34242 16360
江 苏 Jiangsu 80676 27241 1237385 15488 1383 301 21633 15756
浙 江 Zhejiang 103463 39502 1985102 19730 547 186 11271 16382
安 徽 Anhui 35126 12660 233892 8058 326 102 2190 8172
福 建 Fujian 36230 11855 502861 14215 193 76 2026 10497
江 西 Jiangxi 16870 6213 179393 10774 1044 294 10948 10137
山 东 Shandong 78923 28818 999484 12787 1423 511 17772 12454
河 南 Henan 83354 31311 837055 10284 1713 460 15382 9016
湖 北 Hubei 85412 27349 842263 9884 1717 679 14542 8469
湖 南 Hunan 56504 14494 687271 13216 1365 576 18337 13664
广 东 Guangdong 155554 47706 3475863 22668 2569 1128 58528 23299
广 西 Guangxi 49658 19852 500676 9979 261 49 1210 4368
海 南 Hainan 10386 4120 110338 10419 287 49 1938 6848
重 庆 Chongqing 18049 7473 199882 11223 78 26 611 8147
四 川 Sichuan 33548 10415 411556 12412 1045 463 9368 8947
贵 州 Guizhou 32614 9210 376728 11858 3555 1224 45339 12191
云 南 Yunnan 22097 8197 319694 14645 513 188 6266 12359
西 藏 Tibet 600 241 8716 14502
陕 西 Shaanxi 29100 13332 285541 9836 1031 507 7235 7293
甘 肃 Gansu 17122 7129 165548 9709 248 71 3503 14068
青 海 Qinghai 4897 1456 57364 11828
宁 夏 Ningxia 6232 1660 66431 10632 2383 591 27956 11500
新 疆 Xinjiang 36935 13723 454303 12633 523 131 6418 11974
3-3 44 continued
商务服务业 科学研究、技术服务和地质勘查业
Scientific Research,Technical Service
Business Service and Geologic Perambulation
年末人数 劳动报酬 平均劳动 年末人数 劳动报酬 平均劳动
地 区 Region (人) # 女 性
(千元) 报 酬 (人) # 女 性
(千元) 报 酬
Year-end Earnings (元) Year-end Earnings (元)
Figures Female Average Figures Female Average
(1 000 Earning (1 000 Earning
(person) yuan) (yuan) (person) yuan) (yuan)
National 1799167 615291 30054646 17099 2218738 706833 45443054 20442
北 京 Beijing 369837 128232 10134712 28194 363205 124650 11773193 32870

8/2/2019 China Labour Statistical Yearbook - 2004
http://slidepdf.com/reader/full/china-labour-statistical-yearbook-2004 222/464
天 津 Tianjin 39842 10573 514116 13594 52881 17501 1230327 23521
河 北 Hebei 33007 9631 297362 9184 72528 23128 1208533 16641
山 西 Shanxi 38943 13650 321208 8288 54639 18283 700745 13024
内蒙古 Inner Mongolia 37058 12908 457645 12127 39281 13897 554490 14039
辽 宁 Liaoning 81084 26244 967786 11828 90560 28782 1596792 17258
吉 林 Jilin 32514 11384 388134 11819 59863 19655 841375 14120
黑龙江 Heilongjiang 48125 19099 431403 8979 87997 25801 1404995 13855
上 海 Shanghai 147611 47225 2887407 20555 103111 36923 3068951 29841
江 苏 Jiangsu 79293 26940 1215752 15483 83947 24174 1943688 23187
浙 江 Zhejiang 102916 39316 1973831 19753 70638 18708 1914632 27719
安 徽 Anhui 34800 12558 231702 8057 51079 14336 675917 13167
福 建 Fujian 36037 11779 500835 14235 37495 10566 732582 19564
江 西 Jiangxi 15826 5919 168445 10818 49443 14805 630742 12725
山 东 Shandong 77500 28307 981712 12793 74886 22557 1278369 17097
河 南 Henan 81641 30851 821673 10311 107296 35445 1576949 14873
湖 北 Hubei 83695 26670 827721 9913 98193 30764 1411477 14427
湖 南 Hunan 55139 13918 668934 13205 67774 22623 996784 14521
广 东 Guangdong 152985 46578 3417335 22657 92988 27058 3009211 32785广 西 Guangxi 49397 19803 499466 10010 44825 14238 662846 14833
海 南 Hainan 10099 4071 108400 10517 14254 4850 165297 11745
重 庆 Chongqing 17971 7447 199271 11236 59383 18987 871676 14556
四 川 Sichuan 32503 9952 402188 12525 110407 35569 2159698 19656
贵 州 Guizhou 29059 7986 331389 11813 27587 9114 383991 13914
云 南 Yunnan 21584 8009 313428 14700 61605 17989 806415 13187
西 藏 Tibet 600 241 8716 14502 5298 1620 159371 29761
陕 西 Shaanxi 28069 12825 278306 9926 117619 36415 1758165 14915
甘 肃 Gansu 16874 7058 162045 9644 47679 14642 675214 14405
青 海 Qinghai 4897 1456 57364 11828 19295 5460 416658 21761
宁 夏 Ningxia 3849 1069 38475 10080 12410 3888 172831 13824
新 疆 Xinjiang 36412 13592 447885 12642 40572 14405 661140 16168
3-3 45 continued
研究与试验发展 自然科学研究与试验发展
Research and Experimental Development
Research and Experimental Development on Physical Science
年末人数 劳动报酬 平均劳动 年末人数 劳动报酬 平均劳动地 区 Region (人) # 女 性
(千元) 报 酬 (人) # 女 性
(千元) 报 酬
Year-end Earnings (元) Year-end Earnings (元)
Figures Female Average Figures Female Average
(1 000 Earning (1 000 Earning
(person) yuan) (yuan) (person) yuan) (yuan)
National 637587 222229 14079801 22051 180373 61142 4053217 22337
北 京 Beijing 110366 40184 4025360 36551 25303 8679 953494 37524
天 津 Tianjin 12128 4471 240332 19743 4506 1490 90988 20323
河 北 Hebei 13397 4348 298311 22680 2440 677 57817 23351
山 西 Shanxi 14839 5480 211494 14285 10485 3926 151833 14478
内蒙古 Inner Mongolia 9218 3610 130785 14000 547 181 7178 13099
辽 宁 Liaoning 27498 8384 531417 19139 11295 3630 221693 19593
吉 林 Jilin 17464 6020 302016 17312 5831 1822 107268 17807
黑龙江 Heilongjiang 16966 5471 265495 15899 6625 2186 108893 16577
上 海 Shanghai 42015 13846 1337789 31735 26368 8663 894981 33923
江 苏 Jiangsu 25451 8235 617644 24190 8327 2651 202913 24307
浙 江 Zhejiang 12225 3894 330422 27492 539 152 12811 24172
安 徽 Anhui 11812 3592 178296 14982 4494 1394 82730 18103
福 建 Fujian 8706 3015 179907 20328 1193 367 30660 25402

8/2/2019 China Labour Statistical Yearbook - 2004
http://slidepdf.com/reader/full/china-labour-statistical-yearbook-2004 223/464
江 西 Jiangxi 15058 5265 175445 11477 6303 1944 71902 11370
山 东 Shandong 20938 6644 380102 18259 8918 2824 169064 18700
河 南 Henan 27191 9304 427111 15762 6200 2018 115547 18712
湖 北 Hubei 29757 9849 449530 14985 2761 712 49022 16731
湖 南 Hunan 21949 8724 325473 14569 4498 1455 59435 12826
广 东 Guangdong 18806 6067 623229 32657 3110 1024 72678 23220
广 西 Guangxi 13661 4941 195411 14480 4570 1814 69615 15270
海 南 Hainan 7797 2976 69624 8976 113 26 1304 11439
重 庆 Chongqing 9758 3165 186082 18690 2992 1018 50108 16317
四 川 Sichuan 53206 18829 1057068 19906 4270 1341 82582 19178
贵 州 Guizhou 6068 2495 76899 12608 3353 1391 39470 11671
云 南 Yunnan 12740 4695 206573 16072 3812 1286 63448 16290
西 藏 Tibet 1149 474 31188 27262 149 63 4685 31655
陕 西 Shaanxi 48740 17950 776632 15835 14042 5995 148635 10580
甘 肃 Gansu 17230 5879 253598 14934 3618 1116 56777 15607
青 海 Qinghai 2791 1018 60244 21593 1783 626 43037 24110
宁 夏 Ningxia 2199 899 31321 14588 202 81 3406 16861
新 疆 Xinjiang 6464 2505 105003 16053 1726 590 29243 16913
3-3 46 continued
工程和技术研究与试验发展 农业科学研究与试验发展
Research and Experimental Development Research and Experimental Development
on Engineering and Technical Research on Agricultural Science Research
年末人数 劳动报酬 平均劳动 年末人数 劳动报酬 平均劳动
地 区 Region (人) # 女 性
(千元) 报 酬 (人) # 女 性
(千元) 报 酬
Year-end Earnings (元) Year-end Earnings (元)
Figures Female Average Figures Female Average
(1 000 Earning (1 000 Earning
(person) yuan) (yuan) (person) yuan) (yuan)
National 259591 86587 6418630 24668 96122 33792 1484418 15497
北 京 Beijing 53331 18325 2033024 38208 4904 1948 163172 33037
天 津 Tianjin 4167 1548 86927 20521 643 275 11060 17147
河 北 Hebei 7086 2309 184515 26929 2739 923 39680 14762
山 西 Shanxi 634 191 8932 14764 1619 543 21399 13001
内蒙古 Inner Mongolia 4030 1625 57355 13764 2987 1118 41943 14103
辽 宁 Liaoning 9741 2485 214314 21444 4079 1253 55256 13613吉 林 Jilin 5347 1661 116850 21977 3990 1548 44153 11543
黑龙江 Heilongjiang 4009 1213 65251 16325 4275 1336 56869 13419
上 海 Shanghai 11173 3451 334807 29666 1380 519 34520 24978
江 苏 Jiangsu 11927 3676 305826 25369 3046 1020 56302 18569
浙 江 Zhejiang 5383 1594 142709 27657 3298 989 86287 25896
安 徽 Anhui 2159 543 37753 17551 1434 519 13814 9606
福 建 Fujian 1669 594 38570 22503 2155 647 36228 16664
江 西 Jiangxi 2067 632 35917 15802 5999 2428 58584 9759
山 东 Shandong 5861 1784 105757 18755 2728 848 39968 14651
河 南 Henan 10687 3621 170230 15951 5695 1880 70031 12380
湖 北 Hubei 20327 6935 320014 15678 3208 1037 33799 10529
湖 南 Hunan 7322 2880 144671 19277 5311 2144 59634 11001
广 东 Guangdong 7876 2443 312080 39519 6307 1939 184747 28184
广 西 Guangxi 1096 350 16114 14756 4316 1296 54678 13201
海 南 Hainan 257 91 4026 15605 6349 2329 54209 8542
重 庆 Chongqing 5076 1582 113524 22268 755 272 8489 11214
四 川 Sichuan 38671 13462 818149 21209 4858 1820 66772 13765
贵 州 Guizhou 208 57 8196 38660 1642 668 19298 11738
云 南 Yunnan 3050 1048 56397 18082 3505 1348 48286 13935

8/2/2019 China Labour Statistical Yearbook - 2004
http://slidepdf.com/reader/full/china-labour-statistical-yearbook-2004 224/464
西 藏 Tibet 196 78 5413 27617 654 287 15630 24120
陕 西 Shaanxi 29845 10323 575576 19106 895 247 10022 11198
甘 肃 Gansu 3886 1164 61926 15854 3475 950 44634 14085
青 海 Qinghai 629 258 10658 17108 186 64 3059 16535
宁 夏 Ningxia 617 207 10583 18153 1034 480 12134 11966
新 疆 Xinjiang 1264 457 22566 17741 2656 1117 39761 14586
3-3 47 continued
医学研究与试验发展 社会人文科学研究与试验发展
Research and Experimental Development Research and Experimental Development
on Medical Research on Social Science and Humanities
年末人数 劳动报酬 平均劳动 年末人数 劳动报酬 平均劳动
地 区 Region (人) # 女 性
(千元) 报 酬 (人) # 女 性
(千元) 报 酬
Year-end Earnings (元) Year-end Earnings (元)
Figures Female Average Figures Female Average
(1 000 Earning (1 000 Earning
(person) yuan) (yuan) (person) yuan) (yuan)
National 27134 13531 509928 18909 74367 27177 1613608 21778
北 京 Beijing 4633 2359 129082 28445 22195 8873 746588 33883
天 津 Tianjin 1541 741 23142 14959 1271 417 28215 22252
河 北 Hebei 256 117 3417 13244 876 322 12882 14655
山 西 Shanxi 188 116 2438 13250 1913 704 26892 14281
内蒙古 Inner Mongolia 369 181 6371 17173 1285 505 17938 13992
辽 宁 Liaoning 1001 544 15674 15721 1382 472 24480 17473
吉 林 Jilin 687 395 9857 14690 1609 594 23888 14856
黑龙江 Heilongjiang 430 196 8748 20978 1627 540 25734 17411
上 海 Shanghai 1677 710 39504 23265 1417 503 33977 24166
江 苏 Jiangsu 1452 637 33417 23767 699 251 19186 27725
浙 江 Zhejiang 608 267 14220 23235 2397 892 74395 31193
安 徽 Anhui 191 51 2574 13619 3534 1085 41425 11659
福 建 Fujian 1785 820 28605 15597 1904 587 45844 23865
江 西 Jiangxi 318 139 4434 14032 371 122 4608 12420
山 东 Shandong 1273 537 25035 19996 2158 651 40278 18673
河 南 Henan 504 253 6748 13416 4105 1532 64555 15780
湖 北 Hubei 1256 506 15957 12858 2205 659 30738 13940
湖 南 Hunan 2119 1285 27495 13124 2699 960 34238 12752广 东 Guangdong 404 210 16448 40117 1109 451 37276 34136
广 西 Guangxi 1267 672 17646 13690 2412 809 37358 15482
海 南 Hainan 21 11 199 9476 1057 519 9886 9711
重 庆 Chongqing 132 34 1379 10447 803 259 12582 14011
四 川 Sichuan 1319 701 26863 20259 4088 1505 62702 15505
贵 州 Guizhou 127 83 688 5548 738 296 9247 12547
云 南 Yunnan 1070 535 19388 18273 1303 478 19054 14512
西 藏 Tibet 150 46 5460 35921
陕 西 Shaanxi 1192 568 18922 15887 2766 817 23477 8433
甘 肃 Gansu 1240 831 10482 8663 5011 1818 79779 15773
青 海 Qinghai 12 4 169 14083 181 66 3321 17951
宁 夏 Ningxia 27 16 426 15214 319 115 4772 14913
新 疆 Xinjiang 35 12 600 17647 783 329 12833 16453

8/2/2019 China Labour Statistical Yearbook - 2004
http://slidepdf.com/reader/full/china-labour-statistical-yearbook-2004 225/464
3-3 48 continued
专业技术服务业 气象服务
Professional Technique Services Weather Services
年末人数 劳动报酬 平均劳动 年末人数 劳动报酬 平均劳动
地 区 Region (人) # 女 性
(千元) 报 酬 (人) # 女 性
(千元) 报 酬
Year-end Earnings (元) Year-end Earnings (元)
Figures Female Average Figures Female Average
(1 000 Earning (1 000 Earning
(person) yuan) (yuan) (person) yuan) (yuan)
National 1041008 326538 22846729 21880 49957 18120 916191 18406
北 京 Beijing 202958 65858 6388143 32010 2652 1107 99408 37899
天 津 Tianjin 31903 10837 801062 25591 392 137 6584 16839
河 北 Hebei 28282 9508 391570 13951 1882 777 28349 15047
山 西 Shanxi 25782 9129 342789 13464 1563 676 20373 13093
内蒙古 Inner Mongolia 17257 6375 252111 14669 3044 1250 47801 15771
辽 宁 Liaoning 46683 15903 843141 17519 1853 728 32965 17935
吉 林
Jilin 31355 10142 436176 14019 1074 369 15081 14214黑龙江 Heilongjiang 28861 8779 377614 8822 1604 575 23024 14363
上 海 Shanghai 34107 10381 1228977 36379 437 168 10686 24013
江 苏 Jiangsu 42034 11795 1053209 25158 1462 458 31114 21384
浙 江 Zhejiang 45455 11308 1298084 29384 1522 483 38945 25706
安 徽 Anhui 26540 7538 377958 14266 1265 352 26402 20971
福 建 Fujian 22964 6056 468896 20664 1504 477 24711 16485
江 西 Jiangxi 14394 4325 203122 14240 1663 523 24298 14655
山 东 Shandong 39243 12219 698419 18003 1937 660 33826 17409
河 南 Henan 51570 17296 822019 16148 2288 852 33410 14641
湖 北 Hubei 47763 14942 776795 16469 1977 656 29608 14954
湖 南 Hunan 27662 7907 472630 17141 1634 540 24285 14899
广 东 Guangdong 61121 17449 2107640 35349 2172 708 53749 25306
广 西 Guangxi 20595 6232 341469 16669 1930 651 33170 17178
海 南 Hainan 4913 1494 75405 15411 393 113 7319 18436
重 庆 Chongqing 42311 13968 572253 13495 798 286 17400 21942
四 川 Sichuan 39100 12403 797946 20692 2731 965 45901 16956
贵 州 Guizhou 14491 4520 229166 15963 1467 469 20701 14016
云 南 Yunnan 22074 6789 337580 15422 1781 667 26227 14834
西 藏 Tibet 2438 755 75991 31208 993 408 38907 39221
陕 西 Shaanxi 23018 7352 321709 14076 1948 734 28902 14991
甘 肃 Gansu 18877 5845 286830 15749 1399 429 19663 14035
青 海 Qinghai 4393 1739 73161 16552 1442 626 24607 17076
宁 夏 Ningxia 5281 1605 80417 15280 464 170 7802 16851
新 疆 Xinjiang 17583 6089 314447 18017 2686 1106 40973 15158
3-3 49 continued
地震服务 海洋服务
Earthquake Services Ocean Services
年末人数 劳动报酬 平均劳动 年末人数 劳动报酬 平均劳动
地 区 Region (人) # 女 性
(千元) 报 酬 (人) # 女 性
(千元) 报 酬
Year-end Earnings (元) Year-end Earnings (元)
Figures Female Average Figures Female Average
(1 000 Earning (1 000 Earning
(person) yuan) (yuan) (person) yuan) (yuan)
National 13726 4167 230599 16764 6269 1320 144472 23153
北 京 Beijing 696 262 17011 24512 536 175 14467 27504
天 津 Tianjin 487 127 7135 14045 800 268 18441 23432
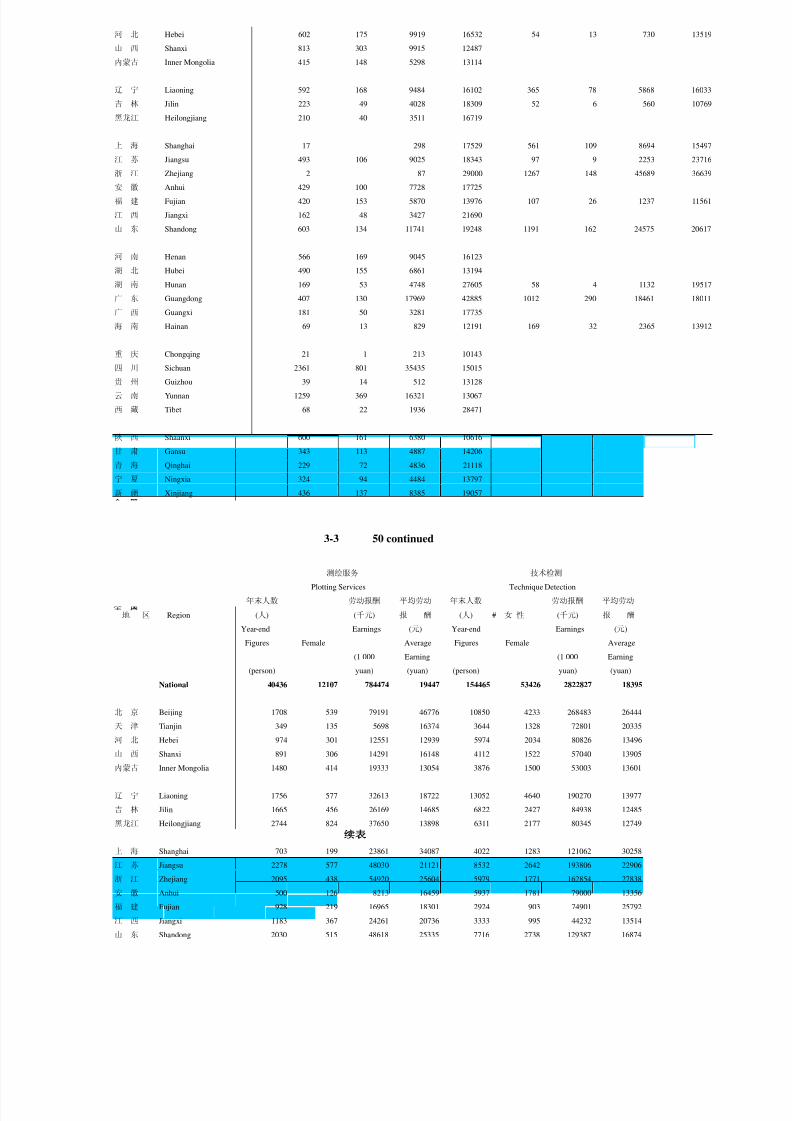
8/2/2019 China Labour Statistical Yearbook - 2004
http://slidepdf.com/reader/full/china-labour-statistical-yearbook-2004 226/464
河 北 Hebei 602 175 9919 16532 54 13 730 13519
山 西 Shanxi 813 303 9915 12487
内蒙古 Inner Mongolia 415 148 5298 13114
辽 宁 Liaoning 592 168 9484 16102 365 78 5868 16033
吉 林 Jilin 223 49 4028 18309 52 6 560 10769
黑龙江 Heilongjiang 210 40 3511 16719
上 海 Shanghai 17 298 17529 561 109 8694 15497
江 苏 Jiangsu 493 106 9025 18343 97 9 2253 23716
浙 江 Zhejiang 2 87 29000 1267 148 45689 36639
安 徽 Anhui 429 100 7728 17725
福 建 Fujian 420 153 5870 13976 107 26 1237 11561
江 西 Jiangxi 162 48 3427 21690
山 东 Shandong 603 134 11741 19248 1191 162 24575 20617
河 南 Henan 566 169 9045 16123
湖 北 Hubei 490 155 6861 13194
湖 南 Hunan 169 53 4748 27605 58 4 1132 19517
广 东 Guangdong 407 130 17969 42885 1012 290 18461 18011
广 西 Guangxi 181 50 3281 17735海 南 Hainan 69 13 829 12191 169 32 2365 13912
重 庆 Chongqing 21 1 213 10143
四 川 Sichuan 2361 801 35435 15015
贵 州 Guizhou 39 14 512 13128
云 南 Yunnan 1259 369 16321 13067
西 藏 Tibet 68 22 1936 28471
陕 西 Shaanxi 600 161 6380 10616
甘 肃 Gansu 343 113 4887 14206
青 海 Qinghai 229 72 4836 21118
宁 夏 Ningxia 324 94 4484 13797
新 疆 Xinjiang 436 137 8385 19057
3-3 50 continued
测绘服务 技术检测
Plotting Services Technique Detection
年末人数 劳动报酬 平均劳动 年末人数 劳动报酬 平均劳动
地 区 Region (人) # 女 性
(千元) 报 酬 (人) # 女 性
(千元) 报 酬
Year-end Earnings (元) Year-end Earnings (元)Figures Female Average Figures Female Average
(1 000 Earning (1 000 Earning
(person) yuan) (yuan) (person) yuan) (yuan)
National 40436 12107 784474 19447 154465 53426 2822827 18395
北 京 Beijing 1708 539 79191 46776 10850 4233 268483 26444
天 津 Tianjin 349 135 5698 16374 3644 1328 72801 20335
河 北 Hebei 974 301 12551 12939 5974 2034 80826 13496
山 西 Shanxi 891 306 14291 16148 4112 1522 57040 13905
内蒙古 Inner Mongolia 1480 414 19333 13054 3876 1500 53003 13601
辽 宁 Liaoning 1756 577 32613 18722 13052 4640 190270 13977
吉 林 Jilin 1665 456 26169 14685 6822 2427 84938 12485
黑龙江 Heilongjiang 2744 824 37650 13898 6311 2177 80345 12749
上 海 Shanghai 703 199 23861 34087 4022 1283 121062 30258
江 苏 Jiangsu 2278 577 48030 21121 8532 2642 193806 22906
浙 江 Zhejiang 2095 438 54920 25604 5979 1771 162854 27838
安 徽 Anhui 500 126 8213 16459 5937 1781 79000 13356
福 建 Fujian 928 219 16965 18301 2924 903 74901 25792
江 西 Jiangxi 1183 367 24261 20736 3333 995 44232 13514
山 东 Shandong 2030 515 48618 25335 7716 2738 129387 16874

8/2/2019 China Labour Statistical Yearbook - 2004
http://slidepdf.com/reader/full/china-labour-statistical-yearbook-2004 227/464
河 南 Henan 1967 712 27547 14318 12217 4399 139816 11518
湖 北 Hubei 1005 393 15542 15589 5454 1747 82058 15043
湖 南 Hunan 1719 483 25089 14595 2888 885 41942 14645
广 东 Guangdong 2344 645 64789 27950 13303 4394 460243 35452
广 西 Guangxi 1337 350 22012 16378 3111 1040 45574 14509
海 南 Hainan 200 56 3237 16686 950 376 13919 14745
重 庆 Chongqing 645 123 12134 19539 1260 395 22738 17961
四 川 Sichuan 1449 467 19392 13328 3911 1401 64039 16282
贵 州 Guizhou 1874 590 30392 16437 2411 811 33697 14035
云 南 Yunnan 1271 412 31594 24173 2938 1141 41652 14225
西 藏 Tibet 78 33 2328 29846
陕 西 Shaanxi 2210 767 28225 12812 4539 1577 52657 11588
甘 肃 Gansu 1293 292 21925 16852 2915 1135 45223 15664
青 海 Qinghai 664 395 11541 17329 736 299 10742 14776
宁 夏 Ningxia 219 90 2962 13525 1284 477 21037 16333
新 疆 Xinjiang 955 339 15729 16066 3386 1342 52214 15494
3-3 51 continued
环境监测 工程技术与规划管理
Environmental Monitoring Engineering Technic & Programming Management
年末人数 劳动报酬 平均劳动 年末人数 劳动报酬 平均劳动
地 区 Region (人) # 女 性
(千元) 报 酬 (人) # 女 性
(千元) 报 酬
Year-end Earnings (元) Year-end Earnings (元)
Figures Female Average Figures Female Average
(1 000 Earning (1 000 Earning
(person) yuan) (yuan) (person) yuan) (yuan)
National 46175 17008 751030 16591 522695 152753 12136092 22849
北 京 Beijing 1149 400 29817 26984 56756 17723 2033418 35956
天 津 Tianjin 507 210 9090 17824 17485 5602 536665 30889
河 北 Hebei 1441 594 17588 12395 16078 5224 219082 13750
山 西 Shanxi 2288 931 26323 11565 14486 4976 198441 13989
内蒙古 Inner Mongolia 1333 590 18339 13809 6880 2381 104869 15377
辽 宁 Liaoning 2974 1139 45445 15312 22505 7418 456859 19700
吉 林 Jilin 1519 615 17845 11787 18772 5754 272907 14756
黑龙江 Heilongjiang 1280 425 15278 11945 13932 3893 180874 6468
上 海 Shanghai 1155 399 35170 29211 21171 6533 866744 41429
江 苏 Jiangsu 3363 1026 62718 18683 22512 5948 637392 28441
浙 江 Zhejiang 2257 712 63143 28468 31229 7419 902659 29970
安 徽 Anhui 1694 593 23668 13947 15572 4199 213563 13730
福 建 Fujian 1466 511 22416 15301 12803 2983 280646 22302
江 西 Jiangxi 1225 445 12934 10645 6494 1868 90002 13934
山 东 Shandong 2814 963 44506 15833 21307 6557 373115 17766
河 南 Henan 3282 1276 35525 10924 28683 9017 554502 19672
湖 北 Hubei 2628 937 30736 11745 35504 10738 604436 17323
湖 南 Hunan 1124 449 17320 15646 19619 5308 352388 18007
广 东 Guangdong 2915 981 91165 31743 35939 9282 1287721 36790
广 西 Guangxi 1404 502 25992 18931 12062 3428 203198 16994
海 南 Hainan 167 63 3076 18419 2864 808 43044 15103
重 庆 Chongqing 32 15 336 10500 8108 1953 193832 23311
四 川 Sichuan 1670 627 25488 15373 26572 8000 601401 23107
贵 州 Guizhou 617 275 7591 12323 7844 2243 133662 17289
云 南 Yunnan 1039 435 15705 15292 11886 3227 178604 15269
西 藏 Tibet 60 21 1378 23759 1239 271 31442 25377
陕 西 Shaanxi 2011 754 20473 10451 11128 3149 177619 16119

8/2/2019 China Labour Statistical Yearbook - 2004
http://slidepdf.com/reader/full/china-labour-statistical-yearbook-2004 228/464
甘 肃 Gansu 1496 597 12587 13667 11431 3279 182545 16071
青 海 Qinghai 281 97 4734 16907 969 227 15556 15479
宁 夏 Ningxia 230 91 3495 15262 1965 583 28755 14769
新 疆 Xinjiang 754 335 11149 15189 8900 2762 180151 20553
3-3 52 continued
科技交流和推广服务业 地质勘查业Services of Science and Technique
Intercommunion and Generalization Geologic Perambulation
年末人数 劳动报酬 平均劳动 年末人数 劳动报酬 平均劳动
地 区 Region (人) # 女 性
(千元) 报 酬 (人) # 女 性
(千元) 报 酬
Year-end Earnings (元) Year-end Earnings (元)
Figures Female Average Figures Female Average
(1 000 Earning (1 000 Earning
(person) yuan) (yuan) (person) yuan) (yuan)
National 223519 78973 3661995 16527 316624 79093 4854529 15231
北 京 Beijing 46752 17774 1242312 27495 3129 834 117378 35645
天 津 Tianjin 3625 1239 50350 14251 5225 954 138583 26153
河 北 Hebei 2994 1119 34912 11633 27855 8153 483740 17033
山 西 Shanxi 2379 883 26868 11453 11639 2791 119594 10683
内蒙古 Inner Mongolia 2249 860 29135 12926 10557 3052 142459 13297
辽 宁 Liaoning 8547 2851 125045 14496 7832 1644 97189 12143
吉 林 Jilin 4539 1780 43110 9593 6505 1713 60073 9194
黑龙江 Heilongjiang 6502 2345 74122 11416 35668 9206 687764 19423
上 海 Shanghai 24734 12251 445915 18113 2255 445 56270 24615
江 苏 Jiangsu 8231 2444 138159 16845 8231 1700 134676 16370
浙 江 Zhejiang 7066 2334 166094 23259 5892 1172 120032 20919
安 徽 Anhui 3960 1119 39519 9944 8767 2087 80144 8941
福 建 Fujian 2028 595 30089 14844 3797 900 53690 13848
江 西 Jiangxi 1588 543 17014 10707 18403 4672 235161 12762
山 东 Shandong 3581 1148 45178 12532 11124 2546 154670 13383
河 南 Henan 13729 4876 147372 10891 14806 3969 180447 12449
湖 北 Hubei 12764 3864 108102 8428 7909 2109 77050 9822
湖 南 Hunan 6609 1982 76352 11423 11554 4010 122329 10153
广 东 Guangdong 4896 1728 125739 25469 8165 1814 152603 18747
广 西 Guangxi 6414 2006 74065 11446 4155 1059 51901 12249
海 南 Hainan 774 236 7798 12128 770 144 12470 15967
重 庆 Chongqing 1364 388 15107 11133 5950 1466 98234 15929
四 川 Sichuan 4590 1261 66865 14221 13511 3076 237819 17603
贵 州 Guizhou 1480 450 14465 9754 5548 1649 63461 11214
云 南 Yunnan 17724 3833 144914 8364 9067 2672 117348 12917
西 藏 Tibet 476 166 13181 27749 1235 225 39011 29985
陕 西 Shaanxi 13165 4615 217479 16384 32696 6498 442345 13526
甘 肃 Gansu 2669 867 32742 12277 8903 2051 102044 11321
青 海 Qinghai 467 158 6952 14887 11644 2545 276301 24089
宁 夏 Ningxia 867 331 11891 13747 4063 1053 49202 11640
新 疆 Xinjiang 6756 2927 91149 13448 9769 2884 150541 14877

8/2/2019 China Labour Statistical Yearbook - 2004
http://slidepdf.com/reader/full/china-labour-statistical-yearbook-2004 229/464
3-3 53 continued
水利、环境和公共设施管理业 水利管理业
Management of Water Conservancy,
Environment and Public Establishment Management of Water Conservancy
年末人数 劳动报酬 平均劳动 年末人数 劳动报酬 平均劳动
地 区 Region (人) # 女 性
(千元) 报 酬 (人) # 女 性
(千元) 报 酬
Year-end Earnings (元) Year-end Earnings (元)
Figures Female Average Figures Female Average
(1 000 Earning (1 000 Earning
(person) yuan) (yuan) (person) yuan) (yuan)
National 1725387 687747 20262472 11774 482083 129782 5413057 11
北 京 Beijing 60758 22076 1364800 21735 5131 1400 125273 24
天 津 Tianjin 33496 11016 564960 16270 6414 1529 119856 18
河 北 Hebei 79714 32190 802508 9953 19377 5312 207562 10
山 西 Shanxi 48814 18917 383596 7911 14901 3920 125471 8
内蒙古 Inner Mongolia 53620 23874 505662 10079 16380 5334 181194 11
辽 宁
Liaoning 105076 45970 1107801 10422 18573 4812 195144 10吉 林 Jilin 64781 27608 575681 8692 16248 4727 126636 7
黑龙江 Heilongjiang 76223 28854 698487 9206 17191 4585 154998 8
上 海 Shanghai 55055 19224 1253273 22763 4864 1305 128531 26
江 苏 Jiangsu 107361 38533 1549410 14350 32066 7020 417025 12
浙 江 Zhejiang 53394 19817 949909 18074 9998 2160 225549 22
安 徽 Anhui 61555 24411 550997 8999 24392 6924 206518 8
福 建 Fujian 32473 12956 412391 12661 7863 1987 108109 13
江 西 Jiangxi 41766 17832 351672 8481 10445 2797 83692 7
山 东 Shandong 104828 40763 1193531 11537 29455 7525 361766 12
河 南 Henan 103727 41833 1002228 9810 30487 8939 288105 9
湖 北 Hubei 86849 35307 770994 8922 33053 9958 285222 8
湖 南 Hunan 69461 26818 658811 9536 24145 6531 220137 9
广 东 Guangdong 112397 46555 1802732 16115 30547 6813 432505 14
广 西 Guangxi 46313 19621 451247 9784 13362 3038 124372 9
海 南 Hainan 16174 7761 151208 9379 4300 1347 24439 5
重 庆 Chongqing 23342 10142 209991 9240 2790 829 24731 8
四 川 Sichuan 71442 30653 671519 9495 14534 3773 152005 10
贵 州 Guizhou 22929 10508 189546 8356 5037 1238 45931 9
云 南 Yunnan 38138 16546 395127 10554 11476 2823 138736 12
西 藏 Tibet 1314 737 19849 15163 181 29 4324 24
陕 西 Shaanxi 49266 16895 450071 9191 24748 7693 223659 9
甘 肃 Gansu 35319 12689 403230 11400 19826 5114 234403 11
青 海 Qinghai 11840 4613 116428 9993 4531 976 51252 11
宁 夏 Ningxia 16782 6810 198430 11902 7129 1847 96291 13
新 疆 Xinjiang 41180 16218 506383 12035 22639 7497 299621 13
3-3 54 continued
环境管理业 公共设施管理业
Environmental Management Management of Public Establishment
年末人数 劳动报酬 平均劳动 年末人数 劳动报酬 平均劳动
地 区 Region (人) # 女 性
(千元) 报 酬 (人) # 女 性
(千元) 报 酬
Year-end Earnings (元) Year-end Earnings (元)
Figures Female Average Figures Female Average
(1 000 Earning (1 000 Earning
(person) yuan) (yuan) (person) yuan) (yuan)
National 723137 357535 7646167 10736 520167 200430 7203248 13685
北 京 Beijing 27242 9798 599020 21433 28385 10878 640507 21557

8/2/2019 China Labour Statistical Yearbook - 2004
http://slidepdf.com/reader/full/china-labour-statistical-yearbook-2004 230/464
天 津 Tianjin 12243 4833 173606 13910 14839 4654 271498 17183
河 北 Hebei 28028 14008 237048 8488 32309 12870 357898 10876
山 西 Shanxi 21329 10263 142146 6720 12584 4734 115979 9261
内蒙古 Inner Mongolia 26325 14142 191275 8323 10915 4398 133193 12270
辽 宁 Liaoning 47902 25489 448694 9464 38601 15669 463963 11532
吉 林 Jilin 27021 15240 226931 8205 21512 7641 222114 9950
黑龙江 Heilongjiang 40167 16837 337130 8591 18865 7432 206359 10689
上 海 Shanghai 33783 12478 719584 21607 16408 5441 405158 23958
江 苏 Jiangsu 36750 17513 420646 11500 38545 14000 711739 18115
浙 江 Zhejiang 27147 11940 390997 14783 16249 5717 333363 20715
安 徽 Anhui 23509 12196 190402 8264 13654 5291 154077 11432
福 建 Fujian 16467 8039 186282 11371 8143 2930 118000 14169
江 西 Jiangxi 17073 9230 126279 7530 14248 5805 141701 9970
山 东 Shandong 39024 18937 361711 9553 36349 14301 470054 12955
河 南 Henan 39665 19405 324438 8317 33575 13489 389685 11707
湖 北 Hubei 33700 17013 295560 8907 20096 8336 190212 9475
湖 南 Hunan 24793 12168 223181 9144 20523 8119 215493 10510
广 东 Guangdong 56931 30123 807128 14288 24919 9619 563099 22570广 西 Guangxi 22841 12241 217496 9642 10110 4342 109379 10819
海 南 Hainan 7985 4740 83163 10363 3889 1674 43606 11597
重 庆 Chongqing 12058 6171 91493 8053 8494 3142 93767 10953
四 川 Sichuan 33131 18380 244002 7440 23777 8500 275512 11824
贵 州 Guizhou 11917 6738 81407 6998 5975 2532 62208 10354
云 南 Yunnan 15477 8564 137608 9229 11185 5159 118783 10787
西 藏 Tibet 854 550 10649 12484 279 158 4876 17477
陕 西 Shaanxi 11835 5300 84252 7227 12683 3902 142160 11245
甘 肃 Gansu 10114 5487 110544 10873 5379 2088 58283 10655
青 海 Qinghai 2843 1774 26059 9313 4466 1863 39117 9003
宁 夏 Ningxia 5476 2953 58684 10795 4177 2010 43455 10703
新 疆 Xinjiang 9507 4985 98752 10142 9034 3736 108010 11097
3-3 55 continued
居民服务和其他服务业 居民服务业
Resident Services and Other Services Resident Services
年末人数 劳动报酬 平均劳动 年末人数 劳动报酬 平均劳动
地 区 Region (人) # 女 性
(千元) 报 酬 (人) # 女 性
(千元) 报 酬Year-end Earnings (元) Year-end Earnings (元)
Figures Female Average Figures Female Average
(1 000 Earning (1 000 Earning
(person) yuan) (yuan) (person) yuan) (yuan)
National 527894 221953 6639547 12665 240619 110075 3030955 12692
北 京 Beijing 91688 31875 1458938 16894 30166 14021 412559 15167
天 津 Tianjin 32492 15814 417641 13833 7104 3200 107951 15631
河 北 Hebei 27476 11373 395232 14343 23513 9957 351356 14918
山 西 Shanxi 30822 17281 205182 6701 4293 2389 26812 6373
内蒙古 Inner Mongolia 9284 4660 65431 7248 5168 2546 30242 6023
辽 宁 Liaoning 18578 8221 180778 9667 11776 4610 120703 10100
吉 林 Jilin 11662 5314 142894 12266 5684 2691 60110 10577
黑龙江 Heilongjiang 36903 16602 231847 6242 16940 7867 96274 5597
上 海 Shanghai 41339 19683 640974 16060 17197 9477 288546 16758
江 苏 Jiangsu 19667 7550 302918 15416 10613 4419 144641 13691
浙 江 Zhejiang 8730 3222 162789 18811 5924 2306 113310 19343
安 徽 Anhui 11578 5078 91490 7564 3468 1195 36254 10406
福 建 Fujian 12990 5691 193179 15042 8692 4363 126988 14625
江 西 Jiangxi 9530 4015 76480 8149 5209 2156 43346 8440

8/2/2019 China Labour Statistical Yearbook - 2004
http://slidepdf.com/reader/full/china-labour-statistical-yearbook-2004 231/464
山 东 Shandong 12163 4597 143729 11593 6332 2416 76933 11789
河 南 Henan 15596 6675 139074 9147 9279 3984 82509 9244
湖 北 Hubei 12578 7234 111774 8918 8900 5238 81950 9260
湖 南 Hunan 7145 2559 77748 10892 3245 1530 39287 12073
广 东 Guangdong 29650 13107 519996 17830 25253 11345 442763 17882
广 西 Guangxi 7160 2593 86737 12688 4572 1717 66723 14827
海 南 Hainan 396 173 5109 12902 367 163 4292 11695
重 庆 Chongqing 3820 1044 38665 13232 3120 873 32403 14655
四 川 Sichuan 24488 8746 320054 13120 5326 2071 63466 12172
贵 州 Guizhou 4598 1894 38568 8590 3490 1596 31279 9216
云 南 Yunnan 6824 2778 75413 11027 3160 1622 32110 10194
西 藏 Tibet 40 7 1016 25400 23 7 401 17435
陕 西 Shaanxi 17509 8016 158437 8762 5280 2735 42569 7333
甘 肃 Gansu 3289 1889 34050 10561 2419 1563 28572 11995
青 海 Qinghai 2291 1138 30639 12890 1612 728 26633 15566
宁 夏 Ningxia 443 198 4434 10217 217 116 2134 9926
新 疆 Xinjiang 17165 2926 288331 12015 2277 1174 17839 3677
3-3 56 continued
其他服务业 教育
Other Services Education
年末人数 劳动报酬 平均劳动 年末人数 劳动报酬 平均劳动
地 区 Region (人) # 女 性
(千元) 报 酬 (人) # 女 性
(千元) 报 酬
Year-end Earnings (元) Year-end Earnings (元)
Figures Female Average Figures Female Average
(1 000 Earning (1 000 Earning
(person) yuan) (yuan) (person) yuan) (yuan)
National 287275 111878 3608592 12642 14427715 6728098 203587199 14189
北 京 Beijing 61522 17854 1046379 17688 328723 188022 9121162 28019
天 津 Tianjin 25388 12614 309690 13300 169026 95332 3169840 18795
河 北 Hebei 3963 1416 43876 10964 816267 472493 8937352 11010
山 西 Shanxi 26529 14892 178370 6753 449556 251232 5074439 11352
内蒙古 Inner Mongolia 4116 2114 35189 8784 321522 161145 4228132 13249
辽 宁 Liaoning 6802 3611 60075 8901 523210 293534 7033274 13498
吉 林 Jilin 5978 2623 82784 13874 359281 199028 4635454 12934
黑龙江 Heilongjiang 19963 8735 135573 6799 443677 234709 6059973 13738
上 海 Shanghai 24142 10206 352428 15530 250091 143966 6392904 25456
江 苏 Jiangsu 9054 3131 158277 17422 800490 350867 13093762 16396
浙 江 Zhejiang 2806 916 49479 17696 496793 257039 12342340 25194
安 徽 Anhui 8110 3883 55236 6414 558529 190809 6318076 11336
福 建 Fujian 4298 1328 66191 15911 425026 193401 6298826 14883
江 西 Jiangxi 4321 1859 33134 7798 430516 159734 4663997 10890
山 东 Shandong 5831 2181 66796 11375 1045715 444128 13734762 13221
河 南 Henan 6317 2691 56565 9010 1038371 488139 11026124 10717
湖 北 Hubei 3678 1996 29824 8098 636920 257421 7481658 11780
湖 南 Hunan 3900 1029 38461 9902 656509 275135 8662847 13201
广 东 Guangdong 4397 1762 77233 17537 924415 467150 18370122 20058
广 西 Guangxi 2588 876 20014 8568 542976 244465 5820752 10801
海 南 Hainan 29 10 817 28172 84225 31599 1098876 13088
重 庆 Chongqing 700 171 6262 8807 299109 125849 3806183 12833
四 川 Sichuan 19162 6675 256588 13377 778393 317057 9791822 12647
贵 州 Guizhou 1108 298 7289 6651 358883 131597 3656713 10255
云 南 Yunnan 3664 1156 43303 11738 461879 197549 6023064 13065
西 藏 Tibet 17 0 615 36176 28755 11248 711136 24964

8/2/2019 China Labour Statistical Yearbook - 2004
http://slidepdf.com/reader/full/china-labour-statistical-yearbook-2004 232/464
陕 西 Shaanxi 12229 5281 115868 9438 478886 215486 5787914 12154
甘 肃 Gansu 870 326 5478 6506 277106 95459 3533970 12838
青 海 Qinghai 679 410 4006 6015 61072 27058 983123 16199
宁 夏 Ningxia 226 82 2300 10502 75007 32036 1116898 14978
新 疆 Xinjiang 14888 1752 270492 14128 306787 175411 4611704 15098
3-3 57 continued
初等教育 中等教育
Primary Education Secondary Education
年末人数 劳动报酬 平均劳动 年末人数 劳动报酬 平均劳动
地 区 Region (人) # 女 性
(千元) 报 酬 (人) # 女 性
(千元) 报 酬
Year-end Earnings (元) Year-end Earnings (元)
Figures Female Average Figures Female Average
(1 000 Earning (1 000 Earning
(person) yuan) (yuan) (person) yuan) (yuan)
National 6259283 3098707 74872129 11957 6030824 2598376 85468727 14308
北 京 Beijing 62585 44936 1597687 25146 107630 64600 3072481 28670
天 津 Tianjin 39511 26090 658526 16585 56810 32677 1099142 19396
河 北 Hebei 361280 226411 3534362 9779 370359 202896 4068252 11105
山 西 Shanxi 213692 129492 2157770 10110 178235 91182 2055879 11640
内蒙古 Inner Mongolia 150239 77090 1818173 12152 131738 63926 1729640 13280
辽 宁 Liaoning 199841 125658 2201788 10977 218595 117631 2804640 12940
吉 林 Jilin 161989 95483 1723922 10587 128582 70617 1556034 12185
黑龙江 Heilongjiang 175633 96701 2146207 12486 189021 98554 2483113 13170
上 海 Shanghai 45899 32734 1126883 24092 95785 52164 2494284 25922
江 苏 Jiangsu 289782 141308 4169146 14212 378848 148786 6317797 16837
浙 江 Zhejiang 174100 103853 3965561 22807 233492 107754 5712742 24950
安 徽 Anhui 269670 96561 2757683 10193 238887 72194 2791182 11755
福 建 Fujian 191581 100583 2585087 13383 187154 70512 2802163 15136
江 西 Jiangxi 211037 84648 2053425 9724 161818 53698 1788515 11152
山 东 Shandong 420935 185809 4624264 10994 520571 210628 7008977 13589
河 南 Henan 496210 248378 4601407 9322 449149 194985 4914563 11073
湖 北 Hubei 224069 101093 2111977 9385 284133 100784 3200438 11333
湖 南 Hunan 273880 126455 2993799 10793 303301 114914 4060969 13491
广 东 Guangdong 456378 253782 7454757 16373 361587 154051 7242152 20366
广 西 Guangxi 261231 120008 2491315 9611 219503 94701 2503506 11482
海 南 Hainan 45048 16599 530898 11795 30448 11122 427428 14103
重 庆 Chongqing 136082 61110 1443015 10620 120475 45414 1463155 12313
四 川 Sichuan 365407 154577 3968107 10831 321652 119339 4078560 12828
贵 州 Guizhou 207467 72887 1940229 9352 122588 43456 1348804 11201
云 南 Yunnan 257696 108284 3231591 12479 155200 63201 2123552 13814
西 藏 Tibet 17547 6757 404745 23180 8057 3007 222084 28016
陕 西 Shaanxi 212735 102926 2040009 9708 175468 72771 1993703 11410
甘 肃 Gansu 131397 44796 1522596 11597 105062 33124 1381611 13224
青 海 Qinghai 29869 12603 474050 15730 21746 9687 354062 16569
宁 夏 Ningxia 36674 16172 514831 14146 28682 11247 435786 15222
新 疆 Xinjiang 139819 84923 2028319 14507 126248 68754 1933513 15468

8/2/2019 China Labour Statistical Yearbook - 2004
http://slidepdf.com/reader/full/china-labour-statistical-yearbook-2004 233/464
3-3 58 continued
高等教育 卫生、社会保障和社会福利业
Higher Education Sanitation,Social Security & Social Welfare
年末人数 劳动报酬 平均劳动 年末人数 劳动报酬 平均劳动
地 区 Region (人) # 女 性
(千元) 报 酬 (人) # 女 性
(千元) 报 酬
Year-end Earnings (元) Year-end Earnings (元)
Figures Female Average Figures Female Average
(1 000 Earning (1 000 Earning
(person) yuan) (yuan) (person) yuan) (yuan)
National 1414242 598033 32382094 23307 4857919 2845174 78207871 16185
北 京 Beijing 117790 54081 3572393 30999 136283 92012 4533303 33813
天 津 Tianjin 36209 15571 836864 23463 68312 44405 1355756 20059
河 北 Hebei 58465 25834 1018268 17627 218643 129920 2539220 11635
山 西 Shanxi 35315 15780 606056 17441 135896 83142 1473620 10876
内蒙古 Inner Mongolia 23927 9874 466468 19604 103173 59967 1372700 13304
辽 宁 Liaoning 76691 33374 1659892 21998 219669 137965 3071844 13909
吉 林 Jilin 51239 22249 1130413 22405 139182 84925 1624878 11715
黑龙江 Heilongjiang 56231 25499 1089974 19516 170422 105165 2213269 12971
上 海 Shanghai 69846 30234 1926940 27789 143281 94178 3850107 26926
江 苏 Jiangsu 95888 40105 2015578 21443 286999 162699 5249782 18346
浙 江 Zhejiang 56835 23763 1931864 35186 224007 134510 6353603 28941
安 徽 Anhui 36120 13539 591593 16649 168077 90115 1951859 11723
福 建 Fujian 30723 11576 675710 23053 113211 64490 1841168 16391
江 西 Jiangxi 31837 12504 529759 17129 129894 67821 1617321 12441
山 东 Shandong 72512 29672 1610395 22734 349142 198620 5203979 14989
河 南 Henan 58156 23831 1086571 19007 317984 181185 3599752 11449
湖 北 Hubei 89036 35599 1713258 19471 247475 141086 2965003 12020
湖 南 Hunan 58356 23657 1337646 23414 229716 129512 3423517 14969
广 东 Guangdong 66099 29421 2780491 43175 346001 211331 8590035 25006
广 西 Guangxi 25231 10647 444159 17876 154598 92883 2075234 13569
海 南 Hainan 4668 1822 93932 20599 28564 16274 432931 15249
重 庆 Chongqing 31854 12961 792401 25411 84637 45324 1133751 13393
四 川 Sichuan 61684 25614 1362725 22547 261354 138514 3828727 14719
贵 州 Guizhou 19481 8961 262344 13524 87594 49141 1022527 11740
云 南 Yunnan 24664 11228 341075 14121 122570 76597 1809563 14841
西 藏 Tibet 1364 627 43515 32233 11456 5558 287987 25075
陕 西 Shaanxi 63894 25335 1447135 22806 132371 70336 1448779 10972
甘 肃 Gansu 24496 9044 408572 17061 75089 40985 1025423 13739
青 海 Qinghai 5722 2528 97040 17040 21903 12972 367499 16830
宁 夏 Ningxia 6307 2450 118961 19159 25533 15184 353707 13919
新 疆 Xinjiang 23602 10653 390102 16527 104883 68358 1591027 15200
3-3 59 continued
卫生 社会保障业
Sanitation Social Security
年末人数 劳动报酬 平均劳动 年末人数 劳动报酬 平均劳动
地 区 Region (人) # 女 性
(千元) 报 酬 (人) # 女 性
(千元) 报 酬
Year-end Earnings (元) Year-end Earnings (元)
Figures Female Average Figures Female Average
(1 000 Earning (1 000 Earning
(person) yuan) (yuan) (person) yuan) (yuan)
National 4642980 2746284 74940795 16226 96221 41947 1475788 15541
北 京 Beijing 128896 87872 4351473 34355 1474 890 40156 27580

8/2/2019 China Labour Statistical Yearbook - 2004
http://slidepdf.com/reader/full/china-labour-statistical-yearbook-2004 234/464
天 津 Tianjin 63751 42063 1284494 20180 2297 1297 32761 19271
河 北 Hebei 209347 125929 2430289 11640 3832 1619 43677 11431
山 西 Shanxi 128505 79718 1391298 10862 4174 2025 44475 10707
内蒙古 Inner Mongolia 97451 57660 1301808 13354 3151 1183 35286 11339
辽 宁 Liaoning 206320 132067 2901807 13979 5781 2510 74700 13059
吉 林 Jilin 132389 81917 1542483 11691 2227 905 30326 13810
黑龙江 Heilongjiang 161926 101229 2107093 13004 4190 2033 54608 12274
上 海 Shanghai 133559 88915 3633527 27255 3983 1761 106755 27429
江 苏 Jiangsu 271787 155752 4952040 18272 8249 3436 158392 19389
浙 江 Zhejiang 216811 130769 6182550 29103 3420 1559 94361 28252
安 徽 Anhui 163693 88032 1897668 11707 1626 662 21839 13590
福 建 Fujian 107772 61661 1757897 16441 2475 1225 37642 15383
江 西 Jiangxi 123500 64978 1552877 12562 2081 928 23142 11311
山 东 Shandong 336618 193603 5005300 14955 6964 2641 103473 14964
河 南 Henan 305024 175484 3455046 11455 5628 2529 64855 11633
湖 北 Hubei 235186 135075 2825923 12058 5427 2345 63788 11728
湖 南 Hunan 221983 125917 3322277 15036 4112 1773 55034 13264
广 东 Guangdong 330711 203855 8206048 24983 5153 2155 135699 27080广 西 Guangxi 149945 90374 2019055 13605 2130 1084 26901 12847
海 南 Hainan 27657 15892 419755 15268 471 174 6551 14119
重 庆 Chongqing 81082 43763 1087707 13409 1774 745 24556 14064
四 川 Sichuan 251746 134094 3697645 14760 5113 2361 70622 13853
贵 州 Guizhou 85757 48312 1001218 11740 370 136 4541 12579
云 南 Yunnan 117714 74303 1749722 14937 2917 1409 35638 12518
西 藏 Tibet 11143 5406 283021 25338
陕 西 Shaanxi 123821 67883 1362478 11032 3527 936 35110 9960
甘 肃 Gansu 72357 39924 986889 13726 1053 404 14046 13339
青 海 Qinghai 21104 12672 354629 16861 370 154 6140 16595
宁 夏 Ningxia 24390 14663 338491 13942 559 216 7532 13522
新 疆 Xinjiang 101035 66502 1538287 15251 1693 852 23182 14050
3-3 60 continued
社会福利业 文化体育和娱乐业
Social Welfare Culture, Sports and Entertainment
年末人数 劳动报酬 平均劳动 年末人数 劳动报酬 平均劳动
地 区 Region (人) # 女 性
(千元) 报 酬 (人) # 女 性
(千元) 报 酬Year-end Earnings (元) Year-end Earnings (元)
Figures Female Average Figures Female Average
(1 000 Earning (1 000 Earning
(person) yuan) (yuan) (person) yuan) (yuan)
National 118718 56943 1791288 15107 1277504 518876 21787602 17098
北 京 Beijing 5913 3250 141674 23803 119183 51173 3940862 33112
天 津 Tianjin 2264 1045 38501 17219 21430 9579 414953 19222
河 北 Hebei 5464 2372 65254 11603 51210 22223 612080 11987
山 西 Shanxi 3217 1399 37847 11645 41415 17771 437717 10711
内蒙古 Inner Mongolia 2571 1124 35606 13774 31477 13656 427248 13597
辽 宁 Liaoning 7568 3388 95337 12616 55353 22734 845913 15145
吉 林 Jilin 4566 2103 52069 11394 44555 17292 513902 11512
黑龙江 Heilongjiang 4306 1903 51568 12456 37194 14908 503902 13810
上 海 Shanghai 5739 3502 109825 19001 48239 19377 1415349 29459
江 苏 Jiangsu 6963 3511 139350 19993 54105 21127 1042230 19170
浙 江 Zhejiang 3776 2182 76692 20364 45305 17689 1180705 26197
安 徽 Anhui 2758 1421 32352 11592 43268 16517 480055 11049
福 建 Fujian 2964 1604 45629 15426 30993 12423 522602 16930
江 西 Jiangxi 4313 1915 41302 9534 33073 12824 392056 11746

8/2/2019 China Labour Statistical Yearbook - 2004
http://slidepdf.com/reader/full/china-labour-statistical-yearbook-2004 235/464
山 东 Shandong 5560 2376 95206 17062 54620 21170 883930 16220
河 南 Henan 7332 3172 79851 11070 69984 28451 736760 10762
湖 北 Hubei 6862 3666 75292 10952 59399 20595 672943 11358
湖 南 Hunan 3621 1822 46206 12839 64680 27096 959995 14871
广 东 Guangdong 10137 5321 248288 24718 70121 30299 1805213 25915
广 西 Guangxi 2523 1425 29278 12019 29542 11700 375218 12659
海 南 Hainan 436 208 6625 15230 11925 4718 170968 14638
重 庆 Chongqing 1781 816 21488 12025 16621 6253 259108 15391
四 川 Sichuan 4495 2059 60460 13421 51066 20637 709811 13673
贵 州 Guizhou 1467 693 16768 11485 20118 8148 224459 11367
云 南 Yunnan 1939 885 24203 12457 39702 16569 524659 13122
西 藏 Tibet 313 152 4966 15765 5493 1928 141454 25988
陕 西 Shaanxi 5023 1517 51191 10199 49603 20443 546122 11061
甘 肃 Gansu 1679 657 24488 14576 38342 14148 469149 12416
青 海 Qinghai 429 146 6730 15507 5767 2356 86347 15022
宁 夏 Ningxia 584 305 7684 13317 7932 3448 109026 13794
新 疆 Xinjiang 2155 1004 29558 13684 25789 11624 382866 14898
3-3 61 continued
新闻出版业 广播、电影、电视和音像业
Broadcasting, Movies, Television and
Journalism and Publishing Activities Audiovisual Activities
年末人数 劳动报酬 平均劳动 年末人数 劳动报酬 平均
地 区 Region (人) # 女 性
(千元) 报 酬 (人) # 女 性
(千元) 报
Year-end Earnings (元) Year-end Earnings (元
Figures Female Average Figures Female Avera
(1 000 Earning (1 000 Earni
(person) yuan) (yuan) (person) yuan) (yua
National 232307 90033 6015470 26102 487682 186508 7306992
北 京 Beijing 52176 22838 1986779 38373 20424 8343 766476
天 津 Tianjin 3460 1377 101134 28707 7306 3893 121758
河 北 Hebei 7139 2839 151312 20805 20384 9075 217987
山 西 Shanxi 6375 2644 98162 15566 14200 5871 131512
内蒙古 Inner Mongolia 4947 2022 68912 14127 11557 4608 154290
辽 宁 Liaoning 14084 5653 257537 18406 16368 5884 263456
吉 林 Jilin 9491 4126 138533 14486 16398 5362 168804黑龙江 Heilongjiang 6559 2803 128958 19676 12820 4939 150333
上 海 Shanghai 8465 3355 378475 45512 12672 4623 406776
江 苏 Jiangsu 8734 2885 246785 28314 20962 8111 384026
浙 江 Zhejiang 10114 3488 383650 38585 16382 5712 397319
安 徽 Anhui 3623 1253 56526 15533 25496 9369 268101
福 建 Fujian 4026 1371 110099 27789 11878 4335 180494
江 西 Jiangxi 3483 1221 50220 14279 16307 5872 205243
山 东 Shandong 10770 3901 245614 22993 18600 6418 266939
河 南 Henan 11977 3653 189323 16502 28559 11966 262072
湖 北 Hubei 11742 3498 148773 12997 24707 7580 278929
湖 南 Hunan 6877 2379 170079 24796 40782 17357 604296
广 东 Guangdong 13880 5416 500423 36959 15186 5551 377290
广 西 Guangxi 5083 1799 86295 16861 8724 3000 80545
海 南 Hainan 2679 1108 63478 23320 4736 1608 57690
重 庆 Chongqing 1826 706 31054 17271 6257 2056 90013
四 川 Sichuan 7089 2857 142837 19974 22884 8798 300703
贵 州 Guizhou 2106 819 31476 15096 11953 4576 126669
云 南 Yunnan 3064 966 45509 14843 17553 6374 236726
西 藏 Tibet 619 237 18498 30374 2532 816 66351

8/2/2019 China Labour Statistical Yearbook - 2004
http://slidepdf.com/reader/full/china-labour-statistical-yearbook-2004 236/464
陕 西 Shaanxi 3050 1212 36770 12008 22200 9090 222805
甘 肃 Gansu 2648 1021 38785 14564 23435 8154 290673
青 海 Qinghai 573 198 9740 16153 2100 758 29605
宁 夏 Ningxia 1221 509 18837 15964 2922 1183 40005
新 疆 Xinjiang 4427 1879 80897 18200 11398 5226 159106
3-3 62 continued
文化艺术业 体育
Culture and Art Sports Activities
年末人数 劳动报酬 平均劳动 年末人数 劳动报酬 平均劳动
地 区 Region (人) # 女 性
(千元) 报 酬 (人) # 女 性
(千元) 报 酬
Year-end Earnings (元) Year-end Earnings (元)
Figures Female Average Figures Female Average
(1 000 Earning (1 000 Earning
(person) yuan) (yuan) (person) yuan) (yuan)
National 399620 178349 5873566 14759 86668 30721 1638752 18934
北 京 Beijing 27345 12024 739884 27416 8431 3169 258782 30122
天 津 Tianjin 6542 2859 117070 17727 2504 787 52745 20864
河 北 Hebei 15923 7132 164423 10324 2996 1094 41588 13407
山 西 Shanxi 17967 8257 170238 9567 2613 872 35890 13783
内蒙古 Inner Mongolia 12883 6298 172124 13361 1651 495 28350 17266
辽 宁 Liaoning 17902 8511 223610 12526 4306 1441 70627 16540
吉 林 Jilin 13398 6179 145682 10891 3763 1194 46808 12536
黑龙江 Heilongjiang 13489 5922 164547 12768 3318 768 46180 14036
上 海 Shanghai 14519 6073 358069 24524 8521 3395 200262 23544
江 苏 Jiangsu 18788 7955 319013 16978 2679 844 50932 19047
浙 江 Zhejiang 14547 6848 315709 21791 2886 1037 67416 23564
安 徽 Anhui 11331 4802 126750 11208 1994 683 21891 11107
福 建 Fujian 8505 3776 123636 14411 2478 839 52557 21209
江 西 Jiangxi 10928 4860 110594 10044 1804 641 20940 11698
山 东 Shandong 19563 8663 279525 14432 4266 1487 69349 16310
河 南 Henan 25532 11268 241276 9574 2096 718 27578 13336
湖 北 Hubei 18053 7668 185406 10235 3280 1163 40395 12399
湖 南 Hunan 13468 5967 143529 10690 2389 855 29368 12470
广 东 Guangdong 19226 8931 449959 23472 9416 3825 274999 29421
广 西 Guangxi 11318 5097 145736 12924 2231 727 38728 17343海 南 Hainan 2079 886 29781 14141 254 80 3601 14233
重 庆 Chongqing 7797 3197 130924 16805 257 81 3189 12409
四 川 Sichuan 17175 7373 209660 12263 2353 985 32964 13792
贵 州 Guizhou 5284 2416 58567 11115 406 150 4440 10963
云 南 Yunnan 12570 6012 169007 13307 2382 893 28419 12340
西 藏 Tibet 1990 784 48981 24614 352 91 7624 21659
陕 西 Shaanxi 18936 8174 224315 11894 3523 1199 38500 10857
甘 肃 Gansu 8762 3726 108118 12366 1614 563 17915 11346
青 海 Qinghai 2246 1104 33912 15146 524 174 7429 14150
宁 夏 Ningxia 3127 1516 41232 13211 602 232 8394 13967
新 疆 Xinjiang 8427 4071 122289 14541 779 239 10892 13893

8/2/2019 China Labour Statistical Yearbook - 2004
http://slidepdf.com/reader/full/china-labour-statistical-yearbook-2004 237/464
3-3 63 continued
娱乐业 公共管理和社会组织
Entertainment Public Management & Social Organization
年末人数 劳动报酬 平均劳动 年末人数 劳动报酬 平均劳动
地 区 Region (人) # 女 性
(千元) 报 酬 (人) # 女 性
(千元) 报 酬
Year-end Earnings (元) Year-end Earnings (元)
Figures Female Average Figures Female Average
(1 000 Earning (1 000 Earning
(person) yuan) (yuan) (person) yuan) (yuan)
National 71227 33265 952822 13336 11709591 3081150 178756270 15355
北 京 Beijing 10807 4799 188941 16870 269554 90490 7806129 29282
天 津 Tianjin 1618 663 22246 13783 131652 35131 2539201 19879
河 北 Hebei 4768 2083 36770 8018 663857 182757 7876046 11902
山 西 Shanxi 260 127 1915 7539 408392 112447 4540872 11167
内蒙古 Inner Mongolia 439 233 3572 8211 296498 84867 4053878 13761
辽 宁 Liaoning 2693 1245 30683 10857 449111 120024 6511011 14486
吉 林
Jilin 1505 431 14075 9440 278931 73997 3349607 12125黑龙江 Heilongjiang 1008 476 13884 13760 380858 103518 5327986 13951
上 海 Shanghai 4062 1931 71767 17449 171241 54264 4775203 28035
江 苏 Jiangsu 2942 1332 41474 13908 517396 108846 10890180 21050
浙 江 Zhejiang 1376 604 16611 12205 383917 88693 11095229 29117
安 徽 Anhui 824 410 6787 8421 421199 99050 5343972 12696
福 建 Fujian 4106 2102 55816 13940 286717 63823 4696491 16426
江 西 Jiangxi 551 230 5059 8970 367291 88886 4141802 11367
山 东 Shandong 1421 701 22503 14260 854199 210078 11629635 13693
河 南 Henan 1820 846 16511 9307 922977 258711 9995414 10973
湖 北 Hubei 1617 686 19440 12022 532676 134822 6673575 12483
湖 南 Hunan 1164 538 12723 10884 609081 156747 7759971 12741
广 东 Guangdong 12413 6576 202542 16331 739221 186234 18660633 25561
广 西 Guangxi 2186 1077 23914 10614 321916 87761 4380807 13678
海 南 Hainan 2177 1036 16418 8502 82225 22008 1199602 14598
重 庆 Chongqing 484 213 3928 8133 194531 50702 2689488 13952
四 川 Sichuan 1565 624 23647 14807 620197 173705 8767588 14380
贵 州 Guizhou 369 187 3307 9110 290316 76748 3262313 11266
云 南 Yunnan 4133 2324 44998 10457 369797 100204 4759752 13006
西 藏 Tibet 61574 17472 1702105 27738
陕 西 Shaanxi 1894 768 23732 12800 409116 103570 4450895 10891
甘 肃 Gansu 1883 684 13658 8130 262999 66788 3542347 13537
青 海 Qinghai 324 122 5661 17746 66824 20363 1121062 16741
宁 夏 Ningxia 60 8 558 9300 70151 20260 937049 13474
新 疆 Xinjiang 758 209 9682 11793 275177 88184 4276427 15592
3-3 64 continued
中国共产党机关 国家机构
Chinese Communist Party Organs Organ of State
年末人数 劳动报酬 平均劳动 年末人数 劳动报酬 平均劳动
地 区 Region (人) # 女 性
(千元) 报 酬 (人) # 女 性
(千元) 报 酬
Year-end Earnings (元) Year-end Earnings (元)
Figures Female Average Figures Female Average
(1 000 Earning (1 000 Earning
(person) yuan) (yuan) (person) yuan) (yuan)
National 472161 105581 7213508 15396 10831858 2826336 165272582 15336
北 京 Beijing 8157 2390 219615 27046 243129 80625 7068355 29388
天 津 Tianjin 3524 809 65342 18637 124683 32634 2417217 20007

8/2/2019 China Labour Statistical Yearbook - 2004
http://slidepdf.com/reader/full/china-labour-statistical-yearbook-2004 238/464
河 北 Hebei 29264 5931 357067 12237 612360 167941 7226234 11839
山 西 Shanxi 16981 3889 204527 12018 383118 105181 4241763 11123
内蒙古 Inner Mongolia 15540 3760 229756 14866 269401 78171 3636486 13580
辽 宁 Liaoning 17891 3863 274835 15336 419799 111594 6064179 14440
吉 林 Jilin 12152 3046 147082 12601 246167 64073 2979480 12184
黑龙江 Heilongjiang 13657 3129 196290 14585 355308 95929 4970754 13944
上 海 Shanghai 2219 635 64262 29104 161800 49869 4552671 28334
江 苏 Jiangsu 13712 2266 297120 21730 477201 101872 10159596 21379
浙 江 Zhejiang 13985 2957 392830 28219 359922 81968 10438787 29239
安 徽 Anhui 17217 3209 229842 13368 396429 93437 4948838 12492
福 建 Fujian 10778 2233 169865 15856 267049 58609 4371070 16411
江 西 Jiangxi 15847 3295 177768 12304 334613 79637 3772335 11296
山 东 Shandong 28939 4503 434155 15053 812018 201388 10983546 13606
河 南 Henan 35681 6645 428579 12182 861050 241980 9221206 10853
湖 北 Hubei 12646 2319 168165 13307 504065 126117 6327995 12505
湖 南 Hunan 22065 5008 274036 12375 565688 144237 7202422 12745
广 东 Guangdong 22965 5389 614387 26827 678756 163356 17305871 25842
广 西 Guangxi 13273 3388 189108 14255 299497 80078 4083144 13695海 南 Hainan 4028 846 62729 15593 75671 20347 1100343 14548
重 庆 Chongqing 6385 1443 92094 14609 178717 45102 2503058 14139
四 川 Sichuan 33080 7896 460796 13998 559450 154244 7905652 14140
贵 州 Guizhou 13437 3002 147546 11025 266477 70164 2987468 11238
云 南 Yunnan 18223 4745 257947 14383 340849 92198 4360751 12922
西 藏 Tibet 5152 1359 158011 30892 53999 15073 1468274 27278
陕 西 Shaanxi 19337 3686 237061 12328 375991 95383 4064612 10832
甘 肃 Gansu 21320 7291 252137 11828 233178 57100 3181562 13718
青 海 Qinghai 4724 1256 93448 19036 57684 17575 953721 16549
宁 夏 Ningxia 3366 798 51446 15348 63917 18424 844523 13332
新 疆 Xinjiang 16616 4595 265662 16011 253872 82030 3930669 15538
3-3 65 continued
人民政协和民主党派 群众社团、社会团体和宗教组织
People's Political Consultative Conference Mass communities, social communities
and democratic parties and religion organizations
年末人数 劳动报酬 平均劳动 年末人数 劳动报酬 平均劳动
地 区 Region (人) # 女 性
(千元) 报 酬 (人) # 女 性
(千元) 报 酬 Year-end Earnings (元) Year-end Earnings (元)
Figures Female Average Figures Female Average
(1 000 Earning (1 000 Earning
(person) yuan) (yuan) (person) yuan) (yuan)
National 86513 20233 1476930 17159 189120 74747 3231659 17112
北 京 Beijing 1864 720 57410 30602 16404 6755 460749 28677
天 津 Tianjin 860 229 18712 21783 2585 1459 37930 14863
河 北 Hebei 4435 1043 67072 15226 7333 2774 98576 13498
山 西 Shanxi 1968 521 22874 11647 6325 2856 71708 11375
内蒙古 Inner Mongolia 3000 743 49761 16620 8397 2193 137531 16443
辽 宁 Liaoning 3066 733 51601 16781 6870 2680 109068 15490
吉 林 Jilin 1911 533 25823 13656 4621 1799 59444 13022
黑龙江 Heilongjiang 2701 680 44900 16556 4625 1952 71116 15426
上 海 Shanghai 889 318 27196 30626 3799 1729 96928 24384
江 苏 Jiangsu 2538 578 63908 25270 6815 2411 155235 22785
浙 江 Zhejiang 2201 487 66821 30456 6785 2591 184562 26675
安 徽 Anhui 2253 475 35169 15575 4985 1824 124922 25024
福 建 Fujian 2089 520 40242 19544 6801 2461 115314 16970
江 西 Jiangxi 4569 1126 64052 14209 7994 2951 83830 10541

8/2/2019 China Labour Statistical Yearbook - 2004
http://slidepdf.com/reader/full/china-labour-statistical-yearbook-2004 239/464
山 东 Shandong 4083 630 70875 17457 8046 2740 132764 16542
河 南 Henan 4723 888 68985 14725 11155 4492 133807 12165
湖 北 Hubei 2786 530 41027 14790 8958 3195 102962 11455
湖 南 Hunan 5044 1029 72330 14423 6682 2602 85023 12791
广 东 Guangdong 2631 787 94533 35876 9865 4374 284555 28909
广 西 Guangxi 1977 503 32060 16258 6441 3177 71702 11612
海 南 Hainan 446 83 7134 16214 2080 732 29396 14133
重 庆 Chongqing 918 236 14067 15324 2419 929 33939 14077
四 川 Sichuan 5891 1519 91191 15591 9984 4287 147014 14765
贵 州 Guizhou 5424 1505 70402 13059 3681 1505 42837 11653
云 南 Yunnan 4180 1020 62186 15268 5126 1966 71071 13999
西 藏 Tibet 877 246 27734 31588 1546 794 48086 31164
陕 西 Shaanxi 5204 926 59035 11349 7619 3207 80648 10041
甘 肃 Gansu 3558 618 49130 13863 4290 1503 53463 12556
青 海 Qinghai 1362 316 26609 19310 3010 1213 46514 15463
宁 夏 Ningxia 1012 215 16516 16683 1243 513 18444 14922
新 疆 Xinjiang 2053 476 37575 18276 2636 1083 42521 16100
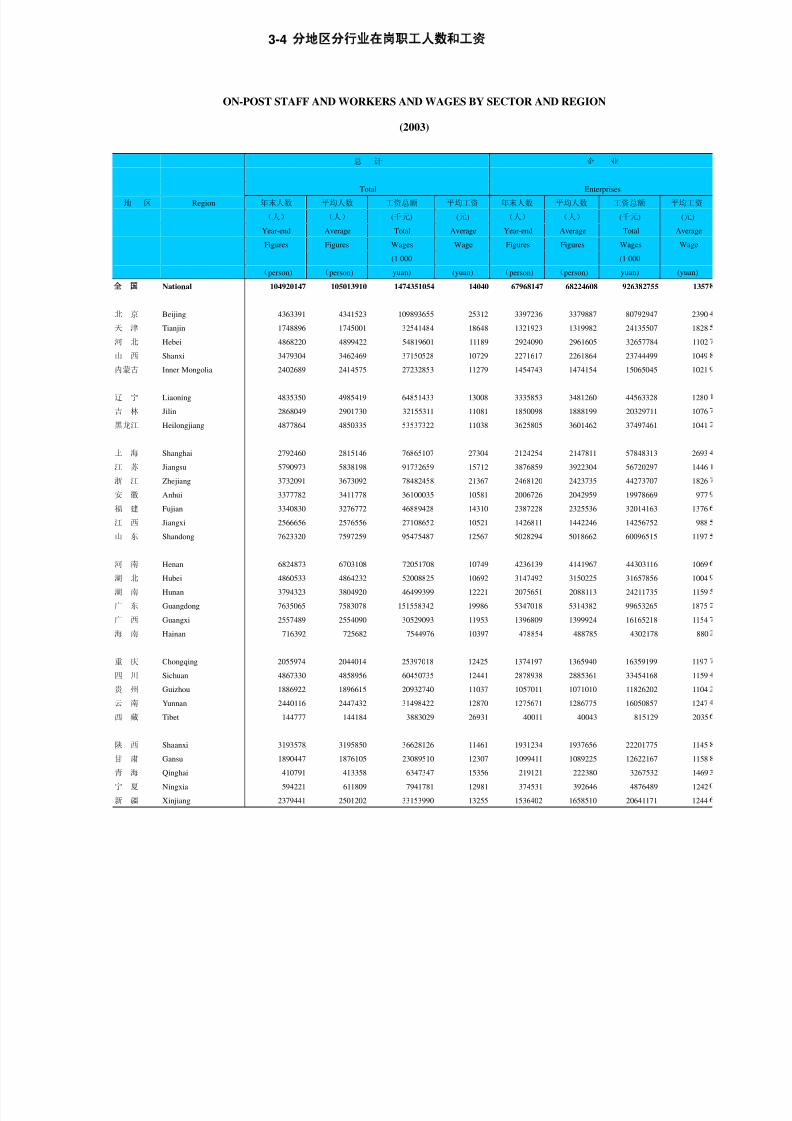
8/2/2019 China Labour Statistical Yearbook - 2004
http://slidepdf.com/reader/full/china-labour-statistical-yearbook-2004 240/464
3-4
ON-POST STAFF AND WORKERS AND WAGES BY SECTOR AND REGION
(2003)
总 计 企 业
Total Enterprises
地 区 Region 年末人数 平均人数 工资总额 平均工资 年末人数 平均人数 工资总额 平均工资
(人) (人) (千元) (元) (人) (人) (千元) (元)
Year-end Average Total Average Year-end Average Total Average
Figures Figures Wages Wage Figures Figures Wages Wage
(1 000 (1 000
(person) (person) yuan) (yuan) (person) (person) yuan) (yuan)
National 104920147 105013910 1474351054 14040 67968147 68224608 926382755 1357
北 京 Beijing 4363391 4341523 109893655 25312 3397236 3379887 80792947 2390
天 津 Tianjin 1748896 1745001 32541484 18648 1321923 1319982 24135507 1828
河 北 Hebei 4868220 4899422 54819601 11189 2924090 2961605 32657784 1102
山 西 Shanxi 3479304 3462469 37150528 10729 2271617 2261864 23744499 1049
内蒙古 Inner Mongolia 2402689 2414575 27232853 11279 1454743 1474154 15065045 1021
辽 宁 Liaoning 4835350 4985419 64851433 13008 3335853 3481260 44563328 1280
吉 林 Jilin 2868049 2901730 32155311 11081 1850098 1888199 20329711 1076
黑龙江 Heilongjiang 4877864 4850335 53537322 11038 3625805 3601462 37497461 1041
上 海 Shanghai 2792460 2815146 76865107 27304 2124254 2147811 57848313 2693
江 苏 Jiangsu 5790973 5838198 91732659 15712 3876859 3922304 56720297 1446
浙 江 Zhejiang 3732091 3673092 78482458 21367 2468120 2423735 44273707 1826
安 徽 Anhui 3377782 3411778 36100035 10581 2006726 2042959 19978669 977
福 建 Fujian 3340830 3276772 46889428 14310 2387228 2325536 32014163 1376
江 西 Jiangxi 2566656 2576556 27108652 10521 1426811 1442246 14256752 988
山 东 Shandong 7623320 7597259 95475487 12567 5028294 5018662 60096515 1197
河 南 Henan 6824873 6703108 72051708 10749 4236139 4141967 44303116 1069
湖 北 Hubei 4860533 4864232 52008825 10692 3147492 3150225 31657856 1004
湖 南 Hunan 3794323 3804920 46499399 12221 2075651 2088113 24211735 1159
广 东 Guangdong 7635065 7583078 151558342 19986 5347018 5314382 99653265 1875
广 西 Guangxi 2557489 2554090 30529093 11953 1396809 1399924 16165218 1154
海 南 Hainan 716392 725682 7544976 10397 478854 488785 4302178 880
重 庆 Chongqing 2055974 2044014 25397018 12425 1374197 1365940 16359199 1197
四 川 Sichuan 4867330 4858956 60450735 12441 2878938 2885361 33454168 1159
贵 州 Guizhou 1886922 1896615 20932740 11037 1057011 1071010 11826202 1104
云 南 Yunnan 2440116 2447432 31498422 12870 1275671 1286775 16050857 1247
西 藏 Tibet 144777 144184 3883029 26931 40011 40043 815129 2035
陕 西 Shaanxi 3193578 3195850 36628126 11461 1931234 1937656 22201775 1145
甘 肃 Gansu 1890447 1876105 23089510 12307 1099411 1089225 12622167 1158
青 海 Qinghai 410791 413358 6347347 15356 219121 222380 3267532 1469
宁 夏 Ningxia 594221 611809 7941781 12981 374531 392646 4876489 1242新 疆 Xinjiang 2379441 2501202 33153990 13255 1536402 1658510 20641171 1244

8/2/2019 China Labour Statistical Yearbook - 2004
http://slidepdf.com/reader/full/china-labour-statistical-yearbook-2004 241/464
3-4 1 continued
非农企业 事 业
Nonagricultural Enterprises Institutions
地 区 Region 年末人数 平均人数 工资总额 平均工资 年末人数 平均人数 工资总额 平均工资
(人) (人) (千元) (元) (人) (人) (千元) (元)
Year-end Average Total Average Year-end Average Total Average
Figures Figures Wages Wage Figures Figures Wages Wage
(1 000 (1 000
(person) (person) yuan) (yuan) (person) (person) yuan) (yuan)
National 63371312 63595103 923388021 14520 26436846 26324105 383380348 14564
北 京 Beijing 3369527 3351902 80792365 24103 736987 734478 22129773 30130
天 津 Tianjin 1312368 1310239 24135507 18421 316255 317316 6086752 19182
河 北 Hebei 2833327 2870692 32572836 11347 1370837 1366009 15254363 11167
山 西 Shanxi 2231190 2221822 23732932 10682 824986 819145 9079758 11084
内蒙古 Inner Mongolia 1131712 1151705 14961651 12991 673209 666908 8374621 12557
辽 宁 Liaoning 3070251 3212821 44465977 13840 1118355 1121476 14605208 13023
吉 林 Jilin 1642206 1677090 20247202 12073 784446 783322 8971222 11453
黑龙江 Heilongjiang 2874816 2871236 37437935 13039 912089 909071 11297942 12428
上 海 Shanghai 2113787 2136947 57848313 27071 528687 528195 14587325 27617
江 苏 Jiangsu 3699552 3741801 56695931 15152 1489361 1492200 25392495 17017
浙 江 Zhejiang 2441958 2397235 44223880 18448 912797 900407 23740866 26367
安 徽 Anhui 1889718 1925375 19924798 10349 1013765 1011469 11438169 11308
福 建 Fujian 2314085 2251805 31989988 14206 670853 669144 10184931 15221
江 西 Jiangxi 1266102 1280137 14023432 10955 807024 803788 8908324 11083
山 东 Shandong 4935746 4925440 59593677 12099 1842566 1829765 25038347 13684
河 南 Henan 4141500 4048163 44091785 10892 1745879 1728168 18559557 10739
湖 北 Hubei 2852752 2857434 31601433 11059 1233967 1233113 14170977 11492
湖 南 Hunan 1904441 1917708 24007814 12519 1177195 1175893 15345982 13050
广 东 Guangdong 5217890 5183935 99542369 19202 1598926 1588155 34118627 21483
广 西 Guangxi 1265648 1267326 15870462 12523 893185 888159 10599442 11934
海 南 Hainan 276793 283931 4298220 15138 162194 161631 2106991 13036
重 庆 Chongqing 1349640 1341090 16358568 12198 508269 506058 6551291 12946
四 川 Sichuan 2768538 2773271 33366860 12032 1425065 1410857 18934052 13420
贵 州 Guizhou 1015339 1028919 11799504 11468 534197 530723 5743213 10821
云 南 Yunnan 1116474 1125917 15804892 14037 800950 799816 10757394 13450
西 藏 Tibet 37055 37134 805786 21699 51950 51577 1433068 27785
陕 西 Shaanxi 1866840 1873272 21967382 11727 886908 884622 10197360 11527
甘 肃 Gansu 1014705 1005033 12531196 12468 553901 550697 7193943 13063
青 海 Qinghai 196981 200267 3234015 16149 127700 126775 2006821 15830
宁 夏 Ningxia 330548 347902 4876489 14017 157050 157096 2205113 14037
新 疆 Xinjiang 889823 977554 20584822 21057 577293 578072 8366421 14473
3-4 2 continued
机 关 农、林、牧、渔业
Agriculture,Forestry,Farming of Animals
Agencies and Organizations and Fishing
地 区 Region 年末人数 平均人数 工资总额 平均工资 年末人数 平均人数 工资总额 平均工资
(人) (人) (千元) (元) (人) (人) (千元) (元)
Year-end Average Total Average Year-end Average Total Average
Figures Figures Wages Wage Figures Figures Wages Wage
(1 000 (1 000
(person) (person) yuan) (yuan) (person) (person) yuan) (yuan)

8/2/2019 China Labour Statistical Yearbook - 2004
http://slidepdf.com/reader/full/china-labour-statistical-yearbook-2004 242/464
National 10500945 10451951 164468685 15736 4596835 4629505 32262870 6969
北 京 Beijing 229168 227158 6970935 30688 27709 27985 419227 14980
天 津 Tianjin 110718 107703 2319225 21534 9555 9743 130038 13347
河 北 Hebei 573293 571808 6907454 12080 90763 90913 441523 4857
山 西 Shanxi 382701 381460 4326271 11341 40427 40042 311812 7787
内蒙古 Inner Mongolia 274737 273513 3793187 13868 323031 322449 2202915 6832
辽 宁 Liaoning 381142 382683 5682897 14850 265602 268439 1331570 4960
吉 林 Jilin 231714 229339 2811625 12260 207892 211109 1163682 5512
黑龙江 Heilongjiang 339970 339802 4741919 13955 750989 730226 3923806 5373
上 海 Shanghai 139519 139140 4429469 31835 10467 10864 203221 18706
江 苏 Jiangsu 424753 423694 9619867 22705 177307 180503 1347934 7468
浙 江 Zhejiang 351174 348950 10467885 29998 26162 26500 439439 16583
安 徽 Anhui 357291 357350 4683197 13105 117008 117584 703796 5985
福 建 Fujian 282749 282092 4690334 16627 73143 73731 587960 7974
江 西 Jiangxi 332821 330522 3943576 11931 160709 162109 897084 5534
山 东 Shandong 752460 748832 10340625 13809 92548 93222 805728 8643
河 南 Henan 842855 832973 9189035 11032 94639 93804 577372 6155湖 北 Hubei 477596 479417 6168884 12867 294740 292791 1563370 5340
湖 南 Hunan 541214 540660 6939598 12835 171210 170405 912810 5357
广 东 Guangdong 689121 680541 17786450 26136 129128 130447 1173649 8997
广 西 Guangxi 267388 265900 3763412 14153 131161 132598 901116 6796
海 南 Hainan 75344 75266 1135807 15091 202061 204854 975550 4762
重 庆 Chongqing 173508 172016 2486528 14455 24557 24850 220595 8877
四 川 Sichuan 563327 562738 8062515 14327 110400 112090 1007465 8988
贵 州 Guizhou 295714 294882 3363325 11406 41672 42091 360426 8563
云 南 Yunnan 352967 350348 4628319 13211 159197 160858 1576868 9803
西 藏 Tibet 52816 52564 1634832 31102 2956 2909 55599 19113
陕 西 Shaanxi 375436 373572 4228991 11320 64394 64384 529852 8230
甘 肃 Gansu 237135 236183 3273400 13860 84706 84192 755274 8971
青 海 Qinghai 63970 64203 1072994 16713 22140 22113 239614 10836
宁 夏 Ningxia 62640 62067 860179 13859 43983 44744 371255 8297
新 疆 Xinjiang 265704 264575 4145950 15670 646579 680956 6132320 9005
3-4 3 continued
采矿业 制 造 业
Mining Manufacturing
地 区 Region 年末人数 平均人数 工资总额 平均工资 年末人数 平均人数 工资总额 平均工资
(人) (人) (千元) (元) (人) (人) (千元) (元)
Year-end Average Total Average Year-end Average Total Average
Figures Figures Wages Wage Figures Figures Wages Wage
(1 000 (1 000
(person) (person) yuan) (yuan) (person) (person) yuan) (yuan)
National 4809842 4791259 65555680 13682 28989435 28980273 362139867 12496
北 京 Beijing 24368 24851 468637 18858 952371 966817 19393586 20059
天 津 Tianjin 63354 63450 1497748 23605 724993 721589 11674891 16179
河 北 Hebei 280725 283390 3983673 14057 1250547 1263017 12806175 10139
山 西 Shanxi 563805 556303 7160362 12871 749967 750418 6711589 8944
内蒙古 Inner Mongolia 166054 152727 1490571 9760 446680 443202 4454280 10050
辽 宁 Liaoning 305033 308674 4246054 13756 1474963 1545983 18870395 12206
吉 林 Jilin 149153 156477 1855632 11859 729478 739150 8226362 11129
黑龙江 Heilongjiang 386130 359366 4839393 13466 1103649 1099676 11065502 10063
上 海 Shanghai 246 239 10563 44197 1069564 1083114 27594550 25477
江 苏 Jiangsu 164677 165799 2409017 14530 2168293 2179203 29444719 13512

8/2/2019 China Labour Statistical Yearbook - 2004
http://slidepdf.com/reader/full/china-labour-statistical-yearbook-2004 243/464
浙 江 Zhejiang 17029 17419 243769 13994 1090197 1059757 15119428 14267
安 徽 Anhui 292542 305528 3879843 12699 773217 782910 7594891 9701
福 建 Fujian 35003 35467 385111 10858 1521396 1469102 17948183 12217
江 西 Jiangxi 96048 98468 927707 9421 591627 595310 5730615 9626
山 东 Shandong 603181 605535 10779524 17802 2700786 2679032 26791212 10000
河 南 Henan 479737 471456 6760178 14339 1575270 1540227 14709714 9550
湖 北 Hubei 108429 107671 1244288 11556 1467178 1476059 14974006 10145
湖 南 Hunan 116692 116968 1074804 9189 773537 785521 8886195 11312
广 东 Guangdong 40085 40886 529935 12961 2815680 2766475 43609232 15763
广 西 Guangxi 46140 46757 508003 10865 556436 553436 6174130 11156
海 南 Hainan 11414 11761 97194 8264 67490 70518 700194 9929
重 庆 Chongqing 69874 73586 715610 9725 540916 541881 6439088 11883
四 川 Sichuan 189096 190225 2018939 10613 1174361 1179727 13180023 11172
贵 州 Guizhou 88160 87149 1007089 11556 412028 423942 4362928 10291
云 南 Yunnan 57541 60206 653903 10861 460716 472535 5975075 12645
西 藏 Tibet 787 793 12913 16284 6999 6927 82540 11916
陕 西 Shaanxi 169306 166333 2084819 12534 867615 873881 8984763 10281
甘 肃 Gansu 74910 74534 909714 12205 473685 457200 5319339 11635青 海 Qinghai 18585 18579 277382 14930 67176 66553 811499 12193
宁 夏 Ningxia 61385 60264 878200 14573 116733 119902 1249830 10424
新 疆 Xinjiang 130353 130398 2605105 19978 265887 267209 3254933 12181
3-4 4 continued
电力、燃气及水的生产和供应业 建 筑 业
Production and Distribution of
Electricity,Gas and Water Construction
地 区 Region 年末人数 平均人数 工资总额 平均工资 年末人数 平均人数 工资总额 平均工资
(人) (人) (千元) (元) (人) (人) (千元) (元)
Year-end Average Total Average Year-end Average Total Average
Figures Figures Wages Wage Figures Figures Wages Wage
(1 000 (1 000
(person) (person) yuan) (yuan) (person) (person) yuan) (yuan)
National 2922678 2920071 54757023 18752 7735148 7885815 90515456 11478
北 京 Beijing 37219 38488 1428359 37112 590163 588549 9846600 16730
天 津 Tianjin 34472 34279 894161 26085 91139 95139 1865609 19609
河 北 Hebei 158225 157319 2766042 17582 303380 317900 2892187 9098山 西 Shanxi 113636 112922 1407873 12468 201882 200854 1841564 9169
内蒙古 Inner Mongolia 88666 88579 1589305 17942 125914 161529 1340144 8297
辽 宁 Liaoning 168346 168583 3128649 18559 298250 337584 3260986 9660
吉 林 Jilin 81066 79529 1209320 15206 161331 174385 1519932 8716
黑龙江 Heilongjiang 154288 155142 2436029 15702 389542 395056 4203916 10641
上 海 Shanghai 54903 55467 1793254 32330 120548 124080 3051265 24591
江 苏 Jiangsu 125286 126322 3157993 25000 242598 249803 3289111 13167
浙 江 Zhejiang 88274 88294 3066712 34733 484638 475762 7603676 15982
安 徽 Anhui 85230 85435 1158793 13563 253205 251058 2141657 8531
福 建 Fujian 78074 77757 1598876 20562 244868 234170 3226567 13779
江 西 Jiangxi 89922 90427 1149074 12707 164029 162686 1499899 9220
山 东 Shandong 203755 201822 3568433 17681 375030 378023 3790923 10028
河 南 Henan 228785 225623 3287299 14570 568320 543799 5095472 9370
湖 北 Hubei 125612 125494 1787953 14247 276118 276331 2742912 9926
湖 南 Hunan 112215 112453 1689255 15022 252757 243527 2271499 9328
广 东 Guangdong 194728 197488 5643091 28574 523801 530135 7744141 14608
广 西 Guangxi 80672 80391 1412538 17571 146897 148655 1576354 10604
海 南 Hainan 18625 18784 299183 15928 42812 44244 406615 9190

8/2/2019 China Labour Statistical Yearbook - 2004
http://slidepdf.com/reader/full/china-labour-statistical-yearbook-2004 244/464
重 庆 Chongqing 57741 58076 950800 16372 307086 293366 2941740 10028
四 川 Sichuan 153298 152744 2337491 15303 670149 658441 6093825 9255
贵 州 Guizhou 58190 58212 1094443 18801 171893 170954 1528629 8942
云 南 Yunnan 68893 68378 1264323 18490 168880 154610 1619537 10475
西 藏 Tibet 5940 5929 136915 23092 4193 4267 75976 17805
陕 西 Shaanxi 82892 81685 1324800 16218 191809 194215 1927820 9926
甘 肃 Gansu 70201 69802 1224628 17544 144776 153539 1428419 9303
青 海 Qinghai 17115 17206 367586 21364 26828 28857 308593 10694
宁 夏 Ningxia 31280 31820 598007 18793 38502 54534 594038 10893
新 疆 Xinjiang 55129 55621 985838 17724 153810 239763 2785850 11619
3-4 5 continued
交通运输、仓储和邮政业 信息传输、计算机服务和软件业
Information Transfer, Computer Services
Traffic,Transport,Storage and Post and Software
地 区 Region 年末人数 平均人数 工资总额 平均工资 年末人数 平均人数 工资总额 平均工资
(人) (人) (千元) (元) (人) (人) (千元) (元)
Year-end Average Total Average Year-end Average Total Average
Figures Figures Wages Wage Figures Figures Wages Wage
(1 000 (1 000
(person) (person) yuan) (yuan) (person) (person) yuan) (yuan)
National 6097376 6139640 98065404 15973 1039702 1027399 33127649 32244
北 京 Beijing 284472 282010 5633616 19977 156261 151941 8054432 53010
天 津 Tianjin 121765 123235 2926585 23748 14562 14290 482787 33785
河 北 Hebei 265436 266534 3405567 12777 34681 34925 820537 23494
山 西 Shanxi 214681 213825 2970897 13894 25057 24806 445348 17953
内蒙古 Inner Mongolia 160529 162436 2209793 13604 24481 24002 416854 17367
辽 宁 Liaoning 330796 342220 5026663 14688 43301 42742 1516731 35486
吉 林 Jilin 251930 255133 2783278 10909 25030 24502 533572 21777
黑龙江 Heilongjiang 319003 323038 4129609 12784 38013 39065 1028113 26318
上 海 Shanghai 291637 295331 7649888 25903 30762 30195 1896890 62821
江 苏 Jiangsu 330755 335535 5714455 17031 50706 48894 1590671 32533
浙 江 Zhejiang 187203 187293 4254880 22718 42199 41653 1843704 44263
安 徽 Anhui 164519 166918 1581260 9473 22961 22664 434202 19158
福 建 Fujian 135585 136065 2473750 18181 29688 29533 979247 33158
江 西 Jiangxi 151453 152581 2137884 14011 20734 20629 347197 16831山 东 Shandong 304263 304695 4912923 16124 51821 50446 1244007 24660
河 南 Henan 323308 320567 4024961 12556 43846 42171 817130 19377
湖 北 Hubei 310790 315092 3726464 11827 34847 34727 573586 16517
湖 南 Hunan 238720 241633 3036070 12565 42645 42278 903088 21361
广 东 Guangdong 426136 424090 10999346 25936 107483 108453 4659769 42966
广 西 Guangxi 160576 159194 2228495 13999 23165 23203 551843 23783
海 南 Hainan 34859 34934 543965 15571 6220 6377 177907 27898
重 庆 Chongqing 143476 145154 1815236 12506 18228 17802 450347 25298
四 川 Sichuan 217213 220606 2905513 13171 40875 40815 941549 23069
贵 州 Guizhou 92100 91928 1220758 13280 10465 10357 190838 18426
云 南 Yunnan 142261 146998 2029980 13810 28910 28220 545856 19343
西 藏 Tibet 7427 7406 168553 22759 2164 2129 96754 45446
陕 西 Shaanxi 197961 198347 2877156 14506 25876 25830 691526 26772
甘 肃 Gansu 123170 122323 1815619 14843 17669 17507 229407 13104
青 海 Qinghai 28448 27898 508508 18227 6578 7301 179561 24594
宁 夏 Ningxia 31066 30364 465813 15341 5544 5327 143118 26867
新 疆 Xinjiang 105838 106257 1887919 17767 14930 14615 341078 23338

8/2/2019 China Labour Statistical Yearbook - 2004
http://slidepdf.com/reader/full/china-labour-statistical-yearbook-2004 245/464
3-4 6 continued
批发和零售业 住宿和餐饮业
Wholesale and Retail Trade Accommodation and Restaurants
地 区 Region 年末人数 平均人数 工资总额 平均工资 年末人数 平均人数 工资总额 平均工资
(人) (人) (千元) (元) (人) (人) (千元) (元)
Year-end Average Total Average Year-end Average Total Average
Figures Figures Wages Wage Figures Figures Wages Wage
(1 000 (1 000
(person) (person) yuan) (yuan) (person) (person) yuan) (yuan)
National 5920087 6037605 66046449 10939 1593886 1581805 17531403 11083
北 京 Beijing 320616 320432 7397976 23088 178505 175600 2902720 16530
天 津 Tianjin 100663 101425 1582825 15606 27920 27904 346852 12430
河 北 Hebei 326776 331547 2262552 6824 47107 48740 385030 7900
山 西 Shanxi 245016 244805 1512501 6178 36264 36030 225175 6250
内蒙古 Inner Mongolia 83474 82657 650281 7867 25690 25172 189203 7516
辽 宁 Liaoning 189580 202476 2119083 10466 57979 59791 605294 10123
吉 林 Jilin 144837 145588 1009718 6935 27754 28367 237076 8357
黑龙江 Heilongjiang 296740 308359 2590322 8400 46056 35441 302225 8528
上 海 Shanghai 175241 182259 4563360 25038 54094 55705 1179173 21168
江 苏 Jiangsu 361319 380130 4353230 11452 70748 72758 863589 11869
浙 江 Zhejiang 194506 194921 3954502 20288 83739 82885 1120275 13516
安 徽 Anhui 214855 231857 1428893 6163 34082 34654 253041 7302
福 建 Fujian 117168 118169 1580459 13375 39997 40334 416762 10333
江 西 Jiangxi 131033 135409 1053771 7782 20519 20527 170648 8313
山 东 Shandong 423743 432444 3462043 8006 88210 88966 822871 9249
河 南 Henan 574371 564372 4046171 7169 95384 94034 744444 7917
湖 北 Hubei 283401 281961 1951986 6923 98280 92579 660414 7134
湖 南 Hunan 184336 190709 1971307 10337 51337 51185 493304 9638
广 东 Guangdong 398852 409493 7491918 18296 192194 192695 2847667 14778
广 西 Guangxi 138216 141129 1207848 8558 47726 48278 386280 8001
海 南 Hainan 32143 32797 288927 8810 30540 30805 257293 8352
重 庆 Chongqing 100886 101734 1067949 10497 24694 24357 229249 9412
四 川 Sichuan 199114 205555 2066912 10055 44308 44336 407546 9192
贵 州 Guizhou 110119 114069 984426 8630 23538 23401 200801 8581
云 南 Yunnan 148856 156056 1727237 11068 40982 41207 362345 8793
西 藏 Tibet 5704 5682 79750 14036 2984 3015 39953 13251
陕 西 Shaanxi 205195 206058 1502114 7290 44823 44751 342527 7654
甘 肃 Gansu 92353 93528 691837 7397 17973 17774 132617 7461
青 海 Qinghai 17459 17881 178556 9986 5077 5172 61089 11811
宁 夏 Ningxia 23971 24604 228025 9268 8007 8013 63448 7918
新 疆 Xinjiang 79544 79499 1039970 13082 27375 27329 282492 10337
3-4 7 continued
金融业 房地产业
Finance Real Estate
地 区 Region 年末人数 平均人数 工资总额 平均工资 年末人数 平均人数 工资总额 平均工资
(人) (人) (千元) (元) (人) (人) (千元) (元)
Year-end Average Total Average Year-end Average Total Average
Figures Figures Wages Wage Figures Figures Wages Wage
(1 000 (1 000
(person) (person) yuan) (yuan) (person) (person) yuan) (yuan)

8/2/2019 China Labour Statistical Yearbook - 2004
http://slidepdf.com/reader/full/china-labour-statistical-yearbook-2004 246/464
National 2861530 2880380 64683256 22457 1082803 1070764 18397617 17182
北 京 Beijing 82565 81438 5025771 61713 150396 146595 3820789 26064
天 津 Tianjin 35921 36094 949086 26295 16457 15409 327494 21253
河 北 Hebei 146710 148361 2260602 15237 23999 23407 253549 10832
山 西 Shanxi 92743 93652 1414384 15103 13286 13187 124902 9472
内蒙古 Inner Mongolia 69362 70045 984804 14060 14530 14829 161015 10858
辽 宁 Liaoning 143530 146247 2950020 20171 58130 59676 799280 13394
吉 林 Jilin 84872 85236 1326196 15559 26948 26512 307421 11596
黑龙江 Heilongjiang 99654 100815 1855726 18407 41410 41252 459631 11142
上 海 Shanghai 117216 112674 4793614 42544 49923 49851 1635226 32802
江 苏 Jiangsu 158524 159583 3857579 24173 60491 60380 1020264 16897
浙 江 Zhejiang 146818 146140 4614832 31578 45715 44642 1013005 22692
安 徽 Anhui 84342 85719 1240764 14475 23960 23584 262431 11128
福 建 Fujian 81433 82432 2163388 26245 33126 32858 544863 16582
江 西 Jiangxi 70901 73544 1131814 15390 19266 19375 191294 9873
山 东 Shandong 188844 190023 3785969 19924 50054 48878 697429 14269
河 南 Henan 170899 168561 2797289 16595 44904 44118 492326 11159湖 北 Hubei 120081 121869 1771891 14539 42583 42514 451334 10616
湖 南 Hunan 113253 115005 2088429 18159 30854 30505 395327 12959
广 东 Guangdong 249833 253039 8458135 33426 140733 137888 3076515 22312
广 西 Guangxi 72678 73592 1276149 17341 21925 21717 273541 12596
海 南 Hainan 17993 18904 377682 19979 10481 10855 130448 12017
重 庆 Chongqing 50282 50266 1120947 22300 29496 29343 357217 12174
四 川 Sichuan 128550 130602 2683922 20550 40234 40194 509993 12688
贵 州 Guizhou 43451 44384 715521 16121 22806 22538 234305 10396
云 南 Yunnan 68045 68363 1034513 15133 15365 15114 191857 12694
西 藏 Tibet 5798 5842 190011 32525 260 261 5395 20670
陕 西 Shaanxi 87891 88801 1512449 17032 15002 14780 161563 10931
甘 肃 Gansu 49284 49245 689001 13991 12260 12115 135421 11178
青 海 Qinghai 13061 13043 250883 19235 1624 1899 26631 14024
宁 夏 Ningxia 18330 18122 353965 19532 6220 5989 63952 10678
新 疆 Xinjiang 48666 48739 1007920 20680 20365 20499 273199 13327
3-4 8 continued
租赁和商务服务业 科学研究、技术服务和地质勘查业
Scientific Research,Technical Service
Tenancy and Business Services and Geologic Perambulation
地 区 Region 年末人数 平均人数 工资总额 平均工资 年末人数 平均人数 工资总额 平均工资
(人) (人) (千元) (元) (人) (人) (千元) (元)
Year-end Average Total Average Year-end Average Total Average
Figures Figures Wages Wage Figures Figures Wages Wage
(1 000 (1 000
(person) (person) yuan) (yuan) (person) (person) yuan) (yuan)
National 1675855 1646553 27169091 16501 2063327 2072422 42765778 20636
北 京 Beijing 332751 323708 8333044 25742 297016 293985 10259613 34898
天 津 Tianjin 36372 34889 471482 13514 47512 47195 1158379 24545
河 北 Hebei 32948 32487 299697 9225 71753 71880 1200321 16699
山 西 Shanxi 37980 37959 317089 8353 53291 52468 687815 13109
内蒙古 Inner Mongolia 32693 32255 403535 12511 38973 39200 551141 14060
辽 宁 Liaoning 79347 80082 954175 11915 86496 88406 1555926 17600
吉 林 Jilin 33032 33200 392562 11824 58406 58190 822819 14140
黑龙江 Heilongjiang 47429 47441 430265 9069 84362 97719 1376229 14084
上 海 Shanghai 103383 101247 2327700 22990 90780 90934 2812404 30928

8/2/2019 China Labour Statistical Yearbook - 2004
http://slidepdf.com/reader/full/china-labour-statistical-yearbook-2004 247/464
江 苏 Jiangsu 74499 73679 1173767 15931 78228 78395 1861382 23744
浙 江 Zhejiang 97310 94829 1909617 20137 64307 62936 1801665 28627
安 徽 Anhui 32213 26086 221291 8483 49258 49558 661523 13348
福 建 Fujian 34099 33356 484925 14538 35311 35278 702476 19913
江 西 Jiangxi 16091 16194 174624 10783 48834 48767 624403 12804
山 东 Shandong 77955 77160 987999 12805 72426 72413 1250170 17264
河 南 Henan 80685 79050 815884 10321 105247 103924 1557454 14986
湖 北 Hubei 83476 83239 827682 9943 93279 93327 1363530 14610
湖 南 Hunan 43687 43316 579560 13380 63672 64164 952999 14853
广 东 Guangdong 153101 150990 3217015 21306 89219 88092 2903819 32963
广 西 Guangxi 46478 47020 488802 10396 42308 42254 631433 14944
海 南 Hainan 10038 10225 108456 10607 13961 13783 161390 11709
重 庆 Chongqing 16012 16354 176697 10805 57585 58048 840396 14478
四 川 Sichuan 31858 31625 397175 12559 106896 106630 2123362 19913
贵 州 Guizhou 31373 30588 363494 11884 26795 26789 377459 14090
云 南 Yunnan 20713 20509 304787 14861 50046 50012 741532 14827
西 藏 Tibet 494 495 7914 15988 4838 4925 155759 31626
陕 西 Shaanxi 28366 28378 279615 9853 116001 116219 1740637 14977甘 肃 Gansu 15570 15468 160016 10345 47008 46198 668491 14470
青 海 Qinghai 4337 4206 54146 12874 17426 18153 397852 21917
宁 夏 Ningxia 5188 5138 57965 11282 12137 12237 169805 13876
新 疆 Xinjiang 36377 35380 448111 12666 39956 40343 653594 16201
3-4 9 continued
水利、环境和公共设施管理业 居民服务和其他服务业
Management of Water Conservancy,
Environment and Public Establishment Resident Services and Other Services
地 区 Region 年末人数 平均人数 工资总额 平均工资 年末人数 平均人数 工资总额 平均工资
(人) (人) (千元) (元) (人) (人) (千元) (元)
Year-end Average Total Average Year-end Average Total Average
Figures Figures Wages Wage Figures Figures Wages Wage
(1 000 (1 000
(person) (person) yuan) (yuan) (person) (person) yuan) (yuan)
National 1638783 1633802 19760804 12095 474972 466224 6014301 12900
北 京 Beijing 57773 59621 1332950 22357 77547 72394 1262023 17433
天 津 Tianjin 30371 31451 544889 17325 28944 26840 388975 14492河 北 Hebei 78673 79662 798267 10021 26529 26636 390130 14647
山 西 Shanxi 48191 47866 381436 7969 30533 30330 203623 6714
内蒙古 Inner Mongolia 52101 48926 500772 10235 9217 8959 65014 7257
辽 宁 Liaoning 100608 101526 1078480 10623 17730 17846 174966 9804
吉 林 Jilin 63246 64658 566305 8758 11501 11488 141708 12335
黑龙江 Heilongjiang 67885 67302 666139 9898 35535 35337 223690 6330
上 海 Shanghai 47040 47278 1174835 24850 29138 27708 513774 18542
江 苏 Jiangsu 100331 100656 1506183 14964 16901 16983 284210 16735
浙 江 Zhejiang 49245 48481 916662 18908 8239 8167 157369 19269
安 徽 Anhui 57890 57727 538472 9328 11172 11681 88775 7600
福 建 Fujian 31052 31150 403336 12948 12563 12402 186138 15009
江 西 Jiangxi 37904 37645 328879 8736 9230 9075 73976 8152
山 东 Shandong 103080 101190 1182379 11685 11968 12260 142615 11633
河 南 Henan 101395 99845 992660 9942 15303 14914 137464 9217
湖 北 Hubei 81781 81521 744361 9131 12433 12386 110741 8941
湖 南 Hunan 64787 64255 635479 9890 6610 6620 74631 11274
广 东 Guangdong 110325 109840 1785657 16257 29246 28751 512691 17832
广 西 Guangxi 42410 42487 431934 10166 6030 5779 69470 12021
海 南 Hainan 15693 15627 147905 9465 380 377 4727 12538

8/2/2019 China Labour Statistical Yearbook - 2004
http://slidepdf.com/reader/full/china-labour-statistical-yearbook-2004 248/464
重 庆 Chongqing 22995 22252 208252 9359 3759 2814 36358 12920
四 川 Sichuan 67224 66563 656264 9859 24274 24187 318793 13180
贵 州 Guizhou 20919 20703 180604 8724 4339 4203 35535 8455
云 南 Yunnan 36119 35617 386374 10848 6185 6188 67786 10954
西 藏 Tibet 1167 1160 18622 16053 33 33 987 29909
陕 西 Shaanxi 46759 46471 442753 9528 16356 16790 152380 9076
甘 肃 Gansu 34061 34057 397717 11678 3252 3189 33897 10629
青 海 Qinghai 10406 10148 110918 10930 2226 2308 30439 13188
宁 夏 Ningxia 16526 16439 197375 12007 418 410 4332 10566
新 疆 Xinjiang 40826 41678 503945 12091 7381 9169 127084 13860
3-4 10 continued
教育 卫生、社会保障和社会福利业
Sanitation, Social Security
Education and Social Welfare
地 区 Region 年末人数 平均人数 工资总额 平均工资 年末人数 平均人数 工资总额 平均工资
(人) (人) (千元) (元) (人) (人) (千元) (元)
Year-end Average Total Average Year-end Average Total Average
Figures Figures Wages Wage Figures Figures Wages Wage
(1 000 (1 000
(person) (person) yuan) (yuan) (person) (person) yuan) (yuan)
National 14017271 13940714 200728473 14399 4717099 4694070 76756942 16352
北 京 Beijing 301363 300419 8581445 28565 130626 128732 4399196 34173
天 津 Tianjin 160627 160805 3091677 19226 65766 65713 1342286 20426
河 北 Hebei 804669 800254 8882692 11100 216239 215834 2521054 11681
山 西 Shanxi 434372 431478 5025750 11648 133911 133527 1457438 10915
内蒙古 Inner Mongolia 316691 314375 4207433 13383 101963 102045 1362644 13353
辽 宁 Liaoning 510071 507614 6956223 13704 213126 214428 3017699 14073
吉 林 Jilin 356815 356003 4610389 12950 137276 136689 1608994 11771
黑龙江 Heilongjiang 439268 436685 6029912 13808 167390 167606 2189955 13066
上 海 Shanghai 229477 230709 6137017 26601 129140 129138 3684467 28531
江 苏 Jiangsu 785729 784545 12983239 16549 274703 274362 5138585 18729
浙 江 Zhejiang 478378 472250 12126169 25677 215666 211401 6207978 29366
安 徽 Anhui 549109 547986 6266775 11436 161664 160254 1898158 11845
福 建 Fujian 416854 415157 6239341 15029 108894 108136 1793889 16589江 西 Jiangxi 421941 419318 4606560 10986 125251 125498 1583088 12614
山 东 Shandong 1029315 1021839 13633272 13342 342763 340699 5146445 15106
河 南 Henan 1027402 1017825 10966400 10774 312549 309225 3548080 11474
湖 北 Hubei 608811 606720 7340251 12098 241356 240753 2918125 12121
湖 南 Hunan 642661 642663 8552890 13309 223598 222343 3362347 15122
广 东 Guangdong 894202 885889 18115504 20449 337681 335109 8430235 25157
广 西 Guangxi 503716 499882 5670415 11344 149393 147922 2041333 13800
海 南 Hainan 81571 81199 1084280 13353 27868 27718 424901 15329
重 庆 Chongqing 296421 293786 3779545 12865 83033 82993 1118114 13472
四 川 Sichuan 758278 754343 9674109 12825 252891 251740 3741102 14861
贵 州 Guizhou 343331 341025 3613894 10597 83548 83118 1007372 12120
云 南 Yunnan 447676 446445 5978228 13391 119431 118970 1795713 15094
西 藏 Tibet 24721 24465 688393 28138 9329 9293 277831 29897
陕 西 Shaanxi 455348 452564 5701573 12598 128449 128302 1427809 11129
甘 肃 Gansu 260323 258172 3494009 13534 73831 73392 1017153 13859
青 海 Qinghai 59789 59388 978282 16473 21337 21263 365118 17172
宁 夏 Ningxia 73882 73706 1114064 15115 24964 24830 350566 14119
新 疆 Xinjiang 304460 303205 4598742 15167 103463 103037 1579267 15327

8/2/2019 China Labour Statistical Yearbook - 2004
http://slidepdf.com/reader/full/china-labour-statistical-yearbook-2004 249/464
3-4 11 continued
文化体育和娱乐业 公共管理和社会组织
Public Management and
Culture, Sports and Entertainment Social Organization
地 区 Region 年末人数 平均人数 工资总额 平均工资 年末人数 平均人数 工资总额 平均工资
(人) (人) (千元) (元) (人) (人) (千元) (元)
Year-end Average Total Average Year-end Average Total Average
Figures Figures Wages Wage Figures Figures Wages Wage
(1 000 (1 000
(person) (person) yuan) (yuan) (person) (person) yuan) (yuan)
National 1220091 1217636 21025918 17268 11463427 11397973 177047073 15533
北 京 Beijing 105514 104730 3666189 35006 256156 253228 7667482 30279
天 津 Tianjin 19580 19726 391315 19838 118923 115825 2474405 21363
河 北 Hebei 50460 50315 604398 12012 658600 656301 7845605 11954
山 西 Shanxi 40447 39956 432571 10826 403815 402041 4518399 11239
内蒙古 Inner Mongolia 31264 31158 425733 13664 291376 290030 4027416 13886
辽 宁 Liaoning 51560 51911 795655 15327 440902 441191 6463584 14650
吉 林 Jilin 42967 44066 508630 11542 274515 271448 3331715 12274
黑龙江 Heilongjiang 36420 35731 499419 13977 374101 375078 5287441 14097
上 海 Shanghai 38896 39126 1255536 32090 150005 149227 4588370 30748
江 苏 Jiangsu 51806 52077 1018090 19550 498072 498591 10718641 21498
浙 江 Zhejiang 42765 42520 1150578 27060 369701 367242 10938198 29785
安 徽 Anhui 42008 42199 471226 11167 408547 408376 5274244 12915
福 建 Fujian 30312 30175 510542 16919 282264 281500 4663615 16567
江 西 Jiangxi 32046 32331 384362 11888 359118 356663 4095773 11484
山 东 Shandong 53864 53759 877622 16325 849714 844853 11593923 13723
河 南 Henan 69147 67690 732276 10818 913682 901903 9949134 11031
湖 北 Hubei 56129 55991 654934 11697 521209 523207 6600997 12616
湖 南 Hunan 62770 62661 945073 15082 598982 598709 7674332 12818
广 东 Guangdong 68557 68161 1765467 25901 734081 725157 18594556 25642
广 西 Guangxi 28155 28176 364190 12926 313407 311620 4335219 13912
海 南 Hainan 11762 11485 169127 14726 80481 80435 1189232 14785
重 庆 Chongqing 16284 16504 256429 15537 192649 190848 2672449 14003
四 川 Sichuan 49623 50497 695815 13779 608688 598036 8690937 14532
贵 州 Guizhou 19735 19362 221447 11437 282460 281802 3232771 11472云 南 Yunnan 38466 38761 514915 13284 361834 358385 4727593 13191
西 藏 Tibet 4900 4864 138549 28485 54083 53789 1650615 30687
陕 西 Shaanxi 48674 48439 536063 11067 400861 399622 4407907 11030
甘 肃 Gansu 36858 36321 464511 12789 258557 257549 3522440 13677
青 海 Qinghai 5732 5713 86099 15071 65447 65677 1114591 16971
宁 夏 Ningxia 7819 7756 107886 13910 68266 67610 930137 13757
新 疆 Xinjiang 25571 25475 381271 14966 272931 272030 4265352 15680

8/2/2019 China Labour Statistical Yearbook - 2004
http://slidepdf.com/reader/full/china-labour-statistical-yearbook-2004 250/464
3-5
NUMBER OF TECHNICAL PERSONNEL
BY REGISTRATION STATUS AND REGION
(2003)单位:人 (person)
年末人数 女 性
Year-end Figures Female
地 区 Region 合 计 国 有 城镇集体 其 他 合 计 国 有 城镇集体 其 他
单 位 单 位 单 位 单 位 单 位 单 位
Urban Urban
State- Collective- Other State- Collective- Other
Total owned owned Ownership Total owned owned Ownership
Units Units Units Units Units Units
National 31130125 24093360 2094224 4942541 13306597 10805783 851364 1649450
北 京 Beijing 1469909 836098 45566 588245 630155 422700 19819 187636
天 津 Tianjin 474767 331077 20571 123119 231485 175927 8410 47148
河 北 Hebei 1593781 1381403 78234 134144 791730 716087 29500 46143
山 西 Shanxi 934270 766929 67331 100010 456144 390806 29393 35945
内蒙古 Inner Mongolia 729322 592393 32144 104785 338176 283829 14826 39521
辽 宁 Liaoning 1371874 1055837 84320 231717 662990 540304 37760 84926
吉 林 Jilin 886142 740243 45597 100302 428117 368010 21204 38903
黑龙江 Heilongjiang 1159686 958337 42203 159146 530143 451175 18333 60635
上 海 Shanghai 767009 508335 32130 226544 339251 247461 17304 74486
江 苏 Jiangsu 1653626 1173524 110739 369363 650513 479235 47837 123441
浙 江 Zhejiang 1145675 776479 84595 284601 514407 385440 35604 93363
安 徽 Anhui 1026171 828106 79633 118432 356259 293765 28118 34376
福 建 Fujian 879900 638436 53942 187522 355010 273135 18892 62983
江 西 Jiangxi 832669 726628 35806 70235 312213 274846 12875 24492
山 东 Shandong 2316079 1855236 161692 299151 926716 756350 65375 104991
河 南 Henan 1914543 1124698 508475 281370 829086 504336 229273 95477
湖 北 Hubei 1320390 1093488 63087 163815 535879 460267 22478 53134
湖 南 Hunan 1292768 1122102 73936 96730 530951 470839 29661 30451
广 东 Guangdong 1982343 1417754 113731 450858 869587 683083 40360 146144
广 西 Guangxi 917223 794612 40669 81942 384521 343307 12669 28545
海 南 Hainan 176566 151245 6928 18393 63193 55755 2327 5111
重 庆 Chongqing 620808 450328 41477 129003 228171 185183 12453 30535
四 川 Sichuan 1574869 1241072 129285 204512 634890 524477 45800 64613
贵 州 Guizhou 625222 544233 22650 58339 238469 212119 6942 19408
云 南 Yunnan 860417 743578 30855 85984 360452 321923 9327 29202
西 藏 Tibet 40493 39339 461 693 16767 16304 225 238
陕 西 Shaanxi 1019430 859420 44948 115062 417507 364939 18948 33620
甘 肃 Gansu 532147 482662 19500 29985 195576 179915 6549 9112
青 海 Qinghai 137766 124995 4157 8614 59768 55431 1709 2628
宁 夏 Ningxia 172821 144134 4261 24426 71598 61867 1613 8118
新 疆 Xinjiang 701439 590639 15301 95499 346873 306968 5780 34125

8/2/2019 China Labour Statistical Yearbook - 2004
http://slidepdf.com/reader/full/china-labour-statistical-yearbook-2004 251/464
3-6
NUMBER OF TECHNICAL PERSONNEL BY SECTOR AND REGION
(2003)
单位:人 (person)
合 计 农、林、 采矿业 制造业 电力、燃气 建筑业
牧、渔业 及水的生产
和供应业
Total Agriculture, Mining Manufac- Production Construc-
地 区 Region Forestry, turing and Distri- tion
Farming of bution of
Animals Electricity,
and Gas and
Fishery Water
National 31130125 782422 664569 4316281 682854 1608701
北 京 Beijing 1469909 6919 3611 206732 9526 149560
天 津 Tianjin 474767 3247 22537 91983 6298 28039
河 北 Hebei 1593781 17379 45994 182316 36440 75559
山 西 Shanxi 934270 12218 76057 125003 27388 49330
内 蒙 古 Inner Mongolia 729322 60460 24252 75321 25193 25632
辽 宁 Liaoning 1371874 27238 34967 227156 36068 61099
吉 林 Jilin 886142 48857 25867 114234 20603 35293
黑 龙 江 Heilongjiang 1159686 111746 50077 139279 35055 51257
上 海 Shanghai 767009 3151 22 183650 10681 39156
江 苏 Jiangsu 1653626 21769 23340 319597 28936 62920
浙 江 Zhejiang 1145675 11323 2828 141214 28139 72680
安 徽 Anhui 1026171 17893 34676 106474 21137 51984
福 建 Fujian 879900 13248 3810 152282 19806 52662
江 西 Jiangxi 832669 21007 13201 99352 20204 30995
山 东 Shandong 2316079 29583 79197 363331 53986 78911
河 南 Henan 1914543 14355 59819 236021 43111 98576
湖 北 Hubei 1320390 32927 8870 201968 29653 62833
湖 南 Hunan 1292768 17158 17321 143126 24382 53016
广 东 Guangdong 1982343 18147 6822 318751 41611 101049
广 西 Guangxi 917223 25931 8534 84100 20080 34277
海 南 Hainan 176566 25764 2002 8863 3963 7028
重 庆 Chongqing 620808 10879 9880 97724 12528 68777
四 川 Sichuan 1574869 41609 24742 204888 34709 127357
贵 州 Guizhou 625222 15375 15890 71088 13969 29890
云 南 Yunnan 860417 44178 8142 81270 17701 32926
西 藏 Tibet 40493 673 102 939 1034 783
陕 西 Shaanxi 1019430 19637 23556 192803 19437 46549
甘 肃 Gansu 532147 16757 11564 76311 17009 24656
青 海 Qinghai 137766 7008 2507 10690 4096 7955
宁 夏 Ningxia 172821 7577 2128 17462 7089 10120
新 疆 Xinjiang 701439 78409 22254 42353 13022 37832

8/2/2019 China Labour Statistical Yearbook - 2004
http://slidepdf.com/reader/full/china-labour-statistical-yearbook-2004 252/464
3-6 1 continued
单位:人 (person)
交通运输、仓储 信息传输、 批发和 住宿和 金融业 房地产业 租赁和商务
和邮政业 计算机服务 零售业 餐饮业 服务业
和软件业
Traffic, Information Wholesale Accommo- Finance Real Tenancy
地 区 Region Transport, Transfer, and dation Estate and
Storage Computer Retail and Business
and post and Trade Restaurants Services
Software
National 900231 411367 1010045 175420 1594501 293058 363926
北 京 Beijing 27824 96086 79497 26093 64195 43292 88426
天 津 Tianjin 24576 6029 18591 2829 25474 4292 5201
河 北 Hebei 39864 13587 52942 5905 82686 6137 7780
山 西 Shanxi 26695 8622 37048 3329 50704 3310 9103
内 蒙 古 Inner Mongolia 20365 8746 14109 2879 37520 3835 7250
辽 宁 Liaoning 50786 17306 41804 9048 92145 17443 18801
吉 林 Jilin 28546 10072 27105 2504 50248 7145 9910
黑 龙 江 Heilongjiang 38281 14712 40948 2950 52021 8496 10088
上 海 Shanghai 40431 14462 29594 4873 57316 12844 14911
江 苏 Jiangsu 55534 16507 45704 5119 85458 14848 17718
浙 江 Zhejiang 31450 15882 46494 10195 91406 16647 23533
安 徽 Anhui 23038 7805 28053 3701 42763 7055 4610
福 建 Fujian 19238 11256 22729 3712 47899 9465 8240
江 西 Jiangxi 25215 6574 23816 2573 40770 4563 3240
山 东 Shandong 58409 17057 88037 10669 104695 19881 18552
河 南 Henan 31280 12811 70457 10948 74558 10631 12788
湖 北 Hubei 69414 12867 35381 5840 56792 11844 11772
湖 南 Hunan 35067 13988 36933 6167 59772 9033 10739
广 东 Guangdong 64531 36818 77427 18788 144325 29715 28982
广 西 Guangxi 24178 9570 29111 4845 44118 7288 9395
海 南 Hainan 5757 2374 4195 3140 9320 2017 1963
重 庆 Chongqing 19779 3227 17284 3026 23643 8772 3247
四 川 Sichuan 31142 13226 31438 5410 70438 10352 7095
贵 州 Guizhou 10798 3734 14994 1911 24186 6873 5795
云 南 Yunnan 24398 11167 27465 4335 45794 4263 5431 西 藏 Tibet 564 1133 344 233 4389 105 100
陕 西 Shaanxi 30846 8901 31981 4842 44002 3153 5446
甘 肃 Gansu 14598 6397 10744 2404 22660 2110 2910
青 海 Qinghai 5612 2269 2845 758 7720 490 793
宁 夏 Ningxia 3689 2366 4481 1397 10627 1910 1454
新 疆 Xinjiang 18326 5816 18494 4997 26857 5249 8653
3-6 2 continued
单位:人 (person)
科学研究、 水利、环境 居民服务和 教育 卫生、社会 文化体育 公共管理和
技术服务和 和公共设施 其他服务业 保障和社会 和娱乐业 社会组织
地质勘查业 管理业 福利业
Scientific Management Resident Education Sanitation, Culture, Public
地 区 Region Research, of Water Services Social Sports Management
Technical Conservancy, and Security and and
Service Environment Other and Entertain- Social
and Geologic and Public Services Social ment Organization
Perambulation Establishment Welfare

8/2/2019 China Labour Statistical Yearbook - 2004
http://slidepdf.com/reader/full/china-labour-statistical-yearbook-2004 253/464
National 1128229 263393 71021 11542011 3493080 601399 1227617
北 京 Beijing 183847 7899 17617 225510 100209 58121 74945
天 津 Tianjin 26844 5172 2775 128405 51979 11166 9330
河 北 Hebei 37203 13656 8714 703133 158421 21948 84117
山 西 Shanxi 28043 7271 1939 343980 100282 19186 4762
内 蒙 古 Inner Mongolia 21130 9113 774 269432 78162 17550 27599
辽 宁 Liaoning 51311 15580 3569 436209 161312 26313 43719
吉 林 Jilin 35865 10854 1428 299604 103005 20964 34038
黑 龙 江 Heilongjiang 34348 10504 2600 368324 125176 18313 45511
上 海 Shanghai 43035 6169 2535 174482 100729 17032 11936
江 苏 Jiangsu 45428 18866 2313 610664 206840 25183 46882
浙 江 Zhejiang 43195 8882 1421 410210 163180 22066 4930
安 徽 Anhui 26185 9169 1069 452701 118894 24964 44000
福 建 Fujian 20070 4672 3409 366745 79643 13943 27071
江 西 Jiangxi 22490 5543 809 366611 93528 16153 36025
山 东 Shandong 43183 22694 2040 886355 269864 28416 141219
河 南 Henan 49563 12108 2018 829645 207531 25123 113200湖 北 Hubei 50027 14241 1519 460263 172778 22582 58819
湖 南 Hunan 31546 10637 1467 531878 166010 38262 86266
广 东 Guangdong 50907 10804 3157 736545 242897 24335 26732
广 西 Guangxi 25283 7022 949 416336 110595 13795 41816
海 南 Hainan 4494 951 92 64632 20835 4664 4512
重 庆 Chongqing 22430 2013 396 235697 60070 5895 15541
四 川 Sichuan 58176 8044 1991 631417 179931 23465 69439
贵 州 Guizhou 14861 2699 308 288170 61281 11084 32316
云 南 Yunnan 31100 7167 947 371979 94050 19181 28923
西 藏 Tibet 2528 88 17 15945 5472 2272 3772
陕 西 Shaanxi 63827 10113 2713 352629 94019 24907 40069
甘 肃 Gansu 21977 5359 355 203368 50896 20215 21857
青 海 Qinghai 8431 2337 427 48944 16262 3118 5504
宁 夏 Ningxia 6041 3452 145 63798 19139 4890 5056
新 疆 Xinjiang 24861 10314 1508 248400 80090 16293 37711

8/2/2019 China Labour Statistical Yearbook - 2004
http://slidepdf.com/reader/full/china-labour-statistical-yearbook-2004 254/464
3-7
NUMBER OF FEMALE TECHNICAL PERSONNEL BY SECTOR AND REGION
(2003)
单位:人 (person)
合 计 农、林、 采矿业 制造业 电力、燃气及 建筑业
牧、渔业 水的生产
和供应业
地 区 Region Total Agriculture, Mining Manufac- Production Construc-
Forestry, turing and Distri- tion
Farming of bution of
Animals and Electricity,
Fishery Gas & Water
National 13306597 246577 222680 1480667 212307 368442
北 京 Beijing 630155 2358 1584 68821 4002 30616
天 津 Tianjin 231485 1032 8606 36037 2366 8173
河 北 Hebei 791730 5967 16393 68190 12180 18479
山 西 Shanxi 456144 4354 29248 47622 10064 13640
内 蒙 古 Inner Mongoli 338176 21985 8217 30865 8876 6792
辽 宁 Liaoning 662990 8699 11112 82398 12484 18528
吉 林 Jilin 428117 16102 11636 43459 6646 10803
黑 龙 江 Heilongjiang 530143 37442 20575 54140 11364 14691
上 海 Shanghai 339251 911 2 55795 3035 7758
江 苏 Jiangsu 650513 5203 7758 107806 7272 11668
浙 江 Zhejiang 514407 2689 871 46000 7967 12255
安 徽 Anhui 356259 4405 10962 31318 5648 10988
福 建 Fujian 355010 3651 828 54099 5345 10096
江 西 Jiangxi 312213 5932 4046 33559 6328 7380
山 东 Shandong 926716 8589 19649 125910 15768 16475
河 南 Henan 829086 4123 21104 83517 12821 20433
湖 北 Hubei 535879 10422 2570 64426 9962 17830
湖 南 Hunan 530951 4361 6273 46750 7340 12944
广 东 Guangdong 869587 5227 2293 99816 10506 20431
广 西 Guangxi 384521 7121 2912 27930 6013 7731
海 南 Hainan 63193 9403 731 2464 705 979
重 庆 Chongqing 228171 2572 2409 33360 3676 9434
四 川 Sichuan 634890 10478 8458 72131 12428 29550
贵 州 Guizhou 238469 3901 5358 24606 4207 7021
云 南 Yunnan 360452 14425 2260 27164 5365 8981
西 藏 Tibet 16767 207 38 390 276 209
陕 西 Shaanxi 417507 6495 7197 61198 5006 12052
甘 肃 Gansu 195576 4814 1785 25718 6181 6540
青 海 Qinghai 59768 2436 729 3512 1277 2350
宁 夏 Ningxia 71598 2124 341 5993 2466 2414新 疆 Xinjiang 346873 29149 6735 15673 4733 11201

8/2/2019 China Labour Statistical Yearbook - 2004
http://slidepdf.com/reader/full/china-labour-statistical-yearbook-2004 255/464
3-7 1 continued
单位:人 (person)
交通运输、仓储 信息传输、 批发和 住宿和 金融业 房地产业 租赁和商务
和邮政业 计算机服务 零售业 餐饮业 服务业
和软件业
Traffic, Information Wholesale Accommoda- Finance Real Tenancy and
地 区 Region Transport, Transfer, and Retail tion and Estate Business
Storage and Computer Trade Restaurants Services
post and Software
National 284900 136759 426148 73907 715326 105200 144898
北 京 Beijing 11725 26324 37088 10934 34533 16092 39378
天 津 Tianjin 8294 2071 8270 1251 12705 1633 2137
河 北 Hebei 14086 5242 23904 2830 36328 2579 2956
山 西 Shanxi 9401 3704 16691 1363 23005 1406 3492
内 蒙 古 Inner Mongolia 6411 3478 6708 1190 17579 1565 3123
辽 宁 Liaoning 16525 6500 19283 4451 41767 7192 8744
吉 林 Jilin 9608 4490 11486 1200 24388 3068 4122
黑 龙 江 Heilongjiang 12340 5488 18217 1397 24694 3308 4187
上 海 Shanghai 7977 4819 12476 2082 29074 4058 6079
江 苏 Jiangsu 14854 4845 17478 2113 35398 5111 3952
浙 江 Zhejiang 9065 5835 20141 4637 45805 5809 9345
安 徽 Anhui 6405 2268 10004 1179 16358 2306 1717
福 建 Fujian 4764 3221 9055 1608 19862 2862 2907
江 西 Jiangxi 8313 2073 9920 1055 18063 1675 1126
山 东 Shandong 15794 5593 34412 4050 42583 7217 6020
河 南 Henan 10468 4786 29174 4474 33017 3745 4690
湖 北 Hubei 27239 5207 14023 2315 25760 3859 5105
湖 南 Hunan 12150 4370 15295 2664 25854 3134 3313
广 东 Guangdong 17222 11893 33982 7759 64609 10347 11427
广 西 Guangxi 7324 2920 11920 2276 18558 2695 3826
海 南 Hainan 1407 691 1438 823 3766 613 847
重 庆 Chongqing 5422 896 7017 939 9876 2529 1168
四 川 Sichuan 10117 4757 12451 2210 33107 3629 2511
贵 州 Guizhou 3513 1234 5996 820 10391 2191 2180云 南 Yunnan 9491 4049 10592 1835 18585 1661 2254
西 藏 Tibet 163 515 114 65 1452 31 38
陕 西 Shaanxi 11480 3059 13092 2039 18546 956 1949
甘 肃 Gansu 4367 2457 4292 1064 8699 694 1157
青 海 Qinghai 1994 848 1174 170 3592 257 311
宁 夏 Ningxia 1100 1032 2063 743 4708 662 602
新 疆 Xinjiang 5881 2094 8392 2371 12664 2316 4235
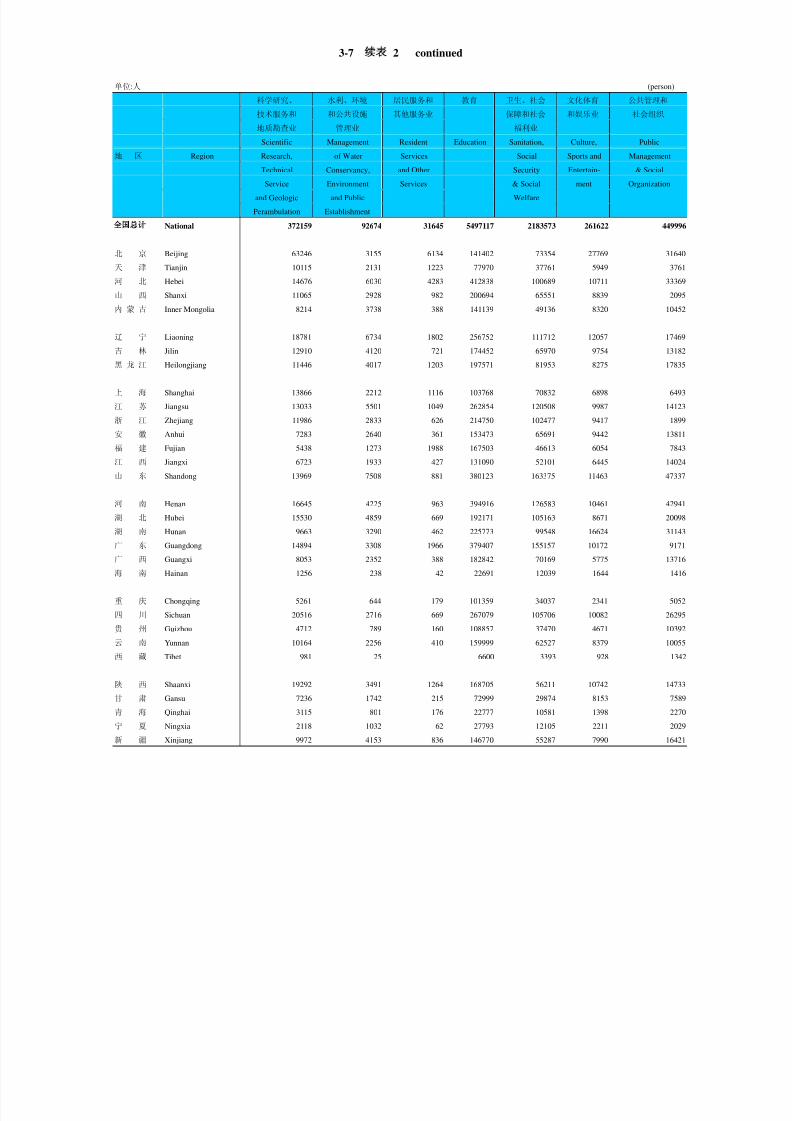
8/2/2019 China Labour Statistical Yearbook - 2004
http://slidepdf.com/reader/full/china-labour-statistical-yearbook-2004 256/464
3-7 2 continued
单位:人 (person)
科学研究、 水利、环境 居民服务和 教育 卫生、社会 文化体育 公共管理和
技术服务和 和公共设施 其他服务业 保障和社会 和娱乐业 社会组织
地质勘查业 管理业 福利业
Scientific Management Resident Education Sanitation, Culture, Public
地 区 Region Research, of Water Services Social Sports and Management
Technical Conservancy, and Other Security Entertain- & Social
Service Environment Services & Social ment Organization
and Geologic and Public Welfare
Perambulation Establishment
National 372159 92674 31645 5497117 2183573 261622 449996
北 京 Beijing 63246 3155 6134 141402 73354 27769 31640
天 津 Tianjin 10115 2131 1223 77970 37761 5949 3761
河 北 Hebei 14676 6030 4283 412838 100689 10711 33369
山 西 Shanxi 11065 2928 982 200694 65551 8839 2095
内 蒙 古 Inner Mongolia 8214 3738 388 141139 49136 8320 10452
辽 宁 Liaoning 18781 6734 1802 256752 111712 12057 17469
吉 林 Jilin 12910 4120 721 174452 65970 9754 13182
黑 龙 江 Heilongjiang 11446 4017 1203 197571 81953 8275 17835
上 海 Shanghai 13866 2212 1116 103768 70832 6898 6493
江 苏 Jiangsu 13033 5501 1049 262854 120508 9987 14123
浙 江 Zhejiang 11986 2833 626 214750 102477 9417 1899
安 徽 Anhui 7283 2640 361 153473 65691 9442 13811
福 建 Fujian 5438 1273 1988 167503 46613 6054 7843
江 西 Jiangxi 6723 1933 427 131090 52101 6445 14024
山 东 Shandong 13969 7508 881 380123 163375 11463 47337
河 南 Henan 16645 4225 963 394916 126583 10461 42941
湖 北 Hubei 15530 4859 669 192171 105163 8671 20098
湖 南 Hunan 9663 3290 462 225773 99548 16624 31143
广 东 Guangdong 14894 3308 1966 379407 155157 10172 9171
广 西 Guangxi 8053 2352 388 182842 70169 5775 13716
海 南 Hainan 1256 238 42 22691 12039 1644 1416
重 庆 Chongqing 5261 644 179 101359 34037 2341 5052
四 川 Sichuan 20516 2716 669 267079 105706 10082 26295
贵 州 Guizhou 4712 789 160 108857 37470 4671 10392云 南 Yunnan 10164 2256 410 159999 62527 8379 10055
西 藏 Tibet 981 25 6600 3393 928 1342
陕 西 Shaanxi 19292 3491 1264 168705 56211 10742 14733
甘 肃 Gansu 7236 1742 215 72999 29874 8153 7589
青 海 Qinghai 3115 801 176 22777 10581 1398 2270
宁 夏 Ningxia 2118 1032 62 27793 12105 2211 2029
新 疆 Xinjiang 9972 4153 836 146770 55287 7990 16421

8/2/2019 China Labour Statistical Yearbook - 2004
http://slidepdf.com/reader/full/china-labour-statistical-yearbook-2004 257/464
3-8
NOT-ON-POST STAFF AND WORKERS AND LIVING
SUBSIDIES BY SECTOR AND REGION
(2003)
总 计 农、林、牧、渔业 采矿业 制造业
Agriculture,Forestry,
Total Farming of Animals Mining Manufacturing
and Fishing
地 区 Region 年末人数 平均生活费 年末人数 平均生活费 年末人数 平均生活费 年末人数 平均生
(人) (元) (人) (元) (人) (元) (人) (元)
Average Average Average Averag
Year-end Living Year-end Living Year-end Living Year-end Livin
Figures Subsidy Figures Subsidy Figures Subsidy Figures Subsid
(person) (yuan) (person) (yuan) (person) (yuan) (person) (yuan) National 17851482 2966 775355 1241 973315 3558 7898391
北 京 Beijing 324463 7325 1558 5821 1745 9017 122623
天 津 Tianjin 408400 2686 1995 3451 5348 7361 265748
河 北 Hebei 897449 3493 9573 1816 57761 4358 416730
山 西 Shanxi 690122 2324 3755 1013 59308 2987 327322
内蒙古 Inner Mongolia 248762 3590 31247 1079 29150 3651 62029
辽 宁 Liaoning 1576914 1890 40808 665 100165 1824 818892
吉 林 Jilin 1052962 1867 87545 1517 71715 2334 441547
黑龙江 Heilongjiang 1601179 1531 207477 615 142808 1520 621656
上 海 Shanghai 793441 4332 3967 3589 123 3485 457897
江 苏 Jiangsu 885818 4212 20991 2392 43367 4717 435228
浙 江 Zhejiang 187417 6530 4960 3284 3465 4363 70795
安 徽 Anhui 552878 2528 13073 1573 37375 4518 228420
福 建 Fujian 186038 2774 11735 1879 3891 1809 72761
江 西 Jiangxi 764463 1883 64738 1022 44586 2705 357185
山 东 Shandong 1217511 3851 38804 1509 83578 8886 502190
河 南 Henan 1077202 1772 24316 583 77653 3253 414453
湖 北 Hubei 1012805 3048 33703 1289 14496 2762 472737
湖 南 Hunan 1208368 2427 40702 1154 64747 2034 513830
广 东 Guangdong 519001 4447 14066 2292 9425 5568 146434
广 西 Guangxi 294367 2714 14053 1776 9680 2044 102170
海 南 Hainan 121387 2054 38692 878 2203 855 21861
重 庆 Chongqing 243710 3690 1166 2929 7269 4152 123132
四 川 Sichuan 523625 3983 6775 2704 29174 3024 240164
贵 州 Guizhou 217581 3350 2190 1683 11137 3619 105023
云 南 Yunnan 210448 6022 19343 3532 6218 4713 79947
西 藏 Tibet 2817 13578 113 912 202 11227 154
陕 西 Shaanxi 604418 2527 6487 2037 29977 2620 301677
甘 肃 Gansu 228072 4079 3441 1580 4882 3766 119814
青 海 Qinghai 37139 5200 838 1368 1210 3270 12273
宁 夏 Ningxia 31981 5568 1456 3203 1429 4874 13244
新 疆 Xinjiang 130744 6536 25788 1814 19228 15003 30455

8/2/2019 China Labour Statistical Yearbook - 2004
http://slidepdf.com/reader/full/china-labour-statistical-yearbook-2004 258/464
3-8 1 continued
电力、燃气及水的生产 建筑业 交通运输、仓储和邮政业 信息传输、计算机服务和
和供应业 Production 软件业 Information
& Distribution of Construction Traffic,Transport, Transfer, Computer
Electricity,Gas & Water Storage and Post Services and Software地 区 Region 年末人数 平均生活费 年末人数 平均生活费 年末人数 平均生活费 年末人数 平均生活费
(人) (元) (人) (元) (人) (元) (人) (元)
Average Average Average Average
Year-end Living Year-end Living Year-end Living Year-end Living
Figures Subsidy Figures Subsidy Figures Subsidy Figures Subsidy
(person) (yuan) (person) (yuan) (person) (yuan) (person) (yuan)
National 233094 7918 1295291 2460 1195736 4088 103395 9765
北 京 Beijing 2766 15934 53728 5257 19060 8457 4867 9087
天 津 Tianjin 1852 8484 24658 3265 38207 3458 1169 12574
河 北 Hebei 5434 7113 57469 2656 51804 3541 3636 11553
山 西 Shanxi 6734 4590 59388 2138 36513 2819 2930 8294
内蒙古 Inner Mongolia 7057 9947 32879 1741 21681 5005 3533 10929
辽 宁 Liaoning 26512 7102 168636 1245 86164 3464 4822 12259
吉 林 Jilin 11696 7146 76341 872 72004 3385 4450 5942
黑龙江 Heilongjiang 12220 4672 106015 604 123979 3207 7234 11012
上 海 Shanghai 960 11250 31049 6176 57183 5947 2803 15704
江 苏 Jiangsu 5774 9966 53764 4661 66645 6122 3159 13482
浙 江 Zhejiang 2478 11537 11501 4205 18023 6042 2649 14540
安 徽 Anhui 3868 6984 56897 2430 37224 2290 2187 9432
福 建 Fujian 2682 6964 17909 2028 14856 3687 1442 11435
江 西 Jiangxi 11336 5541 50096 1571 45788 2687 1925 8365
山 东 Shandong 17261 9038 41234 3267 61052 5381 7130 9038
河 南 Henan 19135 6139 53622 1739 65887 2298 6486 5551
湖 北 Hubei 16101 8860 66307 3302 73196 3387 8323 9128
湖 南 Hunan 16000 6872 66864 2246 71918 3059 10668 6037
广 东 Guangdong 13449 12567 32556 3269 39162 5697 3877 14477
广 西 Guangxi 6902 7769 17348 2580 19342 3310 2351 8686
海 南 Hainan 3899 8548 3210 595 6115 5096 1815 6961
重 庆 Chongqing 4523 6863 21811 2008 24838 4501 811 11839
四 川 Sichuan 14830 7850 54843 3347 38698 3762 3445 8239
贵 州 Guizhou 3965 9244 16810 2375 13727 4284 1549 9996
云 南 Yunnan 5731 12165 18502 5039 18445 7617 3169 11933
西 藏 Tibet 165 14497 148 6831 332 10736 271 33079
陕 西 Shaanxi 4170 6379 57454 2369 35898 3356 2575 8196
甘 肃 Gansu 2461 8687 21930 2578 20245 6980 1591 7180
青 海 Qinghai 379 12708 3890 3037 4897 8556 491 16805
宁 夏 Ningxia 217 6171 4409 3808 2549 10921 214 11783
新 疆 Xinjiang 2537 8605 14023 3457 10304 6015 1823 15544

8/2/2019 China Labour Statistical Yearbook - 2004
http://slidepdf.com/reader/full/china-labour-statistical-yearbook-2004 259/464
3-8 2 continued
批发和零售业 住宿和餐饮业 金融业 房地产业
Wholesale and Accommodation and Finance Real Estate
Retail Trade Restaurants
地 区 Region 年末人数 平均生活费 年末人数 平均生活费 年末人数 平均生活费 年末人数 平均生活费 (人) (元) (人) (元) (人) (元) (人) (元)
Average Average Average Average
Year-end Living Year-end Living Year-end Living Year-end Living
Figures Subsidy Figures Subsidy Figures Subsidy Figures Subsidy
(person) (yuan) (person) (yuan) (person) (yuan) (person) (yuan)
National 3249353 1443 244160 2289 222084 11532 141251 3611
北 京 Beijing 40962 7319 7695 7319 3916 17264 8953 7546
天 津 Tianjin 37759 2808 4579 2317 1972 14316 2115 5203
河 北 Hebei 171088 1485 11525 1878 16268 12319 1776 5637
山 西 Shanxi 129505 870 8393 1047 9048 9883 2318 1246
内蒙古 Inner Mongolia 20756 1596 1436 1893 4081 10201 499 3749
辽 宁 Liaoning 182989 787 15518 1575 15499 11322 10632 3308
吉 林 Jilin 196316 599 10646 953 6713 11929 4245 2155
黑龙江 Heilongjiang 228448 588 13449 424 9233 12492 17714 698
上 海 Shanghai 113797 3390 15925 3975 3868 13359 11608 4933
江 苏 Jiangsu 177173 2289 13652 2915 8971 13173 4447 7437
浙 江 Zhejiang 25128 3187 5227 3822 7991 14748 2110 6288
安 徽 Anhui 123370 1218 11404 1630 5942 10057 1484 2870
福 建 Fujian 40978 1627 3856 2531 1849 16004 952 4777
江 西 Jiangxi 122603 1032 5804 1657 7385 8335 2126 3564
山 东 Shandong 303017 1179 17855 2173 16187 9723 7172 8121
河 南 Henan 298442 586 15864 1304 18696 9116 5986 1686
湖 北 Hubei 181529 1542 9478 2103 13742 9629 7977 3749
湖 南 Hunan 249978 1390 19832 2213 9727 12093 20720 1948
广 东 Guangdong 158877 1440 8746 3515 16698 16240 12118 3549
广 西 Guangxi 72116 1026 7945 1626 6700 9884 2091 1991
海 南 Hainan 26746 658 2431 1570 2353 13724 2715 2377
重 庆 Chongqing 36848 2678 5571 2760 3886 12341 1418 4696
四 川 Sichuan 76643 2383 6891 2161 8300 10315 2660 4410贵 州 Guizhou 40121 2025 3184 2411 3234 10379 2037 2772
云 南 Yunnan 31076 5341 2967 3082 3558 11444 969 5467
西 藏 Tibet 253 8216 61 6371 317 20574 20 7900
陕 西 Shaanxi 111005 1524 9141 2364 6894 8912 1995 2135
甘 肃 Gansu 32160 1766 2580 2200 4251 10058 667 7008
青 海 Qinghai 6440 3131 365 3831 849 13782 27 9412
宁 夏 Ningxia 4275 3663 629 3603 1119 12489 188 6154
新 疆 Xinjiang 8955 5389 1511 4036 2837 15991 1512 6015

8/2/2019 China Labour Statistical Yearbook - 2004
http://slidepdf.com/reader/full/china-labour-statistical-yearbook-2004 260/464
3-8 3 continued
租赁和商务服务业 科学研究、技术服务和地质 水利、环境和公共设施管理 居民服务和其他服务业
勘查业 Scientific Rese- 业 Management of Water
Tenancy and arch,Technical Service Conservancy,Environment Resident Services
Business Services & Geologic Perambulation & Public Establishment and Other Services
地 区 Region 年末人数 平均生活费 年末人数 平均生活费 年末人数 平均生活费 年末人数 平均生活费(人) (元) (人) (元) (人) (元) (人) (元)
Average Average Average Average
Year-end Living Year-end Living Year-end Living Year-end Living
Figures Subsidy Figures Subsidy Figures Subsidy Figures Subsidy
(person) (yuan) (person) (yuan) (person) (yuan) (person) (yuan)
National 286669 2952 173859 5257 99758 4427 89272 2128
北 京 Beijing 17274 8534 12470 10751 3439 15150 5496 5522
天 津 Tianjin 6971 3702 3368 7330 1481 8120 2363 4025
河 北 Hebei 7175 2755 8471 4798 2159 5660 1429 1791
山 西 Shanxi 8959 1411 3293 3442 1610 1893 9943 247
内蒙古 Inner Mongolia 9046 1923 5637 4231 959 5574 1967 812
辽 宁 Liaoning 25180 1511 11061 3694 9750 4869 8582 1128
吉 林 Jilin 12522 3210 6663 5043 5914 2953 3057 3013
黑龙江 Heilongjiang 23667 774 6187 3916 11464 1161 8972 878
上 海 Shanghai 36576 3118 7146 8788 3865 8675 24178 2147
江 苏 Jiangsu 11587 4449 4904 5276 4811 6596 2905 6146
浙 江 Zhejiang 6731 5809 2590 6975 2541 9000 435 2924
安 徽 Anhui 4953 1758 4555 4029 1967 2379 1416 1873
福 建 Fujian 2802 2946 2465 4326 394 3601 1056 2517
江 西 Jiangxi 8791 1201 8105 2950 4093 2765 1139 2781
山 东 Shandong 13732 2764 12144 5172 5307 7065 1764 2778
河 南 Henan 12518 1659 6209 3842 5401 1709 4285 713
湖 北 Hubei 14166 2875 11062 4907 11339 3705 1404 2808
湖 南 Hunan 12793 2678 11439 3473 11837 3306 2526 1234
广 东 Guangdong 15342 3668 4299 7599 3265 4302 1162 7039
广 西 Guangxi 10272 2329 3062 5107 1778 4092 441 2933
海 南 Hainan 2219 1485 949 2033 458 2717 39 308
重 庆 Chongqing 829 2436 1675 11597 500 2771 369 1223
四 川 Sichuan 3518 3703 10160 5555 1710 4633 727 2881贵 州 Guizhou 4446 3162 3623 4657 178 2428 414 1884
云 南 Yunnan 4218 4850 5289 4587 591 6320 391 4335
西 藏 Tibet 19 6474 13 24071 1 8000
陕 西 Shaanxi 4147 1265 6013 5673 1795 5598 2080 1953
甘 肃 Gansu 2534 1968 4579 5647 484 6703 78 4513
青 海 Qinghai 1100 2843 2704 3666 14 2867 123 520
宁 夏 Ningxia 366 11771 239 3434 112 10486 2
新 疆 Xinjiang 2216 6633 3485 3887 541 5119 529 5806

8/2/2019 China Labour Statistical Yearbook - 2004
http://slidepdf.com/reader/full/china-labour-statistical-yearbook-2004 261/464
3-8 4 continued
教育 卫生、社会保障和社会 文化体育和娱乐业 公共管理和社会组织
福利业 Sanitation,
Education Social Security & Culture, Sports Public Management &
Social Welfare and Entertainment Social Organization地 区 Region 年末人数 平均生活费 年末人数 平均生活费 年末人数 平均生活费 年末人数 平均生活费
(人) (元) (人) (元) (人) (元) (人) (元)
Average Average Average Average
Year-end Living Year-end Living Year-end Living Year-end Living
Figures Subsidy Figures Subsidy Figures Subsidy Figures Subsidy
(person) (yuan) (person) (yuan) (person) (yuan) (person) (yuan)
National 205690 8443 144502 5197 63369 4664 456938 9673
北 京 Beijing 8047 14271 1603 10190 2907 11329 5354 16022
天 津 Tianjin 3744 7889 3150 6394 885 7382 1036 7402
河 北 Hebei 9706 9626 4270 4359 2191 6886 58984 11061
山 西 Shanxi 4017 7939 2733 3428 2091 2021 12262 7888
内蒙古 Inner Mongolia 4094 9733 2083 3809 907 6527 9721 10690
辽 宁 Liaoning 13034 7325 17802 3774 3209 3515 17659 9197
吉 林 Jilin 15831 6834 5747 4892 1700 5655 18310 9551
黑龙江 Heilongjiang 13429 9675 7546 4707 1831 4802 37850 10383
上 海 Shanghai 8465 13372 7316 11111 2983 10905 3732 10175
江 苏 Jiangsu 7530 7942 4240 5905 2265 5842 14405 12575
浙 江 Zhejiang 5641 14791 4530 6693 1476 6833 9146 20826
安 徽 Anhui 6443 7202 3111 2377 1336 3421 7853 6434
福 建 Fujian 2009 6590 957 4393 806 2512 2638 8245
江 西 Jiangxi 8583 4742 4438 4105 2196 3253 13546 5269
山 东 Shandong 22711 9606 7685 7377 3937 4829 54751 9924
河 南 Henan 10275 5019 9868 2262 4894 1090 23212 4385
湖 北 Hubei 16159 6152 19053 4473 5210 3565 36823 6652
湖 南 Hunan 17215 7184 15024 5029 8448 3691 44100 6247
广 东 Guangdong 2290 13511 4818 4226 3256 4599 29161 17532
广 西 Guangxi 3824 7751 1840 5621 2769 2158 9683 5018
海 南 Hainan 414 7592 870 2920 1089 4462 3309 8846
重 庆 Chongqing 3300 10149 1148 3794 741 4354 3875 10928
四 川 Sichuan 8080 6082 6488 6239 2078 5074 8441 10298
贵 州 Guizhou 1345 8211 845 4592 685 1543 3068 8811
云 南 Yunnan 1926 11544 928 6881 577 3415 6603 13222
西 藏 Tibet 167 10200 45 14556 2 18500 534 14898
陕 西 Shaanxi 3819 7108 3692 7218 1783 4022 13816 6065
甘 肃 Gansu 1213 10275 879 9863 660 1928 3623 7258
青 海 Qinghai 223 9602 272 11696 69 4379 975 7997
宁 夏 Ningxia 175 11125 200 9617 170 5633 988 12574
新 疆 Xinjiang 1981 12884 1321 7943 218 6700 1480 16465

8/2/2019 China Labour Statistical Yearbook - 2004
http://slidepdf.com/reader/full/china-labour-statistical-yearbook-2004 262/464
3-9
OTHER EMPLOYMENT AND AVERAGE EARNING BY
SECTOR AND REGION
(2003)
总 计 农、林、牧、渔业
Agriculture,Forestry, Farming
Total of Animals and Fishing
地 区 Region 年末人数 平均劳动报酬 年末人数 平均劳动报酬
(人) # 聘用的
(元) # 聘用的
(人) # 聘用的
(元) # 聘用的
Year-end 离退休人员 Average 离退休人员 Year-end 离退休人员 Average 离退休人员
Figures Hired Earning Hired Figures Hired Earning Hired
(person) Retirement (yuan) Retirement (person) Retirement (yuan) Retirement
National 4776819 578592 12398 13142 248581 5092 5307 4964
北 京 Beijing 548938 164837 22555 16256 1405 368 16099 17541
天 津 Tianjin 161267 29323 16904 10019 192 44 8946 15114
河 北 Hebei 124232 9580 8102 8759 100 18 6185 5444
山 西 Shanxi 89967 8665 6366 7610 653 81 4825 4416
内蒙古 Inner Mongolia 40836 4277 7204 8629 247 49 3498 7980
辽 宁 Liaoning 166258 34888 10417 8500 2041 156 8762 7487
吉 林 Jilin 50511 6745 9214 10512 1177 19 4019 1595
黑龙江 Heilongjiang 274842 11733 6589 8674 145899 77 5550 7990
上 海 Shanghai 628679 86936 17403 14405 6219 97 9015 10710
江 苏 Jiangsu 294153 19165 13696 12900 4101 90 4638 8117
浙 江 Zhejiang 195968 29725 16275 15994 812 68 9188 8319
安 徽 Anhui 167928 12142 7030 7885 4647 2604 2838 551
福 建 Fujian 105463 10683 15414 13474 4359 131 4642 6128
江 西 Jiangxi 110223 4229 7051 8505 5246 87 4238 4532
山 东 Shandong 161607 14707 11944 11597 1160 43 6649 10222
河 南 Henan 192047 13105 6631 11053 1685 42 3876 6000
湖 北 Hubei 163419 12096 7083 9643 10065 195 4208 4787
湖 南 Hunan 222044 10128 8191 11466 10198 39 4135 5286
广 东 Guangdong 176301 23391 22964 20276 3220 113 8712 14811
广 西 Guangxi 159873 6004 5918 9876 9383 201 4304 3834
海 南 Hainan 19027 1639 10360 12877 2608 28 6505 11743
重 庆 Chongqing 46189 12299 11743 10534 89 33 8311 5774
四 川 Sichuan 189462 17777 9290 11018 2281 83 4634 5296
贵 州 Guizhou 87585 5606 5762 9086 2358 8 2458 4714
云 南 Yunnan 92418 10250 6138 9066 16786 122 3123 6595
西 藏 Tibet 28919 239 7350 4157 1925 2 4202 7500
陕 西 Shaanxi 109360 8352 5901 8076 1144 33 5176 8788
甘 肃 Gansu 63788 2819 4949 7680 1985 29 4560 6645
青 海
Qinghai 15967 472 6940 9895 790 9 3225 21111宁 夏 Ningxia 22215 1842 8162 9182 285 30 3830 2633
新 疆 Xinjiang 67333 4938 10780 11630 5521 193 6691 6328

8/2/2019 China Labour Statistical Yearbook - 2004
http://slidepdf.com/reader/full/china-labour-statistical-yearbook-2004 263/464
3-9 1 continued
采矿业 制造业
Mining Manufacturing
地 区 Region 年末人数 平均劳动报酬 年末人数 平均劳动报酬
(人) # 聘用的
(元) # 聘用的
(人) # 聘用的
(元) # 聘用的
Year-end 离退休人员 Average 离退休人员 Year-end 离退休人员 Average 离退休人员
Figures Hired Earning Hired Figures Hired Earning Hired
(person) Retirement (yuan) Retirement (person) Retirement (yuan) Retirement
National 72731 6145 9985 7629 815484 147644 19030 12469
北 京 Beijing 234 219 11258 11012 69741 27130 25589 16175
天 津 Tianjin 6384 775 14059 13219 46374 9381 26830 10144
河 北 Hebei 286 38 6629 9071 16609 3910 11163 9990
山 西 Shanxi 5544 322 13595 4813 11012 3805 6226 7442
内蒙古 Inner Mongolia 2462 100 7751 8192 3034 1080 7410 9832
辽 宁 Liaoning 2375 349 7875 2096 36225 12828 13601 8940吉 林 Jilin 763 58 8844 8155 9892 2341 13659 9700
黑龙江 Heilongjiang 831 234 6906 7274 32937 4258 8244 8628
上 海 Shanghai 77 1 9422 14000 200853 23367 23512 16029
江 苏 Jiangsu 919 30 8443 5459 86444 5903 21871 14248
浙 江 Zhejiang 130 16 11978 15688 24736 7297 22086 15015
安 徽 Anhui 3106 1208 6546 7989 21489 1985 7844 8785
福 建 Fujian 770 136 8478 8750 17514 3584 35988 13652
江 西 Jiangxi 2417 97 6948 9408 15427 1065 7327 7789
山 东 Shandong 4758 103 8917 6864 19520 4098 34580 11644
河 南 Henan 7415 171 8892 7894 23902 3406 5430 8244
湖 北 Hubei 3644 74 14412 8414 24009 4558 8350 9684
湖 南 Hunan 4863 524 7144 8173 26447 2409 7094 9769
广 东 Guangdong 113 57 20010 7500 22233 4982 55236 17420
广 西 Guangxi 1369 92 7649 6394 19396 1268 6280 9080
海 南 Hainan 91 18 4231 6556 2133 342 38846 10888
重 庆 Chongqing 664 139 7942 10127 8458 4685 10434 8852
四 川 Sichuan 2810 229 9012 11839 20133 4771 8331 9234
贵 州 Guizhou 1821 21 7754 22762 12403 1648 6111 7753
云 南 Yunnan 1155 675 6915 5816 8515 2504 10913 10714
西 藏 Tibet 926 1 10622 53 2675 49 11050 30933
陕 西 Shaanxi 4060 64 6239 8041 18370 2731 7383 7806
甘 肃 Gansu 3315 124 8832 9889 6865 913 4697 5612
青 海 Qinghai 128 27 5438 7700 1234 130 6923 5844
宁 夏 Ningxia 267 0 6134 3678 449 5846 11461
新 疆 Xinjiang 9034 243 14202 12749 3226 767 11046 15132
3-9 2 continued
电力、燃气及水的生产和供应业 建筑业
Production and Distribution of
Electricity, Gas and Water Construction
地 区 Region 年末人数 平均劳动报酬 年末人数 平均劳动报酬
(人) # 聘用的
(元) # 聘用的
(人) # 聘用的
(元) # 聘用的
Year-end 离退休人员 Average 离退休人员 Year-end 离退休人员 Average 离退休人员
Figures Hired Earning Hired Figures Hired Earning Hired
(person) Retirement (yuan) Retirement (person) Retirement (yuan) Retirement
National 52996 4713 8520 13583 601962 40413 9477 13850
北 京 Beijing 545 243 18631 12703 60559 11671 14056 16604

8/2/2019 China Labour Statistical Yearbook - 2004
http://slidepdf.com/reader/full/china-labour-statistical-yearbook-2004 264/464
天 津 Tianjin 1009 469 11496 12799 8285 2068 12466 8184
河 北 Hebei 9306 140 5173 9917 27948 670 8420 10143
山 西 Shanxi 949 104 8938 13536 6834 317 6989 7016
内蒙古 Inner Mongolia 288 42 6003 8222 4581 724 6200 7360
辽 宁 Liaoning 2036 298 4960 7060 10494 2424 7209 9540
吉 林 Jilin 276 93 6907 5522 4073 302 9940 11341
黑龙江 Heilongjiang 2021 99 5401 8206 16091 974 7977 7605
上 海 Shanghai 1485 652 33018 16265 20467 3346 14027 18197
江 苏 Jiangsu 1775 141 8895 17993 21157 636 10040 12678
浙 江 Zhejiang 1965 272 19895 22780 33912 2186 20000 17705
安 徽 Anhui 1618 151 7986 11633 38310 862 7675 9910
福 建 Fujian 2651 221 11288 16902 19140 887 10734 14315
江 西 Jiangxi 3492 32 6646 9600 17372 407 5133 7642
山 东 Shandong 1700 204 6702 9852 12260 452 8542 11396
河 南 Henan 2646 166 8602 23846 48755 1614 7431 21486
湖 北 Hubei 1643 97 7418 6678 24986 1155 7077 8562
湖 南 Hunan 1621 70 6201 10921 59703 849 8422 13151
广 东 Guangdong 1118 289 19189 23539 22281 2087 10931 22864广 西 Guangxi 2286 85 6094 8244 21184 299 7168 7283
海 南 Hainan 1719 12 8646 19750 1711 153 5473 6973
重 庆 Chongqing 211 44 7192 8273 3272 1624 10427 12021
四 川 Sichuan 2886 401 5524 10574 53409 2344 8602 11052
贵 州 Guizhou 1466 67 5897 10391 14336 494 6846 9152
云 南 Yunnan 1829 78 9428 8198 4498 511 7688 11790
西 藏 Tibet 865 13 7481 8692 3785 8 11707 3429
陕 西 Shaanxi 1646 93 9284 18947 12002 422 6681 3418
甘 肃 Gansu 1197 8 4580 7667 11512 222 6110 11502
青 海 Qinghai 162 47 8752 7065 2579 53 6547 26229
宁 夏 Ningxia 170 6 3497 5667 5319 110 7008 9236
新 疆 Xinjiang 415 76 7870 9151 11147 542 8632 11063
3-9 3 continued
交通运输、仓储和邮政业 信息传输、计算机服务和软件业
Traffic, Transport, Information Transfer, Computer
Storage and Post Services and Software地 区 Region 年末人数 平均劳动报酬 年末人数 平均劳动报酬
(人) # 聘用的
(元) # 聘用的
(人) # 聘用的
(元) # 聘用的
Year-end 离退休人员 Average 离退休人员 Year-end 离退休人员 Average 离退休人员
Figures H ired Earning Hired F igures H ired Earning Hired
(person) Retirement (yuan) Retirement (person) Retirement (yuan) Retirement
National 267798 11556 10558 12016 128497 7349 19798 19126
北 京 Beijing 22315 2098 14818 11769 21310 4385 48003 23559
天 津 Tianjin 12877 271 17726 12329 820 144 27000 13014
河 北 Hebei 5444 192 7625 7208 3637 34 9609 8176
山 西 Shanxi 3699 56 5546 6796 1592 45 6557 8905
内蒙古 Inner Mongolia 4402 224 7135 7731 635 40 9334 7000
辽 宁 Liaoning 5886 791 10494 12423 5169 260 7330 8030
吉 林 Jilin 4419 71 7855 9110 1031 124 10831 19819
黑龙江 Heilongjiang 6846 331 7597 9085 1820 171 9179 6807
上 海 Shanghai 56502 3165 14012 14167 11505 592 27635 18395
江 苏 Jiangsu 13988 250 10948 10901 6471 124 15267 8529
浙 江 Zhejiang 10044 511 13154 12127 5828 197 18977 20766
安 徽 Anhui 6683 120 5123 5594 4402 12 8118 9385
福 建 Fujian 6357 203 10522 14565 7057 46 15130 12197
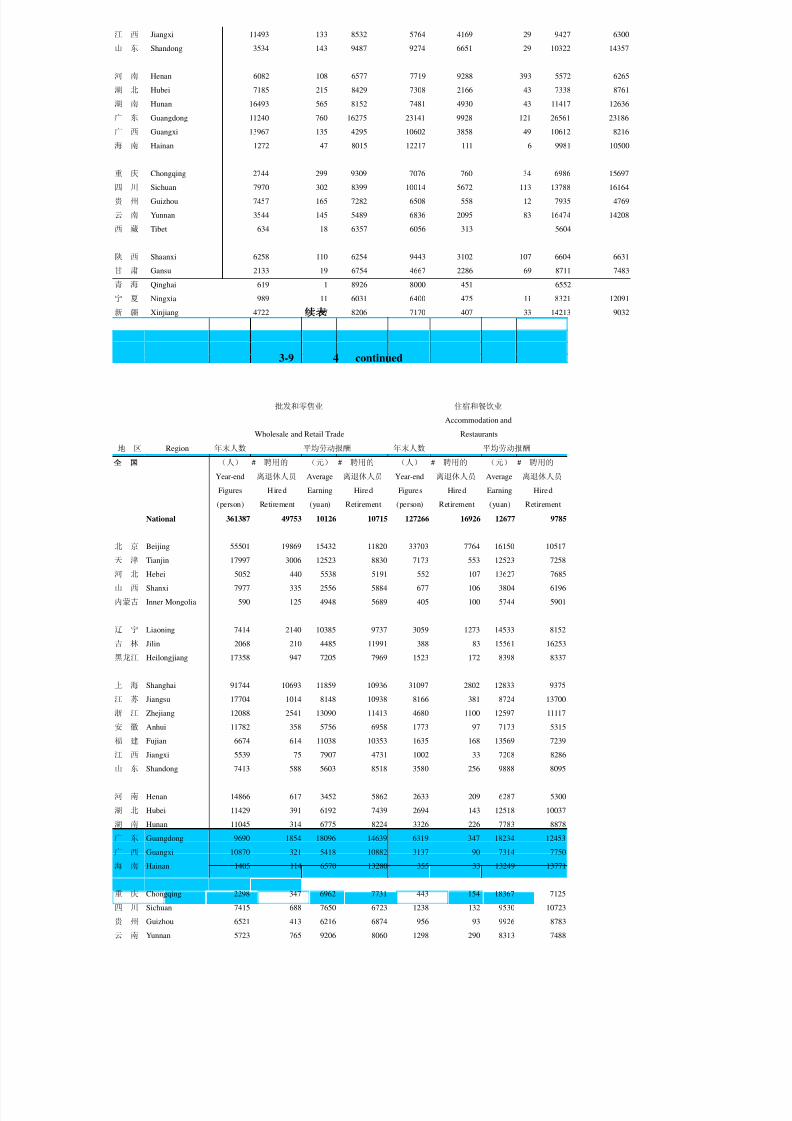
8/2/2019 China Labour Statistical Yearbook - 2004
http://slidepdf.com/reader/full/china-labour-statistical-yearbook-2004 265/464
江 西 Jiangxi 11493 133 8532 5764 4169 29 9427 6300
山 东 Shandong 3534 143 9487 9274 6651 29 10322 14357
河 南 Henan 6082 108 6577 7719 9288 393 5572 6265
湖 北 Hubei 7185 215 8429 7308 2166 43 7338 8761
湖 南 Hunan 16493 565 8152 7481 4930 43 11417 12636
广 东 Guangdong 11240 760 16275 23141 9928 121 26561 23186
广 西 Guangxi 13967 135 4295 10602 3858 49 10612 8216
海 南 Hainan 1272 47 8015 12217 111 6 9981 10500
重 庆 Chongqing 2744 299 9309 7076 760 34 6986 15697
四 川 Sichuan 7970 302 8399 10014 5672 113 13788 16164
贵 州 Guizhou 7457 165 7282 6508 558 12 7935 4769
云 南 Yunnan 3544 145 5489 6836 2095 83 16474 14208
西 藏 Tibet 634 18 6357 6056 313 5604
陕 西 Shaanxi 6258 110 6254 9443 3102 107 6604 6631
甘 肃 Gansu 2133 19 6754 4667 2286 69 8711 7483
青 海 Qinghai 619 1 8926 8000 451 6552
宁 夏 Ningxia 989 11 6031 6400 475 11 8321 12091
新 疆 Xinjiang 4722 97 8206 7170 407 33 14213 9032
3-9 4 continued
批发和零售业 住宿和餐饮业
Accommodation and
Wholesale and Retail Trade Restaurants
地 区 Region 年末人数 平均劳动报酬 年末人数 平均劳动报酬
(人) # 聘用的
(元) # 聘用的
(人) # 聘用的
(元) # 聘用的
Year-end 离退休人员 Average 离退休人员 Year-end 离退休人员 Average 离退休人员
Figures Hired Earning Hired Figures Hired Earning Hired
(person) Retirement (yuan) Retirement (person) Retirement (yuan) Retirement
National 361387 49753 10126 10715 127266 16926 12677 9785
北 京 Beijing 55501 19869 15432 11820 33703 7764 16150 10517
天 津 Tianjin 17997 3006 12523 8830 7173 553 12523 7258
河 北 Hebei 5052 440 5538 5191 552 107 13627 7685
山 西 Shanxi 7977 335 2556 5884 677 106 3804 6196
内蒙古 Inner Mongolia 590 125 4948 5689 405 100 5744 5901
辽 宁 Liaoning 7414 2140 10385 9737 3059 1273 14533 8152
吉 林 Jilin 2068 210 4485 11991 388 83 15561 16253
黑龙江 Heilongjiang 17358 947 7205 7969 1523 172 8398 8337
上 海 Shanghai 91744 10693 11859 10936 31097 2802 12833 9375
江 苏 Jiangsu 17704 1014 8148 10938 8166 381 8724 13700
浙 江 Zhejiang 12088 2541 13090 11413 4680 1100 12597 11117
安 徽 Anhui 11782 358 5756 6958 1773 97 7173 5315
福 建 Fujian 6674 614 11038 10353 1635 168 13569 7239
江 西 Jiangxi 5539 75 7907 4731 1002 33 7208 8286
山 东 Shandong 7413 588 5603 8518 3580 256 9888 8095
河 南 Henan 14866 617 3452 5862 2633 209 6287 5300
湖 北 Hubei 11429 391 6192 7439 2694 143 12518 10037
湖 南 Hunan 11045 314 6775 8224 3326 226 7783 8878
广 东 Guangdong 9690 1854 18096 14639 6319 347 18234 12453
广 西 Guangxi 10870 321 5418 10882 3137 90 7314 7750
海 南 Hainan 1405 114 6570 13280 355 33 13249 13771
重 庆 Chongqing 2298 347 6962 7731 443 154 18367 7125
四 川 Sichuan 7415 688 7650 6723 1238 132 9530 10723
贵 州 Guizhou 6521 413 6216 6874 956 93 9926 8783
云 南 Yunnan 5723 765 9206 8060 1298 290 8313 7488

8/2/2019 China Labour Statistical Yearbook - 2004
http://slidepdf.com/reader/full/china-labour-statistical-yearbook-2004 266/464
西 藏 Tibet 1031 59 9126 9775 1634 1 4781 12000
陕 西 Shaanxi 7244 346 4891 4853 2071 77 5600 6544
甘 肃 Gansu 2161 120 4993 8275 1164 25 5482 10115
青 海 Qinghai 679 21 5892 4375 139 4724
宁 夏 Ningxia 724 95 4525 4930 56 20 3495 6100
新 疆 Xinjiang 1385 333 9080 10953 390 91 16762 7650
3-9 5 continued
金融业 房地产业
Finance Real Estate
地 区 Region 年末人数 平均劳动报酬 年末人数 平均劳动报酬
(人) # 聘用的
(元) # 聘用的
(人) # 聘用的
(元) # 聘用的
Year-end 离退休人员 Average 离退休人员 Year-end 离退休人员 Average 离退休人员
Figures Hired Earning Hired Figures Hired Earning Hired
(person) Retirement (yuan) Retirement (person) Retirement (yuan) Retirement
National 671820 8765 13394 12166 119490 30486 16187 14376
北 京 Beijing 57622 684 21074 15405 38913 14347 22895 15772
天 津 Tianjin 16095 277 19032 8345 2586 474 14307 12081
河 北 Hebei 31140 193 9005 9780 427 193 7624 7335
山 西 Shanxi 24425 215 8153 6239 330 67 9221 5687
内蒙古 Inner Mongolia 6371 48 9131 6978 55 24 7243 9000
辽 宁 Liaoning 44129 178 12276 8205 3851 1013 10132 10161
吉 林 Jilin 10697 139 9075 6894 1337 117 7512 13034
黑龙江 Heilongjiang 16847 256 10273 11487 2779 190 5097 10221
上 海 Shanghai 31214 1908 27313 13602 33345 4752 13969 13959
江 苏 Jiangsu 56568 474 13087 10337 6488 889 10253 12318
浙 江 Zhejiang 36583 494 16116 11945 4554 1556 15947 16815
安 徽 Anhui 34635 307 8266 9261 933 136 8306 8839
福 建 Fujian 13174 140 12683 11099 2346 898 23466 16702
江 西 Jiangxi 15445 90 8588 3078 653 55 8718 8403
山 东 Shandong 65440 973 9922 23677 2200 743 12756 12119
河 南 Henan 40183 218 7329 5133 713 337 13835 9349
湖 北 Hubei 13069 103 8660 7034 1501 213 7036 11555
湖 南 Hunan 27811 225 9320 6887 1504 202 9321 12970
广 东 Guangdong 31993 512 24042 12651 4231 1084 24080 18584
广 西 Guangxi 7766 155 10472 5430 1566 294 11748 10187
海 南 Hainan 1020 3 13911 11000 207 82 14071 15651
重 庆 Chongqing 15321 128 14290 9876 1175 692 17534 12005
四 川 Sichuan 32615 495 15051 9245 1870 363 8152 12798
贵 州 Guizhou 5318 186 8897 6651 2252 767 9432 9735
云 南 Yunnan 3421 129 7402 6819 1412 558 8735 8689
西 藏 Tibet 113 2 10637 22000 53 1 17923 10000
陕 西 Shaanxi 10566 85 7830 5000 241 109 8140 7736
甘 肃 Gansu 3424 36 6915 8933 261 31 7873 13917
青 海 Qinghai 1973 14 10289 9000 24 0 4800
宁 夏 Ningxia 4697 8 16358 11273 265 105 7491 9743
新 疆 Xinjiang 12145 90 15923 21591 1418 194 7423 8846
3-9 6 continued
租赁和商务服务业 科学研究、技术服务和地质勘查业

8/2/2019 China Labour Statistical Yearbook - 2004
http://slidepdf.com/reader/full/china-labour-statistical-yearbook-2004 267/464
Tenancy and Scientific Research,Technical Service
Business Services and Geologic Perambulation
地 区 Region 年末人数 平均劳动报酬 年末人数 平均劳动报酬
(人) # 聘用的
(元) # 聘用的
(人) # 聘用的
(元) # 聘用的
Year-end 离退休人员 Average 离退休人员 Year-end 离退休人员 Average 离退休人员
Figures Hired Earning Hired Figures Hired Earning Hired
(person) Retirement (yuan) Retirement (person) Retirement (yuan) Retirement
National 159029 28845 22847 15012 155411 65518 17781 18820
北 京 Beijing 43691 14057 45034 17329 66189 30239 23581 21068
天 津 Tianjin 3909 652 14801 9291 5369 3168 14072 14470
河 北 Hebei 959 116 6720 5679 775 523 11067 13784
山 西 Shanxi 1301 526 5802 5846 1348 549 9671 10218
内蒙古 Inner Mongolia 4496 231 9852 8837 308 231 11276 12135
辽 宁 Liaoning 2515 1226 9243 9530 4064 2336 9926 9536
吉 林 Jilin 861 256 10205 13299 1457 676 13292 12800
黑龙江 Heilongjiang 1577 507 5220 8900 3635 1238 7806 9399
上 海 Shanghai 46290 3978 14375 14236 12331 7234 21542 21748
江 苏 Jiangsu 6177 658 10235 13680 5719 2085 15158 18385浙 江 Zhejiang 6153 1348 13046 15776 6331 2541 18405 20444
安 徽 Anhui 2913 247 4288 7329 1821 597 8109 11937
福 建 Fujian 2131 368 8879 12031 2184 598 13893 23003
江 西 Jiangxi 779 81 10435 8188 609 191 7934 17279
山 东 Shandong 968 463 11417 10819 2460 1535 11949 11586
河 南 Henan 2669 566 9040 9700 2049 1109 9266 12211
湖 北 Hubei 1936 249 7375 6925 4914 1139 10634 13552
湖 南 Hunan 12817 371 12402 14318 4102 891 9771 15909
广 东 Guangdong 2453 687 110101 25298 3769 2149 28538 31016
广 西 Guangxi 3180 255 3766 8360 2517 475 12906 20197
海 南 Hainan 348 34 5156 10119 293 107 13426 19894
重 庆 Chongqing 2037 238 15924 13000 1798 839 17037 19585
四 川 Sichuan 1690 150 9375 12155 3511 1727 11191 12635
贵 州 Guizhou 1241 288 11187 15913 792 262 8084 18370
云 南 Yunnan 1384 696 11293 12018 11559 1234 5824 10915
西 藏 Tibet 106 1 7566 12000 460 8 8400 28125
陕 西 Shaanxi 734 163 9103 5748 1618 823 10572 12796
甘 肃 Gansu 1552 65 3495 6524 671 419 9931 9975
青 海 Qinghai 560 7 4997 4429 1869 57 18920 10343
宁 夏 Ningxia 1044 99 7627 10530 273 170 11419 11076
新 疆 Xinjiang 558 262 10621 14272 616 368 13770 14878
3-9 7 continued
水利、环境和公共设施管理业 居民服务和其他服务业
Management of Water Conservancy, Resident Services
Environment and Public Establishment and Other Services
地 区 Region 年末人数 平均劳动报酬 年末人数 平均劳动报酬
(人) # 聘用的
(元) # 聘用的
(人) # 聘用的
(元) # 聘用的
Year-end 离退休人员 Average 离退休人员 Year-end 离退休人员 Average 离退休人员
Figures Hired Earning Hired Figures Hired Earning Hired
(person) Retirement (yuan) Retirement (person) Retirement (yuan) Retirement
National 86604 6528 5760 8767 52922 11353 10775 10698
北 京 Beijing 2985 1596 10044 8655 14141 6007 14102 11634
天 津 Tianjin 3125 76 6134 7354 3548 547 8554 9807
河 北 Hebei 1041 115 4395 5376 947 168 5552 2128
山 西 Shanxi 623 37 3456 4216 289 140 5357 6074
内蒙古 Inner Mongolia 1519 16 3931 6545 67 19 6132 4650

8/2/2019 China Labour Statistical Yearbook - 2004
http://slidepdf.com/reader/full/china-labour-statistical-yearbook-2004 268/464
辽 宁 Liaoning 4468 1877 6144 6410 848 339 6806 6036
吉 林 Jilin 1535 86 5961 6698 161 19 7321 5105
黑龙江 Heilongjiang 8338 110 3773 7603 1368 51 4519 6170
上 海 Shanghai 8015 720 10083 11789 12201 2534 10423 11058
江 苏 Jiangsu 7030 306 5906 11418 2766 255 7015 6285
浙 江 Zhejiang 4149 226 8157 19723 491 79 11129 9463
安 徽 Anhui 3665 167 3574 5753 406 87 6542 6059
福 建 Fujian 1421 64 6363 10408 427 123 15966 9804
江 西 Jiangxi 3862 36 5968 6310 300 4 8077 3500
山 东 Shandong 1748 61 4939 10015 195 43 8072 7444
河 南 Henan 2332 121 4126 10788 293 58 5552 10861
湖 北 Hubei 5068 91 5445 7901 145 15 7027 7067
湖 南 Hunan 4674 119 4832 4727 535 20 6017 10667
广 东 Guangdong 2072 204 8428 18819 404 84 17688 10267
广 西 Guangxi 3903 50 5312 9520 1130 100 16336 15784
海 南 Hainan 481 14 6673 13143 16 11 20105 11727
重 庆 Chongqing 347 52 3669 8067 61 42 21361 18524四 川 Sichuan 4218 65 3670 10833 214 40 6063 9375
贵 州 Guizhou 2010 20 4516 5800 259 100 10568 8250
云 南 Yunnan 2019 118 4807 8243 639 142 11716 8073
西 藏 Tibet 147 8235 7 4143
陕 西 Shaanxi 2507 59 2932 2288 1153 37 4688 6889
甘 肃 Gansu 1258 40 4199 10488 37 4 4371 6200
青 海 Qinghai 1434 5 3666 1800 65 6 2899 5667
宁 夏 Ningxia 256 36 4528 6306 25 9 4250 4375
新 疆 Xinjiang 354 41 6110 6627 9784 270 10874 13620
3-9 8 continued
教育 卫生、社会保障和社会福利业
Sanitation,Social Security
Education and Social Welfare
地 区 Region 年末人数 平均劳动报酬 年末人数 平均劳动报酬
(人) # 聘用的
(元) # 聘用的
(人) # 聘用的
(元) # 聘用的
Year-end 离退休人员 Average 离退休人员 Year-end 离退休人员 Average 离退休人员
Figures Hired Earning Hired Figures Hired Earning Hired
(person) Retirement (yuan) Retirement (person) Retirement (yuan) Retirement
National 410444 49804 7019 13162 140820 48064 10520 14037
北 京 Beijing 27360 11794 21487 18023 5657 3458 25118 17959
天 津 Tianjin 8399 4318 9958 10237 2546 1221 7184 7928
河 北 Hebei 11598 623 4766 5270 2404 1286 7553 8723
山 西 Shanxi 15184 355 3136 8379 1985 1014 8239 10369
内蒙古 Inner Mongolia 4831 355 4349 7465 1210 519 8837 10442
辽 宁 Liaoning 13139 2718 5731 5817 6543 3102 8419 9186
吉 林 Jilin 2466 559 10470 16317 1906 963 7879 7770
黑龙江 Heilongjiang 4409 564 6809 9896 3032 850 7720 10753
上 海 Shanghai 20614 8677 12528 14511 14141 3967 11959 13337
江 苏 Jiangsu 14761 1469 7863 9917 12296 3345 9426 11481
浙 江 Zhejiang 18415 3028 12248 15934 8341 4000 17892 22306
安 徽 Anhui 9420 614 5494 9523 6413 2047 8606 13199
福 建 Fujian 8172 736 7364 11742 4317 1191 11284 14003
江 西 Jiangxi 8575 387 6416 9174 4643 932 7606 11060
山 东 Shandong 16400 1369 5951 9392 6379 2757 8873 11326
河 南 Henan 10969 808 5413 10193 5435 2335 9958 13098
湖 北 Hubei 28109 1302 4976 8085 6119 1428 7913 11987
湖 南 Hunan 13848 1215 8112 13056 6118 1414 9607 15811
广 东 Guangdong 30213 2634 8499 17487 8320 3950 18992 23603
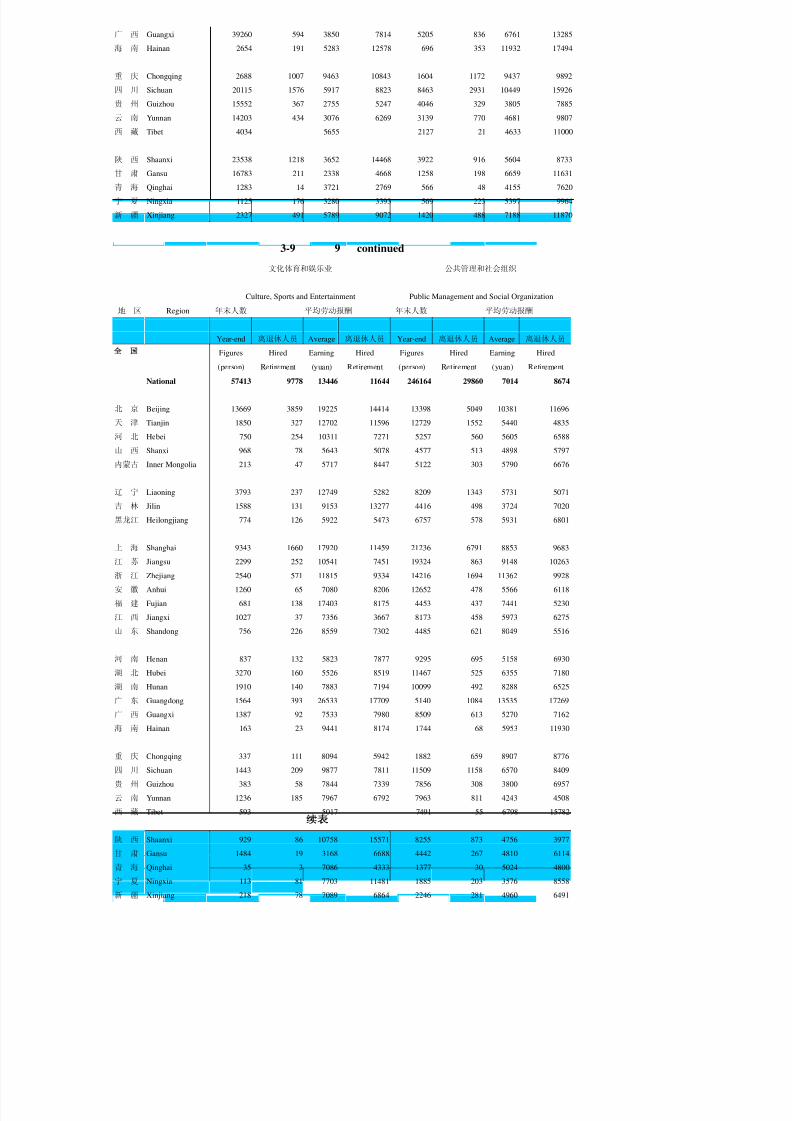
8/2/2019 China Labour Statistical Yearbook - 2004
http://slidepdf.com/reader/full/china-labour-statistical-yearbook-2004 269/464
广 西 Guangxi 39260 594 3850 7814 5205 836 6761 13285
海 南 Hainan 2654 191 5283 12578 696 353 11932 17494
重 庆 Chongqing 2688 1007 9463 10843 1604 1172 9437 9892
四 川 Sichuan 20115 1576 5917 8823 8463 2931 10449 15926
贵 州 Guizhou 15552 367 2755 5247 4046 329 3805 7885
云 南 Yunnan 14203 434 3076 6269 3139 770 4681 9807
西 藏 Tibet 4034 5655 2127 21 4633 11000
陕 西 Shaanxi 23538 1218 3652 14468 3922 916 5604 8733
甘 肃 Gansu 16783 211 2338 4668 1258 198 6659 11631
青 海 Qinghai 1283 14 3721 2769 566 48 4155 7620
宁 夏 Ningxia 1125 176 3280 3393 569 223 5397 9964
新 疆 Xinjiang 2327 491 5789 9072 1420 488 7188 11870
3-9 9 continued
文化体育和娱乐业 公共管理和社会组织
Culture, Sports and Entertainment Public Management and Social Organization
地 区 Region 年末人数 平均劳动报酬 年末人数 平均劳动报酬
(人) # 聘用的
(元) # 聘用的
(人) # 聘用的
(元) # 聘用的
Year-end 离退休人员 Average 离退休人员 Year-end 离退休人员 Average 离退休人员
Figures Hired Earning Hired Figures Hired Earning Hired
(person) Retirement (yuan) Retirement (person) Retirement (yuan) Retirement
National 57413 9778 13446 11644 246164 29860 7014 8674
北 京 Beijing 13669 3859 19225 14414 13398 5049 10381 11696
天 津 Tianjin 1850 327 12702 11596 12729 1552 5440 4835
河 北 Hebei 750 254 10311 7271 5257 560 5605 6588
山 西 Shanxi 968 78 5643 5078 4577 513 4898 5797
内蒙古 Inner Mongolia 213 47 5717 8447 5122 303 5790 6676
辽 宁 Liaoning 3793 237 12749 5282 8209 1343 5731 5071
吉 林 Jilin 1588 131 9153 13277 4416 498 3724 7020
黑龙江 Heilongjiang 774 126 5922 5473 6757 578 5931 6801
上 海 Shanghai 9343 1660 17920 11459 21236 6791 8853 9683
江 苏 Jiangsu 2299 252 10541 7451 19324 863 9148 10263
浙 江 Zhejiang 2540 571 11815 9334 14216 1694 11362 9928
安 徽 Anhui 1260 65 7080 8206 12652 478 5566 6118
福 建 Fujian 681 138 17403 8175 4453 437 7441 5230
江 西 Jiangxi 1027 37 7356 3667 8173 458 5973 6275
山 东 Shandong 756 226 8559 7302 4485 621 8049 5516
河 南 Henan 837 132 5823 7877 9295 695 5158 6930
湖 北 Hubei 3270 160 5526 8519 11467 525 6355 7180
湖 南 Hunan 1910 140 7883 7194 10099 492 8288 6525
广 东 Guangdong 1564 393 26533 17709 5140 1084 13535 17269
广 西 Guangxi 1387 92 7533 7980 8509 613 5270 7162
海 南 Hainan 163 23 9441 8174 1744 68 5953 11930
重 庆 Chongqing 337 111 8094 5942 1882 659 8907 8776
四 川 Sichuan 1443 209 9877 7811 11509 1158 6570 8409
贵 州 Guizhou 383 58 7844 7339 7856 308 3800 6957
云 南 Yunnan 1236 185 7967 6792 7963 811 4243 4508
西 藏 Tibet 593 5017 7491 55 6798 15782
陕 西 Shaanxi 929 86 10758 15571 8255 873 4756 3977
甘 肃 Gansu 1484 19 3168 6688 4442 267 4810 6114
青 海 Qinghai 35 3 7086 4333 1377 30 5024 4800
宁 夏 Ningxia 113 81 7703 11481 1885 203 3576 8558
新 疆 Xinjiang 218 78 7089 6864 2246 281 4960 6491

8/2/2019 China Labour Statistical Yearbook - 2004
http://slidepdf.com/reader/full/china-labour-statistical-yearbook-2004 270/464
3-10
EMPLOYMENT AND NOT-ON-POST STAFF AND WORKERS
IN URBAN UNITS BY REGISTRATION STATUS AND REGION
(2003)
单位:千人 (1 000 persons)
就业人员
Employment 在岗职工
On-post Staff and Workers
地 区 Region 合 计 国 有 集 体 其 他 合 计 国 有 集 体 其 他
单 位 单 位 单 位 单 位 单 位 单 位
Total State- Other Total State- Other
Owned Collective-
Ownership Owned Collective-
Ownership
Units owned Units
Units Units owned Units
Units
National 109697 68756 9999 30943 104920 66213 9505 29203
北 京 Beijing 4912 2128 301 2484 4363 1976 261 2127
天 津 Tianjin 1910 907 140 864 1749 858 118 774
河 北 Hebei 4992 3736 429 828 4868 3673 411 784
山 西 Shanxi 3569 2547 390 632 3479 2488 374 617
内蒙古 Inner Mongolia 2444 1692 158 594 2403 1661 155 587
辽 宁 Liaoning 5002 3178 503 1321 4835 3102 485 1249
吉 林 Jilin 2919 2076 282 561 2868 2044 276 548
黑龙江 Heilongjiang 5153 3427 559 1166 4878 3213 552 1112
上 海 Shanghai 3421 1637 211 1574 2792 1407 155 1230
江 苏 Jiangsu 6085 3174 551 2360 5791 3050 526 2215
浙 江 Zhejiang 3928 1790 322 1816 3732 1704 305 1723
安 徽 Anhui 3546 2220 432 894 3378 2122 407 848
福 建 Fujian 3446 1525 244 1677 3341 1471 231 1639
江 西 Jiangxi 2677 2044 211 422 2567 1961 200 406
山 东 Shandong 7785 4967 756 2062 7623 4875 741 2008
河 南 Henan 7017 3986 1165 1866 6825 3880 1137 1808
湖 北 Hubei 5024 3412 401 1211 4861 3302 383 1176
湖 南 Hunan 4016 3132 344 541 3794 2975 313 506
广 东 Guangdong 7811 3766 785 3261 7635 3656 770 3209
广 西 Guangxi 2717 2009 230 478 2557 1899 201 458
海 南 Hainan 735 587 41 108 716 573 39 105
重 庆 Chongqing 2102 1244 194 665 2056 1219 189 648
四 川 Sichuan 5057 3278 509 1270 4867 3159 487 1221
贵 州 Guizhou 1975 1484 144 346 1887 1417 137 332
云 南 Yunnan 2533 1877 160 496 2440 1818 146 476
西 藏 Tibet 174 161 5 7 145 137 4 4
陕 西 Shaanxi 3303 2544 248 511 3194 2464 233 497
甘 肃 Gansu 1954 1596 158 201 1890 1551 147 192
青 海 Qinghai 427 345 25 57 411 333 24 54
宁 夏 Ningxia 616 400 23 193 594 387 22 185
新 疆 Xinjiang 2447 1889 80 478 2379 1840 76 464

8/2/2019 China Labour Statistical Yearbook - 2004
http://slidepdf.com/reader/full/china-labour-statistical-yearbook-2004 271/464
3-10 continued
单位:千人 (1 000 persons)
不在岗职工
其他就业人员
Others Not-on-post Staff and Workers
地 区 Region 合 计 国 有 集 体 其 他 合 计 国 有 集 体 其 他
单 位 单 位 单 位 单 位 单 位 单 位
Total State- Other Total State- Other
Owned Collective-
Ownership Owned Collective-
Ownership
Units owned Units
Units Units owned Units
Units
National 4777 2543 494 1740 17851 10553 4061 3238
北 京 Beijing 549 152 39 357 324 197 24 104
天 津 Tianjin 161 49 22 90 408 242 88 78
河 北 Hebei 124 62 18 43 897 601 164 133
山 西 Shanxi 90 59 15 15 690 419 147 124
内蒙古 Inner Mongolia 41 31 3 7 249 132 58 59
辽 宁 Liaoning 166 76 18 72 1577 643 726 208
吉 林 Jilin 51 32 5 13 1053 664 256 133
黑龙江 Heilongjiang 275 214 7 53 1601 914 425 263
上 海 Shanghai 629 230 55 344 793 464 144 185
江 苏 Jiangsu 294 124 25 145 886 408 186 292
浙 江 Zhejiang 196 86 16 93 187 87 34 67
安 徽 Anhui 168 97 25 46 553 278 142 133
福 建 Fujian 105 55 13 38 186 106 53 27
江 西 Jiangxi 110 82 11 16 764 532 139 94
山 东 Shandong 162 92 15 54 1218 676 289 252
河 南 Henan 192 106 28 57 1077 580 244 253
湖 北 Hubei 163 110 19 35 1013 670 155 188
湖 南 Hunan 222 157 31 34 1208 822 253 134
广 东 Guangdong 176 110 14 52 519 323 136 60
广 西 Guangxi 160 110 29 21 294 193 57 44
海 南 Hainan 19 14 2 3 121 98 18 5
重 庆 Chongqing 46 25 4 17 244 130 56 58
四 川 Sichuan 189 119 21 49 524 326 65 132
贵 州 Guizhou 88 67 7 13 218 156 28 35
云 南 Yunnan 92 59 14 20 210 144 25 41
西 藏 Tibet 29 24 2 3 3 3 0 0
陕 西 Shaanxi 109 80 15 14 604 434 111 60
甘 肃 Gansu 64 44 11 9 228 174 29 25
青 海 Qinghai 16 13 1 3 37 25 2 9
宁 夏 Ningxia 22 13 2 8 32 20 2 10
新 疆 Xinjiang 67 49 5 14 131 94 4 33

8/2/2019 China Labour Statistical Yearbook - 2004
http://slidepdf.com/reader/full/china-labour-statistical-yearbook-2004 272/464
3-11
EARNINGS AND LIVING SUBSIDIES IN URBAN UNITS
BY REGISTRATION STATUS AND REGION
(2003)
单位:亿元 (100 million yuan)
就业人员劳动报酬
Earnings of Employment 在岗职工工资总额
Wages of On-post Staff and Workers
地 区 Region 合 计 国 有 集 体 其 他 合 计 国 有 集 体 其 他
单 位 单 位 单 位 单 位 单 位 单 位
Total State- Other Total State- Other
Owned Collective-
Ownership Owned Collective-
Ownership
Units owned Units
Units Units owned Units
Units
National 15329.6 9911.9 867.1 4550.6 14743.5 9693.9 829.4 4220.3
北 京 Beijing 1220.3 588.6 40.8 590.9 1098.9 565.5 35.0 498.4
天 津 Tianjin 350.6 172.8 15.5 162.3 325.4 168.4 13.7 143.3
河 北 Hebei 559.3 438.7 30.6 90.0 548.2 434.4 29.2 84.6
山 西 Shanxi 377.2 281.6 25.5 70.1 371.5 277.8 24.8 68.9
内蒙古 Inner Mongolia 275.4 201.0 11.7 62.6 272.3 198.8 11.6 62.0
辽 宁 Liaoning 666.6 438.8 40.1 187.7 648.5 432.7 38.9 176.9
吉 林 Jilin 326.4 232.2 22.9 71.2 321.6 229.9 22.5 69.2
黑龙江 Heilongjiang 554.4 365.8 30.8 157.8 535.4 352.8 30.0 152.6
上 海 Shanghai 873.1 434.9 32.4 405.7 768.7 408.5 27.0 333.1
江 苏 Jiangsu 956.3 552.3 55.4 348.6 917.3 540.6 53.5 323.2
浙 江 Zhejiang 815.7 473.5 50.2 292.0 784.8 462.1 48.7 274.1
安 徽 Anhui 372.4 247.3 27.9 97.3 361.0 241.1 26.5 93.4
福 建 Fujian 484.6 247.9 27.0 209.6 468.9 242.6 25.9 200.4
江 西 Jiangxi 278.7 221.9 14.3 42.5 271.1 216.2 13.8 41.2
山 东 Shandong 974.4 686.3 64.2 223.8 954.8 679.1 63.2 212.4
河 南 Henan 732.7 443.1 89.8 199.9 720.5 436.3 88.5 195.7
湖 北 Hubei 531.6 398.5 28.3 104.8 520.1 391.1 27.2 101.8
湖 南 Hunan 482.9 389.5 28.8 64.6 465.0 376.9 26.7 61.3
广 东 Guangdong 1555.1 855.4 84.9 614.8 1515.6 841.0 83.5 591.0
广 西 Guangxi 314.4 240.4 17.5 56.5 305.3 234.5 15.8 55.0
海 南 Hainan 77.4 60.6 2.9 13.9 75.4 59.7 2.8 13.0
重 庆 Chongqing 259.7 169.1 16.4 74.1 254.0 166.6 16.0 71.4
四 川 Sichuan 622.5 453.0 43.7 125.8 604.5 441.3 42.3 120.9
贵 州 Guizhou 214.5 166.9 10.7 36.9 209.3 163.0 10.3 36.0
云 南 Yunnan 320.6 248.9 13.1 58.6 315.0 246.2 12.3 56.4
西 藏 Tibet 40.9 39.3 0.4 1.2 38.8 37.6 0.3 0.9
陕 西 Shaanxi 372.8 296.5 17.0 59.2 366.3 292.1 16.1 58.1
甘 肃 Gansu 234.1 200.3 11.7 22.1 230.9 198.2 11.2 21.5
青 海 Qinghai 64.6 56.6 2.1 5.9 63.5 55.8 2.0 5.6
宁 夏 Ningxia 81.2 54.4 2.2 24.6 79.4 53.5 2.1 23.9
新 疆 Xinjiang 339.4 255.7 8.1 75.6 331.5 249.7 7.7 74.1
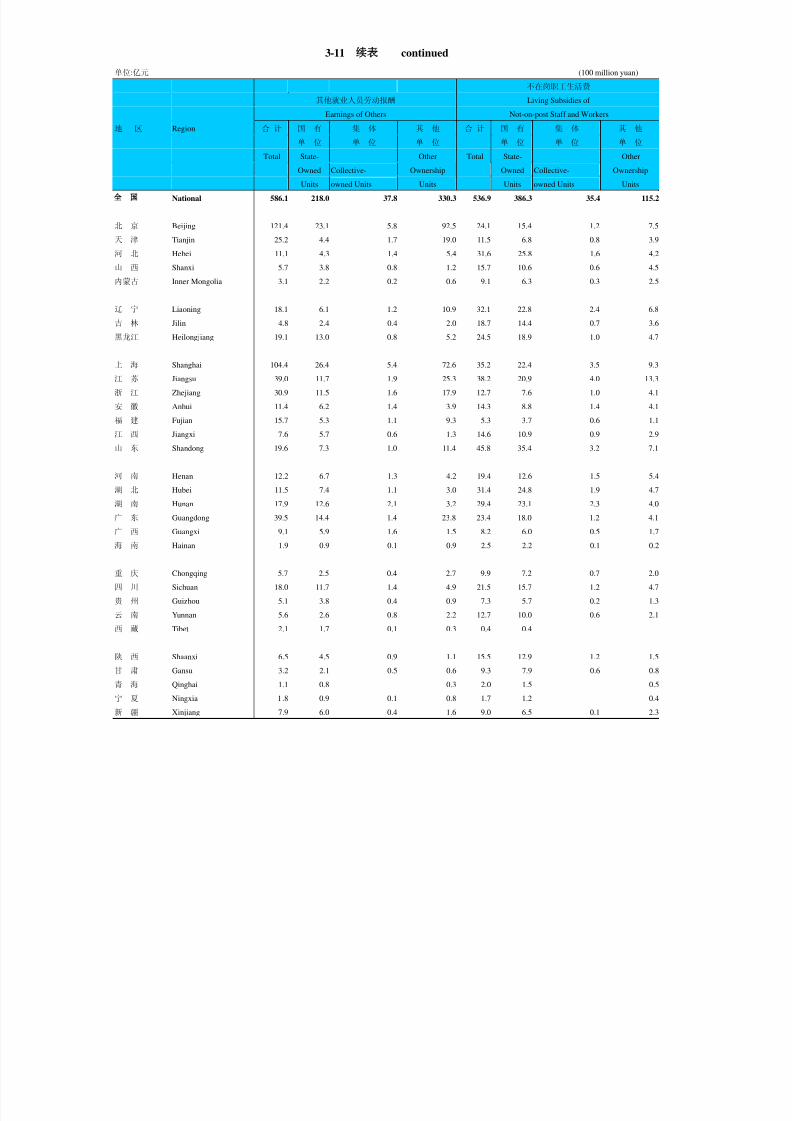
8/2/2019 China Labour Statistical Yearbook - 2004
http://slidepdf.com/reader/full/china-labour-statistical-yearbook-2004 273/464
3-11 continued
单位:亿元 (100 million yuan)
不在岗职工生活费
其他就业人员劳动报酬 Living Subsidies of
Earnings of Others Not-on-post Staff and Workers
地 区 Region 合 计 国 有 集 体 其 他 合 计 国 有 集 体 其 他
单 位 单 位 单 位 单 位 单 位 单 位
Total State- Other Total State- Other
Owned Collective-
Ownership Owned Collective-
Ownership
Units owned Units
Units Units owned Units
Units
National 586.1 218.0 37.8 330.3 536.9 386.3 35.4 115.2
北 京 Beijing 121.4 23.1 5.8 92.5 24.1 15.4 1.2 7.5
天 津 Tianjin 25.2 4.4 1.7 19.0 11.5 6.8 0.8 3.9
河 北 Hebei 11.1 4.3 1.4 5.4 31.6 25.8 1.6 4.2
山 西 Shanxi 5.7 3.8 0.8 1.2 15.7 10.6 0.6 4.5
内蒙古 Inner Mongolia 3.1 2.2 0.2 0.6 9.1 6.3 0.3 2.5
辽 宁 Liaoning 18.1 6.1 1.2 10.9 32.1 22.8 2.4 6.8
吉 林 Jilin 4.8 2.4 0.4 2.0 18.7 14.4 0.7 3.6
黑龙江 Heilongjiang 19.1 13.0 0.8 5.2 24.5 18.9 1.0 4.7
上 海 Shanghai 104.4 26.4 5.4 72.6 35.2 22.4 3.5 9.3
江 苏 Jiangsu 39.0 11.7 1.9 25.3 38.2 20.9 4.0 13.3
浙 江 Zhejiang 30.9 11.5 1.6 17.9 12.7 7.6 1.0 4.1
安 徽 Anhui 11.4 6.2 1.4 3.9 14.3 8.8 1.4 4.1
福 建 Fujian 15.7 5.3 1.1 9.3 5.3 3.7 0.6 1.1
江 西 Jiangxi 7.6 5.7 0.6 1.3 14.6 10.9 0.9 2.9
山 东 Shandong 19.6 7.3 1.0 11.4 45.8 35.4 3.2 7.1
河 南 Henan 12.2 6.7 1.3 4.2 19.4 12.6 1.5 5.4
湖 北 Hubei 11.5 7.4 1.1 3.0 31.4 24.8 1.9 4.7
湖 南 Hunan 17.9 12.6 2.1 3.2 29.4 23.1 2.3 4.0
广 东 Guangdong 39.5 14.4 1.4 23.8 23.4 18.0 1.2 4.1
广 西 Guangxi 9.1 5.9 1.6 1.5 8.2 6.0 0.5 1.7
海 南 Hainan 1.9 0.9 0.1 0.9 2.5 2.2 0.1 0.2
重 庆 Chongqing 5.7 2.5 0.4 2.7 9.9 7.2 0.7 2.0
四 川 Sichuan 18.0 11.7 1.4 4.9 21.5 15.7 1.2 4.7
贵 州 Guizhou 5.1 3.8 0.4 0.9 7.3 5.7 0.2 1.3
云 南 Yunnan 5.6 2.6 0.8 2.2 12.7 10.0 0.6 2.1
西 藏 Tibet 2.1 1.7 0.1 0.3 0.4 0.4
陕 西 Shaanxi 6.5 4.5 0.9 1.1 15.5 12.9 1.2 1.5
甘 肃 Gansu 3.2 2.1 0.5 0.6 9.3 7.9 0.6 0.8
青 海 Qinghai 1.1 0.8 0.3 2.0 1.5 0.5
宁 夏 Ningxia 1.8 0.9 0.1 0.8 1.7 1.2 0.4
新 疆 Xinjiang 7.9 6.0 0.4 1.6 9.0 6.5 0.1 2.3

8/2/2019 China Labour Statistical Yearbook - 2004
http://slidepdf.com/reader/full/china-labour-statistical-yearbook-2004 274/464
3-12
AVERAGE EARNING AND AVERAGE LIVING SUBSIDY
IN URBAN UNITS BY REGISTRATION STATUS AND REGION
(2003)
单位:元 (yuan)
就业人员平均劳动报酬
Average Earning of Employment 在岗职工平均工资
Average Wage of On-post Staff and Workers
地 区 Region 合 计 国 有 集 体 其 他 合 计 国 有 集 体 其 他
单 位 单 位 单 位 单 位 单 位 单 位
Tota State- Other Tota State- Other
Owned Collective-
Ownership Owned Collective-
Ownership
Units owned Units
Units Units owned Units
Units
National 13969 14358 8627 14843 14040 14577 8678 14574
北 京 Beijing 25008 27555 13776 24145 25312 28464 13580 23769
天 津 Tianjin 18511 18819 10865 19480 18648 19352 11285 19026
河 北 Hebei 11105 11700 6933 10648 11189 11783 6919 10701
山 西 Shanxi 10620 11093 6562 11221 10729 11213 6629 11276
内蒙古 Inner Mongolia 11208 11837 7605 10361 11279 11929 7620 10391
辽 宁 Liaoning 12921 13449 7574 13730 13008 13603 7629 13665
吉 林 Jilin 11048 11063 8002 12528 11081 11124 8018 12471
黑龙江 Heilongjiang 10787 10708 5446 13636 11038 11034 5425 13871
上 海 Shanghai 25565 26168 15173 26356 27304 28406 16973 27354
江 苏 Jiangsu 15619 17201 9733 14881 15712 17502 9836 14656
浙 江 Zhejiang 21116 26646 15779 16518 21367 27293 16058 16344
安 徽 Anhui 10419 11035 6358 10867 10581 11220 6407 10999
福 建 Fujian 14343 16223 11270 13016 14310 16460 11386 12719
江 西 Jiangxi 10382 10765 6808 10292 10521 10918 6905 10359
山 东 Shandong 12554 13856 8380 10962 12567 13975 8442 10680
河 南 Henan 10639 11280 7828 11028 10749 11397 7894 11160
湖 北 Hubei 10575 11645 7097 8691 10692 11806 7137 8698
湖 南 Hunan 12002 12381 8407 12075 12221 12604 8546 12226
广 东 Guangdong 20052 22675 10823 19223 19986 22944 10836 18782
广 西 Guangxi 11611 11972 7681 11972 11953 12331 7962 12118海 南 Hainan 10396 10226 6994 12574 10397 10305 7029 12130
重 庆 Chongqing 12409 13508 8527 11440 12425 13586 8552 11316
四 川 Sichuan 12320 13769 8647 10005 12441 13923 8723 10038
贵 州 Guizhou 10801 11125 7392 10819 11037 11390 7504 10975
云 南 Yunnan 12629 13193 8293 11865 12870 13471 8519 11886
西 藏 Tibet 23730 24588 7753 16561 26931 27611 9348 20475
陕 西 Shaanxi 11276 11634 6761 11713 11461 11833 6858 11794
甘 肃 Gansu 12062 12688 7417 10814 12307 12929 7573 11010
青 海 Qinghai 15044 16340 8219 10246 15356 16692 8306 10341
宁 夏 Ningxia 12811 13529 8655 11927 12981 13721 8924 12009
新 疆 Xinjiang 13185 13132 9938 13857 13255 13199 9966 13937
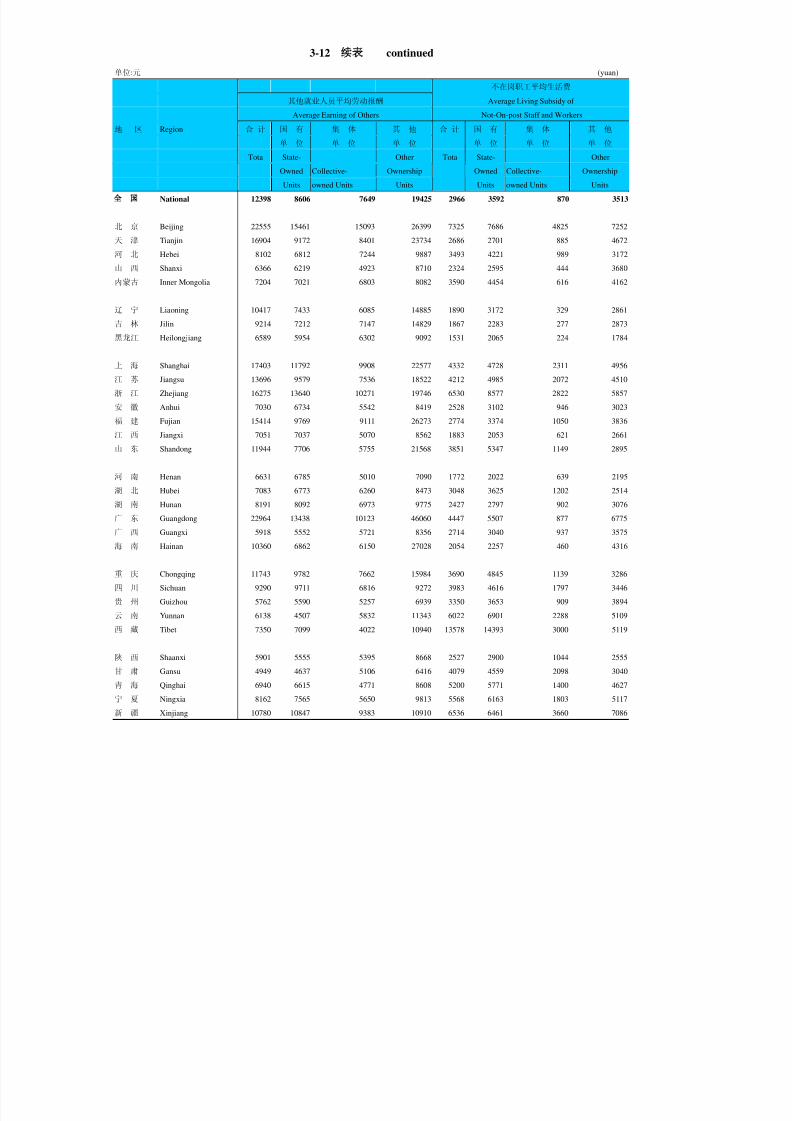
8/2/2019 China Labour Statistical Yearbook - 2004
http://slidepdf.com/reader/full/china-labour-statistical-yearbook-2004 275/464
3-12 continued
单位:元 (yuan)
不在岗职工平均生活费
其他就业人员平均劳动报酬 Average Living Subsidy of
Average Earning of Others Not-On-post Staff and Workers
地 区 Region 合 计 国 有 集 体 其 他 合 计 国 有 集 体 其 他
单 位 单 位 单 位 单 位 单 位 单 位
Tota State- Other Tota State- Other
Owned Collective-
Ownership Owned Collective-
Ownership
Units owned Units
Units Units owned Units
Units
National 12398 8606 7649 19425 2966 3592 870 3513
北 京 Beijing 22555 15461 15093 26399 7325 7686 4825 7252
天 津 Tianjin 16904 9172 8401 23734 2686 2701 885 4672
河 北 Hebei 8102 6812 7244 9887 3493 4221 989 3172
山 西 Shanxi 6366 6219 4923 8710 2324 2595 444 3680
内蒙古 Inner Mongolia 7204 7021 6803 8082 3590 4454 616 4162
辽 宁 Liaoning 10417 7433 6085 14885 1890 3172 329 2861
吉 林 Jilin 9214 7212 7147 14829 1867 2283 277 2873
黑龙江 Heilongjiang 6589 5954 6302 9092 1531 2065 224 1784
上 海 Shanghai 17403 11792 9908 22577 4332 4728 2311 4956
江 苏 Jiangsu 13696 9579 7536 18522 4212 4985 2072 4510
浙 江 Zhejiang 16275 13640 10271 19746 6530 8577 2822 5857
安 徽 Anhui 7030 6734 5542 8419 2528 3102 946 3023
福 建 Fujian 15414 9769 9111 26273 2774 3374 1050 3836
江 西 Jiangxi 7051 7037 5070 8562 1883 2053 621 2661
山 东 Shandong 11944 7706 5755 21568 3851 5347 1149 2895
河 南 Henan 6631 6785 5010 7090 1772 2022 639 2195
湖 北 Hubei 7083 6773 6260 8473 3048 3625 1202 2514
湖 南 Hunan 8191 8092 6973 9775 2427 2797 902 3076
广 东 Guangdong 22964 13438 10123 46060 4447 5507 877 6775
广 西 Guangxi 5918 5552 5721 8356 2714 3040 937 3575
海 南 Hainan 10360 6862 6150 27028 2054 2257 460 4316
重 庆 Chongqing 11743 9782 7662 15984 3690 4845 1139 3286
四 川 Sichuan 9290 9711 6816 9272 3983 4616 1797 3446
贵 州 Guizhou 5762 5590 5257 6939 3350 3653 909 3894
云 南 Yunnan 6138 4507 5832 11343 6022 6901 2288 5109
西 藏 Tibet 7350 7099 4022 10940 13578 14393 3000 5119
陕 西 Shaanxi 5901 5555 5395 8668 2527 2900 1044 2555
甘 肃 Gansu 4949 4637 5106 6416 4079 4559 2098 3040
青 海 Qinghai 6940 6615 4771 8608 5200 5771 1400 4627
宁 夏 Ningxia 8162 7565 5650 9813 5568 6163 1803 5117
新 疆 Xinjiang 10780 10847 9383 10910 6536 6461 3660 7086

8/2/2019 China Labour Statistical Yearbook - 2004
http://slidepdf.com/reader/full/china-labour-statistical-yearbook-2004 276/464
3-13
INCREASE OF EMPLOYMENT IN URBAN UNITS BY REGION
(2003)
单位: 人 (person)
从 农 村 从 城 镇 录用的复员 录用的大、
合 计 中专、 调入 #由外省、自 其 他
招 收 招 收 转业军人 技工学校 治区、直辖
地 区 Region Total Recruited 毕业生 Trans- 市调入 Others
Recruited Recruited Demobilized ferred
from from and Recruit- Into Transferred
Country- Cities Transferred ed Gra- from Other
side and Towns Armymen duates Regions
National 10342144 3097832 1516867 228476 1610380 1710176 71259 2178413
北 京 Beijing 881348 275319 113279 5720 101011 144449 19909 241570
天 津 Tianjin 246226 52738 29581 1747 46704 68015 2370 47441
河 北 Hebei 242409 60589 26843 10524 60811 52768 1769 30874
山 西 Shanxi 214524 50938 24222 7536 38815 32376 404 60637
内蒙古 Inner Mongolia 169361 40924 36239 5449 23315 31733 248 31701
辽 宁 Liaoning 358784 81901 54829 10501 52526 94364 1319 64663
吉 林 Jilin 158811 18891 20084 8152 23329 40977 1023 47378
黑龙江 Heilongjiang 487104 17554 47346 11459 35021 116751 362 258973
上 海 Shanghai 740230 93251 119885 3582 57073 134360 7747 332079
江 苏 Jiangsu 708107 147681 143764 9444 182534 94607 2961 130077
浙 江 Zhejiang 585843 270510 89511 6612 85676 61220 4241 72314
安 徽 Anhui 183921 35315 34854 7679 40832 27841 362 37400
福 建 Fujian 709854 379533 103276 8612 67477 42684 1612 108272
江 西 Jiangxi 187722 36614 29517 8432 25713 30671 2084 56775
山 东 Shandong 629702 212077 99222 18377 126590 121671 3037 51765
河 南 Henan 362635 90368 40815 19450 74630 84503 1389 52869
湖 北 Hubei 224133 60698 47956 6532 36557 37888 775 34502
湖 南 Hunan 232004 36661 26777 10166 37502 71712 2533 49186
广 东 Guangdong 1059288 466455 198065 20721 187681 84662 9909 101704
广 西 Guangxi 159199 31578 21828 3538 32685 39668 627 29902
海 南 Hainan 41949 9579 8075 1775 7314 5951 504 9255
重 庆 Chongqing 220578 90602 33328 5587 31822 34384 737 24855
四 川 Sichuan 354020 122587 63038 10219 50274 61188 1289 46714
贵 州 Guizhou 115254 24418 16863 3357 31024 25066 466 14526
云 南 Yunnan 273587 85285 24359 4243 37398 48442 603 73860
西 藏 Tibet 9095 876 552 377 3770 2860 97 660
陕 西 Shaanxi 164576 22722 19031 9261 53651 37626 737 22285
甘 肃 Gansu 83250 10762 6198 3941 22978 18603 404 20768
青 海 Qinghai 29847 9212 2890 741 4356 5782 192 6866
宁 夏 Ningxia 59238 26053 6034 1352 6515 11794 131 7490
新 疆 Xinjiang 449545 236141 28606 3390 24796 45560 1418 111052
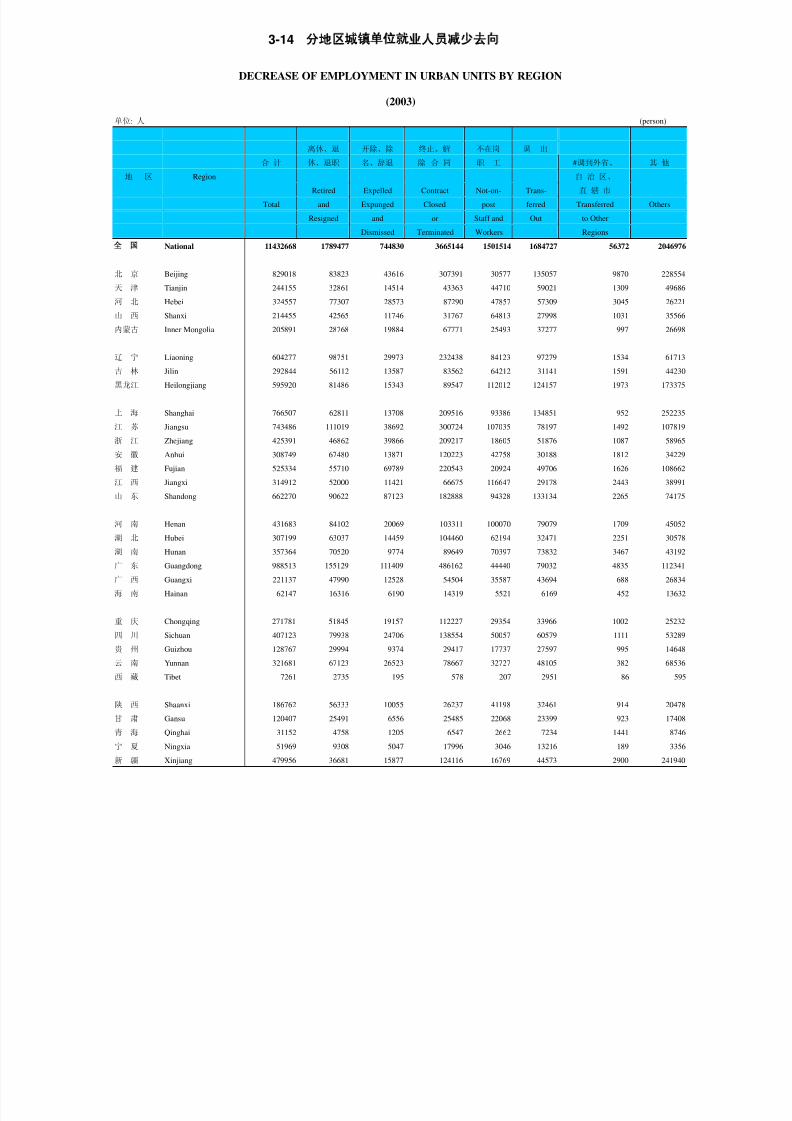
8/2/2019 China Labour Statistical Yearbook - 2004
http://slidepdf.com/reader/full/china-labour-statistical-yearbook-2004 277/464
3-14
DECREASE OF EMPLOYMENT IN URBAN UNITS BY REGION
(2003)
单位: 人 (person)
离休、退 开除、除 终止、解 不在岗 调 出
合 计 休、退职 名、辞退 除 合 同 职 工 #调到外省、 其 他
地 区 Region 自 治 区、
Retired Expelled Contract Not-on- Trans- 直 辖 市
Total and Expunged Closed post ferred Transferred Others
Resigned and or Staff and Out to Other
Dismissed Terminated Workers Regions
National 11432668 1789477 744830 3665144 1501514 1684727 56372 2046976
北 京 Beijing 829018 83823 43616 307391 30577 135057 9870 228554
天 津 Tianjin 244155 32861 14514 43363 44710 59021 1309 49686
河 北 Hebei 324557 77307 28573 87290 47857 57309 3045 26221
山 西 Shanxi 214455 42565 11746 31767 64813 27998 1031 35566
内蒙古 Inner Mongolia 205891 28768 19884 67771 25493 37277 997 26698
辽 宁 Liaoning 604277 98751 29973 232438 84123 97279 1534 61713
吉 林 Jilin 292844 56112 13587 83562 64212 31141 1591 44230
黑龙江 Heilongjiang 595920 81486 15343 89547 112012 124157 1973 173375
上 海 Shanghai 766507 62811 13708 209516 93386 134851 952 252235
江 苏 Jiangsu 743486 111019 38692 300724 107035 78197 1492 107819
浙 江 Zhejiang 425391 46862 39866 209217 18605 51876 1087 58965
安 徽 Anhui 308749 67480 13871 120223 42758 30188 1812 34229
福 建 Fujian 525334 55710 69789 220543 20924 49706 1626 108662
江 西 Jiangxi 314912 52000 11421 66675 116647 29178 2443 38991
山 东 Shandong 662270 90622 87123 182888 94328 133134 2265 74175
河 南 Henan 431683 84102 20069 103311 100070 79079 1709 45052
湖 北 Hubei 307199 63037 14459 104460 62194 32471 2251 30578
湖 南 Hunan 357364 70520 9774 89649 70397 73832 3467 43192
广 东 Guangdong 988513 155129 111409 486162 44440 79032 4835 112341
广 西 Guangxi 221137 47990 12528 54504 35587 43694 688 26834
海 南 Hainan 62147 16316 6190 14319 5521 6169 452 13632
重 庆 Chongqing 271781 51845 19157 112227 29354 33966 1002 25232
四 川 Sichuan 407123 79938 24706 138554 50057 60579 1111 53289
贵 州 Guizhou 128767 29994 9374 29417 17737 27597 995 14648
云 南 Yunnan 321681 67123 26523 78667 32727 48105 382 68536
西 藏 Tibet 7261 2735 195 578 207 2951 86 595
陕 西 Shaanxi 186762 56333 10055 26237 41198 32461 914 20478
甘 肃 Gansu 120407 25491 6556 25485 22068 23399 923 17408
青 海 Qinghai 31152 4758 1205 6547 2662 7234 1441 8746
宁 夏 Ningxia 51969 9308 5047 17996 3046 13216 189 3356
新 疆 Xinjiang 479956 36681 15877 124116 16769 44573 2900 241940

8/2/2019 China Labour Statistical Yearbook - 2004
http://slidepdf.com/reader/full/china-labour-statistical-yearbook-2004 278/464
3-15
EMPLOYMENT AND EARNINGS IN STATE-OWNED
CONTROLLING SHARE HOLD ENTERPRISES BY REGION
(2003)
就业人员 (人) Employment(person)
年末人数 在岗职工 其他就业 不在岗
# 女 性 # 专业技 人 员 # 离退休 # 港澳台 职 工 # 内 退
Year-end On-post 术人员 Other 反聘人员 外籍人员 Not-on-
地 区 Region Figures Female Staff and Tech- Employ- Hired Hong kong post Innerre-
Workers nical ment Retire- Macao Staff and tirement
Personnel ment Taiwan Workers
& Foreign
Personnel
National 46925153 16397200 44614342 10499799 2310811 198016 4923 11384038 3615537
北 京 Beijing 1904085 622249 1692826 514555 211259 51113 1104 234393 116843
天 津 Tianjin 730032 237314 688467 191681 41565 8433 148 264837 65504
河 北 Hebei 2167285 743456 2116525 443993 50760 2550 57 588633 191524
山 西 Shanxi 1851178 552581 1805447 357245 45731 2964 7 491529 119999
内蒙古 Inner Mongolia 1151772 399423 1129821 235454 21951 1081 1 166287 65857
辽 宁 Liaoning 3756579 1372355 3648977 1169714 107602 17546 240 764916 293406
吉 林 Jilin 1351875 451016 1326506 290010 25369 1725 98 676619 133196
黑龙江 Heilongjiang 2331458 769761 2132571 392040 198887 2499 892431 127206
上 海 Shanghai 1647785 524014 1337331 327420 310454 35306 1292 575479 158222
江 苏 Jiangsu 2334367 842136 2214801 503393 119566 5432 304 562992 269926
浙 江 Zhejiang 953448 350877 882884 248116 70564 6433 145 92069 47228
安 徽 Anhui 1364931 460548 1279137 271889 85794 6107 105 324806 105937福 建 Fujian 740927 255052 699791 160441 41136 2421 58 105472 43326
江 西 Jiangxi 1239769 425612 1176913 294098 62856 1468 16 543905 128569
山 东 Shandong 3095669 1126215 3016868 598799 78801 4072 129 681020 298475
河 南 Henan 2754552 995284 2647578 494939 106974 4013 52 659763 163524
湖 北 Hubei 2251486 872826 2173706 477966 77780 4203 128 696381 243243
湖 南 Hunan 1904431 653480 1762855 416990 141576 4052 60 821982 191438
广 东 Guangdong 2207159 791716 2131984 508168 75175 8315 621 298215 99586
广 西 Guangxi 1128129 422527 1060149 260825 67980 2208 35 197951 76261
海 南 Hainan 388184 156533 379293 63182 8891 574 9 98419 17596
重 庆 Chongqing 1367922 483116 1338648 474882 29274 6679 80 146643 62050
四 川 Sichuan 1924324 650275 1837629 439690 86695 5589 68 365886 168920
贵 州 Guizhou 813650 261342 777836 163159 35814 1786 57 168681 58187
云 南 Yunnan 1086837 387349 1040742 267190 46095 3940 54 162889 93835
西 藏 Tibet 85423 28620 67835 17090 17588 164 1 2456 1784
陕 西 Shaanxi 1546967 519944 1499601 353817 47366 2719 32 461535 118323
甘 肃 Gansu 1028078 350794 998715 229998 29363 1661 13 181535 72016
青 海 Qinghai 173245 57718 165047 44108 8198 250 23347 9461
宁 夏 Ningxia 290044 97177 278352 47839 11692 411 3 24024 13920
新 疆 Xinjiang 1353562 535890 1305507 241108 48055 2302 6 108943 60175
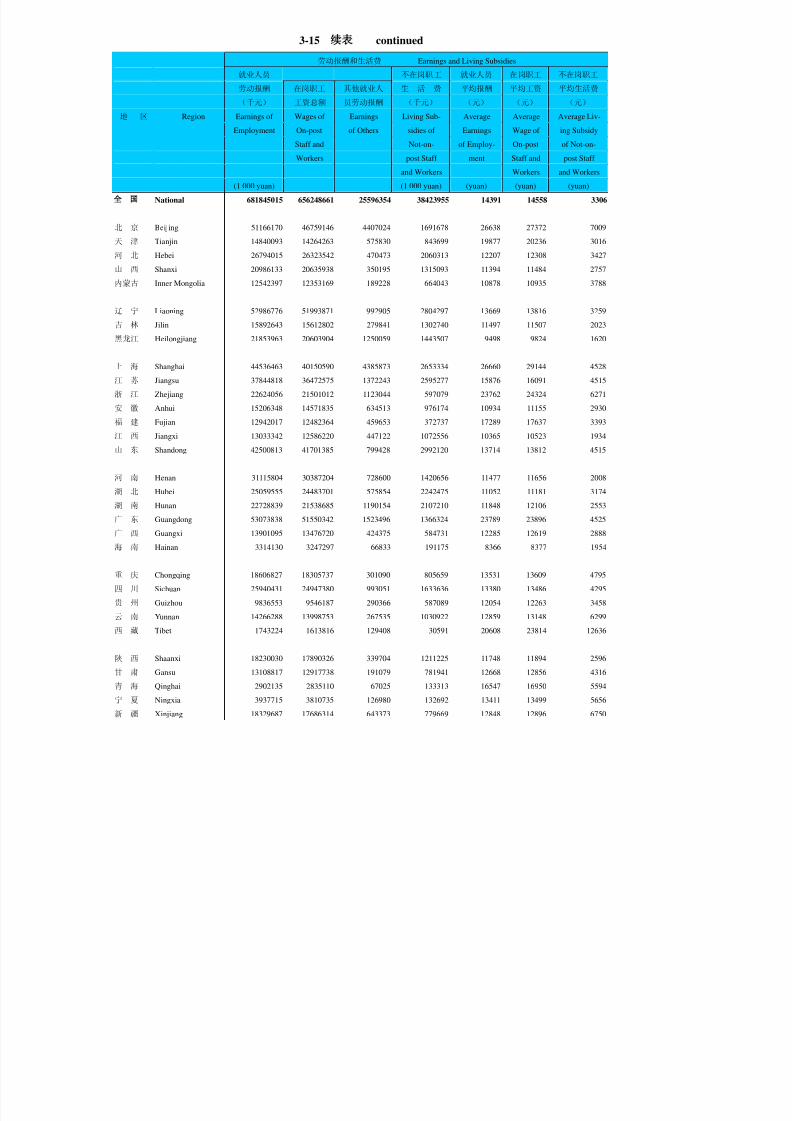
8/2/2019 China Labour Statistical Yearbook - 2004
http://slidepdf.com/reader/full/china-labour-statistical-yearbook-2004 279/464
3-15 continued
劳动报酬和生活费 Earnings and Living Subsidies
就业人员 不在岗职工 就业人员 在岗职工 不在岗职工
劳动报酬 在岗职工 其他就业人 生 活 费 平均报酬 平均工资 平均生活费
(千元) 工资总额 员劳动报酬 (千元) (元) (元) (元)
地 区 Region Earnings of Wages of Earnings Living Sub- Average Average Average Liv-
Employment On-post of Others sidies of Earnings Wage of ing Subsidy
Staff and Not-on- of Employ- On-post of Not-on-
Workers post Staff ment Staff and post Staff
and Workers Workers and Workers
(1 000 yuan) (1 000 yuan) (yuan) (yuan) (yuan)
National 681845015 656248661 25596354 38423955 14391 14558 3306
北 京 Beijing 51166170 46759146 4407024 1691678 26638 27372 7009
天 津 Tianjin 14840093 14264263 575830 843699 19877 20236 3016
河 北 Hebei 26794015 26323542 470473 2060313 12207 12308 3427
山 西 Shanxi 20986133 20635938 350195 1315093 11394 11484 2757
内蒙古 Inner Mongolia 12542397 12353169 189228 664043 10878 10935 3788
辽 宁 Liaoning 52986776 51993871 992905 2804297 13669 13816 3259
吉 林 Jilin 15892643 15612802 279841 1302740 11497 11507 2023
黑龙江 Heilongjiang 21853963 20603904 1250059 1443507 9498 9824 1620
上 海 Shanghai 44536463 40150590 4385873 2653334 26660 29144 4528
江 苏 Jiangsu 37844818 36472575 1372243 2595277 15876 16091 4515
浙 江 Zhejiang 22624056 21501012 1123044 597079 23762 24324 6271
安 徽 Anhui 15206348 14571835 634513 976174 10934 11155 2930
福 建 Fujian 12942017 12482364 459653 372737 17289 17637 3393
江 西 Jiangxi 13033342 12586220 447122 1072556 10365 10523 1934
山 东 Shandong 42500813 41701385 799428 2992120 13714 13812 4515
河 南 Henan 31115804 30387204 728600 1420656 11477 11656 2008
湖 北 Hubei 25059555 24483701 575854 2242475 11052 11181 3174
湖 南 Hunan 22728839 21538685 1190154 2107210 11848 12106 2553
广 东 Guangdong 53073838 51550342 1523496 1366324 23789 23896 4525
广 西 Guangxi 13901095 13476720 424375 584731 12285 12619 2888
海 南 Hainan 3314130 3247297 66833 191175 8366 8377 1954
重 庆 Chongqing 18606827 18305737 301090 805659 13531 13609 4795
四 川 Sichuan 25940431 24947380 993051 1633636 13380 13486 4295
贵 州 Guizhou 9836553 9546187 290366 587089 12054 12263 3458
云 南 Yunnan 14266288 13998753 267535 1030922 12859 13148 6299
西 藏 Tibet 1743224 1613816 129408 30591 20608 23814 12636
陕 西 Shaanxi 18230030 17890326 339704 1211225 11748 11894 2596
甘 肃 Gansu 13108817 12917738 191079 781941 12668 12856 4316
青 海 Qinghai 2902135 2835110 67025 133313 16547 16950 5594
宁 夏 Ningxia 3937715 3810735 126980 132692 13411 13499 5656
新 疆 Xinjiang 18329687 17686314 643373 779669 12848 12896 6750

8/2/2019 China Labour Statistical Yearbook - 2004
http://slidepdf.com/reader/full/china-labour-statistical-yearbook-2004 280/464
4-1
EMPLOYMENT AND EARNINGS BY SECTOR
(State-owned Units, 2003)
年末人数 劳动报酬 平均劳动
(千人) # 女 性 (亿元) 报 酬
项 目 Item Year-end Earnings (元)
Figures (100 Average
(1 000 Female million Earning
persons) yuan ) (yuan)
National Total 68756 25296 9911.9 14358
Grouped by Administrtive Relationship
中央 Under Central Government 13064 4362 2652.0 20113
省、自治区、直辖市 Under Provincial Government 11709 3938 1808.4 15364
地区 Under Perfectural Government 13406 5314 2014.1 14936
县及县以下 At and Below County Level 30316 11599 3399.5 11204
其他 Other 261 82 38.0 15075
Grouped by Enterprises,Institutions & Agencies
企业 Enterprises 32254 10969 4512.7 13802
其中:地方 Local 21087 7353 2319.8 10838
事业 Institutions 25824 11584 3743.6 14560
其中:地方 Local 24189 10926 3374.6 14009
机关 Agencies and Organizations 10678 2743 1655.7 15581
其中:地方 Local 10117 2575 1527.4 15169
Grouped by Sector
Agriculture,Forestry,Farming of Animals 4577 1671 314.4 6819and Fishing
农业 Agriculture 2360 955 149.7 6244
林业 Forestry 1158 385 69.8 6088
畜牧业 Farming of Animals 232 88 13.7 5821
渔业 Fishing 65 20 6.2 9176
农、林、牧、渔服务业 Service Activities for Agriculture, Forestry, 762 224 75.0 9819
Farming of Animals and Fishing
Mining 2643 647 368.5 13819
煤炭开采和洗选业 Mining and Washing of Coal 1665 351 199.0 11841
石油和天然气开采业 Extraction of Petroleum and Natural Gas 566 185 124.0 21952
黑色金属矿采选业 Mining of Ferrous Metal Ores 94 24 13.5 14136
有色金属矿采选业 Mining of Non-ferrous Metal Ores 181 46 19.4 10487
非金属矿采选业 Mining and Processing of Nonmetal Ores 128 37 12.1 9111
其他采矿业 Mining of Other Ores n.e.c 9 4 0.7 7354
Manufacturing 8707 3207 1111.8 12520
农副食品加工业 Processing of Food from Agricultural Products 298 111 20.9 6909
食品制造业 Manufacture of Foods 165 74 13.1 7709
饮料制造业 Manufacture of Beverage 220 86 18.1 8193
烟草制品业 Manufacture of Tobacco 189 78 54.4 28666
纺织业 Manufacture of Textile 827 512 61.7 7334
纺织服装、鞋、帽制造业 Manufacture of Textile Wearing Apparel, 86 52 7.9 8906
Footware,and Caps
皮革、毛皮、羽毛(绒) Manufacture of Leather,Fur,Feather & Its Products
及其制品业 32 16 2.8 8431
木材加工及木、竹、藤、棕、 Processing of Timbers,Manufacture of Wood,
草制品业 Bamboo,Rattan,Palm,and Straw Products 78 31 5.3 6678

8/2/2019 China Labour Statistical Yearbook - 2004
http://slidepdf.com/reader/full/china-labour-statistical-yearbook-2004 281/464
4-1 1 continued
年末人数 劳动报酬 平均劳动
(千人) # 女 性 (亿元) 报 酬
项 目 Item Year-end Earnings (元)
Figures (100 Average
(1 000 Female million Earning
persons) yuan ) (yuan)
家具制造业 Manufacture of Furniture 13 4 1.2 8369
造纸及纸制品业 Manufacture of Paper and Paper Products 131 50 11.7 8459
印刷业和记录媒介的复制 Printing,Reproduction of Recording Media 184 85 24.7 13025
文教体育用品制造业 Manufacture of Articles for Culture, 12 5 1.3 9867
Education and Sport Activity
石油加工、炼焦及核燃料加工业 Processing of Petroleum ,Coking,Processing 252 82 51.9 20128
of Nucleus Fuel
化工原料及化学制品制造业 Manufacture of Chemical Raw Material and 776 257 81.8 10425
Chemical Products
医药制造业 Manufacture of Medicines 198 95 26.3 13271
化学纤维制造业 Manufacture of Chemical Fiber 49 20 5.9 11635
橡胶制品业 Manufacture of Rubber 60 24 6.6 10305
塑料制品业 Manufacture of Plastic 50 23 5.0 9650
非金属矿物制品业 Manufacture of Non-metallic Mineral Products 670 213 60.0 8845
黑色金属冶炼及压延加工业 Manufacture and Processing of Ferrous Metals 924 228 190.4 20291
有色金属冶炼及压延加工业 Manufacture & Processing of Non-ferrous Metals 358 111 52.8 14353
金属制品业 Manufacture of Metal Products 115 39 13.3 11121
通用设备制造业 Manufacture of General Purpose Machinery 584 188 69.3 11522
专用设备制造业 Manufacture of Special Purpose Machinery 721 228 80.9 11023
交通运输设备制造业 Manufacture of Transport Equipment 1036 324 166.7 15724
电气机械及器材制造业 Manufacture of Electrical Machinery & Equipment 287 111 33.5 11258
通信设备、计算机及其他电子 Manufacture of Communication Equipment,
设备制造业 Computer and Other Electronic Equipment 210 87 24.9 11695
仪器仪表及文化、办公用机械 Manufacture of Measuring Instrument and
制造业 Machinery for Cultural Activity & Office Work 127 50 14.1 10760
工艺品及其他制造业 Manufacture of Artwork,Other Manufacture n.e.c 41 18 3.9 9417
废弃资源和废旧材料回收加工业 Recycling and Disposal of Waste 12 5 1.7 13856
Production and Distribution of
Electricity, Gas and Water 2241 704 403.8 18030
电力、热力的生产和供应业 Production and Supply of Electric Power 1673 477 324.5 19432
and Heat Power
燃气生产和供应业 Production and Distribution of Gas 132 45 20.0 14983
水的生产和供应业 Production and Distr ibution of Water 436 182 59.3 13594
Construction 2993 543 384.3 12495
房屋和土木工程建筑业 Construction of Building & Civil Engineering 2607 466 320.6 12064建筑安装业 Architectural Installation 305 62 52.0 15586
建筑装饰业 Architectural Decoration 35 6 4.6 11805
其他建筑业 Other Construction 47 10 7.1 15542
Traffic,Transport,Storage and Post 4928 1407 793 15973
铁路运输业 Transport Via Railway 1699 374 304.2 17818
道路运输业 Transport Via Road 1165 360 131.7 11211
城市公共交通业 Urban Public Traffic 582 221 79.6 13732
水上运输业 Water Transport 387 73 95.1 23993
4-1 2 continued
年末人数 劳动报酬 平均劳动
(千人) # 女 性 (亿元) 报 酬
项 目 Item Year-end Earnings (元)
Figures (100 Average
(1 000 Female million Earning
persons) yuan ) (yuan)
航空运输业 Air Transport 117 38 36.2 30680
管道运输业 Transpor t Via Pipeline 18 6 4.5 25336
装卸搬运和其他运输服务业 Loading,Unloading,Portage and Other Transport 145 38 23.5 15957
Services
仓储业 Storage 316 101 30.9 9405

8/2/2019 China Labour Statistical Yearbook - 2004
http://slidepdf.com/reader/full/china-labour-statistical-yearbook-2004 282/464
邮政业 Post 499 195 87.2 17649
Information Transfer, Computer Services 720 248 179.0 24969
and Software
电信和其他信息传输服务业 Telecom & Other Information Transfer Services 682 235 172.2 25358
计算机服务业 Computer Services 22 8 3.3 14615
软件业 Software Industry 15 5 3.5 23033
Wholesale and Retail Trade 3010 1233 338.0 10937
批发业 Wholesale 2008 745 248.9 12035
零售业 Retail Trade 1002 488 89.2 8717
Accommodation and Restaurants 734 396 76.6 10482
住宿业 Accommodation 596 320 63.9 10843
餐饮业 Restaurants 138 76 12.7 8975
Finance 2081 945 447.4 21267
银行业 Bank 1682 735 384.4 22437
证券业 Securities 17 7 7.5 43082
保险业 Insurance 360 195 48.7 13882
其他金融活动 Other Financial Activities 22 9 6.7 30724
Real Estate 522 185 82.2 15749
房地产开发经营 Real Estate Exploitation Management 203 69 33.2 16202
物业管理 Management Concerning Dwelling 197 68 30.0 15302
房地产中介服务 Real Estate Agency Service 27 11 4.1 15558Tenancy and Business Services 1060 329 157.7 15042
租赁业 Tenancy 16 4 2.0 12744
商务服务业 Business Service 1044 324 155.6 15077
Scientific Research,Technical Service
and Geologic Perambulation 1851 592 368.5 19775
研究与试验发展 Research and Experimental Development 617 215 135.9 21971
# 自然科学研究与试验发展 Research and Experimental Development 176 60 39.8 22437
on Physical Science
工程和技术研究与试验发展 Research and Experimental Development 250 83 61.2 24404
on Engineering and Technical Research
农业科学研究与试验发展 Research and Experimental Development 94 33 14.5 15460
on Agricultural Science Research
医学研究与试验发展 Research and Experimental Development 24 12 4.5 18619
on Medical Research
社会人文科学研究与试验发展 Research and Experimental Development 73 26 15.9 21949
on Social Science and Humanities
4-1 3 continued
年末人数 劳动报酬 平均劳动
(千人) # 女 性 (亿元) 报 酬
项 目 Item Year-end Earnings (元)
Figures (100 Average (1 000 Female million Earning
persons) yuan ) (yuan)
专业技术服务业 Professional Technique Services 765 241 161.7 20859
# 气象服务 Weather Services 50 18 9.1 18381
地震服务 Earthquake Services 13 4 2.3 16972
海洋服务 Ocean Services 6 1 1.3 22817
测绘服务 Plotting Services 38 11 7.3 19229
技术检测 Technique Detection 141 49 25.6 18225
环境监测 Environmental Monitoring 44 16 7.3 16631
工程技术与规划管理 Engineering Technic & Programming Management 427 128 98.4 22495
科技交流和推广服务业 Services of Science and Technique 163 60 24.6 15126
Intercommunion and Generalization
地质勘查业 Geologic Perambulation 305 75 46.3 15077
Management of Water Conservancy, 1553 613 182.5 11782
Environment and Public Establishment
水利管理业 Management of Water Conservancy 470 127 52.9 11241
环境管理业 Environmental Management 625 308 66.2 10775
公共设施管理业 Management of Public Establishment 458 178 63.4 13666
Resident Services and Other Services 221 80 32.6 14419
居民服务业 Resident Services 127 50 18.5 14333
其他服务业 Other Services 93 30 14.2 14533
Education 13783 6415 1970.1 14371

8/2/2019 China Labour Statistical Yearbook - 2004
http://slidepdf.com/reader/full/china-labour-statistical-yearbook-2004 283/464
#初等教育 Primary Education 5833 2898 710.8 12176
中等教育 Secondary Education 5881 2530 836.2 14354
高等教育 Higher Education 1399 591 321.0 23355
Sanitation,Social Security & Social Welfare 4309 2552 717.2 16741
卫生 Sanitation 4106 2459 686.0 16805
社会保障业 Social Security 93 40 14.3 15540
社会福利业 Social Welfare 110 53 17.0 15381
Culture, Sports and Entertainment 1170 470 202.5 17340
新闻出版业 Journalism and Publishing Activities 223 86 57.7 26097
广播、电影、电视和音像业 Broadcasting,Movies,Television and 470 180 70.2 14940
Audiovisual Activities
文化艺术业 Culture and Art 376 169 56.2 14988
体育 Sports Activities 81 28 15.4 19019
娱乐业 Entertainment 20 8 3.0 14405
Public Management & Social Organization 11651 3058 1781.7 15382
# 中国共产党机关 Chinese Communist Party Organs 472 105 72.1 15398
国家机构 Organ of State 10796 2816 1649.1 15352
人民政协和民主党派 People's Political Consultative Conference 86 20 14.8 17164
and democratic parties
群众社团、社会团体和宗教 Mass communities, social communities and
组织 religion organizations 177 69 31.1 17622

8/2/2019 China Labour Statistical Yearbook - 2004
http://slidepdf.com/reader/full/china-labour-statistical-yearbook-2004 284/464
4-2
ON-POST STAFF AND WORKERS AND WAGES BY SECTOR
(State-owned Units, 2003)
年末人数 工资总额 平均人数 平均工资
(千人) (亿元) (千人) (元)
项 目 Item Year-end Total Average Average
Figures Wages (100 Figures Wage
(1 000 million (1 000
persons) yuan ) persons) (yuan)
National Total 66213 9693.9 66499 14577
Grouped by Administrtive Relationship
中央 Under Central Government 12342 2568.4 12465 20606
省、自治区、直辖市 Under Provincial Government 11139 1758.8 11208 15692
地区 Under Perfectural Government 12959 1973.8 13043 15133
县及县以下 At and Below County Level 29526 3356.6 29546 11361
其他 Other 246 36.2 237 15253
Grouped by Enterprises,Institutions and Agencies
企业 Enterprises 30667 4364.0 31110 14028
其中:地方 Local 20177 2248.9 20499 10971
事业 Institutions 25082 3688.8 24974 14770
其中:地方 Local 23503 3327.1 23406 14215
机关 Agencies and Organizations 10464 1641.0 10414 15757
其中:地方 Local 9912 1513.4 9866 15340
Grouped by Sector
Agriculture,Forestry,Farming of Animals 4339 302.2 4372 6912
and Fishing
农业 Agriculture 2169 139.6 2206 6328
林业 Forestry 1134 68.8 1123 6126
畜牧业 Farming of Animals 224 13.3 227 5854
渔业 Fishing 64 6.1 66 9224
农、林、牧、渔服务业 Service Activities for Agriculture, Forestry, 747 74.3 749 9930
Farming of Animals and Fishing
Mining 2597 363.9 2620 13888
煤炭开采和洗选业 Mining and Washing of Coal 1645 197.1 1659 11883
石油和天然气开采业 Extraction of Petroleum and Natural Gas 548 121.8 548 22252
黑色金属矿采选业 Mining of Ferrous Metal Ores 93 13.3 94 14195
有色金属矿采选业 Mining of Non-ferrous Metal Ores 177 19.0 181 10534
非金属矿采选业 Mining and Processing of Nonmetal Ores 125 11.9 130 9154
其他采矿业 Mining of Other Ores n.e.c 9 0.7 9 7322
Manufacturing 8542 1098.4 8717 12601
农副食品加工业 Processing of Food from Agricultural Products 286 20.3 292 6972
食品制造业 Manufacture of Foods 160 12.7 163 7748
饮料制造业 Manufacture of Beverage 216 17.8 217 8211
烟草制品业 Manufacture of Tobacco 188 54.2 189 28758
纺织业 Manufacture of Textile 818 61.0 831 7342
纺织服装、鞋、帽制造业 Manufacture of Textile Wearing Apparel, 82 7.5 84 8896
Footware,and Caps
皮革、毛皮、羽毛(绒) Manufacture of Leather,Fur,Feather & Its Products
及其制品业 31 2.7 33 8375
木材加工及木、竹、藤、棕 Processing of Timbers,Manufacture of Wood,
草制品业 Bamboo,Rattan,Palm,and Straw Products 77 5.2 78 6646

8/2/2019 China Labour Statistical Yearbook - 2004
http://slidepdf.com/reader/full/china-labour-statistical-yearbook-2004 285/464
4-2 1 continued
年末人数 工资总额 平均人数 平均工资
(千人) (亿元) (千人) (元)
项 目 Item Year-end Total Average Average
Figures Wages (100 Figures Wage
(1 000 million (1 000
persons) yuan ) persons) (yuan)
家具制造业 Manufacture of Furniture 11 0.9 11 8152
造纸及纸制品业 Manufacture of Paper and Paper Products 127 11.4 134 8505
印刷业和记录媒介的复制 Printing,Reproduction of Recording Media 180 24.3 185 13114
文教体育用品制造业 Manufacture of Articles for Culture, 11 1.3 13 9902
Education and Sport Activity
石油加工、炼焦及核燃料加工业 Processing of Petroleum ,Coking,Processing 248 51.5 254 20275
of Nucleus Fuel
化工原料及化学制品制造业 Manufacture of Chemical Raw Material and 760 81.0 767 10551
Chemical Products
医药制造业 Manufacture of Medicines 193 25.8 194 13347
化学纤维制造业 Manufacture of Chemical Fiber 48 5.9 50 11725
橡胶制品业 Manufacture of Rubber 59 6.4 62 10299
塑料制品业 Manufacture of Plastic 48 4.8 50 9636
非金属矿物制品业 Manufacture of Non-metallic Mineral Products 655 59.0 662 8913
黑色金属冶炼及压延加工业 Manufacture and Processing of Ferrous Metals 918 189.7 932 20356
有色金属冶炼及压延加工业 Manufacture & Processing of Non-ferrous Metals 354 52.5 365 14389
金属制品业 Manufacture of Metal Products 112 13.0 117 11150
通用设备制造业 Manufacture of General Purpose Machinery 574 68.3 591 11561
专用设备制造业 Manufacture of Special Purpose Machinery 709 79.9 723 11055
交通运输设备制造业 Manufacture of Transport Equipment 1015 164.7 1040 15837
电气机械及器材制造业 Manufacture of Electrical Machinery & Equipment 282 33.1 293 11299
通信设备、计算机及其他电子 Manufacture of Communication Equipment,
设备制造业 Computer and Other Electronic Equipment 205 24.4 209 11682
仪器仪表及文化、办公用机械 Manufacture of Measuring Instrument and
制造业 Machinery for Cultural Activity & Office Work 122 13.5 126 10694
工艺品及其他制造业 Manufacture of Artwork,Other Manufacture n.e.c 39 3.8 40 9461
废弃资源和废旧材料回收加工业 Recycling and Disposal of Waste 12 1.6 12 14167
Production and Distribution of
Electricity, Gas and Water 2201 401.0 2200 18226
电力、热力的生产和供应业 Production and Supply of Electric Power 1641 322.3 1639 19670
and Heat Power
燃气生产和供应业 Production and Distribution of Gas 130 19.8 131 15125
水的生产和供应业 Production and Distribution of Water 430 58.8 430 13672
Construction 2787 363.6 2854 12739
房屋和土木工程建筑业 Construction of Building & Civil Engineering 2416 301.5 2450 12306
建筑安装业 Architectural Installation 293 50.8 323 15723
建筑装饰业 Architectural Decoration 33 4.3 36 11854
其他建筑业 Other Construction 45 7.0 44 15679
Traffic,Transport,Storage and Post 4744 776.5 4783 16234
铁路运输业 Transport Via Railway 1651 299.1 1653 18091
道路运输业 Transport Via Road 1144 130.4 1155 11293
城市公共交通业 Urban Public Traffic 556 77.5 557 13922
水上运输业 Water Transport 384 94.7 393 24078
4-2 2 continued
年末人数 工资总额 平均人数 平均工资
(千人) (亿元) (千人) (元)
项 目 Item Year-end Total Average Average
Figures Wages (100 Figures Wage
(1 000 million (1 000
persons) yuan ) persons) (yuan)
航空运输业 Air Transport 117 36.1 117 30791
管道运输业 Transport Via Pipeline 18 4.5 18 25343
装卸搬运和其他运输服务业 Loading,Unloading,Portage and Other Transport 138 22.9 140 16298
Services
仓储业 Storage 311 30.5 323 9446

8/2/2019 China Labour Statistical Yearbook - 2004
http://slidepdf.com/reader/full/china-labour-statistical-yearbook-2004 286/464
邮政业 Post 426 80.8 426 18953
Information Transfer, Computer Services 639 169.4 638 26572
and Software
电信和其他信息传输服务业 Telecom & Other Information Transfer Services 604 163.2 602 27096
计算机服务业 Computer Services 21 3.1 21 14470
软件业 Software Industry 14 3.2 14 22568
Wholesale and Retail Trade 2863 326.0 2947 11064
批发业 Wholesale 1927 241.6 1985 12167
零售业 Retail Trade 936 84.4 961 8786
Accommodation and Restaurants 692 72.5 689 10525
住宿业 Accommodation 563 60.6 556 10891
餐饮业 Restaurants 130 12.0 133 8996
Finance 1763 413.0 1790 23075
银行业 Bank 1582 371.7 1610 23088
证券业 Securities 17 7.4 17 43647
保险业 Insurance 143 27.3 142 19213
其他金融活动 Other Financial Activities 21 6.6 21 31518
Real Estate 488 78.5 489 16064
# 房地产开发经营 Real Estate Exploitation Management 193 31.8 194 16418
物业管理 Management Concerning Dwelling 178 28.0 177 15814
房地产中介服务 Real Estate Agency Service 26 4.0 26 15693Tenancy and Business Services 987 150.5 979 15378
租赁业 Tenancy 14 1.8 14 13229
商务服务业 Business Service 973 148.7 965 15409
Scientific Research,Technical Service
and Geologic Perambulation 1767 356.2 1783 19975
研究与试验发展 Research and Experimental Development 592 132.6 594 22307
# 自然科学研究与试验发展 Research and Experimental Development 168 38.7 170 22762
on Physical Science
工程和技术研究与试验发展 Research and Experimental Development 240 59.7 241 24781
on Engineering and Technical Research
农业科学研究与试验发展 Research and Experimental Development 92 14.3 91 15621
on Agricultural Science Research
医学研究与试验发展 Research and Experimental Development 22 4.3 22 19701
on Medical Research
社会人文科学研究与试验发展 Research and Experimental Development 70 15.6 70 22237
on Social Science and Humanities
4-2 3 continued
年末人数 工资总额 平均人数 平均工资
(千人) (亿元) (千人) (元)
项 目 Item Year-end Total Average Average
Figures Wages (100 Figures Wage(1 000 million (1 000
persons) yuan ) persons) (yuan)
专业技术服务业 Professional Technique Services 720 154.4 731 21111
# 气象服务 Weather Services 49 9.0 49 18530
地震服务 Earthquake Services 13 2.3 13 17120
海洋服务 Ocean Services 6 1.3 6 22896
测绘服务 Plotting Services 37 7.1 36 19579
技术检测 Technique Detection 136 24.9 136 18338
环境监测 Environmental Monitoring 43 7.1 42 16852
工程技术与规划管理 Engineering Technic & Programming Managemen 395 93.0 407 22870
科技交流和推广服务业 Services of Science and Technique 155 23.6 155 15190
Intercommunion and Generalization
地质勘查业 Geologic Perambulation 300 45.8 303 15111
Management of Water Conservancy, 1479 178.6 1475 12104
Environment and Public Establishment
水利管理业 Management of Water Conservancy 462 52.5 463 11338
环境管理业 Environmental Management 572 63.6 562 11316
公共设施管理业 Management of Public Establishment 445 62.5 450 13875
Resident Services and Other Services 199 30.0 199 15075
居民服务业 Resident Services 119 17.8 119 14916
其他服务业 Other Services 80 12.1 79 15315
Education 13401 1946.4 13329 14602

8/2/2019 China Labour Statistical Yearbook - 2004
http://slidepdf.com/reader/full/china-labour-statistical-yearbook-2004 287/464
# 初等教育 Primary Education 5638 703.0 5640 12465
中等教育 Secondary Education 5764 827.1 5710 14484
高等教育 Higher Education 1358 316.4 1336 23675
Sanitation,Social Security & Social Welfare 4191 705.3 4168 16922
卫生 Sanitation 3995 674.7 3973 16980
社会保障业 Social Security 91 14.1 90 15718
社会福利业 Social Welfare 105 16.6 105 15743
Culture, Sports and Entertainment 1124 196.9 1122 17544
新闻出版业 Journalism and Publishing Activities 209 55.8 208 26809
广播、电影、电视和音像业 Broadcasting,Movies,Television and 453 68.3 453 15065
Audiovisual Activities
文化艺术业 Culture and Art 364 55.1 363 15154
体育 Sports Activities 78 14.9 78 19158
娱乐业 Entertainment 20 2.9 20 14553
Public Management & Social Organization 11411 1765.0 11345 15557
# 中国共产党机关 Chinese Communist Party Organs 468 71.8 464 15458
国家机构 Organ of State 10569 1633.5 10517 15533
人民政协和民主党派 People's Political Consultative Conference 85 14.7 85 17333
and democratic parties
群众社团、社会团体和宗 Mass communities, social communities and
组织 religion organizations 172 30.4 171 17849

8/2/2019 China Labour Statistical Yearbook - 2004
http://slidepdf.com/reader/full/china-labour-statistical-yearbook-2004 288/464
4-3
EMPLOYMENT AND EARNINGS
BY SECTOR AND REGION
(State-owned Units,2003)总 计 中央属单位
Total Units Under Central Government
年末人数 劳动报酬 平均劳动 年末人数 劳动报酬 平均劳动
地 区 Region (人) # 女 性
(千元) 报 酬 (人) # 女 性
(千元) 报 酬
Year-end Earnings (元) Year-end Earnings (元)
Figures Female Average Figures Female Average
(1 000 Earning (1 000 Earning
(person) yuan) (yuan) (person) yuan) (yuan)
National 68755671 25295754 991188874 14358 13063769 4362236 265196605 20113
北 京 Beijing 2127846 838555 58862349 27555 959698 359874 31161694 32289
天 津 Tianjin 906910 340627 17278785 18819 201077 56181 4925261 24137
河 北 Hebei 3735697 1470803 43866552 11700 631895 194284 10238603 16164
山 西 Shanxi 2546894 911590 28158767 11093 490381 143847 7182800 14621
内蒙古 Inner Mongolia 1691942 640510 20104586 11837 198106 73777 2880471 14075
辽 宁 Liaoning 3177914 1184532 43881210 13449 797807 228084 15382673 18773
吉 林 Jilin 2076166 785082 23222370 11063 404755 130190 7423915 18363
黑龙江 Heilongjiang 3427484 1248186 36580408 10708 716035 220143 11768062 16679
上 海 Shanghai 1636925 607292 43493419 26168 497470 145269 16530805 32911
江 苏 Jiangsu 3174236 1130756 55229894 17201 496352 154782 11202864 22227
浙 江 Zhejiang 1790172 701580 47353296 26646 293218 106354 8911818 30062
安 徽 Anhui 2219622 743500 24730553 11035 273706 82482 4194935 15442
福 建 Fujian 1525360 558226 24793773 16223 183350 62363 4463436 24351
江 西 Jiangxi 2043655 689237 22187555 10765 210999 70834 3428372 15735
山 东 Shandong 4966752 1797973 68633643 13856 777819 243088 16494033 21163
河 南 Henan 3986171 1475140 44305981 11280 575877 196032 10235715 17907
湖 北 Hubei 3411677 1275358 39848334 11645 689829 263172 11839081 17048
湖 南 Hunan 3131851 1112514 38951853 12381 454881 154618 8012096 17204
广 东 Guangdong 3765572 1458461 85539378 22675 496197 178372 16931021 33711
广 西 Guangxi 2008583 774381 24037360 11972 216716 68628 4002979 18262
海 南 Hainan 586554 227394 6063489 10226 38251 13206 718604 18564
重 庆 Chongqing 1244064 437225 16911877 13508 306302 102890 5323488 17311
四 川 Sichuan 3277742 1156174 45302953 13769 707625 246933 13856308 19349
贵 州 Guizhou 1484238 494574 16685297 11125 203728 70699 3518580 17039
云 南 Yunnan 1876988 703295 24887404 13193 195591 67669 3394822 17261
西 藏 Tibet 160954 54350 3925279 24588 13749 4925 511283 37342
陕 西 Shaanxi 2543780 879858 29654243 11634 708126 226553 10993251 15437
甘 肃 Gansu 1595617 520473 20030546 12688 310203 100209 4655382 15950
青 海 Qinghai 345361 124555 5659020 16340 85685 27340 1805667 21075
宁 夏 Ningxia 400051 148900 5439769 13529 75463 24814 1386152 18107
新 疆 Xinjiang 1888893 804653 25568931 13132 852878 344624 11822434 13078

8/2/2019 China Labour Statistical Yearbook - 2004
http://slidepdf.com/reader/full/china-labour-statistical-yearbook-2004 289/464
4-3 1 continued
省、自治区、直辖市属单位 地区属单位
Units Under Provincial Government Units Under Prefectural Government
年末人数 劳动报酬 平均劳动 年末人数 劳动报酬 平均劳动
地 区 Region (人) # 女 性
(千元) 报 酬 (人) # 女 性
(千元) 报 酬
Year-end Earnings (元) Year-end Earnings (元)
Figures Female Average Figures Female Average
(1 000 Earning (1 000 Earning
(person) yuan) (yuan) (person) yuan) (yuan)
National 11709074 3938116 180837616 15364 13405615 5314184 201412481 14936
北 京 Beijing 564253 199873 13536021 23554 511173 250887 12540139 24312
天 津 Tianjin 398191 132238 7268032 17994 224527 118076 3771708 16733
河 北 Hebei 547798 157225 8651529 15720 713861 303446 7882950 10921
山 西 Shanxi 579091 174264 7496090 13030 417031 166155 4008485 9576
内蒙古 Inner Mongolia 341132 111479 4523160 13097 386881 147843 4117203 10657
辽 宁 Liaoning 314133 97821 5201285 16278 843892 324599 11635702 13280
吉 林
Jilin 323495 107628 3777047 11315 441289 170671 4461007 9997黑龙江 Heilongjiang 1112318 391055 8471941 7719 691006 280878 7735348 11060
上 海 Shanghai 603086 206600 14046443 22643 502784 241296 12211434 24159
江 苏 Jiangsu 406778 138036 7343944 18032 694979 258704 13576886 19117
浙 江 Zhejiang 179853 63226 5992317 33705 299723 115026 8096153 27330
安 徽 Anhui 292243 101096 3569129 11921 496011 186134 6034656 12061
福 建 Fujian 205513 65374 3760579 18174 330499 119582 5967669 18107
江 西 Jiangxi 407807 128312 5551046 13590 329303 125250 3629294 11111
山 东 Shandong 613256 188998 10518970 17140 960478 381304 13623429 14159
河 南 Henan 328727 114667 4919082 15356 901554 351902 10214846 11515
湖 北 Hubei 326954 116193 3907563 11846 773145 297735 9530603 12357
湖 南 Hunan 473865 151711 6797736 14442 637916 234333 7246591 11394
广 东 Guangdong 410791 146458 12441446 30039 927032 354175 24655605 26488
广 西 Guangxi 270674 105182 3523859 13026 439317 167504 6150887 13960
海 南 Hainan 312392 132536 2726882 8588 52738 20570 804872 14979
重 庆 Chongqing 291101 97628 4272390 14363
四 川 Sichuan 381180 123193 5488437 14544 566276 210246 7390660 12919
贵 州 Guizhou 280495 83489 3244787 11869 215545 82565 2449177 11238
云 南 Yunnan 456015 165753 6375359 13789 212487 85325 2744880 12750
西 藏 Tibet 37824 14382 965431 25532 40077 15410 954184 24401
陕 西 Shaanxi 452939 146377 5478328 11948 311103 109559 3379373 10869
甘 肃 Gansu 428020 134691 5562256 12961 208659 76914 2615666 12391
青 海 Qinghai 83078 31982 1329801 15765 37002 15172 559073 15134
宁 夏 Ningxia 116655 43409 1462763 12491 47082 19317 622081 13380
新 疆 Xinjiang 169417 67240 2633963 15018 192245 83606 2801920 14372
4-3 2 continued
县及县以下属单位 其他隶属关系单位
Units at and Below County Level Other Units
年末人数 劳动报酬 平均劳动 年末人数 劳动报酬 平均劳动
地 区 Region (人) # 女 性
(千元) 报 酬 (人) # 女 性
(千元) 报 酬
Year-end Earnings (元) Year-end Earnings (元)
Figures Female Average Figures Female Average
(1 000 Earning (1 000 Earning
(person) yuan) (yuan) (person) yuan) (yuan)
National 30315849 11599292 339946069 11204 261364 81926 3796103 15075
北 京 Beijing 25729 11593 552180 21624 66993 16328 1072315 19457
天 津 Tianjin 73375 30858 1058401 14368 9740 3274 255383 22999
河 北 Hebei 1838130 813833 17061524 9274 4013 2015 31946 7726
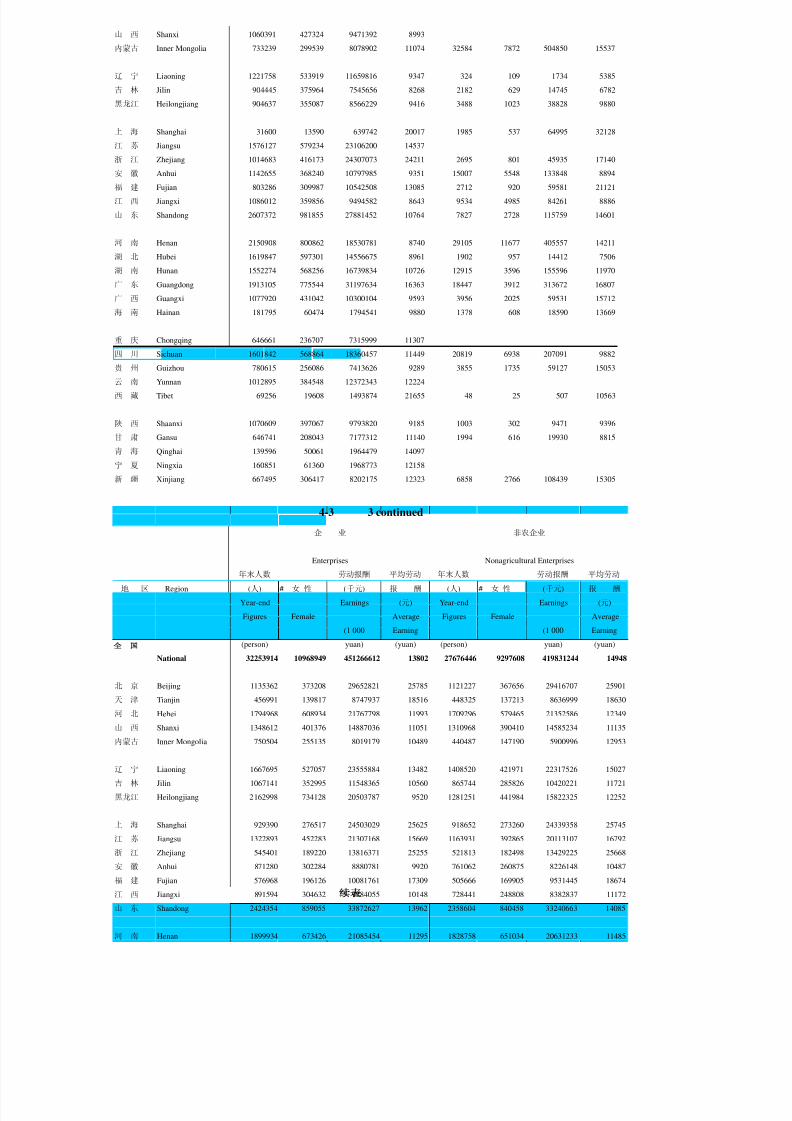
8/2/2019 China Labour Statistical Yearbook - 2004
http://slidepdf.com/reader/full/china-labour-statistical-yearbook-2004 290/464
山 西 Shanxi 1060391 427324 9471392 8993
内蒙古 Inner Mongolia 733239 299539 8078902 11074 32584 7872 504850 15537
辽 宁 Liaoning 1221758 533919 11659816 9347 324 109 1734 5385
吉 林 Jilin 904445 375964 7545656 8268 2182 629 14745 6782
黑龙江 Heilongjiang 904637 355087 8566229 9416 3488 1023 38828 9880
上 海 Shanghai 31600 13590 639742 20017 1985 537 64995 32128
江 苏 Jiangsu 1576127 579234 23106200 14537
浙 江 Zhejiang 1014683 416173 24307073 24211 2695 801 45935 17140
安 徽 Anhui 1142655 368240 10797985 9351 15007 5548 133848 8894
福 建 Fujian 803286 309987 10542508 13085 2712 920 59581 21121
江 西 Jiangxi 1086012 359856 9494582 8643 9534 4985 84261 8886
山 东 Shandong 2607372 981855 27881452 10764 7827 2728 115759 14601
河 南 Henan 2150908 800862 18530781 8740 29105 11677 405557 14211
湖 北 Hubei 1619847 597301 14556675 8961 1902 957 14412 7506
湖 南 Hunan 1552274 568256 16739834 10726 12915 3596 155596 11970
广 东 Guangdong 1913105 775544 31197634 16363 18447 3912 313672 16807
广 西 Guangxi 1077920 431042 10300104 9593 3956 2025 59531 15712
海 南 Hainan 181795 60474 1794541 9880 1378 608 18590 13669
重 庆 Chongqing 646661 236707 7315999 11307
四 川 Sichuan 1601842 568864 18360457 11449 20819 6938 207091 9882
贵 州 Guizhou 780615 256086 7413626 9289 3855 1735 59127 15053
云 南 Yunnan 1012895 384548 12372343 12224
西 藏 Tibet 69256 19608 1493874 21655 48 25 507 10563
陕 西 Shaanxi 1070609 397067 9793820 9185 1003 302 9471 9396
甘 肃 Gansu 646741 208043 7177312 11140 1994 616 19930 8815
青 海 Qinghai 139596 50061 1964479 14097
宁 夏 Ningxia 160851 61360 1968773 12158
新 疆 Xinjiang 667495 306417 8202175 12323 6858 2766 108439 15305
4-3 3 continued
企 业 非农企业
Enterprises Nonagricultural Enterprises
年末人数 劳动报酬 平均劳动 年末人数 劳动报酬 平均劳动
地 区 Region (人) # 女 性
(千元) 报 酬 (人) # 女 性
(千元) 报 酬
Year-end Earnings (元) Year-end Earnings (元)
Figures Female Average Figures Female Average
(1 000 Earning (1 000 Earning
(person) yuan) (yuan) (person) yuan) (yuan)
National 32253914 10968949 451266612 13802 27676446 9297608 419831244 14948
北 京 Beijing 1135362 373208 29652821 25785 1121227 367656 29416707 25901
天 津 Tianjin 456991 139817 8747937 18516 448325 137213 8636999 18630
河 北 Hebei 1794968 608934 21767798 11993 1709296 579465 21352586 12349
山 西 Shanxi 1348612 401376 14887036 11051 1310968 390410 14585234 11135
内蒙古 Inner Mongolia 750504 255135 8019179 10489 440487 147190 5900996 12953
辽 宁 Liaoning 1667695 527057 23555884 13482 1408520 421971 22317526 15027
吉 林 Jilin 1067141 352995 11548365 10560 865744 285826 10420221 11721
黑龙江 Heilongjiang 2162998 734128 20503787 9520 1281251 441984 15822325 12252
上 海 Shanghai 929390 276517 24503029 25625 918652 273260 24339358 25745
江 苏 Jiangsu 1322893 452283 21307168 15669 1163931 392865 20113107 16792
浙 江 Zhejiang 545401 189220 13816371 25255 521813 182498 13429225 25668
安 徽 Anhui 871280 302284 8880781 9920 761062 260875 8226148 10487
福 建 Fujian 576968 196126 10081761 17309 505666 169905 9531445 18674
江 西 Jiangxi 891594 304632 9284055 10148 728441 248808 8382837 11172
山 东 Shandong 2424354 859055 33872627 13962 2358604 840458 33240663 14085
河 南 Henan 1899934 673426 21085454 11295 1828758 651034 20631233 11485

8/2/2019 China Labour Statistical Yearbook - 2004
http://slidepdf.com/reader/full/china-labour-statistical-yearbook-2004 291/464
湖 北 Hubei 1684067 641527 19506497 11520 1391652 520676 17970999 12817
湖 南 Hunan 1418241 475393 16748133 11682 1244315 409310 15839269 12560
广 东 Guangdong 1474285 505322 33831348 22529 1355267 460777 32854046 23781
广 西 Guangxi 798745 287017 9530141 11839 666067 236983 8650236 12885
海 南 Hainan 350783 143071 2863968 8009 149788 49208 1898501 12340
重 庆 Chongqing 578088 188210 8006888 13581 559904 183067 7836922 13723
四 川 Sichuan 1321836 432872 18743936 13891 1226101 407406 17858398 14264
贵 州 Guizhou 625930 200174 7507145 11623 582424 187684 7144365 11865
云 南 Yunnan 695588 250431 9439899 13304 525786 185935 7863959 14586
西 藏 Tibet 39344 13825 756640 19619 34770 13031 698440 20528
陕 西 Shaanxi 1265296 404967 15259853 11978 1204859 387618 14757896 12161
甘 肃 Gansu 785962 255397 9545302 12345 703045 230075 8809574 12757
青 海 Qinghai 150598 49471 2581100 16951 128445 43568 2347096 18034
宁 夏 Ningxia 176969 62769 2366975 13173 133023 44046 1998527 14807
新 疆 Xinjiang 1042097 412310 13064734 11878 398255 146806 6956406 16517
4-3 4 continued
企业中地方 事 业
Local Enterprises Institutions
年末人数 劳动报酬 平均劳动 年末人数 劳动报酬 平均劳动
地 区 Region (人) # 女 性
(千元) 报 酬 (人) # 女 性
(千元) 报 酬
Year-end Earnings (元) Year-end Earnings (元)
Figures Female Average Figures Female Average
(1 000 Earning (1 000 Earning
(person) yuan) (yuan) (person) yuan) (yuan)
National 21087304 7353453 231981768 10838 25824024 11583507 374355098 14560
北 京 Beijing 514473 169790 9901978 18648 753173 386694 22148903 29564
天 津 Tianjin 280558 90106 4388670 15177 326367 168807 6147160 18856
河 北 Hebei 1235123 438585 12770602 10174 1364066 709726 15174117 11164
山 西 Shanxi 893155 268631 8190355 9191 813109 405655 8939446 11068
内蒙古 Inner Mongolia 488267 167479 4082192 8255 663277 305830 8281225 12595
辽 宁 Liaoning 956804 329222 9708663 9566 1121882 558733 14604108 12973
吉 林 Jilin 722767 244724 5314456 7101 774973 373267 8856112 11447
黑龙江 Heilongjiang 1493621 531526 9601703 6425 919042 421693 11309622 12333
上 海 Shanghai 526970 168895 10887515 19868 549818 283103 14410365 26264
江 苏 Jiangsu 919162 324033 12091974 12727 1412784 588807 24194573 17110浙 江 Zhejiang 296529 97532 6181847 20986 880668 429071 22926221 26402
安 徽 Anhui 642947 233137 5423140 8110 981244 356832 11119653 11359
福 建 Fujian 425890 144406 6325233 14696 661664 298368 9994389 15147
江 西 Jiangxi 706316 241516 6386820 8819 814091 302956 8929384 11019
山 东 Shandong 1736581 647714 19139175 11024 1791114 761487 24432825 13729
河 南 Henan 1382857 498245 12189883 9000 1242501 568426 14051680 11449
湖 北 Hubei 1100013 418648 9746205 8823 1246194 514740 14151117 11364
湖 南 Hunan 1008657 337463 9823593 9691 1165189 497722 15209618 13065
广 东 Guangdong 1094433 377084 21612449 19387 1598080 785278 33872854 21351
广 西 Guangxi 597774 227588 6006393 9979 936124 415655 10708889 11509
海 南 Hainan 325413 135014 2358916 7111 159819 65797 2061015 12923
重 庆 Chongqing 312411 99229 3575393 11070 491113 205421 6407902 13104
四 川 Sichuan 731170 234642 7734650 10465 1383012 566433 18439351 13474
贵 州 Guizhou 436759 134477 4248850 9361 554807 211859 5784565 10498
云 南 Yunnan 530312 192870 6516202 11958 822786 356673 10806496 13159
西 藏 Tibet 30893 10963 472691 15674 60894 23406 1480938 24476
陕 西 Shaanxi 672831 225150 6409640 9453 898580 384092 10147496 11324
甘 肃 Gansu 522484 171423 5581644 10576 570074 206117 7206301 12708
青 海 Qinghai 87142 28960 1241077 13898 130084 55262 2002122 15496

8/2/2019 China Labour Statistical Yearbook - 2004
http://slidepdf.com/reader/full/china-labour-statistical-yearbook-2004 292/464
宁 夏 Ningxia 111528 41068 1130716 9990 158734 68244 2206559 13915
新 疆 Xinjiang 303464 123333 2939143 9389 578761 307353 8350092 14393
4-3 5 continued
事业中地方 机 关
Local Institutions Agencies and Organizations
年末人数 劳动报酬 平均劳动 年末人数 劳动报酬 平均劳动
地 区 Region (人) # 女 性
(千元) 报 酬 (人) # 女 性
(千元) 报 酬
Year-end Earnings (元) Year-end Earnings (元)
Figures Female Average Figures Female Average
(1 000 Earning (1 000 Earning
(person) yuan) (yuan) (person) yuan) (yuan)
National 24189239 10925789 337461702 14009 10677733 2743298 165567164 15581
北 京 Beijing 402227 231955 11338826 28196 239311 78653 7060625 29788
天 津 Tianjin 303155 160931 5607141 18510 123552 32003 2383688 19915
河 北 Hebei 1321145 693727 14439793 10981 576663 152143 6924637 12039
山 西 Shanxi 790690 398513 8660259 11025 385173 104559 4332285 11298
内蒙古 Inner Mongolia 646874 299932 8029125 12525 278161 79545 3804182 13765
辽 宁 Liaoning 1062804 537042 13640585 12791 388337 98742 5721218 14674
吉 林 Jilin 719596 354292 7804657 10849 234052 58820 2817893 12155
黑龙江 Heilongjiang 884416 408401 10684516 12110 345444 92365 4766999 13803
上 海 Shanghai 460074 247088 11745213 25539 157717 47672 4580025 29136
江 苏 Jiangsu 1335529 566090 22592665 16921 438559 89666 9728153 22261
浙 江 Zhejiang 855310 419602 22289018 26434 364103 83289 10610704 29336
安 徽 Anhui 949254 346597 10617092 11208 367098 84384 4730119 12888
福 建 Fujian 648929 293381 9682084 14944 286728 63732 4717623 16493
江 西 Jiangxi 781159 290580 8499729 10923 337970 81649 3974116 11837
山 东 Shandong 1723447 735553 23169852 13530 751284 177431 10328191 13817
河 南 Henan 1201403 553272 13383859 11285 843736 233288 9168847 11000
湖 北 Hubei 1159566 480535 12398623 10701 481416 119091 6190720 12807
湖 南 Hunan 1128588 483560 14349938 12731 548421 139399 6994102 12760
广 东 Guangdong 1517208 748759 30910412 20526 693207 167861 17835176 26062
广 西 Guangxi 919821 409142 10450958 11433 273714 71709 3798330 13948
海 南 Hainan 149174 60952 1923570 12921 75952 18526 1138506 15005
重 庆 Chongqing 458132 193919 5680419 12461 174863 43594 2497087 14402
四 川 Sichuan 1267801 521092 15941869 12608 572894 156869 8119666 14185
贵 州 Guizhou 544337 207935 5597045 10355 303501 82541 3393587 11203
云 南 Yunnan 805700 350106 10559384 13134 358614 96191 4641009 13050
西 藏 Tibet 60291 23172 1462330 24412 60716 17119 1687701 27863
陕 西 Shaanxi 795243 340383 8223170 10377 379904 90799 4246894 11214
甘 肃 Gansu 528234 191052 6621352 12605 239581 58959 3278943 13753
青 海 Qinghai 123907 53128 1887129 15369 64679 19822 1075798 16586
宁 夏 Ningxia 152456 66148 2119633 13923 64348 17887 866235 13572
新 疆 Xinjiang 492769 258950 7151456 14558 268035 84990 4154105 15565
4-3 6 continued
机关中地方 农、林、牧、渔业
Agriculture Forestry,
Local Organizations Farming of Animals and Fishing
年末人数 劳动报酬 平均劳动 年末人数 劳动报酬 平均劳动
地 区 Region (人) # 女 性
(千元) 报 酬 (人) # 女 性
(千元) 报 酬
Year-end Earnings (元) Year-end Earnings (元)
Figures Female Average Figures Female Average
(1 000 Earning (1 000 Earning
(person) yuan) (yuan) (person) yuan) (yuan)
National 10117302 2574967 152742347 15169 4577468 1671341 31435368 6819
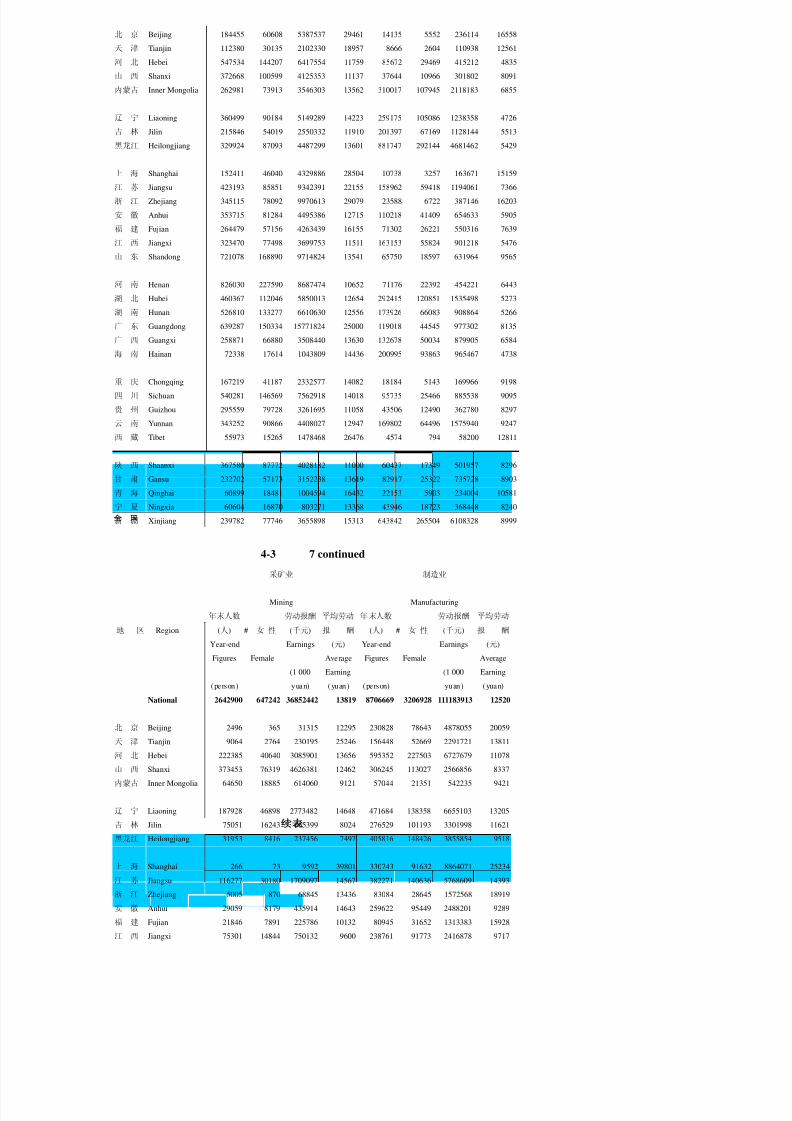
8/2/2019 China Labour Statistical Yearbook - 2004
http://slidepdf.com/reader/full/china-labour-statistical-yearbook-2004 293/464
北 京 Beijing 184455 60608 5387537 29461 14135 5552 236114 16558
天 津 Tianjin 112380 30135 2102330 18957 8666 2604 110938 12561
河 北 Hebei 547534 144207 6417554 11759 85672 29469 415212 4835
山 西 Shanxi 372668 100599 4125353 11137 37644 10966 301802 8091
内蒙古 Inner Mongolia 262981 73913 3546303 13562 310017 107945 2118183 6855
辽 宁 Liaoning 360499 90184 5149289 14223 259175 105086 1238358 4726
吉 林 Jilin 215846 54019 2550332 11910 201397 67169 1128144 5513
黑龙江 Heilongjiang 329924 87093 4487299 13601 881747 292144 4681462 5429
上 海 Shanghai 152411 46040 4329886 28504 10738 3257 163671 15159
江 苏 Jiangsu 423193 85851 9342391 22155 158962 59418 1194061 7366
浙 江 Zhejiang 345115 78092 9970613 29079 23588 6722 387146 16203
安 徽 Anhui 353715 81284 4495386 12715 110218 41409 654633 5905
福 建 Fujian 264479 57156 4263439 16155 71302 26221 550316 7639
江 西 Jiangxi 323470 77498 3699753 11511 163153 55824 901218 5476
山 东 Shandong 721078 168890 9714824 13541 65750 18597 631964 9565
河 南 Henan 826030 227590 8687474 10652 71176 22392 454221 6443
湖 北 Hubei 460367 112046 5850013 12654 292415 120851 1535498 5273
湖 南 Hunan 526810 133277 6610630 12556 173926 66083 908864 5266广 东 Guangdong 639287 150334 15771824 25000 119018 44545 977302 8135
广 西 Guangxi 258871 66880 3508440 13630 132678 50034 879905 6584
海 南 Hainan 72338 17614 1043809 14436 200995 93863 965467 4738
重 庆 Chongqing 167219 41187 2332577 14082 18184 5143 169966 9198
四 川 Sichuan 540281 146569 7562918 14018 95735 25466 885538 9095
贵 州 Guizhou 295559 79728 3261695 11058 43506 12490 362780 8297
云 南 Yunnan 343252 90866 4408027 12947 169802 64496 1575940 9247
西 藏 Tibet 55973 15265 1478468 26476 4574 794 58200 12811
陕 西 Shaanxi 367580 87772 4028182 11000 60437 17349 501957 8296
甘 肃 Gansu 232702 57173 3152238 13619 82917 25322 735728 8903
青 海 Qinghai 60899 18481 1004594 16432 22153 5903 234004 10581
宁 夏 Ningxia 60604 16870 803271 13368 43946 18723 368448 8240
新 疆 Xinjiang 239782 77746 3655898 15313 643842 265504 6108328 8999
4-3 7 continued
采矿业 制造业
Mining Manufacturing
年末人数 劳动报酬 平均劳动 年末人数 劳动报酬 平均劳动
地 区 Region (人) # 女 性
(千元) 报 酬 (人) # 女 性
(千元) 报 酬 Year-end Earnings (元) Year-end Earnings (元)
Figures Female Average Figures Female Average
(1 000 Earning (1 000 Earning
(person) yuan) (yuan) (person) yuan) (yuan)
National 2642900 647242 36852442 13819 8706669 3206928 111183913 12520
北 京 Beijing 2496 365 31315 12295 230828 78643 4878055 20059
天 津 Tianjin 9064 2764 230195 25246 156448 52669 2291721 13811
河 北 Hebei 222385 40640 3085901 13656 595352 227503 6727679 11078
山 西 Shanxi 373453 76319 4626381 12462 306245 113027 2566856 8337
内蒙古 Inner Mongolia 64650 18885 614060 9121 57044 21351 542235 9421
辽 宁 Liaoning 187928 46898 2773482 14648 471684 138358 6655103 13205
吉 林 Jilin 75051 16243 665399 8024 276529 101193 3301998 11621
黑龙江 Heilongjiang 31953 8416 237456 7497 405816 148426 3855854 9518
上 海 Shanghai 266 73 9592 39801 330743 91632 8864071 25234
江 苏 Jiangsu 116277 30180 1709097 14567 382271 140636 5768609 14393
浙 江 Zhejiang 5005 870 68845 13436 83084 28645 1572568 18919
安 徽 Anhui 29059 8179 435914 14643 259622 95449 2488201 9289
福 建 Fujian 21846 7891 225786 10132 80945 31652 1313383 15928
江 西 Jiangxi 75301 14844 750132 9600 238761 91773 2416878 9717

8/2/2019 China Labour Statistical Yearbook - 2004
http://slidepdf.com/reader/full/china-labour-statistical-yearbook-2004 294/464
山 东 Shandong 503353 132830 9616578 19132 889549 383724 9393790 10615
河 南 Henan 139668 41480 2083858 15145 472675 192151 4325385 9306
湖 北 Hubei 76342 24729 1024987 13498 617703 229137 8166515 13081
湖 南 Hunan 96119 21600 856354 8884 409435 149497 4953938 11774
广 东 Guangdong 23516 6000 297467 12581 234774 91944 4363134 17906
广 西 Guangxi 29129 7842 290245 9720 235315 83727 2609291 11035
海 南 Hainan 10907 3572 92163 8192 25556 9338 232194 8786
重 庆 Chongqing 44225 9258 472311 10059 219762 77742 2978256 13224
四 川 Sichuan 116360 29108 1406909 11943 436022 158352 5870183 13136
贵 州 Guizhou 55476 13938 611116 11209 187932 69614 1956698 9704
云 南 Yunnan 38817 11206 462967 11281 181520 69446 2891136 15544
西 藏 Tibet 1531 300 20859 14046 4583 1739 50971 11413
陕 西 Shaanxi 146535 31031 1905846 12810 471450 173750 4869569 10221
甘 肃 Gansu 58790 12456 696384 11943 320386 104363 3744926 12390
青 海 Qinghai 11462 2878 195448 16701 30208 10213 464498 15517
宁 夏 Ningxia 6555 888 76374 11823 26412 9393 279274 10310
新 疆 Xinjiang 69381 25559 1279021 18448 68015 31841 790944 11276
4-3 8 continued
电力、燃气及水的生产和供应业 建筑业
Production and Distribution of
Electricity, Gas and Water Construction
年末人数 劳动报酬 平均劳动 年末人数 劳动报酬 平均劳动
地 区 Region (人) # 女 性
(千元) 报 酬 (人) # 女 性
(千元) 报 酬
Year-end Earnings (元) Year-end Earnings (元)
Figures Female Average Figures Female Average
(1 000 Earning (1 000 Earning
(person) yuan) (yuan) (person) yuan) (yuan)
National 2241228 704198 40380915 18030 2993359 543029 38426758 12495
北 京 Beijing 19175 6031 868928 43097 160646 21702 3198728 20286
天 津 Tianjin 26112 5938 632222 24191 38327 7575 810721 19397
河 北 Hebei 145376 41275 2288806 15854 137203 29750 1559771 11319
山 西 Shanxi 92456 30164 1174407 12758 127286 24553 1296835 10106
内蒙古 Inner Mongolia 62279 21175 1004339 16175 42974 8489 445946 9016
辽 宁 Liaoning 121880 35271 2171453 17760 122795 25378 1573727 10972
吉 林 Jilin 63805 17973 931425 14766 83423 20200 784072 8911
黑龙江 Heilongjiang 123027 38365 1835667 14807 159067 39545 1901772 11835
上 海 Shanghai 37650 10661 1153658 30238 70122 11201 1754489 24791
江 苏 Jiangsu 86309 23075 2113587 24341 89692 16363 1515477 15879
浙 江 Zhejiang 63699 16604 2260338 35502 36565 4965 797569 20813
安 徽 Anhui 66241 19750 938302 14149 107301 21030 1182754 10854
福 建 Fujian 61345 18463 1224921 20030 73815 12339 1143819 15277
江 西 Jiangxi 77545 24820 940434 12039 79761 14497 899711 11205
山 东 Shandong 172311 53283 2935814 17196 153958 25351 1753546 11183
河 南 Henan 167115 54810 2369724 14327 231220 35926 2182112 9703
湖 北 Hubei 95927 33416 1323395 13816 122627 27093 1527383 12161
湖 南 Hunan 97893 34428 1411342 14415 158716 22989 1459505 9553
广 东 Guangdong 133883 41134 3685702 27190 143576 20110 2695136 17904
广 西 Guangxi 73119 24335 1219588 16822 51600 11089 609373 11178
海 南 Hainan 14496 5508 173861 11922 26409 2714 284189 10265
重 庆 Chongqing 36780 13181 674791 18255 56065 9268 632945 11046
四 川 Sichuan 90715 32111 1486654 16327 247935 42462 2976282 11775
贵 州 Guizhou 55024 16734 1038157 18853 99100 12939 1048772 10225
云 南 Yunnan 41848 14443 756839 18210 78340 13521 833709 11046
西 藏 Tibet 6805 2081 143012 21206 4739 1021 53496 12875
陕 西 Shaanxi 73861 24257 1164450 16036 124507 25369 1436874 11398

8/2/2019 China Labour Statistical Yearbook - 2004
http://slidepdf.com/reader/full/china-labour-statistical-yearbook-2004 295/464
甘 肃 Gansu 67813 23600 1161338 17222 73068 15081 807861 10151
青 海 Qinghai 15821 4511 339238 21326 19630 4902 238507 11727
宁 夏 Ningxia 26541 8462 526860 19417 18861 3360 230860 11412
新 疆 Xinjiang 24377 8339 431663 17766 54031 12247 790817 11577
4-3 9 continued
交通运输、仓储和邮政业 信息传输、计算机服务和软件业
Information Transfer,
Traffic, Transport, Storage and Post Computer Services and Software
年末人数 劳动报酬 平均劳动 年末人数 劳动报酬 平均劳动
地 区 Region (人) # 女 性
(千元) 报 酬 (人) # 女 性
(千元) 报 酬
Year-end Earnings (元) Year-end Earnings (元)
Figures Female Average Figures Female Average
(1 000 Earning (1 000 Earning
(person) yuan) (yuan) (person) yuan) (yuan)
National 4928331 1406834 79300596 15973 719598 248458 17900475 24969
北 京 Beijing 160486 53585 3853215 23876 24136 9830 1102606 44087
天 津 Tianjin 95591 22293 2182945 22570 7935 2268 237333 30069
河 北 Hebei 242765 64814 3142354 12928 30211 10065 679384 22389
山 西 Shanxi 195951 46083 2825455 14452 23601 9370 415696 17791
内蒙古 Inner Mongolia 148980 39061 2156938 14278 23365 9410 382829 16728
辽 宁 Liaoning 285574 75446 4480087 15164 31326 11025 926704 29179
吉 林 Jilin 219735 59479 2423046 10859 20192 7701 400341 20286
黑龙江 Heilongjiang 293169 82749 3907304 13131 29903 11075 781888 25642
上 海 Shanghai 173550 30115 4458847 25561 20793 8096 1073568 52513
江 苏 Jiangsu 231109 60305 4237496 18252 27505 8301 693396 25289
浙 江 Zhejiang 121041 33025 2849668 23702 23780 7854 943837 39005
安 徽 Anhui 125815 36120 1358172 10622 23517 7649 398797 17295
福 建 Fujian 112536 32785 2010090 17859 23719 7268 624174 27445
江 西 Jiangxi 148489 41279 2134165 14324 20145 6629 274847 13487
山 东 Shandong 236829 62571 3892299 16365 50869 15273 1141412 22970
河 南 Henan 277197 84848 3703223 13474 38632 12675 541260 14293
湖 北 Hubei 254351 104646 3181345 12372 27602 9334 458448 16619
湖 南 Hunan 213092 69666 2835349 12991 32385 11704 638276 19762
广 东 Guangdong 278022 77351 7061638 25448 72735 23230 2715054 36763
广 西 Guangxi 127401 33103 1855127 14679 18759 6378 414335 22322
海 南 Hainan 27123 8839 412516 15228 3375 960 98803 29085
重 庆 Chongqing 115327 33830 1579127 13533 15139 4898 350191 23394
四 川 Sichuan 166586 57229 2396575 14151 38909 14389 855309 22463
贵 州 Guizhou 92412 28739 1190588 12834 10042 3192 176533 17783
云 南 Yunnan 120325 37135 1764504 14356 21439 8771 396004 18689
西 藏 Tibet 7760 2599 168369 21841 2477 921 98396 40626
陕 西 Shaanxi 190799 45667 2787187 14588 17132 5486 285345 16589
甘 肃 Gansu 114967 35072 1737770 15221 17447 6045 222998 12859
青 海 Qinghai 27049 9878 499854 18895 6318 2111 167622 23807
宁 夏 Ningxia 29144 8598 440150 15535 5579 2231 142697 26519
新 疆 Xinjiang 95156 29924 1775193 18476 10631 4319 262392 25264
4-3 10 continued
批发和零售业 住宿和餐饮业
Wholesale and Retail Trade Accommodation and Restaurants
年末人数 劳动报酬 平均劳动 年末人数 劳动报酬 平均劳动
地 区 Region (人) # 女 性
(千元) 报 酬 (人) # 女 性
(千元) 报 酬
Year-end Earnings (元) Year-end Earnings (元)
Figures Female Average Figures Female Average
(1 000 Earning (1 000 Earning
(person) yuan) (yuan) (person) yuan) (yuan)

8/2/2019 China Labour Statistical Yearbook - 2004
http://slidepdf.com/reader/full/china-labour-statistical-yearbook-2004 296/464
National 3009717 1232724 33804991 10937 734261 395930 7661525 10482
北 京 Beijing 99187 44384 3116444 29982 64512 33447 1078526 16536
天 津 Tianjin 37299 14893 659830 16883 9378 4448 113303 11895
河 北 Hebei 200037 91357 1507329 7456 34736 19592 282711 7879
山 西 Shanxi 144441 56403 961798 6715 24531 13221 168058 6905
内蒙古 Inner Mongolia 47295 18971 418761 8596 14409 8394 106209 7429
辽 宁 Liaoning 79979 31924 963441 10820 20453 10967 198824 9137
吉 林 Jilin 92943 34357 634018 6819 15282 8656 124358 8185
黑龙江 Heilongjiang 168463 63262 1372485 8109 31095 10358 141748 6866
上 海 Shanghai 87005 40392 2022978 22558 35874 15145 702531 19282
江 苏 Jiangsu 118180 48849 1475412 11957 37188 19505 433448 11326
浙 江 Zhejiang 48712 17497 1426835 29034 26278 14897 362410 13745
安 徽 Anhui 123553 48916 890288 6492 17583 9875 138240 7645
福 建 Fujian 62720 23537 991952 15224 16191 9640 177459 10608
江 西 Jiangxi 94294 36547 807123 8278 15776 9418 130523 8054
山 东 Shandong 210323 92244 1819848 8458 56541 29380 522364 9111
河 南 Henan 324939 138268 2407055 7553 51535 29328 400108 7873湖 北 Hubei 137937 53749 960512 6983 19241 10650 140690 7225
湖 南 Hunan 114530 46022 1291600 10557 31495 17457 290021 9186
广 东 Guangdong 177789 68370 3418689 18566 53651 30343 772222 14239
广 西 Guangxi 85617 35689 774851 8896 27753 16349 215785 7719
海 南 Hainan 17947 6809 167582 9097 9441 5350 73101 7643
重 庆 Chongqing 47596 18284 588692 11915 10649 6005 96383 9163
四 川 Sichuan 110232 43077 1312235 11420 18165 10226 182710 10123
贵 州 Guizhou 73385 29763 716128 9365 11474 6399 96144 8554
云 南 Yunnan 70826 27396 991043 12598 17960 10614 157947 8660
西 藏 Tibet 5326 2240 75527 14146 2977 1733 39679 13204
陕 西 Shaanxi 120716 51200 935967 7699 24358 13472 181654 7468
甘 肃 Gansu 55626 23375 438497 7773 13902 8454 104185 7649
青 海 Qinghai 11635 5688 131716 11059 3730 1876 48507 12725
宁 夏 Ningxia 14024 7408 141875 9692 3138 1968 26452 8238
新 疆 Xinjiang 27161 11853 384480 13880 14965 8763 155225 10348
4-3 11 continued
金融业 房地产业
Finance Real Estate
年末人数 劳动报酬 平均劳动 年末人数 劳动报酬 平均劳动
地 区 Region (人) # 女 性
(千元) 报 酬 (人) # 女 性
(千元) 报 酬
Year-end Earnings (元) Year-end Earnings (元)
Figures Female Average Figures Female Average
(1 000 Earning (1 000 Earning
(person) yuan) (yuan) (person) yuan) (yuan)
National 2080795 945381 44738104 21267 522228 184806 8222645 15749
北 京 Beijing 64851 34650 3316063 52084 42898 15318 1069278 25187
天 津 Tianjin 25001 11838 626992 24774 5176 1666 97123 19074
河 北 Hebei 107696 46671 1676458 15355 18092 6957 204373 11238
山 西 Shanxi 70072 31849 1018882 14410 10044 4028 98213 9888
内蒙古 Inner Mongolia 53207 25235 783789 14457 10867 3845 126366 11508
辽 宁 Liaoning 101441 45027 2039475 19451 35905 12504 459517 12647
吉 林 Jilin 60516 27829 1016241 16719 17471 6390 192108 11076
黑龙江 Heilongjiang 64906 27997 1261914 19100 27059 9195 297828 11214
上 海 Shanghai 49294 24036 1998246 40665 32083 10067 782721 23843
江 苏 Jiangsu 127391 58344 2719235 21182 29788 10085 587277 19259
浙 江 Zhejiang 99629 51346 2865411 28585 17932 6264 459245 26071
安 徽 Anhui 76559 33451 1012216 13700 15155 5454 172251 11505

8/2/2019 China Labour Statistical Yearbook - 2004
http://slidepdf.com/reader/full/china-labour-statistical-yearbook-2004 297/464
福 建 Fujian 66006 29892 1816621 27016 11680 4013 205821 17652
江 西 Jiangxi 57039 25565 886572 14793 14644 5476 150866 10062
山 东 Shandong 143046 61994 2735204 19018 33339 12064 469453 14283
河 南 Henan 113160 50645 1896088 17029 22233 8036 240532 11000
湖 北 Hubei 85591 38573 1214407 13939 20796 7228 229919 11053
湖 南 Hunan 84183 37619 1465811 17109 20368 7730 266772 13095
广 东 Guangdong 165893 74365 5687422 33614 51257 17762 1027163 20139
广 西 Guangxi 55709 25367 1010201 17893 12567 4315 155825 12625
海 南 Hainan 14842 5599 337244 21731 4755 1691 56564 11555
重 庆 Chongqing 35491 16887 696024 19394 9557 3387 121960 12619
四 川 Sichuan 98987 47508 2160614 21309 14395 5082 212770 14740
贵 州 Guizhou 32701 14805 536230 15958 5809 1659 66398 11364
云 南 Yunnan 48529 21437 751375 15352 5948 2523 74438 12114
西 藏 Tibet 5510 2032 181471 32703 276 106 5877 21293
陕 西 Shaanxi 66066 28404 1065739 15937 9647 3624 102217 10832
甘 肃 Gansu 38248 15757 530926 13680 9643 3306 107434 11291
青 海 Qinghai 11396 4738 223511 19512 1164 529 22771 15748
宁 夏 Ningxia 14307 5700 277206 19141 1757 512 15498 9247新 疆 Xinjiang 43528 20221 930516 21175 9923 3990 144067 14292
4-3 12 continued
租赁和商务服务业 科学研究、技术服务和地质勘查业
Scientific Research,Technical Service
Tenancy and Business Services and Geologic Perambulation
年末人数 劳动报酬 平均劳动 年末人数 劳动报酬 平均劳动
地 区 Region (人) # 女 性
(千元) 报 酬 (人) # 女 性
(千元) 报 酬
Year-end Earnings (元) Year-end Earnings (元)
Figures Female Average Figures Female Average
(1 000 Earning (1 000 Earning
(person) yuan) (yuan) (person) yuan) (yuan)
National 1060097 328847 15765648 15042 1850673 591782 36847689 19775
北 京 Beijing 201447 55598 4022485 20116 188024 67573 6660820 35609
天 津 Tianjin 25543 4735 273086 11248 38997 13341 931124 23852
河 北 Hebei 21466 6314 210452 10044 70401 22321 1184718 16790
山 西 Shanxi 28172 9176 245996 8837 53193 17890 688637 13151
内蒙古 Inner Mongolia 29260 9702 395103 13152 37609 13352 539580 14260
辽 宁 Liaoning 46757 13809 568109 11829 81156 25643 1438119 17451
吉 林 Jilin 20482 5840 250760 12284 55590 18306 783900 14133
黑龙江 Heilongjiang 24602 9392 217790 9086 81966 24131 1338154 14031
上 海 Shanghai 64093 17848 1051132 16591 87825 32270 2545647 28918
江 苏 Jiangsu 50854 16064 834529 16076 70830 20322 1605482 22621
浙 江 Zhejiang 52019 18139 1056380 20782 54566 15005 1557983 28999安 徽 Anhui 16460 6649 179822 11044 49432 13806 661730 13318
福 建 Fujian 25620 8632 361303 14241 33928 9767 675466 19906
江 西 Jiangxi 13422 4550 153088 11700 49267 14755 629114 12737
山 东 Shandong 41229 12234 577461 14162 69014 20582 1187608 17190
河 南 Henan 52010 19795 546665 10805 98901 32996 1442986 14752
湖 北 Hubei 42538 15239 433632 10271 93441 29123 1365896 14677
湖 南 Hunan 43864 9830 523111 13136 62978 20853 941128 14715
广 东 Guangdong 92493 28524 1817463 19835 78171 22792 2537576 32652
广 西 Guangxi 30594 12316 345130 11070 42711 13711 631248 14779
海 南 Hainan 6674 2319 76486 11435 12858 4327 150781 11732

8/2/2019 China Labour Statistical Yearbook - 2004
http://slidepdf.com/reader/full/china-labour-statistical-yearbook-2004 298/464
重 庆 Chongqing 8993 2905 108327 12396 27226 7639 532008 19108
四 川 Sichuan 21727 5748 303287 13934 107732 34918 2121329 19769
贵 州 Guizhou 24135 6245 309843 13267 26016 8504 366622 14089
云 南 Yunnan 11743 4530 164269 13935 46502 15252 660284 14205
西 藏 Tibet 491 215 6587 13388 5298 1620 159371 29761
陕 西 Shaanxi 17815 5712 191499 10774 112344 34433 1651112 14675
甘 肃 Gansu 12852 5010 136593 10709 46580 14216 670973 14478
青 海 Qinghai 2706 850 34607 12995 18915 5333 410725 21870
宁 夏 Ningxia 4776 1349 54520 11241 11237 3537 159154 13992
新 疆 Xinjiang 25260 9578 316133 12788 37965 13464 618414 16143
4-3 13 continued
水利、环境和公共设施管理业 居民服务和其他服务业
Management of Water Conservancy,
Environment and Public Establishment Resident Services and Other Services
年末人数 劳动报酬 平均劳动 年末人数 劳动报酬 平均劳动
地 区 Region (人) # 女 性
(千元) 报 酬 (人) # 女 性
(千元) 报 酬
Year-end Earnings (元) Year-end Earnings (元)
Figures Female Average Figures Female Average
(1 000 Earning (1 000 Earning
(person) yuan) (yuan) (person) yuan) (yuan)
National 1553310 612617 18252282 11782 220813 80153 3261556 14419
北 京 Beijing 47888 17938 1111534 22532 16027 5258 379103 23586
天 津 Tianjin 30764 10236 513756 16305 10395 3983 175846 16837
河 北 Hebei 75719 30632 762792 10008 22307 8730 349308 15715
山 西 Shanxi 45708 16828 368226 8107 8650 3575 83264 9733
内蒙古 Inner Mongolia 50470 22394 489060 10255 5138 2299 42933 8749
辽 宁 Liaoning 99885 43979 1056571 10455 9651 3890 111094 11791
吉 林 Jilin 58786 23805 522701 8682 8212 3150 88297 10754
黑龙江 Heilongjiang 72765 27182 665452 9210 11372 4296 104160 8978
上 海 Shanghai 47816 16458 1107072 23215 13210 5339 241926 18182
江 苏 Jiangsu 85529 28985 1302407 15146 8770 3056 128777 14692
浙 江 Zhejiang 36118 12441 715743 19986 4770 1492 110968 23436
安 徽 Anhui 57714 22710 515518 8985 3890 1332 42117 10577
福 建 Fujian 28479 11632 360738 12664 7932 3589 129290 16521
江 西 Jiangxi 37973 15489 328434 8703 7466 3182 63689 8617
山 东 Shandong 98581 38129 1138120 11706 7499 2554 102224 13490
河 南 Henan 100768 40724 976281 9834 9338 3271 96777 10634
湖 北 Hubei 78580 31359 700678 8954 4880 1807 58840 11952
湖 南 Hunan 63641 24531 604518 9553 4989 1397 59294 11878
广 东 Guangdong 91284 37408 1499621 16479 9094 3177 233592 25811
广 西 Guangxi 44384 18710 436754 9881 1935 619 35395 18561
海 南 Hainan 14509 7018 139134 9553 192 64 3551 18495
重 庆 Chongqing 20529 8861 188186 9446 2515 460 22622 13930
四 川 Sichuan 64466 28080 613588 9574 7223 2729 106710 14516
贵 州 Guizhou 18068 7785 149574 8395 1098 437 11503 10563
云 南 Yunnan 35135 14863 363489 10539 1790 782 21814 12276
西 藏 Tibet 1314 737 19849 15163 36 6 1010 28056
陕 西 Shaanxi 48544 16638 443784 9199 11739 4929 116168 9987
甘 肃 Gansu 34932 12587 399268 11420 2650 1623 31130 11927
青 海 Qinghai 7847 2855 81029 10412 1334 542 24260 18268
宁 夏 Ningxia 15622 6156 187226 12067 256 89 3280 13120
新 疆 Xinjiang 39492 15467 491179 12160 16455 2496 282614 12124

8/2/2019 China Labour Statistical Yearbook - 2004
http://slidepdf.com/reader/full/china-labour-statistical-yearbook-2004 299/464
4-3 14 continued
教育 卫生、社会保障和社会福利业
Sanitation,Social Security
Education and Social Welfare
年末人数 劳动报酬 平均劳动 年末人数 劳动报酬 平均劳动
地 区 Region (人) # 女 性
(千元) 报 酬 (人) # 女 性
(千元) 报 酬
Year-end Earnings (元) Year-end Earnings (元)
Figures Female Average Figures Female Average
(1 000 Earning (1 000 Earning
(person) yuan) (yuan) (person) yuan) (yuan)
National 13782999 6415433 197010828 14371 4309385 2551791 71723209 16741
北 京 Beijing 305986 175635 8612187 28355 121797 82532 4105637 34215
天 津 Tianjin 165591 92957 3131222 18948 65508 42904 1324040 20420
河 北 Hebei 815512 471948 8929757 11011 202812 120588 2425067 11983
山 西 Shanxi 446366 249379 5043844 11365 113736 70276 1323894 11677
内蒙古 Inner Mongolia 318489 159265 4206038 13296 89393 52888 1263719 14133
辽 宁 Liaoning 520399 291433 6999232 13508 201904 127480 2929780 14453
吉 林
Jilin 357008 197849 4605577 12930 128193 78336 1529248 11976黑龙江 Heilongjiang 441319 233467 6023922 13728 162964 100437 2146478 13158
上 海 Shanghai 245014 141264 6296708 25584 121141 80222 3262255 27003
江 苏 Jiangsu 785793 342482 12925415 16489 206633 119128 4176535 20339
浙 江 Zhejiang 481663 247805 12057921 25363 186918 113811 5651821 30862
安 徽 Anhui 554973 189595 6276789 11334 122221 68116 1599279 13208
福 建 Fujian 422657 192471 6255750 14859 91122 54307 1562790 17315
江 西 Jiangxi 429279 159185 4650719 10889 122804 64238 1550192 12646
山 东 Shandong 1037326 440032 13645342 13241 294207 168551 4634989 15851
河 南 Henan 533977 253415 6540701 12400 300681 171639 3455512 11619
湖 北 Hubei 624283 251365 7373714 11844 237277 135507 2890940 12220
湖 南 Hunan 652900 273323 8620363 13207 202987 116003 3198646 15831
广 东 Guangdong 915061 460573 18204465 20086 333050 203063 8368196 25320
广 西 Guangxi 539527 242388 5787699 10807 152428 91458 2041888 13543
海 南 Hainan 81908 30444 1072330 13121 24419 14040 386763 15950
重 庆 Chongqing 297287 124968 3788191 12847 68589 37905 973775 14249
四 川 Sichuan 774320 315098 9729348 12631 200687 111651 3247492 16277
贵 州 Guizhou 355249 129865 3607420 10221 84140 47205 973763 11639
云 南 Yunnan 460411 196754 5993863 13041 121420 75853 1797133 14880
西 藏 Tibet 28755 11248 711136 24964 11456 5558 287987 25075
陕 西 Shaanxi 474363 212661 5706199 12098 119807 64168 1349523 11292
甘 肃 Gansu 277028 95429 3532745 12838 71260 39059 989554 13971
青 海 Qinghai 60746 26969 978984 16219 21315 12622 359619 16922
宁 夏 Ningxia 74797 31920 1115339 14992 25150 14951 350296 13993
新 疆 Xinjiang 305012 174246 4587908 15105 103366 67295 1566398 15189
4-3 15 continued
文化体育和娱乐业 公共管理和社会组织
Public Management and
Culture, Sports and Entertainment Social Organization
年末人数 劳动报酬 平均劳动 年末人数 劳动报酬 平均劳动
地 区 Region (人) # 女 性
(千元) 报 酬 (人) # 女 性
(千元) 报 酬
Year-end Earnings (元) Year-end Earnings (元)
Figures Female Average Figures Female Average
(1 000 Earning (1 000 Earning
(person) yuan) (yuan) (person) yuan) (yuan)
National 1170481 469907 20254197 17340 11651359 3058353 178165733 15382
北 京 Beijing 95801 40811 3452400 36043 267526 89703 7768911 29344
天 津 Tianjin 20429 9206 403171 19585 130686 34309 2533217 19983

8/2/2019 China Labour Statistical Yearbook - 2004
http://slidepdf.com/reader/full/china-labour-statistical-yearbook-2004 300/464
河 北 Hebei 45621 19842 573718 12546 662334 182335 7860762 11906
山 西 Shanxi 38635 16617 426509 11188 406710 111866 4524014 11172
内蒙古 Inner Mongolia 30376 13123 419360 13806 296120 84726 4049138 13762
辽 宁 Liaoning 51985 21234 794705 15174 448037 119180 6503429 14504
吉 林 Jilin 43382 16783 500448 11503 278169 73823 3340289 12125
黑龙江 Heilongjiang 36276 14461 491024 13799 380015 103288 5318050 13956
上 海 Shanghai 41173 16357 1274376 31126 168535 52859 4729931 28217
江 苏 Jiangsu 48595 18684 982914 20096 512560 106974 10826740 21124
浙 江 Zhejiang 42580 16415 1137332 26878 382225 87783 11071276 29194
安 徽 Anhui 40934 15553 461685 11226 419375 98457 5323845 12704
福 建 Fujian 27296 10396 473417 17437 286221 63731 4690677 16435
江 西 Jiangxi 32871 12705 390808 11783 365665 88461 4129042 11384
山 东 Shandong 50845 19571 827668 16369 852183 209009 11607959 13701
河 南 Henan 64630 25992 701740 11095 916316 256749 9941753 10994
湖 北 Hubei 58083 19969 660746 11405 522063 131583 6600789 12597
湖 南 Hunan 61152 25706 885968 14508 607198 156076 7740993 12749
广 东 Guangdong 54775 22475 1544651 28378 737530 185295 18632885 25582
广 西 Guangxi 27500 10649 357653 12998 319857 86302 4367067 13724海 南 Hainan 9335 3536 149924 16064 80813 21403 1190836 14743
重 庆 Chongqing 15999 5988 252737 15586 194151 50616 2685385 13959
四 川 Sichuan 48877 19604 688700 13862 618669 173336 8746720 14382
贵 州 Guizhou 19215 7748 214983 11398 289456 76513 3252045 11264
云 南 Yunnan 35838 14359 483340 13447 368795 99914 4747310 13007
西 藏 Tibet 5472 1928 141377 26075 61574 17472 1702105 27738
陕 西 Shaanxi 47469 19543 533717 11288 406191 102165 4425436 10919
甘 肃 Gansu 36471 13484 456041 12626 261037 66234 3526195 13575
青 海 Qinghai 5767 2356 86347 15022 66165 19801 1117773 16860
宁 夏 Ningxia 7873 3422 108520 13833 70076 20233 935740 13470
新 疆 Xinjiang 25226 11390 378218 15043 275107 88157 4275421 15593

8/2/2019 China Labour Statistical Yearbook - 2004
http://slidepdf.com/reader/full/china-labour-statistical-yearbook-2004 301/464
4-4
ON-POST STAFF AND WORKERS AND WAGES BY SECTOR AND REGION
(State-owned Units, 2003)
总 计 企 业
Total Enterprises
地 区 Region 年末人数 平均人数 工资总额 平均工资 年末人数 平均人数 工资总额 平均工资
(人) (人) (千元) (元) (人) (人) (千元) (元)
Year-end Average Total Average Year-end Average Total Average
Figures Figures Wages Wage Figures Figures Wages Wage
(1 000 (1 000
(person) (person) yuan) (yuan) (person) (person) yuan) (yuan)
National 66212762 66498895 969385149 14577 30667166 31110332 436403854 14028
北 京 Beijing 1975663 1986805 56552439 28464 1032229 1047247 28046253 26781
天 津 Tianjin 857673 870094 16838087 19352 435301 449678 8483735 18866
河 北 Hebei 3673317 3686588 43439018 11783 1754712 1774356 21458562 12094
山 西 Shanxi 2487645 2477784 27782264 11213 1314032 1311515 14613716 11143
内蒙古 Inner Mongolia 1660781 1666654 19881615 11929 732388 745004 7859900 10550
辽 宁 Liaoning 3101539 3181236 43274942 13603 1625514 1700690 23177265 13628
吉 林 Jilin 2044048 2066219 22985002 11124 1047632 1073652 11382471 10602
黑龙江 Heilongjiang 3213413 3196952 35275497 11034 1971691 1957750 19327743 9872
上 海 Shanghai 1407132 1438191 40853388 28406 773762 806010 22671014 28127
江 苏 Jiangsu 3049835 3088658 54058602 17502 1255002 1292699 20619424 15951
浙 江 Zhejiang 1704039 1692928 46205008 27293 505521 507683 13233063 26066
安 徽 Anhui 2122411 2148642 24107456 11220 809388 837507 8466706 10109
福 建 Fujian 1470680 1474086 24263788 16460 542639 548267 9716616 17722
江 西 Jiangxi 1961232 1979707 21615357 10918 836954 861221 8891299 10324
山 东 Shandong 4874622 4859182 67908269 13975 2362281 2363256 33354678 14114
河 南 Henan 3879763 3828287 43631378 11397 1819137 1792067 20565483 11476
湖 北 Hubei 3301598 3312320 39105554 11806 1627461 1637198 19070840 11648
湖 南 Hunan 2975225 2990460 37693100 12604 1300827 1317718 15785209 11979
广 东 Guangdong 3655582 3665523 84102096 22944 1412914 1442828 32949886 22837
广 西 Guangxi 1898637 1901313 23445978 12331 750072 759283 9215021 12136
海 南 Hainan 572557 579244 5969341 10305 342845 350081 2805839 8015
重 庆 Chongqing 1218812 1226194 16659680 13586 561144 572496 7845773 13705
四 川 Sichuan 3158880 3169562 44131164 13923 1252454 1277645 17913802 14021
贵 州 Guizhou 1417464 1431229 16301765 11390 592797 610836 7238523 11850
云 南 Yunnan 1817770 1827989 24623943 13471 669217 683184 9289421 13597
西 藏 Tibet 136646 136111 3758225 27611 31911 32001 690483 21577
陕 西 Shaanxi 2464230 2468273 29206753 11833 1226522 1234756 14986639 12137
甘 肃 Gansu 1551454 1532758 19817721 12929 768259 753707 9419839 12498
青 海 Qinghai 332748 334230 5578999 16692 143487 145663 2525806 17340
宁 夏 Ningxia 387173 389552 5345027 13721 168297 171178 2288508 13369
新 疆 Xinjiang 1840193 1892124 24973693 13199 1000776 1053156 12510337 11879

8/2/2019 China Labour Statistical Yearbook - 2004
http://slidepdf.com/reader/full/china-labour-statistical-yearbook-2004 302/464
4-4 1 continued
非农企业 事 业
Nonagricultural Enterprises Institutions
地 区 Region 年末人数 平均人数 工资总额 平均工资 年末人数 平均人数 工资总额 平均工资
(人) (人) (千元) (元) (人) (人) (千元) (元)
Year-end Average Total Average Year-end Average Total Average
Figures Figures Wages Wage Figures Figures Wages Wage
(1 000 (1 000
(person) (person) yuan) (yuan) (person) (person) yuan) (yuan)
National 26328301 26738789 406186975 15191 25081914 24974408 368880830 14770
北 京 Beijing 1018218 1033125 27811331 26920 714266 712400 21535251 30229
天 津 Tianjin 426761 440965 8373718 18990 311654 312713 6035127 19299
河 北 Hebei 1669103 1688562 21043785 12463 1346097 1341215 15079992 11244
山 西 Shanxi 1277024 1274892 14315169 11229 792383 786641 8856267 11258
内蒙古 Inner Mongolia 422594 436239 5742452 13164 653884 648369 8231610 12696
辽 宁 Liaoning 1367892 1440226 21946150 15238 1095232 1098219 14419406 13130
吉 林 Jilin 847385 870225 10259074 11789 765441 763970 8798569 11517
黑龙江 Heilongjiang 1234000 1240085 15447922 12457 902402 900054 11214072 12459
上 海 Shanghai 767126 798841 22535882 28211 494599 493782 13772173 27891
江 苏 Jiangsu 1099723 1134711 19444083 17136 1372313 1374512 23856101 17356
浙 江 Zhejiang 482611 484467 12851869 26528 847522 836472 22506413 26906
安 徽 Anhui 703657 730810 7823271 10705 956978 955041 10970898 11487
福 建 Fujian 475540 480625 9184987 19111 645691 644134 9862191 15311
江 西 Jiangxi 679017 702014 8012603 11414 792665 789187 8790823 11139
山 东 Shandong 2297339 2298020 32727425 14242 1765228 1752528 24255756 13840
河 南 Henan 1749207 1722833 20115699 11676 1225815 1211281 13941874 11510
湖 北 Hubei 1344987 1356673 17580167 12958 1200577 1199756 13899526 11585
湖 南 Hunan 1137095 1154793 14916281 12917 1133895 1132790 14976673 13221
广 东 Guangdong 1296883 1325607 31996611 24137 1554145 1542782 33377225 21634
广 西 Guangxi 626744 634267 8372177 13200 881703 876667 10470868 11944
海 南 Hainan 143588 148068 1851409 12504 155439 154966 2034835 13131
重 庆 Chongqing 543025 554085 7676401 13854 484492 482022 6331358 13135
四 川 Sichuan 1158691 1182253 17036537 14410 1344100 1330188 18167131 13658
贵 州 Guizhou 551628 569270 6881001 12087 529330 525891 5704202 10847
云 南 Yunnan 516056 528266 7761299 14692 797387 796265 10722701 13466
西 藏 Tibet 29262 29397 640431 21786 51923 51550 1432916 27797
陕 西 Shaanxi 1167052 1175212 14489104 12329 863626 861242 10004707 11617
甘 肃 Gansu 687103 672763 8692022 12920 547135 543942 7133436 13114
青 海 Qinghai 122124 124326 2294314 18454 125938 125020 1983385 15865
宁 夏 Ningxia 124632 126749 1921132 15157 156254 156326 2196583 14051
新 疆 Xinjiang 362234 380420 6442669 16936 573800 574483 8318761 14480
4-4 2 continued
机 关 农、林、牧、渔业
Agriculture Forestry,
Agencies and Organizations Farming of Animals and Fishing
地 区 Region 年末人数 平均人数 工资总额 平均工资 年末人数 平均人数 工资总额 平均工资
(人) (人) (千元) (元) (人) (人) (千元) (元)
Year-end Average Total Average Year-end Average Total Average
Figures Figures Wages Wage Figures Figures Wages Wage
(1 000 (1 000
(person) (person) yuan) (yuan) (person) (person) yuan) (yuan)
National 10463682 10414155 164100465 15757 4338865 4371543 30216879 6912
北 京 Beijing 229168 227158 6970935 30688 14011 14122 234922 16635
天 津 Tianjin 110718 107703 2319225 21534 8540 8713 110017 12627
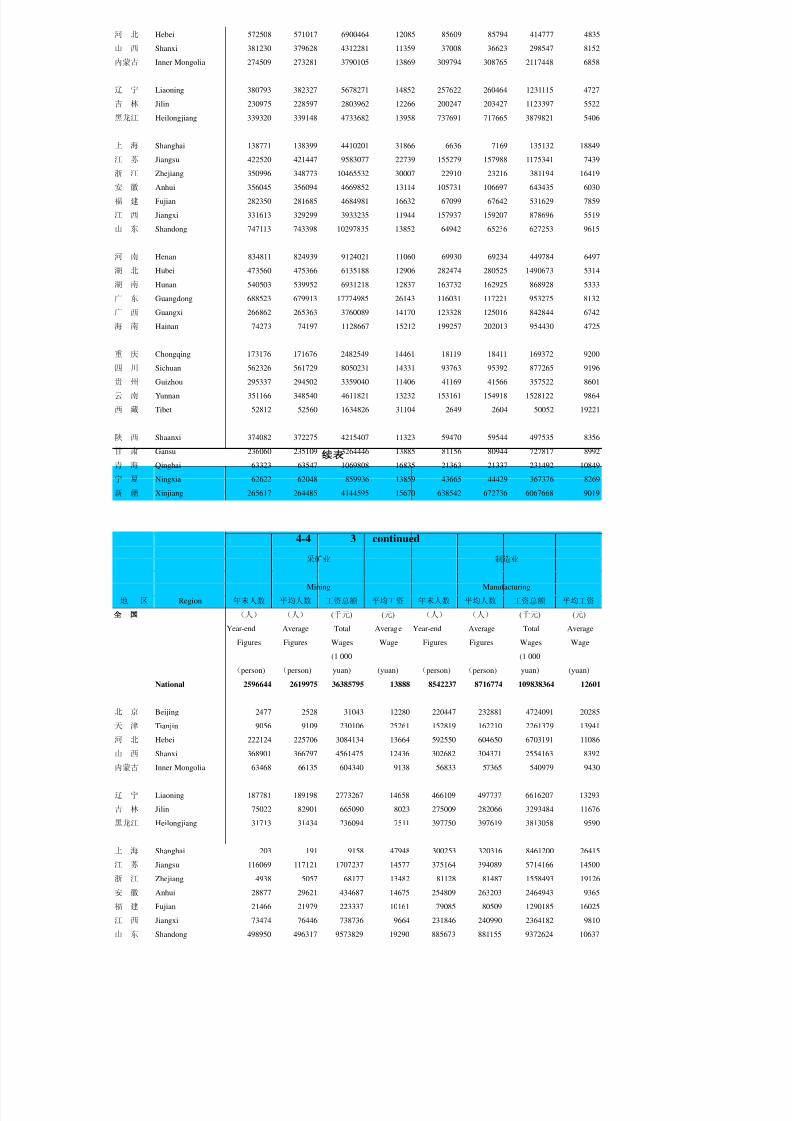
8/2/2019 China Labour Statistical Yearbook - 2004
http://slidepdf.com/reader/full/china-labour-statistical-yearbook-2004 303/464
河 北 Hebei 572508 571017 6900464 12085 85609 85794 414777 4835
山 西 Shanxi 381230 379628 4312281 11359 37008 36623 298547 8152
内蒙古 Inner Mongolia 274509 273281 3790105 13869 309794 308765 2117448 6858
辽 宁 Liaoning 380793 382327 5678271 14852 257622 260464 1231115 4727
吉 林 Jilin 230975 228597 2803962 12266 200247 203427 1123397 5522
黑龙江 Heilongjiang 339320 339148 4733682 13958 737691 717665 3879821 5406
上 海 Shanghai 138771 138399 4410201 31866 6636 7169 135132 18849
江 苏 Jiangsu 422520 421447 9583077 22739 155279 157988 1175341 7439
浙 江 Zhejiang 350996 348773 10465532 30007 22910 23216 381194 16419
安 徽 Anhui 356045 356094 4669852 13114 105731 106697 643435 6030
福 建 Fujian 282350 281685 4684981 16632 67099 67642 531629 7859
江 西 Jiangxi 331613 329299 3933235 11944 157937 159207 878696 5519
山 东 Shandong 747113 743398 10297835 13852 64942 65236 627253 9615
河 南 Henan 834811 824939 9124021 11060 69930 69234 449784 6497
湖 北 Hubei 473560 475366 6135188 12906 282474 280525 1490673 5314
湖 南 Hunan 540503 539952 6931218 12837 163732 162925 868928 5333
广 东 Guangdong 688523 679913 17774985 26143 116031 117221 953275 8132
广 西 Guangxi 266862 265363 3760089 14170 123328 125016 842844 6742海 南 Hainan 74273 74197 1128667 15212 199257 202013 954430 4725
重 庆 Chongqing 173176 171676 2482549 14461 18119 18411 169372 9200
四 川 Sichuan 562326 561729 8050231 14331 93763 95392 877265 9196
贵 州 Guizhou 295337 294502 3359040 11406 41169 41566 357522 8601
云 南 Yunnan 351166 348540 4611821 13232 153161 154918 1528122 9864
西 藏 Tibet 52812 52560 1634826 31104 2649 2604 50052 19221
陕 西 Shaanxi 374082 372275 4215407 11323 59470 59544 497535 8356
甘 肃 Gansu 236060 235109 3264446 13885 81156 80944 727817 8992
青 海 Qinghai 63323 63547 1069808 16835 21363 21337 231492 10849
宁 夏 Ningxia 62622 62048 859936 13859 43665 44429 367376 8269
新 疆 Xinjiang 265617 264485 4144595 15670 638542 672736 6067668 9019
4-4 3 continued
采矿业 制造业
Mining Manufacturing
地 区 Region 年末人数 平均人数 工资总额 平均工资 年末人数 平均人数 工资总额 平均工资
(人) (人) (千元) (元) (人) (人) (千元) (元)
Year-end Average Total Average Year-end Average Total AverageFigures Figures Wages Wage Figures Figures Wages Wage
(1 000 (1 000
(person) (person) yuan) (yuan) (person) (person) yuan) (yuan)
National 2596644 2619975 36385795 13888 8542237 8716774 109838364 12601
北 京 Beijing 2477 2528 31043 12280 220447 232881 4724091 20285
天 津 Tianjin 9056 9109 230106 25261 152819 162210 2261379 13941
河 北 Hebei 222124 225706 3084134 13664 592550 604650 6703191 11086
山 西 Shanxi 368901 366797 4561475 12436 302682 304371 2554163 8392
内蒙古 Inner Mongolia 63468 66135 604340 9138 56833 57365 540979 9430
辽 宁 Liaoning 187781 189198 2773267 14658 466109 497737 6616207 13293
吉 林 Jilin 75022 82901 665090 8023 275009 282066 3293484 11676
黑龙江 Heilongjiang 31713 31434 236094 7511 397750 397619 3813058 9590
上 海 Shanghai 203 191 9158 47948 300253 320316 8461200 26415
江 苏 Jiangsu 116069 117121 1707237 14577 375164 394089 5714166 14500
浙 江 Zhejiang 4938 5057 68177 13482 81128 81487 1558493 19126
安 徽 Anhui 28877 29621 434687 14675 254809 263203 2464943 9365
福 建 Fujian 21466 21979 223337 10161 79085 80509 1290185 16025
江 西 Jiangxi 73474 76446 738736 9664 231846 240990 2364182 9810
山 东 Shandong 498950 496317 9573829 19290 885673 881155 9372624 10637

8/2/2019 China Labour Statistical Yearbook - 2004
http://slidepdf.com/reader/full/china-labour-statistical-yearbook-2004 304/464
河 南 Henan 132916 130981 2024727 15458 463462 455743 4299480 9434
湖 北 Hubei 73098 72816 977448 13424 608666 615456 8094017 13151
湖 南 Hunan 92594 92791 832352 8970 397357 409041 4888378 11951
广 东 Guangdong 23423 23563 296970 12603 231217 240351 4314174 17949
广 西 Guangxi 28156 28801 280808 9750 227993 229472 2573988 11217
海 南 Hainan 10846 11189 92023 8224 24411 25589 229337 8962
重 庆 Chongqing 43653 46556 468908 10072 217441 221968 2957657 13325
四 川 Sichuan 114863 116365 1390788 11952 429386 440857 5826880 13217
贵 州 Guizhou 53713 52793 597862 11325 182258 195504 1920118 9821
云 南 Yunnan 38088 40346 459764 11396 179815 184610 2880077 15601
西 藏 Tibet 696 702 12026 17131 3745 3756 44591 11872
陕 西 Shaanxi 143630 146055 1889559 12937 463625 468592 4822502 10291
甘 肃 Gansu 56896 56397 677849 12019 317531 299523 3732687 12462
青 海 Qinghai 11426 11667 195371 16746 29710 29453 460375 15631
宁 夏 Ningxia 6336 6273 75227 11992 26162 26794 278278 10386
新 疆 Xinjiang 61791 62140 1173403 18883 67301 69417 783480 11287
4-4 4 continued
电力、燃气及水的生产和供应业 建 筑 业
Production and Distribution of
Electricity, Gas and Water Construction
地 区 Region 年末人数 平均人数 工资总额 平均工资 年末人数 平均人数 工资总额 平均工资
(人) (人) (千元) (元) (人) (人) (千元) (元)
Year-end Average Total Average Year-end Average Total Average
Figures Figures Wages Wage Figures Figures Wages Wage
(1 000 (1 000
(person) (person) yuan) (yuan) (person) (person) yuan) (yuan)
National 2200590 2200024 40098026 18226 2786623 2853886 36356712 12739
北 京 Beijing 18978 19973 866337 43375 139772 135403 2980259 22010
天 津 Tianjin 25532 25700 626707 24385 35835 38496 755834 19634
河 北 Hebei 136118 135096 2242813 16602 136876 136665 1547030 11320
山 西 Shanxi 92049 91648 1172876 12798 125460 124169 1256385 10118
内蒙古 Inner Mongolia 62040 61850 1002981 16216 41358 47571 435488 9154
辽 宁 Liaoning 120797 121077 2166329 17892 120066 138966 1540319 11084
吉 林 Jilin 63537 62558 927875 14832 81512 86067 760735 8839
黑龙江 Heilongjiang 121699 122759 1829492 14903 151430 144765 1764676 12190
上 海 Shanghai 37104 37614 1147015 30494 61883 63757 1672275 26229
江 苏 Jiangsu 85758 86321 2110933 24454 85418 90840 1473310 16219
浙 江 Zhejiang 62146 62150 2228823 35862 34956 36641 765668 20896
安 徽 Anhui 64762 64996 927612 14272 95678 96433 1062766 11021
福 建 Fujian 59174 58972 1204188 20420 71475 72198 1116001 15458
江 西 Jiangxi 75291 75899 927821 12224 71427 73234 871600 11902
山 东 Shandong 170918 169367 2927604 17286 148075 151943 1703584 11212
河 南 Henan 164994 163545 2354622 14397 211373 208705 2043246 9790
湖 北 Hubei 94696 94534 1314209 13902 115644 118224 1475354 12479
湖 南 Hunan 96427 96447 1403005 14547 122601 117298 1141859 9735
广 东 Guangdong 133059 134765 3676855 27283 130820 138432 2573179 18588
广 西 Guangxi 70941 70554 1208609 17130 46615 50531 582041 11518
海 南 Hainan 13038 13200 163254 12368 26072 27407 281585 10274
重 庆 Chongqing 36715 36899 673648 18257 55096 56263 621032 11038
四 川 Sichuan 88951 89382 1476900 16523 227027 228794 2710677 11848
贵 州 Guizhou 53625 53695 1030192 19186 92983 94050 977553 10394
云 南 Yunnan 41162 40881 749980 18345 78077 75212 830724 11045
西 藏 Tibet 5940 5929 136915 23092 2044 2069 26118 12623
陕 西 Shaanxi 72253 71066 1150143 16184 119892 120715 1395194 11558
甘 肃 Gansu 66672 66289 1156095 17440 72113 77443 795864 10277
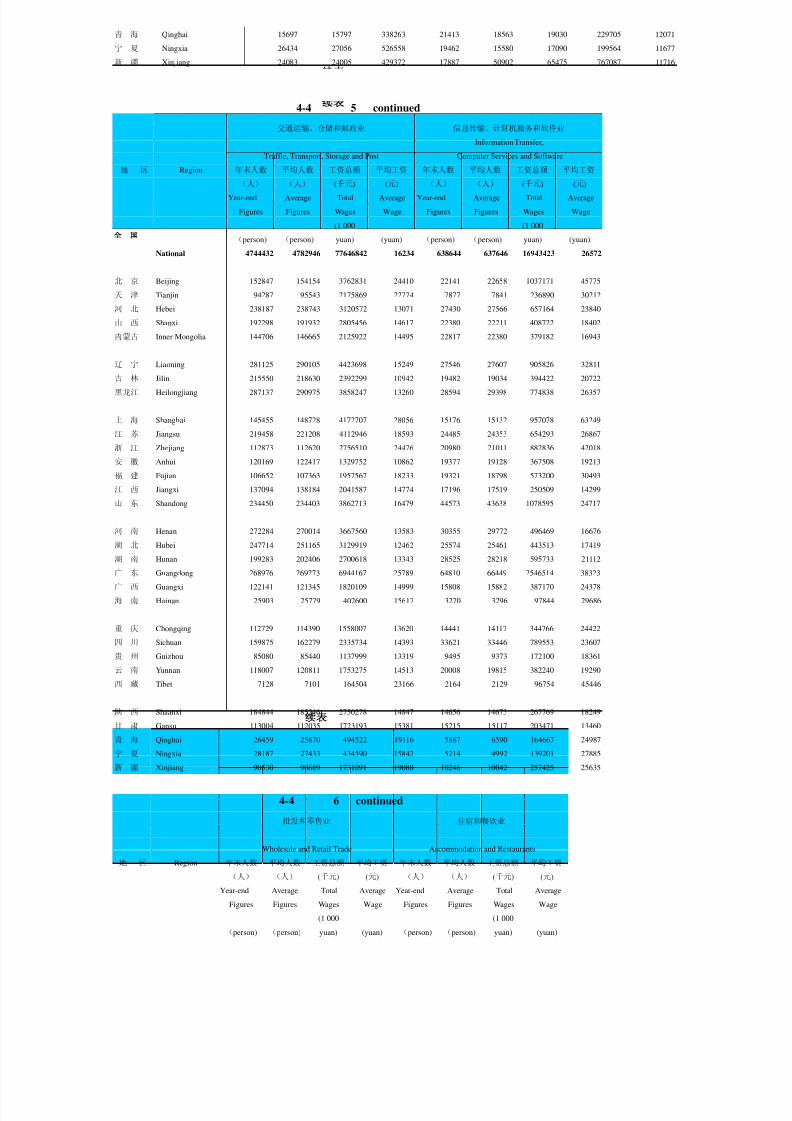
8/2/2019 China Labour Statistical Yearbook - 2004
http://slidepdf.com/reader/full/china-labour-statistical-yearbook-2004 305/464
青 海 Qinghai 15697 15797 338263 21413 18563 19030 229705 12071
宁 夏 Ningxia 26434 27056 526558 19462 15580 17090 199564 11677
新 疆 Xinjiang 24083 24005 429372 17887 50902 65475 767087 11716
4-4 5 continued
交通运输、仓储和邮政业 信息传输、计算机服务和软件业
Information Transfer,
Traffic, Transport, Storage and Post Computer Services and Software
地 区 Region 年末人数 平均人数 工资总额 平均工资 年末人数 平均人数 工资总额 平均工资
(人) (人) (千元) (元) (人) (人) (千元) (元)
Year-end Average Total Average Year-end Average Total Average
Figures Figures Wages Wage Figures Figures Wages Wage
(1 000 (1 000
(person) (person) yuan) (yuan) (person) (person) yuan) (yuan)
National 4744432 4782946 77646842 16234 638644 637646 16943423 26572
北 京 Beijing 152847 154154 3762831 24410 22141 22658 1037171 45775
天 津 Tianjin 94287 95543 2175869 22774 7877 7841 236890 30212
河 北 Hebei 238187 238743 3120572 13071 27430 27566 657164 23840
山 西 Shanxi 192298 191932 2805456 14617 22380 22211 408722 18402
内蒙古 Inner Mongolia 144706 146665 2125922 14495 22817 22380 379182 16943
辽 宁 Liaoning 281125 290105 4423698 15249 27546 27607 905826 32811
吉 林 Jilin 215550 218630 2392299 10942 19482 19034 394422 20722
黑龙江 Heilongjiang 287137 290975 3858247 13260 28594 29398 774838 26357
上 海 Shanghai 145455 148728 4172707 28056 15176 15132 957078 63249
江 苏 Jiangsu 219458 221208 4112946 18593 24485 24353 654293 26867
浙 江 Zhejiang 112873 112620 2756510 24476 20980 21011 882836 42018
安 徽 Anhui 120169 122417 1329752 10862 19377 19128 367508 19213
福 建 Fujian 106652 107363 1957567 18233 19321 18798 573200 30493
江 西 Jiangxi 137094 138184 2041587 14774 17196 17519 250509 14299
山 东 Shandong 234450 234403 3862713 16479 44573 43638 1078595 24717
河 南 Henan 272284 270014 3667560 13583 30355 29772 496469 16676
湖 北 Hubei 247714 251165 3129919 12462 25574 25461 443513 17419
湖 南 Hunan 199283 202406 2700618 13343 28525 28218 595733 21112
广 东 Guangdong 268976 269273 6944167 25789 64810 66449 2546514 38323
广 西 Guangxi 122141 121345 1820109 14999 15808 15882 387170 24378
海 南 Hainan 25903 25779 402600 15617 3270 3296 97844 29686
重 庆 Chongqing 112729 114390 1558007 13620 14441 14117 344766 24422四 川 Sichuan 159875 162279 2335734 14393 33621 33446 789553 23607
贵 州 Guizhou 85080 85440 1137999 13319 9495 9373 172100 18361
云 南 Yunnan 118007 120811 1753275 14513 20008 19815 382240 19290
西 藏 Tibet 7128 7101 164504 23166 2164 2129 96754 45446
陕 西 Shaanxi 184844 185246 2750278 14847 14656 14673 267769 18249
甘 肃 Gansu 113004 112035 1723193 15381 15215 15117 203471 13460
青 海 Qinghai 26459 25870 494522 19116 5867 6590 164667 24987
宁 夏 Ningxia 28187 27433 434590 15842 5214 4992 139201 27885
新 疆 Xinjiang 90530 90689 1731091 19088 10246 10042 257425 25635
4-4 6 continued
批发和零售业 住宿和餐饮业
Wholesale and Retail Trade Accommodation and Restaurants
地 区 Region 年末人数 平均人数 工资总额 平均工资 年末人数 平均人数 工资总额 平均工资
(人) (人) (千元) (元) (人) (人) (千元) (元)
Year-end Average Total Average Year-end Average Total Average
Figures Figures Wages Wage Figures Figures Wages Wage
(1 000 (1 000
(person) (person) yuan) (yuan) (person) (person) yuan) (yuan)

8/2/2019 China Labour Statistical Yearbook - 2004
http://slidepdf.com/reader/full/china-labour-statistical-yearbook-2004 306/464
National 2863219 2946504 32600529 11064 692068 689122 7252814 10525
北 京 Beijing 90108 94507 2974454 31473 57432 58289 990101 16986
天 津 Tianjin 31694 32730 595016 18180 8554 8832 107550 12177
河 北 Hebei 196737 198663 1488018 7490 34456 35605 277075 7782
山 西 Shanxi 140114 139531 949894 6808 24006 23814 166277 6982
内蒙古 Inner Mongolia 46836 48262 416522 8630 14065 13955 104363 7479
辽 宁 Liaoning 78054 87044 938426 10781 19899 20907 192926 9228
吉 林 Jilin 91731 91668 628650 6858 15146 15060 123508 8201
黑龙江 Heilongjiang 155780 160507 1309103 8156 30241 19669 135934 6911
上 海 Shanghai 58424 61920 1708334 27589 24906 25745 569065 22104
江 苏 Jiangsu 113451 118672 1431318 12061 35442 36500 414587 11359
浙 江 Zhejiang 46074 46522 1383765 29744 25262 25334 351973 13893
安 徽 Anhui 116444 130299 850932 6531 16584 17077 130856 7663
福 建 Fujian 58586 60600 944617 15588 15831 16322 173486 10629
江 西 Jiangxi 89791 93134 771045 8279 15002 15362 124998 8137
山 东 Shandong 206652 211162 1805614 8551 54680 55472 508672 9170
河 南 Henan 316391 311284 2381963 7652 49760 49137 388400 7904湖 北 Hubei 132754 132499 928683 7009 18225 18439 134308 7284
湖 南 Hunan 107985 114117 1245164 10911 29117 29229 272419 9320
广 东 Guangdong 174058 180657 3382721 18725 52090 52652 753753 14316
广 西 Guangxi 79222 80673 743578 9217 25837 26134 205912 7879
海 南 Hainan 17174 17665 163156 9236 9229 9372 72563 7743
重 庆 Chongqing 46424 48338 581925 12039 10368 10234 93492 9135
四 川 Sichuan 106227 110900 1277651 11521 17531 17353 176423 10167
贵 州 Guizhou 68565 72018 686146 9527 10630 10526 89304 8484
云 南 Yunnan 68213 74556 958314 12854 17502 17830 154881 8687
西 藏 Tibet 4480 4491 67580 15048 2628 2659 36642 13780
陕 西 Shaanxi 115638 116245 907885 7810 23416 23451 177711 7578
甘 肃 Gansu 54168 54968 430372 7830 12888 12614 98337 7796
青 海 Qinghai 11116 11403 129210 11331 3591 3660 47789 13057
宁 夏 Ningxia 13482 14122 139604 9886 3097 3175 26275 8276
新 疆 Xinjiang 26846 27347 380869 13927 14653 14714 153234 10414
4-4 7 continued
金融业 房地产业
Finance Real Estate
地 区 Region 年末人数 平均人数 工资总额 平均工资 年末人数 平均人数 工资总额 平均工资
(人) (人) (千元) (元) (人) (人) (千元) (元)
Year-end Average Total Average Year-end Average Total Average
Figures Figures Wages Wage Figures Figures Wages Wage
(1 000 (1 000
(person) (person) yuan) (yuan) (person) (person) yuan) (yuan)
National 1762513 1789956 41302738 23075 488438 488920 7853774 16064
北 京 Beijing 52572 51948 3110326 59874 36798 36606 982587 26842
天 津 Tianjin 21838 22037 579345 26290 4611 4602 91357 19852
河 北 Hebei 90840 92548 1524187 16469 17904 17987 203139 11294
山 西 Shanxi 56465 57426 915579 15944 9831 9724 95753 9847
内蒙古 Inner Mongolia 48395 49340 741384 15026 10837 10935 126054 11528
辽 宁 Liaoning 86477 89585 1906410 21280 34600 35110 449700 12808
吉 林 Jilin 52645 52899 946331 17889 16647 16497 186618 11312
黑龙江 Heilongjiang 62176 63286 1231337 19457 25722 25329 292202 11536
上 海 Shanghai 43142 43173 1913745 44327 19629 20358 636359 31258
江 苏 Jiangsu 100433 101459 2414131 23794 28266 29044 571494 19677
浙 江 Zhejiang 83810 84126 2627564 31234 16831 16538 444969 26906
安 徽 Anhui 54321 55340 868697 15697 14802 14620 170089 11634

8/2/2019 China Labour Statistical Yearbook - 2004
http://slidepdf.com/reader/full/china-labour-statistical-yearbook-2004 307/464
福 建 Fujian 58342 59525 1715920 28827 11145 11132 198916 17869
江 西 Jiangxi 45979 48473 778909 16069 14252 14550 147416 10132
山 东 Shandong 112696 114411 2480807 21683 32634 32235 463686 14385
河 南 Henan 95390 93883 1756402 18708 22039 21677 237454 10954
湖 北 Hubei 77614 79227 1147415 14483 20199 20206 226516 11210
湖 南 Hunan 69169 70986 1333459 18785 19960 19907 262565 13190
广 东 Guangdong 149957 153037 5410394 35354 49865 49655 1008981 20320
广 西 Guangxi 48865 49735 938258 18865 11803 11629 151121 12995
海 南 Hainan 13844 14542 323922 22275 4667 4803 55717 11600
重 庆 Chongqing 29041 29322 628278 21427 9333 9402 119464 12706
四 川 Sichuan 77906 80050 1841922 23010 13815 13842 207823 15014
贵 州 Guizhou 28113 29069 498178 17138 5515 5550 62528 11266
云 南 Yunnan 45932 46406 733458 15805 5500 5729 71591 12496
西 藏 Tibet 5480 5519 181291 32849 225 226 4955 21925
陕 西 Shaanxi 58148 59115 1000967 16933 9492 9292 101120 10882
甘 肃 Gansu 35466 35541 508580 14310 9453 9343 105945 11340
青 海 Qinghai 10053 10046 212570 21160 1140 1421 22651 15940
宁 夏 Ningxia 12532 12695 253045 19933 1747 1666 15449 9273新 疆 Xinjiang 34872 35207 779927 22153 9176 9305 139555 14998
4-4 8 continued
租赁和商务服务业 科学研究、技术服务和地质勘查业
Scientific Research,Technical Service
Tenancy and Business Services and Geologic Perambulation
地 区 Region 年末人数 平均人数 工资总额 平均工资 年末人数 平均人数 工资总额 平均工资
(人) (人) (千元) (元) (人) (人) (千元) (元)
Year-end Average Total Average Year-end Average Total Average
Figures Figures Wages Wage Figures Figures Wages Wage
(1 000 (1 000
(person) (person) yuan) (yuan) (person) (person) yuan) (yuan)
National 986586 978746 15051574 15378 1767493 1783420 35624631 19975
北 京 Beijing 192070 190846 3864392 20249 165748 166139 6211456 37387
天 津 Tianjin 24404 23311 263451 11302 36401 36545 899634 24617
河 北 Hebei 21017 20463 207535 10142 69909 70072 1180773 16851
山 西 Shanxi 27397 27115 241903 8921 51999 51185 677180 13230
内蒙古 Inner Mongolia 24802 24461 340084 13903 37408 37656 537241 14267
辽 宁 Liaoning 45722 46972 560613 11935 78349 79521 1409550 17726
吉 林 Jilin 20056 19985 246823 12350 54569 54462 771375 14164
黑龙江 Heilongjiang 23644 23044 214893 9325 78745 92184 1316141 14277
上 海 Shanghai 46192 44734 907545 20288 79074 79657 2386738 29963
江 苏 Jiangsu 46137 47144 786297 16679 67120 67450 1563678 23183
浙 江 Zhejiang 48198 47379 1019561 21519 50911 50063 1493758 29838
安 徽 Anhui 15596 15419 173485 11251 47832 48122 648659 13479
福 建 Fujian 24295 24104 352654 14631 32325 32355 652545 20168
江 西 Jiangxi 12688 12673 148678 11732 48658 48594 622775 12816
山 东 Shandong 40769 40296 573260 14226 66872 67034 1164208 17367
河 南 Henan 50110 49021 532142 10855 97258 96109 1427991 14858
湖 北 Hubei 41290 40934 424699 10375 88758 88786 1319784 14865
湖 南 Hunan 31858 31721 423484 13350 59099 59752 899011 15046
广 东 Guangdong 90943 90159 1795371 19913 75369 74957 2470471 32959
广 西 Guangxi 29576 30193 339712 11251 40429 40449 602151 14887
海 南 Hainan 6440 6458 75499 11691 12590 12586 147555 11724
重 庆 Chongqing 7301 7658 90080 11763 25503 26081 502140 19253
四 川 Sichuan 20715 20736 292364 14099 104518 104346 2087927 20010
贵 州 Guizhou 23226 22528 299169 13280 25254 25230 360280 14280
云 南 Yunnan 11274 11316 161043 14231 45497 45518 653411 14355
西 藏 Tibet 421 422 6124 14512 4838 4925 155759 31626

8/2/2019 China Labour Statistical Yearbook - 2004
http://slidepdf.com/reader/full/china-labour-statistical-yearbook-2004 308/464
陕 西 Shaanxi 17373 17368 187072 10771 110907 111097 1636847 14733
甘 肃 Gansu 12095 11966 131255 10969 45923 45682 664348 14543
青 海 Qinghai 2148 2021 31402 15538 17050 17790 391951 22032
宁 夏 Ningxia 3757 3784 46659 12331 11065 11212 157248 14025
新 疆 Xinjiang 25072 24515 314325 12822 37515 37861 612046 16166
4-4 9 continued
水利、环境和公共设施管理业 居民服务和其他服务业Management of Water Conservancy,
Environment and Public Establishment Resident Services and Other Services
地 区 Region 年末人数 平均人数 工资总额 平均工资 年末人数 平均人数 工资总额 平均工资
(人) (人) (千元) (元) (人) (人) (千元) (元)
Year-end Average Total Average Year-end Average Total Average
Figures Figures Wages Wage Figures Figures Wages Wage
(1 000 (1 000
(person) (person) yuan) (yuan) (person) (person) yuan) (yuan)
National 1479316 1475275 17857261 12104 198720 198782 2996698 15075
北 京 Beijing 45808 47301 1095628 23163 14453 14556 357500 24560
天 津 Tianjin 28409 29139 499611 17146 9378 9611 169632 17650
河 北 Hebei 74693 75265 758707 10080 22186 22135 348797 15758
山 西 Shanxi 45094 44803 366122 8172 8551 8454 82692 9781
内蒙古 Inner Mongolia 48951 46447 484170 10424 5117 4886 42814 8763
辽 宁 Liaoning 96186 97112 1037396 10682 9393 9160 109166 11918
吉 林 Jilin 57494 58869 514401 8738 8081 8080 87293 10804
黑龙江 Heilongjiang 64661 64145 635836 9912 10410 10207 99519 9750
上 海 Shanghai 40835 41007 1041353 25395 9273 9222 205258 22257
江 苏 Jiangsu 80634 80908 1273155 15736 6712 6804 115678 17001
浙 江 Zhejiang 33835 33571 697194 20768 4564 4530 109243 24115
安 徽 Anhui 54217 54031 503699 9322 3675 3765 40575 10777
福 建 Fujian 27137 27153 353247 13010 7775 7657 127695 16677
江 西 Jiangxi 34594 34384 307273 8937 7378 7280 62559 8593
山 东 Shandong 96923 95054 1127882 11866 7402 7538 101839 13510
河 南 Henan 98487 97011 967087 9969 9222 8956 96256 10748
湖 北 Hubei 75438 75256 686382 9121 4758 4796 57933 12079
湖 南 Hunan 59195 58682 582476 9926 4644 4664 57520 12333
广 东 Guangdong 89773 89523 1486587 16606 8898 8852 231207 26119
广 西 Guangxi 40518 40599 417700 10288 1852 1833 33872 18479
海 南 Hainan 14035 14076 135898 9655 192 189 3474 18381
重 庆 Chongqing 20234 19493 186653 9575 2513 1575 22133 14053
四 川 Sichuan 60597 60267 600464 9963 7104 7236 105776 14618
贵 州 Guizhou 16325 16102 142058 8822 1013 1006 10742 10678
云 南 Yunnan 33249 32781 355750 10852 1778 1755 21691 12360
西 藏 Tibet 1167 1160 18622 16053 29 29 981 33828
陕 西 Shaanxi 46059 45771 436543 9538 11402 11281 114558 10155
甘 肃 Gansu 33775 33740 394509 11693 2643 2603 31096 11946
青 海 Qinghai 6413 6279 75519 12027 1334 1324 24260 18323
宁 夏 Ningxia 15423 15338 186453 12156 245 239 3239 13552
新 疆 Xinjiang 39157 40008 488886 12220 6745 8559 121700 14219

8/2/2019 China Labour Statistical Yearbook - 2004
http://slidepdf.com/reader/full/china-labour-statistical-yearbook-2004 309/464
4-4 10 continued
教育 卫生、社会保障和社会福利业
Sanitation,Social Security
Education and Social Welfare
地 区 Region 年末人数 平均人数 工资总额 平均工资 年末人数 平均人数 工资总额 平均工资
(人) (人) (千元) (元) (人) (人) (千元) (元)
Year-end Average Total Average Year-end Average Total Average
Figures Figures Wages Wage Figures Figures Wages Wage
(1 000 (1 000
(person) (person) yuan) (yuan) (person) (person) yuan) (yuan)
National 13400780 13329277 194636796 14602 4190646 4168301 70534750 16922
北 京 Beijing 288994 288618 8353083 28942 117995 116456 4043828 34724
天 津 Tianjin 158597 158769 3074312 19363 63182 63192 1312387 20768
河 北 Hebei 803970 799546 8875440 11101 200671 200230 2408421 12028
山 西 Shanxi 431402 428506 4996227 11660 112058 111739 1309563 11720
内蒙古 Inner Mongolia 313794 311707 4186182 13430 88342 88460 1255331 14191
辽 宁 Liaoning 507538 505007 6926656 13716 196049 196899 2880587 14630
吉 林 Jilin 355068 354305 4588967 12952 126688 126079 1516040 12025
黑龙江 Heilongjiang 437057 434524 5995196 13797 160164 160352 2124873 13251
上 海 Shanghai 226318 227551 6090176 26764 109581 109520 3130289 28582
江 苏 Jiangsu 771662 770439 12821374 16642 198515 197644 4102475 20757
浙 江 Zhejiang 465626 460097 11876760 25814 180302 176676 5530852 31305
安 徽 Anhui 545866 544747 6227487 11432 117150 116185 1554755 13382
福 建 Fujian 414797 413231 6200779 15006 87665 86941 1522448 17511
江 西 Jiangxi 420769 418198 4594119 10986 118405 118331 1518041 12829
山 东 Shandong 1021289 1013845 13552621 13368 289221 287329 4588217 15969
河 南 Henan 529162 522697 6507470 12450 295750 292711 3407340 11641
湖 北 Hubei 596496 594454 7234338 12170 231636 231137 2846652 12316
湖 南 Hunan 639308 639412 8513326 13314 197898 196703 3145733 15992
广 东 Guangdong 885165 876685 17955735 20481 325217 322569 8215561 25469
广 西 Guangxi 500788 497021 5641213 11350 147276 145808 2008328 13774
海 南 Hainan 79373 79092 1059348 13394 23926 23771 381598 16053
重 庆 Chongqing 294662 292104 3762143 12879 67302 67030 961496 14344
四 川 Sichuan 754307 750469 9612877 12809 193963 192970 3174626 16451
贵 州 Guizhou 339849 337553 3565697 10563 80206 79788 959720 12028
云 南 Yunnan 446517 445300 5953770 13370 118404 117931 1784445 15131
西 藏 Tibet 24721 24465 688393 28138 9329 9293 277831 29897
陕 西 Shaanxi 451432 448595 5627055 12544 116215 116085 1330507 11461
甘 肃 Gansu 260245 258095 3492784 13533 70065 69655 981630 14093
青 海 Qinghai 59463 59060 974143 16494 20835 20761 357708 17230
宁 夏 Ningxia 73700 73556 1112721 15128 24595 24466 347325 14196
新 疆 Xinjiang 302845 301629 4576404 15172 102041 101590 1556143 15318
4-4 11 continued
文化体育和娱乐业 公共管理和社会组织
Public Management and
Culture, Sports and Entertainment Social Organization
地 区 Region 年末人数 平均人数 工资总额 平均工资 年末人数 平均人数 工资总额 平均工资
(人) (人) (千元) (元) (人) (人) (千元) (元)
Year-end Average Total Average Year-end Average Total Average
Figures Figures Wages Wage Figures Figures Wages Wage
(1 000 (1 000
(person) (person) yuan) (yuan) (person) (person) yuan) (yuan)
National 1123883 1122345 19690699 17544 11411065 11345453 176496844 15557
北 京 Beijing 88046 87575 3290076 37569 254966 252245 7642354 30297
天 津 Tianjin 18694 18850 380537 20188 117965 114864 2468453 21490
河 北 Hebei 44959 45068 566899 12579 657081 654786 7830346 11959
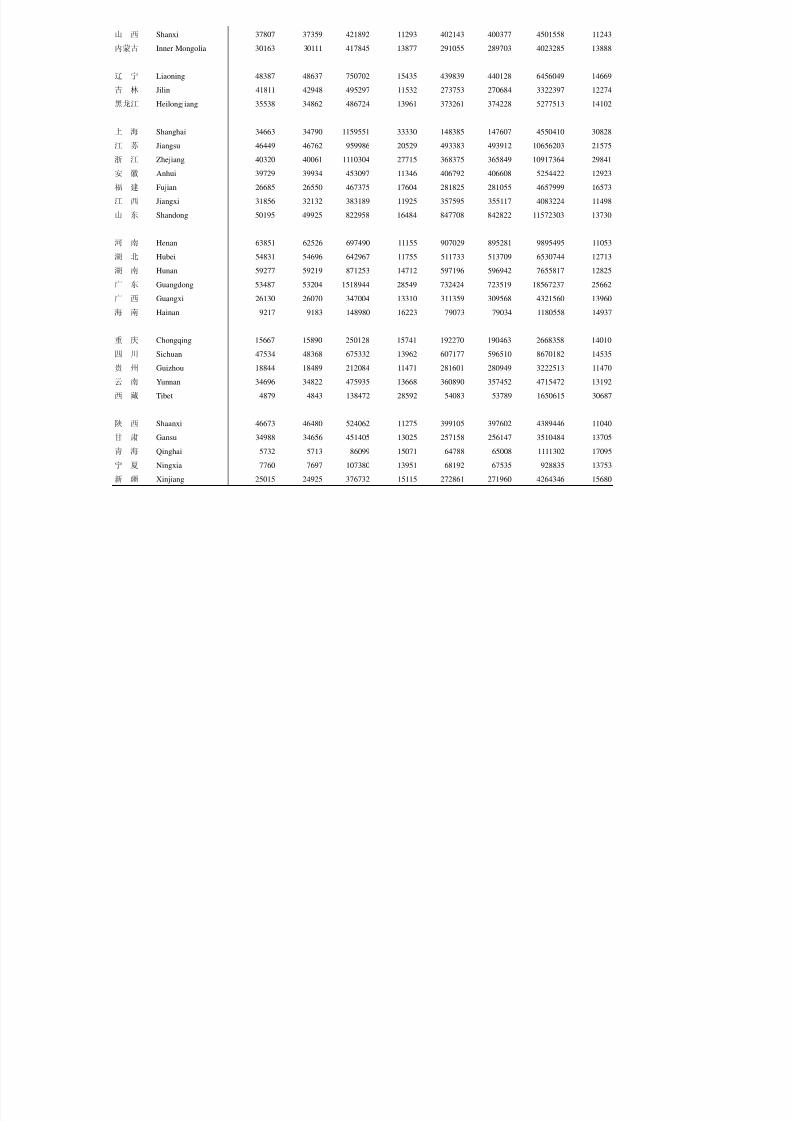
8/2/2019 China Labour Statistical Yearbook - 2004
http://slidepdf.com/reader/full/china-labour-statistical-yearbook-2004 310/464
山 西 Shanxi 37807 37359 421892 11293 402143 400377 4501558 11243
内蒙古 Inner Mongolia 30163 30111 417845 13877 291055 289703 4023285 13888
辽 宁 Liaoning 48387 48637 750702 15435 439839 440128 6456049 14669
吉 林 Jilin 41811 42948 495297 11532 273753 270684 3322397 12274
黑龙江 Heilongjiang 35538 34862 486724 13961 373261 374228 5277513 14102
上 海 Shanghai 34663 34790 1159551 33330 148385 147607 4550410 30828
江 苏 Jiangsu 46449 46762 959986 20529 493383 493912 10656203 21575
浙 江 Zhejiang 40320 40061 1110304 27715 368375 365849 10917364 29841
安 徽 Anhui 39729 39934 453097 11346 406792 406608 5254422 12923
福 建 Fujian 26685 26550 467375 17604 281825 281055 4657999 16573
江 西 Jiangxi 31856 32132 383189 11925 357595 355117 4083224 11498
山 东 Shandong 50195 49925 822958 16484 847708 842822 11572303 13730
河 南 Henan 63851 62526 697490 11155 907029 895281 9895495 11053
湖 北 Hubei 54831 54696 642967 11755 511733 513709 6530744 12713
湖 南 Hunan 59277 59219 871253 14712 597196 596942 7655817 12825
广 东 Guangdong 53487 53204 1518944 28549 732424 723519 18567237 25662
广 西 Guangxi 26130 26070 347004 13310 311359 309568 4321560 13960
海 南 Hainan 9217 9183 148980 16223 79073 79034 1180558 14937
重 庆 Chongqing 15667 15890 250128 15741 192270 190463 2668358 14010
四 川 Sichuan 47534 48368 675332 13962 607177 596510 8670182 14535
贵 州 Guizhou 18844 18489 212084 11471 281601 280949 3222513 11470
云 南 Yunnan 34696 34822 475935 13668 360890 357452 4715472 13192
西 藏 Tibet 4879 4843 138472 28592 54083 53789 1650615 30687
陕 西 Shaanxi 46673 46480 524062 11275 399105 397602 4389446 11040
甘 肃 Gansu 34988 34656 451405 13025 257158 256147 3510484 13705
青 海 Qinghai 5732 5713 86099 15071 64788 65008 1111302 17095
宁 夏 Ningxia 7760 7697 107380 13951 68192 67535 928835 13753
新 疆 Xinjiang 25015 24925 376732 15115 272861 271960 4264346 15680

8/2/2019 China Labour Statistical Yearbook - 2004
http://slidepdf.com/reader/full/china-labour-statistical-yearbook-2004 311/464
4-5
NUMBER OF TECHNICAL PERSONNEL BY SECTOR AND REGION
(State-owned Units, 2003)
单位:人 (person)
合 计 农、林、 采矿业 制造业 电力、燃气 建筑业
牧、渔业 及水的生产
和供应业
Total Agriculture, Mining Manufac- Production Construc-
地 区 Region Forestry, turing and Distri- tion
Farming of bution of
Animals Electricity,
and Gas and
Fishery Water
National 24093360 727175 369759 1538716 515413 693551
北 京 Beijing 836098 3382 265 56128 4020 44938天 津 Tianjin 331077 2906 1938 25705 4084 12688
河 北 Hebei 1381403 15837 35983 96620 29801 38518
山 西 Shanxi 766929 11550 51806 59004 23931 34942
内蒙古 Inner Mongolia 592393 58981 13678 9347 18144 8367
辽 宁 Liaoning 1055837 25401 21363 82561 25485 28275
吉 林 Jilin 740243 47824 10283 52020 16254 20770
黑龙江 Heilongjiang 958337 110172 4307 68316 28482 23535
上 海 Shanghai 508335 2309 11 60260 7365 19866
江 苏 Jiangsu 1173524 18634 16425 62220 20262 27425
浙 江 Zhejiang 776479 10042 765 12984 20492 9611
安 徽 Anhui 828106 16563 7247 38575 16571 28149
福 建 Fujian 638436 12172 2441 12956 14491 17218
江 西 Jiangxi 726628 20433 10641 44184 16282 16148
山 东 Shandong 1855236 23980 67744 133473 46638 37417
河 南 Henan 1124698 11262 16015 81624 32455 39151
湖 北 Hubei 1093488 30361 4556 87226 20514 38539
湖 南 Hunan 1122102 15253 13097 82029 21306 29604
广 东 Guangdong 1417754 15784 4248 35558 27342 35039
广 西 Guangxi 794612 24711 5300 37206 17407 13196
海 南 Hainan 151245 25416 1921 3393 3041 3912
重 庆 Chongqing 450328 7061 6831 47363 8268 12536
四 川 Sichuan 1241072 31915 17066 94367 19908 46710
贵 州 Guizhou 544233 15240 10863 35031 12845 16016
云 南 Yunnan 743578 43222 5952 34539 10934 16850
西 藏 Tibet 39339 673 97 427 1034 508
陕 西 Shaanxi 859420 18675 19750 106113 17098 33685
甘 肃 Gansu 482662 15924 9436 56843 16035 15035
青 海 Qinghai 124995 6654 1817 5508 3947 6064
宁 夏 Ningxia 144134 7441 381 5865 5805 4426新 疆 Xinjiang 590639 77397 7532 11271 5172 14413

8/2/2019 China Labour Statistical Yearbook - 2004
http://slidepdf.com/reader/full/china-labour-statistical-yearbook-2004 312/464
4-5 1 continued
单位:人 (person)
交通运输、仓储 信息传输、 批发和 住宿和 金融业 房地产业 租赁和商务
和邮政业 计算机服务 零售业 餐饮业 服务业
和软件业
Traffic, Information Wholesale Accommo- Finance Real Tenancy
地 区 Region Transport, Transfer, and dation Estate and
Storage Computer Retail and Business
and post and Trade Restaurants Services
Software
National 728296 238880 549954 73840 1086305 132981 216064
北 京 Beijing 17341 16290 29127 8623 43251 10198 41661
天 津 Tianjin 19635 4109 8241 1336 17777 1633 2828
河 北 Hebei 34988 11067 35665 4017 57860 4874 5221
山 西 Shanxi 23516 7920 25447 2144 32514 2661 7149
内蒙古 Inner Mongolia 18793 8178 9629 1444 27675 2680 5950
辽 宁 Liaoning 43552 9510 20609 2635 59132 9987 10844
吉 林 Jilin 25404 7880 18364 1476 34955 4859 6425
黑龙江 Heilongjiang 35209 10866 27344 1944 40571 5325 6964
上 海 Shanghai 26862 7591 12268 1865 30189 5755 5122
江 苏 Jiangsu 39985 8640 16097 2757 59681 8643 13366
浙 江 Zhejiang 19668 8136 11991 2719 54181 6312 12211
安 徽 Anhui 16264 6628 15503 1621 32011 4065 3440
福 建 Fujian 16242 6751 14092 1235 36550 3513 6348
江 西 Jiangxi 23530 5585 17876 1776 29730 3241 2937
山 东 Shandong 45122 14004 50736 6139 67808 13398 10887
河 南 Henan 26995 8088 41148 5571 45596 4173 7383
湖 北 Hubei 61666 11517 19377 2379 43843 5316 7170
湖 南 Hunan 31480 9841 23761 2820 39157 5425 7760
广 东 Guangdong 43655 22489 38793 4638 92056 10957 16830
广 西 Guangxi 19012 7228 17813 2883 29764 4086 5892
海 南 Hainan 3713 1300 2255 852 8500 754 1363
重 庆 Chongqing 15928 2236 9211 1566 15837 2135 1622
四 川 Sichuan 21985 11131 18498 2185 46649 3023 4759
贵 州 Guizhou 10211 3400 10880 875 18421 1411 4727
云 南 Yunnan 20502 8422 15813 1723 32162 2104 3083
西 藏 Tibet 483 1133 314 182 4210 105 80
陕 西 Shaanxi 28552 4697 20045 2160 30656 2130 4419
甘 肃 Gansu 13594 5529 6401 1266 18589 1119 2291
青 海 Qinghai 5331 2092 1838 565 6521 337 576
宁 夏 Ningxia 3345 2188 2705 261 8755 460 1160
新 疆 Xinjiang 15733 4434 8113 2183 21704 2302 5596
4-5 2 continued
单位:人 (person)
科学研究、 水利、环境 居民服务和 教育 卫生、社会 文化体育 公共管理和
技术服务和 和公共设施 其他服务业 保障和社会 和娱乐业 社会组织
地质勘查业 管理业 福利业
Scientific Management Resident Education Sanitation, Culture, Public
地 区 Region Research, of Water Services Social Sports Management
Technical Conservancy, and Security and and
Service Environment Other and Entertain- Social
and Geologic and Public Services Social ment Organization
Perambulation Establishment Welfare
National 979984 246344 39020 11058679 3103983 576874 1217542
北 京 Beijing 113047 6165 3469 219708 90759 53178 74548
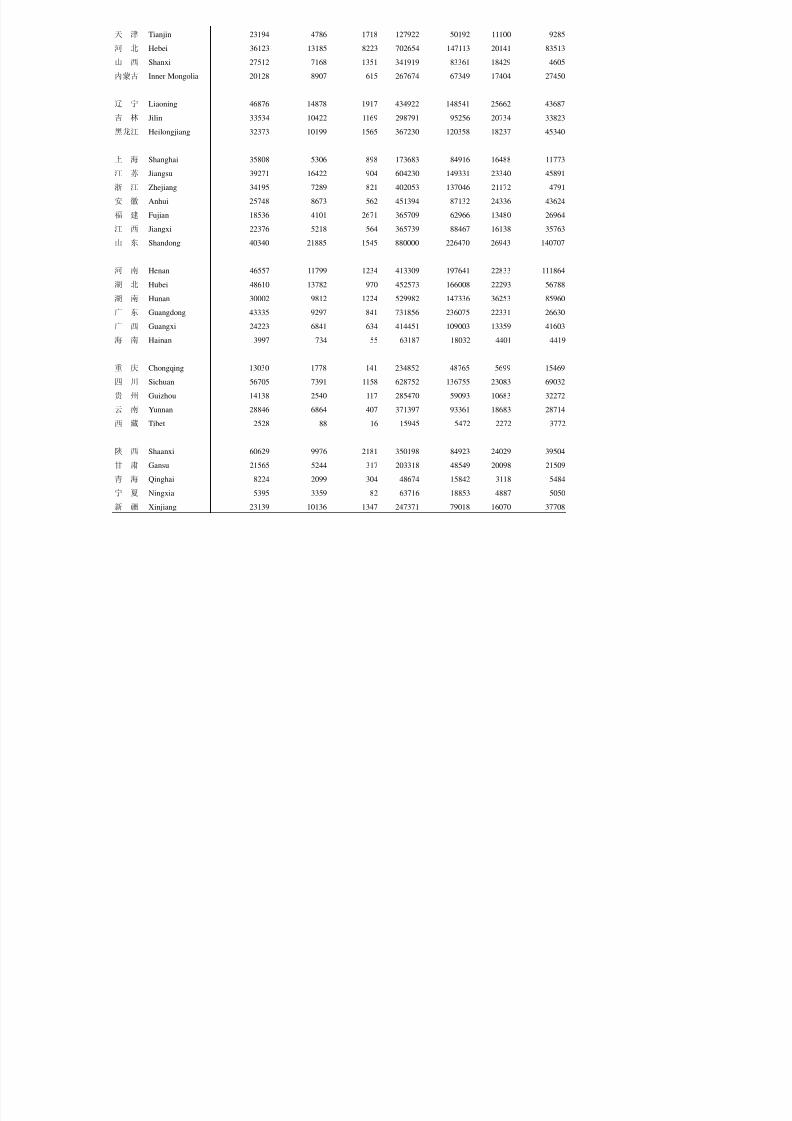
8/2/2019 China Labour Statistical Yearbook - 2004
http://slidepdf.com/reader/full/china-labour-statistical-yearbook-2004 313/464
天 津 Tianjin 23194 4786 1718 127922 50192 11100 9285
河 北 Hebei 36123 13185 8223 702654 147113 20141 83513
山 西 Shanxi 27512 7168 1351 341919 83361 18429 4605
内蒙古 Inner Mongolia 20128 8907 615 267674 67349 17404 27450
辽 宁 Liaoning 46876 14878 1917 434922 148541 25662 43687
吉 林 Jilin 33534 10422 1169 298791 95256 20734 33823
黑龙江 Heilongjiang 32373 10199 1565 367230 120358 18237 45340
上 海 Shanghai 35808 5306 898 173683 84916 16488 11773
江 苏 Jiangsu 39271 16422 904 604230 149331 23340 45891
浙 江 Zhejiang 34195 7289 821 402053 137046 21172 4791
安 徽 Anhui 25748 8673 562 451394 87132 24336 43624
福 建 Fujian 18536 4101 2671 365709 62966 13480 26964
江 西 Jiangxi 22376 5218 564 365739 88467 16138 35763
山 东 Shandong 40340 21885 1545 880000 226470 26943 140707
河 南 Henan 46557 11799 1234 413309 197641 22833 111864
湖 北 Hubei 48610 13782 970 452573 166008 22293 56788
湖 南 Hunan 30002 9812 1224 529982 147336 36253 85960
广 东 Guangdong 43335 9297 841 731856 236075 22331 26630广 西 Guangxi 24223 6841 634 414451 109003 13359 41603
海 南 Hainan 3997 734 55 63187 18032 4401 4419
重 庆 Chongqing 13030 1778 141 234852 48765 5699 15469
四 川 Sichuan 56705 7391 1158 628752 136755 23083 69032
贵 州 Guizhou 14138 2540 117 285470 59093 10683 32272
云 南 Yunnan 28846 6864 407 371397 93361 18683 28714
西 藏 Tibet 2528 88 16 15945 5472 2272 3772
陕 西 Shaanxi 60629 9976 2181 350198 84923 24029 39504
甘 肃 Gansu 21565 5244 317 203318 48549 20098 21509
青 海 Qinghai 8224 2099 304 48674 15842 3118 5484
宁 夏 Ningxia 5395 3359 82 63716 18853 4887 5050
新 疆 Xinjiang 23139 10136 1347 247371 79018 16070 37708

8/2/2019 China Labour Statistical Yearbook - 2004
http://slidepdf.com/reader/full/china-labour-statistical-yearbook-2004 314/464
4-6
NUMBER OF FEMALE TECHNICAL PERSONNEL BY SECTOR AND REGION
(State-owned Units, 2003)
单位:人 (person)
合 计 农、林、 采矿业 制造业 电力、燃气 建筑业
牧、渔业 及水的生产
和供应业
Total Agriculture, Mining Manufac- Production Construc-
地 区 Region Forestry, turing and Distri- tion
Farming of bution of
Animals Electricity,
and Gas and
Fishery Water
National 10805783 233111 119174 534574 161834 188142
北 京 Beijing 422700 1310 72 21153 1732 11968天 津 Tianjin 175927 983 586 9924 1494 3570
河 北 Hebei 716087 5691 13367 37725 10242 11275
山 西 Shanxi 390806 4214 21136 23791 9202 10144
内蒙古 Inner Mongolia 283829 21665 5460 3422 6388 2189
辽 宁 Liaoning 540304 8281 7366 29578 8811 8618
吉 林 Jilin 368010 15773 4216 20046 5279 6467
黑龙江 Heilongjiang 451175 37004 1127 27690 9234 7107
上 海 Shanghai 247461 738 2 17404 2253 4184
江 苏 Jiangsu 479235 4290 5142 19279 5265 5393
浙 江 Zhejiang 385440 2476 213 4022 5889 2342
安 徽 Anhui 293765 4080 3618 10994 4529 6801
福 建 Fujian 273135 3243 624 3736 3969 3518
江 西 Jiangxi 274846 5817 2996 14711 5134 4667
山 东 Shandong 756350 6994 15836 43718 13610 8036
河 南 Henan 504336 3400 4662 27855 10175 10508
湖 北 Hubei 460267 9822 1344 26822 7052 12709
湖 南 Hunan 470839 3967 4800 27156 6474 8316
广 东 Guangdong 683083 4460 1505 11796 7375 8028
广 西 Guangxi 343307 6729 1695 12602 5243 3454
海 南 Hainan 55755 9295 718 975 422 592
重 庆 Chongqing 185183 1836 1565 17193 2622 3108
四 川 Sichuan 524477 8772 6337 34270 6831 14521
贵 州 Guizhou 212119 3874 4263 12178 3907 4639
云 南 Yunnan 321923 14168 1809 11821 3270 5156
西 藏 Tibet 16304 207 38 117 276 136
陕 西 Shaanxi 364939 6246 5179 36716 4196 8239
甘 肃 Gansu 179915 4561 1264 19457 5895 4596
青 海 Qinghai 55431 2319 622 1967 1228 1877
宁 夏 Ningxia 61867 2088 35 1917 1987 1152新 疆 Xinjiang 306968 28808 1577 4539 1850 4832

8/2/2019 China Labour Statistical Yearbook - 2004
http://slidepdf.com/reader/full/china-labour-statistical-yearbook-2004 315/464
4 - 6 1 continued
单位:人 (person)
交通运输、仓储 信息传输、 批发和 住宿和 金融业 房地产业 租赁和商务
和邮政业 计算机服务 零售业 餐饮业 服务业
和软件业
Traffic, Information Wholesale Accommo- Finance Real Tenancy
地 区 Region Transport, Transfer, and dation Estate and
Storage Computer Retail and Business
and post and Trade Restaurants Services
Software
National 231675 87699 224658 33049 485976 51183 84208
北 京 Beijing 7555 6715 12792 3790 23599 3849 19118
天 津 Tianjin 6846 1393 3546 665 9037 591 1215
河 北 Hebei 12408 4360 16209 2016 25080 2094 2077
山 西 Shanxi 8452 3311 11378 939 14545 1172 2762
内蒙古 Inner Mongolia 5815 3273 4470 608 12792 1253 2494
辽 宁 Liaoning 13967 3794 8977 1418 26953 4523 4695
吉 林 Jilin 8411 3803 7314 743 17116 2139 2383
黑龙江 Heilongjiang 11165 4231 11285 955 19273 2152 2889
上 海 Shanghai 4468 2654 4929 763 15807 1824 1830
江 苏 Jiangsu 10739 2514 5971 1153 24705 3150 2602
浙 江 Zhejiang 5488 3124 4620 1421 26708 2427 5228
安 徽 Anhui 4344 1979 5428 588 12115 1484 1310
福 建 Fujian 3879 2132 5596 630 14786 1141 2250
江 西 Jiangxi 7706 1740 7069 780 12597 1301 1013
山 东 Shandong 11628 4668 19868 2542 26214 4970 3636
河 南 Henan 8833 3031 16963 2563 18511 1502 2608
湖 北 Hubei 25296 4742 7617 1022 20211 2077 2856
湖 南 Hunan 11066 3231 9846 1339 15957 2046 2414
广 东 Guangdong 10882 7393 15644 2027 42930 3758 6260
广 西 Guangxi 5533 2245 6979 1385 13193 1560 2470
海 南 Hainan 1070 381 763 238 3440 240 580
重 庆 Chongqing 4659 663 3409 466 6955 740 555
四 川 Sichuan 7280 4046 6901 881 22173 1138 1616
贵 州 Guizhou 3322 1123 4246 409 8065 508 1724
云 南 Yunnan 7973 3167 5684 813 14030 965 1303西 藏 Tibet 140 515 104 62 1379 31 30
陕 西 Shaanxi 10766 1705 8810 982 13144 663 1638
甘 肃 Gansu 4038 2255 2508 585 7271 405 995
青 海 Qinghai 1902 781 700 110 3003 175 215
宁 夏 Ningxia 884 988 1208 127 3935 174 474
新 疆 Xinjiang 5160 1742 3824 1029 10452 1131 2968
4 - 6 2 continued
单位:人 (person
科学研究、 水利、环境 居民服务和 教育 卫生、社会 文化体育 公共管理和
技术服务和 和公共设施 其他服务业 保障和社会 和娱乐业 社会组织
地质勘查业 管理业 福利业
Scientific Management Resident Education Sanitation, Culture, Public
地 区 Region Research, of Water Services Social Sports Management
Technical Conservancy, and Security and and
Service Environment Other and Entertain- Social
and Geologic and Public Services Social ment Organization
Perambulation Establishment Welfare
National 331927 86944 18438 5265395 1969124 251686 446986

8/2/2019 China Labour Statistical Yearbook - 2004
http://slidepdf.com/reader/full/china-labour-statistical-yearbook-2004 316/464
北 京 Beijing 43673 2576 1452 138043 66550 25332 31421
天 津 Tianjin 9128 1994 891 77573 36834 5917 3740
河 北 Hebei 14237 5806 4038 412498 93663 10076 33225
山 西 Shanxi 10872 2869 715 199292 55496 8483 2033
内蒙古 Inner Mongolia 7923 3663 305 140009 43455 8262 10383
辽 宁 Liaoning 17100 6515 1025 255745 103675 11803 17460
吉 林 Jilin 12095 3993 580 173955 60899 9662 13136
黑龙江 Heilongjiang 10842 3885 680 196939 78690 8249 17778
上 海 Shanghai 11641 1929 368 103187 60320 6717 6443
江 苏 Jiangsu 11386 4774 401 259653 89606 9329 13883
浙 江 Zhejiang 9899 2220 382 209852 88170 9131 1828
安 徽 Anhui 7176 2525 198 153144 50475 9262 13715
福 建 Fujian 5139 1159 1779 167029 38871 5836 7818
江 西 Jiangxi 6686 1798 217 130707 49513 6436 13958
山 东 Shandong 12998 7217 615 377048 138641 10924 47187
河 南 Henan 15888 4142 458 200496 120692 9557 42492
湖 北 Hubei 15199 4783 413 188887 101203 8538 19674
湖 南 Hunan 9392 3017 359 224777 89730 15913 31039广 东 Guangdong 12874 2756 423 375748 150786 9326 9112
广 西 Guangxi 7800 2295 237 181651 69089 5577 13570
海 南 Hainan 1146 205 27 21983 10674 1603 1403
重 庆 Chongqing 3751 574 76 100987 28729 2262 5033
四 川 Sichuan 20157 2440 470 265698 84871 9916 26159
贵 州 Guizhou 4566 731 72 107578 36041 4499 10374
云 南 Yunnan 9518 2155 196 159670 62062 8153 10010
西 藏 Tibet 981 25 6600 3393 928 1342
陕 西 Shaanxi 18573 3457 974 167107 51565 10396 14583
甘 肃 Gansu 6925 1691 202 72983 28688 8114 7482
青 海 Qinghai 3042 686 109 22744 10292 1398 2261
宁 夏 Ningxia 1934 1011 31 27739 11948 2210 2025
新 疆 Xinjiang 9386 4053 745 146073 54503 7877 16419

8/2/2019 China Labour Statistical Yearbook - 2004
http://slidepdf.com/reader/full/china-labour-statistical-yearbook-2004 317/464
4-7
NOT-ON-POST STAFF AND WORKERS AND LIVING
SUBSIDIES BY SECTOR AND REGION
(State-owned Units, 2003)总 计 企 业 事 业 机 关
Agencies
Total Enterprises Institutions and Organizations
年末人数 平均生活费 年末人数 平均生活费 年末人数 平均生活费 年末人数 平均生活费
地 区 Region (人) (元) (人) (元) (人) (元) (人) (元)
Average Average Average Average
Year-end Living Year-end Living Year-end Living Year-end Living
Figures Subsidy Figures Subsidy Figures Subsidy Figures Subsidy
(person) (yuan) (person) (yuan) (person) (yuan) (person) (yuan)
National 10553332 3592 9316351 3130 842589 5659 394392 10332
北 京 Beijing 196574 7686 167454 6691 24502 13560 4618 16482
天 津 Tianjin 242314 2701 229853 2483 11606 7013 855 7831
河 北 Hebei 600716 4221 519542 3276 34354 7525 46820 12636
山 西 Shanxi 418912 2595 391024 2349 16703 4369 11185 8158
内蒙古 Inner Mongolia 132407 4454 102081 3908 21015 4391 9311 10928
辽 宁 Liaoning 642579 3172 560057 2887 68968 4295 13554 9706
吉 林 Jilin 664316 2283 593384 1852 53319 4307 17613 11061
黑龙江 Heilongjiang 913502 2065 834905 1538 45637 4756 32960 11166
上 海 Shanghai 464235 4728 439249 4286 21661 12855 3325 9830
江 苏 Jiangsu 407865 4985 365472 4555 31369 7241 11024 13435
浙 江 Zhejiang 86549 8577 58463 6201 19230 10043 8856 21239
安 徽 Anhui 277757 3102 249338 2855 22625 4816 5794 7010
福 建 Fujian 105959 3374 92608 3161 10622 4084 2729 8059
江 西 Jiangxi 531631 2053 464734 1841 55223 3096 11674 5595
山 东 Shandong 675936 5347 567763 4605 56921 8686 51252 9911
河 南 Henan 579859 2022 524623 1934 34179 2351 21057 4178
湖 北 Hubei 670034 3625 563210 3308 80455 4373 26369 8213
湖 南 Hunan 822009 2797 706083 2418 79903 4416 36023 6755
广 东 Guangdong 322583 5507 268878 4121 25028 6493 28677 16909
广 西 Guangxi 193095 3040 165508 2700 22142 4478 5445 7680
海 南 Hainan 98483 2257 93531 1927 3259 8124 1693 8966
重 庆 Chongqing 129950 4845 117816 4470 8897 8339 3237 11611
四 川 Sichuan 326368 4616 284878 4357 33344 5687 8146 9279
贵 州 Guizhou 155530 3653 139665 3444 6623 4654 9242 6101
云 南 Yunnan 144435 6901 127123 6694 11129 6001 6183 13097
西 藏 Tibet 2569 14393 1727 14334 307 14211 535 14707
陕 西 Shaanxi 433763 2900 398878 2669 24030 5113 10855 6721
甘 肃 Gansu 174206 4559 163184 4425 8782 6054 2240 8326
青 海 Qinghai 25257 5771 21764 5633 2710 6300 783 7581
宁 夏 Ningxia 20091 6163 18250 5714 908 8049 933 12909
新 疆 Xinjiang 93848 6461 85306 6286 7138 6870 1404 15485

8/2/2019 China Labour Statistical Yearbook - 2004
http://slidepdf.com/reader/full/china-labour-statistical-yearbook-2004 318/464
4-7 1 continued
农、林、牧、渔业 采矿业 制造业 电力、燃气及水的生产
Agriculture,Forestry, 和供应业 Production
Farming of Animals Mining Manufacturing & Distribution of
and Fishing Electricity,Gas & Water
地 区 Region 年末人数 平均生活费 年末人数 平均生活费 年末人数 平均生活费 年末人数 平均生活费
(人) (元) (人) (元) (人) (元) (人) (元)
Average Average Average Average
Year-end Living Year-end Living Year-end Living Year-end Living
Figures Subsidy Figures Subsidy Figures Subsidy Figures Subsidy
(person) (yuan) (person) (yuan) (person) (yuan) (person) (yuan)
National 692715 1275 552862 4324 4084721 2806 180956 7805
北 京 Beijing 1269 6282 697 10705 66031 5633 1467 17946
天 津 Tianjin 1763 3322 172 5114 157656 1634 906 8364
河 北 Hebei 8288 2004 49279 4834 244665 2875 4974 7321
山 西 Shanxi 2869 1291 42424 2992 177188 2054 5277 4673
内蒙古 Inner Mongolia 27290 1211 19650 3427 8346 2875 4701 8782
辽 宁 Liaoning 39804 663 26630 3918 280787 2511 19381 6948
吉 林 Jilin 86201 1510 40183 1960 242386 1380 10181 7409
黑龙江 Heilongjiang 198555 621 24200 740 280850 1363 10455 4320
上 海 Shanghai 3479 3155 83 4178 286534 3782 502 9969
江 苏 Jiangsu 14348 2808 27408 4861 169848 4003 3536 11819
浙 江 Zhejiang 4716 3026 1731 2973 19999 4793 1710 13638
安 徽 Anhui 10686 1765 4923 6848 102820 2867 2804 7968
福 建 Fujian 11390 1840 3585 1678 31923 2958 2213 7248
江 西 Jiangxi 63562 1025 36544 2878 212595 1547 9969 5490
山 东 Shandong 8481 3595 77212 9256 236332 3720 14477 9577
河 南 Henan 10957 953 42788 3800 178939 1802 15309 6193
湖 北 Hubei 30961 1293 10490 2847 269095 3407 13158 7852
湖 南 Hunan 38861 1151 55182 1981 323414 2147 13976 6346
广 东 Guangdong 13429 2236 7364 4835 63279 3118 10002 11435
广 西 Guangxi 13157 1697 8850 2070 63006 2593 6171 7594
海 南 Hainan 38655 878 2202 853 15284 1271 3775 8267
重 庆 Chongqing 815 2934 3699 4683 64366 4110 2509 8891
四 川 Sichuan 6015 2681 14479 3474 139145 4412 8670 8817
贵 州 Guizhou 2133 1710 7949 3877 69939 3142 3389 10049
云 南 Yunnan 18955 3549 4335 5383 44864 6667 3604 12402
西 藏 Tibet 25 2720 202 11227 125 2632 165 14497
陕 西 Shaanxi 4828 2397 20726 3242 217899 2483 3682 6659
甘 肃 Gansu 3285 1610 4483 3345 92010 4342 2427 8733
青 海 Qinghai 814 1409 1198 3285 5164 5821 334 14116
宁 夏 Ningxia 1441 3137 200 5102 5890 4022 217 6171
新 疆 Xinjiang 25683 1808 13994 15801 14342 4864 1015 9300
4-7 2 continued
建筑业 交通运输、仓储和邮政业 信息传输、计算机服务和 批发和零售业
软件业 Information
Construction Traffic,Transport, Transfer, Computer Wholesale and
Storage and Post Services and Software Retail Trade
地 区 Region 年末人数 平均生活费 年末人数 平均生活费 年末人数 平均生活费 年末人数 平均生活费
(人) (元) (人) (元) (人) (元) (人) (元)
Average Average Average Average
Year-end Living Year-end Living Year-end Living Year-end Living
Figures Subsidy Figures Subsidy Figures Subsidy Figures Subsidy
(person) (yuan) (person) (yuan) (person) (yuan) (person) (yuan)
National 754957 2942 819150 5170 87339 10112 1682991 1683
北 京 Beijing 33349 3950 15608 8765 2570 13499 21330 8813

8/2/2019 China Labour Statistical Yearbook - 2004
http://slidepdf.com/reader/full/china-labour-statistical-yearbook-2004 319/464
天 津 Tianjin 13587 3293 23578 4750 1090 12231 19147 3488
河 北 Hebei 39107 3044 35418 4496 2977 12123 101505 1909
山 西 Shanxi 45575 2450 25614 3862 2776 8606 71934 1078
内蒙古 Inner Mongolia 12643 2982 15944 6083 3413 10943 11035 2105
辽 宁 Liaoning 47756 2494 54470 5065 4001 12131 66593 1059
吉 林 Jilin 42889 1155 55688 4128 3612 7171 103427 765
黑龙江 Heilongjiang 48366 780 95430 4089 6933 10759 126357 746
上 海 Shanghai 18705 7060 34978 7241 1999 16887 46485 3816
江 苏 Jiangsu 29766 5095 38981 7695 2415 13161 63344 2782
浙 江 Zhejiang 5519 4678 7951 8545 1339 16017 6697 3162
安 徽 Anhui 39744 2943 17770 3515 1996 9723 57750 1498
福 建 Fujian 8141 3043 9049 4951 1064 11993 21746 2016
江 西 Jiangxi 37170 1744 32944 3507 1853 8314 77192 1234
山 东 Shandong 16745 4726 40126 6878 6797 9170 140466 1641
河 南 Henan 28202 2101 45013 3195 4956 5901 162180 671
湖 北 Hubei 53874 3488 55209 3992 8170 9200 98227 1547
湖 南 Hunan 48914 2580 44211 4253 8199 6753 142055 1676
广 东 Guangdong 16009 4609 23815 7458 3149 14018 98977 1684广 西 Guangxi 7455 3394 12587 4134 1720 9270 38980 1232
海 南 Hainan 2113 666 4147 6352 1462 6480 16837 895
重 庆 Chongqing 10165 2759 15737 6206 731 12157 16084 3710
四 川 Sichuan 42644 3701 23667 4901 3301 8283 39698 2722
贵 州 Guizhou 13173 2579 12139 4658 1489 9902 26264 2480
云 南 Yunnan 13341 5322 15940 8168 2961 11818 17217 7323
西 藏 Tibet 68 6135 332 10736 271 33079 228 8323
陕 西 Shaanxi 46871 2530 29363 3954 2441 8513 63049 1686
甘 肃 Gansu 18159 2172 18260 7526 1361 7894 16543 2087
青 海 Qinghai 1817 3553 4531 9040 426 17265 5219 3998
宁 夏 Ningxia 4132 3595 2136 12500 212 11850 2366 5049
新 疆 Xinjiang 8958 2920 8514 6630 1655 15591 4059 5440
4-7 3 continued
住宿和餐饮业 金融业 房地产业 租赁和商务服务业
Accommodation and Finance Real Estate Tenancy and
Restaurants Business Services
地 区 Region 年末人数 平均生活费 年末人数 平均生活费 年末人数 平均生活费 年末人数 平均生活费
(人) (元) (人) (元) (人) (元) (人) (元)
Average Average Average Average
Year-end Living Year-end Living Year-end Living Year-end Living
Figures Subsidy Figures Subsidy Figures Subsidy Figures Subsidy
(person) (yuan) (person) (yuan) (person) (yuan) (person) (yuan)
National 160431 2345 171441 11997 81360 4234 165137 3244
北 京 Beijing 4732 7861 2577 17223 3778 8912 10329 8949
天 津 Tianjin 3029 2470 1471 14152 1596 5213 4531 4091
河 北 Hebei 8760 2111 13724 12786 1596 5794 5786 3049
山 西 Shanxi 5225 1252 6571 10927 1459 966 6584 1817
内蒙古 Inner Mongolia 819 3146 3852 10476 385 5294 1716 5951
辽 宁 Liaoning 8246 1768 9812 11701 7648 3592 10389 3064
吉 林 Jilin 8129 1022 6079 12162 3065 1956 8032 3079
黑龙江 Heilongjiang 10076 412 7183 12468 6064 1673 19018 850
上 海 Shanghai 8617 4362 2478 11935 6667 4501 5807 4179
江 苏 Jiangsu 8603 3043 6738 13972 2644 9105 5147 6069
浙 江 Zhejiang 2980 3497 4372 18545 1151 7653 3874 6105
安 徽 Anhui 5353 1906 5499 10215 859 2945 3724 1866
福 建 Fujian 2998 2807 1415 17227 689 4919 2410 2859
江 西 Jiangxi 5176 1582 5480 9181 2049 3649 5945 1581

8/2/2019 China Labour Statistical Yearbook - 2004
http://slidepdf.com/reader/full/china-labour-statistical-yearbook-2004 320/464
山 东 Shandong 11716 2517 12182 9902 5451 9588 7314 3236
河 南 Henan 12290 1346 12674 9859 2813 2255 9656 1751
湖 北 Hubei 6541 2052 10946 10068 5431 4289 11250 2399
湖 南 Hunan 15380 2274 8449 12885 11375 2392 8977 2458
广 东 Guangdong 6898 2846 12872 17128 7707 3256 12176 3294
广 西 Guangxi 6517 1678 5020 10447 889 2687 5889 1950
海 南 Hainan 1838 2631 2227 14251 2023 2395 2078 1236
重 庆 Chongqing 1546 3277 2887 12799 569 4717 334 4033
四 川 Sichuan 3239 2559 6562 10657 1281 4660 2025 4611
贵 州 Guizhou 2430 2347 2721 10749 863 1840 3005 3999
云 南 Yunnan 1296 3031 3083 11714 263 9009 3111 5141
西 藏 Tibet 60 6344 317 20574 1 12000 13 6000
陕 西 Shaanxi 4390 2152 6274 9119 1393 2747 2654 1302
甘 肃 Gansu 1824 2201 3869 10464 523 8858 622 5960
青 海 Qinghai 218 4186 680 14464 23 10043 831 2057
宁 夏 Ningxia 311 5498 995 13143 3 8000 349 12309
新 疆 Xinjiang 1194 4437 2432 16733 1102 6294 1561 7191
4-7 4 continued
科学研究、技术服务和地质 水利、环境和公共设施管理 居民服务和其他服务业 教育
勘查业 Scientific Rese- 业 Management of Water
arch,Technical Service Conservancy,Environment Resident Services Education
& Geologic Perambulation & Public Establishment and Other Services
地 区 Region 年末人数 平均生活费 年末人数 平均生活费 年末人数 平均生活费 年末人数 平均生活费
(人) (元) (人) (元) (人) (元) (人) (元)
Average Average Average Average
Year-end Living Year-end Living Year-end Living Year-end Living
Figures Subsidy Figures Subsidy Figures Subsidy Figures Subsidy
(person) (yuan) (person) (yuan) (person) (yuan) (person) (yuan)
National 159059 5235 92435 4504 43502 2578 197048 8612
北 京 Beijing 10294 11467 3247 15642 2398 6958 7744 14582
天 津 Tianjin 2511 5573 1474 8120 1147 4737 3644 8011
河 北 Hebei 8322 4855 1695 5891 705 2270 9531 9830
山 西 Shanxi 3194 3527 1080 2005 1490 1172 3989 7981
内蒙古 Inner Mongolia 5596 4234 881 6007 54 5509 4028 9856
辽 宁 Liaoning 9909 3975 9199 5077 755 1602 12302 7697
吉 林 Jilin 6387 5046 5519 3096 1840 4053 15716 6870
黑龙江 Heilongjiang 5818 4040 10899 1109 5014 1284 13386 9706
上 海 Shanghai 6357 9258 3212 9445 17970 2046 7838 14872
江 苏 Jiangsu 4694 5259 4001 7012 575 6232 6910 8222
浙 江 Zhejiang 2394 6825 2154 9454 101 2563 5552 14937
安 徽 Anhui 4475 4058 1849 2366 942 2050 6295 7232
福 建 Fujian 2410 4422 311 3948 677 3612 1976 6311
江 西 Jiangxi 8105 2950 4006 2752 984 3037 8572 4741
山 东 Shandong 5612 5340 5184 7111 1193 3337 22524 9664
河 南 Henan 5819 3754 5206 1733 1778 610 6063 4794
湖 北 Hubei 10937 4905 10891 3714 687 3803 15537 6184
湖 南 Hunan 11372 3476 11167 3400 1394 855 17097 7203
广 东 Guangdong 4061 7588 2985 4012 966 6969 2223 13705
广 西 Guangxi 2998 5166 1751 4154 228 3588 3778 7824
海 南 Hainan 949 2033 452 2735 390 7668
重 庆 Chongqing 1515 11925 282 4023 116 395 3243 10327
四 川 Sichuan 9989 5501 1476 4920 430 3594 8026 6104
贵 州 Guizhou 3617 4661 152 2748 391 2000 1313 8087
云 南 Yunnan 5161 4433 510 6365 15 1842 11219
西 藏 Tibet 13 24071 1 8000 167 10200

8/2/2019 China Labour Statistical Yearbook - 2004
http://slidepdf.com/reader/full/china-labour-statistical-yearbook-2004 321/464
陕 西 Shaanxi 6013 5673 1759 5603 1024 1866 3797 7132
甘 肃 Gansu 4538 5672 482 6695 68 4853 1213 10275
青 海 Qinghai 2387 3579 12 2154 78 782 223 9602
宁 夏 Ningxia 236 3458 76 13274 175 11125
新 疆 Xinjiang 3376 3506 522 4971 482 6099 1954 12899
4-7 5 continued
卫生、社会保障和社会福利业 文化体育和娱乐业 公共管理和社会组织
Sanitation, Social
Security and Culture, Sports Public Management &
Social Welfare and Entertainment Social Organization
地 区 Region 年末人数 平均生活费 年末人数 平均生活费 年末人数 平均生活费
(人) (元) (人) (元) (人) (元)
Average Average Average
Year-end Living Year-end Living Year-end Living
Figures Subsidy Figures Subsidy Figures Subsidy
(person) (yuan) (person) (yuan) (person) (yuan)
National 123239 5610 58838 4809 445151 9867
北 京 Beijing 1278 10325 2530 11954 5346 16033
天 津 Tianjin 3104 6441 881 7418 1027 7460
河 北 Hebei 3597 4714 1993 7259 58794 11075
山 西 Shanxi 2196 3943 1444 2923 12023 8029
内蒙古 Inner Mongolia 1508 4744 827 7037 9719 10688
辽 宁 Liaoning 14171 4624 3087 3501 17639 9200
吉 林 Jilin 5066 5391 1655 5789 18261 9551
黑龙江 Heilongjiang 6858 5202 1786 4921 36254 10778
上 海 Shanghai 6310 10642 2537 11930 3677 10208
江 苏 Jiangsu 2904 5511 1991 6007 14012 12811
浙 江 Zhejiang 3799 7450 1375 6809 9135 20843
安 徽 Anhui 1268 3740 1249 3240 7751 6472
福 建 Fujian 576 4822 763 2536 2623 8250
江 西 Jiangxi 4011 4485 2196 3253 13278 5342
山 东 Shandong 5877 8772 3722 4950 54525 9938
河 南 Henan 8405 2367 4565 1125 22246 4451
湖 北 Hubei 18302 4558 5095 3563 35233 6826
湖 南 Hunan 13166 5471 8199 3719 40621 6702
广 东 Guangdong 4633 4177 2897 4867 29141 17536
广 西 Guangxi 1806 5714 2756 2166 9537 5088
海 南 Hainan 631 3722 1060 4519 2360 12300
重 庆 Chongqing 835 4522 657 3998 3860 10907
四 川 Sichuan 5369 6910 1946 5208 8406 10302
贵 州 Guizhou 818 4657 685 1524 3060 8855
云 南 Yunnan 849 6658 552 3543 6536 13276
西 藏 Tibet 45 14556 2 18500 534 14898
陕 西 Shaanxi 3251 7972 1710 4162 12639 6333
甘 肃 Gansu 830 10109 222 5233 3487 7520
青 海 Qinghai 272 11696 69 4379 961 8095
宁 夏 Ningxia 196 9698 170 5633 986 12594
新 疆 Xinjiang 1308 7884 217 6730 1480 16465
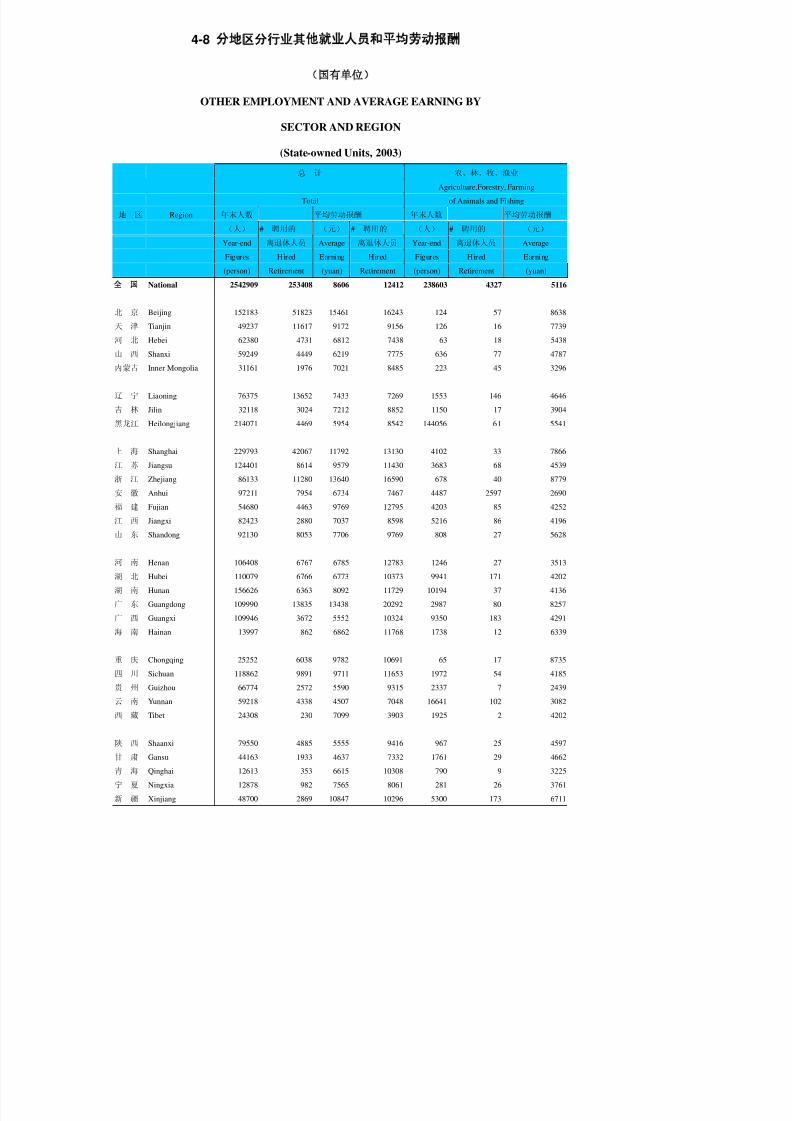
8/2/2019 China Labour Statistical Yearbook - 2004
http://slidepdf.com/reader/full/china-labour-statistical-yearbook-2004 322/464
4-8
OTHER EMPLOYMENT AND AVERAGE EARNING BY
SECTOR AND REGION
(State-owned Units, 2003)总 计 农、林、牧、渔业
Agriculture,Forestry, Farming
Total of Animals and Fishing
地 区 Region 年末人数 平均劳动报酬 年末人数 平均劳动报酬
(人) # 聘用的
(元) # 聘用的
(人) # 聘用的
(元)
Year-end 离退休人员 Average 离退休人员 Year-end 离退休人员 Average
Figures Hired Earning Hired Figures Hired Earning
(person) Retirement (yuan) Retirement (person) Retirement (yuan)
National 2542909 253408 8606 12412 238603 4327 5116
北 京 Beijing 152183 51823 15461 16243 124 57 8638天 津 Tianjin 49237 11617 9172 9156 126 16 7739
河 北 Hebei 62380 4731 6812 7438 63 18 5438
山 西 Shanxi 59249 4449 6219 7775 636 77 4787
内蒙古 Inner Mongolia 31161 1976 7021 8485 223 45 3296
辽 宁 Liaoning 76375 13652 7433 7269 1553 146 4646
吉 林 Jilin 32118 3024 7212 8852 1150 17 3904
黑龙江 Heilongjiang 214071 4469 5954 8542 144056 61 5541
上 海 Shanghai 229793 42067 11792 13130 4102 33 7866
江 苏 Jiangsu 124401 8614 9579 11430 3683 68 4539
浙 江 Zhejiang 86133 11280 13640 16590 678 40 8779
安 徽 Anhui 97211 7954 6734 7467 4487 2597 2690
福 建 Fujian 54680 4463 9769 12795 4203 85 4252
江 西 Jiangxi 82423 2880 7037 8598 5216 86 4196
山 东 Shandong 92130 8053 7706 9769 808 27 5628
河 南 Henan 106408 6767 6785 12783 1246 27 3513
湖 北 Hubei 110079 6766 6773 10373 9941 171 4202
湖 南 Hunan 156626 6363 8092 11729 10194 37 4136
广 东 Guangdong 109990 13835 13438 20292 2987 80 8257
广 西 Guangxi 109946 3672 5552 10324 9350 183 4291
海 南 Hainan 13997 862 6862 11768 1738 12 6339
重 庆 Chongqing 25252 6038 9782 10691 65 17 8735
四 川 Sichuan 118862 9891 9711 11653 1972 54 4185
贵 州 Guizhou 66774 2572 5590 9315 2337 7 2439
云 南 Yunnan 59218 4338 4507 7048 16641 102 3082
西 藏 Tibet 24308 230 7099 3903 1925 2 4202
陕 西 Shaanxi 79550 4885 5555 9416 967 25 4597
甘 肃 Gansu 44163 1933 4637 7332 1761 29 4662
青 海 Qinghai 12613 353 6615 10308 790 9 3225
宁 夏 Ningxia 12878 982 7565 8061 281 26 3761
新 疆 Xinjiang 48700 2869 10847 10296 5300 173 6711

8/2/2019 China Labour Statistical Yearbook - 2004
http://slidepdf.com/reader/full/china-labour-statistical-yearbook-2004 323/464
4-8 1 continued
采矿业 制造业
Mining Manufacturing
地 区 Region 年末人数 平均劳动报酬 年末人数 平均劳动报酬
(人) # 聘用的
(元) # 聘用的
(人) # 聘用的
(元) # 聘用的
Year-end 离退休人员 Average 离退休人员 Year-end 离退休人员 Average 离退休人员
Figures Hired Earning Hired F igures Hired Earning Hired
(person) Retirement (yuan) Retirement (person) Retirement (yuan) Retirement
National 46256 2230 9980 5968 164432 29668 8206 10491
北 京 Beijing 19 14 14316 12000 10381 5530 14939 13521
天 津 Tianjin 8 8 9889 9889 3629 1485 8156 7925
河 北 Hebei 261 13 6668 15308 2802 784 9322 8244
山 西 Shanxi 4552 263 14599 4417 3563 733 3621 6552
内蒙古 Inner Mongolia 1182 33 8175 5970 211 64 6508 7348
辽 宁 Liaoning 147 26 1453 3963 5575 1438 6217 7632
吉 林 Jilin 29 23 10300 8478 1520 318 4085 9509
黑龙江Heilongjiang 240 4 5675 6250 8066 465 5718 5638
上 海 Shanghai 63 8680 30490 6095 13015 12816
江 苏 Jiangsu 208 21 9073 4857 7107 960 8111 13300
浙 江 Zhejiang 67 1 9970 22000 1956 416 8609 12140
安 徽 Anhui 182 159 8291 8579 4813 716 4987 7724
福 建 Fujian 380 19 8003 8947 1860 422 11896 10247
江 西 Jiangxi 1827 75 6723 10880 6915 310 6805 4687
山 东 Shandong 4403 67 6756 4958 3876 876 5617 9574
河 南 Henan 6752 54 8946 7889 9213 413 2864 6202
湖 北 Hubei 3244 42 15222 7763 9037 1012 8191 12907
湖 南 Hunan 3525 189 6669 6363 12078 940 5590 7270
广 东 Guangdong 93 50 6061 6852 3557 1065 14769 13910
广 西 Guangxi 973 52 8911 3828 7322 383 5060 9217
海 南 Hainan 61 5 2295 5000 1145 93 3409 8385
重 庆 Chongqing 572 101 8593 9500 2321 1409 6340 8284
四 川 Sichuan 1497 90 11195 7753 6636 1042 7196 8208
贵 州 Guizhou 1763 7 7683 21143 5674 515 5956 6413
云 南 Yunnan 729 584 4615 4786 1705 331 7945 7687
西 藏 Tibet 835 1 11281 53 838 47 8986 27538
陕 西 Shaanxi 2905 42 5990 8327 7825 1062 5990 7010
甘 肃 Gansu 1894 69 9699 10449 2855 530 4475 4863
青 海 Qinghai 36 4 2139 4500 498 61 8554 4375
宁 夏 Ningxia 219 6134 250 23 3388 8167
新 疆 Xinjiang 7590 214 14690 12950 714 130 10267 10667
4-8 2 continued
电力、燃气及水的生产和供应业 建筑业
Production and Distribution of
Electricity, Gas and Water Construction
地 区 Region 年末人数 平均劳动报酬 年末人数 平均劳动报酬
(人) # 聘用的
(元) # 聘用的
(人) # 聘用的
(元) # 聘用的
Year-end 离退休人员 Average 离退休人员 Year-end 离退休人员 Average 离退休人员
Figures Hired Earning Hired F igures Hired Earning Hired
(person) Retirement (yuan) Retirement (person) Retirement (yuan) Retirement
National 40638 2613 7147 12102 206736 10956 9343 15510
北 京 Beijing 197 166 13709 11404 20874 2074 9805 17402
天 津 Tianjin 580 151 12678 19559 2492 249 16632 7959
河 北 Hebei 9258 98 4959 8000 327 195 11206 10241
山 西 Shanxi 407 41 3752 4235 1826 139 9728 8710
内蒙古 Inner Mongolia 239 13 5588 8000 1616 61 5533 8958

8/2/2019 China Labour Statistical Yearbook - 2004
http://slidepdf.com/reader/full/china-labour-statistical-yearbook-2004 324/464
辽 宁 Liaoning 1083 139 4302 6058 2729 529 7486 7403
吉 林 Jilin 268 91 6788 5602 1911 45 12136 17078
黑龙江 Heilongjiang 1328 29 5074 6345 7637 161 8605 7386
上 海 Shanghai 546 233 12348 14607 8239 1215 11723 20528
江 苏 Jiangsu 551 89 5173 10412 4274 254 9165 15724
浙 江 Zhejiang 1553 155 20761 24297 1609 177 18989 35164
安 徽 Anhui 1479 118 8086 12390 11623 355 9575 11660
福 建 Fujian 2171 165 9502 16365 2340 276 10407 16159
江 西 Jiangxi 2254 28 5694 4069 8334 146 3983 6222
山 东 Shandong 1393 84 6055 9141 5883 128 10276 11047
河 南 Henan 2121 120 8154 25808 19847 955 8583 25736
湖 北 Hubei 1231 53 7337 4075 6983 579 7060 9016
湖 南 Hunan 1466 50 5714 10260 36115 340 8953 18294
广 东 Guangdong 824 156 11241 15374 12756 785 10080 25681
广 西 Guangxi 2178 59 5642 7678 4985 81 6857 4470
海 南 Hainan 1458 8 7670 9000 337 110 9401 6171
重 庆 Chongqing 65 14 17318 5533 969 432 11499 9403四 川 Sichuan 1764 272 5827 8119 20908 942 11080 10981
贵 州 Guizhou 1399 50 5814 8592 6117 119 8356 14127
云 南 Yunnan 686 45 10087 5020 263 151 11222 12967
西 藏 Tibet 865 13 7481 8692 2695 7 13125 14571
陕 西 Shaanxi 1608 69 9224 19758 4615 151 7788 9735
甘 肃 Gansu 1141 5 4587 8417 955 53 5609 19964
青 海 Qinghai 124 45 8864 6932 1067 45 6724 28404
宁 夏 Ningxia 107 3872 3281 56 9970 10429
新 疆 Xinjiang 294 54 7846 8308 3129 146 8370 10126
4-8 3 continued
交通运输、仓储和邮政业 信息传输、计算机服务和软件业
Traffic, Transport, Information Transfer, Computer
Storage and Post Services and Software
地 区 Region 年末人数 平均劳动报酬 年末人数 平均劳动报酬
(人) # 聘用的
(元) # 聘用的
(人) # 聘用的
(元) # 聘用的
Year-end 离退休人员 Average 离退休人员 Year-end 离退休人员 Average 离退休人员
Figures H ired Earning Hired Figures H ired Earning Hired
(person) Retirement (yuan) Retirement (person) Retirement (yuan) Retirement
National 183899 5946 9099 10393 80954 1704 12073 12523
北 京 Beijing 7639 726 12503 10603 1995 391 27821 23956
天 津 Tianjin 1304 109 6017 6021 58 1 8519 5000
河 北 Hebei 4578 59 5048 4627 2781 17 7996 6235
山 西 Shanxi 3653 48 5594 6809 1221 33 6043 9433
内蒙古 Inner Mongolia 4274 168 7043 7827 548 34 7222 5794
辽 宁 Liaoning 4449 409 10566 14796 3780 113 5028 6027
吉 林 Jilin 4185 53 6831 8527 710 19 8444 5091
黑龙江 Heilongjiang 6032 85 7449 10552 1309 26 6438 5952
上 海 Shanghai 28095 1900 11130 11669 5617 275 21930 14221
江 苏 Jiangsu 11651 45 11363 8609 3020 27 12754 4368
浙 江 Zhejiang 8168 215 12243 13217 2800 14 19141 10769
安 徽 Anhui 5646 58 5215 6773 4140 9 7962 6556
福 建 Fujian 5884 96 10116 9538 4398 16 12921 7471
江 西 Jiangxi 11395 103 8566 8402 2949 18 8513 3263
山 东 Shandong 2379 49 8596 7031 6296 26 10378 14600
河 南 Henan 4913 44 7387 6667 8277 262 5532 5087
湖 北 Hubei 6637 153 8618 6942 2028 37 7028 8050
湖 南 Hunan 13809 521 8503 7546 3860 18 10427 8444
广 东 Guangdong 9046 253 14294 20553 7925 43 22763 13162
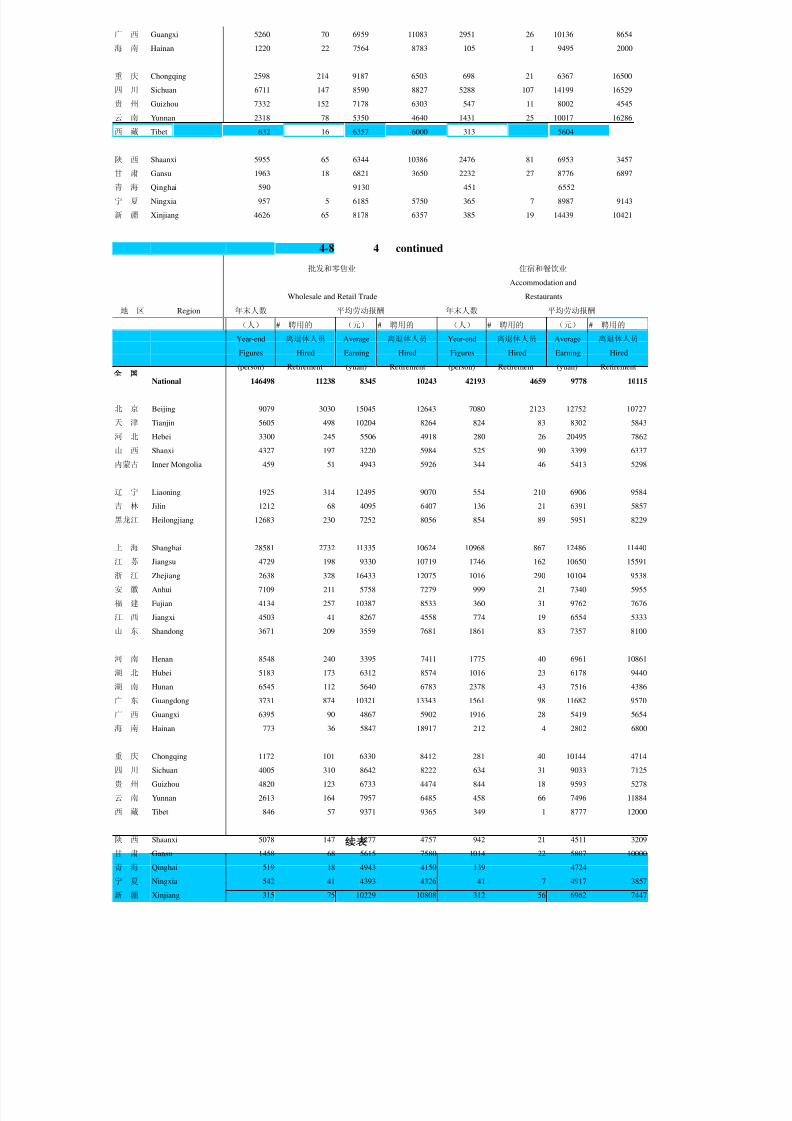
8/2/2019 China Labour Statistical Yearbook - 2004
http://slidepdf.com/reader/full/china-labour-statistical-yearbook-2004 325/464
广 西 Guangxi 5260 70 6959 11083 2951 26 10136 8654
海 南 Hainan 1220 22 7564 8783 105 1 9495 2000
重 庆 Chongqing 2598 214 9187 6503 698 21 6367 16500
四 川 Sichuan 6711 147 8590 8827 5288 107 14199 16529
贵 州 Guizhou 7332 152 7178 6303 547 11 8002 4545
云 南 Yunnan 2318 78 5350 4640 1431 25 10017 16286
西 藏 Tibet 632 16 6357 6000 313 5604
陕 西 Shaanxi 5955 65 6344 10386 2476 81 6953 3457
甘 肃 Gansu 1963 18 6821 3650 2232 27 8776 6897
青 海 Qinghai 590 9130 451 6552
宁 夏 Ningxia 957 5 6185 5750 365 7 8987 9143
新 疆 Xinjiang 4626 65 8178 6357 385 19 14439 10421
4-8 4 continued
批发和零售业 住宿和餐饮业
Accommodation and
Wholesale and Retail Trade Restaurants
地 区 Region 年末人数 平均劳动报酬 年末人数 平均劳动报酬
(人) # 聘用的
(元) # 聘用的
(人) # 聘用的
(元) # 聘用的
Year-end 离退休人员 Average 离退休人员 Year-end 离退休人员 Average 离退休人员
Figures Hired Earning Hired Figures Hired Earning Hired
(person) Retirement (yuan) Retirement (person) Retirement (yuan) Retirement
National 146498 11238 8345 10243 42193 4659 9778 10115
北 京 Beijing 9079 3030 15045 12643 7080 2123 12752 10727
天 津 Tianjin 5605 498 10204 8264 824 83 8302 5843
河 北 Hebei 3300 245 5506 4918 280 26 20495 7862
山 西 Shanxi 4327 197 3220 5984 525 90 3399 6337
内蒙古 Inner Mongolia 459 51 4943 5926 344 46 5413 5298
辽 宁 Liaoning 1925 314 12495 9070 554 210 6906 9584
吉 林 Jilin 1212 68 4095 6407 136 21 6391 5857
黑龙江 Heilongjiang 12683 230 7252 8056 854 89 5951 8229
上 海 Shanghai 28581 2732 11335 10624 10968 867 12486 11440
江 苏 Jiangsu 4729 198 9330 10719 1746 162 10650 15591
浙 江 Zhejiang 2638 328 16433 12075 1016 290 10104 9538
安 徽 Anhui 7109 211 5758 7279 999 21 7340 5955
福 建 Fujian 4134 257 10387 8533 360 31 9762 7676
江 西 Jiangxi 4503 41 8267 4558 774 19 6554 5333
山 东 Shandong 3671 209 3559 7681 1861 83 7357 8100
河 南 Henan 8548 240 3395 7411 1775 40 6961 10861
湖 北 Hubei 5183 173 6312 8574 1016 23 6178 9440
湖 南 Hunan 6545 112 5640 6783 2378 43 7516 4386
广 东 Guangdong 3731 874 10321 13343 1561 98 11682 9570
广 西 Guangxi 6395 90 4867 5902 1916 28 5419 5654
海 南 Hainan 773 36 5847 18917 212 4 2802 6800
重 庆 Chongqing 1172 101 6330 8412 281 40 10144 4714
四 川 Sichuan 4005 310 8642 8222 634 31 9033 7125
贵 州 Guizhou 4820 123 6733 4474 844 18 9593 5278
云 南 Yunnan 2613 164 7957 6485 458 66 7496 11884
西 藏 Tibet 846 57 9371 9365 349 1 8777 12000
陕 西 Shaanxi 5078 147 5277 4757 942 21 4511 3209
甘 肃 Gansu 1458 68 5615 7580 1014 22 5807 10000
青 海 Qinghai 519 18 4943 4150 139 4724
宁 夏 Ningxia 542 41 4393 4326 41 7 4917 3857
新 疆 Xinjiang 315 75 10229 10808 312 56 6962 7447

8/2/2019 China Labour Statistical Yearbook - 2004
http://slidepdf.com/reader/full/china-labour-statistical-yearbook-2004 326/464
4-8 5 continued
金融业 房地产业
Finance Real Estate
地 区 Region 年末人数 平均劳动报酬 年末人数 平均劳动报酬
(人) # 聘用的
(元) # 聘用的
(人) # 聘用的
(元) # 聘用的
Year-end 离退休人员 Average 离退休人员 Year-end 离退休人员 Average 离退休人员
Figures H ired Earning Hired Figures H ired Earning Hired
(person) Retirement (yuan) Retirement (person) Retirement (yuan) Retirement
National 318282 3458 10951 9509 33790 6987 11113 11685
北 京 Beijing 12279 286 17554 16274 6100 2411 14824 12224
天 津 Tianjin 3163 0 14566 0 565 137 11767 12863
河 北 Hebei 16856 153 9154 4854 188 45 6201 6643
山 西 Shanxi 13607 87 7779 2748 213 36 11770 4917
内蒙古 Inner Mongolia 4812 39 8695 6595 30 7 6783 7143
辽 宁 Liaoning 14964 14 8716 9368 1305 157 8014 6872
吉 林 Jilin 7871 85 8868 7255 824 33 6474 9303
黑龙江 Heilongjiang 2730 169 10983 14302 1337 104 4578 9569
上 海 Shanghai 6152 733 14164 13127 12454 1985 11737 11755
江 苏 Jiangsu 26958 111 11335 7625 1522 185 10892 10453
浙 江 Zhejiang 15819 132 14759 6463 1101 254 13255 14347
安 徽 Anhui 22238 77 7739 6271 353 41 6142 4975
福 建 Fujian 7664 103 13049 11944 535 179 13078 14925
江 西 Jiangxi 11060 56 9397 5228 392 13 7788 5462
山 东 Shandong 30350 60 8650 5717 705 368 9096 8258
河 南 Henan 17770 67 8000 12500 194 61 16200 4678
湖 北 Hubei 7977 18 8485 6686 597 79 5719 4940
湖 南 Hunan 15014 163 9012 4947 408 48 9047 13130
广 东 Guangdong 15936 444 17140 10144 1392 305 13488 19488
广 西 Guangxi 6844 68 10703 5339 764 74 6588 7039
海 南 Hainan 998 3 13636 11000 88 16 9207 13944
重 庆 Chongqing 6450 67 10318 11043 224 112 9490 12486
四 川 Sichuan 21081 118 14932 9225 580 72 8342 8886
贵 州 Guizhou 4588 172 8393 6561 294 65 13208 8308
云 南 Yunnan 2597 75 7065 3887 448 75 6844 12508
西 藏 Tibet 30 6000 51 1 18440 10000
陕 西 Shaanxi 7918 65 8350 4937 155 39 7566 6386
甘 肃 Gansu 2782 32 6838 9192 190 10 8657 24700
青 海 Qinghai 1343 12 7765 8923 24 4800
宁 夏 Ningxia 1775 5 13520 18400 10 1 4900 10000
新 疆 Xinjiang 8656 44 17236 8636 747 74 5822 5658
4-8 6 continued
租赁和商务服务业 科学研究、技术服务和地质勘查业
Tenancy and Scientific Research,Technical Service
Business Services and Geologic Perambulation
地 区 Region 年末人数 平均劳动报酬 年末人数 平均劳动报酬
(人) # 聘用的
(元) # 聘用的
(人) # 聘用的
(元) # 聘用的
Year-end 离退休人员 Average 离退休人员 Year-end 离退休人员 Average 离退休人员
Figures Hired Earning Hired F igures Hired Earning Hired
(person) Retirement (yuan) Retirement (person) Retirement (yuan) Retirement
National 73511 9073 10292 13927 83180 36806 15298 18107
北 京 Beijing 9377 3871 17339 16599 22276 11667 21486 22456
天 津 Tianjin 1139 320 9954 10092 2596 1709 12636 15373
河 北 Hebei 449 49 5965 7333 492 309 8101 9362
山 西 Shanxi 775 422 5661 7222 1194 452 9709 11180

8/2/2019 China Labour Statistical Yearbook - 2004
http://slidepdf.com/reader/full/china-labour-statistical-yearbook-2004 327/464
内蒙古 Inner Mongolia 4458 212 9860 9081 201 153 12712 13882
辽 宁 Liaoning 1035 300 7112 9370 2807 1544 9896 9369
吉 林 Jilin 426 58 9199 7645 1021 370 12500 10143
黑龙江 Heilongjiang 958 133 3132 5244 3221 911 6901 8566
上 海 Shanghai 17901 985 7711 12720 8751 5293 18976 20863
江 苏 Jiangsu 4717 278 10120 12180 3710 1193 11869 12832
浙 江 Zhejiang 3821 447 10666 12362 3655 1207 17533 18337
安 徽 Anhui 864 109 7334 8234 1600 567 8352 12108
福 建 Fujian 1325 176 6832 9633 1603 449 14525 23610
江 西 Jiangxi 734 68 10704 8500 609 191 7934 17279
山 东 Shandong 460 158 8770 10060 2142 1297 11392 10396
河 南 Henan 1900 207 9244 7701 1643 818 8790 11811
湖 北 Hubei 1248 114 6946 7226 4683 1026 10781 13840
湖 南 Hunan 12006 121 12298 12725 3879 850 10021 16232
广 东 Guangdong 1550 350 15008 22739 2802 1670 24331 29086
广 西 Guangxi 1018 121 5501 8370 2282 350 12852 21028
海 南 Hainan 234 9 4273 8556 268 89 12128 19411
重 庆 Chongqing 1692 65 16880 9833 1723 772 16961 20105
四 川 Sichuan 1012 35 10605 19048 3214 1620 11284 12529
贵 州 Guizhou 909 81 12907 20291 762 236 8018 18823
云 南 Yunnan 469 114 6835 9407 1005 506 7122 9760
西 藏 Tibet 70 1 6614 12000 460 8 8400 28125
陕 西 Shaanxi 442 71 10904 7324 1437 715 10081 12103
甘 肃 Gansu 757 55 6766 6236 657 412 9992 10060
青 海 Qinghai 558 6 4992 4167 1865 53 18964 10492
宁 夏 Ningxia 1019 74 7374 8589 172 91 11693 10165
新 疆 Xinjiang 188 63 8734 11246 450 278 14214 15355
4-8 7 continued
水利、环境和公共设施管理业 居民服务和其他服务业
Management of Water Conservancy, Resident Services
Environment and Public Establishment and Other Services
地 区 Region 年末人数 平均劳动报酬 年末人数 平均劳动报酬
(人) # 聘用的
(元) # 聘用的
(人) # 聘用的
(元) # 聘用的
Year-end 离退休人员 Average 离退休人员 Year-end 离退休人员 Average 离退休人员
Figures H ired Earning Hired Figures H ired Earning Hired
(person) Retirement (yuan) Retirement (person) Retirement (yuan) Retirement
National 73994 4528 5350 7122 22093 2722 9661 12403
北 京 Beijing 2080 1187 7832 6892 1574 587 14241 19899
天 津 Tianjin 2355 57 5966 7794 1017 206 7460 6050
河 北 Hebei 1026 109 4295 5122 121 14 5495 4807
山 西 Shanxi 614 32 3416 3688 99 43 5663 9558
内蒙古 Inner Mongolia 1519 16 3931 6545 21 13 5667 4538
辽 宁 Liaoning 3699 1171 4863 2955 258 130 7359 6320
吉 林 Jilin 1292 72 6199 4306 131 10 7664 3100
黑龙江 Heilongjiang 8104 77 3651 7976 962 7 3327 2857
上 海 Shanghai 6981 507 9837 11246 3937 1168 8978 9773
江 苏 Jiangsu 4895 189 5757 9692 2058 39 6680 8659
浙 江 Zhejiang 2283 137 8277 21418 206 27 8415 7704
安 徽 Anhui 3497 158 3532 5582 215 60 7106 5783
福 建 Fujian 1342 48 5620 7211 157 53 9438 8653
江 西 Jiangxi 3379 30 6309 6087 88 4 10180 3500
山 东 Shandong 1658 57 4716 10015 97 23 9625 6100
河 南 Henan 2281 119 4054 11000 116 23 3593 13176
湖 北 Hubei 3142 69 4769 6957 122 13 7142 5462
湖 南 Hunan 4446 27 4791 6889 345 9 5409 9400

8/2/2019 China Labour Statistical Yearbook - 2004
http://slidepdf.com/reader/full/china-labour-statistical-yearbook-2004 328/464
广 东 Guangdong 1511 152 8819 20232 196 11 12045 10182
广 西 Guangxi 3866 29 5291 9871 83 48 20581 28976
海 南 Hainan 474 7 6631 16714 25667
重 庆 Chongqing 295 49 3565 7929 2 2 9980 7000
四 川 Sichuan 3869 37 3432 10100 119 17 8122 14278
贵 州 Guizhou 1743 18 4383 5667 85 9169
云 南 Yunnan 1886 55 4526 7375 12 6 5591 7333
西 藏 Tibet 147 8235 7 4143
陕 西 Shaanxi 2485 58 2927 2328 337 9 4587 6667
甘 肃 Gansu 1157 16 3898 7286 7 3 4857 6667
青 海 Qinghai 1434 5 3666 1800
宁 夏 Ningxia 199 6 4367 10500 11 3727
新 疆 Xinjiang 335 34 5956 5864 9710 197 10909 17231
4-8 8 continued
教育 卫生、社会保障和社会福利业
Sanitation,Social Security
Education and Social Welfare
地 区 Region 年末人数 平均劳动报酬 年末人数 平均劳动报酬
(人) # 聘用的
(元) # 聘用的
(人) # 聘用的
(元) # 聘用的
Year-end 离退休人员 Average 离退休人员 Year-end 离退休人员 Average 离退休人员
Figures Hired Earning Hired Figures Hired Earning Hired
(person) Retirement (yuan) Retirement (person) Retirement (yuan) Retirement
National 382219 40984 6253 11906 118739 39599 10252 14444
北 京 Beijing 16992 7745 17148 16764 3802 2595 17460 18485
天 津 Tianjin 6994 3693 8780 8726 2326 1048 7067 7782
河 北 Hebei 11542 623 4760 5270 2141 1181 7750 8934
山 西 Shanxi 14964 343 3112 8355 1678 844 8744 11108
内蒙古 Inner Mongolia 4695 230 4287 7352 1051 442 8792 10271
辽 宁 Liaoning 12861 2699 5516 5838 5855 2758 8465 9448
吉 林 Jilin 1940 385 8835 13249 1505 734 8183 7622
黑龙江 Heilongjiang 4262 512 6731 9514 2800 716 7772 11439
上 海 Shanghai 18696 7661 11122 12348 11560 2815 11688 13092
江 苏 Jiangsu 14131 1387 7742 9867 8118 2333 9621 11655
浙 江 Zhejiang 16037 2161 11831 15756 6616 3172 18743 23100
安 徽 Anhui 9107 587 5459 8681 5071 1572 9096 14519
福 建 Fujian 7860 607 7069 11635 3457 979 12159 14506
江 西 Jiangxi 8510 355 6367 8923 4399 846 7556 11199
山 东 Shandong 16037 1249 5554 9151 4986 2485 9216 11549
河 南 Henan 4815 448 6978 10340 4931 2048 10278 14175
湖 北 Hubei 27787 1185 4961 8091 5641 1352 8138 12245
湖 南 Hunan 13592 1068 8034 12990 5089 1199 9907 16323
广 东 Guangdong 29896 2499 8388 17656 7833 3612 19248 23970
广 西 Guangxi 38739 488 3800 9115 5152 825 6769 13481
海 南 Hainan 2535 109 4923 11663 493 263 10805 14277
重 庆 Chongqing 2625 948 9421 10632 1287 907 9388 10066
四 川 Sichuan 20013 1512 5884 8648 6724 2141 11130 17985
贵 州 Guizhou 15400 355 2712 4974 3934 287 3622 6710
云 南 Yunnan 13894 326 2804 3640 3016 683 4457 9817
西 藏 Tibet 4034 5655 2127 21 4633 11000
陕 西 Shaanxi 22931 1003 3428 15847 3592 838 5552 8850
甘 肃 Gansu 16783 211 2338 4668 1195 184 6738 12088
青 海 Qinghai 1283 14 3721 2769 480 48 3900 7620
宁 夏 Ningxia 1097 148 3124 2524 555 209 5231 9829
新 疆 Xinjiang 2167 433 5462 9042 1325 462 6663 11845

8/2/2019 China Labour Statistical Yearbook - 2004
http://slidepdf.com/reader/full/china-labour-statistical-yearbook-2004 329/464
4-8 9 continued
文化体育和娱乐业 公共管理和社会组织
Culture, Sports and Entertainment Public Management and Social Organization
地 区 Region 年末人数 平均劳动报酬 年末人数 平均劳动报酬
(人) # 聘用的
(元) # 聘用的
(人) # 聘用的
(元) # 聘用的
Year-end 离退休人员 Average 离退休人员 Year-end 离退休人员 Average 离退休人员
Figures Hired Earning Hired F igures Hired Earning Hired
(person) Retirement (yuan) Retirement (person) Retirement (yuan) Retirement
National 46598 8092 12335 11306 240294 27818 7023 8705
北 京 Beijing 7755 2914 19769 14387 12560 4449 10116 11331
天 津 Tianjin 1735 297 13038 12004 12721 1550 5441 4830
河 北 Hebei 662 235 10332 6754 5253 558 5605 6569
山 西 Shanxi 828 60 6059 5322 4567 509 4901 5837
内蒙古 Inner Mongolia 213 47 5717 8447 5065 302 5729 6678
辽 宁 Liaoning 3598 213 11778 4877 8198 1342 5733 5070
吉 林 Jilin 1571 124 9215 13745 4416 498 3724 7020
黑龙江 Heilongjiang 738 115 5964 5305 6754 575 5933 6822
上 海 Shanghai 6510 1320 18662 11149 20150 6250 8967 9857
江 苏 Jiangsu 2146 234 10674 7161 19177 841 9161 10499
浙 江 Zhejiang 2260 520 11991 9300 13850 1587 11497 10357
安 徽 Anhui 1205 62 7205 8308 12583 477 5569 6120
福 建 Fujian 611 116 10070 8752 4396 386 7493 5593
江 西 Jiangxi 1015 37 7368 3667 8070 454 6026 6264
山 东 Shandong 650 193 7371 6844 4475 614 8052 5498
河 南 Henan 779 126 5886 7931 9287 695 5159 6930
湖 北 Hubei 3252 159 5486 8528 10330 508 6810 7243
湖 南 Hunan 1875 137 7963 7262 10002 491 8329 6531
广 东 Guangdong 1288 337 20934 16393 5106 1051 13538 17402
广 西 Guangxi 1370 84 7370 7742 8498 613 5269 7162
海 南 Hainan 118 10 6293 8000 1740 65 5914 11132
重 庆 Chongqing 332 109 8003 6000 1881 658 8905 8790
四 川 Sichuan 1343 191 10166 8452 11492 1153 6570 8422
贵 州 Guizhou 371 48 7793 7365 7855 308 3799 6957
云 南 Yunnan 1142 148 6600 5861 7905 804 4233 4493
西 藏 Tibet 593 5017 7491 55 6798 15782
陕 西 Shaanxi 796 82 12039 16100 7086 342 4667 6585
甘 肃 Gansu 1483 19 3169 6688 3879 170 4362 3799
青 海 Qinghai 35 3 7086 4333 1377 30 5024 4800
宁 夏 Ningxia 113 81 7703 11481 1884 202 3574 8566
新 疆 Xinjiang 211 71 6817 6111 2246 281 4960 6491

8/2/2019 China Labour Statistical Yearbook - 2004
http://slidepdf.com/reader/full/china-labour-statistical-yearbook-2004 330/464
4-9
( )
TYPES OF ON-POST STAFF AND WORKERS BY REGION
(State-owned Units, 2003)
单位:人 (person)
合 计 企 业 企业中地方
Total Enterprises Local Enterprises
地 区 Region 长 期 临 时 长 期 临 时 长 期 临 时
职 工 职 工 职 工 职 工 职 工 职 工
Long-term Temporary Long-term Temporary Long-term Temporary
Employment Employment Employment Employment Employment Employment
National 61861330 4351432 28351527 2315639 18476839 1700583
北 京 Beijing 1799152 176511 929509 102720 429451 45217
天 津 Tianjin 737252 120421 374461 60840 221369 48719
河 北 Hebei 3476783 196534 1656750 97962 1155449 63159
山 西 Shanxi 2298887 188758 1216264 97768 809987 69704
内蒙古 Inner Mongolia 1603791 56990 700920 31468 460221 25617
辽 宁 Liaoning 2942999 158540 1530987 94527 862806 77871
吉 林 Jilin 1960914 83134 1014939 32693 686649 28090
黑龙江 Heilongjiang 2941365 272048 1813557 158134 1197871 122640
上 海 Shanghai 1389346 17786 768331 5431 401967 4740
江 苏 Jiangsu 2933712 116123 1215390 39612 857824 31826
浙 江 Zhejiang 1581462 122577 455379 50142 251282 32281
安 徽 Anhui 2042722 79689 765760 43628 575867 35510
福 建 Fujian 1444933 25747 522632 20007 388860 16752
江 西 Jiangxi 1825445 135787 763646 73308 610626 59204
山 东 Shandong 4691403 183219 2246776 115505 1635918 82092
河 南 Henan 3740814 138949 1725759 93378 1248432 81909
湖 北 Hubei 2991433 310165 1480930 146531 961559 108164
湖 南 Hunan 2808019 167206 1203136 97691 841820 84068
广 东 Guangdong 3370871 284711 1277910 135004 951070 111040
广 西 Guangxi 1630512 268125 644572 105500 483681 81555
海 南 Hainan 524677 47880 313688 29157 296370 22589
重 庆 Chongqing 1110581 108231 493602 67542 256604 48864
四 川 Sichuan 2855743 303137 1098002 154452 573591 130838
贵 州 Guizhou 1268113 149351 499546 93251 342630 74513
云 南 Yunnan 1684688 133082 586806 82411 446617 63105
西 藏 Tibet 133580 3066 30485 1426 23650 495
陕 西 Shaanxi 2276392 187838 1138358 88164 594103 58880
甘 肃 Gansu 1400766 150688 677483 90776 456086 57706
青 海 Qinghai 303133 29615 130009 13478 76036 6322
宁 夏 Ningxia 371078 16095 156367 11930 98430 8302
新 疆 Xinjiang 1720764 119429 919573 81203 280013 18811
4 - 9 1 continued
单位:人 (pers
事 业 事业中地方 机 关 机关中地方
Institutions Local Institutions Organizations Local Organizations
地 区 Region 长 期 临 时 长 期 临 时 长 期 临 时 长 期 临 时
职 工 职 工 职 工 职 工 职 工 职 工 职 工 职 工
Long-term Temporary Long-term Temporary Long-term Temporary Long-term Temporary

8/2/2019 China Labour Statistical Yearbook - 2004
http://slidepdf.com/reader/full/china-labour-statistical-yearbook-2004 331/464
Employment Employment Employment Employment Employment Employment Employment Employmen
National 23548512 1533402 22139835 1363079 9961291 502391 9444139 467
北 京 Beijing 651944 62322 357968 26060 217699 11469 165928 9
天 津 Tianjin 267276 44378 248866 41200 95515 15203 87187 12
河 北 Hebei 1277193 68904 1238252 65629 542840 29668 514730 28
山 西 Shanxi 723622 68761 703934 66229 359001 22229 347550 21
内蒙古 Inner Mongolia 636973 16911 621336 16266 265898 8611 251189 8
辽 宁 Liaoning 1044644 50588 994111 42899 367368 13425 340694 12
吉 林 Jilin 725197 40244 682685 29762 220778 10197 207728 5
黑龙江 Heilongjiang 813176 89226 784093 84941 314632 24688 300023 24
上 海 Shanghai 482448 12151 402593 9338 138567 204 133702
江 苏 Jiangsu 1311840 60473 1243269 53884 406482 16038 391956 15
浙 江 Zhejiang 786363 61159 764944 57873 339720 11276 322388 9
安 徽 Anhui 928989 27989 899541 26509 347973 8072 335673 7
福 建 Fujian 642636 3055 630834 2464 279665 2685 260005
江 西 Jiangxi 746628 46037 717257 44514 315171 16442 303397 13
山 东 Shandong 1712589 52639 1653677 44846 732038 15075 703598 13
河 南 Henan 1195289 30526 1157241 28645 819766 15045 802389 14
湖 北 Hubei 1083549 117028 1002979 111944 426954 46606 407089 45
湖 南 Hunan 1080990 52905 1050818 47182 523893 16610 503412 15
广 东 Guangdong 1443260 110885 1376714 97423 649701 38822 600250 34
广 西 Guangxi 749466 132237 737472 128100 236474 30388 222960 29
海 南 Hainan 141480 13959 132256 12565 69509 4764 66009 4
重 庆 Chongqing 449877 34615 423295 29238 167102 6074 160255 5
四 川 Sichuan 1239739 104361 1137044 95773 518002 44324 488671 41
贵 州 Guizhou 493908 35422 484587 34632 274659 20678 267108 20
云 南 Yunnan 760321 37066 744337 36304 337561 13605 322840 13
西 藏 Tibet 50862 1061 50319 1035 52233 579 47712
陕 西 Shaanxi 795215 68411 713281 49406 342819 31263 331263 30
甘 肃 Gansu 500502 46633 463709 42311 222781 13279 216138 13
青 海 Qinghai 114937 11001 109383 10480 58187 5136 54590 5
宁 夏 Ningxia 152899 3355 147039 2990 61812 810 58110
新 疆 Xinjiang 544700 29100 466001 22637 256491 9126 229595 8
4 - 9 2 continued
单位:人 (person)
农、林、牧、渔业 采矿业 制造业 电力、燃气及水的生产Agriculture,Forestry, 和供应业 Production
Farming of Animals Mining Manufacturing & Distribution of
and Fishing Electricity,Gas & Water
地 区 Region 长 期 临 时 长 期 临 时 长 期 临 时 长 期 临 时
职 工 职 工 职 工 职 工 职 工 职 工 职 工 职 工
Long-term Temporary Long-term Temporary Long-term Temporary Long-term Temporary
Employment Employment Employment Employment Employment Employment Employment Employment
National 4105880 232985 2428536 168108 8012625 529612 2081297 119293
北 京 Beijing 12419 1592 2477 0 211738 8709 18344 634
天 津 Tianjin 7738 802 8661 395 131673 21146 18105 7427
河 北 Hebei 82010 3599 215351 6773 562663 29887 129232 6886
山 西 Shanxi 34322 2686 345720 23181 284116 18566 88967 3082
内蒙古 Inner Mongolia 305956 3838 61898 1570 52357 4476 60734 1306
辽 宁 Liaoning 247857 9765 144348 43433 455824 10285 115454 5343
吉 林 Jilin 196919 3328 72547 2475 265077 9932 61551 1986
黑龙江 Heilongjiang 700953 36738 29886 1827 342939 54811 111782 9917
上 海 Shanghai 6615 21 203 0 299465 788 36997 107
江 苏 Jiangsu 146476 8803 114680 1389 366444 8720 83669 2089

8/2/2019 China Labour Statistical Yearbook - 2004
http://slidepdf.com/reader/full/china-labour-statistical-yearbook-2004 332/464
浙 江 Zhejiang 22030 880 4852 86 71890 9238 60600 1546
安 徽 Anhui 103388 2343 28441 436 242961 11848 63900 862
福 建 Fujian 66822 277 20329 1137 74600 4485 58153 1021
江 西 Jiangxi 146803 11134 66431 7043 219325 12521 68784 6507
山 东 Shandong 64170 772 496360 2590 838112 47561 163017 7901
河 南 Henan 68461 1469 128311 4605 441549 21913 162567 2427
湖 北 Hubei 255193 27281 68369 4729 573260 35406 84490 10206
湖 南 Hunan 158057 5675 86388 6206 384635 12722 93116 3311
广 东 Guangdong 104529 11502 22627 796 207299 23918 123040 10019
广 西 Guangxi 111605 11723 25776 2380 187973 40020 63070 7871
海 南 Hainan 196448 2809 10683 163 22212 2199 11938 1100
重 庆 Chongqing 17337 782 38601 5052 206904 10537 35778 937
四 川 Sichuan 84742 9021 109903 4960 410496 18890 79461 9490
贵 州 Guizhou 38772 2397 49170 4543 164127 18131 50133 3492
云 南 Yunnan 140957 12204 37473 615 164013 15802 39724 1438
西 藏 Tibet 2642 7 690 6 3525 220 5937 3
陕 西 Shaanxi 55564 3906 126209 17421 428695 34930 69087 3166
甘 肃 Gansu 73022 8134 42035 14861 284596 32935 62659 4013青 海 Qinghai 20205 1158 6686 4740 27623 2087 14822 875
宁 夏 Ningxia 42167 1498 5854 482 24063 2099 23601 2833
新 疆 Xinjiang 591701 46841 57577 4214 62471 4830 22585 1498
4 - 9 3 continued
单位:人 (person)
建筑业 交通运输、仓储和邮政业 信息传输、计算机服务和 批发和零售业
软件业 Information
Construction Traffic,Transport, Transfer, Computer Wholesale and
Storage and Post Services and Software Retail Trade
地 区 Region 长 期 临 时 长 期 临 时 长 期 临 时 长 期 临 时
职 工 职 工 职 工 职 工 职 工 职 工 职 工 职 工
Long-term Temporary Long-term Temporary Long-term Temporary Long-term Temporary
Employment Employment Employment Employment Employment Employment Employment Employment
National 2225430 561193 4535297 209135 584603 54041 2662270 200949
北 京 Beijing 104699 35073 148888 3959 21744 397 84878 5230
天 津 Tianjin 34556 1279 90320 3967 7722 155 27197 4497
河 北 Hebei 121115 15761 231516 6671 23847 3583 180971 15766
山 西 Shanxi 105560 19900 182054 10244 20262 2118 125768 14346
内蒙古 Inner Mongolia 36070 5288 134341 10365 21649 1168 44497 2339
辽 宁 Liaoning 115149 4917 272030 9095 26063 1483 72300 5754
吉 林 Jilin 75544 5968 206069 9481 18718 764 88860 2871
黑龙江 Heilongjiang 118331 33099 276362 10775 25970 2624 147835 7945
上 海 Shanghai 61390 493 145074 381 15135 41 57648 776
江 苏 Jiangsu 79227 6191 216999 2459 23730 755 105655 7796
浙 江 Zhejiang 23941 11015 107971 4902 19793 1187 42272 3802
安 徽 Anhui 80640 15038 116168 4001 17406 1971 112860 3584
福 建 Fujian 64371 7104 105216 1436 18224 1097 57683 903
江 西 Jiangxi 50026 21401 130539 6555 16045 1151 85548 4243
山 东 Shandong 120933 27142 230244 4206 40120 4453 200091 6561
河 南 Henan 179322 32051 269717 2567 28432 1923 304444 11947
湖 北 Hubei 104564 11080 220911 26803 24496 1078 110471 22283
湖 南 Hunan 81266 41335 191349 7934 26483 2042 102398 5587
广 东 Guangdong 107189 23631 253920 15056 57549 7261 161442 12616
广 西 Guangxi 36151 10464 111298 10843 13055 2753 68204 11018
海 南 Hainan 13227 12845 21092 4811 3045 225 15794 1380
重 庆 Chongqing 32010 23086 104886 7843 9353 5088 39851 6573
四 川 Sichuan 144172 82855 147335 12540 30244 3377 96245 9982
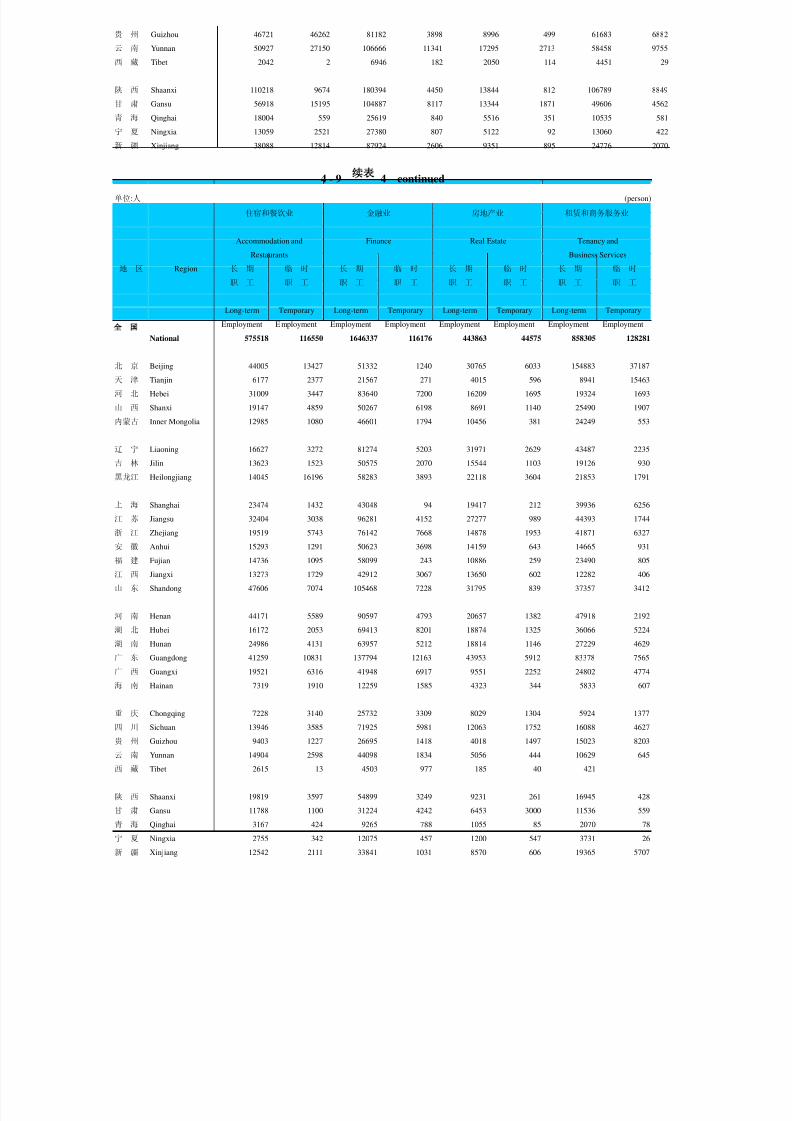
8/2/2019 China Labour Statistical Yearbook - 2004
http://slidepdf.com/reader/full/china-labour-statistical-yearbook-2004 333/464
贵 州 Guizhou 46721 46262 81182 3898 8996 499 61683 6882
云 南 Yunnan 50927 27150 106666 11341 17295 2713 58458 9755
西 藏 Tibet 2042 2 6946 182 2050 114 4451 29
陕 西 Shaanxi 110218 9674 180394 4450 13844 812 106789 8849
甘 肃 Gansu 56918 15195 104887 8117 13344 1871 49606 4562
青 海 Qinghai 18004 559 25619 840 5516 351 10535 581
宁 夏 Ningxia 13059 2521 27380 807 5122 92 13060 422
新 疆 Xinjiang 38088 12814 87924 2606 9351 895 24776 2070
4 - 9 4 continued
单位:人 (person)
住宿和餐饮业 金融业 房地产业 租赁和商务服务业
Accommodation and Finance Real Estate Tenancy and
Restaurants Business Services
地 区 Region 长 期 临 时 长 期 临 时 长 期 临 时 长 期 临 时
职 工 职 工 职 工 职 工 职 工 职 工 职 工 职 工
Long-term Temporary Long-term Temporary Long-term Temporary Long-term Temporary
Employment Employment Employment Employment Employment Employment Employment Employment
National 575518 116550 1646337 116176 443863 44575 858305 128281
北 京 Beijing 44005 13427 51332 1240 30765 6033 154883 37187
天 津 Tianjin 6177 2377 21567 271 4015 596 8941 15463
河 北 Hebei 31009 3447 83640 7200 16209 1695 19324 1693
山 西 Shanxi 19147 4859 50267 6198 8691 1140 25490 1907
内蒙古 Inner Mongolia 12985 1080 46601 1794 10456 381 24249 553
辽 宁 Liaoning 16627 3272 81274 5203 31971 2629 43487 2235
吉 林 Jilin 13623 1523 50575 2070 15544 1103 19126 930
黑龙江 Heilongjiang 14045 16196 58283 3893 22118 3604 21853 1791
上 海 Shanghai 23474 1432 43048 94 19417 212 39936 6256
江 苏 Jiangsu 32404 3038 96281 4152 27277 989 44393 1744
浙 江 Zhejiang 19519 5743 76142 7668 14878 1953 41871 6327
安 徽 Anhui 15293 1291 50623 3698 14159 643 14665 931
福 建 Fujian 14736 1095 58099 243 10886 259 23490 805
江 西 Jiangxi 13273 1729 42912 3067 13650 602 12282 406
山 东 Shandong 47606 7074 105468 7228 31795 839 37357 3412
河 南 Henan 44171 5589 90597 4793 20657 1382 47918 2192
湖 北 Hubei 16172 2053 69413 8201 18874 1325 36066 5224
湖 南 Hunan 24986 4131 63957 5212 18814 1146 27229 4629
广 东 Guangdong 41259 10831 137794 12163 43953 5912 83378 7565
广 西 Guangxi 19521 6316 41948 6917 9551 2252 24802 4774
海 南 Hainan 7319 1910 12259 1585 4323 344 5833 607
重 庆 Chongqing 7228 3140 25732 3309 8029 1304 5924 1377
四 川 Sichuan 13946 3585 71925 5981 12063 1752 16088 4627
贵 州 Guizhou 9403 1227 26695 1418 4018 1497 15023 8203
云 南 Yunnan 14904 2598 44098 1834 5056 444 10629 645
西 藏 Tibet 2615 13 4503 977 185 40 421
陕 西 Shaanxi 19819 3597 54899 3249 9231 261 16945 428
甘 肃 Gansu 11788 1100 31224 4242 6453 3000 11536 559
青 海 Qinghai 3167 424 9265 788 1055 85 2070 78
宁 夏 Ningxia 2755 342 12075 457 1200 547 3731 26
新 疆 Xinjiang 12542 2111 33841 1031 8570 606 19365 5707
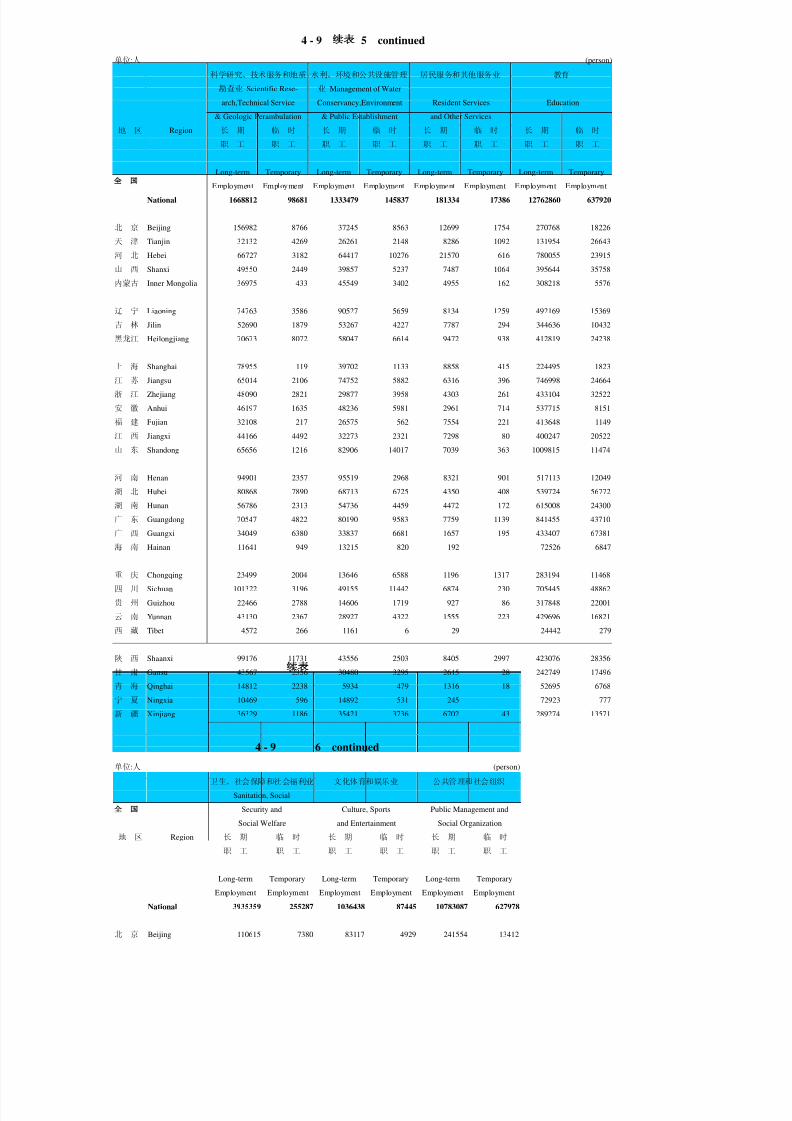
8/2/2019 China Labour Statistical Yearbook - 2004
http://slidepdf.com/reader/full/china-labour-statistical-yearbook-2004 334/464
4 - 9 5 continued
单位:人 (person)
科学研究、技术服务和地质 水利、环境和公共设施管理 居民服务和其他服务业 教育
勘查业 Scientific Rese- 业 Management of Water
arch,Technical Service Conservancy,Environment Resident Services Education
& Geologic Perambulation & Public Establishment and Other Services
地 区 Region 长 期 临 时 长 期 临 时 长 期 临 时 长 期 临 时
职 工 职 工 职 工 职 工 职 工 职 工 职 工 职 工
Long-term Temporary Long-term Temporary Long-term Temporary Long-term Temporary
Employment Employment Employment Employment Employment Employment Employment Employment
National 1668812 98681 1333479 145837 181334 17386 12762860 637920
北 京 Beijing 156982 8766 37245 8563 12699 1754 270768 18226
天 津 Tianjin 32132 4269 26261 2148 8286 1092 131954 26643
河 北 Hebei 66727 3182 64417 10276 21570 616 780055 23915
山 西 Shanxi 49550 2449 39857 5237 7487 1064 395644 35758
内蒙古 Inner Mongolia 36975 433 45549 3402 4955 162 308218 5576
辽 宁 Liaoning 74763 3586 90527 5659 8134 1259 492169 15369
吉 林 Jilin 52690 1879 53267 4227 7787 294 344636 10432
黑龙江 Heilongjiang 70673 8072 58047 6614 9472 938 412819 24238
上 海 Shanghai 78955 119 39702 1133 8858 415 224495 1823
江 苏 Jiangsu 65014 2106 74752 5882 6316 396 746998 24664
浙 江 Zhejiang 48090 2821 29877 3958 4303 261 433104 32522
安 徽 Anhui 46197 1635 48236 5981 2961 714 537715 8151
福 建 Fujian 32108 217 26575 562 7554 221 413648 1149
江 西 Jiangxi 44166 4492 32273 2321 7298 80 400247 20522
山 东 Shandong 65656 1216 82906 14017 7039 363 1009815 11474
河 南 Henan 94901 2357 95519 2968 8321 901 517113 12049
湖 北 Hubei 80868 7890 68713 6725 4350 408 539724 56772
湖 南 Hunan 56786 2313 54736 4459 4472 172 615008 24300
广 东 Guangdong 70547 4822 80190 9583 7759 1139 841455 43710
广 西 Guangxi 34049 6380 33837 6681 1657 195 433407 67381
海 南 Hainan 11641 949 13215 820 192 72526 6847
重 庆 Chongqing 23499 2004 13646 6588 1196 1317 283194 11468
四 川 Sichuan 101322 3196 49155 11442 6874 230 705445 48862
贵 州 Guizhou 22466 2788 14606 1719 927 86 317848 22001
云 南 Yunnan 43130 2367 28927 4322 1555 223 429696 16821
西 藏 Tibet 4572 266 1161 6 29 24442 279
陕 西 Shaanxi 99176 11731 43556 2503 8405 2997 423076 28356
甘 肃 Gansu 43567 2356 30480 3295 2615 28 242749 17496
青 海 Qinghai 14812 2238 5934 479 1316 18 52695 6768
宁 夏 Ningxia 10469 596 14892 531 245 72923 777
新 疆 Xinjiang 36329 1186 35421 3736 6702 43 289274 13571
4 - 9 6 continued
单位:人 (person)
卫生、社会保障和社会福利业 文化体育和娱乐业 公共管理和社会组织
Sanitation, Social
Security and Culture, Sports Public Management and
Social Welfare and Entertainment Social Organization
地 区 Region 长 期 临 时 长 期 临 时 长 期 临 时
职 工 职 工 职 工 职 工 职 工 职 工
Long-term Temporary Long-term Temporary Long-term Temporary
Employment Employment Employment Employment Employment Employment
National 3935359 255287 1036438 87445 10783087 627978
北 京 Beijing 110615 7380 83117 4929 241554 13412

8/2/2019 China Labour Statistical Yearbook - 2004
http://slidepdf.com/reader/full/china-labour-statistical-yearbook-2004 335/464
天 津 Tianjin 58375 4807 13360 5334 100212 17753
河 北 Hebei 187656 13015 39594 5365 619877 37204
山 西 Shanxi 104030 8028 34109 3698 377846 24297
内蒙古 Inner Mongolia 85970 2372 28728 1435 281603 9452
辽 宁 Liaoning 189560 6489 46068 2319 419394 20445
吉 林 Jilin 120315 6373 35529 6282 262537 11216
黑龙江 Heilongjiang 148892 11272 31870 3668 339235 34026
上 海 Shanghai 108262 1319 34402 261 146270 2115
江 苏 Jiangsu 191433 7082 43822 2627 468142 25241
浙 江 Zhejiang 166079 14223 37711 2609 356539 11836
安 徽 Anhui 111406 5744 38797 932 396906 9886
福 建 Fujian 86779 886 26514 171 279146 2679
江 西 Jiangxi 114511 3894 28557 3299 332775 24820
山 东 Shandong 279499 9722 46926 3269 824289 23419
河 南 Henan 288602 7148 61946 1905 888266 18763
湖 北 Hubei 208501 23135 50538 4293 456460 55273
湖 南 Hunan 188132 9766 56556 2721 573651 23545
广 东 Guangdong 295415 29802 49086 4401 682440 49984广 西 Guangxi 118841 28435 21438 4692 274329 37030
海 南 Hainan 21469 2457 8602 615 72859 6214
重 庆 Chongqing 62489 4813 13630 2037 181294 10976
四 川 Sichuan 176434 17529 43214 4320 556679 50498
贵 州 Guizhou 75991 4215 16644 2200 263708 17893
云 南 Yunnan 112371 6033 32611 2085 346198 14692
西 藏 Tibet 9282 47 4572 307 53515 568
陕 西 Shaanxi 109203 7012 43102 3571 358180 40925
甘 肃 Gansu 65001 5064 28484 6504 239802 17356
青 海 Qinghai 19697 1138 5282 450 58830 5958
宁 夏 Ningxia 23585 1010 7496 264 67401 791
新 疆 Xinjiang 96964 5077 24133 882 263150 9711

8/2/2019 China Labour Statistical Yearbook - 2004
http://slidepdf.com/reader/full/china-labour-statistical-yearbook-2004 336/464
4-10
INCREASE OF EMPLOYMENT IN URBAN UNITS BY REGION
(State-owned Units, 2003)
单位: 人 (person)
从 农 村 从 城 镇 录用的复员 录用的大、
合 计 中专、 调入 #由外省、自 其 他
招 收 招 收 转业军人 技工学校 治区、直辖
地 区 Region Total Recruited 毕业生 Trans- 市调入 Others
Recruited Recruited Demobilized ferred
from from and Recruit- Into Transferred
Country- Cities Transferred ed Gra- from Other
side and Towns Armymen duates Regions
National 4411837 703775 411184 149934 856119 1214448 36764 1076377
北 京 Beijing 246230 67200 17390 2898 41566 52939 6531 64237
天 津 Tianjin 73165 7427 8069 987 15035 26920 1416 14727河 北 Hebei 148344 18905 12549 8217 45411 40723 1463 22539
山 西 Shanxi 132996 23387 11778 5376 28078 25830 292 38547
内蒙古 Inner Mongolia 99540 9612 16023 3838 15052 28116 178 26899
辽 宁 Liaoning 186443 25175 13445 7600 30447 66713 862 43063
吉 林 Jilin 111326 9209 8110 6304 15149 32783 781 39771
黑龙江 Heilongjiang 235490 3062 18691 8661 22010 78231 241 104835
上 海 Shanghai 252633 10544 22663 1896 25623 74474 2597 117433
江 苏 Jiangsu 206933 12373 19046 4762 58289 59070 1458 53393
浙 江 Zhejiang 153955 23840 16904 2981 38029 44118 1923 28083
安 徽 Anhui 87186 9151 8250 4674 22842 21281 241 20988
福 建 Fujian 132542 31241 14128 2302 20550 28836 865 35485
江 西 Jiangxi 105281 13551 9736 6312 17893 25953 842 31836
山 东 Shandong 300915 62402 37282 13285 76821 79022 2431 32103
河 南 Henan 192359 21470 16108 13071 41411 68231 591 32068
湖 北 Hubei 111520 13222 14825 4612 23616 30735 596 24510
湖 南 Hunan 165882 17352 12007 8403 27741 67900 2452 32479
广 东 Guangdong 264451 41937 41465 7901 66978 65245 5300 40925
广 西 Guangxi 109635 15008 11386 2638 23620 36071 443 20912
海 南 Hainan 25904 3736 3846 811 4444 5362 334 7705
重 庆 Chongqing 83732 9066 11605 3660 19198 26599 604 13604
四 川 Sichuan 181617 34223 17793 7173 36602 55828 1174 29998
贵 州 Guizhou 84495 12345 12321 2459 25078 22951 302 9341
云 南 Yunnan 155581 28484 8224 3051 27399 42405 302 46018
西 藏 Tibet 8677 675 528 371 3725 2828 88 550
陕 西 Shaanxi 118973 13282 8916 8436 36959 34979 697 16401
甘 肃 Gansu 65085 3552 3962 3484 20619 17395 355 16073
青 海 Qinghai 21388 4056 1864 609 4200 5043 163 5616
宁 夏 Ningxia 23649 1811 2456 1006 4022 10321 96 4033
新 疆 Xinjiang 325910 156477 9814 2156 17712 37546 1146 102205

8/2/2019 China Labour Statistical Yearbook - 2004
http://slidepdf.com/reader/full/china-labour-statistical-yearbook-2004 337/464
4-11
DECREASE OF EMPLOYMENT IN URBAN UNITS BY REGION
(State-owned Units, 2003)
单位: 人 (person)
离休、退 开除、除 终止、解 不在岗 调 出
合 计 休、退职 名、辞退 除 合 同 职 工 #调到外省、 其 他
地 区 Region 自 治 区、
Retired Expelled Contract Not-on- Trans- 直 辖 市
Total and Expunged Closed post ferred Transferred Others
Resigned and or Staff and Out to Other
Dismissed Terminated Workers Regions
National 5897606 1167901 242545 1294012 916775 1206515 35173 1069858
北 京 Beijing 287147 49383 13475 92759 14791 57288 2149 59451
天 津 Tianjin 97231 18793 3985 9047 24081 28518 680 12807河 北 Hebei 201599 57331 13541 42684 33566 40274 2239 14203
山 西 Shanxi 140163 31400 6818 15881 44803 21547 752 19714
内蒙古 Inner Mongolia 124993 20642 8139 29655 14335 29814 800 22408
辽 宁 Liaoning 338648 57966 12565 104016 55234 70926 1090 37941
吉 林 Jilin 204802 41558 4963 51293 45409 22597 767 38982
黑龙江 Heilongjiang 422380 55256 5322 56424 80718 94025 1422 130635
上 海 Shanghai 326958 35492 2335 69762 54697 76339 403 88333
江 苏 Jiangsu 290883 60761 6991 80402 44142 51159 1033 47428
浙 江 Zhejiang 127719 25538 12580 22849 8268 38035 526 20449
安 徽 Anhui 180453 46037 6077 63712 22651 22251 1531 19725
福 建 Fujian 141336 26686 7933 40485 9048 35963 452 21221
江 西 Jiangxi 228075 42724 5321 47349 77619 27229 2259 27833
山 东 Shandong 319569 60527 26434 64029 47686 85005 1880 35888
河 南 Henan 223193 48606 6073 33751 50979 60504 1269 23280
湖 北 Hubei 187164 46144 8800 46205 37403 28016 1795 20596
湖 南 Hunan 261738 52793 4318 54031 52606 68750 3286 29240
广 东 Guangdong 293124 63083 16696 100570 25609 51474 1227 35692
广 西 Guangxi 141339 34475 6363 25674 23244 37369 549 14214
海 南 Hainan 45680 14601 3770 8119 3636 4889 325 10665
131353 34875 3662 38318 19288 28062 831 7148
重 庆 Chongqing
四 川 Sichuan 242779 54306 14826 63925 30626 53221 833 25875
贵 州 Guizhou 96363 25461 4016 20233 12072 25846 799 8735
云 南 Yunnan 193404 49696 11995 32757 20855 39730 223 38371
西 藏 Tibet 6624 2594 140 508 201 2710 86 471
陕 西 Shaanxi 150372 47333 7539 18167 31084 29724 821 16525
甘 肃 Gansu 89483 22330 5246 12258 16773 20615 813 12261
青 海 Qinghai 23768 4071 706 3781 1793 6456 1435 6961
宁 夏 Ningxia 30448 5619 2250 5911 1981 12097 167 2590
新 疆 Xinjiang 348818 31820 9666 39457 11577 36082 2731 220216

8/2/2019 China Labour Statistical Yearbook - 2004
http://slidepdf.com/reader/full/china-labour-statistical-yearbook-2004 338/464
5-1
EMPLOYMENT AND EARNINGS BY SECTOR
(Urban Collective-owned Units, 2003)
年末人数 劳动报酬 平均劳动
(千人) # 女 性
(千元) 报 酬
Year-end Earnings (元)
项 目 Item Figures Female Average
(1 000 (1 000 Earning
persons) yuan) (yuan)
National Total 9999 3839 86713557 8627
Grouped by Enterprises,Institutions
and Agencies
企业 Enterprises 8641 3197 72697327 8359
事业 Institutions 1319 630 13642399 10369
机关 Agencies and Organizations 38 12 373831 9662
Grouped by Sector
Agriculture,Forestry,Farming of Animals 141 45 861090 6127
and Fishing
农业 Agriculture 14 6 77611 5935
林业 Forestry 8 3 35127 4310
畜牧业 Farming of Animals 5 1 29021 6248
渔业 Fishing 4 1 28846 7112
农、林、牧、渔服务业 Service Activities for Agriculture, Forestry, 111 33 690485 6242
Farming of Animals and Fishing
Mining 277 111 1988963 7194煤炭开采和洗选业 Mining and Washing of Coal 193 83 1378212 7166
石油和天然气开采业 Extraction of Petroleum and Natural Gas 9 3 107377 11864
黑色金属矿采选业 Mining of Ferrous Metal Ores 20 8 130863 6348
有色金属矿采选业 Mining of Non-ferrous Metal Ores 23 8 172262 7484
非金属矿采选业 Mining and Processing of Nonmetal Ores 31 9 195958 6356
其他采矿业 Mining of Other Ores n.e.c 1 4291 7069
Manufacturing 2966 1408 22777584 7594
农副食品加工业 Processing of Food from Agricultural Products 49 21 332665 6801
食品制造业 Manufacture of Foods 49 24 309349 6126
饮料制造业 Manufacture of Beverage 31 14 193025 6374
烟草制品业 Manufacture of Tobacco 7 3 125033 18469
纺织业 Manufacture of Textile 220 140 1389331 6270
纺织服装、鞋、帽制造业 Manufacture of Textile Wearing Apparel, 166 116 1138920 6800
Footware,and Caps
皮革、毛皮、羽毛(绒)及其 Manufacture of Leather,Fur,Feather & Its Products
制品业 49 29 325083 6666
木材加工及木、竹、藤、棕、草 Processing of Timbers,Manufacture of Wood,
制品业 Bamboo,Rattan,Palm,and Straw Products 58 22 246639 4317
家具制造业 Manufacture of Furniture 38 15 215026 5626
造纸及纸制品业 Manufacture of Paper and Paper Products 65 32 449460 6847
印刷业和记录媒介的复制 Printing,Reproduction of Recording Media 101 56 747564 7254
文教体育用品制造业 Manufacture of Articles for Culture, 28 16 228046 7920
Education and Sport Activity
石油加工、炼焦及核燃料加工业 Processing of Petroleum ,Coking,Processing 42 19 400728 9790
of Nucleus Fuel
化工原料及化学制品制造业 Manufacture of Chemical Raw Material and 168 71 1438563 8468
Chemical Products
医药制造业 Manufacture of Medicines 48 23 414284 8654
化学纤维制造业 Manufacture of Chemical Fiber 9 5 92474 9741
橡胶制品业 Manufacture of Rubber 50 23 362867 7162
塑料制品业 Manufacture of Plastic 107 56 875362 8074
非金属矿物制品业 Manufacture of Non-metallic Mineral Products 247 93 1642175 6590
黑色金属冶炼及压延加工业 Manufacture and Processing of Ferrous Metals 134 53 1351874 9901
有色金属冶炼及压延加工业 Manufacture & Processing of Non-ferrous Metals 62 25 558491 8837
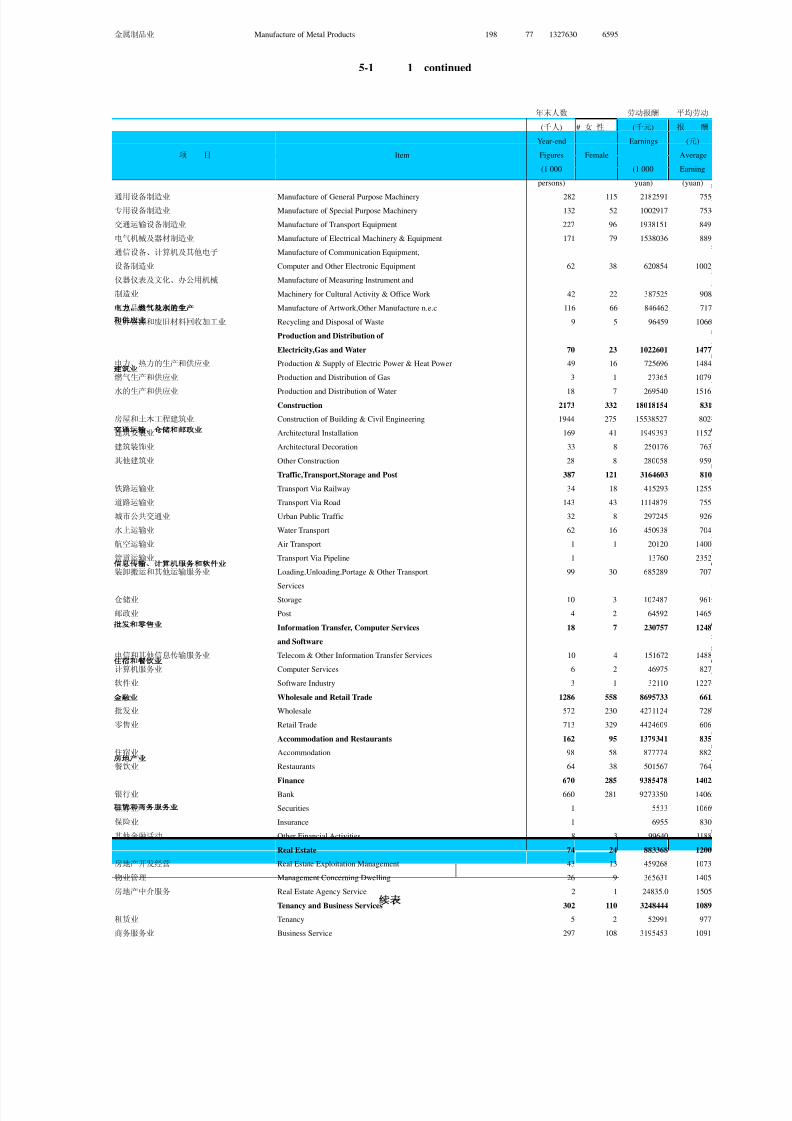
8/2/2019 China Labour Statistical Yearbook - 2004
http://slidepdf.com/reader/full/china-labour-statistical-yearbook-2004 339/464
金属制品业 Manufacture of Metal Products 198 77 1327630 6595
5-1 1 continued
年末人数 劳动报酬 平均劳动
(千人) # 女 性
(千元) 报 酬
Year-end Earnings (元)
项 目 Item Figures Female Average(1 000 (1 000 Earning
persons) yuan) (yuan)
通用设备制造业 Manufacture of General Purpose Machinery 282 115 2182591 755
专用设备制造业 Manufacture of Special Purpose Machinery 132 52 1002917 753
交通运输设备制造业 Manufacture of Transport Equipment 227 96 1938151 849
电气机械及器材制造业 Manufacture of Electrical Machinery & Equipment 171 79 1538036 889
通信设备、计算机及其他电子 Manufacture of Communication Equipment,
设备制造业 Computer and Other Electronic Equipment 62 38 620854 1002
仪器仪表及文化、办公用机械 Manufacture of Measuring Instrument and
制造业 Machinery for Cultural Activity & Office Work 42 22 387525 908
工艺品及其他制造业 Manufacture of Artwork,Other Manufacture n.e.c 116 66 846462 717
废弃资源和废旧材料回收加工业 Recycling and Disposal of Waste 9 5 96459 1066
Production and Distribution of
Electricity,Gas and Water 70 23 1022601 1477
电力、热力的生产和供应业 Production & Supply of Electric Power & Heat Power 49 16 725696 1484
燃气生产和供应业 Production and Distribution of Gas 3 1 27365 1079
水的生产和供应业 Production and Distribution of Water 18 7 269540 1516
Construction 2173 332 18018154 831
房屋和土木工程建筑业 Construction of Building & Civil Engineering 1944 275 15538527 802
建筑安装业 Architectural Installation 169 41 1949393 1152
建筑装饰业 Architectural Decoration 33 8 250176 763
其他建筑业 Other Construction 28 8 280058 959
Traffic,Transport,Storage and Post 387 121 3164603 810
铁路运输业 Transport Via Railway 34 18 415293 1255
道路运输业 Transport Via Road 143 43 1114879 755
城市公共交通业 Urban Public Traffic 32 8 297245 926
水上运输业 Water Transport 62 16 450938 704
航空运输业 Air Transport 1 1 20120 1400
管道运输业 Transport Via Pipeline 1 13760 2352
装卸搬运和其他运输服务业 Loading,Unloading,Portage & Other Transport 99 30 685289 707
Services
仓储业 Storage 10 3 102487 961
邮政业 Post 4 2 64592 1465
Information Transfer, Computer Services 18 7 230757 1248and Software
电信和其他信息传输服务业 Telecom & Other Information Transfer Services 10 4 151672 1488
计算机服务业 Computer Services 6 2 46975 827
软件业 Software Industry 3 1 32110 1227
Wholesale and Retail Trade 1286 558 8695733 661
批发业 Wholesale 572 230 4271124 728
零售业 Retail Trade 713 329 4424609 606
Accommodation and Restaurants 162 95 1379341 835
住宿业 Accommodation 98 58 877774 882
餐饮业 Restaurants 64 38 501567 764
Finance 670 285 9385478 1402
银行业 Bank 660 281 9273350 1406
证券业 Securities 1 5533 1066
保险业 Insurance 1 6955 830
其他金融活动 Other Financial Activities 8 3 99640 1188
Real Estate 74 24 883368 1200
房地产开发经营 Real Estate Exploitation Management 43 13 459268 1073
物业管理 Management Concerning Dwelling 26 9 365631 1405
房地产中介服务 Real Estate Agency Service 2 1 24835.0 1505
Tenancy and Business Services 302 110 3248444 1089
租赁业 Tenancy 5 2 52991 977
商务服务业 Business Service 297 108 3195453 1091

8/2/2019 China Labour Statistical Yearbook - 2004
http://slidepdf.com/reader/full/china-labour-statistical-yearbook-2004 340/464
5-1 2 continued
年末人数 劳动报酬 平均劳动
(千人) # 女 性
(千元) 报 酬
Year-end Earnings (元)
项 目 Item Figures Female Average
(1 000 (1 000 Earningpersons) yuan) (yuan)
Scientific Research,Technical Service
and Geologic Perambulation 48 14 623753 12962
研究与实验发展 Research and Experimental Development 3 1 31269 11702
# 自然科学研究与实验发展 Research and Experimental Development 1 5014 9478
on Physical Science
工程和技术研究与实验发展 Research and Experimental Development 1 15613 13684
on Engineering and Technical Research
农业科学研究与实验发展 Research and Experimental Development … 2778 10685
on Agricultural Science Research
医学研究与实验发展 Research and Experimental Development … 4997 12041
on Medical Research
社会人文科学研究与实验发展 Research and Experimental Development … 2867 8768
on Social Science and Humanities
专业技术服务业 Professional Technique Services 25 9 405463 15627
# 气象服务 Weather Services … 772 8674
地震服务 Earthquake Services … 226 5795
海洋服务 Ocean Services … 1063 14365
测绘服务 Plotting Services 1 11505 14186
技术检测 Technique Detection 4 1 47804 12910
环境监测 Environmental Monitoring 1 7547 13057
工程技术与规划管理 Engineering Technic & Programming Management 13 4 214457 15765
科技交流和推广服务业 Services of Science and Technique 18 4 163222 9340
Intercommunion and Generalization
地质勘查业 Geologic Perambulation 2 1 23799 11735
Management of Water Conservancy, 107 52 1062500 10030
Environment and Public Establishment
水利管理业 Management of Water Conservancy 10 2 102139 10459
环境管理业 Environmental Management 80 43 752929 9557
公共设施管理业 Management of Public Establishment 18 7 207432 11928
Resident Services and Other Services 152 74 1306846 8683
居民服务业 Resident Services 46 24 362342 7796
其他服务业 Other Services 105 50 944504 9078
Education 571 275 5301251 9330
#初等教育 Primary Education 417 196 3650548 8789
中等教育 Secondary Education 116 52 1187928 10347
高等教育 Higher Education 5 2 84831 18714
Sanitation,Social Security & Social Welfare 512 273 5944466 11610
卫生 Sanitation 503 268 5846747 11620
社会保障业 Social Security 2 1 37335 16254
社会福利业 Social Welfare 7 4 60384 9196
Culture, Sports and Entertainment 32 13 299144 9424
新闻出版业 Journalism and Publishing Activities 2 1 32118 16904
广播、电影、电视和音像业 Broadcasting,Movies,Television and 8 3 74909 9683
Audiovisual Activities
文化艺术业 Culture and Art 16 6 135423 8582
体育 Sports Activities … 4116 9376
娱乐业 Entertainment 6 3 52578 8928
Public Management & Social Organization 50 18 519481 10293
#中国共产党机关 Chinese Communist Party Organs
国家机构 Organ of State 35 10 354645 10230
人民政协和民主党派 People's Political Consultative Conference … … 80 5000
and democratic parties
群众社团、社会团体和宗教 Mass communities, social communities and
组织 religion organizations 9 4 101528 10606

8/2/2019 China Labour Statistical Yearbook - 2004
http://slidepdf.com/reader/full/china-labour-statistical-yearbook-2004 341/464
5-2
ON-POST STAFF AND WORKERS AND WAGES BY SECTOR
(Urban Collective-owned Units, 2003)
年末人数 工资总额 平均人数 平均工资
(千人) (千元) (千人) (元)
项 目 Item Year-end Total Average Average
Figures Wages Figures Wage
(1 000 (1 000 (1 000
persons) yuan) persons) (yuan)
National Total 9505 82937994 9558 8678
Grouped by Enterprises,Institutions
and Agencies
企业 Enterprises 8199 69352111 8255 8401
事业 Institutions 1268 13217663 1265 10448
机关 Agencies Organizations 37 368220 38 9742
Grouped by Sector
Agriculture,Forestry,Farming of Animals 139 847751 138 6125
and Fishing
农业 Agriculture 13 76856 13 5969
林业 Forestry 7 31482 8 4072
畜牧业 Farming of Animals 5 28480 5 6233
渔业 Fishing 4 27872 4 7172
农、林、牧、渔服务业 Service Activities for Agriculture, Forestry, 110 683061 109 6247
Farming of Animals and Fishing
Mining 270 1933574 269 7178
煤炭开采和洗选业 Mining and Washing of Coal 190 1353423 189 7150
石油和天然气开采业 Extraction of Petroleum and Natural Gas 7 91508 7 13017
黑色金属矿采选业 Mining of Ferrous Metal Ores 19 126744 20 6322
有色金属矿采选业 Mining of Non-ferrous Metal Ores 23 169979 23 7481
非金属矿采选业 Mining and Processing of Nonmetal Ores 30 188035 30 6314
其他采矿业 Mining of Other Ores n.e.c 1 3885 1 7400
Manufacturing 2874 22070804 2904 7600
农副食品加工业 Processing of Food from Agricultural Products 47 324034 47 6831
食品制造业 Manufacture of Foods 48 297015 49 6087
饮料制造业 Manufacture of Beverage 30 182423 29 6285
烟草制品业 Manufacture of Tobacco 7 124827 7 18559
纺织业 Manufacture of Textile 217 1369085 218 6280
纺织服装、鞋、帽制造业 Manufacture of Textile Wearing Apparel, 161 1110311 163 6801
Footware,and Caps
皮革、毛皮、羽毛(绒)及其 Manufacture of Leather,Fur,Feather & Its Produc
制品业 47 315008 47 6660
木材加工及木、竹、藤、棕、 Processing of Timbers,Manufacture of Wood,
草制品业 Bamboo,Rattan,Palm,and Straw Products 57 241389 56 4301
家具制造业 Manufacture of Furniture 37 207745 37 5587
造纸及纸制品业 Manufacture of Paper and Paper Products 63 439912 64 6903
印刷业和记录媒介的复制 Printing,Reproduction of Recording Media 97 722947 100 7266
文教体育用品制造业 Manufacture of Articles for Culture, 28 222546 28 7858
Education and Sport Activity
石油加工、炼焦及核燃料 Processing of Petroleum ,Coking,Processing
加工业 of Nucleus Fuel 42 398838 41 9823
化工原料及化学制品制造业 Manufacture of Chemical Raw Material and 161 1390791 163 8515
Chemical Products
医药制造业 Manufacture of Medicines 45 394569 46 8552
化学纤维制造业 Manufacture of Chemical Fiber 9 91165 9 9750
橡胶制品业 Manufacture of Rubber 49 355108 50 7155
塑料制品业 Manufacture of Plastic 104 851321 105 8078
非金属矿物制品业 Manufacture of Non-metallic Mineral Products 239 1596148 240 6645
黑色金属冶炼及压延加工业 Manufacture and Processing of Ferrous Metals 131 1328434 133 9952
有色金属冶炼及压延加工业 Manufacture & Processing of Non-ferrous Metal 60 542795 61 8955
金属制品业 Manufacture of Metal Products 192 1282857 195 6579
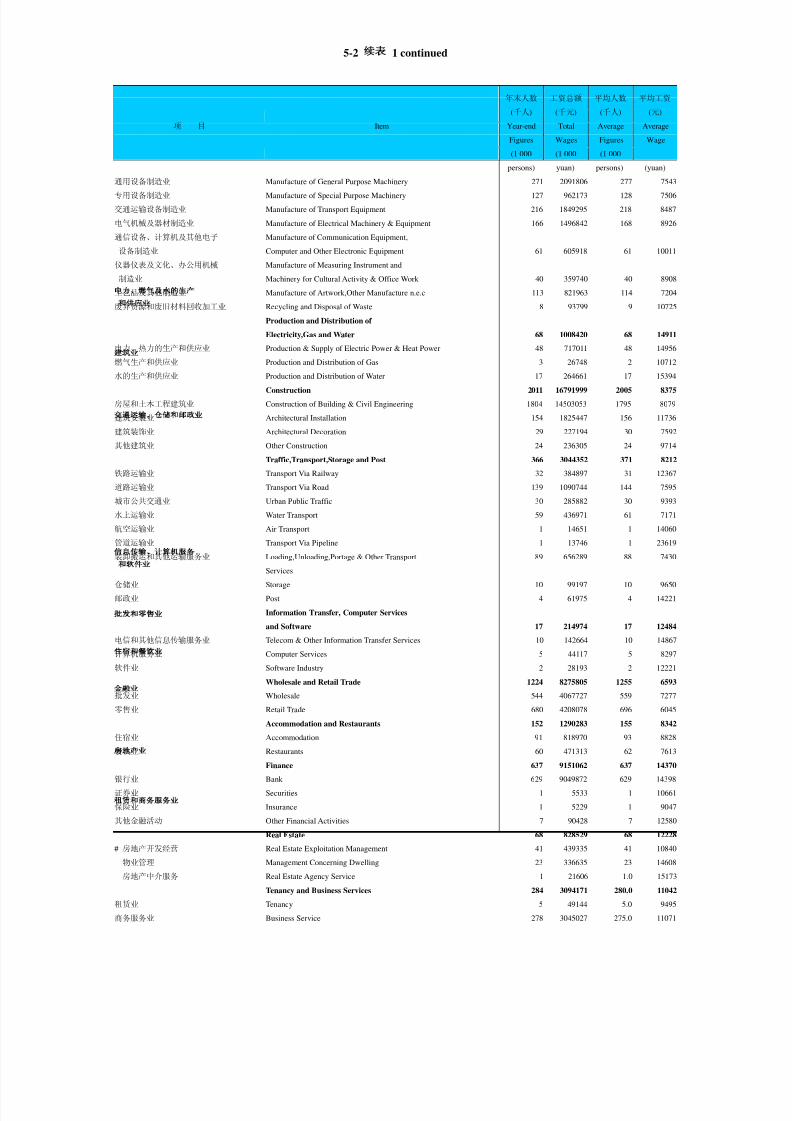
8/2/2019 China Labour Statistical Yearbook - 2004
http://slidepdf.com/reader/full/china-labour-statistical-yearbook-2004 342/464
5-2 1 continued
年末人数 工资总额 平均人数 平均工资
(千人) (千元) (千人) (元)
项 目 Item Year-end Total Average Average
Figures Wages Figures Wage
(1 000 (1 000 (1 000persons) yuan) persons) (yuan)
通用设备制造业 Manufacture of General Purpose Machinery 271 2091806 277 7543
专用设备制造业 Manufacture of Special Purpose Machinery 127 962173 128 7506
交通运输设备制造业 Manufacture of Transport Equipment 216 1849295 218 8487
电气机械及器材制造业 Manufacture of Electrical Machinery & Equipment 166 1496842 168 8926
通信设备、计算机及其他电子 Manufacture of Communication Equipment,
设备制造业 Computer and Other Electronic Equipment 61 605918 61 10011
仪器仪表及文化、办公用机械 Manufacture of Measuring Instrument and
制造业 Machinery for Cultural Activity & Office Work 40 359740 40 8908
工艺品及其他制造业 Manufacture of Artwork,Other Manufacture n.e.c 113 821963 114 7204
废弃资源和废旧材料回收加工业 Recycling and Disposal of Waste 8 93799 9 10725
Production and Distribution of
Electricity,Gas and Water 68 1008420 68 14911
电力、热力的生产和供应业 Production & Supply of Electric Power & Heat Power 48 717011 48 14956
燃气生产和供应业 Production and Distribution of Gas 3 26748 2 10712
水的生产和供应业 Production and Distribution of Water 17 264661 17 15394
Construction 2011 16791999 2005 8375
房屋和土木工程建筑业 Construction of Building & Civil Engineering 1804 14503053 1795 8079
建筑安装业 Architectural Installation 154 1825447 156 11736
建筑装饰业 Architectural Decoration 29 227194 30 7592
其他建筑业 Other Construction 24 236305 24 9714
Traffic,Transport,Storage and Post 366 3044352 371 8212
铁路运输业 Transport Via Railway 32 384897 31 12367
道路运输业 Transport Via Road 139 1090744 144 7595
城市公共交通业 Urban Public Traffic 30 285882 30 9393
水上运输业 Water Transport 59 436971 61 7171
航空运输业 Air Transport 1 14651 1 14060
管道运输业 Transport Via Pipeline 1 13746 1 23619
装卸搬运和其他运输服务业 Loading,Unloading,Portage & Other Transport 89 656289 88 7430
Services
仓储业 Storage 10 99197 10 9650
邮政业 Post 4 61975 4 14221
Information Transfer, Computer Services
and Software 17 214974 17 12484
电信和其他信息传输服务业 Telecom & Other Information Transfer Services 10 142664 10 14867
计算机服务业 Computer Services 5 44117 5 8297
软件业 Software Industry 2 28193 2 12221
Wholesale and Retail Trade 1224 8275805 1255 6593
批发业 Wholesale 544 4067727 559 7277
零售业 Retail Trade 680 4208078 696 6045
Accommodation and Restaurants 152 1290283 155 8342
住宿业 Accommodation 91 818970 93 8828
餐饮业 Restaurants 60 471313 62 7613
Finance 637 9151062 637 14370
银行业 Bank 629 9049872 629 14398
证券业 Securities 1 5533 1 10661
保险业 Insurance 1 5229 1 9047
其他金融活动 Other Financial Activities 7 90428 7 12580
Real Estate 68 828529 68 12228
# 房地产开发经营 Real Estate Exploitation Management 41 439335 41 10840
物业管理 Management Concerning Dwelling 23 336635 23 14608
房地产中介服务 Real Estate Agency Service 1 21606 1.0 15173
Tenancy and Business Services 284 3094171 280.0 11042
租赁业 Tenancy 5 49144 5.0 9495
商务服务业 Business Service 278 3045027 275.0 11071

8/2/2019 China Labour Statistical Yearbook - 2004
http://slidepdf.com/reader/full/china-labour-statistical-yearbook-2004 343/464
5-2 2 continued
年末人数 工资总额 平均人数 平均工资
(千人) (千元) (千人) (元)
项 目 Item Year-end Total Average Average
Figures Wages Figures Wage
(1 000 (1 000 (1 000
persons) yuan) persons) (yuan)
Scientific Research,Technical Service
and Geologic Perambulation 34 493006 34 14541
研究与实验发展 Research and Experimental Development 2 29093 2 12551
# 自然科学研究与实验发展 Research and Experimental Development … 4938 1 9533
on Physical Science
工程和技术研究与实验发展 Research and Experimental Development 1 13804 1 16375
on Engineering and Technical Research
农业科学研究与实验发展 Research and Experimental Development … 2760 … 10698
on Agricultural Science Research
医学研究与实验发展 Research and Experimental Development … 4879 … 12510
on Medical Research
社会人文科学研究与实验发展 Research and Experimental Development … 2712 … 8777
on Social Science and Humanities
专业技术服务业 Professional Technique Services 21 339793 22 15553
# 气象服务 Weather Services … 702 … 8667
地震服务 Earthquake Services … 150 … 6000
海洋服务 Ocean Services … 1063 … 14365
测绘服务 Plotting Services 1 10441 1 15724
技术检测 Technique Detection 3 45803 3 13090
环境监测 Environmental Monitoring 1 7066 1 13357
工程技术与规划管理 Engineering Technic & Programming Management 11 176239 12 15169
科技交流和推广服务业 Services of Science and Technique 8 103284 8 12962
Intercommunion and Generalization
地质勘查业 Geologic Perambulation 2 20836 2 11765
Management of Water Conservancy, 98 1004813 97 10380
Environment and Public Establishment
水利管理业 Management of Water Conservancy 10 101319 10 10534
环境管理业 Environmental Management 72 702205 71 9952
公共设施管理业 Management of Public Establishment 17 201289 17 12108
Resident Services and Other Services 140 1207426 139 8713
居民服务业 Resident Services 39 305729 39 7751
其他服务业 Other Services 101 901697 99 9097
Education 556 5147698 553 9308
#初等教育 Primary Education 411 3628724 410 8858
中等教育 Secondary Education 112 1128566 111 10166 高等教育 Higher Education 2 47825 2 20044
Sanitation,Social Security & Social Welfare 493 5763000 493 11685
卫生 Sanitation 485 5670543 485 11692
社会保障业 Social Security 2 36465 2 16750
社会福利业 Social Welfare 6 55992 6 9284
Culture, Sports and Entertainment 30 283153 30 9429
新闻出版业 Journalism and Publishing Activities 2 27811 2 17083
广播、电影、电视和音像业 Broadcasting,Movies,Television and 7 69661 7 9618
Audiovisual Activities
文化艺术业 Culture and Art 15 131487 15 8690
体育 Sports Activities … 3558 … 8985
娱乐业 Entertainment 6 50636 6 8991
Public Management & Social Organization 45 487174 45 10748
#中国共产党机关 Chinese Communist Party Organs
国家机构 Organ of State 33 347182 33 10582
人民政协和民主党派 People's Political Consultative Conference … 80 … 5000
and democratic parties
群众社团、社会团体和宗教 Mass communities, social communities and
组织 religion organizations 7 79765 7 11621

8/2/2019 China Labour Statistical Yearbook - 2004
http://slidepdf.com/reader/full/china-labour-statistical-yearbook-2004 344/464
5-3
(
EMPLOYMENT AND EARNINGS BY SECTOR AND REGION
(Urban Collective-owned Units, 2003)
总 计 企 业
Total Enterprise
年末人数 劳动报酬 平均劳动 年末人数 劳动报酬 平均劳动
地 区 Region (人) # 女 性
(千元) 报酬(元) (人) # 女 性
(千元) 报酬(元)
Year-end Earnings Average Year-end Earnings Average
Figures Female (1 000 Earning Figures Female (1 000 Earning
(person) yuan) (yuan) (person) yuan) (yuan)
National 9998670 3839441 86713557 8627 8641115 3196670 72697327 8359
北 京 Beijing 300511 89809 4081455 13776 278308 76795 3568305 13003
天 津 Tianjin 139577 53273 1548800 10865 133425 49890 1478707 10842
河 北 Hebei 429030 158474 3061884 6933 403191 145784 2880287 6928
山 西 Shanxi 389947 158469 2551172 6562 355128 140016 2311540 6535
内蒙古 Inner Mongolia 157765 73994 1174170 7605 140255 65645 1043610 7589
辽 宁 Liaoning 502531 217004 4005101 7574 478146 204370 3808193 7551
吉 林 Jilin 281768 137287 2288236 8002 263575 126914 2135060 7982
黑龙江 Heilongjiang 559449 209550 3084452 5446 548833 204469 2991460 5376
上 海 Shanghai 210692 89349 3242603 15173 170564 68099 2356547 13599
江 苏 Jiangsu 550881 232325 5542762 9733 439032 175613 4092838 8958
浙 江 Zhejiang 321752 116091 5023803 15779 261139 84701 3923099 15177
安 徽 Anhui 431920 164363 2787030 6358 374126 138584 2328738 6113
福 建 Fujian 244359 81723 2698245 11270 219211 70447 2387467 11142
江 西 Jiangxi 211040 74413 1434153 6808 196105 67434 1317681 6741
山 东 Shandong 756064 332137 6423667 8380 675446 292182 5621721 8197
河 南 Henan 1165043 484613 8981642 7828 641146 242534 4398346 7022
湖 北 Hubei 401235 151203 2833082 7097 363719 135667 2547481 7043
湖 南 Hunan 343783 117899 2884270 8407 302109 100212 2539121 8421
广 东 Guangdong 784681 284580 8489063 10823 744762 263689 7877465 10589
广 西 Guangxi 230405 74903 1747904 7681 222162 71119 1684623 7683
海 南 Hainan 40539 14732 286424 6994 34126 11498 222698 6439
重 庆 Chongqing 193543 65462 1642453 8527 169039 55671 1415214 8433
四 川 Sichuan 508789 155975 4369505 8647 429687 124641 3630695 8515
贵 州 Guizhou 144427 43701 1067803 7392 140585 41996 1036642 7370
云 南 Yunnan 159672 55224 1311918 8293 154828 52921 1265761 8254
西 藏 Tibet 5283 1604 40276 7753 5252 1592 40118 7769
陕 西 Shaanxi 248035 103100 1701085 6761 225615 93151 1523512 6648
甘 肃 Gansu 157816 51488 1170887 7417 149509 47731 1103668 7379
青 海 Qinghai 24650 10273 206744 8219 22192 8888 180117 7935
宁 夏 Ningxia 23301 8523 221235 8655 22573 8146 213078 8585
新 疆 Xinjiang 80182 27900 811733 9938 77327 26271 773535 9827
5-3 1 continued
非农企业 事 业
Nonagricultural Enterpriese Institutions
年末人数 劳动报酬 平均劳动 年末人数 劳动报酬 平均劳动
地 区 Region (人) # 女 性
(千元) 报酬(元) (人) # 女 性
(千元) 报酬(元)
Year-end Earnings Average Year-end Earnings Average
Figures Female (1 000 Earning Figures Female (1 000 Earning
(person) yuan) (yuan) (person) yuan) (yuan)
National 8500210 3151698 71836237 8396 1319370 630388 13642399 10369

8/2/2019 China Labour Statistical Yearbook - 2004
http://slidepdf.com/reader/full/china-labour-statistical-yearbook-2004 345/464
北 京 Beijing 276313 75897 3548710 13019 22203 13014 513150 23493
天 津 Tianjin 133323 49864 1477784 10844 6152 3383 70093 11375
河 北 Hebei 398356 144742 2856281 6951 25052 12443 174583 6955
山 西 Shanxi 352211 139205 2302276 6563 33341 18107 225602 6789
内蒙古 Inner Mongolia 136371 64342 1025332 7680 17278 8279 127458 7657
辽 宁 Liaoning 474938 203271 3780426 7546 24028 12545 192246 7964
吉 林 Jilin 261554 126056 2126661 8011 17454 10242 145513 8200
黑龙江 Heilongjiang 539367 200123 2970069 5421 9965 4902 84752 9155
上 海 Shanghai 168847 67692 2322988 13540 39088 20729 865073 21966
江 苏 Jiangsu 427266 171746 4012920 9025 109565 55939 1412646 12808
浙 江 Zhejiang 259188 84368 3881458 15130 60375 31321 1097279 18393
安 徽 Anhui 365825 134782 2291364 6143 56490 25322 444690 7932
福 建 Fujian 218732 70304 2383636 11149 24698 11203 305277 12374
江 西 Jiangxi 193823 66902 1303398 6751 13688 6686 106033 7613
山 东 Shandong 656591 285644 5517184 8269 75175 38333 758717 10096
河 南 Henan 620663 235647 4303052 7100 515799 238886 4518151 8810
湖 北 Hubei 356206 132962 2502582 7066 33437 14703 251696 7541湖 南 Hunan 295662 98890 2505903 8493 40937 17510 336648 8244
广 东 Guangdong 742702 263198 7857974 10593 39313 20590 600075 15105
广 西 Guangxi 221101 70766 1674971 7682 7714 3559 59943 7723
海 南 Hainan 33320 11200 219143 6486 5342 2743 56586 10683
重 庆 Chongqing 162836 54431 1367482 8462 24171 9728 223248 9131
四 川 Sichuan 416194 122104 3528539 8546 78099 31031 726507 9319
贵 州 Guizhou 140492 41982 1035922 7369 3416 1567 26676 7869
云 南 Yunnan 153757 52455 1259511 8271 3015 1697 29336 9785
西 藏 Tibet 5217 1580 39841 7765 27 11 152 5630
陕 西 Shaanxi 222021 92152 1502367 6660 21027 9590 163806 7759
甘 肃 Gansu 148395 47362 1094887 7375 7232 3531 58265 8067
青 海 Qinghai 21700 8674 173856 7829 1811 826 23441 13037
宁 夏 Ningxia 22524 8127 212640 8584 710 369 7914 10961
新 疆 Xinjiang 74715 25230 757080 9966 2768 1599 36843 12824
5-3 2 continued
机 关 农、林、牧、渔业
Agriculture Forestry,
Agencies and Organizations Farming of Animals and Fishing
年末人数 劳动报酬 平均劳动 年末人数 劳动报酬 平均劳动地 区 Region (人) # 女 性
(千元) 报酬(元) (人) # 女 性
(千元) 报酬(元)
Year-end Earnings Average Year-end Earnings Average
Figures Female (1 000 Earning Figures Female (1 000 Earning
(person) yuan) (yuan) (person) yuan) (yuan)
National 38185 12383 373831 9662 140905 44972 861090 6127
北 京 Beijing 1995 898 19595 10598
天 津 Tianjin 102 26 923 9049
河 北 Hebei 787 247 7014 8845 4835 1042 24006 5000
山 西 Shanxi 1478 346 14030 7629 2917 811 9264 3176
内蒙古 Inner Mongolia 232 70 3102 13144 3884 1303 18278 4566
辽 宁 Liaoning 357 89 4662 12808 3208 1099 27767 8299
吉 林 Jilin 739 131 7663 10327 2021 858 8399 4154
黑龙江 Heilongjiang 651 179 8240 12580 9466 4346 21391 2480
上 海 Shanghai 1040 521 20983 20254 1717 407 33559 19432
江 苏 Jiangsu 2284 773 37278 16264 11766 3867 79918 6513
浙 江 Zhejiang 238 69 3425 14451 1951 333 41641 21322
安 徽 Anhui 1304 457 13602 10399 8301 3802 37374 4705
福 建 Fujian 450 73 5501 12011 479 143 3831 7883
江 西 Jiangxi 1247 293 10439 8272 2282 532 14283 5917

8/2/2019 China Labour Statistical Yearbook - 2004
http://slidepdf.com/reader/full/china-labour-statistical-yearbook-2004 346/464
山 东 Shandong 5443 1622 43229 7820 18855 6538 104537 5603
河 南 Henan 8098 3193 65145 8054 20483 6887 95294 4686
湖 北 Hubei 4079 833 33905 8284 7513 2705 44899 5956
湖 南 Hunan 737 177 8501 11566 6447 1322 33218 5139
广 东 Guangdong 606 301 11523 18146 2060 491 19491 8941
广 西 Guangxi 529 225 3338 6181 1061 353 9652 7977
海 南 Hainan 1071 491 7140 6679 806 298 3555 4438
重 庆 Chongqing 333 63 3991 11704 6203 1240 47732 7659
四 川 Sichuan 1003 303 12303 12169 13493 2537 102156 7566
贵 州 Guizhou 426 138 4485 11129 93 14 720 7742
云 南 Yunnan 1829 606 16821 9122 1071 466 6250 5798
西 藏 Tibet 4 1 6 1500 35 12 277 8394
陕 西 Shaanxi 1393 359 13767 10305 3594 999 21145 5933
甘 肃 Gansu 1075 226 8954 8337 1114 369 8781 7947
青 海 Qinghai 647 559 3186 4857 492 214 6261 12752
宁 夏 Ningxia 18 8 243 12789 49 19 438 8939
新 疆 Xinjiang 87 30 1355 15056 2612 1041 16455 5979
5-3 4 continued
电力、燃气及水的生产和供应业 建 筑 业
Production and Distribution of
Electricity, Gas and Water Construction
年末人数 劳动报酬 平均劳动 年末人数 劳动报酬 平均劳动
地 区 Region (人) # 女 性
(千元) 报酬(元) (人) # 女 性
(千元) 报酬(元)
Year-end Earnings Average Year-end Earnings Average
Figures Female (1 000 Earning Figures Female (1 000 Earning
(person) yuan) (yuan) (person) yuan) (yuan)
National 69924 23347 1022601 14774 2172993 332491 18018154 8311
北 京 Beijing 152 57 1815 12020 108223 7294 1372613 13470
天 津 Tianjin 685 153 7313 11444 15314 3749 227039 14357
河 北 Hebei 546 212 3788 7120 91811 8282 696974 7090
山 西 Shanxi 5689 2123 65172 12076 42630 8005 253498 5734
内蒙古 Inner Mongolia 599 264 6796 13813 28128 9066 247231 8203
辽 宁 Liaoning 6610 2789 67888 10330 108848 35138 897392 7556
吉 林 Jilin 773 292 5263 8530 44281 16763 397699 8508
黑龙江 Heilongjiang 4128 1714 61161 14593 134405 34949 739616 5146
上 海 Shanghai 921 308 33536 35227 8740 1170 123354 14180
江 苏 Jiangsu 4540 1213 57768 12509 64268 9088 588551 9084
浙 江 Zhejiang 4330 856 78103 17860 91519 7146 1241126 13934
安 徽 Anhui 2324 832 16369 7161 101584 13359 626326 6261
福 建 Fujian 2116 554 47623 23299 85352 12386 1012402 12335
江 西 Jiangxi 458 188 3744 8175 77132 11979 510729 6900
山 东 Shandong 2633 791 22701 8688 114397 17865 934164 7923
河 南 Henan 1790 636 15908 8912 128479 16114 930340 7634
湖 北 Hubei 2485 784 24775 10026 81398 12376 583852 7345
湖 南 Hunan 2476 839 31257 12644 87864 12726 677639 7864
广 东 Guangdong 15709 4830 318232 20219 223385 22393 1991752 9151
广 西 Guangxi 1588 608 34203 21350 64508 8304 502229 7919
海 南 Hainan 107 43 485 4450 13018 2375 79121 5979
重 庆 Chongqing 1848 688 16577 8903 60518 8229 509672 8779
四 川 Sichuan 3312 1262 47686 14556 189223 23859 1385277 7558
贵 州 Guizhou 885 213 4797 5690 52107 8053 339506 6514
云 南 Yunnan 1343 439 21140 16593 32670 5167 240197 8072
西 藏 Tibet 771 160 9683 13138
陕 西 Shaanxi 47 20 229 4872 51819 9072 360232 6703
甘 肃 Gansu 772 251 6831 8848 41050 3648 250849 6301
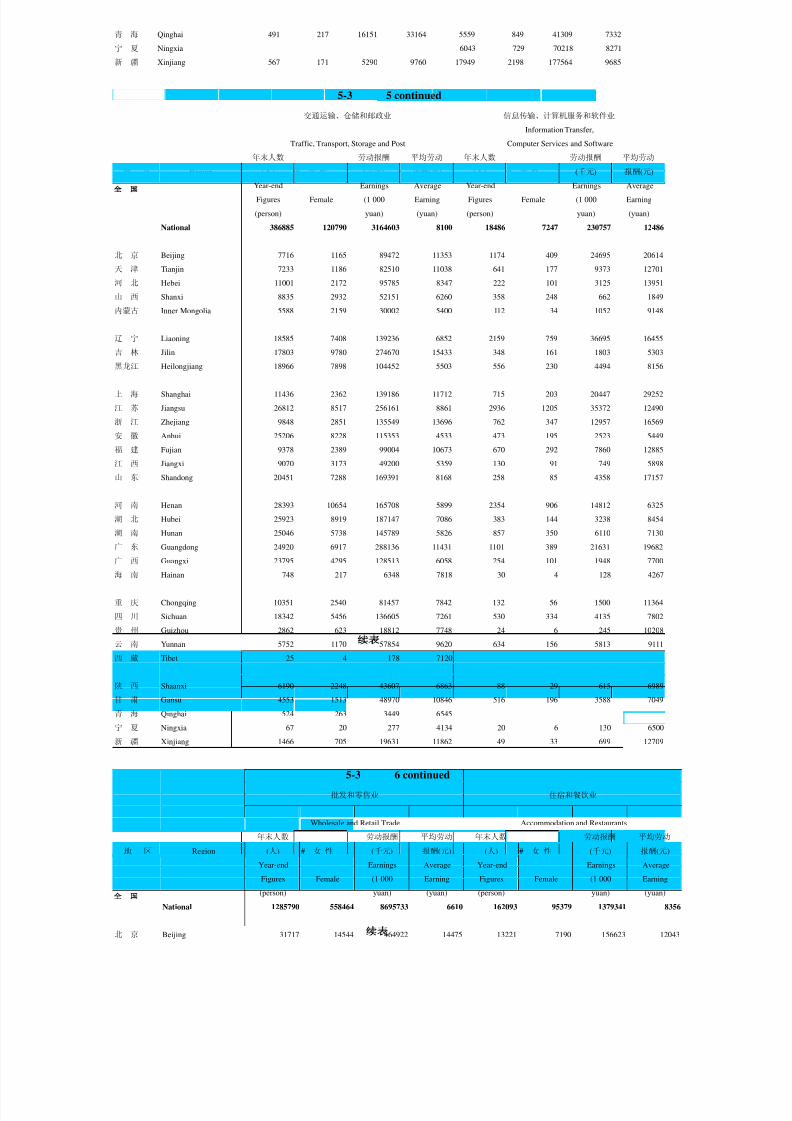
8/2/2019 China Labour Statistical Yearbook - 2004
http://slidepdf.com/reader/full/china-labour-statistical-yearbook-2004 347/464
青 海 Qinghai 491 217 16151 33164 5559 849 41309 7332
宁 夏 Ningxia 6043 729 70218 8271
新 疆 Xinjiang 567 171 5290 9760 17949 2198 177564 9685
5-3 5 continued
交通运输、仓储和邮政业 信息传输、计算机服务和软件业
Information Transfer,
Traffic, Transport, Storage and Post Computer Services and Software
年末人数 劳动报酬 平均劳动 年末人数 劳动报酬 平均劳动
地 区 Region (人) # 女 性
(千元) 报酬(元) (人) # 女 性
(千元) 报酬(元)
Year-end Earnings Average Year-end Earnings Average
Figures Female (1 000 Earning Figures Female (1 000 Earning
(person) yuan) (yuan) (person) yuan) (yuan)
National 386885 120790 3164603 8100 18486 7247 230757 12486
北 京 Beijing 7716 1165 89472 11353 1174 409 24695 20614
天 津 Tianjin 7233 1186 82510 11038 641 177 9373 12701
河 北 Hebei 11001 2172 95785 8347 222 101 3125 13951
山 西 Shanxi 8835 2932 52151 6260 358 248 662 1849
内蒙古 Inner Mongolia 5588 2159 30002 5400 112 34 1052 9148
辽 宁 Liaoning 18585 7408 139236 6852 2159 759 36695 16455
吉 林 Jilin 17803 9780 274670 15433 348 161 1803 5303
黑龙江 Heilongjiang 18966 7898 104452 5503 556 230 4494 8156
上 海 Shanghai 11436 2362 139186 11712 715 203 20447 29252
江 苏 Jiangsu 26812 8517 256161 8861 2936 1205 35372 12490
浙 江 Zhejiang 9848 2851 135549 13696 762 347 12957 16569
安 徽 Anhui 25206 8228 115353 4533 473 195 2523 5449
福 建 Fujian 9378 2389 99004 10673 670 292 7860 12885
江 西 Jiangxi 9070 3173 49200 5359 130 91 749 5898
山 东 Shandong 20451 7288 169391 8168 258 85 4358 17157
河 南 Henan 28393 10654 165708 5899 2354 906 14812 6325
湖 北 Hubei 25923 8919 187147 7086 383 144 3238 8454
湖 南 Hunan 25046 5738 145789 5826 857 350 6110 7130
广 东 Guangdong 24920 6917 288136 11431 1101 389 21631 19682
广 西 Guangxi 23795 4295 128513 6058 254 101 1948 7700
海 南 Hainan 748 217 6348 7818 30 4 128 4267
重 庆 Chongqing 10351 2540 81457 7842 132 56 1500 11364
四 川 Sichuan 18342 5456 136605 7261 530 334 4135 7802
贵 州 Guizhou 2862 623 18812 7748 24 6 245 10208
云 南 Yunnan 5752 1170 57854 9620 634 156 5813 9111
西 藏 Tibet 25 4 178 7120
陕 西 Shaanxi 6190 2248 43607 6863 88 29 615 6989
甘 肃 Gansu 4553 1513 48970 10846 516 196 3588 7049
青 海 Qinghai 524 263 3449 6545
宁 夏 Ningxia 67 20 277 4134 20 6 130 6500
新 疆 Xinjiang 1466 705 19631 11862 49 33 699 12709
5-3 6 continued
批发和零售业 住宿和餐饮业
Wholesale and Retail Trade Accommodation and Restaurants
年末人数 劳动报酬 平均劳动 年末人数 劳动报酬 平均劳动
地 区 Region (人) # 女 性
(千元) 报酬(元) (人) # 女 性
(千元) 报酬(元)
Year-end Earnings Average Year-end Earnings Average
Figures Female (1 000 Earning Figures Female (1 000 Earning
(person) yuan) (yuan) (person) yuan) (yuan)
National 1285790 558464 8695733 6610 162093 95379 1379341 8356
北 京 Beijing 31717 14544 464922 14475 13221 7190 156623 12043
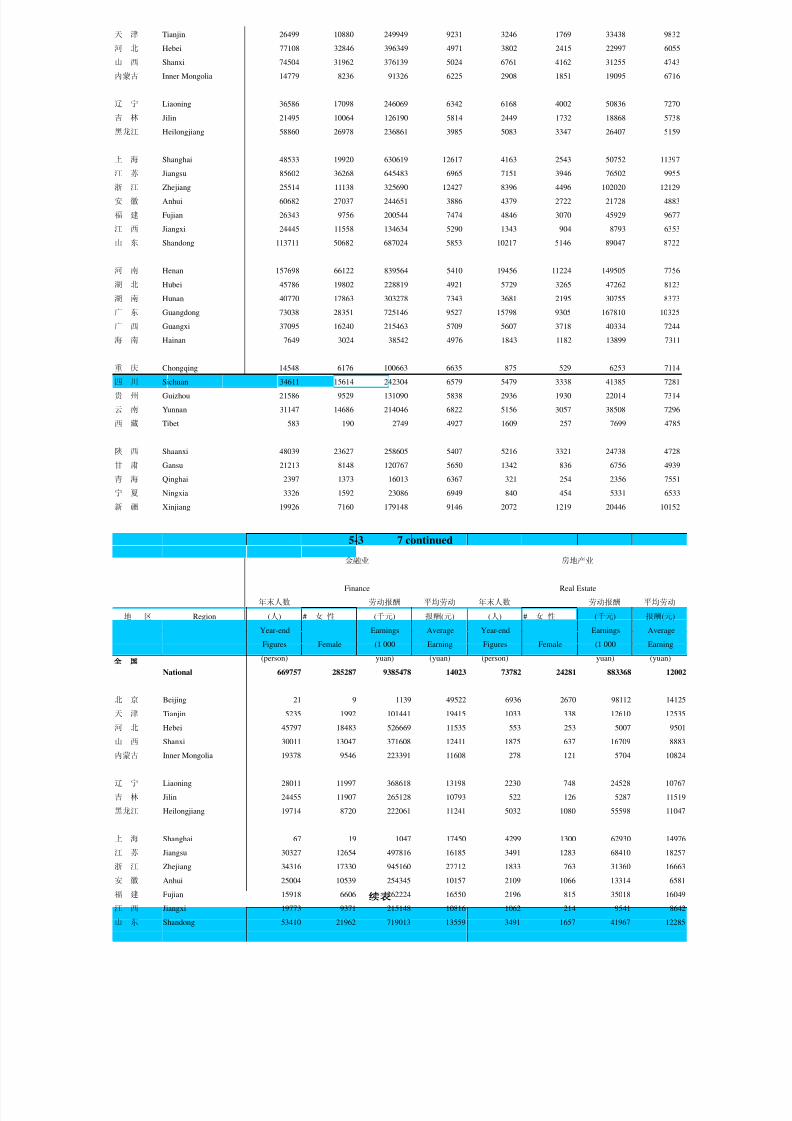
8/2/2019 China Labour Statistical Yearbook - 2004
http://slidepdf.com/reader/full/china-labour-statistical-yearbook-2004 348/464
天 津 Tianjin 26499 10880 249949 9231 3246 1769 33438 9832
河 北 Hebei 77108 32846 396349 4971 3802 2415 22997 6055
山 西 Shanxi 74504 31962 376139 5024 6761 4162 31255 4743
内蒙古 Inner Mongolia 14779 8236 91326 6225 2908 1851 19095 6716
辽 宁 Liaoning 36586 17098 246069 6342 6168 4002 50836 7270
吉 林 Jilin 21495 10064 126190 5814 2449 1732 18868 5738
黑龙江 Heilongjiang 58860 26978 236861 3985 5083 3347 26407 5159
上 海 Shanghai 48533 19920 630619 12617 4163 2543 50752 11397
江 苏 Jiangsu 85602 36268 645483 6965 7151 3946 76502 9955
浙 江 Zhejiang 25514 11138 325690 12427 8396 4496 102020 12129
安 徽 Anhui 60682 27037 244651 3886 4379 2722 21728 4883
福 建 Fujian 26343 9756 200544 7474 4846 3070 45929 9677
江 西 Jiangxi 24445 11558 134634 5290 1343 904 8793 6353
山 东 Shandong 113711 50682 687024 5853 10217 5146 89047 8722
河 南 Henan 157698 66122 839564 5410 19456 11224 149505 7756
湖 北 Hubei 45786 19802 228819 4921 5729 3265 47262 8123
湖 南 Hunan 40770 17863 303278 7343 3681 2195 30755 8373
广 东 Guangdong 73038 28351 725146 9527 15798 9305 167810 10325广 西 Guangxi 37095 16240 215463 5709 5607 3718 40334 7244
海 南 Hainan 7649 3024 38542 4976 1843 1182 13899 7311
重 庆 Chongqing 14548 6176 100663 6635 875 529 6253 7114
四 川 Sichuan 34611 15614 242304 6579 5479 3338 41385 7281
贵 州 Guizhou 21586 9529 131090 5838 2936 1930 22014 7314
云 南 Yunnan 31147 14686 214046 6822 5156 3057 38508 7296
西 藏 Tibet 583 190 2749 4927 1609 257 7699 4785
陕 西 Shaanxi 48039 23627 258605 5407 5216 3321 24738 4728
甘 肃 Gansu 21213 8148 120767 5650 1342 836 6756 4939
青 海 Qinghai 2397 1373 16013 6367 321 254 2356 7551
宁 夏 Ningxia 3326 1592 23086 6949 840 454 5331 6533
新 疆 Xinjiang 19926 7160 179148 9146 2072 1219 20446 10152
5-3 7 continued
金融业 房地产业
Finance Real Estate
年末人数 劳动报酬 平均劳动 年末人数 劳动报酬 平均劳动
地 区 Region (人) # 女 性
(千元) 报酬(元) (人) # 女 性
(千元) 报酬(元)
Year-end Earnings Average Year-end Earnings Average
Figures Female (1 000 Earning Figures Female (1 000 Earning
(person) yuan) (yuan) (person) yuan) (yuan)
National 669757 285287 9385478 14023 73782 24281 883368 12002
北 京 Beijing 21 9 1139 49522 6936 2670 98112 14125
天 津 Tianjin 5235 1992 101441 19415 1033 338 12610 12535
河 北 Hebei 45797 18483 526669 11535 553 253 5007 9501
山 西 Shanxi 30011 13047 371608 12411 1875 637 16709 8883
内蒙古 Inner Mongolia 19378 9546 223391 11608 278 121 5704 10824
辽 宁 Liaoning 28011 11997 368618 13198 2230 748 24528 10767
吉 林 Jilin 24455 11907 265128 10793 522 126 5287 11519
黑龙江 Heilongjiang 19714 8720 222061 11241 5032 1080 55598 11047
上 海 Shanghai 67 19 1047 17450 4299 1300 62930 14976
江 苏 Jiangsu 30327 12654 497816 16185 3491 1283 68410 18257
浙 江 Zhejiang 34316 17330 945160 27712 1833 763 31360 16663
安 徽 Anhui 25004 10539 254345 10157 2109 1066 13314 6581
福 建 Fujian 15918 6606 262224 16550 2196 815 35018 16049
江 西 Jiangxi 19773 9371 215148 10816 1062 214 9541 8642
山 东 Shandong 53410 21962 719013 13559 3491 1657 41967 12285

8/2/2019 China Labour Statistical Yearbook - 2004
http://slidepdf.com/reader/full/china-labour-statistical-yearbook-2004 349/464
河 南 Henan 57218 26408 636249 11193 4694 1217 41295 8845
湖 北 Hubei 24144 10952 248045 10248 3548 843 22209 6254
湖 南 Hunan 37174 16203 534486 14414 1660 651 14898 8900
广 东 Guangdong 56339 21834 1101485 19372 14688 4568 206683 14480
广 西 Guangxi 18665 6845 238961 12775 1567 552 15208 9786
海 南 Hainan 3153 1016 32164 9717 771 233 8499 10995
重 庆 Chongqing 8480 3598 138594 16386 1343 264 7938 5946
四 川 Sichuan 41466 17331 612450 14726 1966 698 20278 9892
贵 州 Guizhou 11458 4433 149999 13174 2448 669 21617 8992
云 南 Yunnan 16590 5240 199457 12043 769 286 7420 9854
西 藏 Tibet
陕 西 Shaanxi 18647 7258 205340 11014 1007 424 6635 6589
甘 肃 Gansu 10311 3787 113054 11127 1192 405 14653 12376
青 海 Qinghai 2853 1390 34332 12072 90 55 779 8467
宁 夏 Ningxia 3308 1483 52415 16671 235 21 1036 4177
新 疆 Xinjiang 8514 3327 113639 13485 864 324 8125 9884
5-3 8 continued
租赁和商务服务业 科学研究、技术服务和地质勘查业
Scientific Research,Technical Service
Tenancy and Business Services and Geologic Perambulation
年末人数 劳动报酬 平均劳动 年末人数 劳动报酬 平均劳动
地 区 Region (人) # 女 性
(千元) 报酬(元) (人) # 女 性
(千元) 报酬(元)
Year-end Earnings Average Year-end Earnings Average
Figures Female (1 000 Earning Figures Female (1 000 Earning
(person) yuan) (yuan) (person) yuan) (yuan)
National 302286 110387 3248444 10896 47927 14244 623753 12962
北 京 Beijing 13654 5355 210446 15255 8768 3160 163287 18649
天 津 Tianjin 5567 2211 80775 14284 1769 677 29446 16524
河 北 Hebei 9449 2471 68204 7167 359 140 4210 11826
山 西 Shanxi 9650 4046 65727 6668 1037 261 8071 7905
内蒙古 Inner Mongolia 5521 2206 35663 6608 207 90 2787 13464
辽 宁 Liaoning 22240 8139 223471 10405 2731 1053 33154 9806
吉 林 Jilin 3988 1934 36184 9055 1189 480 12516 10589
黑龙江 Heilongjiang 14131 5634 87739 6247 1688 747 16969 10023
上 海 Shanghai 41422 15788 638543 15734 1666 570 30846 18091
江 苏 Jiangsu 15855 6237 158621 10849 2912 991 45573 15991
浙 江 Zhejiang 14056 4080 273367 19657 2749 699 61522 22569
安 徽 Anhui 4938 1371 35536 7107 527 205 4215 7835
福 建 Fujian 5097 952 50198 10286 849 244 12873 15039
江 西 Jiangxi 1174 438 9443 7863 133 45 1230 9248
山 东 Shandong 21683 10466 178454 8274 921 297 12348 12822
河 南 Henan 21646 7430 180932 8491 2806 1045 33417 11999
湖 北 Hubei 8835 3720 82782 9266 1328 476 13962 10358
湖 南 Hunan 5599 2184 47072 8451 1497 320 11082 7220
广 东 Guangdong 31606 6142 430465 13860 2383 762 42164 17874
广 西 Guangxi 11206 4068 75017 6755 535 155 7884 14736
海 南 Hainan 682 218 6754 9540 42 10 538 12810
重 庆 Chongqing 1148 533 13309 11279 129 20 1648 12976
四 川 Sichuan 4374 1378 30381 7172 1059 313 15428 14921
贵 州 Guizhou 5350 1902 41447 7783 482 209 4088 8552
云 南 Yunnan 3900 968 30779 8134 8989 832 45557 5328
西 藏 Tibet
陕 西 Shaanxi 9998 7371 77547 7783 462 166 2506 5332
甘 肃 Gansu 2265 1339 13534 5809 333 111 2468 7411
青 海 Qinghai 1880 462 18820 10080
宁 夏 Ningxia 870 79 4861 6091 252 105 2497 9909

8/2/2019 China Labour Statistical Yearbook - 2004
http://slidepdf.com/reader/full/china-labour-statistical-yearbook-2004 350/464
新 疆 Xinjiang 4502 1265 42373 9471 125 61 1467 11831
5-3 9 continued
水利、环境和公共设施管理业 居民服务和其他服务业
Management of Water Conservancy,
Environment and Public Establishment Resident Services and Other Services
年末人数 劳动报酬 平均劳动 年末人数 劳动报酬 平均劳动
地 区 Region (人) # 女 性
(千元) 报酬(元) (人) # 女 性
(千元) 报酬(元)
Year-end Earnings Average Year-end Earnings Average
Figures Female (1 000 Earning Figures Female (1 000 Earning
(person) yuan) (yuan) (person) yuan) (yuan)
National 107413 51712 1062500 10030 151552 74090 1306846 8683
北 京 Beijing 1966 490 39807 18498 12020 3987 129479 11478
天 津 Tianjin 982 306 6622 6764 8687 4542 70888 10277
河 北 Hebei 1999 763 14419 7275 4644 2317 41967 8749
山 西 Shanxi 3106 2089 15370 5003 21681 13382 119844 5555
内蒙古 Inner Mongolia 2283 1193 8900 5463 3461 1968 17419 5080
辽 宁 Liaoning 3661 1560 31518 8574 5598 2553 40150 6705
吉 林 Jilin 5217 3504 44910 8566 3216 2045 52800 16490
黑龙江 Heilongjiang 2691 1433 25479 9557 22426 11072 100294 4470
上 海 Shanghai 3133 1423 49686 15879 8414 5274 106740 12599
江 苏 Jiangsu 17191 7841 176159 10273 6439 2854 105151 16197
浙 江 Zhejiang 13657 6176 181543 13668 1470 730 18023 12404
安 徽 Anhui 1879 870 14053 7559 5747 3490 35613 5808
福 建 Fujian 1701 827 25313 14846 2082 888 18436 8800
江 西 Jiangxi 3722 2319 22710 6213 2017 813 12451 6311
山 东 Shandong 3772 1724 30853 8151 3129 1276 25219 7837
河 南 Henan 1384 537 10697 7808 4433 2418 26344 5949
湖 北 Hubei 7033 3525 61610 8893 872 538 6545 7412
湖 南 Hunan 3705 1465 28083 7654 1636 763 14168 8587
广 东 Guangdong 13891 6401 161950 11599 5324 2200 65336 11755
广 西 Guangxi 1100 531 6783 6155 4216 1375 42770 10930
海 南 Hainan 444 295 2908 6550 31 12 229 7156
重 庆 Chongqing 1630 842 11917 7289 452 135 3852 8503
四 川 Sichuan 4783 1979 35613 8125 15559 5371 199312 12935
贵 州 Guizhou 3096 1821 24354 7905 836 305 5954 7165
云 南 Yunnan 1629 970 14732 9342 993 325 10868 11034
西 藏 Tibet 4 1 6 1500
陕 西 Shaanxi 512 215 4736 9250 4550 2548 27235 5191
甘 肃 Gansu 101 19 1146 10142 523 232 2307 4596
青 海 Qinghai 194 113 2667 13747 813 504 5408 6029
宁 夏 Ningxia 112 55 1473 12590 40 24 267 6675
新 疆 Xinjiang 839 426 6489 7307 239 148 1771 7349
5-3 10 continued
教育 卫生、社会保障和社会福利业
Sanitation,Social Security
Education and Social Welfare
年末人数 劳动报酬 平均劳动 年末人数 劳动报酬 平均劳动
地 区 Region (人) # 女 性
(千元) 报酬(元) (人) # 女 性
(千元) 报酬(元)
Year-end Earnings Average Year-end Earnings Average
Figures Female (1 000 Earning Figures Female (1 000 Earning
(person) yuan) (yuan) (person) yuan) (yuan)
National 571207 274574 5301251 9330 512159 272516 5944466 11610
北 京 Beijing 10030 5475 151221 15777 10551 7019 304734 29158
天 津 Tianjin 2769 2015 33747 12196 2325 1186 27841 12110
河 北 Hebei 720 537 7182 9838 15657 9237 112301 7159

8/2/2019 China Labour Statistical Yearbook - 2004
http://slidepdf.com/reader/full/china-labour-statistical-yearbook-2004 351/464
山 西 Shanxi 2623 1581 26146 9949 21192 12300 142164 6727
内蒙古 Inner Mongolia 320 200 3083 9314 13500 6888 106568 7885
辽 宁 Liaoning 2233 1764 18488 8181 14605 8335 98537 6659
吉 林 Jilin 637 382 7061 11016 10205 6141 85177 8331
黑龙江 Heilongjiang 1488 780 24838 16748 7052 4458 61995 8739
上 海 Shanghai 2022 1013 40476 19065 21600 13711 564079 26070
江 苏 Jiangsu 9657 6655 111729 11302 69656 38057 957495 13665
浙 江 Zhejiang 5459 3881 88472 16537 35640 19788 675019 19142
安 徽 Anhui 3030 915 30502 10083 45528 21806 349775 7757
福 建 Fujian 422 233 5260 12290 21457 9860 271957 12678
江 西 Jiangxi 46 39 324 6353 5936 3005 55229 8828
山 东 Shandong 7338 3595 68108 9253 54621 29880 565763 10387
河 南 Henan 496478 230716 4384666 8883 14437 7818 113343 7956
湖 北 Hubei 9534 4399 77681 8181 9031 4947 67566 7543
湖 南 Hunan 1307 613 15103 11799 26461 13362 222325 8421
广 东 Guangdong 6375 4876 104892 16361 11746 7557 195995 16589
广 西 Guangxi 1541 815 12289 8209 807 560 8239 10097
海 南 Hainan 485 213 5750 12864 4037 2181 44370 10999
重 庆 Chongqing 530 334 3804 7273 15952 7360 158450 9771
四 川 Sichuan 954 402 10321 10773 59917 26463 572771 9569
贵 州 Guizhou 2475 1260 34127 13828 1115 620 9936 8943
云 南 Yunnan 400 282 4293 10841 780 527 7033 8880
西 藏 Tibet
陕 西 Shaanxi 1794 1365 24729 13056 12426 6114 97757 7886
甘 肃 Gansu 4 2 54 13500 3671 1850 34371 9404
青 海 Qinghai 326 89 4139 12619 588 350 7880 13470
宁 夏 Ningxia 9 9 24 2667 363 222 3213 8975
新 疆 Xinjiang 201 134 2742 13642 1303 914 22583 16967
5-3 11 continued
文化体育和娱乐业 公共管理和社会组织
Public Management and
Culture, Sports and Entertainment Social Organization
年末人数 劳动报酬 平均劳动 年末人数 劳动报酬 平均劳动
地 区 Region (人) # 女 性
(千元) 报酬(元) (人) # 女 性
(千元) 报酬(元)
Year-end Earnings Average Year-end Earnings Average
Figures Female (1 000 Earning Figures Female (1 000 Earning
(person) yuan) (yuan) (person) yuan) (yuan)
National 32216 13458 299144 9424 49802 17928 519481 10293
北 京 Beijing 2214 989 23119 11647 1411 531 28945 20456
天 津 Tianjin 247 93 2543 9281 161 54 2559 15604
河 北 Hebei 2342 925 15644 6663 1523 422 15284 10062
山 西 Shanxi 2604 1068 10207 3970 1661 568 16723 10141
内蒙古 Inner Mongolia 89 55 605 6050 378 141 4740 12344
辽 宁 Liaoning 473 189 3590 7574 1074 844 7582 7060
吉 林 Jilin 622 270 7465 12238 762 174 9318 12196
黑龙江 Heilongjiang 276 127 3620 13507 843 230 9936 11648
上 海 Shanghai 1584 664 28077 17581 2706 1405 45272 16749
江 苏 Jiangsu 3467 1441 36278 10482 4760 1849 61489 12972
浙 江 Zhejiang 1256 635 25841 20444 667 214 11562 14204
安 徽 Anhui 1686 619 12716 7520 1817 592 19998 10970
福 建 Fujian 602 307 5077 8309 496 92 5814 11582
江 西 Jiangxi 31 18 161 5194 1626 425 12760 7738
山 东 Shandong 2255 791 23580 10411 1954 1061 20515 10361
河 南 Henan 3673 1583 19440 5447 5669 1681 43679 7738
湖 北 Hubei 411 188 3157 7681 8223 1951 56158 6806

8/2/2019 China Labour Statistical Yearbook - 2004
http://slidepdf.com/reader/full/china-labour-statistical-yearbook-2004 352/464
湖 南 Hunan 809 321 6536 8190 1883 671 18978 10127
广 东 Guangdong 2039 962 31465 15646 1469 785 24963 16856
广 西 Guangxi 82 45 718 9089 472 173 3656 7197
海 南 Hainan 181 94 1242 6862 1412 605 8766 6239
重 庆 Chongqing 292 93 2639 9260 380 86 4103 10630
四 川 Sichuan 635 290 5694 8205 1528 369 20868 13516
贵 州 Guizhou 402 173 5081 12831 860 235 10268 12023
云 南 Yunnan 274 113 2267 7457 941 241 11954 12895
西 藏 Tibet 21 77 3667
陕 西 Shaanxi 1670 688 8129 4868 2901 1405 25305 7613
甘 肃 Gansu 1866 662 13066 7866 1421 508 12682 8906
青 海 Qinghai 659 562 3289 4916
宁 夏 Ningxia 59 26 506 8576 75 27 1309 17224
新 疆 Xinjiang 54 29 604 10982 70 27 1006 14371

8/2/2019 China Labour Statistical Yearbook - 2004
http://slidepdf.com/reader/full/china-labour-statistical-yearbook-2004 353/464
5-4
(
ON-POST STAFF AND WORKERS AND WAGES BY SECTOR AND REGION
(Urban Collective-owned Units, 2003)
总 计 企 业
Total Enterprises
地 区 Region 年末人数 平均人数 工资总额 平均工资 年末人数 平均人数 工资总额 平均工资
(人) (人) (千元) (元) (人) (人) (千元) (元)
Year-end Average Total Average Year-end Average Total Average
Figures Figures Wages Wage Figures Figures Wages Wage
(1 000 (1 000
(person) (person) yuan) (yuan) (person) (person) yuan) (yuan)
National 9504688 9557772 82937994 8678 8199308 8254905 69352111 8401
北 京 Beijing 261090 257877 3502091 13580 244853 241781 3075040 12718
天 津 Tianjin 117720 121800 1374506 11285 113119 117197 1322881 11288
河 北 Hebei 410536 422414 2922639 6919 385204 397022 2743256 6910
山 西 Shanxi 374477 373390 2475272 6629 340690 339340 2239963 6601
内蒙古 Inner Mongolia 155160 151615 1155265 7620 137810 134919 1026335 7607
辽 宁 Liaoning 484982 509829 3889493 7629 462204 486873 3705180 7610
吉 林 Jilin 276273 280529 2249355 8018 258426 262379 2097680 7995
黑龙江 Heilongjiang 551968 553259 3001602 5425 541788 543747 2910944 5353
上 海 Shanghai 155365 159272 2703255 16973 121687 125229 1890848 15099
江 苏 Jiangsu 525760 544080 5351337 9836 420540 438010 3951409 9021
浙 江 Zhejiang 305290 303056 4866338 16058 248850 247278 3811906 15415
安 徽 Anhui 407031 413897 2651678 6407 351362 358602 2206172 6152
福 建 Fujian 231273 227230 2587297 11386 207187 203169 2283928 11242
江 西 Jiangxi 199592 199548 1377790 6905 185562 185209 1265026 6830
山 东 Shandong 740931 748923 6322442 8442 662230 670153 5533360 8257
河 南 Henan 1136771 1121225 8850983 7894 618757 606101 4285507 7071
湖 北 Hubei 382679 381186 2720508 7137 348617 347139 2451667 7062
湖 南 Hunan 312806 312822 2673261 8546 272490 272611 2340577 8586
广 东 Guangdong 770201 770751 8351667 10836 731558 731655 7753210 10597
广 西 Guangxi 201260 199011 1584584 7962 193711 191406 1524221 7963
海 南 Hainan 38900 39338 276498 7029 32749 33230 216155 6505
重 庆 Chongqing 189436 187143 1600494 8552 165327 162767 1376582 8457
四 川 Sichuan 487443 485179 4232058 8723 410539 408491 3511435 8596
贵 州 Guizhou 137101 137264 1029991 7504 133370 133556 999197 7481
云 南 Yunnan 146159 144915 1234469 8519 141432 140201 1189057 8481
西 藏 Tibet 3688 3639 34018 9348 3657 3608 33860 9385
陕 西 Shaanxi 232539 234958 1611302 6858 210655 213036 1436614 6744
甘 肃 Gansu 147074 147903 1120031 7573 139600 140441 1053200 7499
青 海 Qinghai 24026 24537 203805 8306 21655 22167 177653 8014
宁 夏 Ningxia 21627 23462 209370 8924 20910 22732 201324 8856
新 疆 Xinjiang 75530 77720 774595 9966 72769 74856 737924 9858
5-4 1 continued
非农企业 事 业
Nonagricultural Enterprises Institutions
地 区 Region 年末人数 平均人数 工资总额 平均工资 年末人数 平均人数 工资总额 平均工资
(人) (人) (千元) (元) (人) (人) (千元) (元)
Year-end Average Total Average Year-end Average Total Average
Figures Figures Wages Wage Figures Figures Wages Wage
(1 000 (1 000
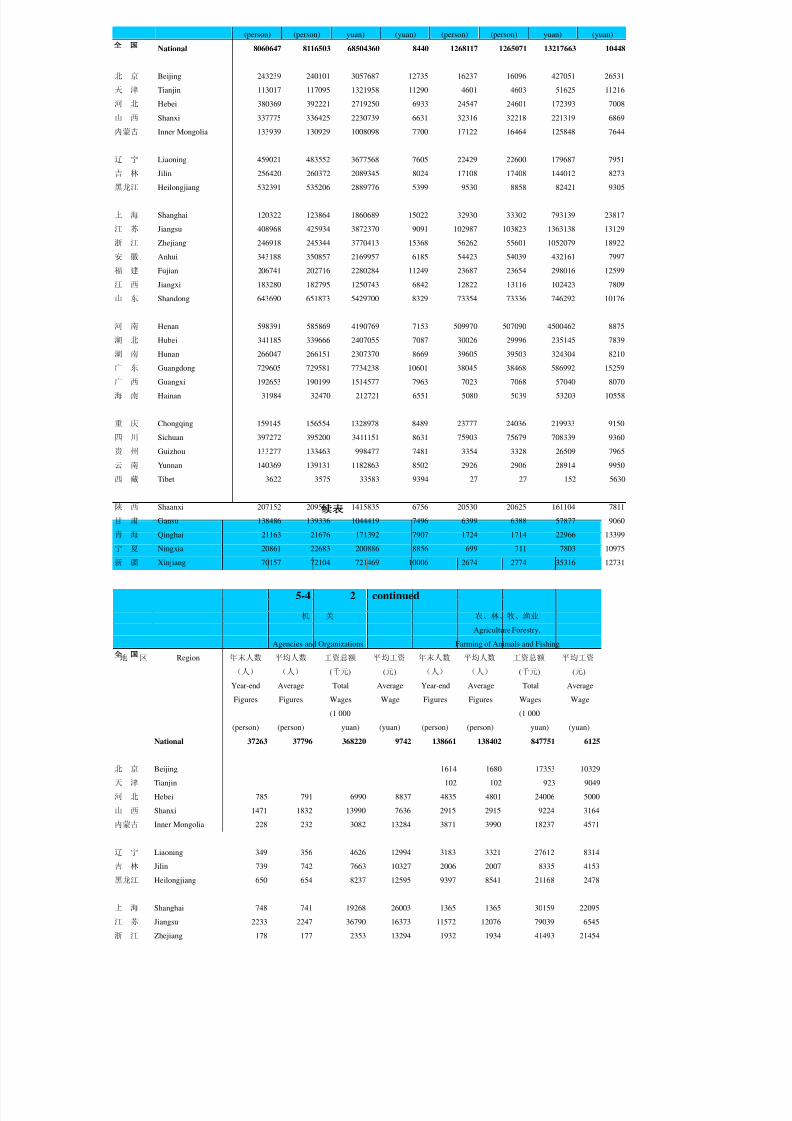
8/2/2019 China Labour Statistical Yearbook - 2004
http://slidepdf.com/reader/full/china-labour-statistical-yearbook-2004 354/464
(person) (person) yuan) (yuan) (person) (person) yuan) (yuan)
National 8060647 8116503 68504360 8440 1268117 1265071 13217663 10448
北 京 Beijing 243239 240101 3057687 12735 16237 16096 427051 26531
天 津 Tianjin 113017 117095 1321958 11290 4601 4603 51625 11216
河 北 Hebei 380369 392221 2719250 6933 24547 24601 172393 7008
山 西 Shanxi 337775 336425 2230739 6631 32316 32218 221319 6869
内蒙古 Inner Mongolia 133939 130929 1008098 7700 17122 16464 125848 7644
辽 宁 Liaoning 459021 483552 3677568 7605 22429 22600 179687 7951
吉 林 Jilin 256420 260372 2089345 8024 17108 17408 144012 8273
黑龙江 Heilongjiang 532391 535206 2889776 5399 9530 8858 82421 9305
上 海 Shanghai 120322 123864 1860689 15022 32930 33302 793139 23817
江 苏 Jiangsu 408968 425934 3872370 9091 102987 103823 1363138 13129
浙 江 Zhejiang 246918 245344 3770413 15368 56262 55601 1052079 18922
安 徽 Anhui 343188 350857 2169957 6185 54423 54039 432161 7997
福 建 Fujian 206741 202716 2280284 11249 23687 23654 298016 12599
江 西 Jiangxi 183280 182795 1250743 6842 12822 13116 102423 7809
山 东 Shandong 643690 651873 5429700 8329 73354 73336 746292 10176
河 南 Henan 598391 585869 4190769 7153 509970 507090 4500462 8875
湖 北 Hubei 341185 339666 2407055 7087 30026 29996 235145 7839
湖 南 Hunan 266047 266151 2307370 8669 39605 39503 324304 8210
广 东 Guangdong 729605 729581 7734238 10601 38045 38468 586992 15259
广 西 Guangxi 192653 190199 1514577 7963 7023 7068 57040 8070
海 南 Hainan 31984 32470 212721 6551 5080 5039 53203 10558
重 庆 Chongqing 159145 156554 1328978 8489 23777 24036 219933 9150
四 川 Sichuan 397272 395200 3411151 8631 75903 75679 708339 9360
贵 州 Guizhou 133277 133463 998477 7481 3354 3328 26509 7965
云 南 Yunnan 140369 139131 1182863 8502 2926 2906 28914 9950
西 藏 Tibet 3622 3575 33583 9394 27 27 152 5630
陕 西 Shaanxi 207152 209561 1415835 6756 20530 20625 161104 7811
甘 肃 Gansu 138486 139336 1044419 7496 6399 6388 57877 9060
青 海 Qinghai 21163 21676 171392 7907 1724 1714 22966 13399
宁 夏 Ningxia 20861 22683 200886 8856 699 711 7803 10975
新 疆 Xinjiang 70157 72104 721469 10006 2674 2774 35316 12731
5-4 2 continued
机 关 农、林、牧、渔业
Agriculture Forestry,
Agencies and Organizations Farming of Animals and Fishing
地 区 Region 年末人数 平均人数 工资总额 平均工资 年末人数 平均人数 工资总额 平均工资
(人) (人) (千元) (元) (人) (人) (千元) (元)
Year-end Average Total Average Year-end Average Total Average
Figures Figures Wages Wage Figures Figures Wages Wage
(1 000 (1 000
(person) (person) yuan) (yuan) (person) (person) yuan) (yuan)
National 37263 37796 368220 9742 138661 138402 847751 6125
北 京 Beijing 1614 1680 17353 10329
天 津 Tianjin 102 102 923 9049
河 北 Hebei 785 791 6990 8837 4835 4801 24006 5000
山 西 Shanxi 1471 1832 13990 7636 2915 2915 9224 3164
内蒙古 Inner Mongolia 228 232 3082 13284 3871 3990 18237 4571
辽 宁 Liaoning 349 356 4626 12994 3183 3321 27612 8314
吉 林 Jilin 739 742 7663 10327 2006 2007 8335 4153
黑龙江 Heilongjiang 650 654 8237 12595 9397 8541 21168 2478
上 海 Shanghai 748 741 19268 26003 1365 1365 30159 22095
江 苏 Jiangsu 2233 2247 36790 16373 11572 12076 79039 6545
浙 江 Zhejiang 178 177 2353 13294 1932 1934 41493 21454

8/2/2019 China Labour Statistical Yearbook - 2004
http://slidepdf.com/reader/full/china-labour-statistical-yearbook-2004 355/464
安 徽 Anhui 1246 1256 13345 10625 8174 7745 36215 4676
福 建 Fujian 399 407 5353 13152 446 453 3644 8044
江 西 Jiangxi 1208 1223 10341 8455 2282 2414 14283 5917
山 东 Shandong 5347 5434 42790 7874 18540 18280 103660 5671
河 南 Henan 8044 8034 65014 8092 20366 20232 94738 4683
湖 北 Hubei 4036 4051 33696 8318 7432 7473 44612 5970
湖 南 Hunan 711 708 8380 11836 6443 6460 33207 5140
广 东 Guangdong 598 628 11465 18256 1953 2074 18972 9148
广 西 Guangxi 526 537 3323 6188 1058 1207 9644 7990
海 南 Hainan 1071 1069 7140 6679 765 760 3434 4518
重 庆 Chongqing 332 340 3979 11703 6182 6213 47604 7662
四 川 Sichuan 1001 1009 12284 12174 13267 13291 100284 7545
贵 州 Guizhou 377 380 4285 11276 93 93 720 7742
云 南 Yunnan 1801 1808 16498 9125 1063 1070 6194 5789
西 藏 Tibet 4 4 6 1500 35 33 277 8394
陕 西 Shaanxi 1354 1297 13584 10473 3503 3475 20779 5980
甘 肃 Gansu 1075 1074 8954 8337 1114 1105 8781 7947
青 海 Qinghai 647 656 3186 4857 492 491 6261 12752宁 夏 Ningxia 18 19 243 12789 49 49 438 8939
新 疆 Xinjiang 87 90 1355 15056 2612 2752 16455 5979
5-4 3 continued
采矿业 制造业
Mining Manufacturing
地 区 Region 年末人数 平均人数 工资总额 平均工资 年末人数 平均人数 工资总额 平均工资
(人) (人) (千元) (元) (人) (人) (千元) (元)
Year-end Average Total Average Year-end Average Total Average
Figures Figures Wages Wage Figures Figures Wages Wage
(1 000 (1 000
(person) (person) yuan) (yuan) (person) (person) yuan) (yuan)
National 269701 269384 1933574 7178 2873579 2903992 22070804 7600
北 京 Beijing 1175 1151 13018 11310 61708 64609 703310 10886
天 津 Tianjin 2924 2809 37033 13184 46043 49236 465835 9461
河 北 Hebei 9209 8497 44123 5193 143434 147181 937259 6368
山 西 Shanxi 27885 26960 220956 8196 121189 120630 731350 6063
内蒙古 Inner Mongolia 12914 8038 51275 6379 42235 42519 293462 6902
辽 宁 Liaoning 17243 18073 115077 6367 212059 220867 1525555 6907
吉 林 Jilin 6962 7048 38304 5435 131619 132629 876508 6609
黑龙江 Heilongjiang 27440 28819 170365 5912 222132 218065 1092051 5008
上 海 Shanghai 3 3 28 9333 37624 39119 526449 13458
江 苏 Jiangsu 8429 8573 60023 7001 169163 176572 1478842 8375
浙 江 Zhejiang 307 337 4143 12294 65381 64760 743450 11480
安 徽 Anhui 50274 55287 397860 7196 82769 83539 531059 6357
福 建 Fujian 664 666 7945 11929 61927 60252 566914 9409
江 西 Jiangxi 3199 3248 18230 5613 54096 55173 342058 6200
山 东 Shandong 38283 38064 297832 7825 281828 285725 2411582 8440
河 南 Henan 8030 7813 56487 7230 182493 178906 1208446 6755
湖 北 Hubei 13890 13403 97626 7284 142211 141452 958743 6778
湖 南 Hunan 3889 3920 26529 6768 86730 87342 689065 7889
广 东 Guangdong 3022 3476 23995 6903 276757 277668 2528465 9106
广 西 Guangxi 3217 3170 23837 7520 50918 51482 368632 7160
海 南 Hainan 402 408 3541 8679 4619 4460 29135 6533
重 庆 Chongqing 2186 2338 11354 4856 64297 64306 501532 7799
四 川 Sichuan 8579 7831 51664 6597 100514 101321 818216 8075
贵 州 Guizhou 1888 1877 15158 8076 31796 31608 219755 6953
云 南 Yunnan 3146 3008 23750 7896 42243 43814 360897 8237

8/2/2019 China Labour Statistical Yearbook - 2004
http://slidepdf.com/reader/full/china-labour-statistical-yearbook-2004 356/464
西 藏 Tibet 29 29 238 8207 1953 1931 18265 9459
陕 西 Shaanxi 2832 2895 19524 6744 72187 72643 470623 6479
甘 肃 Gansu 9680 9531 85379 8958 52476 53632 408809 7622
青 海 Qinghai 413 484 3652 7545 6931 7113 39596 5567
宁 夏 Ningxia 212 260 1615 6212 7323 7333 51603 7037
新 疆 Xinjiang 1375 1368 13013 9512 16924 18105 173338 9574
5-4 4 continued
电力、燃气及水的生产和供应业 建 筑 业
Production and Distribution of
Electricity, Gas and Water Construction
地 区 Region 年末人数 平均人数 工资总额 平均工资 年末人数 平均人数 工资总额 平均工资
(人) (人) (千元) (元) (人) (人) (千元) (元)
Year-end Average Total Average Year-end Average Total Average
Figures Figures Wages Wage Figures Figures Wages Wage
(1 000 (1 000
(person) (person) yuan) (yuan) (person) (person) yuan) (yuan)
National 68303 67631 1008420 14911 2010667 2004936 16791999 8375
北 京 Beijing 123 120 1370 11417 98690 93336 1209786 12962
天 津 Tianjin 504 493 5877 11921 13005 14200 214403 15099
河 北 Hebei 546 532 3788 7120 83412 89064 640409 7190
山 西 Shanxi 5263 5161 61849 11984 38538 39413 227846 5781
内蒙古 Inner Mongolia 599 492 6796 13813 27448 29356 241221 8217
辽 宁 Liaoning 6496 6468 67330 10410 106034 115612 878098 7595
吉 林 Jilin 773 595 5210 8756 43336 45583 388410 8521
黑龙江 Heilongjiang 3959 4020 60274 14994 132034 136239 688597 5054
上 海 Shanghai 903 901 33304 36963 6196 6387 99692 15609
江 苏 Jiangsu 4513 4591 57588 12544 59590 59953 547538 9133
浙 江 Zhejiang 4172 4215 76313 18105 87173 85730 1215871 14183
安 徽 Anhui 2285 2250 16123 7166 88486 87572 555242 6340
福 建 Fujian 2064 1991 47185 23699 77281 75050 940069 12526
江 西 Jiangxi 449 449 3664 8160 71935 69122 484471 7009
山 东 Shandong 2600 2442 21457 8787 111830 113293 908286 8017
河 南 Henan 1744 1739 15640 8994 119637 114735 890505 7761
湖 北 Hubei 2472 2458 24710 10053 72428 70830 520994 7356
湖 南 Hunan 2401 2395 30696 12817 71745 70909 566582 7990
广 东 Guangdong 15630 15660 316767 20228 216571 211929 1939980 9154
广 西 Guangxi 1526 1538 33868 22021 50286 48063 397589 8272
海 南 Hainan 107 109 485 4450 12068 12299 75038 6101
重 庆 Chongqing 1835 1849 16368 8852 59752 56289 495444 8802
四 川 Sichuan 3291 3255 47586 14619 176352 171727 1303060 7588
贵 州 Guizhou 883 841 4791 5697 48203 48288 320476 6637
云 南 Yunnan 1335 1266 21106 16671 30909 27876 227785 8171
西 藏 Tibet 703 703 9139 13000
陕 西 Shaanxi 47 47 229 4872 46689 47859 323553 6761
甘 肃 Gansu 772 772 6831 8848 35478 35518 228145 6423
青 海 Qinghai 491 487 16151 33164 5264 5339 40284 7545
宁 夏 Ningxia 4795 6812 61462 9023
新 疆 Xinjiang 520 495 5064 10230 14799 15850 152024 9591

8/2/2019 China Labour Statistical Yearbook - 2004
http://slidepdf.com/reader/full/china-labour-statistical-yearbook-2004 357/464
5-4 5 continued
交通运输、仓储和邮政业 信息传输、计算机服务和软件业
Information Transfer,
Traffic, Transport, Storage and Post Computer Services and Software
地 区 Region 年末人数 平均人数 工资总额 平均工资 年末人数 平均人数 工资总额 平均工资
(人) (人) (千元) (元) (人) (人) (千元) (元)
Year-end Average Total Average Year-end Average Total Average
Figures Figures Wages Wage Figures Figures Wages Wage
(1 000 (1 000
(person) (person) yuan) (yuan) (person) (person) yuan) (yuan)
National 365735 370704 3044352 8212 17250 17220 214974 12484
北 京 Beijing 7082 7095 80371 11328 811 809 17812 22017
天 津 Tianjin 7006 7265 81062 11158 562 659 8917 13531
河 北 Hebei 10258 10736 79992 7451 194 193 2979 15435
山 西 Shanxi 8794 8288 52067 6282 301 301 610 2027
内蒙古 Inner Mongolia 5464 5437 28752 5288 112 115 1052 9148
辽 宁 Liaoning 17766 19494 134965 6923 2131 2199 36536 16615
吉 林 Jilin 17588 17558 268287 15280 347 339 1799 5307
黑龙江 Heilongjiang 18904 18920 104064 5500 385 389 3486 8961
上 海 Shanghai 9163 9576 114997 12009 616 611 19494 31905
江 苏 Jiangsu 26112 28099 252658 8992 2712 2608 31383 12033
浙 江 Zhejiang 9535 9583 132541 13831 683 703 11847 16852
安 徽 Anhui 24481 24652 111554 4525 455 445 2444 5492
福 建 Fujian 9066 8966 96051 10713 669 603 7769 12884
江 西 Jiangxi 8994 9084 48832 5376 130 121 741 6124
山 东 Shandong 19498 19781 164334 8308 258 254 4358 17157
河 南 Henan 27645 27388 163149 5957 2337 2325 14549 6258
湖 北 Hubei 25656 26128 185623 7104 381 381 3214 8436
湖 南 Hunan 23386 23318 137743 5907 834 834 6007 7203
广 东 Guangdong 24368 24652 284117 11525 1088 1086 21452 19753
广 西 Guangxi 15418 14440 114997 7964 239 238 1847 7761
海 南 Hainan 719 782 6056 7744 30 30 128 4267
重 庆 Chongqing 10253 10290 80257 7800 132 132 1500 11364
四 川 Sichuan 17960 18411 134980 7331 530 530 4135 7802
贵 州 Guizhou 2859 2423 18769 7746 24 24 245 10208
云 南 Yunnan 5293 5575 54266 9734 627 630 5757 9138
西 藏 Tibet 23 23 165 7174
陕 西 Shaanxi 5918 6061 42168 6957 88 88 615 6989
甘 肃 Gansu 4539 4501 48890 10862 505 498 3469 6966
青 海 Qinghai 524 527 3449 6545
宁 夏 Ningxia 67 67 277 4134 20 20 130 6500
新 疆 Xinjiang 1396 1584 18919 11944 49 55 699 12709
5-4 6 continued
批发和零售业 住宿和餐饮业
Wholesale and Retail Trade Accommodation and Restaurants
地 区 Region 年末人数 平均人数 工资总额 平均工资 年末人数 平均人数 工资总额 平均工资
(人) (人) (千元) (元) (人) (人) (千元) (元)
Year-end Average Total Average Year-end Average Total Average
Figures Figures Wages Wage Figures Figures Wages Wage
(1 000 (1 000
(person) (person) yuan) (yuan) (person) (person) yuan) (yuan)
National 1224214 1255154 8275805 6593 151699 154673 1290283 8342
北 京 Beijing 26629 27267 401741 14734 10705 10453 120497 11528
天 津 Tianjin 20618 21609 208233 9636 2479 2632 25986 9873
河 北 Hebei 76444 79045 393123 4973 3748 3740 22604 6044

8/2/2019 China Labour Statistical Yearbook - 2004
http://slidepdf.com/reader/full/china-labour-statistical-yearbook-2004 358/464
山 西 Shanxi 72165 72467 371848 5131 6626 6486 30822 4752
内蒙古 Inner Mongolia 14736 14629 91053 6224 2885 2820 18954 6721
辽 宁 Liaoning 34631 36962 233248 6310 5902 6737 48713 7231
吉 林 Jilin 21404 21612 125680 5815 2381 3220 18727 5816
黑龙江 Heilongjiang 58508 59093 235180 3980 5026 5062 26281 5192
上 海 Shanghai 29661 31352 476023 15183 3365 3636 43379 11930
江 苏 Jiangsu 82839 90113 631241 7005 6417 6945 69212 9966
浙 江 Zhejiang 23532 24220 305285 12605 7798 7900 95889 12138
安 徽 Anhui 59388 61725 240642 3899 4221 4290 20923 4877
福 建 Fujian 25669 26115 196335 7518 4520 4425 43901 9921
江 西 Jiangxi 24219 25233 132744 5261 1342 1383 8789 6355
山 东 Shandong 111321 114887 676244 5886 10060 10024 88273 8806
河 南 Henan 153137 150896 826421 5477 19119 18923 147889 7815
湖 北 Hubei 44432 45143 224010 4962 5576 5686 46417 8163
湖 南 Hunan 38621 39158 288299 7362 3381 3367 28787 8550
广 东 Guangdong 71459 74418 711864 9566 15716 16171 167301 10346
广 西 Guangxi 35401 36021 208136 5778 5072 5043 36577 7253
海 南 Hainan 7481 7580 37819 4989 1790 1848 13822 7479
重 庆 Chongqing 14270 14886 99204 6664 870 873 6207 7110
四 川 Sichuan 33356 35579 234837 6600 5384 5587 40722 7289
贵 州 Guizhou 20883 21733 127797 5880 2919 2993 21896 7316
云 南 Yunnan 30465 30677 208096 6783 4883 5003 36785 7353
西 藏 Tibet 578 553 2713 4906 342 342 3138 9175
陕 西 Shaanxi 46606 46388 253789 5471 4695 4710 23248 4936
甘 肃 Gansu 20735 20849 118956 5706 1255 1282 6494 5066
青 海 Qinghai 2386 2504 15921 6358 321 312 2356 7551
宁 夏 Ningxia 3277 3283 22906 6977 840 776 5295 6823
新 疆 Xinjiang 19363 19157 176417 9209 2061 2004 20399 10179
5-4 7 continued
金融业 房地产业
Finance Real Estate
地 区 Region 年末人数 平均人数 工资总额 平均工资 年末人数 平均人数 工资总额 平均工资
(人) (人) (千元) (元) (人) (人) (千元) (元)
Year-end Average Total Average Year-end Average Total Average
Figures Figures Wages Wage Figures Figures Wages Wage
(1 000 (1 000
(person) (person) yuan) (yuan) (person) (person) yuan) (yuan)
National 637326 636818 9151062 14370 67933 67759 828529 12228
北 京 Beijing 21 23 1139 49522 5999 6037 86372 14307
天 津 Tianjin 4663 4659 97534 20935 750 738 10523 14259
河 北 Hebei 42563 42494 497381 11705 460 443 4622 10433
山 西 Shanxi 26677 26610 354293 13314 1848 1820 16520 9077
内蒙古 Inner Mongolia 19146 19012 221729 11663 273 522 5665 10852
辽 宁 Liaoning 27745 27673 366645 13249 1976 2097 23631 11269
吉 林 Jilin 24285 24394 263821 10815 509 446 5198 11655
黑龙江 Heilongjiang 19380 19381 219002 11300 4951 4914 54895 11171
上 海 Shanghai 41 38 805 21184 2447 2349 44885 19108
江 苏 Jiangsu 28402 28840 479151 16614 3332 3579 67191 18774
浙 江 Zhejiang 33713 33495 939145 28038 1557 1565 28520 18224
安 徽 Anhui 22290 22261 241170 10834 2060 1972 12981 6583
福 建 Fujian 15641 15566 259938 16699 2105 2085 33497 16066
江 西 Jiangxi 18184 18240 204916 11234 1057 1088 9456 8691
山 东 Shandong 49328 48942 693036 14160 3473 3401 41770 12282
河 南 Henan 53444 52991 599656 11316 4635 4615 41098 8905

8/2/2019 China Labour Statistical Yearbook - 2004
http://slidepdf.com/reader/full/china-labour-statistical-yearbook-2004 359/464
湖 北 Hubei 23573 23631 244354 10340 3154 3160 20782 6577
湖 南 Hunan 32613 32494 501694 15440 1611 1626 14617 8990
广 东 Guangdong 56255 56777 1100663 19386 14137 13767 200046 14531
广 西 Guangxi 18559 18609 237165 12745 1468 1457 14068 9655
海 南 Hainan 3132 3289 31937 9710 748 750 8146 10861
重 庆 Chongqing 8302 8347 137450 16467 1259 1251 7492 5989
四 川 Sichuan 39922 40050 604672 15098 1895 1923 19198 9983
贵 州 Guizhou 11183 11135 147944 13286 2263 2242 20356 9079
云 南 Yunnan 16437 16413 198637 12102 642 626 6125 9784
西 藏 Tibet
陕 西 Shaanxi 17312 17283 197058 11402 1005 1005 6605 6572
甘 肃 Gansu 10166 10042 112200 11173 1149 1137 14470 12726
青 海 Qinghai 2799 2790 33789 12111 90 92 779 8467
宁 夏 Ningxia 3066 2942 50692 17230 235 248 1036 4177
新 疆 Xinjiang 8484 8397 113446 13510 845 804 7985 9932
5-4 8 continued
租赁和商务服务业 科学研究、技术服务和地质勘查业
Scientific Research,Technical Service
Tenancy and Business Services and Geologic Perambulation
地 区 Region 年末人数 平均人数 工资总额 平均工资 年末人数 平均人数 工资总额 平均工资
(人) (人) (千元) (元) (人) (人) (千元) (元)
Year-end Average Total Average Year-end Average Total Average
Figures Figures Wages Wage Figures Figures Wages Wage
(1 000 (1 000
(person) (person) yuan) (yuan) (person) (person) yuan) (yuan)
National 283639 280229 3094171 11042 33566 33905 493006 14541
北 京 Beijing 12056 12186 189540 15554 5672 5536 108096 19526
天 津 Tianjin 5128 5232 77308 14776 1500 1510 24657 16329
河 北 Hebei 9385 9461 67864 7173 341 337 4161 12347
山 西 Shanxi 9209 9532 63908 6705 930 917 7178 7828
内蒙古 Inner Mongolia 5516 5391 35627 6609 186 186 2612 14043
辽 宁 Liaoning 21721 20959 219779 10486 2294 2949 29249 9918
吉 林 Jilin 3968 3977 36069 9069 981 973 9875 10149
黑龙江 Heilongjiang 13934 13905 87108 6265 1628 1632 16275 9972
上 海 Shanghai 31638 31204 547436 17544 1223 1257 24936 19838
江 苏 Jiangsu 15350 14121 155727 11028 2638 2586 43566 16847
浙 江 Zhejiang 13422 13287 265234 19962 2499 2486 55665 22391
安 徽 Anhui 4077 4111 31444 7649 407 418 3651 8734
福 建 Fujian 4838 4647 48859 10514 686 693 11509 16608
江 西 Jiangxi 1163 1190 9418 7914 133 133 1230 9248
山 东 Shandong 21596 21474 177694 8275 914 954 12224 12813
河 南 Henan 21406 21057 178879 8495 2694 2676 32214 12038
湖 北 Hubei 8356 8452 78859 9330 1237 1257 13441 10693
湖 南 Hunan 5454 5436 45997 8462 1474 1473 10973 7449
广 东 Guangdong 31449 30899 428751 13876 2284 2252 38732 17199
广 西 Guangxi 10715 10596 73165 6905 511 511 7804 15272
海 南 Hainan 678 704 6711 9533 42 42 538 12810
重 庆 Chongqing 1129 1162 13221 11378 127 125 1630 13040
四 川 Sichuan 4014 4024 29772 7399 1014 916 14614 15954
贵 州 Guizhou 5233 5192 40801 7858 472 468 3998 8543
云 南 Yunnan 3783 3661 29600 8085 534 526 5529 10511
西 藏 Tibet
陕 西 Shaanxi 9748 9744 76203 7821 453 401 2416 6025
甘 肃 Gansu 1473 1539 13355 8678 325 325 2407 7406
青 海 Qinghai 1880 1867 18820 10080
宁 夏 Ningxia 869 797 4860 6098 252 252 2497 9909
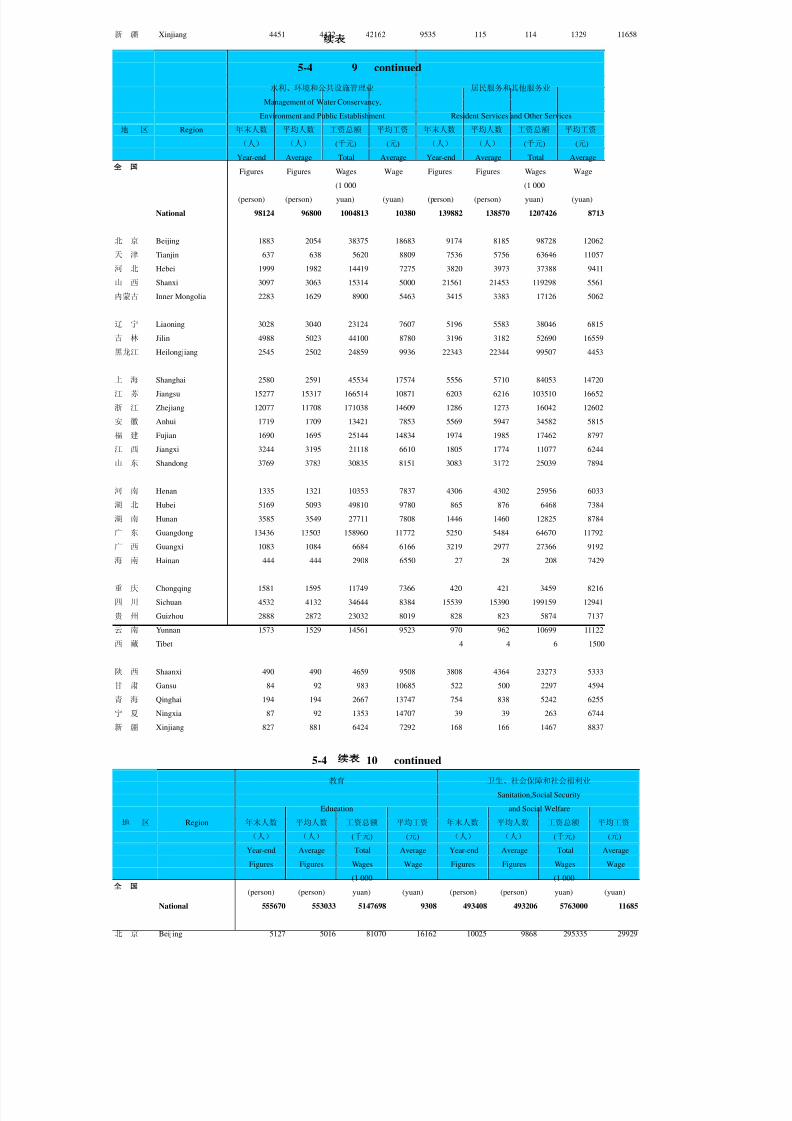
8/2/2019 China Labour Statistical Yearbook - 2004
http://slidepdf.com/reader/full/china-labour-statistical-yearbook-2004 360/464
新 疆 Xinjiang 4451 4422 42162 9535 115 114 1329 11658
5-4 9 continued
水利、环境和公共设施管理业 居民服务和其他服务业
Management of Water Conservancy,
Environment and Public Establishment Resident Services and Other Services
地 区 Region 年末人数 平均人数 工资总额 平均工资 年末人数 平均人数 工资总额 平均工资
(人) (人) (千元) (元) (人) (人) (千元) (元)
Year-end Average Total Average Year-end Average Total Average
Figures Figures Wages Wage Figures Figures Wages Wage
(1 000 (1 000
(person) (person) yuan) (yuan) (person) (person) yuan) (yuan)
National 98124 96800 1004813 10380 139882 138570 1207426 8713
北 京 Beijing 1883 2054 38375 18683 9174 8185 98728 12062
天 津 Tianjin 637 638 5620 8809 7536 5756 63646 11057
河 北 Hebei 1999 1982 14419 7275 3820 3973 37388 9411
山 西 Shanxi 3097 3063 15314 5000 21561 21453 119298 5561
内蒙古 Inner Mongolia 2283 1629 8900 5463 3415 3383 17126 5062
辽 宁 Liaoning 3028 3040 23124 7607 5196 5583 38046 6815
吉 林 Jilin 4988 5023 44100 8780 3196 3182 52690 16559
黑龙江 Heilongjiang 2545 2502 24859 9936 22343 22344 99507 4453
上 海 Shanghai 2580 2591 45534 17574 5556 5710 84053 14720
江 苏 Jiangsu 15277 15317 166514 10871 6203 6216 103510 16652
浙 江 Zhejiang 12077 11708 171038 14609 1286 1273 16042 12602
安 徽 Anhui 1719 1709 13421 7853 5569 5947 34582 5815
福 建 Fujian 1690 1695 25144 14834 1974 1985 17462 8797
江 西 Jiangxi 3244 3195 21118 6610 1805 1774 11077 6244
山 东 Shandong 3769 3783 30835 8151 3083 3172 25039 7894
河 南 Henan 1335 1321 10353 7837 4306 4302 25956 6033
湖 北 Hubei 5169 5093 49810 9780 865 876 6468 7384
湖 南 Hunan 3585 3549 27711 7808 1446 1460 12825 8784
广 东 Guangdong 13436 13503 158960 11772 5250 5484 64670 11792
广 西 Guangxi 1083 1084 6684 6166 3219 2977 27366 9192
海 南 Hainan 444 444 2908 6550 27 28 208 7429
重 庆 Chongqing 1581 1595 11749 7366 420 421 3459 8216
四 川 Sichuan 4532 4132 34644 8384 15539 15390 199159 12941
贵 州 Guizhou 2888 2872 23032 8019 828 823 5874 7137
云 南 Yunnan 1573 1529 14561 9523 970 962 10699 11122
西 藏 Tibet 4 4 6 1500
陕 西 Shaanxi 490 490 4659 9508 3808 4364 23273 5333
甘 肃 Gansu 84 92 983 10685 522 500 2297 4594
青 海 Qinghai 194 194 2667 13747 754 838 5242 6255
宁 夏 Ningxia 87 92 1353 14707 39 39 263 6744
新 疆 Xinjiang 827 881 6424 7292 168 166 1467 8837
5-4 10 continued
教育 卫生、社会保障和社会福利业
Sanitation,Social Security
Education and Social Welfare
地 区 Region 年末人数 平均人数 工资总额 平均工资 年末人数 平均人数 工资总额 平均工资
(人) (人) (千元) (元) (人) (人) (千元) (元)
Year-end Average Total Average Year-end Average Total Average
Figures Figures Wages Wage Figures Figures Wages Wage
(1 000 (1 000
(person) (person) yuan) (yuan) (person) (person) yuan) (yuan)
National 555670 553033 5147698 9308 493408 493206 5763000 11685
北 京 Beijing 5127 5016 81070 16162 10025 9868 295335 29929

8/2/2019 China Labour Statistical Yearbook - 2004
http://slidepdf.com/reader/full/china-labour-statistical-yearbook-2004 361/464
天 津 Tianjin 1819 1825 16375 8973 2152 2126 26257 12350
河 北 Hebei 668 677 6887 10173 15394 15430 110781 7180
山 西 Shanxi 2421 2421 25165 10394 20932 20878 140613 6735
内蒙古 Inner Mongolia 314 325 3047 9375 13353 13344 105021 7870
辽 宁 Liaoning 1983 2000 16443 8222 14074 14274 94414 6614
吉 林 Jilin 594 598 6332 10589 9963 9982 83314 8346
黑龙江 Heilongjiang 1459 1454 24556 16889 6845 6879 60482 8792
上 海 Shanghai 1154 1276 20075 15733 19074 19136 531580 27779
江 苏 Jiangsu 9233 9459 107097 11322 65961 66430 924721 13920
浙 江 Zhejiang 4574 4475 76475 17089 33987 33649 652064 19378
安 徽 Anhui 2803 2803 29453 10508 44191 43771 340738 7785
福 建 Fujian 366 371 4813 12973 20642 20629 265646 12877
江 西 Jiangxi 46 47 312 6638 5760 6077 53741 8843
山 东 Shandong 7114 7133 66640 9342 53277 53119 555351 10455
河 南 Henan 491144 488303 4371087 8952 14017 13838 111014 8022
湖 北 Hubei 9395 9355 77061 8237 8925 8852 66865 7554
湖 南 Hunan 1163 1149 13295 11571 25459 25400 214301 8437
广 东 Guangdong 6134 6183 102717 16613 11294 11367 189580 16678广 西 Guangxi 1259 1228 10986 8946 763 768 7926 10320
海 南 Hainan 436 395 5122 12967 3837 3842 41596 10827
重 庆 Chongqing 529 522 3797 7274 15645 15878 155518 9795
四 川 Sichuan 886 889 9717 10930 58280 58121 558429 9608
贵 州 Guizhou 2341 2323 33336 14350 1084 1080 9736 9015
云 南 Yunnan 376 372 4163 11191 696 707 6511 9209
西 藏 Tibet
陕 西 Shaanxi 1793 1893 24725 13061 12096 12079 95803 7931
甘 肃 Gansu 4 4 54 13500 3608 3589 34025 9480
青 海 Qinghai 326 328 4139 12619 502 502 7410 14761
宁 夏 Ningxia 9 9 24 2667 354 349 3111 8914
新 疆 Xinjiang 200 200 2735 13675 1218 1242 21117 17002
5-4 11 continued
文化体育和娱乐业 公共管理和社会组织
Public Management and
Culture, Sports and Entertainment Social Organization
地 区 Region 年末人数 平均人数 工资总额 平均工资 年末人数 平均人数 工资总额 平均工资
(人) (人) (千元) (元) (人) (人) (千元) (元)
Year-end Average Total Average Year-end Average Total Average
Figures Figures Wages Wage Figures Figures Wages Wage
(1 000 (1 000
(person) (person) yuan) (yuan) (person) (person) yuan) (yuan)
National 30448 30030 283153 9429 44883 45326 487174 10748
北 京 Beijing 1807 1665 18239 10954 789 787 19939 25335
天 津 Tianjin 137 153 1772 11582 155 158 2545 16108
河 北 Hebei 2307 2313 15594 6742 1519 1515 15259 10072
山 西 Shanxi 2471 2428 9703 3996 1655 1647 16708 10145
内蒙古 Inner Mongolia 89 100 605 6050 321 327 4131 12633
辽 宁 Liaoning 457 458 3493 7627 1063 1063 7535 7088
吉 林 Jilin 611 599 7378 12317 762 764 9318 12196
黑龙江 Heilongjiang 258 250 3524 14096 840 850 9928 11680
上 海 Shanghai 1136 1141 22466 19690 1620 1620 37960 23432
江 苏 Jiangsu 3403 3396 35843 10554 4614 4606 60493 13134
浙 江 Zhejiang 1181 1189 25302 21280 481 547 10021 18320
安 徽 Anhui 1633 1638 12479 7618 1749 1762 19697 11179
福 建 Fujian 586 593 5000 8432 439 445 5616 12620
江 西 Jiangxi 31 31 161 5194 1523 1546 12549 8117
山 东 Shandong 2215 2224 23368 10507 1944 1971 20459 10380

8/2/2019 China Labour Statistical Yearbook - 2004
http://slidepdf.com/reader/full/china-labour-statistical-yearbook-2004 362/464
河 南 Henan 3621 3526 19245 5458 5661 5639 43657 7742
湖 北 Hubei 400 400 3114 7785 7127 7156 53805 7519
湖 南 Hunan 785 765 6418 8390 1786 1767 18515 10478
广 东 Guangdong 1963 1937 30101 15540 1435 1448 24534 16943
广 西 Guangxi 79 74 652 8811 469 505 3641 7210
海 南 Hainan 167 167 1200 7186 1408 1401 8674 6191
重 庆 Chongqing 288 281 2617 9313 379 385 4091 10626
四 川 Sichuan 617 676 5614 8305 1511 1526 20755 13601
贵 州 Guizhou 402 396 5049 12750 859 853 10258 12026
云 南 Yunnan 269 299 2248 7518 915 901 11760 13052
西 藏 Tibet 21 21 77 3667
陕 西 Shaanxi 1537 1537 7725 5026 1732 1996 18307 9172
甘 肃 Gansu 1865 1660 13064 7870 1324 1327 11422 8607
青 海 Qinghai 659 669 3289 4916
宁 夏 Ningxia 59 59 506 8576 74 75 1302 17360
新 疆 Xinjiang 53 54 596 11037 70 70 1006 14371

8/2/2019 China Labour Statistical Yearbook - 2004
http://slidepdf.com/reader/full/china-labour-statistical-yearbook-2004 363/464
5-5
(
NOT-ON-POST STAFF AND WORKERS AND LIVING
SUBSIDIES BY SECTOR AND REGION
(Urban Collective-owned Units, 2003)总 计 农、林、牧、渔业 采矿业 制造业
Agriculture,Forestry,
Farming of Animals Mining Manufacturing
Total and Fishing
地 区 Region 年末人数 平均生活费 年末人数 平均生活费 年末人数 平均生活费 年末人数
(人) (元) (人) (元) (人) (元) (人)
Average Average Average
Year-end Living Year-end Living Year-end Living Year-end
Figures Subsidy Figures Subsidy Figures Subsidy Figures
(person) (yuan) (person) (yuan) (person) (yuan) (person)
National 4060563 870 67941 682 157582 352 1811054
北 京 Beijing 24279 4825 135 3518 2 3500 11216
天 津 Tianjin 88410 885 29 2913 56548
河 北 Hebei 163555 989 1235 561 5082 383 79701
山 西 Shanxi 147226 444 858 86 5240 718 65132
内蒙古 Inner Mongolia 57806 616 3248 51 580 63 23564
辽 宁 Liaoning 726496 329 825 325 55126 195 410225
吉 林 Jilin 255874 277 429 1049 22040 115425
黑龙江 Heilongjiang 424665 224 7482 516 43525 71 213145
上 海 Shanghai 144109 2311 280 9543 40 1925 62169
江 苏 Jiangsu 185982 2072 4368 1095 3540 2658 76490
浙 江 Zhejiang 34165 2822 134 10366 12861
安 徽 Anhui 141922 946 2256 607 4143 1381 55486
福 建 Fujian 53404 1050 171 730 166 3314 22117
江 西 Jiangxi 138632 621 1176 846 2826 1050 67234
山 东 Shandong 289160 1149 26158 531 2329 4011 93218
河 南 Henan 244436 639 12429 226 679 751 68577
湖 北 Hubei 154880 1202 2106 1465 74 2378 77182
湖 南 Hunan 252675 902 1734 1243 1697 770 97374
广 东 Guangdong 136470 877 230 2466 94 2578 49877
广 西 Guangxi 57261 937 157 688 12 2723 15522
海 南 Hainan 17790 460 10 1200 1 5000 3186
重 庆 Chongqing 56199 1139 196 1991 794 151 30319
四 川 Sichuan 64837 1797 502 3360 1183 773 24858
贵 州 Guizhou 27524 909 4 385 2040 9290
云 南 Yunnan 24570 2288 127 2967 1269 1353 11731
西 藏 Tibet 1 3000 1
陕 西 Shaanxi 110904 1044 1553 917 6570 323 42688
甘 肃 Gansu 28776 2098 80 950 98 2559 12894
青 海 Qinghai 2394 1400 1265
宁 夏 Ningxia 2378 1803 50 1062
新 疆 Xinjiang 3783 3660 58 2190 8 1222 697

8/2/2019 China Labour Statistical Yearbook - 2004
http://slidepdf.com/reader/full/china-labour-statistical-yearbook-2004 364/464
5-5 1 continued
电力、燃气及水的生产 建筑业 交通运输、仓储和邮政业 信息传输、计算机服务和
和供应业 Production 软件业 Information
& Distribution of Construction Traffic,Transport, Transfer, Computer
Electricity,Gas & Water Storage and Post Services and Software
地 区 Region 年末人数 平均生活费 年末人数 平均生活费 年末人数 平均生活费 年末人数 平均生活费
(人) (元) (人) (元) (人) (元) (人) (元)
Average Average Average Average
Year-end Living Year-end Living Year-end Living Year-end Living
Figures Subsidy Figures Subsidy Figures Subsidy Figures Subsidy
(person) (yuan) (person) (yuan) (person) (yuan) (person) (yuan)
National 5530 3089 328946 900 235120 735 4173 2176
北 京 Beijing 3148 6246 565 5870 12 7167
天 津 Tianjin 124 2317 2626 2594 13082 449 35 14231
河 北 Hebei 18 5681 1230 9028 694 89 1045
山 西 Shanxi 28 7714 8698 146 7117 168 104
内蒙古 Inner Mongolia 2 14856 858 1735 1994
辽 宁 Liaoning 1947 255 97427 497 26931 422 78 2808
吉 林 Jilin 114 2439 21079 116 12284 245 596 1904
黑龙江 Heilongjiang 285 12795 36469 193 23729 169 30 9800
上 海 Shanghai 216 11036 2455 2922 4688 2042 137 11885
江 苏 Jiangsu 50 4364 10022 2699 9065 2500 63 10415
浙 江 Zhejiang 118 5220 2385 2377 2372 1979 39 11185
安 徽 Anhui 189 5206 11394 984 12271 772 4 4250
福 建 Fujian 43 3846 6698 1172 4651 881 36 1316
江 西 Jiangxi 79 2284 12353 1096 9902 442
山 东 Shandong 470 701 14120 1552 11167 1160 28 9929
河 南 Henan 63 3794 11702 908 16934 373 653 61
湖 北 Hubei 165 4694 6075 2441 12077 1147 35 8000
湖 南 Hunan 407 3539 15469 1109 22142 700 1739 1499
广 东 Guangdong 645 6701 12149 685 11388 656 2 7500
广 西 Guangxi 34 13061 3878 742 3201 858 64 973
海 南 Hainan 2 1038 376 1750 1509 156 474
重 庆 Chongqing 80 289 6999 921 5051 1011 49 5959
四 川 Sichuan 183 3304 6704 1556 5553 954 1
贵 州 Guizhou 155 1235 2624 657 810 1244
云 南 Yunnan 111 3802 1767 2047 484 2919 13 5077
西 藏 Tibet
陕 西 Shaanxi 9498 1495 5645 592 125 1568
甘 肃 Gansu 1006 2207 1409 1681 85 741
青 海 Qinghai 327 706 1
宁 夏 Ningxia 46 935 30 267
新 疆 Xinjiang 2 5000 253 718 58 1379
5-5 2 continued
批发和零售业 住宿和餐饮业 金融业 房地产业
Wholesale and Accommodation and Finance Real Estate
Retail Trade Restaurants
地 区 Region 年末人数 平均生活费 年末人数 平均生活费 年末人数 平均生活费 年末人数 平均生活费
(人) (元) (人) (元) (人) (元) (人) (元)
Average Average Average Average
Year-end Living Year-end Living Year-end Living Year-end Living
Figures Subsidy Figures Subsidy Figures Subsidy Figures Subsidy
(person) (yuan) (person) (yuan) (person) (yuan) (person) (yuan)
National 1178950 684 39839 1356 31955 8496 24034 1331
北 京 Beijing 4915 4647 413 6132 720 4235

8/2/2019 China Labour Statistical Yearbook - 2004
http://slidepdf.com/reader/full/china-labour-statistical-yearbook-2004 365/464
天 津 Tianjin 12196 1080 670 2218 55 9636 94 2191
河 北 Hebei 57036 610 914 862 1605 9162 38 4000
山 西 Shanxi 43067 459 1661 811 1981 6897 743 1212
内蒙古 Inner Mongolia 5244 514 216 457 202 6749
辽 宁 Liaoning 99452 236 4375 615 2817 7986 1156 502
吉 林 Jilin 76688 179 1999 206 455 8413 64 953
黑龙江 Heilongjiang 79563 152 2668 335 1175 8256 5836 12
上 海 Shanghai 42281 2570 4091 2494 370 3802
江 苏 Jiangsu 72311 1153 1076 2033 1587 8956 462 5011
浙 江 Zhejiang 9839 1867 560 1605 2401 9954 183 4040
安 徽 Anhui 48622 731 3481 827 191 6939 179 2778
福 建 Fujian 17268 865 543 880 323 11713 169 2427
江 西 Jiangxi 40605 498 303 628 1412 6194 51 1176
山 东 Shandong 122853 515 2599 1909 2535 8742 673 3034
河 南 Henan 113683 329 2610 999 3941 6601 1370 404
湖 北 Hubei 48473 1042 800 2040 2205 7046 1291 1697
湖 南 Hunan 91401 684 3639 1828 803 5279 6839 1169
广 东 Guangdong 54090 410 469 1438 2669 12876 2097 2907广 西 Guangxi 27860 496 694 751 1558 7635 289 1338
海 南 Hainan 9512 165 310 23 126 4750 362 294
重 庆 Chongqing 10275 1394 489 671 553 10198 354 714
四 川 Sichuan 20883 1276 810 880 1480 8772 115 2912
贵 州 Guizhou 11885 802 671 2774 201 6879 118 2168
云 南 Yunnan 7285 1952 622 1368 448 9606 20 6100
西 藏 Tibet
陕 西 Shaanxi 37148 1088 2604 2457 569 6275 380 814
甘 肃 Gansu 11064 1093 296 1308 66 8662 6 3167
青 海 Qinghai 523 1501 52 1654 169 8788 4 2000
宁 夏 Ningxia 1049 1201 68 836 51 3240
新 疆 Xinjiang 1879 3184 136 1022 377 10310 51 4164
5-5 3 continued
租赁和商务服务业 科学研究、技术服务和地质 水利、环境和公共设施管理 居民服务和其他服务业
勘查业 Scientific Rese- 业 Management of Water
Tenancy and arch,Technical Service Conservancy,Environment Resident Services
Business Services & Geologic Perambulation & Public Establishment and Other Services
地 区 Region 年末人数 平均生活费 年末人数 平均生活费 年末人数 平均生活费 年末人数 平均生活费(人) (元) (人) (元) (人) (元) (人) (元)
Average Average Average Average
Year-end Living Year-end Living Year-end Living Year-end Living
Figures Subsidy Figures Subsidy Figures Subsidy Figures Subsidy
(person) (yuan) (person) (yuan) (person) (yuan) (person) (yuan)
National 84652 1725 8447 2898 5293 2794 34815 1273
北 京 Beijing 1616 7841 304 7787 24 14412 635 4684
天 津 Tianjin 1542 2217 236 8402 1030 2985
河 北 Hebei 1328 1404 85 1424 141 678 456 1782
山 西 Shanxi 2316 235 94 415 530 1693 8311 83
内蒙古 Inner Mongolia 5588 130 3 1000 69 391 1856 370
辽 宁 Liaoning 13776 377 991 523 479 734 6817 1115
吉 林 Jilin 2253 293 67 60 365 1144 1202 103
黑龙江 Heilongjiang 3997 417 143 2203 559 2243 3733 324
上 海 Shanghai 21323 2591 375 3100 122 4930 3612 2034
江 苏 Jiangsu 3073 2744 63 6952 617 4284 1142 8792
浙 江 Zhejiang 1848 4745 126 7383 301 7265 198 1587
安 徽 Anhui 1046 1232 61 1984 101 2437 328 1040
福 建 Fujian 290 2746 55 196 60 1683 372 538

8/2/2019 China Labour Statistical Yearbook - 2004
http://slidepdf.com/reader/full/china-labour-statistical-yearbook-2004 366/464
江 西 Jiangxi 1842 222 87 3468 155 1168
山 东 Shandong 4734 2154 5537 3160 66 5561 290 1849
河 南 Henan 2638 1348 86 1058 193 1233 2153 799
湖 北 Hubei 922 3783 62 3527 336 4128 359 2149
湖 南 Hunan 2791 2175 3 634 1849 399 1094
广 东 Guangdong 2039 1632 146 197 176 5764 104 2269
广 西 Guangxi 3635 2245 2 27 116 327
海 南 Hainan 109 5717 3 2667 37 324
重 庆 Chongqing 381 1390 2 138 2587 168 1186
四 川 Sichuan 1004 2098 5 6400 176 3181 104 1524
贵 州 Guizhou 1303 1379 21 880 15 1133
云 南 Yunnan 412 2703 1 4000 21 619 133 1326
西 藏 Tibet
陕 西 Shaanxi 1406 1105 36 5378 1056 2035
甘 肃 Gansu 1176 45 5 2400
青 海 Qinghai 38 16795 1 3000
宁 夏 Ningxia 3 3250 11 2727 2
新 疆 Xinjiang 223 3698 26 269
5-5 4 continued
教育 卫生、社会保障和社会福利业 文化体育和娱乐业 公共管理和社会组织
Sanitation, Social
Education Security and Culture, Sports Public Management &
Social Welfare and Entertainment Social Organization
地 区 Region 年末人数 平均生活费 年末人数 平均生活费 年末人数 平均生活费 年末人数 平均生活费
(人) (元) (人) (元) (人) (元) (人) (元)
Average Average Average Average
Year-end Living Year-end Living Year-end Living Year-end Living
Figures Subsidy Figures Subsidy Figures Subsidy Figures Subsidy
(person) (yuan) (person) (yuan) (person) (yuan) (person) (yuan)
National 7721 4081 20069 2817 2956 1792 11486 1908
北 京 Beijing 284 7408 269 10747 13 2267 8 5833
天 津 Tianjin 92 4000 42 3467 9 444
河 北 Hebei 115 681 673 2453 140 2239 190 6516
山 西 Shanxi 28 643 456 1162 623 5 239 608
内蒙古 Inner Mongolia 66 2309 575 1546 2 17500
辽 宁 Liaoning 664 722 3340 412 50 1900 20 6250
吉 林 Jilin 45 444 676 1347 44 795 49 9571
黑龙江 Heilongjiang 42 286 688 271 1596 917
上 海 Shanghai 611 1818 1005 13587 279 3658 55 7642
江 苏 Jiangsu 467 3557 1025 7431 244 4672 317 4671
浙 江 Zhejiang 43 7857 728 2776 19 9350 10 6300
安 徽 Anhui 148 5803 1843 1437 77 6724 102 3548
福 建 Fujian 3 381 3744 43 2071 15 7438
江 西 Jiangxi 339 1547 268 1982
山 东 Shandong 187 2035 1765 2680 205 2259 226 7319
河 南 Henan 4174 5318 1372 1307 253 563 926 1113
湖 北 Hubei 466 4592 721 2315 96 4042 1435 2884
湖 南 Hunan 103 4880 1835 2138 187 2112 3479 867
广 东 Guangdong 57 7971 166 4119 52 3846 20 11333
广 西 Guangxi 41 48 19 2632 6 333 146 438
海 南 Hainan 239 918 949
重 庆 Chongqing 17 2579 313 1447 6 10000 15 16923
四 川 Sichuan 31 2839 1119 2538 91 2391 35 9294
贵 州 Guizhou 20 6190 14 5214 8 3857
云 南 Yunnan 64 7623 24 560 38 10464
西 藏 Tibet

8/2/2019 China Labour Statistical Yearbook - 2004
http://slidepdf.com/reader/full/china-labour-statistical-yearbook-2004 367/464
陕 西 Shaanxi 15 3267 368 2779 66 424 1177 2932
甘 肃 Gansu 17 1033 438 264 136 434
青 海 Qinghai 14 1071
宁 夏 Ningxia 4 5750 2 5667
新 疆 Xinjiang 2 4500 13 14083
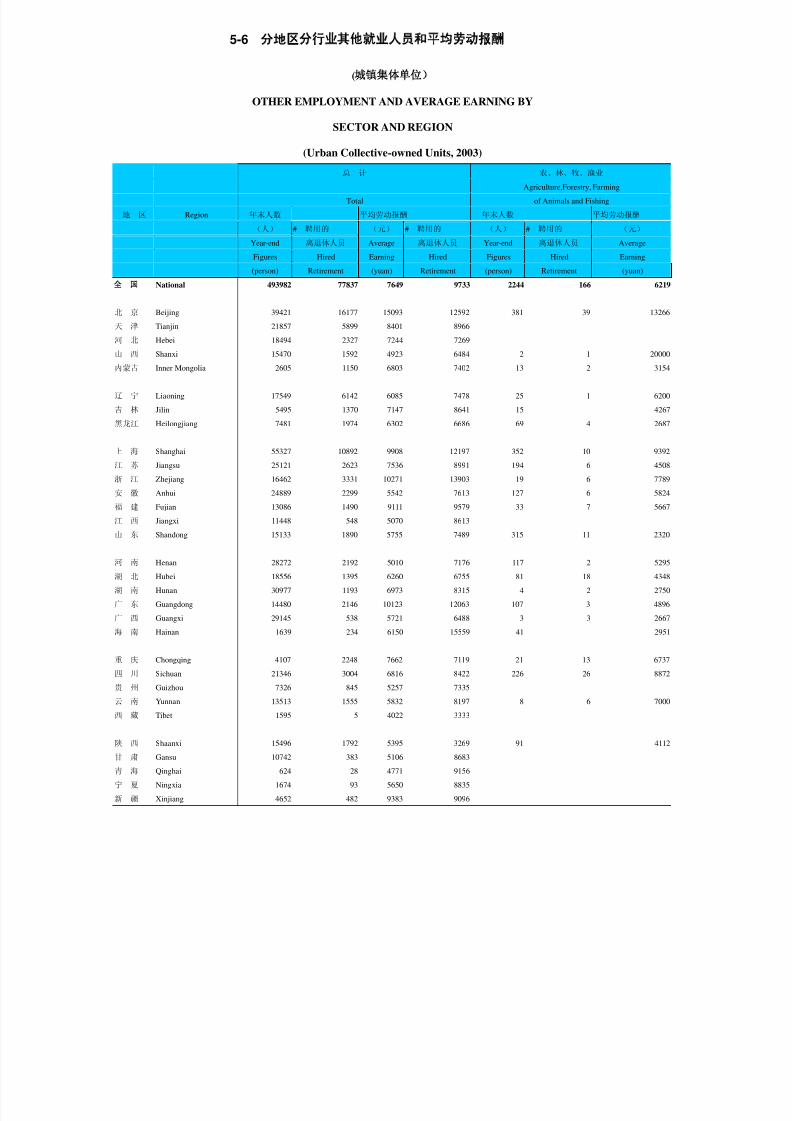
8/2/2019 China Labour Statistical Yearbook - 2004
http://slidepdf.com/reader/full/china-labour-statistical-yearbook-2004 368/464
5-6
(
OTHER EMPLOYMENT AND AVERAGE EARNING BY
SECTOR AND REGION
(Urban Collective-owned Units, 2003)总 计 农、林、牧、渔业
Agriculture,Forestry, Farming
Total of Animals and Fishing
地 区 Region 年末人数 平均劳动报酬 年末人数 平均劳动报酬
(人) # 聘用的
(元) # 聘用的
(人) # 聘用的
(元)
Year-end 离退休人员 Average 离退休人员 Year-end 离退休人员 Average
Figures Hired Earning Hired Figures Hired Earning
(person) Retirement (yuan) Retirement (person) Retirement (yuan)
National 493982 77837 7649 9733 2244 166 6219
北 京 Beijing 39421 16177 15093 12592 381 39 13266天 津 Tianjin 21857 5899 8401 8966
河 北 Hebei 18494 2327 7244 7269
山 西 Shanxi 15470 1592 4923 6484 2 1 20000
内蒙古 Inner Mongolia 2605 1150 6803 7402 13 2 3154
辽 宁 Liaoning 17549 6142 6085 7478 25 1 6200
吉 林 Jilin 5495 1370 7147 8641 15 4267
黑龙江 Heilongjiang 7481 1974 6302 6686 69 4 2687
上 海 Shanghai 55327 10892 9908 12197 352 10 9392
江 苏 Jiangsu 25121 2623 7536 8991 194 6 4508
浙 江 Zhejiang 16462 3331 10271 13903 19 6 7789
安 徽 Anhui 24889 2299 5542 7613 127 6 5824
福 建 Fujian 13086 1490 9111 9579 33 7 5667
江 西 Jiangxi 11448 548 5070 8613
山 东 Shandong 15133 1890 5755 7489 315 11 2320
河 南 Henan 28272 2192 5010 7176 117 2 5295
湖 北 Hubei 18556 1395 6260 6755 81 18 4348
湖 南 Hunan 30977 1193 6973 8315 4 2 2750
广 东 Guangdong 14480 2146 10123 12063 107 3 4896
广 西 Guangxi 29145 538 5721 6488 3 3 2667
海 南 Hainan 1639 234 6150 15559 41 2951
重 庆 Chongqing 4107 2248 7662 7119 21 13 6737
四 川 Sichuan 21346 3004 6816 8422 226 26 8872
贵 州 Guizhou 7326 845 5257 7335
云 南 Yunnan 13513 1555 5832 8197 8 6 7000
西 藏 Tibet 1595 5 4022 3333
陕 西 Shaanxi 15496 1792 5395 3269 91 4112
甘 肃 Gansu 10742 383 5106 8683
青 海 Qinghai 624 28 4771 9156
宁 夏 Ningxia 1674 93 5650 8835
新 疆 Xinjiang 4652 482 9383 9096

8/2/2019 China Labour Statistical Yearbook - 2004
http://slidepdf.com/reader/full/china-labour-statistical-yearbook-2004 369/464
5-7
INCREASE OF EMPLOYMENT IN URBAN UNITS BY REGION
(Urban Collective-owned Units, 2003)
单位: 人 (person)
从 农 村 从 城 镇 录用的复员 录用的大、
合 计 中专、 调入 #由外省、自 其 他
招 收 招 收 转业军人 技工学校 治区、直辖
地 区 Region Total Recruited 毕业生 Trans- 市调入 Others
Recruited Recruited Demobilized ferred
from from and Recruit- Into Transferred
Country- Cities Transferred ed Gra- from Other
side and Towns Armymen duates Regions
National 683767 306642 103555 10664 60754 73479 1534 128673
北 京 Beijing 46612 22397 3699 98 1274 3178 310 15966
天 津 Tianjin 16733 3141 2036 90 1029 5830 17 4607河 北 Hebei 19954 8599 2441 319 2080 3781 34 2734
山 西 Shanxi 23272 8937 4425 537 2949 3054 20 3370
内蒙古 Inner Mongolia 10357 3539 3720 51 438 883 1726
辽 宁 Liaoning 31250 11206 6355 370 1598 7829 16 3892
吉 林 Jilin 6519 1005 1803 175 700 1636 5 1200
黑龙江 Heilongjiang 13200 759 4843 243 401 3558 7 3396
上 海 Shanghai 42680 4379 7218 140 1474 8349 428 21120
江 苏 Jiangsu 37969 10778 7979 523 4217 5099 49 9373
浙 江 Zhejiang 32409 18246 5052 366 3023 1431 68 4291
安 徽 Anhui 16581 6272 4008 485 1346 1510 10 2960
福 建 Fujian 53683 30873 8133 409 2352 1023 83 10893
江 西 Jiangxi 15640 4133 2414 758 3226 2176 18 2933
山 东 Shandong 41181 14977 6623 1101 9733 5333 39 3414
河 南 Henan 35450 14157 3799 959 8175 6055 25 2305
湖 北 Hubei 24648 17808 2048 365 942 1600 8 1885
湖 南 Hunan 14820 4362 1012 415 1155 1571 10 6305
广 东 Guangdong 79933 48458 10072 1711 6828 2375 190 10489
广 西 Guangxi 8607 3602 1576 68 1058 734 18 1569
海 南 Hainan 1695 808 344 59 222 131 11 131
重 庆 Chongqing 27520 20755 2849 119 1161 641 10 1995
四 川 Sichuan 26548 15872 3404 547 2140 1127 11 3458
贵 州 Guizhou 8022 4987 1012 212 590 407 1 814
云 南 Yunnan 15634 6458 1797 168 707 1634 102 4870
西 藏 Tibet 157 129 18 3 7 4
陕 西 Shaanxi 5060 2047 985 137 704 844 10 343
甘 肃 Gansu 5946 1928 964 111 568 672 1 1703
青 海 Qinghai 1295 758 262 24 29 84 1 138
宁 夏 Ningxia 1679 682 582 28 112 133 9 142
新 疆 Xinjiang 18713 14590 2082 76 520 794 19 651

8/2/2019 China Labour Statistical Yearbook - 2004
http://slidepdf.com/reader/full/china-labour-statistical-yearbook-2004 370/464
5-8
DECREASE OF EMPLOYMENT IN URBAN UNITS BY REGION
(Urban Collective-owned Units, 2003)
单位: 人 (person)
离休、退 开除、除 终止、解 不在岗 调 出
合 计 休、退职 名、辞退 除 合 同 职 工 #调到外省、 其 他
地 区 Region 自 治 区、
Retired Expelled Contract Not-on- Trans- 直 辖 市
Total and Expunged Closed post ferred Transferred Others
Resigned and or Staff and Out to Other
Dismissed Terminated Workers Regions
National 1181551 196145 72458 402244 225091 103598 1998 182015
北 京 Beijing 47921 5674 4499 15828 891 4744 742 16285
天 津 Tianjin 26939 3700 1106 4351 8635 6182 111 2965
河 北 Hebei 48023 7972 7100 15532 5922 6481 42 5016
山 西 Shanxi 29273 4609 1554 4683 7276 2702 35 8449
内蒙古 Inner Mongolia 17655 1597 1959 4679 5967 2147 7 1306
辽 宁 Liaoning 74835 20822 2948 28388 12923 6985 28 2769
吉 林 Jilin 34096 6265 2364 10169 9694 3401 9 2203
黑龙江 Heilongjiang 75021 11686 2188 11739 19181 10446 298 19781
上 海 Shanghai 62850 7329 350 14781 9382 11663 215 19345
江 苏 Jiangsu 91428 12054 2465 37846 22434 5865 44 10764
浙 江 Zhejiang 32718 4038 2858 14522 2135 1923 29 7242
安 徽 Anhui 46586 9433 1929 16166 9899 2968 45 6191
福 建 Fujian 47564 9863 4655 20450 2766 1259 6 8571
江 西 Jiangxi 39858 5395 1121 8911 18787 887 18 4757
山 东 Shandong 77257 12021 5996 20113 19605 9737 72 9785
河 南 Henan 56553 13693 2585 14771 10859 7994 38 6651
湖 北 Hubei 36906 6065 728 16650 10053 1532 23 1878
湖 南 Hunan 38319 8297 1296 12847 8873 2356 44 4650
广 东 Guangdong 91980 12317 12058 42943 8664 3692 21 12306
广 西 Guangxi 27265 4560 1194 8379 6993 1316 5 4823
海 南 Hainan 3566 1008 139 758 683 244 734
重 庆 Chongqing 35702 7483 2441 18740 3608 1021 16 2409
四 川 Sichuan 45868 6429 2050 22385 5025 1303 8 8676
贵 州 Guizhou 11697 1707 2990 2801 1747 497 8 1955
云 南 Yunnan 28258 5116 1286 9414 3606 1850 75 6986
西 藏 Tibet 222 12 44 59 1 9 97
陕 西 Shaanxi 16219 4425 589 3470 5447 1159 20 1129
甘 肃 Gansu 14266 1296 478 5882 3125 1821 26 1664
青 海 Qinghai 2104 218 404 582 185 75 640
宁 夏 Ningxia 2691 204 508 1280 259 117 1 323
新 疆 Xinjiang 17911 857 576 13125 466 1222 12 1665

8/2/2019 China Labour Statistical Yearbook - 2004
http://slidepdf.com/reader/full/china-labour-statistical-yearbook-2004 371/464
6-1
EMPLOYMENT AND EARNINGS BY SECTOR
(Other Ownership Units, 2003)
年末人数 劳动报酬 平均劳动
(千人) # 女 性
(千元) 报 酬
Year-end Earnings (元)
项 目 Item Figures Female Average
(1 000 (1 000 Earning
persons) yuan ) (yuan)
National Total 30943 12426 455061980 14843Grouped by Registration Status
内资 Domestic Funded 22311 7843 303113202 13583
股份合作 Cooperative Units 1733 630 18167885 10558
联营 Joint-owned Units 440 153 5888765 13556
国有联营 State Joint-owned Units 146 52 2369834 16141
集体联营 Collective Joint-owned Units 75 25 798544 10547
有限责任公司 Limited Liability Corporations 12611 4227 169044938 13358
国有独资 State Funded Corporations 3015 946 48042686 15903
股份有限公司 Share-holding Corporations Ltd 5916 2203 92940886 15738
其他 Others 1612 630 17070728 10670
港、澳、台商投资 Funded by Entrepreneurs from Hong Kong, 4094 2187 60430177 15155
Macao and Taiwan
外商投资 Foreign Funded 4537 2396 91518601 21016
Grouped by Enterprises Institutions
企业 Enterprises 30829 12371 453366689 14842
事业 Institutions 99 49 1573929 16229
Grouped by Sector
Agriculture,Forestry,Farming of Animals 127 45 1283048 10077
and Fishing
农业 Agriculture 32 13 290365 8907
林业 Forestry 15 5 126701 8175
畜牧业 Farming of Animals 32 9 381260 12152
渔业 Fishing 16 4 184157 11657
农、林、牧、渔服务业 Service Activities for Agriculture, Forestry, 33 14 300565 9378
Farming of Animals and Fishing
Mining 1963 439 27445023 14285
煤炭开采和洗选业 Mining and Washing of Coal 1457 291 17828570 12600
石油和天然气开采业 Extraction of Petroleum and Natural Gas 287 98 7312955 25681
黑色金属矿采选业 Mining of Ferrous Metal Ores 43 8 470192 10769
有色金属矿采选业 Mining of Non-ferrous Metal Ores 87 20 950546 10970
非金属矿采选业 Mining and Processing of Nonmetal Ores 88 22 871661 9685
其他采矿业 Mining of Other Ores n.e.c 1 … 11099 9249
Manufacturing 18132 8312 243304410 13596
农副食品加工业 Processing of Food from Agricultural Products 603 261 5799039 9816食品制造业 Manufacture of Foods 443 225 5512703 13159
饮料制造业 Manufacture of Beverage 498 197 5970875 12163
烟草制品业 Manufacture of Tobacco 27 14 451523 17978
纺织业 Manufacture of Textile 1670 1117 14663325 8689
纺织服装、鞋、帽制造业 Manufacture of Textile Wearing Apparel, 1139 834 11810817 10683
Footware,and Caps
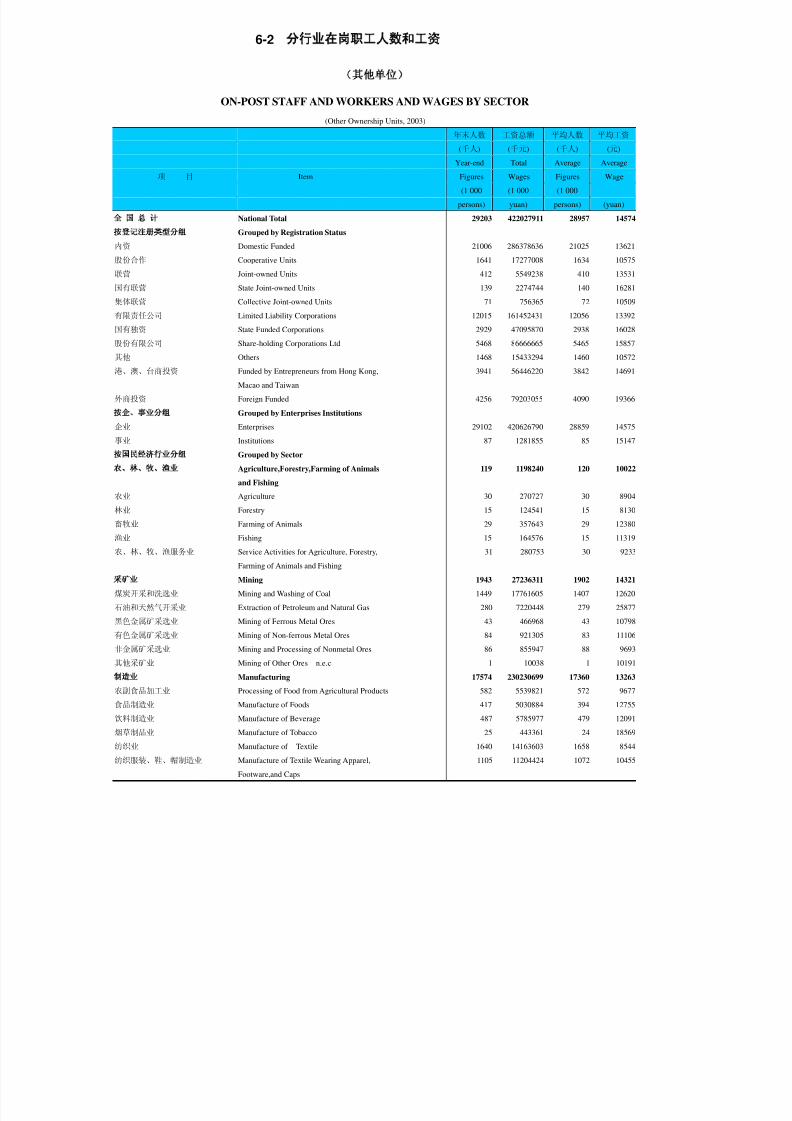
8/2/2019 China Labour Statistical Yearbook - 2004
http://slidepdf.com/reader/full/china-labour-statistical-yearbook-2004 372/464
6-2
ON-POST STAFF AND WORKERS AND WAGES BY SECTOR
(Other Ownership Units, 2003)
年末人数 工资总额 平均人数 平均工资
(千人) (千元) (千人) (元)
Year-end Total Average Average
项 目 Item Figures Wages Figures Wage
(1 000 (1 000 (1 000
persons) yuan) persons) (yuan)
National Total 29203 422027911 28957 14574
Grouped by Registration Status
内资 Domestic Funded 21006 286378636 21025 13621
股份合作 Cooperative Units 1641 17277008 1634 10575
联营 Joint-owned Units 412 5549238 410 13531
国有联营 State Joint-owned Units 139 2274744 140 16281
集体联营 Collective Joint-owned Units 71 756365 72 10509
有限责任公司 Limited Liability Corporations 12015 161452431 12056 13392
国有独资 State Funded Corporations 2929 47095870 2938 16028
股份有限公司 Share-holding Corporations Ltd 5468 86666665 5465 15857
其他 Others 1468 15433294 1460 10572
港、澳、台商投资 Funded by Entrepreneurs from Hong Kong, 3941 56446220 3842 14691
Macao and Taiwan
外商投资 Foreign Funded 4256 79203055 4090 19366
Grouped by Enterprises Institutions
企业 Enterprises 29102 420626790 28859 14575
事业 Institutions 87 1281855 85 15147
Grouped by Sector
Agriculture,Forestry,Farming of Animals 119 1198240 120 10022
and Fishing
农业 Agriculture 30 270727 30 8904
林业 Forestry 15 124541 15 8130
畜牧业 Farming of Animals 29 357643 29 12380
渔业 Fishing 15 164576 15 11319
农、林、牧、渔服务业 Service Activities for Agriculture, Forestry, 31 280753 30 9233
Farming of Animals and Fishing
Mining 1943 27236311 1902 14321
煤炭开采和洗选业 Mining and Washing of Coal 1449 17761605 1407 12620
石油和天然气开采业 Extraction of Petroleum and Natural Gas 280 7220448 279 25877
黑色金属矿采选业 Mining of Ferrous Metal Ores 43 466968 43 10798
有色金属矿采选业 Mining of Non-ferrous Metal Ores 84 921305 83 11106
非金属矿采选业 Mining and Processing of Nonmetal Ores 86 855947 88 9693
其他采矿业 Mining of Other Ores n.e.c 1 10038 1 10191
Manufacturing 17574 230230699 17360 13263
农副食品加工业 Processing of Food from Agricultural Products 582 5539821 572 9677
食品制造业 Manufacture of Foods 417 5030884 394 12755
饮料制造业 Manufacture of Beverage 487 5785977 479 12091
烟草制品业 Manufacture of Tobacco 25 443361 24 18569
纺织业 Manufacture of Textile 1640 14163603 1658 8544
纺织服装、鞋、帽制造业 Manufacture of Textile Wearing Apparel, 1105 11204424 1072 10455
Footware,and Caps

8/2/2019 China Labour Statistical Yearbook - 2004
http://slidepdf.com/reader/full/china-labour-statistical-yearbook-2004 373/464
6-3
EMPLOYMENT AND EARNINGS BY SECTOR AND REGION
(Other Ownership Units, 2003)
总 计 内 资
Total Domestic Funded
年末人数 劳动报酬 平均劳动 年末人数 劳动报酬 平均劳动
地 区 Region (人) # 女 性 (千元) 报 酬 (人) # 女 性 (千元) 报 酬
Year-end Earnings (元) Year-end Earnings (元)
Figures Female Average Figures Female Average
(1 000 Earning (1 000 Earning
(person) yuan) (yuan) (person) yuan) (yuan)
National 30942625 12426119 455061980 14843 22311358 7843393 303113202 13583
北 京 Beijing 2483972 849291 59086090 24145 1996677 637303 38897515 19750
天 津 Tianjin 863676 368880 16232775 19480 407594 144137 7588971 18881
河 北 Hebei 827725 306556 8997948 10648 662665 234873 7075451 10372
山 西 Shanxi 632430 192647 7008814 11221 599076 181801 6683498 11297
内蒙古 Inner Mongolia 593818 211339 6259557 10361 552243 185562 5938352 10544
辽 宁 Liaoning 1321163 511831 18772071 13730 932192 309721 12874305 13110
吉 林 Jilin 560626 210921 7124572 12528 474023 171188 5727532 11856
黑龙江 Heilongjiang 1165773 379288 15779155 13636 1095545 347185 14953098 13751
上 海 Shanghai 1573522 653460 40570267 26356 757360 268760 17318316 22904
江 苏 Jiangsu 2360009 1066762 34855162 14881 1538693 620719 21284504 13580
浙 江 Zhejiang 1816135 685538 29196497 16518 1385974 460154 22453277 16548
安 徽 Anhui 894168 291218 9726919 10867 819155 256210 8907286 10836
福 建 Fujian 1676574 873057 20964991 13016 458206 167816 6025043 13619
江 西 Jiangxi 422184 170929 4246816 10292 356983 136161 3712914 10518
山 东 Shandong 2062111 999793 22382648 10962 1371770 560806 14314052 10465
河 南 Henan 1865706 665333 19986121 11028 1725350 602285 18265926 10900
湖 北 Hubei 1211040 549649 10480661 8691 1098101 490009 9194435 8383
湖 南 Hunan 540733 195501 6455264 12075 474726 166943 5604616 11938
广 东 Guangdong 3261113 1608595 61483997 19223 1193430 429540 26179452 21927 广 西 Guangxi 478374 185955 5651341 11972 392986 147908 4602287 11824
海 南 Hainan 108326 45189 1387979 12574 73933 28908 935316 12634
重 庆 Chongqing 664556 205526 7411593 11440 606674 184497 6595317 11168
四 川 Sichuan 1270261 413127 12577431 10005 1179720 374248 11397708 9764
贵 州 Guizhou 345842 115001 3691967 10819 325387 107166 3483983 10857
云 南 Yunnan 495874 171521 5856574 11865 462379 157681 5377828 11695
西 藏 Tibet 7459 1873 124559 16561 7459 1873 124559 16561
陕 西 Shaanxi 511123 176165 5923797 11713 479950 165609 5400177 11377
甘 肃 Gansu 200802 68675 2207429 10814 181115 61478 1914698 10384
青 海 Qinghai 56747 19816 591743 10246 55390 19567 572937 10153 宁 夏 Ningxia 193084 61845 2463169 11927 182658 58564 2327490 11862
新 疆 Xinjiang 477699 170838 7564073 13857 463944 164721 7382359 13878

8/2/2019 China Labour Statistical Yearbook - 2004
http://slidepdf.com/reader/full/china-labour-statistical-yearbook-2004 374/464
6-4
ON-POST STAFF AND WORKERS AND WAGES BY SECTOR AND REGION
(Other Ownership Units, 2003)
总 计 内 资
Total Domestic Funded
地 区 Region 年末人数 平均人数 工资总额 平均工资 年末人数 平均人数 工资总额 平均工资
(人) (人) (千元) (元) (人) (人) (千元) (元)
Year-end Average Total Average Year-end Average Total Average
Figures Figures Wages Wage Figures Figures Wages Wage
(1 000 (1 000
(person) (person) yuan) (yuan) (person) (person) yuan) (yuan)
National 29202697 28957243 422027911 14574 21005620 21025244 286378636 13621
北 京 Beijing 2126638 2096841 49839125 23769 1699721 1678786 33574075 19999
天 津 Tianjin 773503 753107 14328891 19026 350032 349785 6845273 19570
河 北 Hebei 784367 790420 8457944 10701 623308 631417 6622678 10489
山 西 Shanxi 617182 611295 6892992 11276 584461 578968 6577312 11360
内蒙古 Inner Mongolia 586748 596306 6195973 10391 545821 556120 5882785 10578
辽 宁 Liaoning 1248829 1294354 17686998 13665 877197 926216 12249802 13226
吉 林 Jilin 547728 554982 6920954 12471 462611 470850 5622840 11942
黑龙江 Heilongjiang 1112483 1100124 15260223 13871 1043731 1032051 14461078 14012
上 海 Shanghai 1229963 1217683 33308464 27354 579479 589651 15029035 25488
江 苏 Jiangsu 2215378 2205460 32322720 14656 1453397 1483311 20307693 13691
浙 江 Zhejiang 1722762 1677108 27411112 16344 1305975 1278952 21078821 16481
安 徽 Anhui 848340 849239 9340901 10999 774819 777779 8550398 10993
福 建 Fujian 1638877 1575456 20038343 12719 436333 422609 5784670 13688
江 西 Jiangxi 405832 397301 4115505 10359 341622 339010 3592825 10598
山 东 Shandong 2007767 1989154 21244776 10680 1328000 1325530 13834070 10437
河 南 Henan 1808339 1753596 19569347 11160 1673827 1622826 17920700 11043
湖 北 Hubei 1176256 1170726 10182763 8698 1065682 1063920 8954713 8417
湖 南 Hunan 506292 501638 6133038 12226 442022 438246 5313272 12124
广 东 Guangdong 3209282 3146804 59104579 18782 1166476 1167365 25561091 21896
广 西 Guangxi 457592 453766 5498531 12118 376975 374975 4499788 12000
海 南 Hainan 104935 107100 1299137 12130 71205 71409 914421 12805
重 庆 Chongqing 647726 630677 7136844 11316 591106 574986 6369631 11078
四 川 Sichuan 1221007 1204215 12087513 10038 1132996 1117022 10944582 9798
贵 州 Guizhou 332357 328122 3600984 10975 312919 308776 3405015 11027
云 南 Yunnan 476187 474528 5640010 11886 444796 442738 5203117 11752
西 藏 Tibet 4443 4434 90786 20475 4443 4434 90786 20475
陕 西 Shaanxi 496809 492619 5810071 11794 466468 462293 5298944 11462
甘 肃 Gansu 191919 195444 2151758 11010 172265 175749 1859515 10581
青 海 Qinghai 54017 54591 564543 10341 52726 53290 546011 10246
宁 夏 Ningxia 185421 198795 2387384 12009 175060 188563 2253039 11948新 疆 Xinjiang 463718 531358 7405702 13937 450147 517617 7230656 13969

8/2/2019 China Labour Statistical Yearbook - 2004
http://slidepdf.com/reader/full/china-labour-statistical-yearbook-2004 375/464
6-5
(
NOT-ON-POST STAFF AND WORKERS AND LIVING
SUBSIDIES BY SECTOR AND REGION
(Other Ownership Units, 2003)
总 计 农、林、牧、渔业 采矿业 制造业
Agriculture,Forestry,
Farming of Animals Mining Manufacturing
Total and Fishing
地 区 Region 年末人数 平均生活费 年末人数 平均生活费 年末人数 平均生活费 年末人数
(人) (元) (人) (元) (人) (元) (人)
Average Average Average
Year-end Living Year-end Living Year-end Living Year-end
Figures Subsidy Figures Subsidy Figures Subsidy Figures
(person) (yuan) (person) (yuan) (person) (yuan) (person) National 3237587 3513 14699 1816 262871 3862 2002616
北 京 Beijing 103610 7252 154 3777 1046 7811 45376
天 津 Tianjin 77676 4672 232 4468 5147 7444 51544
河 北 Hebei 133178 3172 50 2308 3400 4919 92364
山 西 Shanxi 123984 3680 28 1821 11644 3947 85002
内蒙古 Inner Mongolia 58549 4162 709 494 8920 4543 30119
辽 宁 Liaoning 207839 2861 179 2645 18409 3961 127880
吉 林 Jilin 132772 2873 915 2278 9492 8956 83736
黑龙江 Heilongjiang 263012 1784 1440 342 75083 2605 127661
上 海 Shanghai 185097 4956 208 4729 109194
江 苏 Jiangsu 291971 4510 2275 2360 12419 4977 188890
浙 江 Zhejiang 66703 5857 110 6096 1734 5717 37935
安 徽 Anhui 133199 3023 131 1403 28309 4537 70114
福 建 Fujian 26675 3836 174 5789 140 2778 18721
江 西 Jiangxi 94200 2661 5216 2281 77356
山 东 Shandong 252415 2895 4165 965 4037 4363 172640
河 南 Henan 252907 2195 930 1495 34186 2695 166937
湖 北 Hubei 187891 2514 636 505 3932 2542 126460
湖 南 Hunan 133684 3076 107 907 7868 2866 93042
广 东 Guangdong 59948 6775 407 4039 1967 8581 33278
广 西 Guangxi 44011 3575 739 3310 818 1678 23642
海 南 Hainan 5114 4316 27 741 3391
重 庆 Chongqing 57561 3286 155 4258 2776 4384 28447
四 川 Sichuan 132420 3446 258 2018 13512 2745 76161
贵 州 Guizhou 34527 3894 53 679 2803 3035 25794
云 南 Yunnan 41443 5109 261 2756 614 4283 23352
西 藏 Tibet 247 5119 88 398 28
陕 西 Shaanxi 59751 2555 106 2724 2681 3810 41090
甘 肃 Gansu 25090 3040 76 870 301 7062 14910
青 海 Qinghai 9488 4627 24 12 1917 5844
宁 夏 Ningxia 9512 5117 15 8800 1179 4802 6292
新 疆 Xinjiang 33113 7086 47 4574 5226 12811 15416

8/2/2019 China Labour Statistical Yearbook - 2004
http://slidepdf.com/reader/full/china-labour-statistical-yearbook-2004 376/464
6-6
(
OTHER EMPLOYMENT AND AVERAGE EARNING BY
SECTOR AND REGION
(Other Ownership Units, 2003)
总 计 农、林、牧、渔业
Agriculture,Forestry, Farming
Total of Animals and Fishing
地 区 Region 年末人数 平均劳动报酬 年末人数 平均劳动报酬
(人) # 聘用的
(元) # 聘用的
(人) # 聘用的
(元) # 聘用的
Year-end 离退休人员 Average 离退休人员 Year-end 离退休人员 Average 离退休人员
Figures Hired Earning Hired Figures Hired Earning Hired
(person) Retirement (yuan) Retirement (person) Retirement (yuan) Retirement
National 1739928 247347 19425 14956 7734 599 10927 16223
北 京 Beijing 357334 96837 26399 16899 900 272 17464 20264
天 津 Tianjin 90173 11807 23734 11329 66 28 10635 9515
河 北 Hebei 43358 2522 9887 12474 37 7718
山 西 Shanxi 15248 2624 8710 8090 15 3 4533 6000
内蒙古 Inner Mongolia 7070 1151 8082 10198 11 2 8000 24000
辽 宁 Liaoning 72334 15094 14885 10003 463 9 22097 12800
吉 林 Jilin 12898 2351 14829 13704 12 2 15333 5500
黑龙江 Heilongjiang 53290 5290 9092 9542 1774 12 6316 7455
上 海 Shanghai 343559 33977 22577 16724 1765 54 11691 15269
江 苏 Jiangsu 144631 7928 18522 15687 224 16 7639 10500
浙 江 Zhejiang 93373 15114 19746 15999 115 22 12230 8818
安 徽 Anhui 45828 1889 8419 9973 33 1 3515 8000
福 建 Fujian 37697 4730 26273 15344 123 39 19129 10771
江 西 Jiangxi 16352 801 8562 8115 30 1 11600 12000
山 东 Shandong 54344 4764 21568 15822 37 5 72184 20400
河 南 Henan 57367 4146 7090 10280 322 13 4844 9222
湖 北 Hubei 34784 3935 8473 9307 43 6 5488 4333
湖 南 Hunan 34441 2572 9775 12330
广 东 Guangdong 51831 7410 46060 22452 126 30 22008 19900
广 西 Guangxi 20782 1794 8356 9927 30 15 8103 7800
海 南 Hainan 3391 543 27028 13567 829 16 7023 11217
重 庆 Chongqing 16830 4013 15984 12107 3 3 8667
四 川 Sichuan 49254 4882 9272 11125 83 3 4566 6333
贵 州 Guizhou 13485 2189 6939 9482 21 1 4476 3000
云 南 Yunnan 19687 4357 11343 11447 137 14 9800 15214
西 藏 Tibet 3016 4 10940 13429
陕 西 Shaanxi 14314 1675 8668 11163 86 8 12756 19375
甘 肃 Gansu 8883 503 6416 8240 224 3656
青 海
Qinghai 2730 91 8608 8110宁 夏 Ningxia 7663 767 9813 10661 4 4 8750 8750
新 疆 Xinjiang 13981 1587 10910 14922 221 20 6220 23750

8/2/2019 China Labour Statistical Yearbook - 2004
http://slidepdf.com/reader/full/china-labour-statistical-yearbook-2004 377/464
6-7
INCREASE OF EMPLOYMENT IN URBAN UNITS BY REGION
( Other Ownership Units, 2003)单位: 人 (person)
合 计 从农村 从城镇 录用的复员 录用的大、 调入
招 收 招 收 转业军人 中专、 Trans- #由外省、自 其 他
Recruited 技工学校 ferred 治区、直辖
地 区 Region Total Recruited Recruited Demobilized 毕业生 Into 市调入 Others
from from and Recruit- Transferred
Country- Cities Transferred ed Gra- from Other
side and Towns Armymen duates Regions
National 5246540 2087415 1002128 67878 693507 422249 32961 9733
北 京 Beijing 588506 185722 92190 2724 58171 88332 13068 1613
天 津 Tianjin 156328 42170 19476 670 30640 35265 937 281
河 北 Hebei 74111 33085 11853 1988 13320 8264 272 56
山 西 Shanxi 58256 18614 8019 1623 7788 3492 92 187
内蒙古 Inner Mongolia 59464 27773 16496 1560 7825 2734 70 30
辽 宁 Liaoning 141091 45520 35029 2531 20481 19822 441 177
吉 林 Jilin 40966 8677 10171 1673 7480 6558 237 64
黑龙江 Heilongjiang 238414 13733 23812 2555 12610 34962 114 1507
上 海 Shanghai 444917 78328 90004 1546 29976 51537 4722 1935
江 苏 Jiangsu 463205 124530 116739 4159 120028 30438 1454 673
浙 江 Zhejiang 399479 228424 67555 3265 44624 15671 2250 399
安 徽 Anhui 80154 19892 22596 2520 16644 5050 111 134
福 建 Fujian 523629 317419 81015 5901 44575 12825 664 618
江 西 Jiangxi 66801 18930 17367 1362 4594 2542 1224 220
山 东 Shandong 287606 134698 55317 3991 40036 37316 567 162
河 南 Henan 134826 54741 20908 5420 25044 10217 773 184
湖 北 Hubei 87965 29668 31083 1555 11999 5553 171 81
湖 南 Hunan 51302 14947 13758 1348 8606 2241 71 104
广 东 Guangdong 714904 376060 146528 11109 113875 17042 4419 502
广 西 Guangxi 40957 12968 8866 832 8007 2863 166 74
海 南 Hainan 14350 5035 3885 905 2648 458 159 14
重 庆 Chongqing 109326 60781 18874 1808 11463 7144 123 92
四 川 Sichuan 145855 72492 41841 2499 11532 4233 104 132
贵 州 Guizhou 22737 7086 3530 686 5356 1708 163 43
云 南 Yunnan 102372 50343 14338 1024 9292 4403 199 229
西 藏 Tibet 261 72 6 6 42 25 5 1
陕 西 Shaanxi 40543 7393 9130 688 15988 1803 30 55
甘 肃 Gansu 12219 5282 1272 346 1791 536 48 29
青 海 Qinghai 7164 4398 764 108 127 655 28 11
宁 夏 Ningxia 33910 23560 2996 318 2381 1340 26 33
新 疆 Xinjiang 104922 65074 16710 1158 6564 7220 253 81

8/2/2019 China Labour Statistical Yearbook - 2004
http://slidepdf.com/reader/full/china-labour-statistical-yearbook-2004 378/464
7-1
TOWNSHIP AND VILLAGE ENTERPRISES
单位: 万个 (10 000)
合 计 农林牧渔业 工 业 建筑业 交通运输 批发 住宿及 社会 其 他
年份 Farming Fo- 企 业 仓储业 零售业 餐饮业 服务业 企 业
Total res try Ani- Industry Constru- Transport Wholesale Hotels and Social
Year mal husbandry cture Storage and Retail Catering Services Others
& Fishery Trade Services
1978 152.42 49.46 79.40 4.67 6.51 12.38
1979 148.04 44.39 76.71 4.97 8.21 13.76
1980 142.46 37.83 75.78 5.08 8.94 14.83
1981 133.75 31.90 72.54 4.83 8.89 15.59
1982 136.17 29.28 74.92 5.38 9.58 17.01
1983 134.64 26.98 74.40 5.70 9.16 18.40
1984 606.52 24.84 481.22 8.04 12.96 79.46
1985 1222.45 22.42 493.03 8.26 10.61 688.13
1986 1515.30 23.97 635.50 89.25 261.98 504.60
1987 1750.24 23.12 708.28 90.25 325.24 603.35
1988 1888.16 23.28 773.52 95.58 372.55 623.23
1989 1868.63 22.68 736.47 92.55 379.88 637.05
1990 1850.40 22.40 722.00 90.40 381.40 634.20
1991 1908.88 23.09 742.57 88.81 400.34 654.07
1992 2091.62 24.92 793.82 98.49 436.95 737.77
1993 2452.90 27.90 918.40 121.70 486.40 656.301994 2494.47 24.64 698.58 82.99 369.11 759.63 292.93 266.58
1995 2202.67 27.77 718.16 106.75 495.17 697.77 94.45 62.60
1996 2336.33 28.94 756.43 104.58 546.49 761.71
1997 907.50 21.46 378.22 41.62 143.06 211.08 86.75 25.30
1998 2004.00 18.90 662.00 82.10 414.80 545.50 221.10 59.50
1999 2070.90 16.50 673.50 82.50 412.70 583.10 241.40 61.10
2000 2084.66 15.12 674.01 79.52 412.52 591.30 249.19 63.01
2001 2115.54 12.74 672.17 76.26 412.86 614.17 262.70 64.64
2002 2132.69 32.17 627.68 69.75 380.13 627.12 211.02 106.29 78.53
2003 2185.08 41.43 643.13 68.06 383.45 647.85 213.20 124.22 63.74
注: 1.本表 1978-1983 年为乡村两级数, 1984 年以后为乡镇企业全部数(以下同)。
2.1997 年乡镇企业数统计口径有所调整,与以前数据不可比(以下同)。
a) Figures for 1978-1983 included only township and village level enterprises, since 1984 figuers has been
covered all township and village enterprises(the same below).
b) In 1997 the statistical coverage of township and village enterprises was adjusted(the same below).

8/2/2019 China Labour Statistical Yearbook - 2004
http://slidepdf.com/reader/full/china-labour-statistical-yearbook-2004 379/464
7-2
TOWNSHIP AND VILLAGE ENTERPRISES
BY SECTOR AND REGION
(2003)单位: 万个 (10 000)
合 计 农林牧渔业 工 业 建筑业 交通运输 批发 住宿及 社会 其 他
Farming Fo- 企 业 仓储业 零售业 餐饮业 服务业 企 业
地 区 Region Total restry Ani- Industry Constru- Transport Wholesale Hotels and Social
mal husbandry cture Storage and Retail Catering Services Others
& Fishery Trade Services
National 2185.08 41.43 643.13 68.06 383.45 647.85 213.20 124.22 63.74
北 京 Beijing 15.09 0.45 2.31 0.50 4.96 3.63 1.34 1.69 0.21
天 津 Tianjin 13.60 3.84 0.21 3.31 4.16 1.16 0.88 0.04
河 北 Hebei 107.47 1.23 39.35 3.49 19.64 29.26 8.28 5.38 0.85山 西 Shanxi 41.15 0.69 8.50 1.46 12.68 10.58 4.26 2.35 0.63
内蒙古 Inner Mongolia 43.37 1.12 6.14 0.77 6.19 17.45 5.86 4.63 1.21
辽 宁 Liaoning 111.52 1.34 28.16 2.66 28.25 32.93 9.15 5.74 3.29
吉 林 Jilin 59.14 3.50 8.85 1.53 11.21 20.24 6.46 5.70 1.64
黑龙江 Heilongjiang 27.53 0.05 9.19 1.11 5.53 7.78 2.56 1.24 0.07
上 海 Shanghai 3.22 3.22
江 苏 Jiangsu 102.05 0.28 47.98 2.96 11.31 21.12 6.40 6.43 5.57
浙 江 Zhejiang 108.12 0.02 69.40 0.43 10.53 18.69 3.80 3.56 1.70
安 徽 Anhui 81.07 2.14 22.39 3.63 14.26 23.99 7.91 5.16 1.59
福 建 Fujian 77.07 2.12 22.68 3.52 11.83 23.59 7.17 3.75 2.40
江 西 Jiangxi 68.23 1.82 20.17 3.31 9.39 21.19 6.41 2.75 3.19
山 东 Shandong 248.36 5.46 82.05 6.07 34.68 74.21 25.64 13.18 7.07
河 南 Henan 138.45 3.44 50.30 5.21 18.89 37.04 11.73 6.05 5.79
湖 北 Hubei 101.24 3.69 27.16 4.85 15.30 29.92 12.59 5.06 2.66
湖 南 Hunan 157.54 3.61 42.71 7.57 30.93 46.25 13.67 7.31 5.47
广 东 Guangdong 136.36 1.64 36.64 5.49 18.28 48.66 12.75 6.18 6.72
广 西 Guangxi 87.50 0.83 17.31 1.70 14.90 35.44 9.53 6.20 1.57
海 南 Hainan 4.45 0.25 0.88 0.15 0.61 1.29 0.80 0.29 0.18
重 庆 Chongqing 7.34 0.16 3.47 0.29 0.57 1.56 0.91 0.20 0.17
四 川 Sichuan 152.09 3.16 32.03 3.31 29.40 49.00 18.56 11.50 5.13
贵 州 Guizhou 44.73 0.79 9.70 0.74 9.72 15.30 4.88 2.46 1.14
云 南 Yunnan 80.03 0.80 12.86 0.80 18.99 30.28 9.78 5.26 1.26
西 藏 Tibet 0.13 0.02 0.02 0.02 0.01 0.03 0.02 … 0.01
陕 西 Shaanxi 85.77 1.23 19.53 4.14 21.14 20.28 11.04 5.41 2.99
甘 肃 Gansu 25.92 0.19 6.70 0.86 5.82 7.90 2.97 1.20 0.29
青 海 Qinghai 5.69 0.04 1.25 0.07 1.37 1.79 0.64 0.27 0.25
宁 夏 Ningxia 15.40 0.07 2.84 0.64 5.29 4.05 1.28 1.14 0.08
新 疆 Xinjiang 35.46 1.27 5.48 0.57 8.49 10.24 5.63 3.22 0.55

8/2/2019 China Labour Statistical Yearbook - 2004
http://slidepdf.com/reader/full/china-labour-statistical-yearbook-2004 380/464
7-3
EMPLOYMENT IN TOWNSHIP AND VILLAGE ENTERPRISES
单位: 万人 (10 000 persons)
合 计 农林牧渔业 工 业 建筑业 交通运输 批发 住宿及 社会 其 他
年 份 Farming Fo- 企 业 仓储业 零售业 餐饮业 服务业 企 业
Year Total restry Ani- Industry Constru- Transport Wholesale Hotels and Social
mal husbandry cture Storage and Retail Catering Services Others
& Fishery Trade Services
1978 2826.56 608.42 1734.36 235.62 103.83 144.33
1979 2909.34 533.00 1814.38 298.45 116.90 146.61
1980 2999.67 456.07 1942.30 334.67 113.56 153.07
1981 2969.56 379.94 1980.80 348.83 107.38 152.61
1982 3112.91 344.00 2072.81 421.29 112.94 161.87
1983 3234.64 309.22 2168.14 482.72 109.71 164.85
1984 5208.11 283.93 3656.07 683.49 129.30 455.32
1985 6979.03 252.38 4136.70 789.95 114.18 1685.82
1986 7937.14 240.80 4761.96 270.37 541.26 1122.75
1987 8805.18 244.18 5266.69 373.98 623.14 1297.19
1988 9545.45 249.99 5703.39 1484.81 684.16 1423.10
1989 9366.78 239.30 5624.10 1403.73 699.37 1400.28
1990 9264.75 236.06 5571.69 1346.84 711.22 1398.94
1991 9609.11 243.08 5813.55 1384.33 732.31 1435.84
1992 10624.59 261.82 6336.40 1552.42 799.74 1674.34
1993 12345.30 285.40 7259.60 1826.90 931.40 1407.80
1994 12017.47 260.46 6961.51 1622.04 725.59 1614.53 418.17 415.16
1995 12862.06 313.52 7564.72 1932.52 952.03 1677.42 225.22 196.63
1996 13508.29 336.00 7860.14 1948.84 1062.32 2447.87
1997 9158.28 276.96 6149.44 1273.40 382.03 622.99 347.74 105.72
1998 12536.55 273.91 7334.23 1633.75 886.34 1418.90 767.63 221.79
1999 12704.09 247.38 7395.32 1613.45 885.72 1514.02 834.90 213.29
2000 12819.57 222.04 7466.73 1581.09 898.49 1556.93 864.04 230.25
2001 13085.58 200.03 7615.11 1564.41 902.69 1643.74 924.54 235.07
2002 13287.71 205.37 7667.61 1460.36 861.62 1691.27 830.78 301.94 268.76
2003 13572.93 290.42 7856.23 1408.44 847.95 1673.36 829.87 380.27 286.39

8/2/2019 China Labour Statistical Yearbook - 2004
http://slidepdf.com/reader/full/china-labour-statistical-yearbook-2004 381/464
7-4
EMPLOYMENT IN TOWNSHIP AND VILLAGE
ENTERPRISES BY SECTOR AND REGION
(2003)单位: 万人 (10 000 persons
合 计 农林牧渔业 工 业 建筑业 交通运输 批发 住宿及 社会 其 他
Farming 企 业 仓储业 零售业 餐饮业 服务业 企 业
地 区 Region Total Forestry Industry Constru- Transport Wholesale Hotels Social
Animal cture Storage and and Services Others
husbandry Retail Catering
and Fishery Trade Services
National 13572.9 290.4 7856.2 1408.4 847.9 1673.4 829.9 380.3 286.4
北 京 Beijing 120.8 3.2 61.4 20.3 8.1 11.8 5.2 8.4 2.4
天 津 Tianjin 139.3 97.9 7.7 9.7 13.8 5.4 3.3 1.5河 北 Hebei 903.9 12.3 540.6 97.3 62.3 111.4 46.9 24.1 8.9
山 西 Shanxi 349.5 5.2 203.4 31.7 37.2 35.8 23.5 8.3 4.5
内蒙古 Inner Mongolia 194.0 7.0 71.6 20.8 15.9 35.2 24.0 14.5 5.1
辽 宁 Liaoning 507.4 11.6 257.9 41.2 54.4 78.6 35.0 16.2 12.5
吉 林 Jilin 197.9 13.0 69.3 12.4 21.0 42.1 20.1 12.3 7.7
黑龙江 Heilongjiang 159.3 0.6 85.2 13.7 15.5 22.1 14.5 6.4 1.2
上 海 Shanghai 167.8 167.8
江 苏 Jiangsu 1044.3 4.2 792.7 78.3 27.4 62.4 29.3 22.4 27.5
浙 江 Zhejiang 1082.8 0.5 952.1 36.7 19.2 47.5 13.8 8.3 4.7
安 徽 Anhui 512.5 17.9 267.4 77.5 38.9 52.7 34.0 16.8 7.3
福 建 Fujian 595.2 23.4 363.3 54.7 30.8 69.1 28.1 12.2 13.6
江 西 Jiangxi 346.1 10.9 174.4 31.3 21.3 58.2 25.7 8.5 15.7
山 东 Shandong 1529.8 33.2 809.2 169.5 99.8 218.7 119.5 48.8 31.0
河 南 Henan 965.8 24.6 538.0 127.2 54.2 115.2 53.8 21.0 31.9
湖 北 Hubei 663.2 33.3 322.6 88.5 39.4 95.2 50.5 18.2 15.5
湖 南 Hunan 794.4 31.6 363.3 124.8 64.1 118.6 49.1 21.3 21.6
广 东 Guangdong 1227.8 12.2 854.4 63.4 37.2 129.4 72.3 25.1 33.8
广 西 Guangxi 352.5 6.4 137.4 26.6 31.8 90.7 34.4 17.9 7.4
海 南 Hainan 30.2 3.1 10.0 2.3 2.1 5.7 4.2 1.5 1.3
重 庆 Chongqing 179.0 2.7 103.3 45.9 5.1 9.9 6.8 2.1 3.2
四 川 Sichuan 678.2 15.0 304.3 102.6 47.7 102.2 55.8 30.2 20.4
贵 州 Guizhou 216.3 5.8 101.0 17.8 20.6 40.5 18.7 8.0 4.0
云 南 Yunnan 318.1 11.6 106.4 48.5 29.2 67.2 33.4 15.3 6.6
西 藏 Tibet 2.5 0.3 1.7 0.3 … 0.1 0.1 … …
陕 西 Shaanxi 393.1 7.0 153.7 67.8 49.5 54.8 37.4 14.2 8.6
甘 肃 Gansu 184.6 3.0 66.1 48.5 23.6 25.6 12.8 4.0 1.0
青 海 Qinghai 24.4 0.3 9.3 2.7 3.4 4.3 2.3 0.9 1.1
宁 夏 Ningxia 57.1 0.8 19.7 11.6 9.8 9.3 3.9 1.8 0.2
新 疆 Xinjiang 88.1 5.0 27.1 7.3 11.4 16.6 12.8 6.5 1.4

8/2/2019 China Labour Statistical Yearbook - 2004
http://slidepdf.com/reader/full/china-labour-statistical-yearbook-2004 382/464
8-1
HISTORIC FIGURES OF GENERAL CONDITION OF VOCATIONAL SCHOOLS
单位:万人,亿元 (10000 persons, 100 million yuan)
技工学 招生人数 在校学 毕业生 在职教 兼职教
校个数 生人数 人 数 职 工 文化技 生产实习 师人数
(个) Students 人 数 术理论 指导教师
Number Newly Number of Number 课教师 Produc- Part-
of Enrolled Students of Total Teachers tion Guide time
Vocational in School Graduates Teachers of Cul- Teachers Teachers
Schools and tural and
Staff Technical
年份 Year
Theory
一、绝对数
Absolute
figure
1990 4184 50.6 133.2 24.3 30.8 10.4 3.2 1.7
1995 4521 74.6 189.0 68.5 33.7 11.5 3.9 1.9
2000 3792 50.4 140.1 64.6 24.0 10.5 3.5 2.7
2001 3470 55.1 134.7 47.7 22.0 10.0 3.4 2.6
2002 3075 73.3 153.0 45.4 20.3 9.5 3.2 2.6
2003 2970 91.6 193.1 45.3 20.2 9.6 3.4 3.0
二、比上年
增长(%)
Increase overPreceding
year(%)
1995 2.1 4.5 1.0 23 -1.0 0.9 1.6 8.2
2000 -7.5 -2.3 -10.2 -2.5 -11.0 -6.9 -6.7 -6.3
2001 -8.5 9.4 -3.8 -26.1 -8.3 -4.9 -3.7 -4.1
2002 -11.4 33.0 13.6 -4.8 -7.4 -5.0 -6.8 -2.4
2003 -3.4 24.9 26.2 -0.3 -0.7 1.5 7.3 17.4

8/2/2019 China Labour Statistical Yearbook - 2004
http://slidepdf.com/reader/full/china-labour-statistical-yearbook-2004 383/464
8-2
GENERAL CONDITION OF VOCATIONAL SCHOOLS BY REGION
(2003)
技工学 在职教
校个数 劳动预备 职 工 女 性 文化技
(个) 制度定点 人 数 Female 术理论 高级 讲师 助理
Number 培 训 机 (人) 课教师 讲师 Lecturers 讲师
of 构 数 Total Teachers Senior Assis-
Voca- Teachers of Cul- Lecturers tant
tional and tural and Lecturers
Schools Staff Technical
(person) Theory
地 区 Region
Number of Labor
Pre-partory System
Training Agency
National 2970 1222 202190 77750 95900 19096 44883 23502
北 京 Beijing 47 19 3957 1901 1517 259 675 395
天 津 Tianjin 79 10 6051 2546 2364 650 1022 530
河 北 Hebei 168 18 10462 3717 5541 1030 2335 1248
山 西 Shanxi 107 54 8062 3416 3787 670 1544 1003
内 蒙 古 Inner Mongolia 55 39 4102 1844 2286 350 1214 539
辽 宁 Liaoning 174 54 11142 4781 4831 1280 2345 990
吉 林 Jilin 117 62 5261 2562 3005 591 1514 754
黑 龙 江 Heilongjiang 147 71 9454 3985 5108 1098 2162 937
上 海 Shanghai 84 16 3973 1511 1534 223 819 368
江 苏 Jiangsu 148 27 10840 3797 4956 910 2204 1497
浙 江 Zhejiang 87 31 5616 2050 3003 413 1164 907
安 徽 Anhui 95 26 4705 1467 2307 544 1177 462
福 建 Fujian 93 36 3911 1433 2073 257 832 595
江 西 Jiangxi 66 31 5538 2028 2621 631 1247 673
山 东 Shandong 244 159 20684 7210 9731 2457 4104 2309
河 南 Henan 167 81 11484 4597 5264 1042 2383 1463
湖 北 Hubei 127 66 10389 3475 5240 1181 2714 1143
湖 南 Hunan 136 67 8185 3006 3799 804 1865 806
广 东 Guangdong 186 52 12783 4832 6080 733 3022 1890
广 西 Guangxi 64 17 5012 1973 2390 349 1370 544
海 南 Hainan 12 2 796 319 370 55 127 144
重 庆 Chongqing 66 20 3496 1217 1466 402 746 260
四 川 Sichuan 125 54 8200 3206 3978 681 2009 1005
贵 州 Guizhou 56 13 2747 1029 1184 172 635 309
云 南 Yunnan 48 21 4466 1815 2221 363 1109 519
陕 西 Shaanxi 131 72 8870 3179 3725 945 1699 774
甘 肃 Gansu 56 28 3260 1323 1566 235 836 388
青 海 Qinghai 15 6 1224 479 589 94 293 175宁 夏 Ningxia 12 12 1293 568 690 174 289 204
新 疆 Xinjiang 58 58 6227 2484 2674 503 1428 671

8/2/2019 China Labour Statistical Yearbook - 2004
http://slidepdf.com/reader/full/china-labour-statistical-yearbook-2004 384/464
8-3
TRAINING OF VOCATIONAL SCHOOLS BY REGION
(2003)
单位:人 (person)
招生学 招生人数 在校学
校 数 Students 高级班 女 生 农业户 生人数 女 生
(所) Newly 学 生 Female 口学生 Number of Female
Number Enrolled Senior New Students
of Class Students in School
School from
地 区 Region
Rural
National 2442 916363 90503 303037 499936 1931423 622916
北 京 Beijing 47 28817 1198 10259 16794 71187 25695
天 津 Tianjin 65 16796 746 5897 5381 51977 20806
河 北 Hebei 148 30215 1098 11156 13073 73875 33685
山 西 Shanxi 105 24641 836 7866 16125 50241 18321
内 蒙 古 Inner Mongolia 49 9053 598 2748 2124 18813 5701
辽 宁 Liaoning 129 35764 1359 8830 11129 61334 15894
吉 林 Jilin 80 11348 889 3737 5096 23058 7623
黑 龙 江 Heilongjiang 93 17104 1303 5251 2659 31789 12164
上 海 Shanghai 44 16382 4259 3529 45111 12405
江 苏 Jiangsu 129 71764 14000 24226 36582 151628 55199
浙 江 Zhejiang 80 33494 3879 8969 18012 70650 21775
安 徽 Anhui 87 27411 2169 11550 14088 56431 22093
福 建 Fujian 85 31872 2112 11354 23292 66439 24842
江 西 Jiangxi 63 29700 3182 12433 20237 67342 26218
山 东 Shandong 189 105896 23303 35508 66749 212811 72167
河 南 Henan 119 56856 4406 17118 38561 112422 37049
湖 北 Hubei 125 53884 1460 20178 21586 97186 681
湖 南 Hunan 107 47807 4908 17882 32098 87931 32331
广 东 Guangdong 141 99703 10730 25878 48980 239537 57842
广 西 Guangxi 60 25912 563 8313 15047 57933 20432
海 南 Hainan 12 4220 430 1137 1235 7753 2358
重 庆 Chongqing 62 24438 955 8274 16423 41735 15604
四 川 Sichuan 121 35608 2936 14846 28058 73678 30095
贵 州 Guizhou 30 8301 730 2526 4102 17204 5152
云 南 Yunnan 41 12414 859 4112 7392 30434 10469
陕 西 Shaanxi 115 36191 3694 12077 20760 71962 24112
甘 肃 Gansu 41 6169 614 2085 2883 12356 4308
青 海 Qinghai 8 1251 223 454 709 2483 798
宁 夏 Ningxia 9 2700 391 979 899 6783 2187
新 疆 Xinjiang 58 10652 932 3135 6333 19340 4910

8/2/2019 China Labour Statistical Yearbook - 2004
http://slidepdf.com/reader/full/china-labour-statistical-yearbook-2004 385/464
8-4
EMPLOYMENT TRAINNING CENTERS BY REGION
(2003)
就业训 在职教 兼职教 经费来
练中心 拥有实 劳动预备 职工总 教 师 师人数 源总计 财政补
个 数 习场地 制度定点 人 数 Teachers (人) (万元) 助 费
(个) Centers 培 训 机 (人) Part- Resouses Financial
Number with 构 数 Total time of Funds Allowance
of Emplo- Practical Number Teachers Teachers (10000
yment Sites of Labor and (person) yuan)
Trainning Preparat- Staff
Centers ory System (person)
Training
地 区 Region
Agency
National 3307 3002 2147 37424 21803 25720 99590.2 25088.5
北 京 Beijing 19 19 15 614 336 648 5859.0 313.9
天 津 Tianjin 19 19 11 367 117 242 1526.2 56.4
河 北 Hebei 233 214 159 2086 1329 1469 3585.6 722.1
山 西 Shanxi 100 70 34 717 448 338 885.1 287.3
内 蒙 古 Inner Mon 123 100 42 852 470 538 1614.2 535.3
辽 宁 Liaoning 137 137 102 1394 967 1234 577.3 260.4
吉 林 Jilin 68 68 54 501 280 334 978.2 494.6
黑 龙 江 Heilongji 165 135 129 1388 847 670 3591.5 2313.5
上 海 Shanghai
江 苏 Jiangsu 146 121 90 1455 779 1721 9459.6 938.7
浙 江 Zhejiang 104 100 36 649 273 890 4446.1 1624.8
安 徽 Anhui 94 94 49 889 577 703 1770.0 340.0
福 建 Fujian 124 97 61 653 293 755 1817.5 494.9
江 西 Jiangxi 116 116 104 1639 912 1185 1718.6 917.9
山 东 Shandong 147 147 147 3717 2225 1787 11810.1 1219.3
河 南 Henan 148 138 87 1426 782 1744 4415.3 1325.7
湖 北 Hubei 154 148 123 2186 1190 1151 3251.3 696.7
湖 南 Hunan 298 298 266 4654 2909 1821 7468.5 2097.3
广 东 Guangdong 222 216 130 3897 2324 2366 16834.9 3882.0
广 西 Guangxi 101 90 63 594 222 658 2317.8 423.7
海 南 Hainan 30 24 21 545 365 96 115.7 78.5
重 庆 Chongqing 42 41 18 299 177 350 1067.8 303.1
四 川 Sichuan 158 148 89 1362 787 1255 3297.4 1661.5
贵 州 Guizhou 81 48 10 505 288 376 1003.1 465.7
云 南 Yunnan 119 95 73 908 569 547 1347.3 531.6
西 藏 Tibet
陕 西 Shaanxi 117 117 105 1986 1033 1533 2112.8 350.0
甘 肃 Gansu 90 74 59 541 337 403 1045.8 442.8青 海 Qinghai 31 8 21 206 118 164 526.6 83.9
宁 夏 Ningxia 25 24 4 181 80 188 168.3 111.9
新 疆 Xinjiang 96 96 45 1213 769 554 4978.7 2115.4

8/2/2019 China Labour Statistical Yearbook - 2004
http://slidepdf.com/reader/full/china-labour-statistical-yearbook-2004 386/464
8-5
GENERAL CONDITIONS OF COMMUNE-RUN
VOCATIONAL TRAINING AGENCIES BY REGION
(2003)
职业培 在职教 兼职 经费来
训机构 劳动预备 职 工 教 师 教师 源总计
个 数 制度定点 人 数 Teachers (人) (万元)
(个) 培 训 机 (人) Part-time Resouses
Number of 构 数 Total Teachers of Funds
Vocational Number Teachers (person) (10000 yuan)
Training of Labor and
Agencies Preparatory Staff
System (person)
Training
地 区 Region
Agencies
National 19139 2758 175317 115785 58643 585455.0 3951212.7 3955508.2 1904951.6
北 京 Beijing 457 45 7656 3905 4175 16677.8 107251 137090 78259
天 津 Tianjin 252 10 4218 2350 1615 7182.5 68011 65217 40025
河 北 Hebei 947 98 9378 6002 2753 23527.3 127228.9 224103.1 95090.4
山 西 Shanxi 253 101 2051 1312 562 3271.9 22264.2 23053.2 10390.4
内 蒙 古 Inner Mongolia 253 16 1531 1091 559 1079.7 8332.4 7939.3 3594.1
辽 宁 Liaoning 695 87 5353 3371 1655 11067.1 92890 179939 37803
吉 林 Jilin 691 294 3649 2666 1001 3125.8 27600 27357 12569
黑 龙 江 Heilongjiang 896 138 4129 2931 1183 4557.1 36539.5 31507.5 13319
上 海 Shanghai 436 22 9640 3576 936 13344.0 100370 126180 73840
江 苏 Jiangsu 1348 118 14151 9158 5837 32184.3 234818.1 299206.1 112221.1
浙 江 Zhejiang 1054 89 6673 4356 3258 1430.6 13840 14403 8097
安 徽 Anhui 597 155 5491 3796 1484 8044.2 65141 69386 38807
福 建 Fujian 377 95 3184 2203 1686 6257.0 38511.7 55333.1 25368.6
江 西 Jiangxi 705 134 5736 4202 1732 4426.7 32957 37057 18721
山 东 Shandong 1184 216 14471 10603 4025 36223.3 274660 361131 190592
河 南 Henan 1110 115 9183 6396 2894 11207.2 78187.8 84600.9 38942.1
湖 北 Hubei 914 134 7426 5493 2106 7477.4 55714.8 63141.6 29815.8
湖 南 Hunan 569 167 5917 4701 1922 8341.7 67153.2 73612.2 31811.5
广 东 Guangdong 2422 116 15966 11731 5098 24930.4 198169 228324.4 121915.4
广 西 Guangxi 398 75 4306 2780 1022 9937.9 61293.8 64073.2 40009.6
海 南 Hainan 139 34 786 452 465 292.8 1857 2015 502.6
重 庆 Chongqing 896 69 9227 6675 3587 8051.7 64847 72727 39142
四 川 Sichuan 848 199 7679 4971 2590 8988.2 50118 69386 35704
贵 州 Guizhou 196 35 3883 2207 1452 2552.1 18540.4 23721.6 12582.7
云 南 Yunnan 205 76 1295 903 368 1059.4 8475.2 6453.9 2145.5
西 藏 Tibet
陕 西 Shaanxi 500 5200 3000 2200 318000.0 2000000 1500000 750000
甘 肃 Gansu 345 65 2814 1978 806 6707.6 57341.7 60869.3 17996.9
青 海 Qinghai 111 13 630 465 201 332.5 591 3392.8 1918
宁 夏 Ningxia 93 13 610 439 133 392.6 3661 3813 2410
新 疆 Xinjiang 248 29 3084 2072 1338 4784.3 34848 40475 21359

8/2/2019 China Labour Statistical Yearbook - 2004
http://slidepdf.com/reader/full/china-labour-statistical-yearbook-2004 387/464
8-6
STATISTICS OF OCCUPATIONAL SKILL TESTING BY REGION
(2003)
单位:人 (person)
年 末 职 业
技 能 鉴 定 鉴定所数 鉴定站数 工考委数
机 构 数 Testing Testing Workers
(个) Agencies Stations Assessing
Numbe of Testing Committees
地 区 Region
Agencies
National 7252 4780 2293 179
of Which:Subto- 1131 1128 3
tal of Industrial
Administrations
of Which:Subto- 6121 4780 1165 176
tal of Local
Goveinments
北 京 Beijing 86 86
天 津 Tianjin 93 61 23 9
河 北 Hebei 275 251 24
山 西 Shanxi 239 238 1
内 蒙 古 Inner Mongolia 158 111 45 2
辽 宁 Liaoning 113 113
吉 林 Jilin 194 189 5
黑 龙 江 Heilongjiang 103 103
上 海 Shanghai 43 35 8
江 苏 Jiangsu 141 107 10 24
浙 江 Zhejiang 216 99 117
安 徽 Anhui 362 135 227
福 建 Fujian 298 292 6
江 西 Jiangxi 354 244 110
山 东 Shandong 288 150 138
河 南 Henan 403 229 112 62
湖 北 Hubei 385 385
湖 南 Hunan 372 365 3 4
广 东 Guangdong 655 602 53
广 西 Guangxi 216 112 44 60
海 南 Hainan 44 44
重 庆 Chongqing 144 144
四 川 Sichuan 122 66 56
贵 州 Guizhou 149 149 0
云 南 Yunnan 154 154 0
西 藏 Tibet 10 10
陕 西 Shaanxi 182 88 94
甘 肃 Gansu 56 56青 海 Qinghai 53 26 13 14
宁 夏 Ningxia 41 40 1
新 疆 Xinjiang 112 62 50
新疆生产建设兵团
Xinjiang Production and
Construction Crops
60 44 16

8/2/2019 China Labour Statistical Yearbook - 2004
http://slidepdf.com/reader/full/china-labour-statistical-yearbook-2004 388/464
9-1
LABOUR DISPUTES ACCEPTED AND SETTLED BY REGION
单位:件
上期未结 案件受理情况 Cases Accepted
案 件 数 当期案件
Number of 受 理 数 集体劳动争 劳 动 者
年 份 Cases Cases 议 案 件 数 申 诉
Year Left from Number of 案 件 数
Last Collective Number
Year-end Labour of Cases
Disputes Appealed
by Laborers
1996 2634 47951 3150 41697
1997 2864 71524 4109 68773
1998 3475 93649 6767 84829
1999 3840 120191 9043 114152
2000 6374 135206 8247 120043
2001 8739 154621 9847 146781
2002 12472 184116 11024 172253
2003 16276 226391 10823 215512
劳动者当
事 人 数 集体劳动争议劳
年 份 (人) 动者当事人人数
Year Number of (人)
Laborers Involved Number of
Laborers Involved
in Collective
Labour Disputes
1996 189120 92203
1997 221115 132647
1998 358531 251268
1999 473957 319241
2000 422617 259445
2001 556230 286680
2002 608396 374956
2003 801042 514573

8/2/2019 China Labour Statistical Yearbook - 2004
http://slidepdf.com/reader/full/china-labour-statistical-yearbook-2004 389/464
9-2
LABOUR DISPUTES ACCEPTED AND SETTLED
(2003)
单位:件 (piece)
上期未 案件受理情况 Cases Accepted
结案数 当期案件
Number of 受 理 数 集体劳动争 用 人 单
Cases Left Cases 议案 件 数 位 申 诉
from Last Number of 案 件 数
Year-end Collective Number of
Labour Cases Appea-
Disputes led by Units
Total 16276 226391 10823 10879
1.国有企业 State-owned Enterprises 4263 48771 3623 3158
2.集体企业 Collective-owned Enterprises 1483 30218 1519 1357
3.港澳台及外资企业 2061 23391 1121 1124
Hongkong,Macao,Taiwan Chinese-funded and
Foreign-funded Enterprises
4.股份制联营 Share-holding Joint Ownership Enterprises 1981 23451 733 884
5.有限责任公司 Limited Liability Cooporations 3056 47814 1801 2438
6.私营企业 Private Enterprises 1895 31537 1248 1257
7.个体工商户 Individual Economy 386 9603 343 270
8.机关社团事业 State Organs,Mass 488 5937 221 255
Organizations and Institutions
9.其他 Other 663 5669 214 136
劳动者当
劳 动 者 事 人 数 女性当事 集体劳动争议劳
申 诉 (人) 人 人 数 动者当事人数
案 件 数 Number of (人) (人)
Number Laborers Females Number of
of Cases Involved Laborers Involved
Appealed in Collective
by Laborers Labour Disputes
总 计 215512 801042 221569 514573
1.国有企业 State-owned Enterprises 45613 309439 121307 294794
2.集体企业 Collective-owned Enterprises 28861 97501 19123 47796
3.港澳台及外资企业 22264 89621 19769 45798
Hongkong,Macao,Taiwan Chinese-funded and
Foreign-funded Enterprises
4.股份制联营 Share-holding Joint Ownership Enterprises 22567 63649 8096 18456
5.有限责任公司 Limited Liability Cooporations 45376 126537 24053 54613
6.私营企业 Private Enterprises 30280 73627 19418 37720
7.个体工商户 Individual Economy 9333 19763 5314 6880
8.机关社团事业 State Organs,Mass 5682 9532 2179 3704
Organizations and Institutions
9.其他 Other 5536 11373 2310 4812
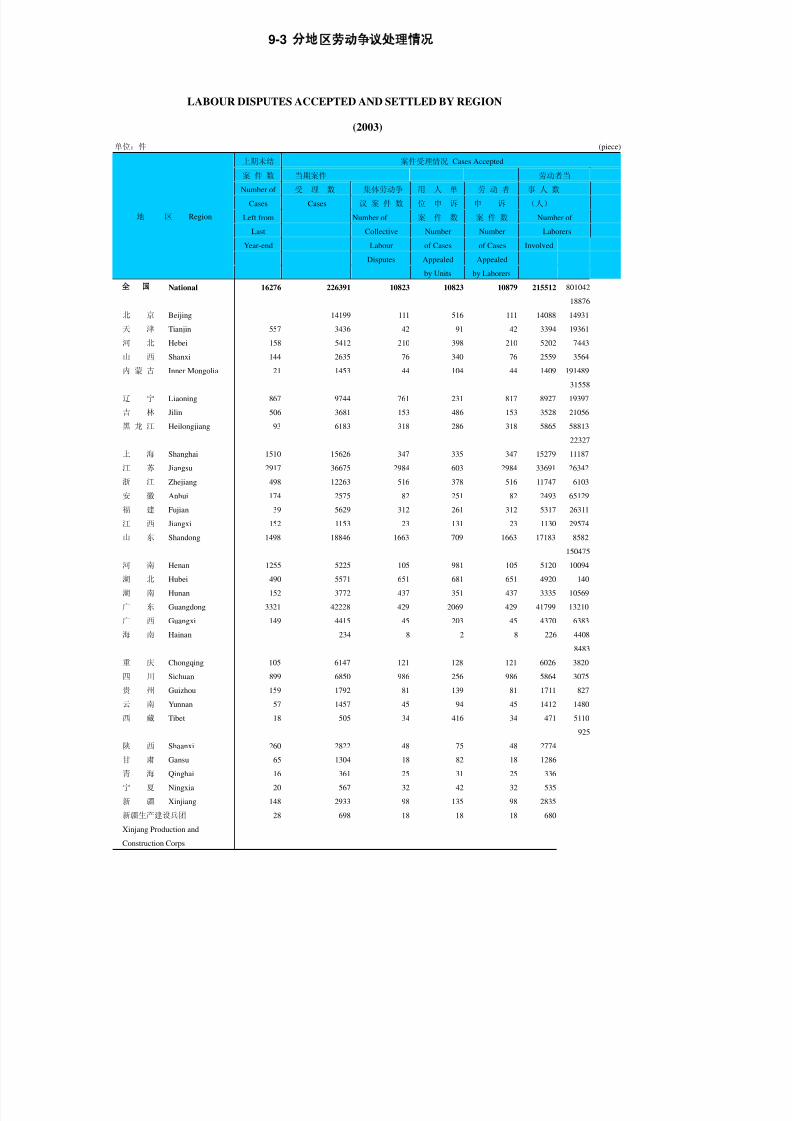
8/2/2019 China Labour Statistical Yearbook - 2004
http://slidepdf.com/reader/full/china-labour-statistical-yearbook-2004 390/464
9-3
LABOUR DISPUTES ACCEPTED AND SETTLED BY REGION
(2003)
单位:件 (piece)
上期未结 案件受理情况 Cases Accepted
案 件 数 当期案件 劳动者当
Number of 受 理 数 集体劳动争 用 人 单 劳 动 者 事 人 数
Cases Cases 议 案 件 数 位 申 诉 申 诉 (人)
Left from Number of 案 件 数 案 件 数 Number of
Last Collective Number Number Laborers
Year-end Labour of Cases of Cases Involved
Disputes Appealed Appealed
地 区 Region
by Units by Laborers
National 16276 226391 10823 10823 10879 215512 801042
18876
北 京 Beijing 14199 111 516 111 14088 14931 天 津 Tianjin 557 3436 42 91 42 3394 19361
河 北 Hebei 158 5412 210 398 210 5202 7443
山 西 Shanxi 144 2635 76 340 76 2559 3564
内 蒙 古 Inner Mongolia 21 1453 44 104 44 1409 191489
31558
辽 宁 Liaoning 867 9744 761 231 817 8927 19397
吉 林 Jilin 506 3681 153 486 153 3528 21056
黑 龙 江 Heilongjiang 93 6183 318 286 318 5865 58813
22327
上 海 Shanghai 1510 15626 347 335 347 15279 11187
江 苏 Jiangsu 2917 36675 2984 603 2984 33691 26342
浙 江 Zhejiang 498 12263 516 378 516 11747 6103
安 徽 Anhui 174 2575 82 251 82 2493 65129
福 建 Fujian 39 5629 312 261 312 5317 26311
江 西 Jiangxi 152 1153 23 131 23 1130 29574
山 东 Shandong 1498 18846 1663 709 1663 17183 8582
150475
河 南 Henan 1255 5225 105 981 105 5120 10094
湖 北 Hubei 490 5571 651 681 651 4920 140
湖 南 Hunan 152 3772 437 351 437 3335 10569
广 东 Guangdong 3321 42228 429 2069 429 41799 13210
广 西 Guangxi 149 4415 45 203 45 4370 6383
海 南 Hainan 234 8 2 8 226 4408
8483
重 庆 Chongqing 105 6147 121 128 121 6026 3820
四 川 Sichuan 899 6850 986 256 986 5864 3075
贵 州 Guizhou 159 1792 81 139 81 1711 827
云 南 Yunnan 57 1457 45 94 45 1412 1480
西 藏 Tibet 18 505 34 416 34 471 5110
925
陕 西 Shaanxi 260 2822 48 75 48 2774
甘 肃 Gansu 65 1304 18 82 18 1286
青 海 Qinghai 16 361 25 31 25 336
宁 夏 Ningxia 20 567 32 42 32 535 新 疆 Xinjiang 148 2933 98 135 98 2835
新疆生产建设兵团 28 698 18 18 18 680
Xinjang Production and
Construction Corps

8/2/2019 China Labour Statistical Yearbook - 2004
http://slidepdf.com/reader/full/china-labour-statistical-yearbook-2004 391/464
10-1
CASES SETTLED BY LABOUR AND SOCIAL SECURITY INSPECTION ORGANIZATION
2003
单位:件
案件分类 Cases by Caused Reasons
结案数
养老保险费 征 缴 失业保险费 征 缴 医疗保险费 征 缴 职业中介
Cases Settled Levy of Pension InsuranceLevy of Unemployment
InsuranceLevy of Medical Insurance Labour Exchanges Medi
总计 Total 263567 41490 15492 5136
案件分类 Cases by Caused Reasons
女职工特殊劳动保护 劳动合同的订立和解除 收取风险抵押金 克扣、无故拖欠工
Special Protection for Female Workers and EmployeesSignation and Termination of
Labour ContractCollection of Risk Depoists Deducted and Delaid Payment witho
总计 Total 2114 64264 23617
案件分类 Cases by Caused Reasons 案件处理情况 Settlement o
最低工资支付 工作时间和休息、休假 职业资格与职业培训 其他 责令限 期改正
Minimum
Wage
Payment
Working Hours, Rest and
Vocations
Vocational Qualification and
Vocational TrainingOthers Order to Make Correcti
总计 Total 7463 11987 10893 13621
案件处理情况 Settement of Cases
行政处罚分类 Classification of Administrative Punishment Notice
行政处理决定 行政处罚决定
警告 罚款 其他行政处罚
Circulate a Notice of
Administrative
Settlement
Circulate a Notice of
Administrative Punishment
Warning Fine Others
总计 Total 10069 22011 7562 16980

8/2/2019 China Labour Statistical Yearbook - 2004
http://slidepdf.com/reader/full/china-labour-statistical-yearbook-2004 392/464
10-2
LAOUR AND SOCIAL SECURITY INSPECTION
(2003)
主动监察 Inspection on Initiative
检查单位数(万
户)Employing Units
Inspected (10000)
涉及劳动者人数
(万人) Laborers
Involved (10000
persons)
群众举报专查结案数(万件)Cases Settled through
Inspection upon Reporting
总计
Total 110.7 7987.4 16.6
追发劳动者工资等待遇 Repay Wages and otherBenefits
涉及劳动者人数(万人)金 额
(亿元)
劳动保障年检单位数(万
户)Employing Units
Inspected in Annually
Inspection (10000)
补签劳动合同
(万人)Number
of Labor
Contracts Signed
for Inspection
(10000 persons)Laborers Involved
(10000 persons)
Amount of Money (100
million yuan)
总计
Total 117.2 895.0 602.5 27.2
督促缴费 Levy for Inspection
单位数(万户) 金额 (亿元)
Units Involved(10000)
Amount of
Money (100
million yuan)
督促登记单位数(万户) Registeration for Inspection
Units Involved (10000)
总计
Total 14.9 37.2 8.8
取缔非法 清退风 审查用 纠正用人
职 业 中 险抵押 人单位 单位违法
介 机 构 金金额 规章数 规 章 数
(户) (万元) (万件) (万件)
Number of Illegal
Occupational
Intermediary Agencies
Number of
Money Repaid to
Employees
(10000 Yuan)
Number of Regulations of
Employing Units
Inspected(10000)
Number of Regulations of
Employing Units
Corrected(10000)
总计
Total 6585 11871.0 61.3 16.0

8/2/2019 China Labour Statistical Yearbook - 2004
http://slidepdf.com/reader/full/china-labour-statistical-yearbook-2004 393/464
11-1
HISTORIC FIGURES OF RETIREES AT THE YEAR-END
合 计 离休人员 退休人员 领取定期离退休、退职人数
与职
Total Termination Retirees 生活费的工人数的比例(以
离退
年 份 退职人员 休、退职人数为 1)
Year Resignation Proportion to
Staff and Workers
(Number of
terminated
retired andresigned=1)
一、 绝对数(万人)
Absolute figure
( 10000 persons )
1985 1637.0 112.0 1476.0 49.0 1:7.5
1990 2301.0 182.0 2037.0 82.0 1:6.1
1995 3094.1 199.5 2802.9 91.7 1:4.8
2000 3875.8 169.7 3621.0 85.1 1:3.5
2001 4017.7 158.7 3777.8 81.2 1:3.2
2002 4222.8 152.9 3990.4 79.5 1:3.0
2003 4523.4 140.9 4303.1 79.4 1:2.7
二、比上年增长(%)
Increase over
Preceding year ( % )
1985 10.8
1990 4.5 5.2 4.9 -5.7
1995 5.6 -0.7 6.5 -4.5
2000 4.0 -3.5 4.4 3.4
2001 3.7 -6.5 4.3 -4.4
2002 5.1 -3.7 5.6 -2.1
2003 7.1 -7.8 7.8 -0.1
注: 本表包括民政部门和总后勤部事业单位支付离休、退休、退职费的人数。
a) Includes retired and resigned staff and workers under civil adm administrtion organs and General Logistics Department.

8/2/2019 China Labour Statistical Yearbook - 2004
http://slidepdf.com/reader/full/china-labour-statistical-yearbook-2004 394/464
11-2
HISTORIC FIGURES OF RETIREES OF ENTERPRISES AT THE YEAR-END
合 计 离休人员 退休人员 领取定期
年 份 Total Termination Retirees 生活费的
Year 退职人员
Resignation
一、 绝对数(万人)
Absolute figure
( 10000 persons )
1995 2366.1 100.7 2195.2 70.2
2000 2977.9 86.6 2821.6 69.7
2001 3072.4 79.7 2925.5 67.2
2002 3261.4 79.7 3116.0 65.7
2003 3486.4 73.7 3345.9 66.8
二、比上年增长(%)
Increase over
Preceding year ( % )
1995 5.7 0.1 6.2 -2.6
2000 3.8 -2.4 4.0 5.4
2001 3.2 -8.0 3.7 -3.6
2002 6.2 -8.1 6.5 -2.2
2003 6.9 -8.2 7.4 1.7
三、构成(以合计为 100)
Composition (Total=100)
1995 100.0 4.3 92.7 3.0
2000 100.0 2.9 94.8 2.3
2001 100.0 2.6 95.2 2.22002 100.0 2.5 95.5 2.0
2003 100.0 2.1 96.0 1.9
注:本表不包括民政部门支付离休、退休、退职费的人数。
a) Excluded retired and resigned s taff and workers paid by the civil administration depts.

8/2/2019 China Labour Statistical Yearbook - 2004
http://slidepdf.com/reader/full/china-labour-statistical-yearbook-2004 395/464
11-3 ( )
NUMBER OF RETIREES AT THE YEAR-END BY REGION(1)
(2003)
单位:人 ( person)
地 区 Region 合计 Total离休人员
Termination 退休人员 Retirees
领取定期生活费
的退职人员
Resignation
National 45234656 1408943 43031372 794341
#民政部门 235797 235797
Civil Administration
Department
总后事业单位 32068 1313 30431 324
General Logistics
Department
北 京 Beijing 2031434 57999 1926273 47162
天 津 Tianjin 1143872 21671 1108323 13878
河 北 Hebei 1916485 90422 1790449 35614
山 西 Shanxi 1165470 71682 1079907 13881
内蒙古 Inner Mongolia 787910 27700 748806 11404
辽 宁 Liaoning 3270607 111593 3090852 68162
吉 林 Jilin 1322188 49526 1249400 23262
黑龙江 Heilongjiang 2290856 86935 2159013 44908
上 海 Shanghai 2548250 34370 2482047 31833
江 苏 Jiangsu 3018714 76807 2875009 66898
浙 江 Zhejiang 1638420 34266 1560621 43533
安 徽 Anhui 1413023 53171 1336625 23227
福 建 Fujian 862760 20308 828559 13893
江 西 Jiangxi 1027293 20504 995990 10799
山 东 Shandong 2116823 121920 1946497 48406
河 南 Henan 2043231 95476 1924549 23206
湖 北 Hubei 2246993 45859 2162783 38351
湖 南 Hunan 1965265 44448 1898594 22223
广 东 Guangdong 2302941 55939 2230938 16064
广 西 Guangxi 1002500 17243 973511 11746
海 南 Hainan 329791 5125 307808 16858
重 庆 Chongqing 1067049 13373 1033624 20052
四 川 Sichuan 2328902 33523 2258803 36576贵 州 Guizhou 733297 18285 708741 6271
云 南 Yunnan 1053422 31230 1011370 10822
西 藏 Tibet 59689 733 58778 178
陕 西 Shaanxi 1126271 44202 1056155 25914
甘 肃 Gansu 697466 23714 661426 12326
青 海 Qinghai 233790 8269 221010 4511
宁 夏 Ningxia 193417 7110 182646 3661
新 疆 Xinjiang 1028203 51001 946884 30318
新 疆 生 产 建 设 兵 团
Xinjiang Production and Construction
Crops
472053 33226 420747 18080
注:本表包括民政部门和总后勤部支付离休、退休、退职费的人数。
a) Includes retired and resigned staff and workers under civil administration and General Logistics Department.

8/2/2019 China Labour Statistical Yearbook - 2004
http://slidepdf.com/reader/full/china-labour-statistical-yearbook-2004 396/464
11-4 ( )
NUMBER OF RETIREES AT THE YEAR END BY REGION 2
(2003)
单位:人 (person)
地 区 Region 合计
Total 女性
Female
离休人员
Termination
退休人员
Retirees
领取定期生活费
的退职人员
Resignation
National 44966791 18720496 1407630 42765144 794017
北 京 Beijing 1795637 944496 57999 1690476 47162
天 津 Tianjin 1106385 539328 21671 1070836 13878
河 北 Hebei 1910799 710263 90422 1784763 35614
山 西 Shanxi 1152185 378302 71682 1066622 13881
内蒙古 Inner Mongolia 784390 267612 27700 745286 11404
辽 宁 Liaoning 3267679 1520871 111593 3087924 68162
吉 林 Jilin 1300114 521887 49526 1227326 23262
黑龙江 Heilongjiang 2285793 808237 86935 2153950 44908
上 海 Shanghai 2545662 1407751 34370 2479459 31833
江 苏 Jiangsu 3014197 1337249 76807 2870492 66898
浙 江 Zhejiang 1623701 740471 34266 1545902 43533
安 徽 Anhui 1405468 518461 53171 1329070 23227
福 建 Fujian 858443 319749 20308 824242 13893
江 西 Jiangxi 1018527 394684 20504 987224 10799
山 东 Shandong 2111231 805470 121920 1940905 48406
河 南 Henan 2027250 772262 95476 1908568 23206
湖 北 Hubei 2238682 971586 45859 2154472 38351
湖 南 Hunan 1952964 807995 44448 1886293 22223
广 东 Guangdong 2293137 1043008 55939 2221134 16064
广 西 Guangxi 994741 387032 17243 965752 11746
海 南 Hainan 327167 154288 5125 305184 16858
重 庆 Chongqing 1065787 429741 13373 1032362 20052
四 川 Sichuan 2325183 853943 33523 2255084 36576
贵 州 Guizhou 723789 274320 18285 699233 6271
云 南 Yunnan 1051415 407392 31230 1009363 10822
西 藏 Tibet 51464 19710 733 50553 178
陕 西 Shaanxi 1125385 399374 44202 1055269 25914
甘 肃 Gansu 689946 222953 23714 653906 12326
青 海 Qinghai 230439 69132 8269 217659 4511
宁 夏 Ningxia 192440 65230 7110 181669 3661
新 疆 Xinjiang 1027902 418400 51001 946583 30318
新疆生产建设兵团 468889 209299 33226 417583 18080
注:本表不包括民政部门支付离休、退休、退职费的人数。
a) Excluded retired and resigned staff and workers paid by the civil adminstration depts.

8/2/2019 China Labour Statistical Yearbook - 2004
http://slidepdf.com/reader/full/china-labour-statistical-yearbook-2004 397/464
11-5
RETIREES OF ENTERPRISES AT THE YEAR-END BY REGION
(2003)
单位:人 (person)
总计 Total
地 区 Region 合计
Total 女 性
Female
离休人员
Termination 退休人员 Retirees
领取定期生活费的
退职人员
Resignation
National 34864070 15169954 737059 33459051 667960
北 京 Beijing 1465327 768670 31897 1389693 43737
天 津 Tianjin 940450 451377 12288 915891 12271
河 北 Hebei 1429281 551065 40232 1360298 28751
山 西 Shanxi 885022 295052 36016 838996 10010
内蒙古 Inner Mongolia 551063 199290 11775 530463 8825
辽 宁 Liaoning 2805596 1357749 67737 2674203 63656
吉 林 Jilin 1041799 420874 26089 996363 19347
黑龙江 Heilongjiang 1870578 673667 50234 1783187 37157
上 海 Shanghai 2200379 1216809 19693 2150719 29967
江 苏 Jiangsu 2401884 1133411 35857 2304769 61258
浙 江 Zhejiang 1249655 594017 14215 1198806 36634
安 徽 Anhui 1050363 406378 24765 1005830 19768
福 建 Fujian 626401 237224 9591 606892 9918
江 西 Jiangxi 761054 317083 10409 741222 9423
山 东 Shandong 1617945 678241 62228 1522628 33089
河 南 Henan 1453341 582051 41470 1392407 19464
湖 北 Hubei 1803066 813737 25165 1744165 33736
湖 南 Hunan 1429600 608466 20707 1389885 19008
广 东 Guangdong 1739063 834588 26813 1700724 11526
广 西 Guangxi 669039 289693 7879 652936 8224
海 南 Hainan 264001 133200 2918 244927 16156
重 庆 Chongqing 825623 346837 6830 800937 17856
四 川 Sichuan 1680677 630379 17507 1633324 29846
贵 州 Guizhou 472507 190886 7799 459856 4852
云 南 Yunnan 721479 308600 13119 700012 8348
西 藏 Tibet 25105 10139 136 24902 67
陕 西 Shaanxi 843930 312325 22757 803430 17743
甘 肃 Gansu 503429 178587 13549 481251 8629
青 海 Qinghai 150395 48896 3524 144612 2259
宁 夏 Ningxia 138553 49061 2915 133674 1964
新 疆 Xinjiang 803442 333391 39819 737054 26569
新疆生产建设兵团 444023 198211 31126 394995 17902
注:本表不包括民政部门支付离休、退休、退职费的人数。
a) Excluded retired and resigned staff and workers paid by the civil adminstration depts.

8/2/2019 China Labour Statistical Yearbook - 2004
http://slidepdf.com/reader/full/china-labour-statistical-yearbook-2004 398/464
11-6
RETIREES OF INSTITUTIONS AT THE YEAR-END BY REGION
(2003)
单位:人 (person)
总计 Total
地 区 Region 合计
Total 女性
Female
离休人员
Termination
退休人员
Retirees
领取定期生活费
的退职人员
Resignation
National 7200516 2740306 332586 6785862 82068
北 京 Beijing 228836 121375 13168 212831 2837
天 津 Tianjin 112621 77681 5239 106174 1208
河 北 Hebei 321869 122009 22942 295809 3118
山 西 Shanxi 176113 61292 15395 157944 2774
内蒙古 Inner Mongolia 156086 48597 6528 147994 1564
辽 宁 Liaoning 353562 137141 25394 324394 3774
吉 林 Jilin 204691 85183 15120 186837 2734
黑龙江 Heilongjiang 287831 99095 18729 263781 5321
上 海 Shanghai 299145 165428 8561 288769 1815
江 苏 Jiangsu 488398 177381 21791 462548 4059
浙 江 Zhejiang 282820 122345 8977 268661 5182
安 徽 Anhui 247471 85385 12743 232038 2690
福 建 Fujian 160539 63271 4671 153685 2183
江
西Jiangxi
183786 59805 4554 178134 1098
山 东 Shandong 340912 92540 30522 300864 9526
河 南 Henan 396237 137764 28545 365481 2211
湖 北 Hubei 312626 108996 10747 299019 2860
湖 南 Hunan 381330 154506 13213 366267 1850
广 东 Guangdong 397930 164369 12678 382532 2720
广 西 Guangxi 215912 68326 3836 209366 2710
海 南 Hainan 44691 16815 630 43592 469
重 庆 Chongqing 166341 66000 3092 161953 1296
四 川 Sichuan 445057 165056 7682 432903 4472
贵 州 Guizhou 161957 59493 3752 157492 713
云 南 Yunnan 207244 72022 7288 198353 1603
西 藏 Tibet 16072 5741 203 15826 43
陕 西 Shanxi 213695 69947 11954 196794 4947
甘 肃 Gansu 135629 34412 5109 128652 1868
青 海 Qinghai 45016 12891 1356 42639 1021
宁 夏 Ningxia 38082 12226 1956 35286 840
新 疆 Xinjiang 158166 63588 4919 150839 2408
新疆生产建设兵团 19851 9626 1292 18405 154
注:本表不包括民政部门支
a) Excluded retired and resigned s taff and workers Paid by the civil adminstrtion organs.

8/2/2019 China Labour Statistical Yearbook - 2004
http://slidepdf.com/reader/full/china-labour-statistical-yearbook-2004 399/464
11-7
RETIREES OF STATE ORGANS AT THE YEAR-END BY
REGION
(2003)单位:人 (person)
总计 Total
地 区 Region
合计
Total 女性
Female
离休人员
Termination
退休人员
Retirees
领取定期生活
费的退职人员
Resignation
National 2902205 810236 337985 2520231 43989
北 京 Beijing 101474 54451 12934 87952 588
天 津 Tianjin 53314 10270 4144 48771 399
河 北 Hebei 159649 37189 27248 128656 3745
山 西 Shanxi 91050 21958 20271 69682 1097
内蒙古 Inner Mongolia 77241 19725 9397 66829 1015
辽 宁 Liaoning 108521 25981 18462 89327 732
吉 林 Jilin 53624 15830 8317 44126 1181
黑龙江 Heilongjiang 127384 35475 17972 106982 2430
上 海 Shanghai 46138 25514 6116 39971 51
江 苏 Jiangsu 123915 26457 19159 103175 1581
浙 江 Zhejiang 91226 24109 11074 78435 1717
安 徽 Anhui 107634 26698 15663 91202 769
福 建 Fujian 71503 19254 6046 63665 1792
江 西 Jiangxi 73687 17796 5541 67868 278
山 东 Shandong 152374 34689 29170 117413 5791
河 南 Henan 177672 52447 25461 150680 1531
湖 北 Hubei 122990 48853 9947 111288 1755
湖 南 Hunan 142034 45023 10528 130141 1365
广 东 Guangdong 156144 44051 16448 137878 1818
广 西 Guangxi 109790 29013 5528 103450 812
海 南 Hainan 18475 4273 1577 16665 233
重 庆 Chongqing 73823 16904 3451 69472 900
四 川 Sichuan 199449 58508 8334 188857 2258
贵 州 Guizhou 89325 23941 6734 81885 706
云 南 Yunnan 122692 26770 10823 110998 871
西 藏 Tibet 10287 3830 394 9825 68
陕 西 Shaanxi 67760 17102 9491 55045 3224
甘 肃 Gansu 50888 9954 5056 44003 1829
青 海 Qinghai 35028 7345 3389 30408 1231
宁 夏 Ningxia 15805 3943 2239 12709 857
新 疆 Xinjiang 66294 21421 6263 58690 1341
新 疆 生 产 建 设 兵 团
Xinjiang Production and
Construction Crops
5015 1462 808 4183 24
注:本表不包括民政部门支
a) Excluded retired and resigned staff and workers Paid by the civil adminstration organs.

8/2/2019 China Labour Statistical Yearbook - 2004
http://slidepdf.com/reader/full/china-labour-statistical-yearbook-2004 400/464
11-8
NUMBER OF RETIREES PAID BY CIVIL ADMINISTRATION DEPARTMENTS
(2003)
单位:人 (person)
合 计
Total 退休人员 本年接收
Admitted
Retirees This 其中:退休人员
Year Retirees
地 区 Region
National 235797 235797 11507 11507
北 京 Beijing 37487 37487 973 973
天 津 Tianjin 5686 5686 100 100
河 北 Hebei 13285 13285 839 839
山 西 Shanxi 3520 3520 185 185
内蒙古 Inner Mongolia 2928 2928 118 118
辽 宁 Liaoning 22074 22074 509 509
吉 林 Jilin 5063 5063 390 390
黑龙江 Heilongjiang 2588 2588 394 394
上 海 Shanghai 4517 4517 632 632
江 苏 Jiangsu 14719 14719 537 537
浙 江 Zhejiang 7555 7555 76 76
安 徽 Anhui 4317 4317 81 81
福 建 Fujian 8766 8766 203 203
江 西 Jiangxi 5592 5592 34 34
山 东 Shandong 15981 15981 590 590
河 南 Henan 8311 8311 339 339
湖 北 Hubei 12301 12301 812 812
湖 南 Hunan 9804 9804 163 163
广 东 Guangdong 7759 7759 1523 1523
广 西 Guangxi 2624 2624 45 45
海 南 Hainan 1262 1262 37 37
重 庆 Chongqing 3719 3719 138 138
四 川 Sichuan 9508 9508 209 209
贵 州 Guizhou 2007 2007 23 23
云 南 Yunnan 8225 8225 50 50
西 藏 Tibet 886 886
陕 西 Shaanxi 7520 7520 617 617
甘 肃 Gansu 3351 3351 122 122
青 海 Qinghai 977 977 2 2
宁 夏 Ningxia 301 301
新 疆 Xinjiang 3164 3164 766 766
新疆生产建设兵团 Xinjiang Production and
Construction Crops
注:本表退休人员含离休人员的人数。
a) Included terminated worker in retired staff.

8/2/2019 China Labour Statistical Yearbook - 2004
http://slidepdf.com/reader/full/china-labour-statistical-yearbook-2004 401/464
11-9
HISTORIC FIGURES OF PENSIONS FOR RETIREES
离休、退休、退职费用总额 (亿元) 平均每人离
Pensions for Retirees 休、退休、退
企 业
(100 million yuan) 职费用(元)
Enterprises
年 份 合 计 企 业 事 业 机 关 Average
Year Total 民政部 总后事 Enter- Instit- State Pensions
门支付 业单位 prises utions Organs for Retirees
Civil General (yuan)
Affair Logistic
Department Department
一、绝对数
Absloute figure
1985 145.6 3.7 935
1990 396.2 7.2 307.1 62.6 26.4 1760 1664
1995 1305.6 19.4 915.6 275.6 114.1 4335 3976
2000 2733.3 36.4 3.4 1846.6 635.2 251.6 7190 6318
2001 3072.0 44.3 3.4 1988.5 768.9 313.8 7784 6573
2002 3659.4 51.0 3.6 2417.2 873.0 369.2 8881 7633
2003 4148.9 56.7 3.6 2684.6 1032.4 431.9 9485 7957
二、比上年增长 %
Increace over
preceding year
1985 37.2 23.3 22.1
1995 25.1 10.9 25.8 24.4 20.6 18.6 20.7
2000 12.9 23.0 9.7 10.2 19.6 17.2 8.7 6.3
2001 12.4 21.7 7.7 21.0 24.7 8.3 4.0
2002 19.1 15.1 5.9 21.6 13.5 17.7 14.1 16.1
2003 13.4 11.2 11.1 18.3 17.0 6.8 4.2
注: 1.本表数字不包括离休、退休、退职职工的医疗卫生费。
2.本表 1985 年的数字不包括据有关规定发给离休、退休、退职职工的肉类等价格补贴。
3.事业单位包括民政部门和总后事业单位支付离休、退休、退职费的数据。
A) Excluded the personnel health care. B)Figures of 1985-1988 excluded price subsidies.
C)Institutions include pensions for retirees of civil affair department and general logistic department.

8/2/2019 China Labour Statistical Yearbook - 2004
http://slidepdf.com/reader/full/china-labour-statistical-yearbook-2004 402/464
11-10
HISTORIC FIGURES OF RETIREES AND THEIR AVERAGE PENSION
企 业 Enterprises
合 计 Total 离休人员 Temination 总 计 Total
合 计 Total离休人员
Termination
年末人数(万
人)
Number of
Retirees at
Year-end
(10000
persons)
离休、退休、
退职费(亿元)
Pensions(100
million yuan)
人均离休、退
休、退职费
(元)
Average
Pension(yuan)
年末人数(万
人)
Number of
Retirees at
Year-end
(10000
persons)
离休、退休、
退职费(亿元)
Pensions(100
million yuan)
人均离休、退
休、退职费
(元)
Average
Pension(yuan)
年末人数(万
人)
Number of
Retirees at
Year-end
(10000
persons)
离休金(亿元)
Pensions for
Termintion
(100 million
yuan)
一、绝对数
Absloute
figure
1990 2270.6 388.9 1713 1845.8 307.1 1664 92.9 25.4 1995 3065.5 1285.9 4311 .2366.0 915.6 3976 100.7 66.2
2000 3848.0 2693.6 7137 2978.0 1846.6 6318 86.7 105.3
2001 3989.9 3024.3 7717 3072.4 1988.5 6573 79.7 113.7
2002 4196.0 3604.8 8807 3261.4 2417.2 7633 79.7 143.7
2003 4496.7 4088.6 9407 3486.4 2866.2 7957 73.7 135.2
二、比上年
增长(%)
Increace
over prece-
ding year
1995 5.7 25.3 18.7 5.7 25.8 20.7 16.5
2000 4.0 12.8 8.5 3.8 10.2 6.3 -2.3 5.0
2001 3.7 3.9 8.1 3.2 7.7 4.0 -8.1 8.0
2002 5.2 19.2 14.1 6.2 21.6 16.1 26.4
2003 7.2 13.4 6.8 6.9 18.6 4.2 -7.5 -6.0
注:1.本表不包括民政部门和总后事业单位支付离休、退休、退职费的数字。
2.退休人员包括退职人员。
Note:a)Data of this table excluded terminated, retired and resigned staff and workers
under civil administrtion organs and General Logistics Department.
b)Retirees include persons resignated.

8/2/2019 China Labour Statistical Yearbook - 2004
http://slidepdf.com/reader/full/china-labour-statistical-yearbook-2004 403/464
11-11
HISTORIC FIGURES OF TOTAL SOCIAL INSURANCE AND WELFARE FUND OF RETIREES
合 计 离 休 金 退 休 金 退职生活费 医 疗 其 他
年 份 Total Pensions Retirement Resignation 卫 生 费 Others
Year for Pensions Allowances Medical
Termination for Living Care
Expenses Expenses
一、绝对数(亿元)
Absolute figure
(100 million yuan)
1990 465.2 34.6 239.4 5.0 76.2 1
1995 1522.4 121.9 986.3 15.3 236.3 1
2000 3040.5 201.1 2305.7 30.3 346.9 1
2001 3337.2 223.4 2618.7 27.8 312.9 1
2002 3870.7 263.7 3143.0 33.4 266.0 1
2003 4359.9 269.5 3592.1 37.6 271.3 1
二、比上年增长(%)
Increase over
Preceeding year(%)
1995 24.9 18.1 28.7 23.4 22.6
2000 12.3 8.1 13.3 11.4 8.4
2001 9.8 11.1 13.6 -8.3 -9.8
2002 16.0 18.0 20.0 20.1 -15.0
2003 12.6 2.2 14.3 12.6 2.0
三、构成(以合计为 100)
Composition(Total=100)
1990 100 7.4 51.5 1.1 16.4
1995 100 8.0 64.8 1.0 15.5
2000 100 6.6 75.8 1.0 11.4
2001 100 6.7 78.5 0.8 9.4
2002 100 6.8 81.2 0.9 6.9
2003 100 6.2 82.4 0.8 6.2
注: 本表不包括民政部门支付的离休、退休、退职费。
a) Excluded retired and resigned s taff and workers paid by the Civil Administration Organs.

8/2/2019 China Labour Statistical Yearbook - 2004
http://slidepdf.com/reader/full/china-labour-statistical-yearbook-2004 404/464
11-12
HISTORIC FIGURES OF TOTAL SOCIAL INSURANCE
AND WEIFARE FUND OF RETIREES OF ENTERPRISES
合 计 离 休 金 退 休 金 退职生活费 医 疗 其 他
Total Pensions Retirement Resigna- 卫 生 费 Others
年 份 for Pensions ation Medical
Year Termination Allowances Care
for Living
Expenses
一、绝对数(亿元)
Absolute figure
(100 million yuan)
1995 1082.5 57.2 722.5 11.4 166.8 124.6
2000 2071.1 99.4 1618.8 24.0 224.5 104.4
2001 2193.7 108.2 1762.4 20.7 204.2 97.22002 2596.6 137.7 2152.2 25.5 179.5 101.7
2003 2866.0 135.0 2412.0 29.0 182.0 109.0
二、比上年增长(%)
Increase over
Preceeding year(%)
1995 24.4 18.4 28.6 25.3 17.1 15.3
2000 9.8 5.1 10.6 10.6 6.0 9.1
2001 5.9 8.9 8.9 -13.7 -9.0 -6.9
2002 18.4 27.3 22.1 23.2 -12.1 4.6
2003 10.4 -2.0 12.1 13.7 1.4 7.2
三、构成(以合计为 100)
Composition(Total=100)
1995 100.0 5.3 66.7 1.1 15.4 11.5
2000 100.0 4.8 78.2 1.2 10.8 5.0
2001 100.0 5.0 80.4 0.9 9.3 4.4
2002 100.0 5.3 82.9 1.0 6.9 3.9
2003 100.0 4.7 84.2 1.0 6.4 3.8
注: 本表不包括民政部门支付的离休、退休、退职费。
a) Excluded retired and resigned staff and workers paid by the Civil Administration Organs.

8/2/2019 China Labour Statistical Yearbook - 2004
http://slidepdf.com/reader/full/china-labour-statistical-yearbook-2004 405/464
11-13
AVERAGE PENSIONS IN 2002 AND 2003 BY REGION
2002
合 计 Total 企 业 Enterprises 事业 Institutions
离休、退 人均离 离休人员 Termination 退休人员 Retirees 离休人员 Termination
休 、退 休、退 离休金 人均离 退休金 人均退 离休金 人均离
地 区 Region 职 费 休、退 (亿元) 休 金 (亿元) 休 金 (亿元) 休 金
(亿元) 职 费 Pensions (元) Reti- (元) Pensions (元)
Pensions (元) for Ter- Average remnt Average for Ter- Average
(100 Pension mination Termi- Pensions Retir- mination Termi-
million Per- (100 nation (100 ement (100 nation
yuan) Person million Pension million pension million Pension
(yuan) yuan) (yuan) yuan) (yuan) yuan) (yuan)
National 3604.8 8807 143.7 18032 2273.4 7364
北 京 Beijing 199.9 11186 9.9 19389 140.6 9881 天 津 Tianjin 103.9 9998 2.5 19527 64.9 7477
河 北 Hebei 153.9 9074 7.2 17135 92.9 7596
山 西 Shanxi 87.4 7979 5.8 15311 52.3 6417
内 蒙 古 Inner Mongolia 60.9 8025 2.2 17018 33.9 6516
辽 宁 Liaoning 243.2 7725 15.6 21089 168.3 6447
吉 林 Jilin 98.5 8115 4.4 14139 64.2 6959
黑 龙 江 Heilongjiang 147.3 7362 10.6 18967 99.0 6123
上 海 Shanghai 269.9 11089 6.0 29408 210.2 10068
江
苏Jiangsu 214.5 8428 7.7 19719 168.3 8019
浙 江 Zhejiang 163.1 11363 2.9 19496 99.7 9083
安 徽 Anhui 104.5 8032 4.8 17067 59.5 6360
福 建 Fujian 72.9 9797 1.8 19948 37.3 7303
江 西 Jiangxi 70.2 7457 1.4 12110 39.5 5864
山 东 Shandong 199.9 10291 11.9 18663 115.5 8353
河 南 Henan 146.8 7847 6.6 14074 84.8 6458
湖 北 Hubei 137.2 7369 4.3 14044 93.2 6570
湖 南 Hunan 115.2 6969 2.9 15239 70.9 5993
广 东 Guangdong 181.7 8721 5.1 16152 101.5 6753
广 西 Guangxi 69.9 8422 1.2 14304 36.0 6739
海 南 Hainan 20.1 6319 0.7 19215 11.7 4618
重 庆 Chongqing 71.0 6679 1.1 15094 44.5 5397
四 川 Sichuan 168.7 7714 3.3 16778 97.3 6194
贵 州 Guizhou 63.1 9420 1.7 19986 34.0 7895
云 南 Yunnan 103.1 10551 2.9 20263 52.7 8111
西 藏 Tibet 9.5 21037 0.0 11652 2.7 12827
陕 西 Shaanxi 82.2 8071 3.6 15062 48.4 6619
甘 肃 Gansu 62.9 9924 2.6 18418 37.4 8236
青 海 Qinghai 29.5 13477 0.8 24446 14.5 10521
宁 夏 Ningxia 17.1 9138 0.5 13413 10.0 7742 新 疆 Xinjiang 99.1 12818 6.5 25933 59.1 11114
新疆生产建设兵团 Xinjiang
Production and Construction
Crops
37.5 8249 5.1 16033 28.7 7170
注:1.本表不包括民政部门和总后事业单位支付离休、退休、退职费的数字。
2.退休人员包括退职人员。
a) Excluded retired and resigned staff and workers under civil administrtion organs and General Logistics Department.
b)Retirees include persons resignated.

8/2/2019 China Labour Statistical Yearbook - 2004
http://slidepdf.com/reader/full/china-labour-statistical-yearbook-2004 406/464
11-14
NUMBER OF RETIREES AND THEIR TOTAL
SOCIAL INSURANCE AND WELFARE FUNDS
(2003)
离休、退休、退职人员年末人数(万人)
Number of Retirees(10000 persons)
合计 Total
女性 Female
离休人员 Termi-
nation
退休人员 Retirees 领取定期生活费的退职人员
Resignation
一、企业 Enterprises 3486.4 1517.0 73.7 3345.966.8
1.内资企业 Domestic Enterprises 3452.4 1502.0 73.2 3312.9
66.3
①国有企业 State-owned Enterprises 2393.6 976.7 60.1 2294.1 39.4
②集体企业 Collective-owned 617.5 319.4 6.2 594.7 16.6
Enterprises
③其他企业 Other Enterprises 441.3 206.0 7.0 424.1
10.2
2.港、澳、台商投资企业16.6 7.7 0.1 16.1 0.3
Hongkong,
Macao and Taiwan
Chinese-Funded
Enterprises
3.外商投资企业 Foreign-Funded17.5 7.3 0.3 16.9 0.2
Enterprises
二、事业 Institutions 720.1 274 33.3 678.6 8.2
三、机关 State Organs 290.2 81 33.8 252 4.4
保险福利费用构成(亿元) Social Insurance and Welfare
Funds of Retirees (100 million yuan)
合计 Total 离休金 Pensions
for Termi-nation
退休金 Retiremnt
Pensions
退职生活费
Resignation
Allowances for
Living Expenses
医疗卫生费
Medical care 其他 Others
一、企业 Enterprises 2866.2 135.2 2411.6 29.2 181.6 108.6
1.内资企业 Domestic Enterprises 2835.3 134.6 2383.9 28.9 180.5 107.5
①国有企业 State-owned Enterprises 2071.7 109.3 1715.7 16.9 142.9 86.8
②集体企业 Collective-owned 401.3 11.5 359.1 7.3 15.7 7.8
Enterprises
③其他企业 Other Enterprises 362.4 13.8 309.1 4.7 21.9 12.9
2.港、澳、台商投资企业 14.9 0.2 13.6 0.2 0.5 0.4
Hongkong,
Macao and Taiwan
Chinese-Funded
Enterprises
3.外商投资企业 Foreign-Funded 15.9 0.4 14.1 0.1 0.6 0.8
Enterprises 二、事业 Institutions 1031.7 65.9 848.1 5.5 59.6 52.6
三、机关 State Organs 462.0 68.4 332.3 2.9 30.1 28.2

8/2/2019 China Labour Statistical Yearbook - 2004
http://slidepdf.com/reader/full/china-labour-statistical-yearbook-2004 407/464
11-15
TOTAL SOCIAL INSURANCE AND WELFARE FUND OF RETIREES BY REGION
(2003)
单位:万元 (10000 yuan)
地 区 Region 合计
Total
离休金
Pensions for
Termination
退休金
Retirement
Pensions
退职生活费
Resignation
Allowances for
Living Expenses
医疗卫生费
Medical Care
Expenses
其 他
Others
National 43599053.3 2695138.5 35920788.2 375660.6 2712966.2 1894499.9
北 京 Beijing 2311786.5 137786.6 1765777.0 25801.7 222572.8 159848.4
天 津 Tianjin 1136250.0 51122.5 978888.5 7165.5 64498.4 34575.1
河 北 Hebei 1761592.6 170778.7 1410939.7 16856.6 112133.0 50884.6山 西 Shanxi 1003677.9 110957.7 787058.1 5342.4 60990.5 39329.2
内蒙古 Inner Mongolia 741854.3 49271.7 620653.3 4524.9 39734.9 27669.5
辽 宁 Liaoning 2559786.3 204879.2 2119806.6 21032.9 106313.4 107754.2
吉 林 Jilin 1093223.1 82987.2 902459.3 8629.9 66175.7 32971.0
黑龙江 Heilongjiang 2052220.6 147425.9 1646924.3 17518.2 135178.2 105174.0
上 海 Shanghai 2962753.1 110812.1 2681121.2 23084.1 19040.7 128695.0
江 苏 Jiangsu 3238683.5 192183.5 2668997.0 44550.8 196206.6 136745.6
浙 江 Zhejiang 2137029.6 84762.6 1702279.1 27377.1 206310.3 116300.5
安 徽 Anhui 1184264.3 95492.6 973076.4 9358.8 78722.1 27614.5
福 建 Fujian 912974.1 50491.7 784728.0 9596.5 38707.4 29450.5
江 西 Jiangxi 828352.6 29268.5 719693.6 4067.2 54394.8 20928.4
山 东 Shandong 2273045.2 240055.6 1810088.3 23961.8 112038.3 86901.2
河 南 Henan 1727706.9 146418.0 1432502.2 11021.6 86262.1 51503.0
湖 北 Hubei 1844236.0 78661.5 1486418.5 15685.2 152750.5 110720.3
湖 南 Hunan 1565749.1 72850.8 1331392.8 7547.6 91352.4 62605.4
广 东 Guangdong 2590169.0 112734.7 2050374.9 11114.4 279342.0 136603.0
广 西 Guangxi 900085.9 28750.0 741571.0 5269.9 46111.6 78383.4
海 南 Hainan 228330.4 11598.4 193367.8 4872.2 14569.2 3922.8
重 庆 Chongqing 834388.4 22340.0 697085.9 7135.7 72845.2 34981.6
四 川 Sichuan 1873839.4 59116.4 1658671.5 15943.5 71614.9 68493.1
贵 州 Guizhou 770703.1 36435.4 630542.0 2287.6 66449.3 34988.8
云 南 Yunnan 1148669.5 65211.2 964353.5 5468.4 68163.1 45473.3
西 藏 Tibet 116673.1 2357.6 103447.6 142.7 6380.2 4345.0
陕 西 Shaanxi 1022115.5 73509.7 821005.9 7289.6 79066.9 41243.4
甘 肃 Gansu 734907.5 45976.5 618911.7 4518.2 33004.5 32496.6
青 海 Qinghai 311591.2 19971.5 267849.1 2358.7 5900.5 15511.4
宁 夏 Ningxia 201007.8 12000.4 155967.7 1751.7 15556.7 15731.3
新 疆 Xinjiang 1129111.6 93111.6 895008.2 16666.1 83722.1 40603.6
新疆生产建设兵团 XinjiangProduction and Construction Crops
402275.2 55818.6 299827.6 7719.0 26857.8 12052.2

8/2/2019 China Labour Statistical Yearbook - 2004
http://slidepdf.com/reader/full/china-labour-statistical-yearbook-2004 408/464
11-16
TOTAL SOCIAL INSURANCE AND WEIFARE FUND
OF RETIREES OF ENTERPRISES BY REGION
(2003)单位:万元 (10000 yuan)
地 区 Region 合计
Total
离休金
Pensions for
Termination
退休金
Retirement
Pensions
退职生活费
Resignation
Allowances for
Living Expenses
医疗卫生费
Medical Care
Expenses
其 他
Others
National 28661965.8 1352070.3 24115928.1 291834.4 1815649.6 1086483.4
北 京 Beijing 1667203.0 79385.4 1368764.2 23297.7 136835.7 58920.0
天 津 Tianjin 848424.2 26627.3 752174.4 5905.4 39801.8 23915.3
河 北 Hebei 1145103.6 73432.6 943196.7 9750.2 86096.0 32628.1
山 西 Shanxi 653410.1 55139.2 527508.0 3273.6 44723.6 22765.7
内蒙古 Inner Mongolia 420925.2 19453.2 345425.7 2968.4 30539.4 22538.5
辽 宁 Liaoning 1944228.1 127515.9 1645253.5 18401.1 76787.1 76270.5
吉 林 Jilin 747388.0 43596.7 638503.4 7107.3 32463.7 25716.9
黑龙江 Heilongjiang 1481824.4 81727.5 1193023.5 10783.7 104784.1 91505.6
上 海 Shanghai 2372993.9 62649.0 2187086.2 21467.1 15726.8 86064.8
江 苏 Jiangsu 2002890.8 83017.1 1714685.4 37469.4 118913.6 48805.3
浙 江 Zhejiang 1348282.9 29148.5 1091786.9 21079.6 147533.2 58734.7
安 徽 Anhui 710736.5 43742.9 594148.0 7273.5 47522.1 18050.0
福 建 Fujian 537538.7 21033.8 466886.9 4737.4 25114.3 19766.3
江 西 Jiangxi 485876.0 13775.5 424237.5 3294.2 33417.4 11151.4
山 东 Shandong 1528979.8 116487.1 1241851.9 17971.1 77590.8 75079.0
河 南 Henan 1038963.3 63754.2 873789.6 8673.0 58004.1 34742.4
湖 北 Hubei 1231594.4 45661.1 1045830.1 13316.4 104741.0 22045.8
湖 南 Hunan 950184.2 30925.6 826715.7 5573.8 55146.4 31822.7
广 东 Guangdong 1601729.6 43721.8 1305804.5 6744.9 177608.1 67850.3
广 西 Guangxi 518565.3 12809.8 417655.5 3259.0 30551.7 54289.3
海 南 Hainan 141443.6 6378.5 118397.2 4485.5 9869.6 2312.8
重 庆 Chongqing 539876.6 10858.1 452565.4 5482.4 51267.5 19703.2
四 川 Sichuan 1103130.3 28423.8 984578.4 11772.0 44536.2 33819.9
贵 州 Guizhou 438710.4 16352.1 363131.3 1603.4 36486.4 21137.2
云 南 Yunnan 638648.1 27117.8 530583.0 3929.9 49028.0 27989.4
西 藏 Tibet 34592.8 207.1 29873.2 49.9 2976.4 1486.2
陕 西 Shaanxi 654885.7 35095.1 538447.5 5878.1 51340.2 24124.8
甘 肃 Gansu 454215.7 24891.7 385011.9 3196.8 23034.9 18080.4
青 海 Qinghai 168965.6 8123.0 148516.5 1002.7 1737.3 9586.1
宁 夏 Ningxia 123769.9 4717.8 99098.1 889.5 10938.5 8126.0
新 疆 Xinjiang 769241.3 66308.3 594886.7 13605.4 67299.8 27141.1
新疆生产建设兵团
Xinjiang Production and
Construction Crops
357643.7 49992.8 266511.3 7591.9 23234.0 10313.7

8/2/2019 China Labour Statistical Yearbook - 2004
http://slidepdf.com/reader/full/china-labour-statistical-yearbook-2004 409/464
11-17
TOTAL SOCIAL INSURANCE AND WELFARE FUND OF
RETIREES OF DOMESTIC ENTERPRISES BY REGION
(2003)单位:万元 (10000 yuan)
地 区 Region 合计
Total
离休金
Pensions for
Termination
退休金
Retirement
Pensions
退职生活费
Resignation
Allowances for
Living Expenses
医疗卫生费
Medical Care
Expenses
其 他
Others
National 28353230.5 1346128.5 23838900.8 288524.4 1804811.7 1074865.1
北 京 Beijing 1638653.2 79000.9 1344579.8 23018.4 135548.0 56506.1
天 津 Tianjin 796020.3 26390.4 701927.6 5779.2 39305.4 22617.7
河 北 Hebei 1137191.6 73092.8 936706.4 9637.1 85381.4 32373.9
山 西 Shanxi 652454.6 55096.7 526680.3 3272.3 44643.6 22761.7
内蒙古 Inner Mongolia 420363.4 19440.1 344903.0 2968.0 30523.5 22528.8
辽 宁 Liaoning 1932406.9 127075.8 1634441.7 18327.6 76516.2 76045.6
吉 林 Jilin 745441.0 43509.7 636852.5 7070.8 32340.0 25668.0
黑龙江 Heilongjiang 1480369.5 81709.6 1191663.4 10782.7 104747.8 91466.0
上 海 Shanghai 2314221.6 62014.0 2133830.1 21203.1 15152.7 82021.7
江 苏 Jiangsu 1971711.7 82541.0 1686460.4 36456.3 117855.9 48398.1
浙 江 Zhejiang 1315208.1 28741.9 1061752.1 20636.6 146166.1 57911.4
安
徽Anhui
708649.0 43597.2 592447.1 7246.3 47366.3 17992.1
福 建 Fujian 527856.2 20924.3 457908.0 4580.8 24748.2 19694.9
江 西 Jiangxi 485673.1 13775.5 424062.3 3283.5 33402.8 11149.0
山 东 Shandong 1514775.4 114570.0 1230904.9 17470.3 77175.9 74654.4
河 南 Henan 1035063.3 63619.0 870152.0 8655.5 57941.2 34695.7
湖 北 Hubei 1225463.5 45613.3 1040448.3 13271.9 104141.0 21989.0
湖 南 Hunan 947557.7 30828.1 824270.7 5552.8 55098.3 31807.9
广 东 Guangdong 1571334.5 43608.1 1278612.9 6655.2 175507.5 66950.8
广 西 Guangxi 516792.9 12772.4 416205.1 3219.7 30433.2 54162.5
海 南 Hainan 141420.4 6378.5 118374.6 4485.5 9869.3 2312.5
重 庆 Chongqing 535278.0 10682.6 449092.7 5451.9 50564.3 19486.5
四 川 Sichuan 1101458.9 28400.8 982964.8 11756.5 44521.9 33814.9
贵 州 Guizhou 438369.4 16339.1 362823.9 1601.6 36474.0 21130.8
云 南 Yunnan 638100.1 27089.2 530144.2 3929.9 48966.3 27970.5
西 藏 Tibet 34592.8 207.1 29873.2 49.9 2976.4 1486.2
陕 西 Shaanxi 654405.3 35090.0 538031.2 5877.4 51314.4 24092.3
甘 肃 Gansu 454055.7 24885.5 384883.5 3194.5 23021.2 18071.0
青 海 Qinghai 168965.6 8123.0 148516.5 1002.7 1737.3 9586.1
宁 夏 Ningxia 122812.4 4717.8 98280.0 889.5 10859.6 8065.5
新 疆 Xinjiang 768920.6 66301.3 594596.4 13605.0 67278.1 27139.8
新疆生产建设兵团 Xinjiang Production and
Construction Crops
357643.7 49992.8 266511.3 7591.9 23234.0 10313.7

8/2/2019 China Labour Statistical Yearbook - 2004
http://slidepdf.com/reader/full/china-labour-statistical-yearbook-2004 410/464
11-18
TOTAL SOCIAL INSURANCE AND WELFARE FUND OF
RETIREES OF STATE-OWNED ENTERPRISES BY REGION
(2003)单位:万元 (10000 yuan)
地 区 Region 合计
Total
离休金
Pensions for
Termination
退休金
Retirement
Pensions
退职生活费
Resignation
Allowances for
Living Expenses
医疗卫生费
Medical Care
Expenses
其 他
Others
National 20716501.9 1093114.2 17157175.4 169003.3 1429060.9 868148.2
北 京 Beijing 1039465.9 50698.3 839235.2 9666.2 92303.3 47562.9
天 津 Tianjin 576662.2 20815.3 502284.3 3290.3 32626.9 17645.4
河 北 Hebei 872875.1 56497.6 712631.5 6411.5 69441.7 27892.8
山 西 Shanxi 578690.6 50280.9 463311.7 2358.1 42132.8 20607.1
内蒙古 Inner Mongolia 267805.8 14150.3 204222.3 1716.3 28503.8 19213.1
辽 宁 Liaoning 1409983.9 99423.3 1169067.1 10538.2 65185.9 65769.4
吉 林 Jilin 625295.7 39342.8 532916.3 4333.4 29122.6 19580.6
黑龙江 Heilongjiang 1319662.0 77580.9 1043254.4 8985.8 100375.6 89465.3
上 海 Shanghai 1575951.9 51267.0 1439288.0 7562.1 12357.0 65477.8
江 苏 Jiangsu 1113919.5 57276.9 929511.9 16928.1 78498.0 31704.6
浙 江 Zhejiang 607043.2 19905.3 462235.7 8449.3 95518.3 20934.6
安 徽 Anhui 497462.3 35012.7 407229.3 3694.0 37133.5 14392.8
福 建 Fujian 375097.9 15849.1 325181.3 3196.5 18427.9 12443.1
江 西 Jiangxi 395402.1 12693.1 342712.0 2569.8 27961.6 9465.6
山 东 Shandong 906811.7 68775.2 740458.4 4071.0 44959.4 48547.7
河 南 Henan 765594.4 51263.3 636686.5 5842.8 42371.7 29430.1
湖 北 Hubei 914264.7 39572.2 768444.1 7956.8 80836.6 17455.0
湖 南 Hunan 743043.5 26828.5 634198.6 4236.4 48934.4 28845.5
广 东 Guangdong 1064389.4 34642.0 850962.6 4875.6 120910.2 52999.0
广 西 Guangxi 395370.9 10490.4 315152.2 2206.1 23043.4 44478.8
海 南 Hainan 127665.9 5687.2 106664.1 4420.3 8850.5 2043.8
重 庆 Chongqing 405488.7 8743.7 334571.3 3426.0 42210.0 16537.7
四 川 Sichuan 847453.2 24741.9 748232.0 8768.1 37526.5 28184.7
贵 州 Guizhou 402455.9 15452.9 331005.8 1441.9 34214.7 20340.6
云 南 Yunnan 529814.6 23168.2 435598.1 3388.0 43586.7 24073.6
西 藏 Tibet 34387.2 207.1 29679.6 48.6 2968.0 1483.9
陕 西 Shaanxi 579199.6 32243.1 472794.9 4066.6 47449.1 22645.9
甘 肃 Gansu 407733.9 22729.6 343726.2 2560.3 22046.4 16671.4
青 海 Qinghai 152440.4 7981.1 133698.7 791.5 1500.7 8468.4
宁 夏 Ningxia 108330.4 4647.0 85666.0 843.2 9585.4 7588.8
新 疆 Xinjiang 719544.3 65154.4 550476.3 12777.7 65244.4 25891.5
新疆生产建设兵团 Xinjiang Production and
Construction Crops
357195.2 49992.8 266078.9 7582.9 23234.0 10306.6
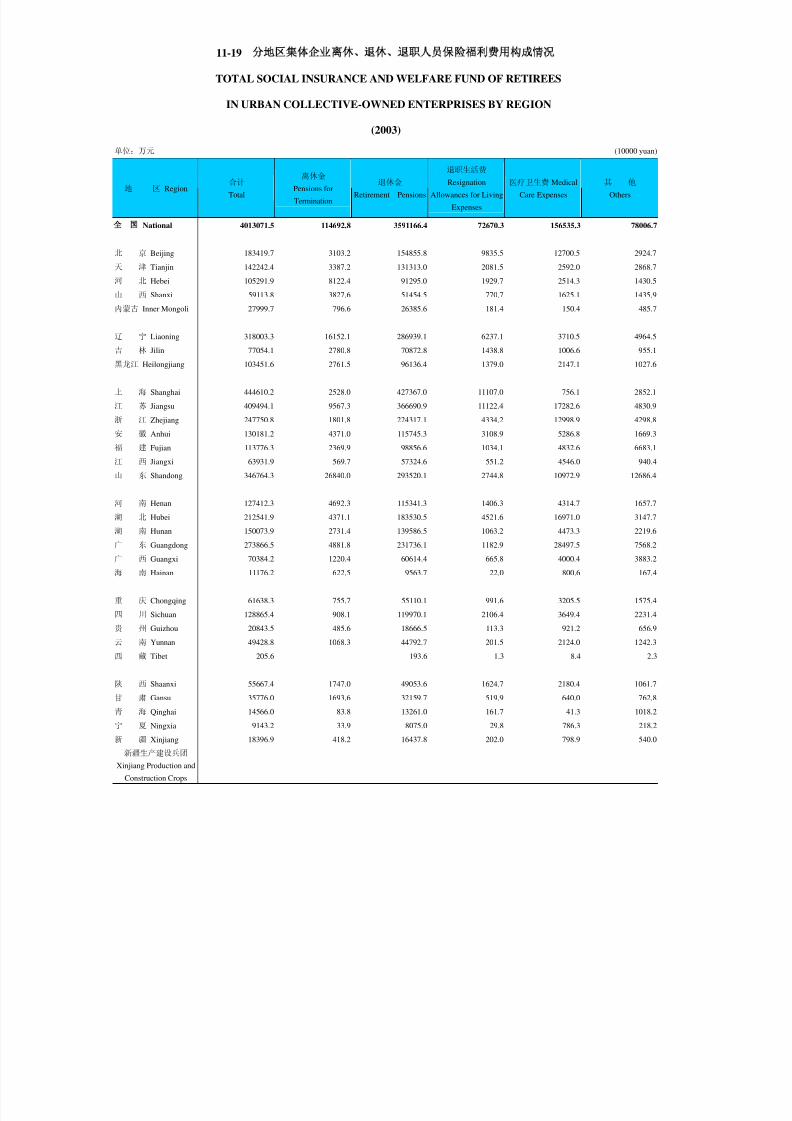
8/2/2019 China Labour Statistical Yearbook - 2004
http://slidepdf.com/reader/full/china-labour-statistical-yearbook-2004 411/464
11-19
TOTAL SOCIAL INSURANCE AND WELFARE FUND OF RETIREES
IN URBAN COLLECTIVE-OWNED ENTERPRISES BY REGION
(2003)
单位:万元 (10000 yuan)
地 区 Region 合计
Total
离休金
Pensions for
Termination
退休金
Retirement Pensions
退职生活费
Resignation
Allowances for Living
Expenses
医疗卫生费 Medical
Care Expenses
其 他
Others
National 4013071.5 114692.8 3591166.4 72670.3 156535.3 78006.7
北 京 Beijing 183419.7 3103.2 154855.8 9835.5 12700.5 2924.7
天 津 Tianjin 142242.4 3387.2 131313.0 2081.5 2592.0 2868.7
河 北 Hebei 105291.9 8122.4 91295.0 1929.7 2514.3 1430.5
山 西 Shanxi 59113.8 3827.6 51454.5 770.7 1625.1 1435.9
内蒙古 Inner Mongoli 27999.7 796.6 26385.6 181.4 150.4 485.7
辽 宁 Liaoning 318003.3 16152.1 286939.1 6237.1 3710.5 4964.5
吉 林 Jilin 77054.1 2780.8 70872.8 1438.8 1006.6 955.1
黑龙江 Heilongjiang 103451.6 2761.5 96136.4 1379.0 2147.1 1027.6
上 海 Shanghai 444610.2 2528.0 427367.0 11107.0 756.1 2852.1
江 苏 Jiangsu 409494.1 9567.3 366690.9 11122.4 17282.6 4830.9
浙 江 Zhejiang 247750.8 1801.8 224317.1 4334.2 12998.9 4298.8
安 徽 Anhui 130181.2 4371.0 115745.3 3108.9 5286.8 1669.3
福 建 Fujian 113776.3 2369.9 98856.6 1034.1 4832.6 6683.1
江 西 Jiangxi 63931.9 569.7 57324.6 551.2 4546.0 940.4
山 东 Shandong 346764.3 26840.0 293520.1 2744.8 10972.9 12686.4
河 南 Henan 127412.3 4692.3 115341.3 1406.3 4314.7 1657.7
湖 北 Hubei 212541.9 4371.1 183530.5 4521.6 16971.0 3147.7
湖 南 Hunan 150073.9 2731.4 139586.5 1063.2 4473.3 2219.6
广 东 Guangdong 273866.5 4881.8 231736.1 1182.9 28497.5 7568.2
广 西 Guangxi 70384.2 1220.4 60614.4 665.8 4000.4 3883.2
海 南 Hainan 11176.2 622.5 9563.7 22.0 800.6 167.4
重 庆 Chongqing 61638.3 755.7 55110.1 991.6 3205.5 1575.4
四 川 Sichuan 128865.4 908.1 119970.1 2106.4 3649.4 2231.4
贵 州 Guizhou 20843.5 485.6 18666.5 113.3 921.2 656.9云 南 Yunnan 49428.8 1068.3 44792.7 201.5 2124.0 1242.3
西 藏 Tibet 205.6 193.6 1.3 8.4 2.3
陕 西 Shaanxi 55667.4 1747.0 49053.6 1624.7 2180.4 1061.7
甘 肃 Gansu 35776.0 1693.6 32159.7 519.9 640.0 762.8
青 海 Qinghai 14566.0 83.8 13261.0 161.7 41.3 1018.2
宁 夏 Ningxia 9143.2 33.9 8075.0 29.8 786.3 218.2
新 疆 Xinjiang 18396.9 418.2 16437.8 202.0 798.9 540.0
新疆生产建设兵团
Xinjiang Production and
Construction Crops

8/2/2019 China Labour Statistical Yearbook - 2004
http://slidepdf.com/reader/full/china-labour-statistical-yearbook-2004 412/464
11-20
TOTAL SOCIAL INSURANCE AND WELFARE FUND
OF RETIREES OF OTHER ENTERPRISES BY REGION
(2003)单位:万元 (10000 yuan)
地 区 Region 合计
Total
离休金
Pensions for
Termination
退休金
Retirement
Pensions
退职生活费
Resignation
Allowances for
Living Expenses
医疗卫生费Medical
Care Expenses
其 他
Others
National 3623657.1 138321.4 3090559.1 46850.8 219215.5 128710.2
北 京 Beijing 415767.6 25199.4 350488.8 3516.7 30544.2 6018.5
天 津 Tianjin 77115.7 2187.9 68330.3 407.4 4086.5 2103.6河 北 Hebei 159024.6 8472.8 132779.9 1295.9 13425.4 3050.6
山 西 Shanxi 14650.2 988.2 11914.1 143.5 885.7 718.7
内蒙古 Inner Mongolia 124557.9 4493.2 114295.1 1070.3 1869.3 2830.0
辽 宁 Liaoning 204419.7 11500.4 178435.5 1552.3 7619.8 5311.7
吉 林 Jilin 43091.2 1386.1 33063.3 1298.6 2210.9 5132.3
黑龙江 Heilongjiang 57255.9 1367.2 52272.6 417.9 2225.1 973.1
上 海 Shanghai 293659.5 8219.0 267175.1 2534.0 2039.6 13691.8
江 苏 Jiangsu 448298.1 15696.8 390257.6 8405.8 22075.3 11862.6
浙 江 Zhejiang 460414.1 7034.8 375199.3 7853.1 37648.9 32678.0
安 徽 Anhui 81005.5 4213.5 69472.6 443.5 4946.0 1930.0
福 建 Fujian 38982.0 2705.3 33870.1 350.2 1487.7 568.7
江 西 Jiangxi 26339.1 512.7 24025.7 162.5 895.2 743.0
山 东 Shandong 261199.5 18954.8 196926.3 10654.5 21243.5 13420.3
河 南 Henan 142056.6 7663.4 118124.2 1406.3 11254.8 3607.8
湖 北 Hubei 98656.9 1670.0 88473.7 793.5 6333.4 1386.3
湖 南 Hunan 54440.3 1268.1 50485.6 253.2 1690.7 742.7
广 东 Guangdong 233078.6 4084.3 195914.2 596.7 26099.8 6383.6
广 西 Guangxi 51037.8 1061.6 40438.5 347.8 3389.4 5800.5
海 南 Hainan 2578.3 68.8 2146.8 43.2 218.2 101.3
重 庆 Chongqing 68151.0 1183.2 59411.3 1034.3 5148.8 1373.4
四 川 Sichuan 125140.3 2750.8 114762.7 882.0 3346.0 3398.8
贵 州 Guizhou 15070.0 400.6 13151.6 46.4 1338.1 133.3
云 南 Yunnan 58856.7 2852.7 49753.4 340.4 3255.6 2654.6
西 藏 Tibet
陕 西 Shanxi 19538.3 1099.9 16182.7 186.1 1684.9 384.7
甘 肃 Gansu 10545.8 462.3 8997.6 114.3 334.8 636.8
青 海 Qinghai 1959.2 58.1 1556.8 49.5 195.3 99.5
宁 夏 Ningxia 5338.8 36.9 4539.0 16.5 487.9 258.5
新 疆 Xinjiang 30979.4 728.7 27682.3 625.3 1234.8 708.3新疆生产建设兵团
Xinjiang Production and
Construction Crops
448.5 432.4 9.0 7.1

8/2/2019 China Labour Statistical Yearbook - 2004
http://slidepdf.com/reader/full/china-labour-statistical-yearbook-2004 413/464
11-21
TOTAL SOCIAL INSURANCE AND WELFARE FUND OF RETIREES IN
HONGKONG MACAO AND TAIWAN CHINESE-FUNDED ENTERPRISES BY REGION
(2003)
单位:万元 (10000 yuan)
地 区 Region 合计
Total
离休金
Pensions for
Termination
退休金
Retirement
Pensions
退职生活费
Resignation
Allowances for
Living Expenses
医疗卫生费
Medical Care
Expenses
其 他
Others
National 149360.6 2267.6 136264.1 1959.1 5043.7 3826.0
北 京 Beijing 966.3 21.0 808.2 27.1 31.8 78.2
天 津 Tianjin 25749.0 227.0 23999.0 123.9 451.1 948.0
河 北 Hebei 5345.5 222.6 4569.0 88.2 245.9 219.8
山 西 Shanxi 650.7 30.8 563.2 0.9 52.0 3.8
内蒙古 Inner Mongolia 307.5 7.8 274.1 15.9 9.7
辽 宁 Liaoning 7216.6 273.6 6579.9 52.8 182.3 128.0
吉 林 Jilin 595.9 18.2 544.4 4.2 4.7 24.4
黑龙江 Heilongjiang 1313.8 17.9 1230.0 30.6 35.3
上 海 Shanghai 22153.0 254.0 21302.4 105.6 119.0 372.0
江 苏 Jiangsu 17775.8 206.9 15974.3 668.7 660.8 265.1
浙 江 Zhejiang 20022.8 291.8 18546.6 280.3 400.4 503.7
安 徽 Anhui 618.7 65.3 443.9 0.3 109.2
福 建 Fujian 4570.6 36.0 4348.5 82.4 44.4 59.3
江 西 Jiangxi 168.4 0.0 144.7 10.7 11.2 1.8
山 东 Shandong 4631.7 263.4 3562.0 334.3 288.9 183.1
河 南 Henan 1824.1 80.0 1714.6 8.3 3.6 17.5
湖 北 Hubei 4621.4 39.9 4032.5 26.7 474.3 48.0
湖 南 Hunan 304.1 13.9 256.9 14.2 13.4 5.6
广 东 Guangdong 25821.0 95.8 23288.2 66.4 1691.8 678.8
广 西 Guangxi 1110.6 29.5 884.3 31.5 62.0 103.3
海 南 Hainan 2.9 2.7 0.1 0.1
重 庆 Chongqing 1384.8 9.6 1166.7 18.9 70.4 119.2四 川 Sichuan 933.5 13.4 893.6 8.5 14.0 4.0
贵 州 Guizhou 339.2 13.0 305.6 1.8 12.4 6.4
云 南 Yunnan 336.8 19.5 295.6 21.4 0.3
西 藏 Tibet
陕 西 Shaanxi 305.1 5.1 286.0 0.7 10.4 2.9
甘 肃 Gansu 36.7 4.6 22.1 2.3 7.7
青 海 Qinghai
宁 夏 Ningxia
新 疆 Xinjiang 254.1 7.0 225.0 0.4 21.7

8/2/2019 China Labour Statistical Yearbook - 2004
http://slidepdf.com/reader/full/china-labour-statistical-yearbook-2004 414/464
11-22
TOTAL SOCIAL INSURANCE AND WELFARE FUND OF
RETIREES IN FOREIGN FUNDED ENTERPRISES BY REGION
(2003)
单位:万元 (10000 yuan)
地 区 Region 合计
Total
离休金
Pensions for
Termination
退休金
Retiremnt
Pensions
退职生活费
Resignation
Allowances for
Living Expenses
医疗卫生费
Medical Care
Expenses
其 他
Others
National 159374.7 3674.2 140763.2 1350.9 5794.2 7792.3
北 京 Beijing 27583.5 363.5 23376.2 252.2 1255.9 2335.7
天 津 Tianjin 26654.9 9.9 26247.8 2.3 45.3 349.6
河 北 Hebei 2566.5 117.2 1921.3 24.9 468.7 34.4
山 西 Shanxi 304.8 11.7 264.5 0.4 28.0 0.2
内蒙古 Inner Mongol 254.3 5.3 248.6 0.4
辽 宁 Liaoning 4604.6 166.5 4231.9 20.7 88.6 96.9
吉 林 Jilin 1351.1 68.8 1106.5 32.3 119.0 24.5
黑龙江 Heilongjiang 141.1 130.1 1.0 5.7 4.3
上 海 Shanghai 36619.3 381.0 31953.7 158.4 455.1 3671.1
江 苏 Jiangsu 13403.3 269.2 12250.7 344.4 396.9 142.1
浙 江 Zhejiang 13052.0 114.8 11488.2 162.7 966.7 319.6
安 徽 Anhui 1468.8 80.4 1257.0 26.9 46.6 57.9
福 建 Fujian 5111.9 73.5 4630.4 74.2 321.7 12.1江 西 Jiangxi 34.5 30.5 3.4 0.6
山 东 Shandong 9572.7 1653.7 7385.0 166.5 126.0 241.5
河 南 Henan 2075.9 55.2 1923.0 9.3 59.3 29.2
湖 北 Hubei 1509.5 7.9 1349.3 17.8 125.7 8.8
湖 南 Hunan 2322.4 83.6 2188.1 6.8 34.7 9.2
广 东 Guangdong 4574.1 17.9 3903.4 23.3 408.8 220.7
广 西 Guangxi 661.8 7.9 566.1 7.8 56.5 23.5
海 南 Hainan 20.3 19.9 0.2 0.2
重 庆 Chongqing 3213.8 165.9 2306.0 11.6 632.8 97.5
四 川 Sichuan 737.9 9.6 720.0 7.0 0.3 1.0
贵 州 Guizhou 1.8 1.8
云 南 Yunnan 211.2 9.1 143.2 40.3 18.6
西 藏 Tibet
陕 西 Shanxi 175.3 130.3 15.4 29.6
甘 肃 Gansu 123.3 1.6 106.3 13.7 1.7
青 海 Qinghai
宁 夏 Ningxia 957.5 818.1 78.9 60.5
新 疆 Xinjiang 66.6 65.3 1.3

8/2/2019 China Labour Statistical Yearbook - 2004
http://slidepdf.com/reader/full/china-labour-statistical-yearbook-2004 415/464
11-23
TOTAL SOCIAL INSURANCE AND WELFARE FUND
OF RETIREES OF INSTITUTIONS BY REGION
(2003)单位:万元 (10000 yuan)
地 区 Region 合计
Total
离休金
Pensions for
Termination
退休金
Retirement
Pensions
退职生活费
Resignation
Allowances for
Living Expenses
医疗卫生费
Medical Care
Expenses
其 他
Others
National 10317447.6 659489.8 8481410.3 54507.6 596348.1 525691.8
北 京 Beijing 424889.5 26989.2 271725.7 2001.1 56132.0 68041.5
天 津 Tianjin 189509.6 13806.1 154285.3 955.7 13602.0 6860.5
河 北 Hebei 389833.4 37035.4 321710.2 2749.5 15693.8 12644.5
山 西 Shanxi 230082.0 24796.7 181942.9 1604.6 10978.9 10758.9
内蒙古 Inner Mongolia 208510.0 12492.2 186392.7 978.0 5197.6 3449.5
辽 宁 Liaoning 447916.0 44451.8 360812.2 2107.0 18109.4 22435.6
吉 林 Jilin 269837.3 25288.5 213714.7 1034.2 24234.3 5565.5
黑龙江 Heilongjiang 400817.9 39139.4 328283.0 4129.0 20034.8 9231.7
上 海 Shanghai 493780.2 28027.0 428365.0 1574.0 2407.1 33407.1
江 苏 Jiangsu 888520.8 52884.3 740022.6 5147.3 53412.5 37054.1
浙 江 Zhejiang 556026.8 23015.9 448068.1 4921.3 40020.5 40001.0
安 徽 Anhui 321569.1 23970.0 271952.3 1654.3 17652.5 6340.0
福 建 Fujian 258878.4 14059.2 226871.6 3603.4 7619.6 6724.6
江 西 Jiangxi 226645.5 7450.7 199354.2 578.8 13562.6 5699.1
山 东 Shandong 515511.2 66677.7 415766.4 4068.8 21048.3 7950.1
河 南 Henan 469927.7 43973.0 394044.1 1421.4 17772.6 12716.7
湖 北 Hubei 430957.0 14444.8 320475.8 1381.1 34913.2 59742.1
湖 南 Hunan 461258.1 25222.5 388096.6 1042.4 22627.4 24269.1
广 东 Guangdong 690799.9 31779.1 535932.6 1844.6 76044.2 45199.4
广 西 Guangxi 239557.1 6160.3 208715.1 1406.9 9657.6 13617.2
海 南 Hainan 59887.1 1498.2 54358.9 232.9 2779.4 1017.7
重 庆 Chongqing 192580.9 5161.7 163789.8 854.5 13486.5 9288.4四 川 Sichuan 507104.5 14886.0 449633.4 2662.6 18440.4 21482.1
贵 州 Guizhou 207919.3 7328.7 173114.5 362.5 18498.4 8615.2
云 南 Yunnan 300591.9 15738.1 260766.9 1304.8 11424.4 11357.7
西 藏 Tibet 48045.5 612.0 44138.7 38.7 1831.8 1424.3
陕 西 Shanxi 271411.3 19758.1 214828.2 920.4 21557.0 14347.6
甘 肃 Gansu 201630.3 10813.2 173293.0 602.4 7599.8 9321.9
青 海 Qinghai 80980.2 3406.1 71315.8 609.3 3170.4 2478.6
宁 夏 Ningxia 53162.6 3298.2 40924.9 440.8 3256.7 5242.0
新 疆 Xinjiang 246948.7 11819.6 213456.5 2160.7 11345.8 8166.1
新疆生产建设兵团
Xinjiang Production and
Construction Crops
32357.8 3506.1 25258.6 114.5 2236.5 1242.1

8/2/2019 China Labour Statistical Yearbook - 2004
http://slidepdf.com/reader/full/china-labour-statistical-yearbook-2004 416/464
11-24
TOTAL SOCIAL INSURANCE AND WELFARE
FUND OF RETIREES OF STATE ORGANS BY REGION
(2003)单位:万元 (10000 yuan)
地 区 Region 合计
Total
离休金
Pensions for
Termination
退休金
Retirement
Pensions
退职生活费
Resignation
Allowances for
Living Expenses
医疗卫生费 Medical
Care Expenses 其 他 Others
National 4619640.0 683578.3 3323449.8 29318.6 300968.5 282324.7
北 京 Beijing 219694.0 31412.0 125287.1 502.9 29605.1 32886.9
天 津 Tianjin 98316.2 10689.1 72428.8 304.4 11094.6 3799.3
河 北 Hebei 226655.6 60310.7 146032.8 4356.9 10343.2 5612.0
山 西 Shanxi 120185.8 31021.8 77607.2 464.2 5288.0 5804.6
内蒙古 Inner Mongolia 112419.1 17326.3 88834.9 578.5 3997.9 1681.5
辽 宁 Liaoning 167642.2 32911.5 113740.9 524.8 11416.9 9048.1
吉 林 Jilin 75997.9 14102.0 50241.2 488.4 9477.7 1688.6
黑龙江 Heilongjiang 169578.3 26559.0 125617.8 2605.5 10359.3 4436.7
上 海 Shanghai 95979.0 20136.1 65670.0 43.0 906.8 9223.1
江 苏 Jiangsu 347271.9 56282.1 214289.0 1934.1 23880.5 50886.2
浙 江 Zhejiang 232719.9 32598.2 162424.1 1376.2 18756.6 17564.8
安 徽 Anhui 151958.7 27779.7 106976.1 430.9 13547.5 3224.5
福 建 Fujian 116557.0 15398.7 90969.5 1255.7 5973.5 2959.6
江 西 Jiangxi 115831.1 8042.3 96101.9 194.2 7414.8 4077.9
山 东 Shandong 228554.1 56890.9 152470.0 1921.9 13399.2 3872.1
河 南 Henan 218815.9 38690.8 164668.5 927.2 10485.4 4044.0
湖 北 Hubei 181684.6 18555.6 120112.6 987.7 13096.3 28932.4
湖 南 Hunan 154306.8 16702.6 116580.5 931.4 13578.6 6513.7
广 东 Guangdong 297639.5 37233.8 208637.8 2524.9 25689.7 23553.3
广 西 Guangxi 141963.5 9779.9 115200.4 604.0 5902.3 10476.9
海 南 Hainan 26999.7 3721.7 20611.7 153.8 1920.2 592.3
重 庆 Chongqing 101930.9 6320.2 80730.7 798.8 8091.2 5990.0
四 川 Sichuan 263604.6 15806.6 224459.7 1508.9 8638.3 13191.1
贵 州 Guizhou 124073.4 12754.6 94296.2 321.7 11464.5 5236.4
云 南 Yunnan 209429.5 22355.3 173003.6 233.7 7710.7 6126.2
西 藏 Tibet 34034.8 1538.5 29435.7 54.1 1572.0 1434.5
陕 西 Shanxi 95818.5 18656.5 67730.2 491.1 6169.7 2771.0
甘 肃 Gansu 79061.5 10271.6 60606.8 719.0 2369.8 5094.3
青 海 Qinghai 61645.4 8442.4 48016.8 746.7 992.8 3446.7
宁 夏 Ningxia 24075.3 3984.4 15944.7 421.4 1361.5 2363.3
新 疆 Xinjiang 112921.6 14983.7 86665.0 900.0 5076.5 5296.4
新疆生产建设兵团
Xinjiang Production and
Construction Crops
12273.7 2319.7 8057.7 12.6 1387.3 496.4

8/2/2019 China Labour Statistical Yearbook - 2004
http://slidepdf.com/reader/full/china-labour-statistical-yearbook-2004 417/464
11-25
HISTORIC FIGURES OF REVENUE,EXPENSES AND BALANCE OF SOCIAL INSURANCE FUNDS
单位:亿元 (100 million yuan)
合 计 基本养 失业保险 医疗保险 工伤保险 生育保险
年 份 Total 老保险 Unemployment Medical Work Maternity
Year Basic Pension Insurance Insurance Injury Insurance
Insurance Insurance
一、基金收入 Revenue
1990 186.8 178.8 8.0
1991 225.0 215.7 9.3
1992 377.4 365.8 11.7
1993 526.1 503.5 17.9 1.4 2.4 0.8
1994 742.0 707.4 25.4 3.2 4.6 1.5
1995 1006.0 950.1 35.3 9.7 8.1 2.9
2000 2644.5 2278.1 160.4 170.0 24.8 11.2
2001 3101.9 2489.0 187.3 383.6 28.3 13.7
2002 4048.7 3171.5 215.6 607.8 32.0 21.8
2003 4882.9 3680.0 249.5 890.0 37.6 25.8
二、基金支出 Expenses
1990 151.9 149.3 2.5
1991 176.1 173.1 3.0
1992 327.1 321.9 5.1
1993 482.2 470.6 9.3 1.3 0.4 0.5
1994 680.0 661.1 14.2 2.9 0.9 0.8
1995 877.1 847.6 18.9 7.3 1.8 1.6
2000 2385.6 2115.5 123.4 124.5 13.8 8.3
2001 2748.0 2321.3 156.6 244.1 16.5 9.62002 3471.5 2842.9 186.6 409.4 19.9 12.8
2003 4016.4 3122.1 199.8 653.9 27.1 13.5
三、累计结余
Balance at the Year-end
1990 117.3 97.9 19.5
1991 169.7 144.1 25.7
1992 252.8 220.6 32.1
1993 303.7 258.6 40.8 0.4 3.1 0.8
1994 365.7 304.8 52.0 0.7 6.8 1.4
1995 516.8 429.8 68.4 3.1 12.7 2.7
2000 1327.5 947.1 195.9 109.8 57.9 16.8
2001 1622.8 1054.1 226.2 253.0 68.9 20.6
2002 2423.4 1608.0 253.8 450.7 81.1 29.7
2003 3313.8 2206.5 303.5 670.6 91.2 42.0

8/2/2019 China Labour Statistical Yearbook - 2004
http://slidepdf.com/reader/full/china-labour-statistical-yearbook-2004 418/464
11-26
HISTORIC FIGURES OF REVENUE,EXPENSES
AND BALANCE OF BASIC PENSION INSURANCE
单位:亿元 (100 million yuan)
合 计
年 份 Total 企 业 事业、机关
Year Enterprises Institutions and
State Organs
一、基金收入
Revenue
1990 178.8 178.8
1995 950.1 950.1
2000 2278.1 2088.3 189.8
2001 2489.0 2235.1 253.0
2002 3171.5 2783.6 387.8
2003 3680.0 3209.4 470.6
二、基金支出
Expenses
1990 149.3 149.3
1995 847.6 847.6
2000 2115.5 1970.0 145.4
2001 2321.3 2116.5 204.4
2002 2842.9 2502.8 340.1
2003 3122.1 2716.2 405.9
三、累计结余
Balance at
the year-end
1990 97.9 97.9
1995 429.8 429.8
2000 947.1 761.0 186.1
2001 1054.1 818.6 233.2
2002 1608.0 1243.5 364.5
2003 2206.5 1764.8 441.7

8/2/2019 China Labour Statistical Yearbook - 2004
http://slidepdf.com/reader/full/china-labour-statistical-yearbook-2004 419/464
11-27
HISTORIC FIGURES OF CONTRIBUTORS OF PENSION INSURANCE
单位: 万人 (10000 persons)
职 工 Workers 离休、退休、退职人员 Retirees
合 计 合 计
年 份 Total 企 业(含其 他) Total 企 业(含其 他)
Year Enterprises Enterprises
(Included Others) (Included Others)
1989 4816.9 4816.9 893.4 893.4
1990 5200.7 5200.7 1086.6 1086.6
1991 5653.7 5653.7 1681.5 1681.5
1992 7774.7 7774.7 1839.4 1839.4
1993 8008.2 8008.2 2079.4 2079.4
1994 8494.1 8494.1 2241.2 2241.2
1995 8737.8 8737.8 2358.3 2358.3
2000 10447.5 9469.9 3380.6 3169.9
2001 10801.9 9733.0 3380.6 3171.3
2002 11128.8 9929.4 3607.8 3349.2
2003 11646.5 10324.5 3860.2 3556.9

8/2/2019 China Labour Statistical Yearbook - 2004
http://slidepdf.com/reader/full/china-labour-statistical-yearbook-2004 420/464
11-28
HISTORIC FIGURES OF CONTRBUTORS OF BASIC PENSION INSURANCE BY REGION
单位: 万人 (10000 persons)
1 9 9 8 1 9 9 9 2 0 0 0
合 计 合 计 合 计
Total 离休、退休、 Total 离休、退休、 Total 离休、退休、
退职人员 退职人员 退职人员
地 区 Region
Retirees Retirees Retirees
National 11203.1 2727.3 12485.4 2983.6 13617.4 3169.9
北 京 Beijing 351.7 106.5 378.8 108.8 391.7 116.3
天 津 Tianjin 263.8 74.6 274.3 76.2 288.2 80.1
河 北 Hebei 532.3 113.1 544.9 118.9 634.3 137.4
山 西 Shanxi 337.1 71.4 365.7 79.1 416.1 78.0
内
蒙
古
Inner Mongolia 256.5 55.5 285.6 61.2 295.1 62.5
辽 宁 Liaoning 895.1 242.6 945.3 257.7 1030.0 281.0
吉 林 Jilin 365.7 87.1 399.5 89.5 387.5 93.6
黑 龙 江 Heilongjiang 600.4 145.6 617.1 150.9 624.9 158.5
上 海 Shanghai 583.8 189.6 662.6 225.3 675.3 234.2
江 苏 Jiangsu 790.8 176.4 821.6 188.5 890.3 200.3
浙 江 Zhejiang 378 96.6 516.5 106.8 561.7 114.4
安 徽 Anhui 349.9 77.7 389.2 86.9 415.2 93.3
福 建 Fujian 202.9 49.7 219.7 52.3 230.7 56.0
江 西 Jiangxi 299.8 64.1 313.2 66.7 327.4 72.6
山 东 Shandong 713.2 134.3 939.1 169.9 1008.6 180.0
河 南 Henan 599.5 115.9 677.3 124.6 729.5 135.0
湖 北 Hubei 520.5 107.4 577.7 122.4 597.1 131.5
湖 南 Hunan 412.6 101.9 419.5 105.1 438.8 111.5
广 东 Guangdong 599.9 143.4 766.4 161.3 1172.0 173.7
广 西 Guangxi 221.5 46.4 263.6 60.2 239.4 54.5
海 南 Hainan 85.8 23.8 111.5 29.5 129.1 29.9
重 庆 Chongqing 247.3 67.0 264.5 74.6 270.5 78.4
四 川 Sichuan 494.9 138.0 527 148.5 571.7 159.5
贵 州 Guizhou 131.5 34.2 149 37.9 165.4 40.5
云 南 Yunnan 208.9 59.7 223.5 63.1 252.3 68.2
西 藏 Tibet 6.7 1.8 7.1 2.1 7.3 2.1
陕 西 Shaanxi 278.4 70.7 274.2 73.8 296.3 78.0
甘 肃 Gansu 174.5 39.7 184.2 41.6 187.1 43.4
青 海 Qinghai 47 11.8 49.5 12.7 50.5 14.1
宁 夏 Ningxia 52.6 11.4 55.4 12.0 57.0 12.5
新 疆 Xinjiang 118.1 30.0 135 33.8 140.3 35.0
新疆生产建设兵团 Xinjiang Production
and Construction Crops 106.4 36.3 106.5 38.9 111.2 40.9
11-28 continued
单位:万人 (10000 persons)
2 0 0 1 2 0 0 2 2 0 0 3
合 计 合 计 合 计
Total 离休、退休、 Total 离休、退休、 Total 离休、退休、
退职人员 退职人员 退职人员
地 区 Region
Retirees Retirees Retirees
National 14182.5 3380.6 14736.6 3607.8 15506.7 3860.2

8/2/2019 China Labour Statistical Yearbook - 2004
http://slidepdf.com/reader/full/china-labour-statistical-yearbook-2004 421/464
北 京 Beijing 425.9 124.3 436.2 133.2 448.5 141.5
天 津 Tianjin 281.4 85.2 296.0 91.4 283.3 97.6
河 北 Hebei 641.4 145.3 643.5 154.0 665.5 163.6
山 西 Shanxi 365.6 81.8 361.8 85.4 364.4 88.1
内 蒙 古 Inner Mongolia 290.6 65.3 292.9 70.8 300.9 72.6
辽 宁 Liaoning 1022.7 288.9 1039.2 302.2 1070.4 315.5
吉 林 Jilin 389.1 99.6 397.7 104.9 427.0 115.5
黑 龙 江 Heilongjiang 692.5 178.5 689.8 187.4 714.3 196.0
上 海 Shanghai 683.5 239.9 699.8 246.9 715.6 254.6
江 苏 Jiangsu 888.1 212.7 1063.5 252.9 1135.2 271.4
浙 江 Zhejiang 610.4 125.1 701.1 132.6 801.2 144.2
安 徽 Anhui 432.7 98.5 432.3 102.8 456.6 113.6
福 建 Fujian 242.0 58.4 285.1 61.6 364.2 79.4
江 西 Jiangxi 328.8 78.2 339.8 82.6 355.9 93.4
山 东 Shandong 1022.6 191.3 1043.0 205.3 1135.9 219.3
河 南 Henan 736.6 141.9 757.8 161.5 751.1 171.0
湖 北 Hubei 612.1 137.7 628.8 147.2 732.4 177.9
湖 南 Hunan 603.4 148.0 616.5 157.7 636.2 167.5广 东 Guangdong 1370.3 187.0 1405.4 193.5 1482.2 203.8
广 西 Guangxi 248.9 58.7 257.2 63.5 264.8 66.3
海 南 Hainan 108.2 30.5 111.2 31.9 116.7 33.6
重 庆 Chongqing 270.3 82.3 280.3 87.8 280.0 92.4
四 川 Sichuan 578.9 169.4 589.2 178.1 605.5 187.5
贵 州 Guizhou 159.0 42.4 168.9 44.9 168.0 48.0
云 南 Yunnan 243.1 69.6 252.1 74.1 257.3 77.8
西 藏 Tibet 7.1 2.6 7.0 2.6 7.3 2.8
陕 西 Shaanxi 345.4 83.4 352.0 90.8 362.4 97.4
甘 肃 Gansu 188.4 45.3 188.0 48.1 192.0 51.2
青 海 Qinghai 51.9 14.9 54.2 15.0 56.4 15.9
宁 夏 Ningxia 57.9 13.2 59.0 13.7 60.7 14.3
新 疆 Xinjiang 148.1 35.7 152.1 36.5 160.0 39.4
新疆生产建设兵团 Xinjiang Production and Construction Crops 110.3 41.9 110.0 43.1 109.2 43.5

8/2/2019 China Labour Statistical Yearbook - 2004
http://slidepdf.com/reader/full/china-labour-statistical-yearbook-2004 422/464
11-29
BASIC PENSION INSURANCE BY REGION
(2003)
参保职工(万人) Active 基金收支情况(万元)
Contributors(10000 persons) Revenue and Expenses(10000 yuan)
年末数
离休、退休、退职人员年末人数
基金收入 基金支出 累计结余
Number 企业(含其他) Retirees at Revenue Expenses Balance
at the Enterprises the Year-end at the
地 区 Region
Year-end (others) (10000 persons) Year-end
National 11646.5 10324.5 3860.2 36799793 31221058 22065401
北 京 Beijing 307.0 297.1 141.5 1663306 1475353 378691
天 津 Tianjin 185.7 178.4 97.6 852741 817207 221073
河 北 Hebei 501.9 410.1 163.6 1487934 1230766 872288
山 西 Shanxi 276.3 276.3 88.1 940865 708988 701009
内 蒙 古 Inner Mongolia 228.3 197.2 72.6 600943 531052 268420
辽 宁 Liaoning 754.9 688.6 315.5 2623065 2173763 1557866
吉 林 Jilin 311.5 300.3 115.5 923387 811094 258991
黑 龙 江 Heilongjiang 518.3 468.0 196.0 1547627 1351845 732467
上 海 Shanghai 461.1 394.3 254.6 2942041 2895766 743332
江 苏 Jiangsu 863.8 775.7 271.4 2615091 2332601 1193700
浙 江 Zhejiang 657.0 594.2 144.2 2173528 1493128 2006702
安 徽 Anhui 343.1 323.1 113.6 812206 740298 247157
福 建 Fujian 284.8 230.8 79.4 731491 663249 464774
江 西 Jiangxi 262.5 242.3 93.4 593132 536315 304829
山 东 Shandong 916.7 710.9 219.3 2637041 2190979 1754944
河 南 Henan 580.0 504.0 171.0 1441656 1203326 971519
湖 北 Hubei 554.4 501.1 177.9 1197485 1176227 434851
湖 南 Hunan 468.7 317.4 167.5 1363588 1189872 757407
广 东 Guangdong 1278.5 1145.7 203.8 3055375 1972110 4567456
广 西 Guangxi 198.5 195.0 66.3 502828 462505 333686
海 南 Hainan 83.1 62.3 33.6 228031 210100 106219
重 庆 Chongqing 187.6 183.3 92.4 575475 536253 155727
四 川 Sichuan 418.0 397.2 187.5 1729205 1451783 1111592
贵 州 Guizhou 120.0 106.4 48.0 415840 348341 320611
云 南 Yunnan 179.6 162.4 77.8 718964 616629 454622
西 藏 Tibet 4.4 3.5 2.8 48028 48216 -260
陕 西 Shaanxi 265.0 265.0 97.4 742622 685370 207032
甘 肃 Gansu 140.8 134.8 51.2 473073 427163 200118
青 海 Qinghai 40.5 37.9 15.9 159085 156661 6600
宁 夏 Ningxia 46.5 42.9 14.3 165889 114540 157788
新 疆 Xinjiang 120.6 113.5 39.4 511057 370862 465478
新疆生产建设兵团 Xinjiang Production and
Construction Crops
65.7 64.7 43.5 315156 292640 74146
0 0
12038 34566
中国人民银行 16.4 3.4
The People's Bank of China
中国农业发展银行 5.2 0.3 12038 6056 34566
Agricuture Development
Bank of China

8/2/2019 China Labour Statistical Yearbook - 2004
http://slidepdf.com/reader/full/china-labour-statistical-yearbook-2004 423/464
11-30
NUMBER OF PENSIONERS PAID BY THE SOCIALIZED
AGENCIES BY REGION
截止 2003 年 12 月 by the year-end
养老金实发人数(人) 社会化发放人数 (人) 社会化发放率(%) 地 区 Region
Number of pensioners(person)Number of pensioners paid by the
socialized agencies(person)
Ratio of socialized pensionable
retirees (%)
National 35570222 35384721 99.5
北 京 Beijing 1414780 1414780 100.0
天 津 Tianjin 949169 949169 100.0
河 北 Hebei 1415720 1415720 100.0
山 西 Shanxi 879088 879088 100.0
内 蒙 古 Inner Mongolia 697062 697062 100.0
辽 宁 Liaoning 2941104 2941104 100.0
吉 林 Jilin 1138358 1091976 95.9
黑 龙 江 Heilongjiang 1830253 1820026 99.4
上 海 Shanghai 2200379 2200379 100.0
江 苏 Jiangsu 2463726 2452218 99.5
浙 江 Zhejiang 1271693 1271693 100.0
安 徽 Anhui 1088143 1088143 100.0
福 建 Fujian 645355 645355 100.0
江 西 Jiangxi 856099 854057 99.8
山 东 Shandong 1725994 1725994 100.0
河 南 Henan 1577311 1577311 100.0
湖 北 Hubei 1710505 1710505 100.0
湖 南 Hunan 1299390 1299390 100.0
广 东 Guangdong 1959635 1959635 100.0
广 西 Guangxi 663285 650926 98.1
海 南 Hainan 289435 205247 70.9
重 庆 Chongqing 916287 916287 100.0 四 川 Sichuan 1829021 1829021 100.0
贵 州 Guizhou 467822 467795 100.0
云 南 Yunnan 725216 716513 98.8
西 藏 Tibet 28142 27322 97.1
陕 西 Shaanxi 972528 972528 100.0
甘 肃 Gansu 500988 500988 100.0
青 海 Qinghai 159109 159109 100.0
宁 夏 Ningxia 142624 135240 94.8
新 疆 Xinjiang 382346 380485 99.5
新疆生产建设兵团 Xinjiang Production and
Construction Crops 429655 429655 100.0
注:养老金实发人数和社会化发放人数指企业、企业化管理的事业单位及其它参保人员中的离退休人员。
Note: Number of pensioners and number of pensioners paid by the socialized agencies refers to retirees of enterprises ,
institutions managed with enterprise's management model and other retirees.

8/2/2019 China Labour Statistical Yearbook - 2004
http://slidepdf.com/reader/full/china-labour-statistical-yearbook-2004 424/464
11-31
HISTORIC FIGURES OF UNEMPLOYMENT INSURANCE MEDICAL INSURANCE
WORK INJURY INSURANCE AND MATERNITY INSURANCE
一、失业保险 Unemloyment Inurance 二、生育保险
年末参保 全年发放 全年发 Maternity
职工人数 失业保险 放失业 Insurance
年 份 (万人) 金 人 数 保险金 年末参保
year Contributors (万人) (万元) 职工人数
at the Beneficiaries of Unemployed (万人)
Year-end Unemploment Relief Contributors
(10000 persons) Insurance Funds (10000 yuan) at the Year-end
(10000 persons) (10000 persons)
一、绝对数 Absolute figure
1995 8238.0 261.3 81964 1500.2
2000 10408.4 329.7 561984 3001.6
2001 10354.6 468.5 832563 3455.1
2002 10181.6 657.0 1167736 3488.2
2003 10372.4 741.6 1334448 3655.4
二、比上年增长% Increase
over Preceding Year %
2000 4.8 21.5 76.3 2.5
2001 -0.6 42.1 48.1 15.1
2002 -1.7 40.2 40.2 1.0
2003 1.9 12.9 14.3 4.8
三、基本医疗保险 四、工伤保险
Basic Medical Insurance Work Injury Insurance
年末参保人数(万人) 年末参保职工人数 年末享受工伤
年 份 Contributors at the Year-end (10000 persons) (万人) 待 遇 的人数
year 职 工 离休、退休、 Contributors (万人)
Workers 退职人员 at the Year-end Beneficiaries at the
Retirees (10000 persons) Year-end (10000 persons)
一、绝对数 Absolute figure
1995 702.6 43.3 2614.8 7.1
2000 2862.8 924.2 4350.3 18.8
2001 5470.7 1815.2 4345.3 18.7
2002 6925.8 2475.4 4405.6 26.5
2003 7974.9 2926.8 4574.8 29.5
二、比上年增长% Increase
over Preceding Year %
2000 89.7 66.2 9.8 25.0
2001 91.1 96.4 -0.1 -0.6
2002 26.6 36.4 1.4 41.7
2003 15.1 18.2 3.8 11.3

8/2/2019 China Labour Statistical Yearbook - 2004
http://slidepdf.com/reader/full/china-labour-statistical-yearbook-2004 425/464
11-32
HISTORIC FIGURES OF BASIC HEALTHCARE INSURANCE BY REGION
单位: 万人 (10000 persons)
1 9 9 9 2 0 0 0 2 0 0 1
合 计 合 计 合 计
Total 离休、退休、 Total 离休、退休、 Total 离休、退休、
退职人员 退职人员 退职人员
地 区 Region
Retirees Retirees Retirees
National 2065.4 555.9 3786.9 924.2 7285.9 1815.2
北 京 Beijing 235 75.5 232.6 81.9 240.7 89.4
天 津 Tianjin 20.2 3.1 139.6 46.8
河 北 Hebei 32.3 7 159.9 35.4 282.5 61.5
山 西 Shanxi 78 11.5 72.1 11.4 157.3 34.4
内 蒙 古 Inner Mongolia 13.4 2.4 103.7 22.1 196.9 45.5
辽 宁 Liaoning 63.9 21.7 109.5 36.6 313.6 90.4
吉 林 Jilin 46.1 8.7 40.2 8.5 124.2 27.8
黑 龙 江 Heilongjiang 38.3 9.5 52.1 15.1 308.3 89.2
上 海 Shanghai 555.6 197.3 569.6 204.3 680.5 238.9
江 苏 Jiangsu 56.5 15 307.3 71.9 456.0 113.5
浙 江 Zhejiang 200.1 52.9 228.0 67.5 352.7 100.0
安 徽 Anhui 5.7 1 61.5 13.3 232.8 53.6
福 建 Fujian 4.2 1.4 77.8 18.9 171.0 38.3
江 西 Jiangxi 51.6 7.3 61.4 9.5 71.6 12.2
山 东 Shandong 216.2 44.2 253.3 48.7 490.2 86.0
河 南 Henan 36.6 10 296.2 58.4 460.3 94.8
湖 北 Hubei 24.2 4.9 133.9 11.6 255.4 54.5
湖 南 Hunan 8.6 3.4 127.3 30.4 351.6 83.7
广 东 Guangdong 124.1 16.3 350.3 41.6 544.8 84.4
广 西 Guangxi 8.6 1.6 10.2 2.1 150.1 33.4
海 南 Hainan 17.8 3.6 33.9 5.1 40.9 8.5
重 庆 Chongqing 10.1 2.3 9.7 2.4 36.8 9.7
四 川 Sichuan 197.9 50.6 261.2 74.1 437.6 128.3
贵 州 Guizhou 31.1 6.9
云 南 Yunnan 69.5 15.9 185.7 45.6
西 藏 Tibet
陕 西 Shaanxi 14.5 3.7 130.5 28.2 231.4 49.4
甘 肃 Gansu 4 0.7 5.0 1.2 109.9 23.6
青 海 Qinghai 1.9 0.3 12.7 2.6 38.3 12.6
宁 夏 Ningxia 5.4 1.1 17.2 4.0
新 疆 Xinjiang 116.2 25.3
新疆生产建设兵团 Xinjiang Production and Construction Crops 11.9 4.6 60.8 22.8
11-32 continued
单位: 万人 (10000 persons)
2 0 0 2 2 0 0 3
合 计 合 计
Total 离休、退休、 Total 离休、退休、
退职人员 退职人员
Retirees Retirees
地 区 Region
National 9401.2 2475.4 10901.7 2926.8
北 京 Beijing 321.1 113.2 436.1 134.7
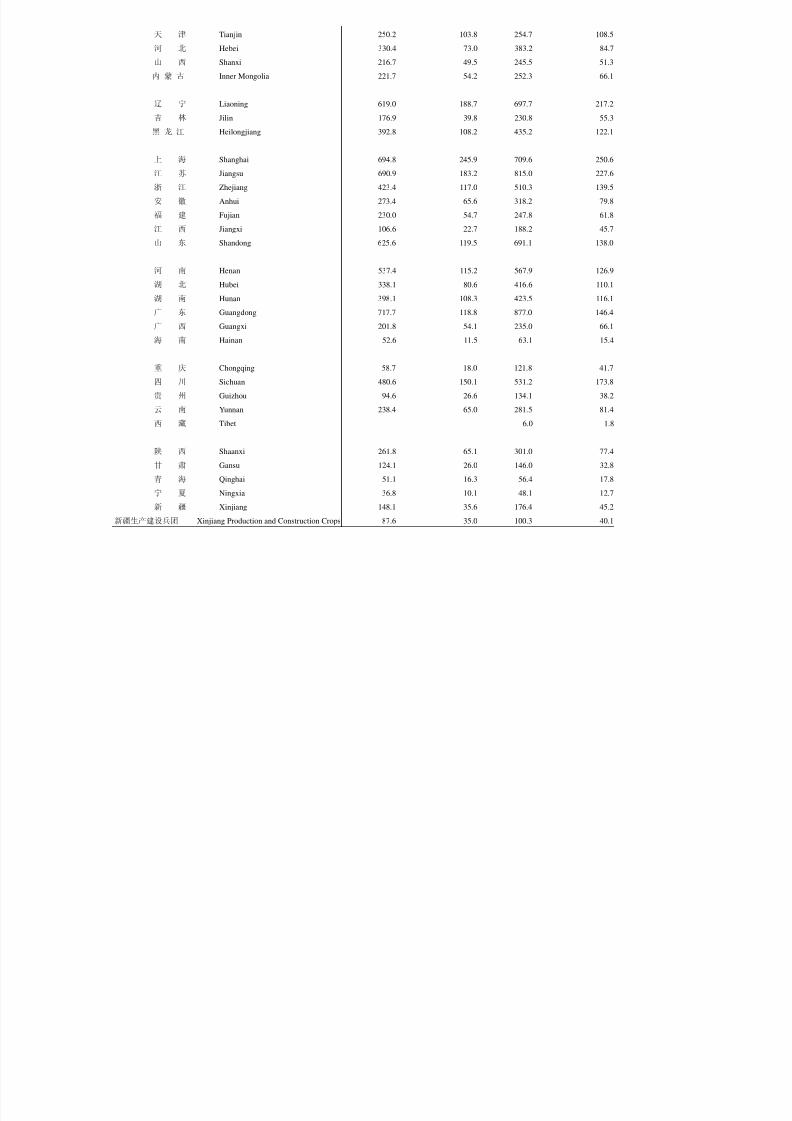
8/2/2019 China Labour Statistical Yearbook - 2004
http://slidepdf.com/reader/full/china-labour-statistical-yearbook-2004 426/464
天 津 Tianjin 250.2 103.8 254.7 108.5
河 北 Hebei 330.4 73.0 383.2 84.7
山 西 Shanxi 216.7 49.5 245.5 51.3
内 蒙 古 Inner Mongolia 221.7 54.2 252.3 66.1
辽 宁 Liaoning 619.0 188.7 697.7 217.2
吉 林 Jilin 176.9 39.8 230.8 55.3
黑 龙 江 Heilongjiang 392.8 108.2 435.2 122.1
上 海 Shanghai 694.8 245.9 709.6 250.6
江 苏 Jiangsu 690.9 183.2 815.0 227.6
浙 江 Zhejiang 423.4 117.0 510.3 139.5
安 徽 Anhui 273.4 65.6 318.2 79.8
福 建 Fujian 230.0 54.7 247.8 61.8
江 西 Jiangxi 106.6 22.7 188.2 45.7
山 东 Shandong 625.6 119.5 691.1 138.0
河 南 Henan 537.4 115.2 567.9 126.9
湖 北 Hubei 338.1 80.6 416.6 110.1
湖 南 Hunan 398.1 108.3 423.5 116.1
广 东 Guangdong 717.7 118.8 877.0 146.4广 西 Guangxi 201.8 54.1 235.0 66.1
海 南 Hainan 52.6 11.5 63.1 15.4
重 庆 Chongqing 58.7 18.0 121.8 41.7
四 川 Sichuan 480.6 150.1 531.2 173.8
贵 州 Guizhou 94.6 26.6 134.1 38.2
云 南 Yunnan 238.4 65.0 281.5 81.4
西 藏 Tibet 6.0 1.8
陕 西 Shaanxi 261.8 65.1 301.0 77.4
甘 肃 Gansu 124.1 26.0 146.0 32.8
青 海 Qinghai 51.1 16.3 56.4 17.8
宁 夏 Ningxia 36.8 10.1 48.1 12.7
新 疆 Xinjiang 148.1 35.6 176.4 45.2
新疆生产建设兵团 Xinjiang Production and Construction Crops 87.6 35.0 100.3 40.1

8/2/2019 China Labour Statistical Yearbook - 2004
http://slidepdf.com/reader/full/china-labour-statistical-yearbook-2004 427/464
11-33
Basic Medical Insurance by Region
(2003)
年末参保人数(万人) 基金收支情况(万元)
Contributors at the Year-end Revenue and Expenses(10000 yuan)
(10000 persons)
职 工 离休、退休、 基金收入 基金支出 累计结余
Workers 退职人员 Revenue Expenses Balance
Retirees at the
地 区 Region
Year-end
National 7974.9 2926.8 8899652 6538736 6706463
北 京 Beijing 301.5 134.7 680951 544354 245435
天 津 Tianjin 146.2 108.5 195347 204036 58554
河 北 Hebei 298.4 84.7 266861 178845 224387
山 西 Shanxi 194.2 51.3 102891 48961 89995
内 蒙 古 Inner Mongolia 186.2 66.1 114895 85804 94648
辽 宁 Liaoning 480.4 217.2 380300 262647 309144
吉 林 Jilin 175.4 55.3 99115 70722 78846
黑 龙 江 Heilongjiang 313.2 122.1 154843 112356 115326
上 海 Shanghai 459.1 250.6 1215590 1170618 465984
江 苏 Jiangsu 587.4 227.6 733229 555503 519956
浙 江 Zhejiang 370.8 139.5 589217 338695 611633
安 徽 Anhui 238.4 79.8 168696 116234 133246
福 建 Fujian 185.9 61.8 264851 166915 289949
江 西 Jiangxi 142.5 45.7 80489 61669 52079
山 东 Shandong 553.0 138.0 486904 363008 320953
河 南 Henan 441.0 126.9 283377 195924 261344
湖 北 Hubei 306.6 110.1 248495 141552 214573
湖 南 Hunan 307.4 116.1 271930 201598 190474
广 东 Guangdong 730.6 146.4 1009690 573139 1256457
广 西 Guangxi 169.0 66.1 190483 108574 144986
海 南 Hainan 47.7 15.4 40557 33316 25329
重 庆 Chongqing 80.0 41.7 55219 38564 37196
四 川 Sichuan 357.4 173.8 366763 269754 357314
贵 州 Guizhou 95.9 38.2 69346 38323 55444
云 南 Yunnan 200.1 81.4 276196 227008 190686
西 藏 Tibet 4.2 1.8 10866 11160 7373
陕 西 Shaanxi 223.6 77.4 122598 92733 95840
甘 肃 Gansu 113.2 32.8 86925 72231 43956
青 海 Qinghai 38.6 17.8 39193 25120 37616
宁 夏 Ningxia 35.4 12.7 43669 22236 31755
新 疆 Xinjiang 131.2 45.2 199255 165651 120294
新疆生产建设兵团 Xinjiang Production and Construction Crops 60.3 40.1 50911 41486 25691

8/2/2019 China Labour Statistical Yearbook - 2004
http://slidepdf.com/reader/full/china-labour-statistical-yearbook-2004 428/464
11-34
UNEMPLOYMENT INSURANCE BY REGION
单位:万人 (10000 persons)
1 9 9 9 2 0 0 0 2 0 0 1
年末参保 全年发放失业
年末参保 全年发放失业
年末参保 全年发放失业
职工人数 保险金人数 职工人数 保险金人数 职工人数 保险金人数
Contributors Beneficiaries Contributors Beneficiaries Contributors Beneficiaries
at the in the Year at the in the Year at the in the Year
地 区 Region
Year-end Year-end Year-end
National 9852.0 271.4 10408.4 329.7 10354.6 468.5
北 京 Beijing 306.2 4.3 306.2 10.9 287.2 12.5
天 津 Tianjin 204.4 7.3 216.9 11.1 214.3 14.7
河 北 Hebei 543.2 3.3 542.2 7.2 513.2 10.5
山 西 Shanxi 257.6 2.4 254.8 3.3 286.0 4.3
内 蒙 古 Inner Mongolia 215.6 4.7 220.4 6.4 217.7 11.9
辽 宁 Liaoning 695.0 15.5 693.7 23.8 656.7 35.3
吉 林 Jilin 291.9 3.3 279.3 5.1 283.8 13.2
黑 龙 江 Heilongjiang 528.0 8.4 526.3 6.0 532.6 15.8
上 海 Shanghai 431.6 50.8 434.9 38.7 430.7 40.9
江 苏 Jiangsu 755.6 13.0 764.1 43.8 766.5 53.7
浙 江 Zhejiang 365.5 22.7 388.6 34.5 391.1 46.5
安 徽 Anhui 345.8 4.0 368.7 14.4 375.2 13.3
福 建 Fujian 146.4 3.7 167.3 7.0 239.6 12.5
江 西 Jiangxi 211.1 0.9 226.8 0.8 235.9 2.5
山 东 Shandong 624.3 12.2 715.9 18.6 700.2 28.8
河 南 Henan 631.0 5.1 671.0 9.6 676.1 17.4
湖 北 Hubei 517.6 6.8 497.9 16.5 420.8 33.1
湖 南 Hunan 353.0 5.8 346.5 4.7 352.0 8.4
广 东 Guangdong 440.7 13.0 748.5 27.3 819.5 31.3
广 西 Guangxi 225.4 3.0 224.6 3.8 217.7 6.2
海 南 Hainan 56.2 0.5 56.2 0.9 56.1 1.5
重 庆 Chongqing 204.5 4.7 210.0 4.9 210.0 10.0
四 川 Sichuan 461.9 65.2 470.2 16.2 412.2 20.4
贵 州 Guizhou 126.2 0.6 138.7 0.6 136.4 1.5
云 南 Yunnan 181.0 4.5 191.2 5.2 190.7 7.7
西 藏 Tibet 5.7 5.7 6.3
陕 西 Shaanxi 314.0 1.1 309.8 2.3 304.9 3.8
甘 肃 Gansu 159.3 2.6 172.0 2.2 162.7 2.5
青 海 Qinghai 49.3 0.3 43.8 1.2 35.7 2.0
宁 夏 Ningxia 37.2 0.4 34.1 0.7 34.7 1.1
新 疆(含兵团)Xinjiang 166.7 1.4 182.5 1.9 188.2 5.1
11-34 continued
单位:万人 (10000 persons)
2 0 0 2 2 0 0 3
年末参保 全年发放失业 年末参保 全年发放失业
职工人数 保险金人数 职工人数 保险金人数
Contributors Beneficiaries Contributors Beneficiaries
at the in the Year at the in the Year
地 区 Region
Year-end Year-end
National 10181.6 657.0 10372.4 741.6
北 京 Beijing 299.6 14.2 306.6 14.1
天 津 Tianjin 196.3 17.8 193.5 15.2
河 北 Hebei 488.6 14.2 484.2 13.5

8/2/2019 China Labour Statistical Yearbook - 2004
http://slidepdf.com/reader/full/china-labour-statistical-yearbook-2004 429/464
山 西 Shanxi 278.9 5.1 284.1 9.9
内 蒙 古 Inner Mongolia 219.7 17.9 221.6 11.6
辽 宁 Liaoning 591.2 101.1 622.2 135.6
吉 林 Jilin 284.0 24.3 292.9 25.1
黑 龙 江 Heilongjiang 466.0 26.2 479.0 22.1
上 海 Shanghai 436.0 34.6 441.1 30.6
江 苏 Jiangsu 735.6 76.7 761.6 88.3
浙 江 Zhejiang 390.0 47.9 396.8 36.5
安 徽 Anhui 378.8 22.3 380.8 33.3
福 建 Fujian 249.5 17.7 266.4 18.1
江 西 Jiangxi 226.7 5.2 215.5 8.2
山 东 Shandong 701.2 38.4 719.1 47.6
河 南 Henan 670.4 22.5 680.0 30.1
湖 北 Hubei 416.1 33.7 390.1 35.4
湖 南 Hunan 326.6 14.1 347.5 18.3
广 东 Guangdong 890.2 41.6 954.1 46.2
广 西 Guangxi 215.5 10.2 219.1 13.8
海 南 Hainan 60.2 2.5 57.7 2.9
重 庆 Chongqing 205.3 12.9 199.5 14.2
四 川 Sichuan 402.9 21.6 400.0 22.2
贵 州 Guizhou 132.2 2.3 128.0 2.4
云 南 Yunnan 183.2 8.6 183.0 11.9
西 藏 Tibet 7.1 7.1
陕 西 Shaanxi 315.7 8.8 323.3 11.5
甘 肃 Gansu 161.0 3.9 162.1 8.0
青 海 Qinghai 32.2 2.2 33.2 2.0
宁 夏 Ningxia 35.7 1.4 36.3 1.4
新 疆(含兵团)Xinjiang 185.2 7.2 186.5 11.7

8/2/2019 China Labour Statistical Yearbook - 2004
http://slidepdf.com/reader/full/china-labour-statistical-yearbook-2004 430/464
11-35
UNEMPLOYMENT INSURANCE BY REGION
(2003)
单位:万人 (10000 persons)
年末参保人数 Contributors at the Year-end
Contributors this Year
合 计 一、企业
Total Enter- 国有企业 集体企业 其他企业
prises State- Collective- Other 外商投
owned owned Enter- 资企业
Enter- Enter- prises Foreign
prises prises Funded
Enter-
地区 Region
prises
National 10372 8030 4884 1125 2021 693
北 京 Beijing 306.6 231.6 111.2 14.6 105.8 26.3
天 津 Tianjin 193.5 158.9 102.1 20.6 36.2 29.1
河 北 Hebei 484.2 364.7 250.1 45.8 68.8 18.6
山 西 Shanxi 284.1 236.1 210.2 24.1 1.7 1.0
内 蒙 古 Inner Mongolia 221.6 157.2 86.2 17.9 53.1 3.5
辽 宁 Liaoning 622.2 486.3 248.4 124.6 113.3 35.9
吉 林 Jilin 292.9 245.1 201.7 22.3 21.0 2.9
黑 龙 江 Heilongjiang 479.0 429.8 327.7 71.4 30.8 13.4
上 海 Shanghai 441.1 314.6 112.9 40.3 161.4 65.0
江 苏 Jiangsu 761.6 606.3 266.4 130.4 209.5 80.2
浙 江 Zhejiang 396.8 292.5 83.2 43.7 165.7 29.4安 徽 Anhui 380.8 290.6 188.8 59.6 42.1 5.4
福 建 Fujian 266.4 214.2 74.0 24.2 116.0 59.3
江 西 Jiangxi 215.5 154.6 136.4 11.7 6.4 0.9
山 东 Shandong 719.1 568.0 389.1 100.3 78.6 34.0
河 南 Henan 680.0 512.0 343.0 91.5 77.5 10.3
湖 北 Hubei 390.1 283.5 222.5 30.3 30.7 10.7
湖 南 Hunan 347.5 228.5 191.5 23.1 13.8 4.9
广 东 Guangdong 954.1 858.0 262.9 86.8 508.3 237.7
广 西 Guangxi 219.1 134.3 102.5 13.3 18.6 3.6
海 南 Hainan 57.7 48.5 42.4 3.2 2.9 1.8
重 庆 Chongqing 199.5 160.4 119.3 29.1 12.0 4.0
四 川 Sichuan 400.0 276.6 191.8 22.1 62.8 7.2
贵 州 Guizhou 128.0 88.6 79.0 5.1 4.5 0.8
云 南 Yunnan 183.0 125.2 78.2 17.2 29.8 1.5
西 藏 Tibet 7.1 3.2 3.2
陕 西 Shaanxi 323.3 257.1 212.0 31.6 13.5 3.7
甘 肃 Gansu 162.1 121.3 93.3 12.9 15.1 0.5
青 海 Qinghai 33.2 22.1 20.2 0.6 1.2
宁 夏 Ningxia 36.3 26.6 20.5 1.7 4.4 0.2
新疆(含兵团 Xinjiang 186.5 133.4 113.6 4.5 15.4 1.1
11-35 continued
单位:万人 (10000 persons)
领取失业保
事业单位 其他单位 险 金人 数
Institutions Others
Beneficiaries of
Unemployment
Insurance
地 区 Region
this Year

8/2/2019 China Labour Statistical Yearbook - 2004
http://slidepdf.com/reader/full/china-labour-statistical-yearbook-2004 431/464
National 2175.3 167.8 741.6
北 京 Beijing 75.0 14.1
天 津 Tianjin 34.6 15.2
河 北 Hebei 118.5 0.9 13.5
山 西 Shanxi 47.5 0.5 9.9
内 蒙 古 Inner Mongolia 59.8 4.5 11.6
辽 宁 Liaoning 102.5 33.4 135.6
吉 林 Jilin 47.5 0.3 25.1
黑 龙 江 Heilongjiang 48.6 0.5 22.1
上 海 Shanghai 66.8 59.8 30.6
江 苏 Jiangsu 146.1 9.3 88.3
浙 江 Zhejiang 89.2 15.2 36.5
安 徽 Anhui 89.5 0.7 33.3
福 建 Fujian 49.9 2.3 18.1
江 西 Jiangxi 60.8 0.1 8.2
山 东 Shandong 149.1 2.1 47.6
河 南 Henan 163.1 4.9 30.1湖 北 Hubei 105.7 0.9 35.4
湖 南 Hunan 118.6 0.5 18.3
广 东 Guangdong 72.9 23.2 46.2
广 西 Guangxi 84.5 0.2 13.8
海 南 Hainan 8.8 0.5 2.9
重 庆 Chongqing 36.4 2.7 14.2
四 川 Sichuan 122.3 1.1 22.2
贵 州 Guizhou 39.3 0.1 2.4
云 南 Yunnan 56.8 1.0 11.9
西 藏 Tibet 3.9
陕 西 Shaanxi 64.4 1.8 11.5
甘 肃 Gansu 40.4 0.4 8.0
青 海 Qinghai 10.8 0.3 2.0
宁 夏 Ningxia 9.5 0.2 1.4
新疆(含兵团) Xinjiang 52.6 0.5 11.7

8/2/2019 China Labour Statistical Yearbook - 2004
http://slidepdf.com/reader/full/china-labour-statistical-yearbook-2004 432/464
11-36
BALANCE OF UNEMPLOYMENT INSURANCE FUND BY REGION
(2003)
单位:万元 (10000 yuan)
本年基金收入 Revenue this Year
合 计 失业保险费 Contributed 利息收入 财政补
Total 单位缴费 Interest 贴收入
By Units Financial
地 区 Region
Allowance
National 2495178 2331001 29761 82980
北 京 Beijing 125844.4 124184.6 1400.1 14.1
天 津 Tianjin 56578.8 56223.9 352.6
河 北 Hebei 91349.1 86592.9 1313.6 35.8
山 西 Shanxi 37974.2 37139.6 768.7 51.6
内 蒙 古 Inner Mongolia 36925.2 33209.1 281.5 3066.6
辽 宁 Liaoning 168145.3 143876.6 592.2 21446.1
吉 林 Jilin 53674.2 48453.7 670.5 2745.0
黑 龙 江 Heilongjiang 84046.0 67944.4 1252.8 2442.1
上 海 Shanghai 260916.4 259736.4 1160.6
江 苏 Jiangsu 235174.4 218953.4 2544.5 10293.5
浙 江 Zhejiang 134360.6 118913.2 2432.0 11854.4
安 徽 Anhui 70237.8 60996.4 442.3 8197.0
福 建 Fujian 61422.5 56843.2 220.2 4337.2
江 西 Jiangxi 30953.2 30050.5 567.7 169.5
山 东 Shandong 184019.0 170134.6 2513.8 2335.8
河 南 Henan 85576.9 82757.5 1755.1 956.6
湖 北 Hubei 76482.4 64024.2 672.6 10215.0
湖 南 Hunan 61624.7 59577.6 1727.6 191.5
广 东 Guangdong 246585.2 232135.5 3662.2 310.0
广 西 Guangxi 43111.1 41276.7 941.6 589.8
海 南 Hainan 11791.7 11619.8 81.0 81.5
重 庆 Chongqing 26476.3 26375.6 80.8 19.9
四 川 Sichuan 84169.3 79669.1 1192.2 3298.6
贵 州 Guizhou 31467.4 30477.5 890.2 58.8
云 南 Yunnan 44576.7 44067.0 454.6 5.0
西 藏 Tibet 3575.2 3514.4 60.7
陕 西 Shaanxi 41349.1 40245.6
甘 肃 Gansu 29828.4 27260.1 43.5 9.4
青 海 Qinghai 9023.6 8921.3 328.2 254.8
宁 夏 Ningxia 7813.5 7383.3 85.8
新疆(含兵团) Xinjiang 60105.9 58443.7 1271.7 1.0
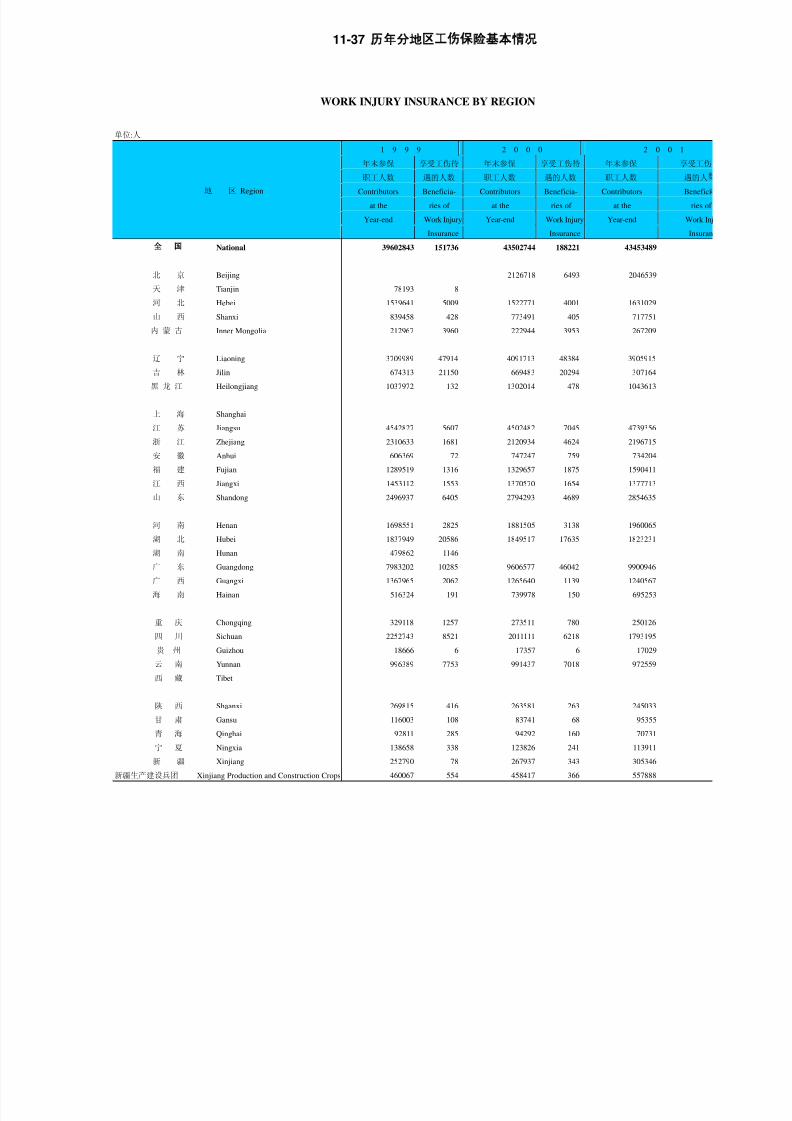
8/2/2019 China Labour Statistical Yearbook - 2004
http://slidepdf.com/reader/full/china-labour-statistical-yearbook-2004 433/464
11-37
WORK INJURY INSURANCE BY REGION
单位:人
1 9 9 9 2 0 0 0 2 0 0 1
年末参保 享受工伤待 年末参保 享受工伤待 年末参保 享受工伤
职工人数 遇的人数 职工人数 遇的人数 职工人数 遇的人
Contributors Beneficia- Contributors Beneficia- Contributors Benefici
at the ries of at the ries of at the ries of
Year-end Work Injury Year-end Work Injury Year-end Work Inj
地 区 Region
Insurance Insurance Insuran
National 39602843 151736 43502744 188221 43453489
北 京 Beijing 2126718 6493 2046539
天 津 Tianjin 78193 8
河 北 Hebei 1539641 5009 1522771 4001 1631029
山 西 Shanxi 839458 428 773491 405 717751
内 蒙 古 Inner Mongolia 212967 3960 222944 3953 267209
辽 宁 Liaoning 3709989 47914 4091713 48384 3905915
吉 林 Jilin 674313 21150 669483 20294 307164
黑 龙 江 Heilongjiang 1037972 132 1302014 478 1043613
上 海 Shanghai
江 苏 Jiangsu 4542827 5607 4502482 7045 4739356
浙 江 Zhejiang 2310633 1681 2120934 4624 2196715
安 徽 Anhui 606369 72 747247 759 734204
福
建
Fujian 1289519 1316 1329657 1875 1590411 江 西 Jiangxi 1453112 1553 1370570 1654 1377713
山 东 Shandong 2496937 6405 2794293 4689 2854635
河 南 Henan 1698551 2825 1881505 3138 1960065
湖 北 Hubei 1837949 20586 1849517 17635 1823231
湖 南 Hunan 479862 1146
广 东 Guangdong 7983202 10285 9606577 46042 9900946
广 西 Guangxi 1367965 2062 1265640 1139 1240567
海 南 Hainan 516324 191 739978 150 695253
重 庆 Chongqing 329118 1257 273511 780 250126
四 川 Sichuan 2252743 8521 2011111 6218 1793195
贵 州 Guizhou 18666 6 17357 6 17029
云 南 Yunnan 996389 7753 991437 7018 972559
西 藏 Tibet
陕 西 Shaanxi 269815 416 263581 263 245033
甘 肃 Gansu 116003 108 83741 68 95355
青 海 Qinghai 92811 285 94292 160 70731
宁 夏 Ningxia 138658 338 123826 241 113911
新 疆 Xinjiang 252790 78 267937 343 305346
新疆生产建设兵团 Xinjiang Production and Construction Crops 460067 554 458417 366 557888

8/2/2019 China Labour Statistical Yearbook - 2004
http://slidepdf.com/reader/full/china-labour-statistical-yearbook-2004 434/464
11-38
WORK INJURY INSURANCE BY REGION
(2003)
参保职 基金收入 基金支出 累计结余 享受工伤待遇的人数(人)
工人数 (万元) (万元) (万元) Beneficiaries of Work
(人) Revenue Expenses Reserve Injury Insurance(person)
Employees (10000 (10000 (10000 合 计 一至四级
Insured yuan) yuan) yuan) Total 1-4
地 区 Region
(person) Level
National 45748335 375889 271318 912186 294683 38483
北 京 Beijing 2428990 28197 23953 29395 10059 2522
天 津 Tianjin
河 北 Hebei 1456909 4869 4019 8421 3822 519
山 西 Shanxi 484432 1013 749 3287 382 40
内 蒙 古 Inner Mongolia 318332 1758 928 1863 2393 391
辽 宁 Liaoning 3458000 21247 21689 39412 65191 13234
吉 林 Jilin 371226 1428 1032 2984 11804 1077
黑 龙 江 Heilongjiang 1309403 5096 3497 8431 9641 1243
上 海 Shanghai
江 苏 Jiangsu 5030194 33217 27989 75922 15099 3770
浙 江 Zhejiang 2877043 22394 12662 68754 13875 507
安 徽 Anhui 679906 4604 2792 7347 3872 224
福
建
Fujian 1722504 19696 8006 59786 3663 211 江 西 Jiangxi 1296637 8850 5132 27564 2475 458
山 东 Shandong 2818274 14530 11549 34956 12695 2800
河 南 Henan 2106114 5798 4020 16562 4457 1433
湖 北 Hubei 1891875 4148 2912 15273 13499 3598
湖 南 Hunan 85942 4821 4825 13919 261 6
广 东 Guangdong 11200081 133372 94142 370110 95863 1085
广 西 Guangxi 1203323 10249 6123 29375 3002 404
海 南 Hainan 681660 3705 2649 14390 922 41
重 庆 Chongqing 264538 856 153
四 川 Sichuan 1614084 16330 12213 38253 7120 2655
贵 州 Guizhou 12639 171 61 447 18 2
云 南 Yunnan 841140 16472 12839 22333 10037 785
西 藏 Tibet
陕 西 Shaanxi 350523 1488 886 2818 692 226
甘 肃 Gansu 79902 325 344 1126 185 62
青 海 Qinghai 66063 1654 1680 897 329 329
宁 夏 Ningxia 152179 1118 1049 1246 190 18
新 疆 Xinjiang 410765 3221 1804 7396 1048 305
新疆生产建设兵团 Xinjiang Production and
Construction Crops 535657 6118 1774 9919 1233 385

8/2/2019 China Labour Statistical Yearbook - 2004
http://slidepdf.com/reader/full/china-labour-statistical-yearbook-2004 435/464
11-39
MATERNITY INSURANCE BY REGION
单位:人 (person)
1 9 9 9 2 0 0 0 2 0 0 1
年末参保 享受待遇人数享受待遇人数 年末参保 享受待遇人数享受待遇人数 年末参保 享受待遇人数
职工人数 Beneficia- Beneficia- 职工人数 Beneficia- Beneficia- 职工人数 Beneficia-
Contributors
ries of ries of Contributors
ries of ries of Contributors
ries of
at the Maternity Maternity at the Maternity Maternity at the Maternity
地 区 Region
Year-end Insurance Insurance Year-end Insurance Insurance Year-end Insurance
National 29453554 30016395 34550557 24486
北 京 Beijing
天 津 Tianjin 75497
河 北 Hebei 1429444 1380158 1315476 761
山 西 Shanxi 1216432 1131829 1080399 250
内 蒙 古 Inner Mongolia 264619 264708 279192 2655
辽 宁 Liaoning 1981709 2288627 2277558 1201
吉 林 Jilin 565177 551065 239563 65
黑 龙 江 Heilongjiang 503179 702903 681812 1915
上 海 Shanghai 4436661 653
江 苏 Jiangsu 4465128 4576600 4834639 46015
浙 江 Zhejiang 2138565 2000168 1876402 1678
安 徽 Anhui 335164 238391 233986 146
福 建 Fujian 996621 938275 1181935 938
江 西 Jiangxi 1419753 1293785 1201528 830 山 东 Shandong 2654384 3255450 3318382 34305
河 南 Henan 2160850 2002863 1963637 1067
湖 北 Hubei 1890646 1912960 1821375 1092
湖 南 Hunan 155634 37041 98
广 东 Guangdong 2103160 2315665 2500681 23655
广 西 Guangxi 1006401 1125761 1135325 12183
海 南 Hainan 107764 59
重 庆 Chongqing 247782 255546 235863 221
四 川 Sichuan 1918669 1881954 1781030 1561
贵 州 Guizhou 11696 11148 10867 2
云 南 Yunnan 966711 954694 961061 1168
西 藏 Tibet
陕 西 Shaanxi 57147 52622 45862 783
甘 肃 Gansu 75305 60014 50312 30
青 海 Qinghai 85381 85145 66366 54
宁 夏 Ningxia 105738 93696 86603 146
新 疆 Xinjiang 237952 254626 305219 329
新疆生产建设兵团 Xinjiang Production and Construction Crops 384810 387742 484018 652

8/2/2019 China Labour Statistical Yearbook - 2004
http://slidepdf.com/reader/full/china-labour-statistical-yearbook-2004 436/464
11-40
MATERNITY INSURANCE BY REGION
(2003)
参保职 享受待遇人数 基金收入 基金支出 累计结余
工人数 (人) (万元) (万元) (万元)
(人) Beneficiaries Revenue Expenses Reserve
Number of of Maternity (10000 yuan) (10000 yuan) at the
Employees Insurance Year-end
Insured (person) (10000 yuan)
地 区 Region
(person)
National 36554162 363816 257612 134624 419864
北 京 Beijing
天 津 Tianjin
河 北 Hebei 940908 4311 1968 1197 5355
山 西 Shanxi 843391 2493 1510 1112 3324
内 蒙 古 Inner Mongolia 403282 1735 963 414 1513
辽 宁 Liaoning 1991090 14666 9241 4986 17263
吉 林 Jilin 340173 1180 1186 222 4469
黑 龙 江 Heilongjiang 1675292 27488 2716 1857 3284
上 海 Shanghai 4610582 40737 71382 28080 85454
江 苏 Jiangsu 5040625 72415 40120 21490 78287
浙
江
Zhejiang 2150367 21155 18220 8806 43760 安 徽 Anhui 238558 1868 1280 618 1471
福 建 Fujian 1393519 14469 7908 5389 8984
江 西 Jiangxi 1087337 5640 3251 2735 9679
山 东 Shandong 3364535 40852 21942 12278 29851
河 南 Henan 1991625 11153 3980 3485 5502
湖 北 Hubei 1821199 6190 4052 1840 8960
湖 南 Hunan 32796 366 340 247 468
广 东 Guangdong 3307594 30042 27740 15798 49983
广 西 Guangxi 1110668 12364 7327 4286 13049
海 南 Hainan 283814 2168 1730 546 2365
重 庆 Chongqing 164980 688
四 川 Sichuan 1651039 12790 9355 4960 20309
贵 州 Guizhou 8876 58 29 13 73
云 南 Yunnan 827883 14210 13922 9612 16218
西 藏 Tibet
陕 西 Shaanxi 146427 1158 611 354 676
甘 肃 Gansu 68207 393 315 157 477
青 海 Qinghai 51843 922 507 315 495
宁 夏 Ningxia 150702 1929 647 362 275
新 疆 Xinjiang 321587 4161 2942 1846 2435
新疆生产建设兵团 Xinjiang Production and Construction Crops 535263 16215 2428 1619 5885

8/2/2019 China Labour Statistical Yearbook - 2004
http://slidepdf.com/reader/full/china-labour-statistical-yearbook-2004 437/464
11-41
RURAL SOCIAL OLD-AGE INSURANCE BY REGION
2003
开展工作的地区和单位(个)
Number of Region Launching the
Rural Old-age Insurance
地 级 县 级 乡 镇 村 乡镇企业
Prefec- Counties Small Villages Township
tures Towns Enter-
地 区 Region
prises
National 250 1870 27578 389431 84775
北 京 Beijing 13 192 3980 2294
天 津 Tianjin
河 北 Hebei 11 143 1467 29280 999
山 西 Shanxi 11 116 1497 10896 6582
内 蒙 古 Inner Mongolia 10 58 865 7490
辽 宁 Liaoning 13 59 888 9688 5031
吉 林 Jilin 6 29 444 1046 14
黑 龙 江 Heilongjiang 13 98 877
上 海 Shanghai 13 89 1058 21947 3090
江 苏 Jiangsu 10 127 2000 13899
浙 江 Zhejiang 89 1314 19967 23623
安 徽 Anhui 11 32 1289 29297 7096.61
福 建 Fujian 17 90 1726 19026 4943
江 西 Jiangxi 9 82 1065 15295
山 东 Shandong 11 95 1487 17300 7564
河 南 Henan 17 148 1831 83471 3870
湖 北 Hubei 14 91 1148 18753 423
湖 南 Hunan 13 55 206
广 西 Guangxi 13 96 1792 24697 871
海 南 Hainan 14 85 1127 9787 299
重 庆 Chongqing 2 22 245 3607 1221
四 川 Sichuan 1 16 614 4622 133
贵 州 Guizhou 19 100 2898 29802 2114
云 南 Yunnan 0 1 26 377 1
西 藏 Tibet 14 103 1145 7822 293
陕 西 Shaanxi 10 99 1613 14145 356
甘 肃 Gansu 1 9 194 1345 54
青 海 Qinghai 7 23 193 2000
宁 夏 Ningxia 15 140
新 疆 Xinjiang 12 44 242 1366 4
深 圳 Shenzhen 1 2 19 219

8/2/2019 China Labour Statistical Yearbook - 2004
http://slidepdf.com/reader/full/china-labour-statistical-yearbook-2004 438/464
12-1
NUMBER OF GRASSROOTS TRADE UNION BY REGION
(2003)
内资企业 Enterprises of Domestic Funded
总 计 国有企业 集体企业 股份合作企业 联营企业 有限责任公司 股份有限公司
地 区 Region (个) Limited Share-holding
Total State-owned Urban Collec- Cooperative
Joint-owned
Liability Corporations
tive-owned Corporations Ltd.
National 905516 118587 83842 25916 3930 35364 16790
北 京 Beijing 14048 2178 1745 994 44 1358 496
天 津 Tianjin 12440 2278 1862 340 44 454 430
河 北 Hebei 47888 6172 6588 821 276 1132 624
山 西 Shanxi 20894 4090 4819 337 64 620 338
内蒙古 Inner Mongolia 22239 2161 578 349 81 1156 417
辽 宁 Liaoning 35717 4897 3698 832 83 1062 632
吉 林 Jilin 21000 3873 1672 335 56 846 387
黑龙江 Heilongjiang 19488 5716 1578 454 26 551 320
上 海 Shanghai 25125 3219 2624 1149 181 1670 886
江 苏 Jiangsu 47128 4102 3968 3659 200 2934 1354
浙 江 Zhejiang 56429 2607 1938 5341 395 5029 1875
安 徽 Anhui 30104 3964 4092 661 219 853 479福 建 Fujian 51295 4194 2684 728 77 762 516
江 西 Jiangxi 22431 3865 2104 242 77 179 314
山 东 Shandong 55175 6707 5939 1739 125 3067 1581
河 南 Henan 52295 7482 6075 1009 179 1593 778
湖 北 Hubei 45391 11350 5143 656 141 954 457
湖 南 Hunan 49647 6669 5301 1106 259 570 496
广 东 Guangdong 67858 7013 6001 896 311 2364 1152
广 西 Guangxi 22640 3643 1892 274 239 537 211
海 南 Hainan 6281 1554 546 58 135 103 54
重 庆 Chongqing 15857 1343 1440 499 77 646 329
四 川 Sichuan 54817 4651 3355 1276 259 3139 1171
贵 州 Guizhou 22163 3259 1614 314 99 360 187
云 南 Yunnan 21539 2364 1814 705 30 804 317
西 藏 Tibet
陕 西 Shaanxi 30029 3997 3188 475 139 878 353
甘 肃 Gansu 15018 2080 880 270 82 516 241
青 海 Qinghai 4642 566 231 127 6 140 96
宁 夏 Ningxia 4675 615 196 105 7 313 89
新 疆 Xinjiang 11263 1978 277 165 19 774 210

8/2/2019 China Labour Statistical Yearbook - 2004
http://slidepdf.com/reader/full/china-labour-statistical-yearbook-2004 439/464
12-2
TRADE UNION MEMBERS IN GRASSROOTS TRADE UNION BY REGION
(2003)
内资企业 Enterprises of Domestic Funded
总 计 国有企业 集体企业 股份合作企业 联营企业 有限责任公司 股份有限公司
地 区 Region (人) Limited Share-holding
Total State-owned Urban Collec- Cooperative
Joint-owned
Liability Corporations
(person) tive-owned Corporations Ltd
National 123404806 39403387 9329222 3634627 726789 7288039 6044991
北 京 Beijing 2443031 847276 145820 60646 5615 165588 198813
天 津 Tianjin 1889914 773986 226794 46083 4991 112724 77847
河 北 Hebei 6282881 1900481 587039 143699 55243 394356 233897
山 西 Shanxi 3522682 1686195 458483 40646 10216 139011 149641
内蒙古 Inner Mongolia 3335820 750463 55663 66596 40711 427700 233224
辽 宁 Liaoning 7698113 3107354 895262 155065 12458 402293 292974
吉 林 Jilin 3472913 1534128 194874 50588 42162 127208 248976
黑龙江 Heilongjiang 3849210 2356087 170634 52050 3802 157621 109372
上 海 Shanghai 3807807 1133025 337381 140541 24266 209126 295908
江 苏 Jiangsu 8495474 1585559 548523 663516 52657 753208 544174
浙 江 Zhejiang 6430752 596199 214244 601980 46959 679999 441815
安 徽 Anhui 3919493 1358015 412257 93233 63674 176289 276116
福 建 Fujian 3778464 653574 158919 56066 7903 69600 133625
江 西 Jiangxi 2603613 1088845 207024 27161 26941 50277 56453
山 东 Shandong 8427679 2072387 817708 383592 25757 893475 669387
河 南 Henan 7174692 2600003 610999 163625 19235 409549 333487
湖 北 Hubei 6716527 3930345 500168 108133 21807 191549 207506
湖 南 Hunan 6382204 2084782 870134 133320 60436 228661 182690
广 东 Guangdong 9297749 1509104 830379 163841 34871 327543 321211
广 西 Guangxi 2605469 901605 137318 66600 12655 96621 81958
海 南 Hainan 657077 359699 29384 6207 6788 9562 23449
重 庆 Chongqing 1795710 539995 115360 45417 10216 116677 111679
四 川 Sichuan 6363349 1399896 264770 164277 89224 396758 327565
贵 州 Guizhou 2008511 640550 74787 28746 13366 84129 43948
云 南 Yunnan 2127665 638616 92931 51747 1723 149772 113774
西 藏 Tibet
陕 西 Shaanxi 3275746 1263052 210306 46816 18403 227522 139814
甘 肃 Gansu 1904253 760647 98803 27531 7501 89335 77080
青 海 Qinghai 409716 124700 14968 10981 254 27608 17216
宁 夏 Ningxia 522818 205134 13300 14390 171 35786 27423
新 疆 Xinjiang 2205474 1001685 34990 21534 6784 138492 73969

8/2/2019 China Labour Statistical Yearbook - 2004
http://slidepdf.com/reader/full/china-labour-statistical-yearbook-2004 440/464
12-3
EMPLOYEE CONGRESS SYSTEM IN GRASSROOTS TRADE UNION BY REGION
(2003)
建立职工 本年度召开 职工(代表) 实行业务招待 开展民主评 实行厂务
(代表)大 过职工(代表) 大会的 女职工 费使用情况向 议企事业领 公开的企
会制度的企 大会的企事 职工代表 代表 职工(代表) 导干部的企 事业单位
事业单位 业单位 (人) 大会报告制度 事业单位 (个)
地 区 Region (个) (个) 的企事业单位 (个)
Number of Number of Congress (个)
Establish- Establish- Members Female Number of Number of Number of
ments with
ments with Establish- Establish- Establish-
Employee Congress (person) ments with ments with ments with
Congress Held Reporting Syst- Carrying out
Publishing
em of Operation
Commenting Management
Serving Outlay on Leaders Affairs
to Congress
National 350747 275120 8843393 3000312 238095 263067 291425
北 京 Beijing 6402 4811 156853 62228 4855 5675 5946
天 津 Tianjin 6302 5668 160451 57917 5953 5516 5693
河 北 Hebei 21033 17746 440127 147450 15312 15354 18746
山 西 Shanxi 6477 5422 263023 69285 4454 4833 4451
内蒙古 Inner Mongolia 5893 5188 210216 70826 5130 4835 5446
辽 宁 Liaoning 15344 12316 376879 133143 8837 9660 11400
吉 林 Jilin 8209 6530 243565 90283 6116 7251 7598
黑龙江 Heilongjiang 8917 7645 327812 111956 7173 7927 8027
上 海 Shanghai 12583 10311 309968 119521 8460 9061 9795
江 苏 Jiangsu 20895 17610 631979 239962 14252 15967 16697
浙 江 Zhejiang 22171 15281 428509 160641 10234 11671 12152
安 徽 Anhui 9553 7763 265997 79191 6909 7734 9324
福 建 Fujian 22661 12580 360278 123462 10042 14629 21983
江 西 Jiangxi 5101 4525 169317 50348 4377 4507 4629
山 东 Shandong 26363 21496 826290 287348 20029 22348 23366
河 南 Henan 21428 18642 603761 198363 15878 16699 17206
湖 北 Hubei 21445 15123 473726 120529 12919 14105 16343
湖 南 Hunan 18352 10569 374450 126328 9469 9307 10123
广 东 Guangdong 18755 14785 473700 177535 11945 13868 16432
广 西 Guangxi 8717 7117 219159 73321 6129 6989 7514
海 南 Hainan 1992 1308 54269 15982 1235 1462 1940
重 庆 Chongqing 5801 4922 110194 36143 4446 4893 5182
四 川 Sichuan 20397 18326 426112 142715 16020 17734 18382
贵 州 Guizhou 5863 4796 139859 44306 4222 4841 5615
云 南 Yunnan 8004 6517 193507 64754 6241 7019 7818
西 藏 Tibet
陕 西 Shaanxi 9926 8320 239417 76995 8077 8699 8737
甘 肃 Gansu 4222 3481 137718 35212 3341 3679 3940
青 海 Qinghai 1009 881 27098 8307 860 907 836
宁 夏 Ningxia 2180 1471 45403 16684 1285 1650 1743
新 疆 Xinjiang 4539 3806 145303 56169 3776 3994 4187
国家机关 209 160 8133 3256 118 250 172
中直机关 4 4 320 152 1 3 2

8/2/2019 China Labour Statistical Yearbook - 2004
http://slidepdf.com/reader/full/china-labour-statistical-yearbook-2004 441/464
12-4
VOCATIONAL TRAINING ORGANIZATIONS ABOVE GRASSROOTS TRADE UNION BY REGION
(2003 年 4 季度)
(the Fourth Season,2003)
工会现有 自开办以来 本年度工会
职业培训 工会职业培 下岗失业 职业培训 下岗失业
机构 训机构累计 人员人次数 经培训累 机构培训 人员人次数 本年度经
(个) 培训 计实现再 人次数 培训实现
(人次) 就业人数 (人次) 再就业人数
地 区 Region Number of Trained Laid-off Trained Laid-off
Vocational Persons and Re- Persons and Re-
Training Unemployment employees This Year Unemployment employees
Organiza- (person/time) Persons (person/time) Persons
tions
National 3844 5146770 3616926 2154790 1093867 876895 454373
北 京 Beijing 7 62891 6004 5299 6266 276 241
天 津 Tianjin 107 291655 261330 224150 42660 42660 24150
河 北 Hebei 194 191281 153024 91814 42977 34574 20744
山 西 Shanxi 170 150859 98763 36116 45652 30653 13126
内蒙古 Inner Mongolia 57 123017 108613 69911 8714 7762 3865
辽 宁 Liaoning 568 362310 326079 189125 159295 143365 63718
吉 林 Jilin 185 200057 150284 79800 45337 43588 21837
黑龙江 Heilongjiang 121 248212 227865 109245 46438 43405 13122
上 海 Shanghai 25 200000 200000 33000 33000江 苏 Jiangsu 137 157068 157068 66161 75610 75610 22289
浙 江 Zhejiang 55 146760 55720 22988 11781 9023 4392
安 徽 Anhui 117 78259 70234 51231 41370 35360 17749
福 建 Fujian 59 92975 50744 28836 21343 12987 7959
江 西 Jiangxi 126 176658 123968 48611 24096 15052 10709
山 东 Shandong 364 402093 221359 155075 69771 44468 32042
河 南 Henan 221 395714 285468 125018 76434 68028 62947
湖 北 Hubei 320 278400 213400 211300 58600 52400 33400
湖 南 Hunan 337 90000 35000 13600 47920 24634 9567
广 东 Guangdong 49 251576 49787 34540 29375 8920 5407
广 西 Guangxi 55 54773 48655 32073 25929 22314 21329
海 南 Hainan 131 23513 9957 1237 1297 816 730
重 庆 Chongqing 34 90000 63000 29000 50000 36000 7200
四 川 Sichuan 115 723752 420000 412523 39979 36868 23491
贵 州 Guizhou 114 54497 47459 20357 38294 19343 10530
云 南 Yunnan 27 30896 10176 5710 4968 3286 1540
西 藏 Tibet
陕 西 Shaanxi 88 72930 58344 35006 9675 7740 4644
甘 肃 Gansu 21 98120 91352 23620 14632 11250 8315
青 海 Qinghai 7 49876 40723 12633 8230 7159 2976
宁 夏 Ningxia 6 13800 1878 1878
新 疆 Xinjiang 27 34828 30672 17933 14224 6354 6354

8/2/2019 China Labour Statistical Yearbook - 2004
http://slidepdf.com/reader/full/china-labour-statistical-yearbook-2004 442/464
12-5
CONDITION OF CARRYING OUT RATIONALIZED PROPOSALS AND
LABOR EMULATION IN GRASSROOTS TRADE UNION BY REGION
(2003)
开展经济技 本年度职工 本年度已实 已实施合理化建 本年度参加 本年度参加 本年度参加
术创新工程 提出合理化 施的合理化 议创造(节约)价 劳动竞赛的 技术练兵、 技术培训的
活动单位数 建议件数 建议件数 值折算的金额数 职工人次数 技术比武的 职工
(个) (件) (件) (万元) (人次) 职工 (人次)
地 区 Region Units Rationalized Rationa- Amount of Person/Time (人次)
Carrying Proposals Put lized Money of Staff and Staff and Staff and
out Forward by Proposals from the Workers Workers Workers
Economic the Staff Practiced Rationalized Participating Joined Joined
Technology and Workers this Year Proposals in Labor Skill Skill
Creation this Year Practiced Emulation Compitition
Training
Project This Year This Year
(case) (case) (10000 yuan) (person/time) (person/time) (person/ time)
National 128977 7457298 2061884 2487095 52772328 18679486 34353386
北 京 Beijing 3790 237289 77518 104147 897440 451095 834987
天 津 Tianjin 3157 376380 77699 57693 819990 444034 1024371
河 北 Hebei 8075 795450 179352 140232 3247346 1280883 1853819
山 西 Shanxi 1599 239044 84600 130120 1235729 462403 747574
内蒙古 Inner Mongolia 2625 103533 34139 26899 2041877 599736 840301
辽 宁 Liaoning 5423 461464 114370 71447 3375448 1195798 2017726
吉 林 Jilin 3456 272746 51249 64877 1024087 605746 937611
黑龙江 Heilongjiang 3241 131494 53762 85462 3179079 694273 1395564
上 海 Shanghai 2414 373412 154402 161112 1064603 463670 1646546
江 苏 Jiangsu 7258 385550 153584 170247 2037670 961196 1700250
浙 江 Zhejiang 7211 284955 80635 130950 1284946 674114 1226544
安 徽 Anhui 2554 120335 39200 54072 1138201 643827 649080
福 建 Fujian 17204 167203 81646 143835 1151771 801093 848932
江 西 Jiangxi 1333 101286 17667 29305 566979 209473 266962
山 东 Shandong 12576 645471 252005 308605 2611539 1620342 2163753
河 南 Henan 6644 367070 118514 103391 5154071 1396272 2190926
湖 北 Hubei 3602 203916 66835 86494 1252107 936243 1355921
湖 南 Hunan 3036 175706 54300 65139 3263572 497728 772284
广 东 Guangdong 14253 963453 67570 164542 5180862 637440 2150006
广 西 Guangxi 1660 264243 24612 37493 1145116 295044 574291
海 南 Hainan 282 5398 2595 6763 239423 86726 180297
重 庆 Chongqing 1268 106780 26989 23947 1429165 281864 417080
四 川 Sichuan 7605 299184 129132 129522 5097208 1370290 4938355
贵 州 Guizhou 1060 41835 19081 54917 303665 128571 349112
云 南 Yunnan 1920 51378 24319 31370 621955 318766 576690
西 藏 Tibet
陕 西 Shaanxi 2453 124370 32522 39813 1114933 862604 808591
甘 肃 Gansu 1560 97032 22278 17122 549161 290071 445224
青 海 Qinghai 168 7283 2030 1938 118717 64886 69386
宁 夏 Ningxia 612 27455 7258 11253 158159 79438 221020
新 疆 Xinjiang 928 26319 11841 34220 1462228 324224 1139854
国家机关 9 237 174 159 5115 871 9852
中直机关 1 27 6 8 166 765 477

8/2/2019 China Labour Statistical Yearbook - 2004
http://slidepdf.com/reader/full/china-labour-statistical-yearbook-2004 443/464
12-6
CONDITION OF GRASSROOTS TRADE UNION PATICIPATING IN
DEALING WITH LABOR DISPUTE BY REGION
(2003)
建立劳动争议 劳动争议调解 本年度劳动争议 本年度劳动争议
调解委员会 委员会中 调解委员会受理 受理集体 调解委员会调解
的单位数 工会和职工 劳动争议件数 劳动争议 成功劳动争议件数
(个) 代表人数 (件) (件)
地 区 Region Units with (人) Cases Accepted by
Collective Cases Successfully
Labor Dispute Delegates of Labor Dispute Labor Dispute Madiated by
Mediation Trade Union and Mediation Labor Dispute
Committee Staff nad Workers Committee Mediation
in Labor Dispute this Year Committee
Mediation this Year
Committee (case) (case)
(person)
National 153113 551586 192692 9432 51781
北 京 Beijing 3257 13620 2445 69 941
天 津 Tianjin 2752 11463 2659 81 475
河 北 Hebei 13712 40620 5439 309 1571
山 西 Shanxi 2289 7499 3204 286 784
内蒙古 Inner Mongolia 2025 9001 1272 50 238
辽 宁 Liaoning 4473 21040 8598 186 629
吉 林 Jilin 2439 11385 2354 191 419
黑龙江 Heilongjiang 2553 14590 2715 287 980
上 海 Shanghai 5291 18253 4454 408 743
江 苏 Jiangsu 13109 48234 11436 638 3852
浙 江 Zhejiang 14126 39423 9326 505 4138
安 徽 Anhui 3121 13005 6857 238 1085
福 建 Fujian 19799 33103 7644 976 1833
江 西 Jiangxi 1587 6720 1629 162 349
山 东 Shandong 13089 50875 17769 633 7024
河 南 Henan 6756 30792 13219 1309 5124
湖 北 Hubei 3930 19299 11899 718 2414
湖 南 Hunan 2202 11280 4169 247 1008
广 东 Guangdong 13009 50895 37587 545 8699
广 西 Guangxi 3453 13734 3949 52 647
海 南 Hainan 463 2560 364 36 214
重 庆 Chongqing 1106 5366 2258 69 755
四 川 Sichuan 6413 25818 7965 466 1742
贵 州 Guizhou 2721 10086 2363 109 640
云 南 Yunnan 2714 11440 7667 161 978
西 藏 Tibet
陕 西 Shaanxi 2490 9692 2985 182 1110甘 肃 Gansu 1340 6429 3249 124 519
青 海 Qinghai 281 1282 1754 9 30
宁 夏 Ningxia 950 3441 975 235 451
新 疆 Xinjiang 1648 10571 4453 151 2389
国家机关 15 70 35
中直机关

8/2/2019 China Labour Statistical Yearbook - 2004
http://slidepdf.com/reader/full/china-labour-statistical-yearbook-2004 444/464
12-7
JOB EXCHANGES ABOVE GRASSROOTS TRADE UNION BY REGION
(2003 年4季度)
(the Fourth Season,2003)
工会现有 自开办以来 本年度工会
职业介绍 获得劳动 工会职业介 下岗失业 职业介绍机 下岗失业
机构 保障部门 获得政府 绍机构累计 人员人次数 构成功介绍 人员人次数
(个) 资质认定 职业介绍 成功介绍 (人次)
机构 补贴 (人次)
地 区 Region Number of Qualificated
(万元) Placed Laid-off Placed Laid-off
Job by Subsidized Jobseekers and Jobseekers and
Exchanges Labor and by Unemployed this Year Unemployed
Security Government (person/time) persons (person/time) persons
Bureau (10000 yuan)
National 2543 956 830 3054124 2049164 792731 550015
北 京 Beijing 7 7 226463 15204 40976 2351
天 津 Tianjin 80 15 10 63705 53087 24150 24150
河 北 Hebei 179 125 24 148603 133740 42610 33884
山 西 Shanxi 117 8 7 51014 39012 21532 13523
内蒙古 Inner Mongolia 84 27 18 82765 76413 9413 8926
辽 宁 Liaoning 288 56 57 237161 177870 85144 63850
吉 林 Jilin 125 19 5 107898 84950 17241 12397
黑龙江 Heilongjiang 104 36 4 164194 119377 10157 9183
上 海 Shanghai 23 1 114700 114700 2891 2891
江 苏 Jiangsu 82 68 49 230438 181160 87986 87986
浙 江 Zhejiang 65 40 1 83984 41572 22860 7951
安 徽 Anhui 101 37 115726 74289 30142 20187
福 建 Fujian 49 34 5 59170 32764 16577 9630
江 西 Jiangxi 101 57 2 132246 99547 15548 10392
山 东 Shandong 165 83 34 192462 104446 54276 29256
河 南 Henan 163 104 60 218945 182820 59669 42322
湖 北 Hubei 212 56 214 204350 94460 39400 31500
湖 南 Hunan 72 6 40 23470 13282 11328 4282
广 东 Guangdong 36 22 36 31532 17560 9462 4661
广 西 Guangxi 41 53365 37457 29574 25891
海 南 Hainan 43 15 15 2291 1729 931 595
重 庆 Chongqing 33 8 47800 33500 39700 32100
四 川 Sichuan 107 87 43 242910 173731 39372 27806
贵 州 Guizhou 106 6 23 47257 24398 32261 11517
云 南 Yunnan 31 6 23 22918 13304 6517 5117
西 藏 Tibet
陕 西 Shaanxi 88 15 150 54340 43472 11526 9221
甘 肃 Gansu 19 38450 32460 12871 11340
青 海 Qinghai 3 24830 15260 3968 3120
宁 夏 Ningxia 1 1258
新 疆 Xinjiang 18 18 10 29879 17600 14649 3986

8/2/2019 China Labour Statistical Yearbook - 2004
http://slidepdf.com/reader/full/china-labour-statistical-yearbook-2004 445/464
13-1
EMPLOYMENT BY ECONOMIC ACTIVITY
单位:千人 (1000)
行 业 Industry 1996 1997 1998 1999 2000 2001 2002
Total 3073.3 3163.6 3122.0 3112.1 3207.3 3252.3 3232.3
农林牧渔业 Agriculture,Hunting, 12.4 10.5 9.3 9.2 9.3 7.2 9.9
Forestry and Fishing
采掘业 Mining and Quarrying 0.5 0.5 0.2 0.3 0.3 0.2 0.4
制造业 Manufacturing 489.9 443.0 379.6 353.9 333.7 326.4 289.5
电力、天然气及水 Electricity,Gas and Water 21.8 19.1 17.7 17.0 16.6 15.7 15.9
建筑业 Construction 273.1 303.1 306.6 286.8 301.7 291.4 286.7
批发零售和餐饮、 Wholesale and Retail Trade
旅馆业 and Restaurants and Hotels 907.8 960.8 953.5 935.1 981.7 981.1 983.7
交通运输和仓储业 Transport,Storage and 336.2 343.4 349.2 339.4 356.6 353.4 346
Communication
金融保险、房地产 Financing,Insurance,Real
和商业服务 Estate and Business Services 363.8 405.1 410.3 437.7 452.7 478.1 474.7
团体、社会和个人 Community,Social and
服务 Personal Services 667.9 678.2 695.6 732.9 754.7 798.9 825.6
其 他 Activities not Adepuately - - - - - - -
Defined
Male 1865.9 1909.7 1856.9 1816.5 1854.5 1846.9 1799.8农林牧渔业 Agriculture,Hunting, 9.1 7.7 6.5 6.5 6.3 5.1 6.6
Forestry and Fishing
采掘业 Mining and Quarrying 0.4 0.4 0.2 0.3 0.3 0.2 0.3
制造业 Manufacturing 310.3 281.9 241.0 222.3 213.3 210.1 181.7
电力、天然气及水 Electricity,Gas and Water 19.4 16.8 15.4 15.1 14.7 13.5 13.0
建筑业 Construction 257.5 285.7 288.0 267.9 282.7 270.8 265.0
批发零售和餐饮、 Wholesale and Retail Trade
旅馆业 and Restaurants and Hotels 503.4 532.7 512.4 493.9 503.5 499.6 493.2
交通运输和仓储业 Transport,Storage and 273.9 275.6 282.3 272.4 284.0 280.8 273.2
Communication
金融保险、房地产 Financing,Insurance,Real
和商业服务 Estate and Business Services 216.1 239.0 242.1 262.2 270.6 281.8 283.1
团体、社会和个人 Community,Social and
服务 Personal Services 275.9 269.8 269.0 275.9 279.0 284.9 283.6
其 他 Activities not Adepuately - - - - - - -
Defined
Female 1207.4 1253.9 1265.1 1295.6 1352.8 1405.4 1432.5
农林牧渔业 Agriculture,Hunting, 3.3 2.8 2.8 2.7 3.0 2.1 3.2
Forestry and Fishing
采掘业 Mining and Quarrying 0.1 - - - - - 0.1
制造业 Manufacturing 179.7 161.2 138.6 131.5 120.4 116.2 107.8
电力、天然气及水 Electricity,Gas and Water 2.4 2.3 2.2 1.9 1.8 2.2 2.8
建筑业 Construction 15.7 17.3 18.6 18.9 19.1 20.6 21.7
批发零售和餐饮、 Wholesale and Retail Trade
旅馆业 and Restaurants and Hotels 404.4 428.1 441.1 441.3 478.1 481.5 490.4
交通运输和仓储业 Transport,Storage and 62.3 67.8 66.8 67.0 72.6 72.6 72.8
Communication
金融保险、房地产 Financing,Insurance,Real
和商业服务 Estate and Business Services 147.7 166.1 168.2 175.5 182.0 196.3 191.6
团体、社会和个人 Community,Social and
服务 Personal Services 392.0 408.4 426.7 457.0 475.7 513.9 542.0
其 他 Activities not Adepuately - - - - - -
Defined

8/2/2019 China Labour Statistical Yearbook - 2004
http://slidepdf.com/reader/full/china-labour-statistical-yearbook-2004 446/464
13-2
EMPLOYMENT BY OCCUPATION
单位:千人 (1000)
职 业
Occupation 1996 1997 1998 1999 2000 2001 2002
Total 3073.3 3163.6 3122.0 3112.1 3207.3 3252.3 3232.3
立法者高级官员和 Legislators,Senior Officials
和管理人员 and Managers 301.1 247.0 248.2 242.6 233.3 273.0 295.5
专业人员 Professio nals 161.0 163.3 165.4 168.5 182.7 194.6 194.4
技术和辅助专业人员 Technicians and Associate 426.0 523.7 490.2 525.2 549.8 569.4 571.0
Professionals
职 员 Clerks 561.6 584.6 578.2 568.1 588.0 559.3 539.4
服务人员和商店与 Service Workers and Shop and
市场销售人员 and Market Sales Workers 434.4 439.0 443.8 440.6 461.5 474.6 473.7
农渔业技术人员 Skilled Agricultural and 11.9 10.2 9.1 8.5 8.9 6.7 9.4
Fishery Workers
手艺人和有关行业工人 Craft and Related Trade 341.2 356.0 347.5 327.8 332.7 310.0 290.9
Workers
设备和机械操作工、 Plant and Machine Operators
装配工 and Assemblers 300.8 276.5 270.9 259.5 263.4 251.8 240.8
简单劳动职业人员 Elementary Occupations 535.4 563.2 568.9 571.3 586.9 612.9 617.1
其 他 Others
Male 1865.9 1909.7 1856.9 1816.5 1854.5 1846.9 1799.8
立法者高级官员和 Legislators,Senior Officials
和管理人员 and Managers 242.0 197.8 194.8 189.4 176.8 203.5 219.7
专业人员 Professio nals 108.4 110.3 114.8 113.2 123.7 130.9 126.8
技术和辅助专业人员 Technicians and Associate 254.9 325.9 296.8 315.2 330.5 339.1 333.9
Professionals
职 员 Clerks 163.6 172.4 166.1 158.0 162.0 152.5 139.3
服务人员和商店与 Service Workers and Shop and
市场销售人员 and Market Sales Workers 264.6 262.9 257.4 249.2 256.4 254.5 245.9
农渔业技术人员 Skilled Agricultural and 8.8 7.6 6.5 6.4 6.2 4.9 6.5
Fishery Workers
手艺人和有关行业工人 Craft and Related Trade 328.1 343.5 335.0 315.8 323.0 300.2 279.3
Workers
设备和机械操作工、 Plant and Machine Operators
装配工 and Assemblers 239.3 226.5 228.0 218.6 226.6 217.1 210.2
简单劳动职业人员 Elementary Occupations 256.1 262.8 257.5 250.6 249.4 244.1 238.3
其 他 Others
Female 1207.4 1253.9 1265.1 1295.6 1352.8 1405.4 1432.5
立法者高级官员和 Legislators,Senior Officials
和管理人员 and Managers 59.0 49.2 53.4 53.2 56.5 69.4 75.9
专业人员 Professio nals 52.6 53.0 50.5 55.3 59.0 63.7 67.7
技术和辅助专业人员 Technicians and Associate 171.1 197.8 193.4 210.0 219.3 230.2 237.0
Professionals
职 员 Clerks 397.9 412.2 412.1 410.0 426.0 406.8 400.1
服务人员和商店与 Service Workers and Shop and
市场销售人员 and Market Sales Workers 169.8 176.2 186.4 191.4 205.1 220.1 227.8
农渔业技术人员 Skilled Agricultural and 3.1 2.6 2.6 2.1 2.7 1.9 2.9
Fishery Workers
手艺人和有关行业工人 Craft and Related Trade 13.1 12.5 12.5 12.0 9.8 9.8 11.6
Workers
设备和机械操作工、 Plant and Machine Operators
装配工 and Assemblers 61.4 50.1 42.8 40.9 36.9 34.7 30.6
简单劳动职业人员 Elementary Occupations 279.3 300.4 311.3 320.7 337.6 368.8 378.9
其 他 Others - - - - - -
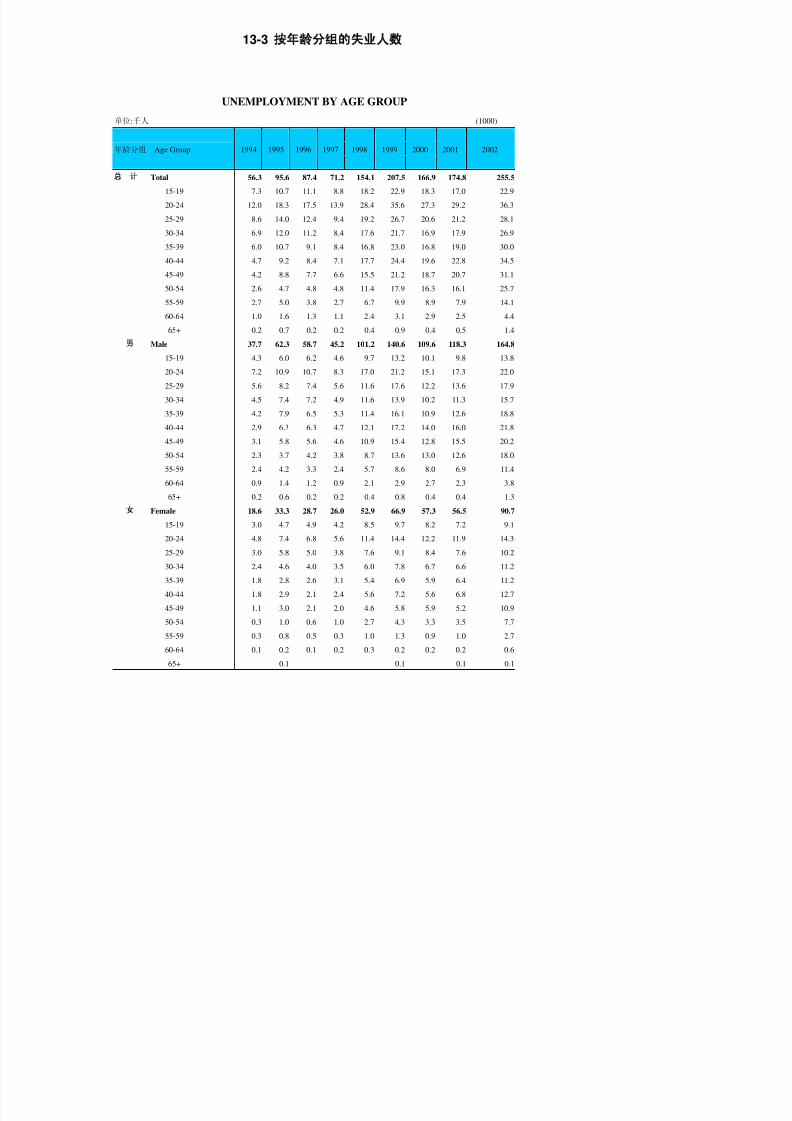
8/2/2019 China Labour Statistical Yearbook - 2004
http://slidepdf.com/reader/full/china-labour-statistical-yearbook-2004 447/464
13-3
UNEMPLOYMENT BY AGE GROUP
单位:千人 (1000)
年龄分组 Age Group
1994 1995 1996 1997 1998 1999 2000 2001 2002
Total 56.3 95.6 87.4 71.2 154.1 207.5 166.9 174.8 255.5
15-19 7.3 10.7 11.1 8.8 18.2 22.9 18.3 17.0 22.9
20-24 12.0 18.3 17.5 13.9 28.4 35.6 27.3 29.2 36.3
25-29 8.6 14.0 12.4 9.4 19.2 26.7 20.6 21.2 28.1
30-34 6.9 12.0 11.2 8.4 17.6 21.7 16.9 17.9 26.9
35-39 6.0 10.7 9.1 8.4 16.8 23.0 16.8 19.0 30.0
40-44 4.7 9.2 8.4 7.1 17.7 24.4 19.6 22.8 34.5
45-49 4.2 8.8 7.7 6.6 15.5 21.2 18.7 20.7 31.1
50-54 2.6 4.7 4.8 4.8 11.4 17.9 16.3 16.1 25.7
55-59 2.7 5.0 3.8 2.7 6.7 9.9 8.9 7.9 14.1
60-64 1.0 1.6 1.3 1.1 2.4 3.1 2.9 2.5 4.4
65+ 0.2 0.7 0.2 0.2 0.4 0.9 0.4 0.5 1.4
Male 37.7 62.3 58.7 45.2 101.2 140.6 109.6 118.3 164.8
15-19 4.3 6.0 6.2 4.6 9.7 13.2 10.1 9.8 13.8
20-24 7.2 10.9 10.7 8.3 17.0 21.2 15.1 17.3 22.0
25-29 5.6 8.2 7.4 5.6 11.6 17.6 12.2 13.6 17.9
30-34 4.5 7.4 7.2 4.9 11.6 13.9 10.2 11.3 15.7
35-39 4.2 7.9 6.5 5.3 11.4 16.1 10.9 12.6 18.8
40-44 2.9 6.3 6.3 4.7 12.1 17.2 14.0 16.0 21.8
45-49 3.1 5.8 5.6 4.6 10.9 15.4 12.8 15.5 20.2
50-54 2.3 3.7 4.2 3.8 8.7 13.6 13.0 12.6 18.0
55-59 2.4 4.2 3.3 2.4 5.7 8.6 8.0 6.9 11.4
60-64 0.9 1.4 1.2 0.9 2.1 2.9 2.7 2.3 3.8
65+ 0.2 0.6 0.2 0.2 0.4 0.8 0.4 0.4 1.3
Female 18.6 33.3 28.7 26.0 52.9 66.9 57.3 56.5 90.7
15-19 3.0 4.7 4.9 4.2 8.5 9.7 8.2 7.2 9.1
20-24 4.8 7.4 6.8 5.6 11.4 14.4 12.2 11.9 14.3
25-29 3.0 5.8 5.0 3.8 7.6 9.1 8.4 7.6 10.2
30-34 2.4 4.6 4.0 3.5 6.0 7.8 6.7 6.6 11.2
35-39 1.8 2.8 2.6 3.1 5.4 6.9 5.9 6.4 11.2
40-44 1.8 2.9 2.1 2.4 5.6 7.2 5.6 6.8 12.7
45-49 1.1 3.0 2.1 2.0 4.6 5.8 5.9 5.2 10.9
50-54 0.3 1.0 0.6 1.0 2.7 4.3 3.3 3.5 7.7
55-59 0.3 0.8 0.5 0.3 1.0 1.3 0.9 1.0 2.7
60-64 0.1 0.2 0.1 0.2 0.3 0.2 0.2 0.2 0.6
65+ 0.1 0.1 0.1 0.1

8/2/2019 China Labour Statistical Yearbook - 2004
http://slidepdf.com/reader/full/china-labour-statistical-yearbook-2004 448/464
13-4
UNEMPLOYMENT BY ECONOMIC ACTIVITY
单位: 千人 (1000)
行 业 Industry 1995 1996 1997 1998 1999 2000 2001 2002
Total 95.6 87.4 71.2 154.1 207.5 166.9 174.8 255.5
初次失业 Unemployed for the First Time 11.9 10.0 7.6 16.7 23.9 17.6 16.3 24.9
农林牧渔业 Agriculture,Hunting, 0.1 0.2 0.1 0.2 0.4 0.3 0.2 0.5
Forestry and Fishing
采掘业 Mining and Quarrying - - - - - - - -
制造业 Manufacturing 23.3 18.7 13.1 22.0 27.1 19.0 18.3 22.8
电力、天然气及水 Electricity,Gas and Water 0.1 0.2 0.2 0.2 0.2 0.2 0.1
建筑业 Construction 14.0 10.9 9.0 28.2 41.1 34.3 35.0 53.8
批发零售和餐饮、 Wholesale and Retail Trade
旅馆业 and Restaurants and Hotels 26.0 26.9 22.8 49.3 64.3 54.5 57.0 83.4
交通运输和仓储业 Transport,Storage and 8.0 8.1 7.4 13.3 19.0 14.8 16.1 19.8
Communication
金融保险、房地产 Financing,Insurance,Real
和商业服务 Estate and Business Services 5.0 5.3 4.8 12.1 15.0 12.1 15.0 23.2
团体、社会和个人 Community,Social and
服务 Personal Services 7.1 7.3 6.2 12.0 16.3 14.0 16.6 27.0
Male 62.3 58.7 45.2 101.2 140.6 109.6 118.3 164.8
初次失业 Unemployed for the First Time 5.9 4.8 3.4 8.0 11.7 8.2 8.4 10.4
农林牧渔业 Agriculture,Hunting, 0.1 0.1 0.1 0.2 0.3 0.3 0.2 0.3
Forestry and Fishing
采掘业 Mining and Quarrying - - - - - - - -
制造业 Manufacturing 14.0 12.2 8.3 14.2 18.5 12.8 12.4 14.1
电力、天然气及水 Electricity,Gas and Water 0.2 0.2 0.2 0.1 0.1 0.1
建筑业 Construction 13.8 10.7 8.6 27.1 39.9 33.3 33.9 52.2
批发零售和餐饮、 Wholesale and Retail Trade
旅馆业 and Restaurants and Hotels 14.6 16.1 12.3 26.6 34.9 28.4 30.9 43.5
交通运输和仓储业 Transport,Storage and 6.6 7.0 6.2 11.3 16.0 12.5 13.9 16.4
Communication
金融保险、房地产 Financing,Insurance,Real
和商业服务 Estate and Business Services 3.0 3.6 3.3 7.0 10.0 7.4 9.9 15.3
团体、社会和个人 Community,Social and
服务 Personal Services 4.2 4.3 2.9 6.5 9.0 6.7 8.5 12.4
Female 33.3 28.7 26.0 52.9 66.9 57.3 56.5 90.7
初次失业 Unemployed for the First Time 6.0 5.2 4.2 8.7 12.2 9.4 7.9 14.5
农林牧渔业 Agriculture,Hunting, - 0.1 - - 0.1 - - 0.2
Forestry and Fishing
采掘业 Mining and Quarrying - - - - - - - -
制造业 Manufacturing 9.3 6.5 4.7 7.8 8.6 6.3 6.0 8.7
电力、天然气及水 Electricity,Gas and Water 0.1 - - - - - 0.1 -
建筑业 Construction 0.2 0.3 0.4 1.1 1.2 1.0 1.1 1.6
批发零售和餐饮、 Wholesale and Retail Trade
旅馆业 and Restaurants and Hotels 11.4 10.8 10.6 22.6 29.4 26.2 26.1 39.8
交通运输和仓储业 Transport,Storage and 1.4 1.1 1.2 2.0 3.0 2.3 2.2 3.4
Communication
金融保险、房地产 Financing,Insurance,Real
和商业服务 Estate and Business Services 2.1 1.8 1.6 5.0 5.1 4.7 5.1 7.9
团体、社会和个人 Community,Social and
服务 Personal Services 2.8 3.0 3.3 5.5 7.3 7.3 8.1 14.6

8/2/2019 China Labour Statistical Yearbook - 2004
http://slidepdf.com/reader/full/china-labour-statistical-yearbook-2004 449/464
13-5
UNEMPLOYMET BY OCCUPATION
单位:千人 (1000)
职 业
Occupation 1996 1997 1998 1999 2000 2001 2002
Total 87.4 71.2 154.1 207.5 166.9 174.8 255.5
初次失业 Unemployed for the First Time 10.0 7.6 16.7 23.9 17.6 16.3 24.9
立法者高级官员和 Legislators,Senior Officials
和管理人员 and Managers 2.8 2.0 4.1 5.7 3.9 5.2 8.2
专业人员 Professio nals 1.2 0.9 1.8 2.6 2.1 3.7 4.8
技术和辅助专业人员 Technicians and Associate 7.7 6.7 15.0 18.7 13.4 17.0 25.7
Professionals
职 员 Clerks 11.7 11.0 22.2 25.7 21.3 21.6 30.2
服务人员和商店与 Service Workers and Shop and
市场销售人员 and Market Sales Workers 16.5 13.5 27.9 36.6 34.1 33.2 47.6
农渔业技术人员 Skilled Agricultural and 0.2 0.1 0.2 0.3 0.3 0.2 0.3
Fishery Workers
手艺人和有关行业工人 Craft and Related Trade 14.1 10.4 27.4 40.2 32.5 31.7 47.4
Workers
设备和机械操作工、 Plant and Machine Operators
装配工 and Assemblers 10.4 6.5 11.9 16.5 11.5 12.2 15.1
简单劳动职业人员 Elementary Occupations 12.8 12.5 26.8 37.2 30.3 33.7 51.4
Male 58.7 45.2 101.2 140.6 109.6 118.3 164.8
初次失业 Unemployed for the First Time 4.8 3.4 8.0 11.7 8.2 8.4 10.4
立法者高级官员和 Legislators,Senior Officials
和管理人员 and Managers 2.2 1.6 3.4 4.9 3.1 4.3 6.6
专业人员 Professio nals 0.9 0.7 1.2 1.8 1.5 2.7 3.5
技术和辅助专业人员 Technicians and Associate 5.5 4.5 10.4 13.1 9.0 11.3 18.0
Professionals
职 员 Clerks 3.9 3.5 7.6 8.5 6.6 7.1 9.0
服务人员和商店与 Service Workers and Shop and
市场销售人员 and Market Sales Workers 10.0 7.5 14.9 19.7 17.2 16.9 23.0
农渔业技术人员 Skilled Agricultural and 0.1 0.1 0.2 0.3 0.2 0.2 0.3
Fishery Workers
手艺人和有关行业工人 Craft and Related Trade 13.6 10.0 26.3 38.8 31.5 31.1 46.4
Workers
设备和机械操作工、 Plant and Machine Operators
装配工 and Assemblers 7.0 4.6 8.8 13.2 9.2 9.7 11.4
简单劳动职业人员 Elementary Occupations 10.6 9.4 20.4 28.6 23.1 26.6 36.1
Female 28.7 26.0 52.9 66.9 57.3 56.5 90.7
初次失业 Unemployed for the First Time 5.2 4.2 8.7 12.2 9.4 7.8 14.5
立法者高级官员和 Legislators,Senior Officials
和管理人员 and Managers 0.5 0.4 0.7 0.9 0.8 1.0 1.6
专业人员 Professio nals 0.4 0.2 0.6 0.8 0.6 1.0 1.3
技术和辅助专业人员 Technicians and Associate 2.2 2.1 4.5 5.5 4.4 5.7 7.7
Professionals
职 员 Clerks 7.8 7.5 14.7 17.2 14.7 14.4 21.2
服务人员和商店与 Service Workers and Shop and
市场销售人员 and Market Sales Workers 6.5 6.0 13.0 16.9 16.9 16.3 24.5
农渔业技术人员 Skilled Agricultural and 0.1 - - 0.1 - - 0.1
Fishery Workers
手艺人和有关行业工人 Craft and Related Trade 0.4 0.4 1.2 1.3 1.0 0.6 1.0
Workers
设备和机械操作工、 Plant and Machine Operators
装配工 and Assemblers 3.4 1.9 3.1 3.4 2.3 2.5 3.6
简单劳动职业人员 Elementary Occupations 2.2 3.1 6.4 8.6 7.2 7.1 15.3

8/2/2019 China Labour Statistical Yearbook - 2004
http://slidepdf.com/reader/full/china-labour-statistical-yearbook-2004 450/464
13-6
WAGES OF WAGE EARNERS BY ECONOMIC ACTIVITY
单位: 元 / 日 (dollars/per day)
分 组
Group 1995 1996 1997 1998 1999 2000 2001 2002
Total 307.3 333.0 369.1 394.9 403.3 397.5 412.5 401.3
制造业 Manufacturing 278.0 296.9 322.6 335.3 334.7 335.4 342.6 326.1
交通运输和 Transport,Storage and
仓储业 Communication 421.9 443.1 487.3 528.0 526.0 504.9 507.7 508.6
金融保险、房地 Financing,Insurance,Real
产和商业服务 Estate and Business Services 377.4 404.1 421.5 438.8 418.5 437.3 455.1 432.8
团体、社会和个 Community,Social and
人服务 Personal Services 478.8 510.4 530.1 525.0 532.7 531.4 549.9 524.6
Male 386.0 415.7 457.8 480.1 480.2 475.5 480.8 476.0
制造业 Manufacturing 357.7 386.3 423.8 430.6 422.6 428.8 428.5 419.2
交通运输和 Transport,Storage and
仓储业 Communication 422.9 443.4 490.5 531.9 529.1 507.5 511.1 510.5
金融保险、房地 Financing,Insurance,Real
产和商业服务 Estate and Business Services 377.4 406.1 425.6 438.8 418.5 437.1 462.7 432.8
团体、社会和个 Community,Social and
人服务 Personal Services 478.7 510.4 530.1 533.1 532.7 531.4 549.9 524.6
Female 235.0 247.6 261.5 267.6 275.0 283.2 291.0 277.8
制造业 Manufacturing 233.5 245.3 258.8 262.9 268.9 278.1 280.6 268.2

8/2/2019 China Labour Statistical Yearbook - 2004
http://slidepdf.com/reader/full/china-labour-statistical-yearbook-2004 451/464
13-7
WAGES OF SALARIED EMPLOYEES BY ECONOMIC ACTIVITY
单位: 元 / 月 (dollars/per month)
分 组
Group 1996 1997 1998 1999 2000 2001 2002
Total 10301.3 11177.8 11521.8 11560.9 11573.7 11449.0 11069.8
制 造 业 Manufacturing 10323.8 11331.2 11711.6 11853.0 11869.7 12133.1 11950.7
批发零售和餐 Wholesale and Retail Trade
饮、旅馆业 and Restaurants and Hotels 10659.5 11468.6 11780.6 11802.2 11959.3 12046.4 11745.0
交通运输和 Transport,Storage and
仓储业 Communication 11823.3 12767.3 13488.6 13322.0 12799.8 13191.6 13381.7
金融保险、房地 Financing,Insurance,Real
产和商业服务 Estate and Business Services 10345.5 10943.3 11252.5 11697.4 11429.4 11311.8 10571.8
团体、社会和个 Community,Social and
人服务 Personal Services 5904.1 6311.1 6798.8 6659.0 6749.6 6405.7 6179.2
Male 10820.2 11641.0 11907.0 12141.0 12105.3 11905.0 11619.0
制 造 业 Manufacturing 11260.0 12165.2 12555.7 12893.2 12697.1 12929.7 12810.2
批发零售和餐 Wholesale and Retail Trade
饮、旅馆业 and Restaurants and Hotels 11390.8 12348.4 12715.4 12784.6 12938.5 13076.3 12867.8
交通运输和 Transport,Storage and
仓储业 Communication 12667.4 13690.3 14409.9 14340.9 13509.9 13768.4 14296.0
金融保险、房地 Financing,Insurance,Real
产和商业服务 Estate and Business Services 9532.9 9942.1 10116.6 10702.4 10547.5 10438.2 9606.4
团体、社会和个 Community,Social and
人服务 Personal Services 7032.3 7266.0 7779.2 7773.2 7649.5 7162.9 6993.0
Female 9717.4 10670.4 11092.0 10952.1 11011.9 10969.3 10518.2
制 造 业 Manufacturing 9390.4 10467.0 10915.9 10846.7 11101.4 11395.0 11123.2
批发零售和餐 Wholesale and Retail Trade
饮、旅馆业 and Restaurants and Hotels 9930.1 10660.6 10955.1 10941.7 11115.0 11204.5 10852.0
交通运输和 Transport,Storage and
仓储业 Communication 10700.0 11562.2 12108.9 11707.5 11634.8 12274.2 12059.8
金融保险、房地 Financing,Insurance,Real
产和商业服务 Estate and Business Services 11828.3 12807.1 13723.4 13390.2 13107.7 13054.8 12554.1
团体、社会和个 Community,Social and
人服务 Personal Services 4935.5 5511.9 6018.0 5843.5 6061.8 5886.2 5688.7

8/2/2019 China Labour Statistical Yearbook - 2004
http://slidepdf.com/reader/full/china-labour-statistical-yearbook-2004 452/464

8/2/2019 China Labour Statistical Yearbook - 2004
http://slidepdf.com/reader/full/china-labour-statistical-yearbook-2004 453/464
13-9
OCCUPATIONAL INJURIES BY ECONOMIC ACTIVITY
项 目
Item 1995 1996 1997 1998 1999 2000 2001
Total (fatal and 59375 59465 62776 63526 58841 58092 53719
non fatal,person)
农林牧渔业 Agriculture,Hunting, 121 58 68 100 107 90 145
Forestry and Fishing
采掘业 Mining and Quarrying 38 12 25 15 14 8 11
制造业 Manufacturing 10167 8263 8084 7689 6792 6985 5979
电力、天然气及水 Electricity,Gas and Water 155 120 93 93 61 70 70
建筑业 Construction 15544 16861 19051 19674 14174 12038 9324
批发零售和餐饮、 Wholesale and Retail Trade
旅馆业 and Restaurants and Hotels 15592 16048 16754 16855 17272 17642 16934
交通运输和仓储业 Transport,Storage and
Communication 4929 5489 5169 5587 5694 5620 5114
金融保险、房地产和 Financing,Insurance,Real
商业服务 Estate and Business Services 2913 2376 2759 3496 3933 4339 4522
团体、社会和个人 Community,Social and
服务 Personal Services 7239 7364 8332 9901 10708 11247 11596
其 他 Activities not Adepuately 2677 2874 2441 116 86 53 24
Defined
1 Non fatal 59128 59187 62529 63286 58606 57893 53543
农林牧渔业 Agriculture,Hunting, 121 58 68 98 106 90 145
Forestry and Fishing
采掘业 Mining and Quarrying 38 12 25 14 14 7 11
制造业 Manufacturing 10133 8227 8049 7659 6752 6950 5953
电力、天然气及水 Electricity,Gas and Water 155 120 93 92 61 70 68
建筑业 Construction 15455 16791 18988 19604 14110 11991 9282
批发零售和餐 Wholesale and Retail Trade
饮、旅馆业 and Restaurants and Hotels 15571 16023 16740 16838 17263 17626 16922
交通运输和仓储业 Transport,Storage and
Communication 4881 5438 5131 5554 5653 5595 5077
金融保险、房地 Financing,Insurance,Real
产和商业服务 Estate and Business Services 2877 2307 2707 3449 3891 4296 4484
团体、社会和个 Community,Social and
人服务 Personal Services 7220 7337 8301 9862 10670 11215 11577
其 他 Activities not Adepuately 2677 2874 2427 116 86 53 24
Defined
2 Fatal 247 278 247 240 235 199 176
农林牧渔业 Agriculture,Hunting, 2 1
Forestry and Fishing
采掘业 Mining and Quarrying 1 1
制造业 Manufacturing 34 36 35 30 40 35 26
电力、天然气及水 Electricity,Gas and Water 1 2
建筑业 Construction 89 70 63 70 64 47 42
批发零售和餐饮、 Wholesale and Retail Trade
旅馆业 and Restaurants and Hotels 21 25 14 17 9 16 12
交通运输和 Transport,Storage and
仓储业 Communication 48 51 38 33 41 25 37
金融保险、房地 Financing,Insurance,Real
产和商业服务 Estate and Business Services 36 69 52 47 42 43 38
团体、社会和个 Community,Social and
人服务 Personal Services 19 27 31 39 38 32 19
其 他 Activities not Adepuately 14
Defined
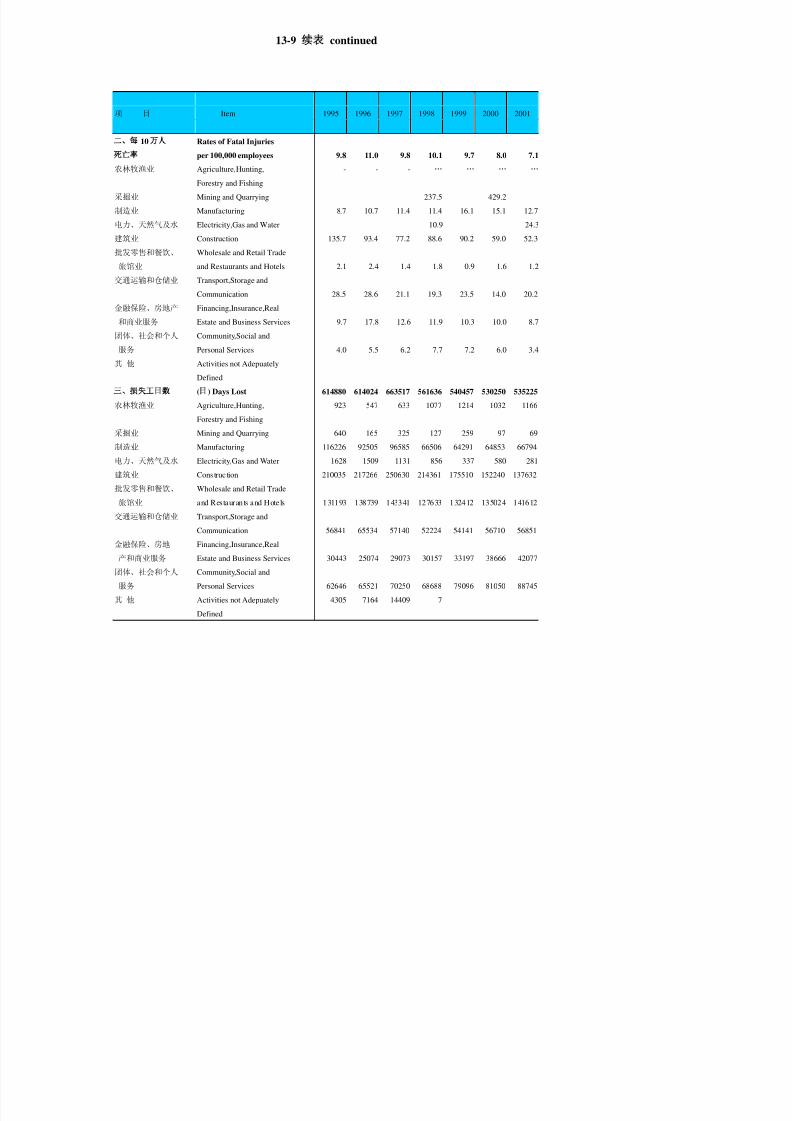
8/2/2019 China Labour Statistical Yearbook - 2004
http://slidepdf.com/reader/full/china-labour-statistical-yearbook-2004 454/464
13-9 continued
项 目
Item 1995 1996 1997 1998 1999 2000 2001
10 Rates of Fatal Injuries
per 100,000 employees 9.8 11.0 9.8 10.1 9.7 8.0 7.1农林牧渔业 Agriculture,Hunting, - - - … … … …
Forestry and Fishing
采掘业 Mining and Quarrying 237.5 429.2
制造业 Manufacturing 8.7 10.7 11.4 11.4 16.1 15.1 12.7
电力、天然气及水 Electricity,Gas and Water 10.9 24.3
建筑业 Construction 135.7 93.4 77.2 88.6 90.2 59.0 52.3
批发零售和餐饮、 Wholesale and Retail Trade
旅馆业 and Restaurants and Hotels 2.1 2.4 1.4 1.8 0.9 1.6 1.2
交通运输和仓储业 Transport,Storage and
Communication 28.5 28.6 21.1 19.3 23.5 14.0 20.2
金融保险、房地产 Financing,Insurance,Real
和商业服务 Estate and Business Services 9.7 17.8 12.6 11.9 10.3 10.0 8.7
团体、社会和个人 Community,Social and
服务 Personal Services 4.0 5.5 6.2 7.7 7.2 6.0 3.4
其 他 Activities not Adepuately
Defined
( ) Days Lost 614880 614024 663517 561636 540457 530250 535225
农林牧渔业 Agriculture,Hunting, 923 547 633 1077 1214 1032 1166
Forestry and Fishing
采掘业 Mining and Quarrying 640 165 325 127 259 97 69
制造业 Manufacturing 116226 92505 96585 66506 64291 64853 66794
电力、天然气及水 Electricity,Gas and Water 1628 1509 1131 856 337 580 281
建筑业 Construction 210035 217266 250630 214361 175510 152240 137632
批发零售和餐饮、 Wholesale and Retail Trade
旅馆业 and Restaurants and Hotels 131193 138739 143341 127633 132412 135024 141612
交通运输和仓储业 Transport,Storage and
Communication 56841 65534 57140 52224 54141 56710 56851
金融保险、房地 Financing,Insurance,Real
产和商业服务 Estate and Business Services 30443 25074 29073 30157 33197 38666 42077
团体、社会和个人 Community,Social and
服务 Personal Services 62646 65521 70250 68688 79096 81050 88745
其 他 Activities not Adepuately 4305 7164 14409 7
Defined

8/2/2019 China Labour Statistical Yearbook - 2004
http://slidepdf.com/reader/full/china-labour-statistical-yearbook-2004 455/464
13-10
CONSUMER PRICES INDICES
(1990=100
项 目
Item 1994 1995 1996 1997 1998 1999 2000 1 2001 200
总指数 General Indices 144.1 157.3 167.1 177.0 181.9 174.7 168.5 165.8 1
总指数(不含住房) General Indices 138.8 149.3 156.5 163.4 166.8 161.2 157.5 155.9 15
(excl. shelter)
食品指数 Food Indices 139.6 149.5 155.4 161.0 164.1 161.1 157.5 156.2 15
用电及燃料指数 Fuel and Light Indices 119.1 128.0 134.8 142.4 144.7 144.1 154.2 151.1 1
服装指数 Clothing Indices 139.2 152.4 165.0 178.7 177.4 140.9 126.6 120.8 1
租金指数 Rent Indices 163.3 185.4 204.9 224.1 234.9 221.9 202.3 196.1 18
注 1:自 2000 年起使用新系列。 Note1:Series replacing former series.
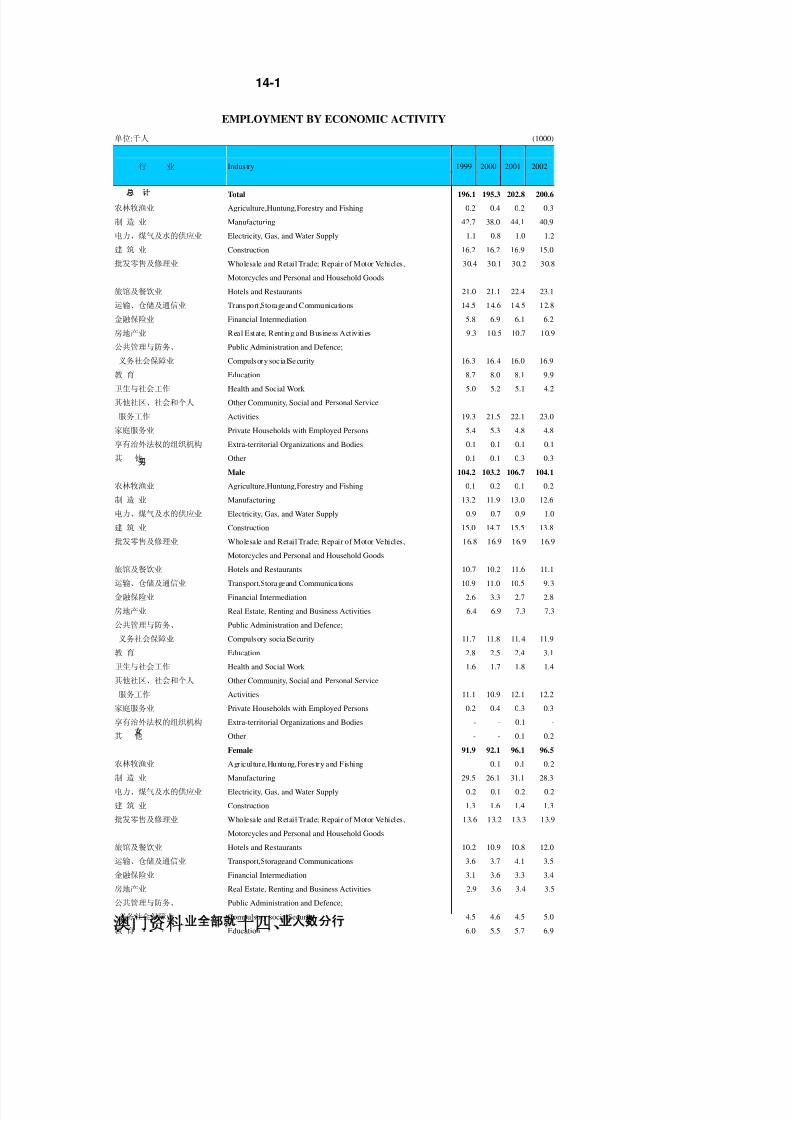
8/2/2019 China Labour Statistical Yearbook - 2004
http://slidepdf.com/reader/full/china-labour-statistical-yearbook-2004 456/464
14-1
EMPLOYMENT BY ECONOMIC ACTIVITY
单位:千人 (1000)
行 业 Industry 1999 2000 2001 2002
Total 196.1 195.3 202.8 200.6
农林牧渔业 Agriculture,Huntung,Forestry and Fishing 0.2 0.4 0.2 0.3
制 造 业 Manufacturing 42.7 38.0 44.1 40.9
电力、煤气及水的供应业 Electricity, Gas, and Water Supply 1.1 0.8 1.0 1.2
建 筑 业 Construction 16.2 16.2 16.9 15.0
批发零售及修理业 Wholesale and Retail Trade; Repair of Motor Vehicles, 30.4 30.1 30.2 30.8
Motorcycles and Personal and Household Goods
旅馆及餐饮业 Hotels and Restaurants 21.0 21.1 22.4 23.1
运输、仓储及通信业 Transport,Storageand Communications 14.5 14.6 14.5 12.8
金融保险业 Financial Intermediation 5.8 6.9 6.1 6.2
房地产业 Real Estate, Renting and Business Activities 9.3 10.5 10.7 10.9
公共管理与防务、 Public Administration and Defence;
义务社会保障业 Compulsory socialSecurity 16.3 16.4 16.0 16.9
教 育 Education 8.7 8.0 8.1 9.9
卫生与社会工作 Health and Social Work 5.0 5.2 5.1 4.2
其他社区、社会和个人 Other Community, Social and Personal Service
服务工作 Activities 19.3 21.5 22.1 23.0
家庭服务业 Private Households with Employed Persons 5.4 5.3 4.8 4.8
享有治外法权的组织机构 Extra-territorial Organizations and Bodies 0.1 0.1 0.1 0.1
其 他 Other 0.1 0.1 0.3 0.3
Male 104.2 103.2 106.7 104.1
农林牧渔业 Agriculture,Huntung,Forestry and Fishing 0.1 0.2 0.1 0.2
制 造 业 Manufacturing 13.2 11.9 13.0 12.6
电力、煤气及水的供应业 Electricity, Gas, and Water Supply 0.9 0.7 0.9 1.0
建 筑 业 Construction 15.0 14.7 15.5 13.8
批发零售及修理业 Wholesale and Retail Trade; Repair of Motor Vehicles, 16.8 16.9 16.9 16.9
Motorcycles and Personal and Household Goods
旅馆及餐饮业 Hotels and Restaurants 10.7 10.2 11.6 11.1
运输、仓储及通信业 Transport,Storageand Communications 10.9 11.0 10.5 9.3
金融保险业 Financial Intermediation 2.6 3.3 2.7 2.8
房地产业 Real Estate, Renting and Business Activities 6.4 6.9 7.3 7.3
公共管理与防务、 Public Administration and Defence;
义务社会保障业 Compulsory socialSecurity 11.7 11.8 11.4 11.9
教 育 Education 2.8 2.5 2.4 3.1
卫生与社会工作 Health and Social Work 1.6 1.7 1.8 1.4
其他社区、社会和个人 Other Community, Social and Personal Service
服务工作 Activities 11.1 10.9 12.1 12.2
家庭服务业 Private Households with Employed Persons 0.2 0.4 0.3 0.3
享有治外法权的组织机构 Extra-territorial Organizations and Bodies - - 0.1 -
其 他 Other - - 0.1 0.2
Female 91.9 92.1 96.1 96.5
农林牧渔业 Agriculture,Huntung,Forestry and Fishing 0.1 0.1 0.2
制 造 业 Manufacturing 29.5 26.1 31.1 28.3
电力、煤气及水的供应业 Electricity, Gas, and Water Supply 0.2 0.1 0.2 0.2
建 筑 业 Construction 1.3 1.6 1.4 1.3
批发零售及修理业 Wholesale and Retail Trade; Repair of Motor Vehicles, 13.6 13.2 13.3 13.9
Motorcycles and Personal and Household Goods
旅馆及餐饮业 Hotels and Restaurants 10.2 10.9 10.8 12.0
运输、仓储及通信业 Transport,Storageand Communications 3.6 3.7 4.1 3.5
金融保险业 Financial Intermediation 3.1 3.6 3.3 3.4
房地产业 Real Estate, Renting and Business Activities 2.9 3.6 3.4 3.5
公共管理与防务、 Public Administration and Defence;
义务社会保障业 Compulsory socialSecurity 4.5 4.6 4.5 5.0
教 育 Education 6.0 5.5 5.7 6.9
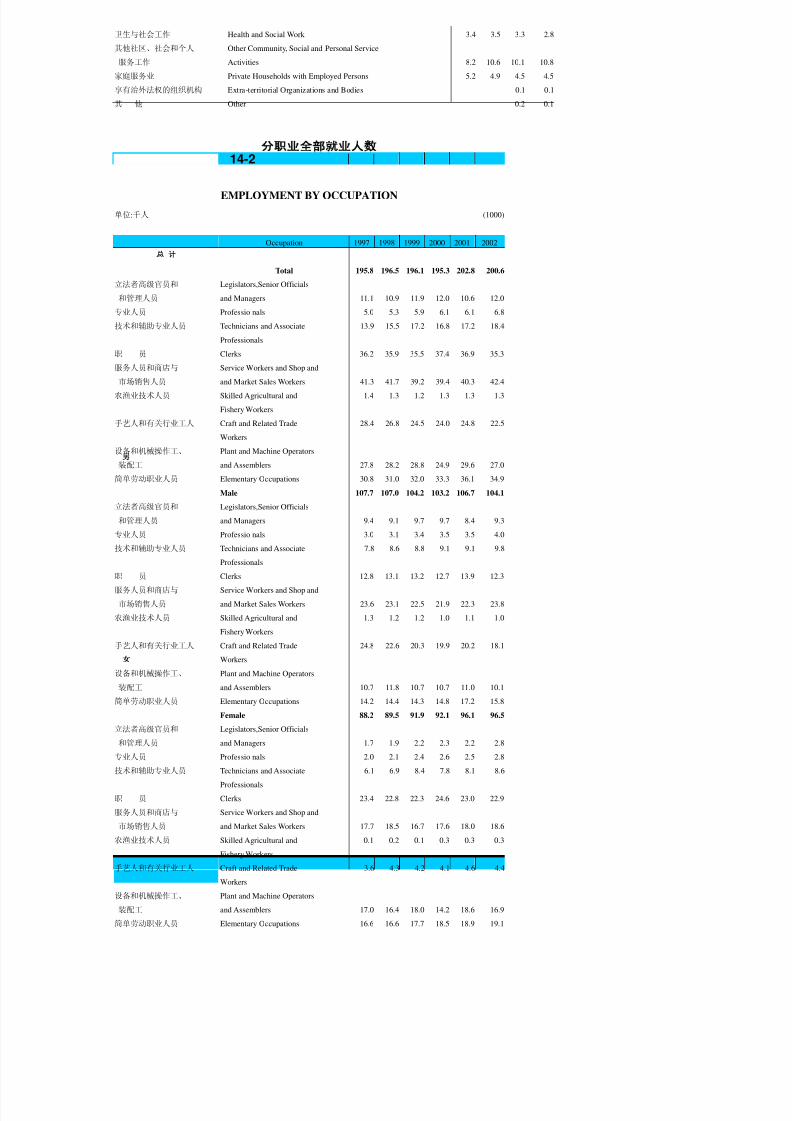
8/2/2019 China Labour Statistical Yearbook - 2004
http://slidepdf.com/reader/full/china-labour-statistical-yearbook-2004 457/464
卫生与社会工作 Health and Social Work 3.4 3.5 3.3 2.8
其他社区、社会和个人 Other Community, Social and Personal Service
服务工作 Activities 8.2 10.6 10.1 10.8
家庭服务业 Private Households with Employed Persons 5.2 4.9 4.5 4.5
享有治外法权的组织机构 Extra-territorial Organizations and Bodies 0.1 0.1
其 他 Other 0.2 0.1
14-2
EMPLOYMENT BY OCCUPATION
单位:千人 (1000)
职 业
Occupation 1997 1998 1999 2000 2001 2002
Total 195.8 196.5 196.1 195.3 202.8 200.6
立法者高级官员和 Legislators,Senior Officials
和管理人员 and Managers 11.1 10.9 11.9 12.0 10.6 12.0
专业人员 Professio nals 5.0 5.3 5.9 6.1 6.1 6.8技术和辅助专业人员 Technicians and Associate 13.9 15.5 17.2 16.8 17.2 18.4
Professionals
职 员 Clerks 36.2 35.9 35.5 37.4 36.9 35.3
服务人员和商店与 Service Workers and Shop and
市场销售人员 and Market Sales Workers 41.3 41.7 39.2 39.4 40.3 42.4
农渔业技术人员 Skilled Agricultural and 1.4 1.3 1.2 1.3 1.3 1.3
Fishery Workers
手艺人和有关行业工人 Craft and Related Trade 28.4 26.8 24.5 24.0 24.8 22.5
Workers
设备和机械操作工、 Plant and Machine Operators
装配工 and Assemblers 27.8 28.2 28.8 24.9 29.6 27.0
简单劳动职业人员 Elementary Occupations 30.8 31.0 32.0 33.3 36.1 34.9
Male 107.7 107.0 104.2 103.2 106.7 104.1
立法者高级官员和 Legislators,Senior Officials
和管理人员 and Managers 9.4 9.1 9.7 9.7 8.4 9.3
专业人员 Professio nals 3.0 3.1 3.4 3.5 3.5 4.0
技术和辅助专业人员 Technicians and Associate 7.8 8.6 8.8 9.1 9.1 9.8
Professionals
职 员 Clerks 12.8 13.1 13.2 12.7 13.9 12.3
服务人员和商店与 Service Workers and Shop and
市场销售人员 and Market Sales Workers 23.6 23.1 22.5 21.9 22.3 23.8
农渔业技术人员 Skilled Agricultural and 1.3 1.2 1.2 1.0 1.1 1.0
Fishery Workers
手艺人和有关行业工人 Craft and Related Trade 24.8 22.6 20.3 19.9 20.2 18.1
Workers
设备和机械操作工、 Plant and Machine Operators
装配工 and Assemblers 10.7 11.8 10.7 10.7 11.0 10.1
简单劳动职业人员 Elementary Occupations 14.2 14.4 14.3 14.8 17.2 15.8
Female 88.2 89.5 91.9 92.1 96.1 96.5
立法者高级官员和 Legislators,Senior Officials
和管理人员 and Managers 1.7 1.9 2.2 2.3 2.2 2.8
专业人员 Professio nals 2.0 2.1 2.4 2.6 2.5 2.8
技术和辅助专业人员 Technicians and Associate 6.1 6.9 8.4 7.8 8.1 8.6
Professionals
职 员 Clerks 23.4 22.8 22.3 24.6 23.0 22.9
服务人员和商店与 Service Workers and Shop and
市场销售人员 and Market Sales Workers 17.7 18.5 16.7 17.6 18.0 18.6
农渔业技术人员 Skilled Agricultural and 0.1 0.2 0.1 0.3 0.3 0.3
Fishery Workers
手艺人和有关行业工人 Craft and Related Trade 3.6 4.3 4.2 4.1 4.6 4.4
Workers
设备和机械操作工、 Plant and Machine Operators
装配工 and Assemblers 17.0 16.4 18.0 14.2 18.6 16.9
简单劳动职业人员 Elementary Occupations 16.6 16.6 17.7 18.5 18.9 19.1

8/2/2019 China Labour Statistical Yearbook - 2004
http://slidepdf.com/reader/full/china-labour-statistical-yearbook-2004 458/464
14-3
UNEMPLOYMENT BY AGE GROUP
单位:千人 (1000)
年龄分组 Age Group 1994 1995 1996 1997 1998 1999 2000 2001 2002
Total 4.4 6.7 8.6 6.5 9.5 13.3 14.2 13.8 13.4
14-19 0.6 0.7 0.7 0.7 1.1 1.4 1.1 1.1 1.2
20-24 1.0 1.0 1.3 1.4 1.5 1.8 1.7 1.6 1.5
25-29 0.6 0.8 1.3 0.6 1.0 1.3 1.3 1.4 1.2
30-34 0.8 1.2 1.2 0.8 1.2 1.5 1.5 1.3 1.2
35-39 0.6 1.0 1.5 0.9 1.4 2.0 2.4 2.1 1.9
40-44 0.3 1.0 1.1 0.9 1.3 2.4 2.9 2.8 2.6
45-49 0.2 0.7 0.8 0.6 0.9 1.4 1.8 2.1 2.1
50-54 0.1 0.3 0.4 0.4 0.7 0.8 1.1 1.0 1.0
55-59 0.1 0.1 0.2 0.1 0.4 0.4 0.4 0.4 0.5
60-64 - - 0.1 0.1 0.1 0.2 0.1 0.1 0.2
65+ - - - - - 0.1 0.1 - -
Male 2.4 4.3 5.3 4.1 6.4 9.1 9.8 9.4 8.9
14-19 0.4 0.5 0.5 0.4 0.7 0.9 0.7 0.7 0.8
20-24 0.4 0.6 0.9 0.8 0.9 1.1 1.0 1.0 0.9
25-29 0.3 0.4 0.6 0.4 0.6 0.7 0.8 0.9 0.8
30-34 0.4 0.6 0.6 0.4 0.8 1.0 0.9 0.8 0.7
35-39 0.3 0.6 0.9 0.6 1.0 1.3 1.6 1.1 1.1
40-44 0.3 0.7 0.7 0.6 0.9 1.8 2.2 1.9 1.8
45-49 0.2 0.5 0.5 0.4 0.6 1.1 1.3 1.7 1.5
50-54 0.1 0.2 0.3 0.3 0.5 0.7 0.9 0.9 0.7
55-59 0.1 0.1 0.2 0.1 0.3 0.3 0.3 0.3 0.4
60-64 - - 0.1 0.1 0.1 0.1 0.1 0.1 0.2
65+ - - - - - 0.1 0.1 - -
Female 2.0 2.4 3.3 2.4 3.1 4.2 4.4 4.4 4.5
14-19 0.2 0.2 0.2 0.3 0.4 0.5 0.4 0.4 0.4
20-24 0.6 0.4 0.4 0.6 0.6 0.7 0.7 0.6 0.6
25-29 0.3 0.4 0.7 0.2 0.4 0.6 0.5 0.5 0.4
30-34 0.4 0.5 0.6 0.4 0.4 0.5 0.6 0.5 0.5
35-39 0.4 0.4 0.6 0.3 0.4 0.7 0.8 1.0 0.8
40-44 0.1 0.3 0.4 0.3 0.4 0.6 0.7 0.9 0.8
45-49 0.1 0.3 0.3 0.2 0.3 0.3 0.5 0.4 0.6
50-54 - 0.1 0.1 0.1 0.2 0.1 0.2 0.1 0.3
55-59 - - - - 0.1 0.1 0.1 0.1 0.1
60-64 - - - - - 0.1 - - -
65+ - - - - - - - - -

8/2/2019 China Labour Statistical Yearbook - 2004
http://slidepdf.com/reader/full/china-labour-statistical-yearbook-2004 459/464
14-4
UNEMPLOYMENT BY ECONOMIC ACTIVITY
单位: 千人 (1000)
行 业 Industry 1999 2000 2001 2002
Total 13.2 14.2 13.9 13.4
初次失业 Uemployed Persons without Previous Work Experience 1.3 1.0 1.0 1.1
制 造 业 Manufacturing 2.2 1.9 2.4 2.6
建 筑 业 Construction 3.6 4.3 3.4 2.7
批发零售及修理业 Wholesale and Retail Trade; Repair of Motor Vehicles, 1.6 1.8 1.9 2.0
Motorcycles and Personal and Household Goods
旅馆及餐饮业 Hotels and Restaurants 1.9 2.0 2.0 2.4
运输、仓储及通信业 Transport,Storageand Communications 0.7 0.6 0.7 0.7
金融保险业 Financial Intermediation 0.3 0.3 0.1 0.2
房地产业 Real Estate, Renting and Business Activities 0.5 0.6 0.6 0.5
公共管理与防务、 Public Administration and Defence;
义务社会保障业 Compulsory socialSecurity 0.1 0.1 0.1 -
教 育 Education 0.2 0.2 0.2 0.1
卫生与社会工作 Health and Social Work 0.1 0.1 0.1 -
其他社区、社会和个人 Other Community, Social and Personal Service
服务工作 Activities 0.7 1.0 1.0 0.9
家庭服务业 Private Households with Employed Persons 0.1 0.3 0.1 0.2
Male 9.1 9.8 9.4 8.9
初次失业 Uemployed Persons without Previous Work Experience 0.7 0.6 0.6 0.7
制 造 业 Manufacturing 1.2 1.0 1.4 1.2
建 筑 业 Construction 3.4 4.1 3.2 2.6
批发零售及修理业 Wholesale and Retail Trade; Repair of Motor Vehicles, 1.0 0.9 1.0 1.1
Motorcycles and Personal and Household Goods
旅馆及餐饮业 Hotels and Restaurants 1.2 1.2 1.3 1.5
运输、仓储及通信业 Transport,Storageand Communications 0.4 0.6 0.5
金融保险业 Financial Intermediation 0.1 0.1 0.1 0.1
房地产业 Real Estate, Renting and Business Activities 0.4 0.4 0.4 0.3
公共管理与防务、 Public Administration and Defence;
义务社会保障业 Compulsory socialSecurity 0.1 0.1 0.1 -
教 育 Education 0.1 0.1 0.1 0.1
其他社区、社会和个人 Other Community, Social and Personal Service
服务工作 Activities 0.5 0.6 0.6 0.6
家庭服务业 Private Households with Employed Persons - - - 0.1
Female 4.2 4.4 4.4 4.5
初次失业 Uemployed Persons without Previous Work Experience 0.6 0.4 0.3 0.4
制 造 业 Manufacturing 1.0 0.9 1.0 1.4
建 筑 业 Construction 0.2 0.2 0.2 0.1
批发零售及修理业 Wholesale and Retail Trade; Repair of Motor Vehicles, 0.6 0.9 0.9 0.9
Motorcycles and Personal and Household Goods
旅馆及餐饮业 Hotels and Restaurants 0.7 0.8 0.8 0.9
运输、仓储及通信业 Transport,Storageand Communications 0.3 0.2 0.2 0.1
金融保险业 Financial Intermediation 0.2 0.2 0.1 0.1
房地产业 Real Estate, Renting and Business Activities 0.1 0.1 0.2 0.2
教 育 Education 0.1 0.2 0.2 -
卫生与社会工作 Health and Social Work - 0.1 - -
其他社区、社会和个人 Other Community, Social and Personal Service
服务工作 Activities 0.2 0.4 0.5 0.4
家庭服务业 Private Households with Employed Persons 0.1 0.2 - 0.1

8/2/2019 China Labour Statistical Yearbook - 2004
http://slidepdf.com/reader/full/china-labour-statistical-yearbook-2004 460/464
14-5
UNEMPLOYMET BY OCCUPATION
单位:千人 (1000)
职 业
Occupation 1996 1997 1998 1999 2000 2001 2002
Total 8.6 6.5 9.5 13.2 14.2 13.9 13.4
初次失业 Unemployed for the First Time 0.7 0.7 0.9 1.3 1.0 1.0 1.1
立法者高级官员和 Legislators,Senior Officials
和管理人员 and Managers 0.1 0.2 0.2 0.4 0.3 0.3 0.4
专业人员 Professio nals 0.1 0.1 0.1 0.1 0.1 0.1
技术和辅助专业人员 Technicians and Associate 0.3 0.1 0.2 0.5 0.5 0.4 0.5
Professionals
职 员 Clerks 0.8 0.7 1.2 1.6 1.5 1.8 1.5
服务人员和商店与 Service Workers and Shop and
市场销售人员 and Market Sales Workers 2.0 1.8 2.4 2.3 2.7 2.9 2.9
农渔业技术人员 Skilled Agricultural and 0.1
Fishery Workers
手艺人和有关行业工人 Craft and Related Trade 1.9 1.3 2.0 3.4 4.1 3.3 3.0
Workers
设备和机械操作工、 Plant and Machine Operators
装配工 and Assemblers 1.3 0.8 0.9 1.2 1.1 1.4 1.6
简单劳动职业人员 Elementary Occupations 1.4 0.8 1.6 2.6 2.8 2.8 2.5
Male 5.3 4.1 6.4 9.1 9.8 9.4 8.9
初次失业 Unemployed for the First Time 0.4 0.3 0.5 0.7 0.6 0.6 0.7
立法者高级官员和 Legislators,Senior Officials
和管理人员 and Managers 0.1 0.2 0.2 0.3 0.2 0.2 0.4
专业人员 Professio nals 0.1 0.1 0.1 0.1
技术和辅助专业人员 Technicians and Associate 0.1 0.1 0.1 0.4 0.3 0.3 0.3
Professionals
职 员 Clerks 0.3 0.3 0.4 0.5 0.5 0.7 0.6
服务人员和商店与 Service Workers and Shop and
市场销售人员 and Market Sales Workers 1.0 1.0 1.6 1.4 1.6 1.6 1.5
农渔业技术人员 Skilled Agricultural and
Fishery Workers
手艺人和有关行业工人 Craft and Related Trade 1.8 1.2 1.9 3.2 3.9 3.1 2.8
Workers
设备和机械操作工、 Plant and Machine Operators
装配工 and Assemblers 0.5 0.4 0.6 0.8 0.7 0.8 0.8
简单劳动职业人员 Elementary Occupations 1.0 0.6 1.1 1.7 1.8 1.9 1.7
Female 3.3 2.4 3.1 4.2 4.4 4.4 4.5
初次失业 Unemployed for the First Time 0.2 0.3 0.4 0.6 0.4 0.3 0.4
立法者高级官员和 Legislators,Senior Officials
和管理人员 and Managers
专业人员 Professio nals
技术和辅助专业人员 Technicians and Associate 0.1 0.1 0.2 0.1 0.1
Professionals
职 员 Clerks 0.6 0.4 0.8 1.0 1.0 1.1 0.9
服务人员和商店与 Service Workers and Shop and
市场销售人员 and Market Sales Workers 0.9 0.8 0.9 0.9 1.2 1.3 1.4
农渔业技术人员 Skilled Agricultural and
Fishery Workers
手艺人和有关行业工人 Craft and Related Trade 0.1 0.1 0.1 0.2 0.2 0.2 0.2
Workers
设备和机械操作工、 Plant and Machine Operators
装配工 and Assemblers 0.8 0.4 0.3 0.4 0.4 0.5 0.7
简单劳动职业人员 Elementary Occupations 0.5 0.3 0.5 0.8 1.0 0.8 0.8

8/2/2019 China Labour Statistical Yearbook - 2004
http://slidepdf.com/reader/full/china-labour-statistical-yearbook-2004 461/464
14-6
WAGES BY ECONOMIC ACTIVITY
单位:澳元 / 月 (Patacas/m)
行 业 Industry 1999 2000 2001 2002
Total 4920 4822 4655 4672
采 矿 业 Mining and Quarrying 10751 4251 5251 8020
制 造 业 Manufacturing 2921 2960 2760 2766
电力、煤气及水的供应业 Electricity, Gas, and Water Supply 11726 11631 9950 12827
建 筑 业 Construction 4660 4351 4296 4142
批发零售及修理业 Wholesale and Retail Trade; Repair of Motor Vehicles, 4711 4533 4445 4430
Motorcycles and Personal and Household Goods
旅馆及餐饮业 Hotels and Restaurants 4443 4099 4001 4050
运输、仓储及通信业 Transport,Storageand Communications 5675 5649 5628 5850
金融保险业 Financial Intermediation 7549 7726 7704 7941
房地产业 Real Estate, Renting and Business Activities 4385 3957 3818 3720
公共管理与防务、 Public Administration and Defence;
义务社会保障业 Compulsory socialSecurity 13767 13742 13798 13749
教 育 Education 9526 9095 8682 8713
卫生与社会工作 Health and Social Work 7914 9137 9826 7747
其他社区、社会和个人 Other Community, Social and Personal Service
服务工作 Activities 6494 6156 6183 5974
家庭服务业 Private Households with Employed Persons 2940 2816 2845 2813
Male 5877 5791 5567 5665
采 矿 业 Mining and Quarrying 10751 5251 8020
制 造 业 Manufacturing 4738 4690 4525 4479
电力、煤气及水的供应业 Electricity, Gas, and Water Supply 11613 12021 10501 12942
建 筑 业 Construction 4687 4335 4286 4107
批发零售及修理业 Wholesale and Retail Trade; Repair of Motor Vehicles, 5480 4947 4759 4824
Motorcycles and Personal and Household Goods
旅馆及餐饮业 Hotels and Restaurants 5551 5480 4866 5022
运输、仓储及通信业 Transport,Storageand Communications 5689 5661 5648 5789
金融保险业 Financial Intermediation 8762 8597 8537 9578
房地产业 Real Estate, Renting and Business Activities 4246 3954 3791 3743
公共管理与防务、 Public Administration and Defence;
义务社会保障业 Compulsory socialSecurity 13481 13613 13421 13495
教 育 Education 10116 9794 9701 9504
卫生与社会工作 Health and Social Work 9451 9948 11591 8848
其他社区、社会和个人 Other Community, Social and Personal Service
服务工作 Activities 6551 6607 6468 6659
家庭服务业 Private Households with Employed Persons 5551 5803 4757 4251
Female 3835 3867 3695 3770
采 矿 业 Mining and Quarrying 4251
制 造 业 Manufacturing 2510 2613 2431 2435
电力、煤气及水的供应业 Electricity, Gas, and Water Supply 12938 11620 9655 9023
建 筑 业 Construction 4436 4509 4463 4418
批发零售及修理业 Wholesale and Retail Trade; Repair of Motor Vehicles, 4044 3876 3885 3856
Motorcycles and Personal and Household Goods
旅馆及餐饮业 Hotels and Restaurants 3745 3606 3524 3569
运输、仓储及通信业 Transport,Storageand Communications 5616 5602 5568 6186
金融保险业 Financial Intermediation 7062 7322 7302 7594
房地产业 Real Estate, Renting and Business Activities 4672 3965 3878 3664
公共管理与防务、 Public Administration and Defence;
义务社会保障业 Compulsory socialSecurity 14730 14352 15544 15479
教 育 Education 9170 8755 8303 8612
卫生与社会工作 Health and Social Work 6886 8117 9174 6639
其他社区、社会和个人 Other Community, Social and Personal Service
服务工作 Activities 6368 5708 5853 5568
家庭服务业 Private Households with Employed Persons 2904 2756 2792 2772

8/2/2019 China Labour Statistical Yearbook - 2004
http://slidepdf.com/reader/full/china-labour-statistical-yearbook-2004 462/464
14-7
HOURS OF WORK BY ECONOMIC ACTIVITY
单位:小时 / 周 (hours/per week)
行 业 Industry 1999 2000 2001 2002
Total 48.3 48.1 47.9
采 矿 业 Mining and Quarrying 43.2 47.0 47.0 44.7
制 造 业 Manufacturing 48.8 48.2 47.8
电力、煤气及水的供应业 Electricity, Gas, and Water Supply 42.4 43.0 42.9 43.4
建 筑 业 Construction 4 4.7 45.1 45.9 44.6
批发零售及修理业 Wholesale and Retail Trade; Repair of Motor Vehicles, 52.1 52.5 53.5 52.9
Motorcycles and Personal and Household Goods
旅馆及餐饮业 Hotels and Restaurants 55.5 56.3 57.9 55.5
运输、仓储及通信业 Transport,Storageand Communications 47.1 47.1 47.4 47.0
金融保险业 Financial Intermediation 43.8 43.7 43.8 43.9
房地产业 Real Estate, Renting and Business Activities 49.9 53.1 53.6 54.3
公共管理与防务、 Public Administration and Defence;
义务社会保障业 Compulsory socialSecurity 38.5 38.8 38.9 39.1
教 育 Education 41.6 40.8 41.5 41.4
卫生与社会工作 Health and Social Work 44.6 42.1 43.7 43.4
其他社区、社会和个人 Other Community, Social and Personal Service
服务工作 Activities 55.1 54.9 55.0 54.0
家庭服务业 Private Households with Employed Persons 60.6 56.2 55.7 55.2
Male 48.1 48.0 48.2 47.9
采 矿 业 Mining and Quarrying 43.2 … 47.0 44.7
制 造 业 Manufacturing 48.2 48.2 48.0 48.1
电力、煤气及水的供应业 Electricity, Gas, and Water Supply 43.0 43.1 43.4 43.1
建 筑 业 Construction 4 4.6 45.1 45.9 44.8
批发零售及修理业 Wholesale and Retail Trade; Repair of Motor Vehicles, 52.5 53.2 54.2 53.6
Motorcycles and Personal and Household Goods
旅馆及餐饮业 Hotels and Restaurants 58.4 58.2 57.4 57.2
运输、仓储及通信业 Transport,Storageand Communications 47.9 47.9 47.9 47.5
金融保险业 Financial Intermediation 44.4 44.8 44.5 43.9
房地产业 Real Estate, Renting and Business Activities 59.3 59.9 59.6 61.2
公共管理与防务、 Public Administration and Defence;
义务社会保障业 Compulsory socialSecurity 39.2 39.6 39.3 40.0
教 育 Education 41.8 40.1 41.0 40.9
卫生与社会工作 Health and Social Work 43.0 42.8 43.2 42.8
其他社区、社会和个人 Other Community, Social and Personal Service
服务工作 Activities 54.9 54.9 55.3 53.3
家庭服务业 Private Households with Employed Persons 58.6 58.4 53.6 56.9
Female 48.6 48.2 48.0 47.8
采 矿 业 Mining and Quarrying 47.0
制 造 业 Manufacturing 49.1 48.3 48.0 47.7
电力、煤气及水的供应业 Electricity, Gas, and Water Supply 38.8 40.7 41.2 39.6
建 筑 业 Construction 4 5.8 45.2 45.3 42.6
批发零售及修理业 Wholesale and Retail Trade; Repair of Motor Vehicles, 51.7 51.8 52.7 52.2
Motorcycles and Personal and Household Goods
旅馆及餐饮业 Hotels and Restaurants 54.0 54.5 58.5 54.2
运输、仓储及通信业 Transport,Storageand Communications 45.4 45.4 46.5 46.0
金融保险业 Financial Intermediation 43.3 43.0 43.4 43.9
房地产业 Real Estate, Renting and Business Activities 46.4 47.0 47.1 47.2
公共管理与防务、 Public Administration and Defence; 37.4 37.5 38.0 37.8
义务社会保障业 Compulsory socialSecurity
教 育 Education 41.5 41.1 41.7 41.5
卫生与社会工作 Health and Social Work 45.0 41.9 43.9 43.7
其他社区、社会和个人 Other Community, Social and Personal Service
服务工作 Activities 55.4 54.9 54.6 54.5
家庭服务业 Private Households with Employed Persons 60.7 55.8 56.1 54.9

8/2/2019 China Labour Statistical Yearbook - 2004
http://slidepdf.com/reader/full/china-labour-statistical-yearbook-2004 463/464
14-8
CONSUMER PRICES INDICES
项 目
Item 1993 1994 1995 1996 1997 1998 1999 2000 2001 2002
总指数 General Indices 125.9 133.8 145.3 152.3 157.6 157.9 96.81 95.2 93.3 90.9
总指数(不含住房) General Indices 125.9 133.8 145.3 152.3 157.6 157.9 152.8
(excl. shelter)
食品指数 Food Indices 125.9 134.9 145.7 152.3 157.8 158.7 151.7 149.5 147.3 144.2
用电及燃料指数 Fuel and Light Indices 110.6 111.0 118.4 125.8 135.1 134.2 131.3 137.8 138.6 130.8
服装指数 Clothing Indices 107.3 110.5 124.3 132.0 134.1 135.5 132.5 125.3 119.4 107.2
租金指数 Rent Indices 107.9 104.4 101.3 98.7 96.0
注 1:以 1998 年为 100。 Note 1: 1998=100.
14-9
OCCUPATIONAL INJURIES BY ECONOMIC AVTIVITY
行 业 Industry 1999 2000 2001 2002
Total ( fatal and non fatal, person) 3218 3608 3651 3855
农林牧渔业 Agriculture,Huntung,Forestry and Fishing 1 3
制 造 业 Manufacturing 785 881 792 792
电力、煤气及水的供应业 Electricity, Gas, and Water Supply 14 11 27 15
建 筑 业 Construction 346 324 356 305
批发零售及修理业 Wholesale and Retail Trade; Repair of Motor Vehicles, 494 470 502 498
Motorcycles and Personal and Household Goods
旅馆及餐饮业 Hotels and Restaurants 638 766 767 853
运输、仓储及通信业 Transport,Storageand Communications 182 268 270 302
金融保险业 Financial Intermediation 26 27 33 29
房地产业 Real Estate, Renting and Business Activities 61 111 136 133
公共管理与防务、 Public Administration and Defence;
义务社会保障业 Compulsory socialSecurity 10 23 40 61
教 育 Education 72 87 71 114
卫生与社会工作 Health and Social Work 19 20 28 28其他社区、社会和个人 Other Community, Social and Personal Service
服务工作 Activities 556 600 603 704
家庭服务业 Private Households with Employed Persons 14 20 23 21
1 Non fatal 3216 3602 3645 3847
农林牧渔业 Agriculture,Huntung,Forestry and Fishing 1 3
制 造 业 Manufacturing 785 880 791 791
电力、煤气及水的供应业 Electricity, Gas, and Water Supply 14 11 27 14
建 筑 业 Construction 346 324 355 301
批发零售及修理业 Wholesale and Retail Trade; Repair of Motor Vehicles, 494 468 501 498
Motorcycles and Personal and Household Goods
旅馆及餐饮业 Hotels and Restaurants 638 766 767 852
运输、仓储及通信业 Transport,Storageand Communications 181 268 270 302
金融保险业 Financial Intermediation 26 27 33 29
房地产业 Real Estate, Renting and Business Activities 61 109 134 132
公共管理与防务、 Public Administration and Defence;
义务社会保障业 Compulsory socialSecurity 10 23 40 61
教 育 Education 72 87 71 114
卫生与社会工作 Health and Social Work 19 20 28 28
其他社区、社会和个人 Other Community, Social and Personal Service
服务工作 Activities 555 599 602 704
家庭服务业 Private Households with Employed Persons 14 20 23 21
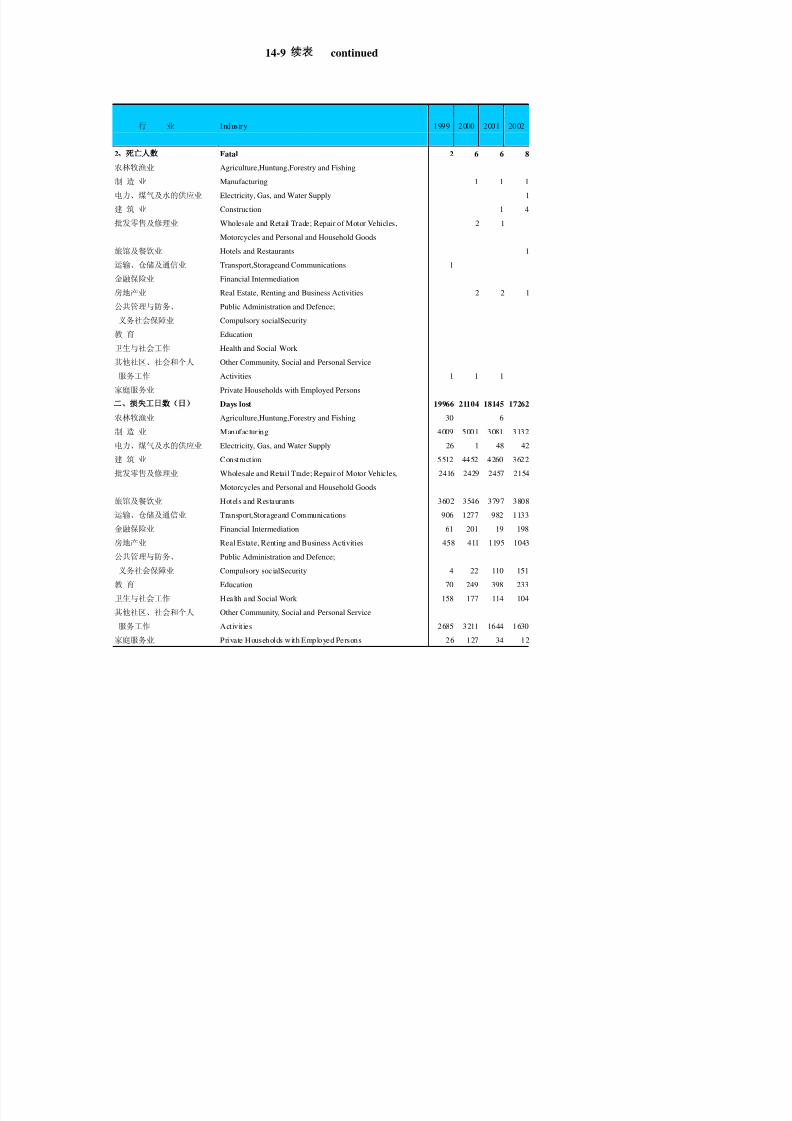
8/2/2019 China Labour Statistical Yearbook - 2004
http://slidepdf.com/reader/full/china-labour-statistical-yearbook-2004 464/464
14-9 continued
行 业 Industry 1999 2000 2001 2002
2 Fatal 2 6 6 8农林牧渔业 Agriculture,Huntung,Forestry and Fishing
制 造 业 Manufacturing 1 1 1
电力、煤气及水的供应业 Electricity, Gas, and Water Supply 1
建 筑 业 Construction 1 4
批发零售及修理业 Wholesale and Retail Trade; Repair of Motor Vehicles, 2 1
Motorcycles and Personal and Household Goods
旅馆及餐饮业 Hotels and Restaurants 1
运输、仓储及通信业 Transport,Storageand Communications 1
金融保险业 Financial Intermediation
房地产业 Real Estate, Renting and Business Activities 2 2 1
公共管理与防务、 Public Administration and Defence;
义务社会保障业 Compulsory socialSecurity
教 育 Education
卫生与社会工作 Health and Social Work
其他社区、社会和个人 Other Community, Social and Personal Service
服务工作 Activities 1 1 1
家庭服务业 Private Households with Employed Persons
Days lost 19966 21104 18145 17262
农林牧渔业 Agriculture,Huntung,Forestry and Fishing 30 6
制 造 业 Manufacturing 4009 5001 3081 3132
电力、煤气及水的供应业 Electricity, Gas, and Water Supply 26 1 48 42
建 筑 业 Construction 5512 4452 4260 3622
批发零售及修理业 Wholesale and Retail Trade; Repair of Motor Vehicles, 2416 2429 2457 2154
Motorcycles and Personal and Household Goods
旅馆及餐饮业 Hotels and Restaurants 3602 3546 3797 3808
运输、仓储及通信业 Transport,Storageand Communications 906 1277 982 1133
金融保险业 Financial Intermediation 61 201 19 198
房地产业 Real Estate Renting and Business Activities 458 411 1195 1043