Embed Size (px)
Citation preview
1
CHINA MOBILE CHINA MOBILE LIMITED (00941.HK)
Global Investment Research Challenge 2008
$
Amy Lee
BUY with Target Price HK$136.6
Andy Chau
Angela Yuen
Sophia ZhangSophia Zhang
Hong Kong Baptist University
2
Overview of China Telecom Industry
China MobileGSM
China UnicomGSM+CDMA
China TelecomFixed Line
China NetcomFixed Line
China Population: 1.3 billionMobile Penetration: 41 6%Mobile Penetration: 41.6%Rural Penetration: 19%Market Share:Market Share:
China Mobile:69%China Unicom: 29%China Unicom: 29%
3
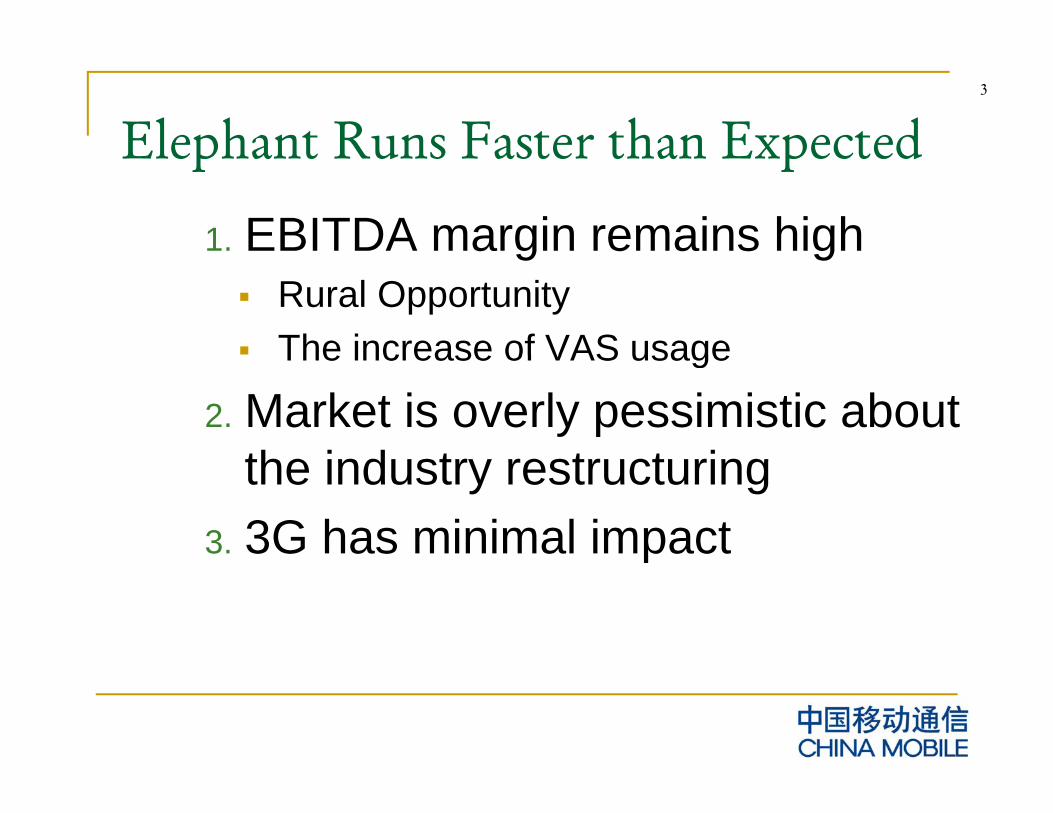
Elephant Runs Faster than ExpectedElephant Runs Faster than Expected
1. EBITDA margin remains highg gRural OpportunityThe increase of VAS usageThe increase of VAS usage
2. Market is overly pessimistic about th i d t t t ithe industry restructuring
3. 3G has minimal impactp
4
Rural Opportunity
5
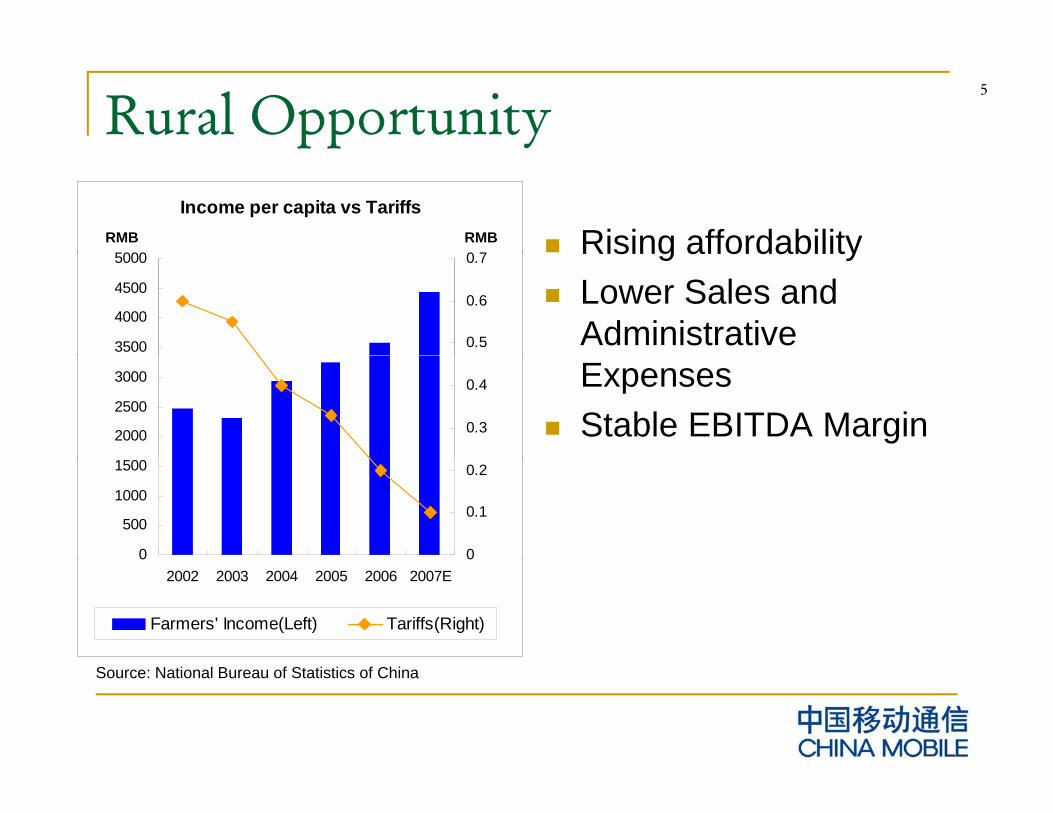
Rural Opportunity
Rising affordabilityIncome per capita vs Tariffs
5000 0 7RMBRMB Rising affordability
Lower Sales and Administrative 3500
4000
4500
5000
0.5
0.6
0.7
ExpensesStable EBITDA Margin2000
2500
3000
0.3
0.4
0
500
1000
1500
0
0.1
0.2
2002 2003 2004 2005 2006 2007E
Farmers' Income(Left) Tariffs(Right)
Source: National Bureau of Statistics of China
6
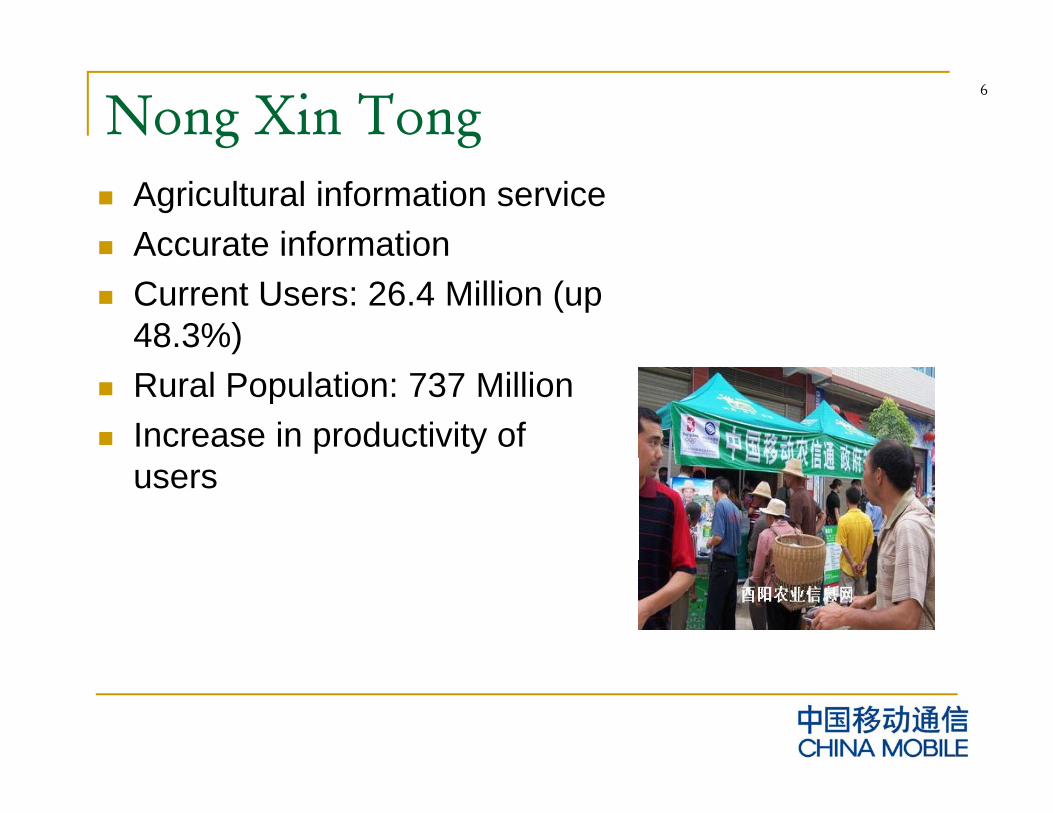
Nong Xin TongAgricultural information serviceAccurate informationAccurate information Current Users: 26.4 Million (up 48.3%)Rural Population: 737 MillionIncrease in productivity of users
7
The increase of VAS usage
8
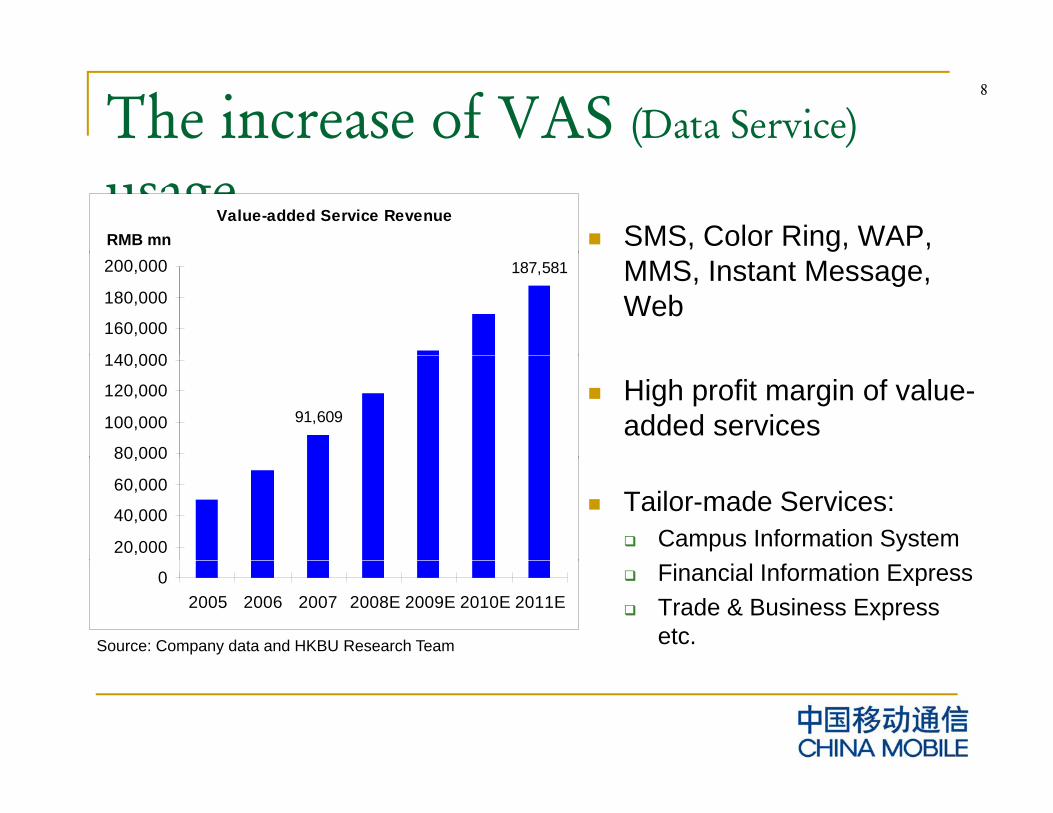
The increase of VAS (Data Service)
usageSMS, Color Ring, WAP,
Value-added Service RevenueRMB mn
MMS, Instant Message, Web
187,581
140 000
160,000
180,000
200,000
High profit margin of value-added services 91,609
80,000
100,000
120,000
140,000
Tailor-made Services:Campus Information System20,000
40,000
60,000
80,000
Financial Information ExpressTrade & Business Expressetc.Source: Company data and HKBU Research Team
02005 2006 2007 2008E 2009E 2010E 2011E
9
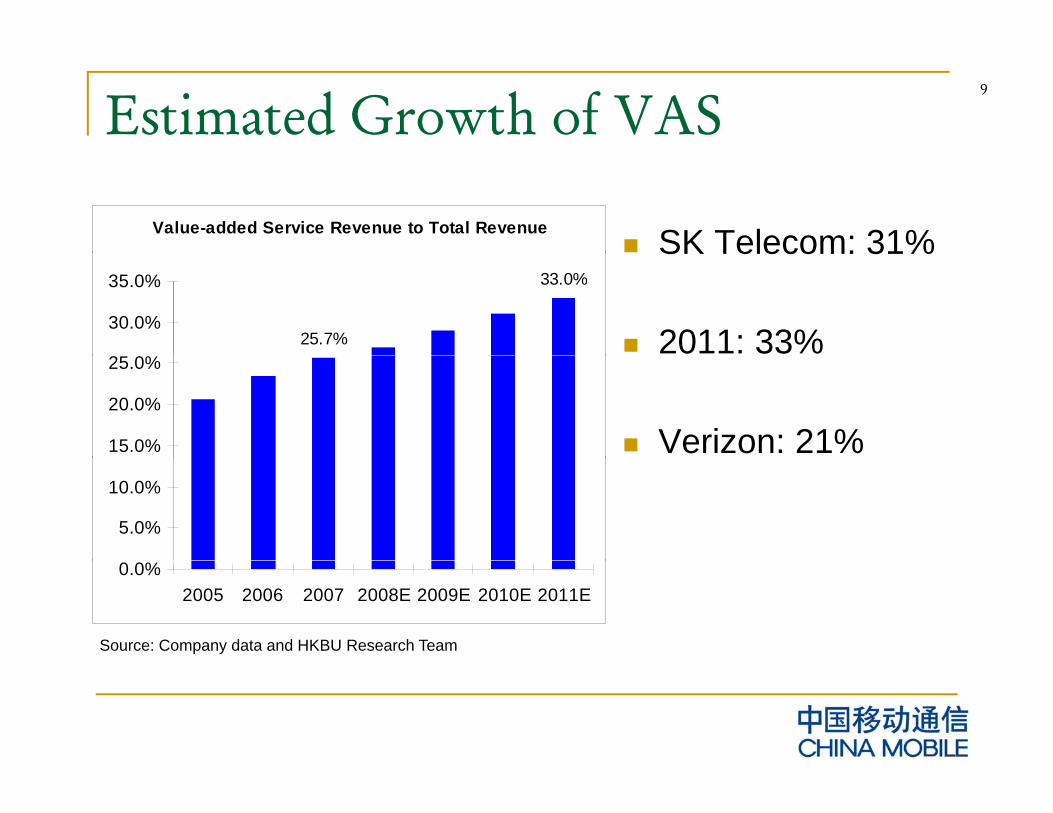
Estimated Growth of VAS
SK Telecom: 31%Value-added Service Revenue to Total Revenue SK Telecom: 31%
2011: 33%25.7%
33.0%
30.0%
35.0%
Verizon: 21%15.0%
20.0%
25.0%
5.0%
10.0%
0.0%2005 2006 2007 2008E 2009E 2010E 2011E
Source: Company data and HKBU Research Team
10
Future Uncertainties
R t t i Restructuring &&
G Li i3G Licensing
11
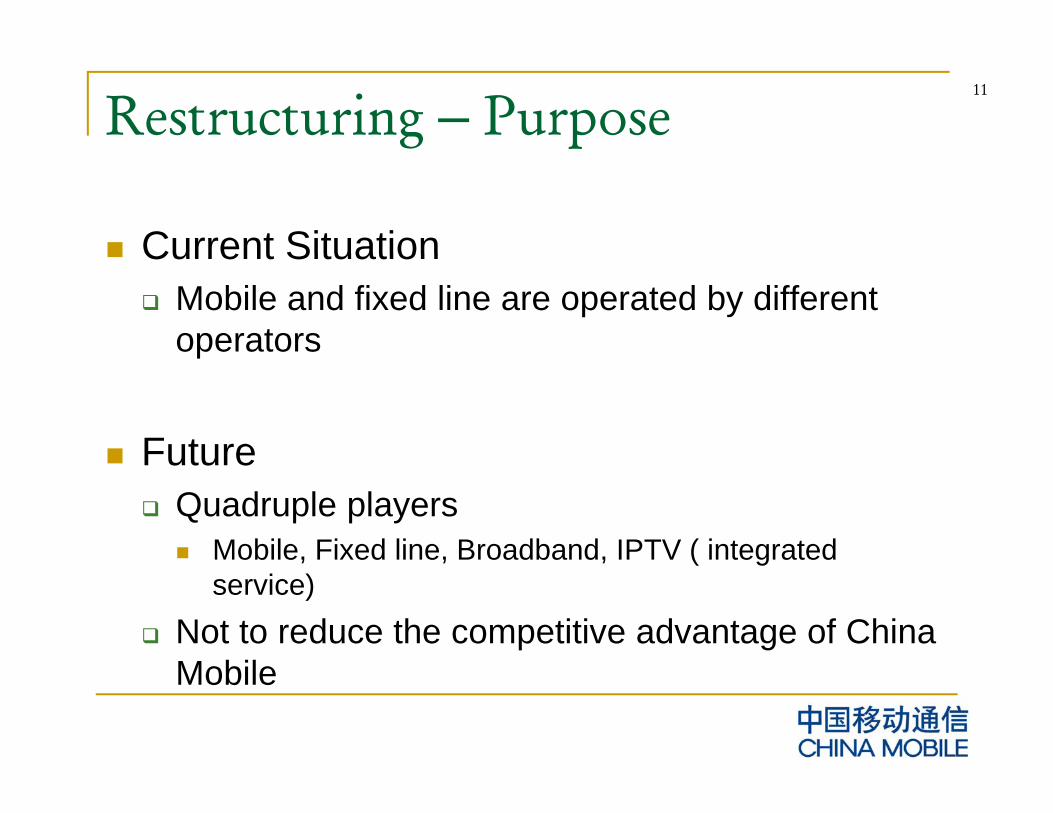
Restructuring – Purpose
Current SituationCurrent SituationMobile and fixed line are operated by different operatorsp
FutureFutureQuadruple players
Mobile, Fixed line, Broadband, IPTV ( integrated , , , ( gservice)
Not to reduce the competitive advantage of China M bilMobile
12
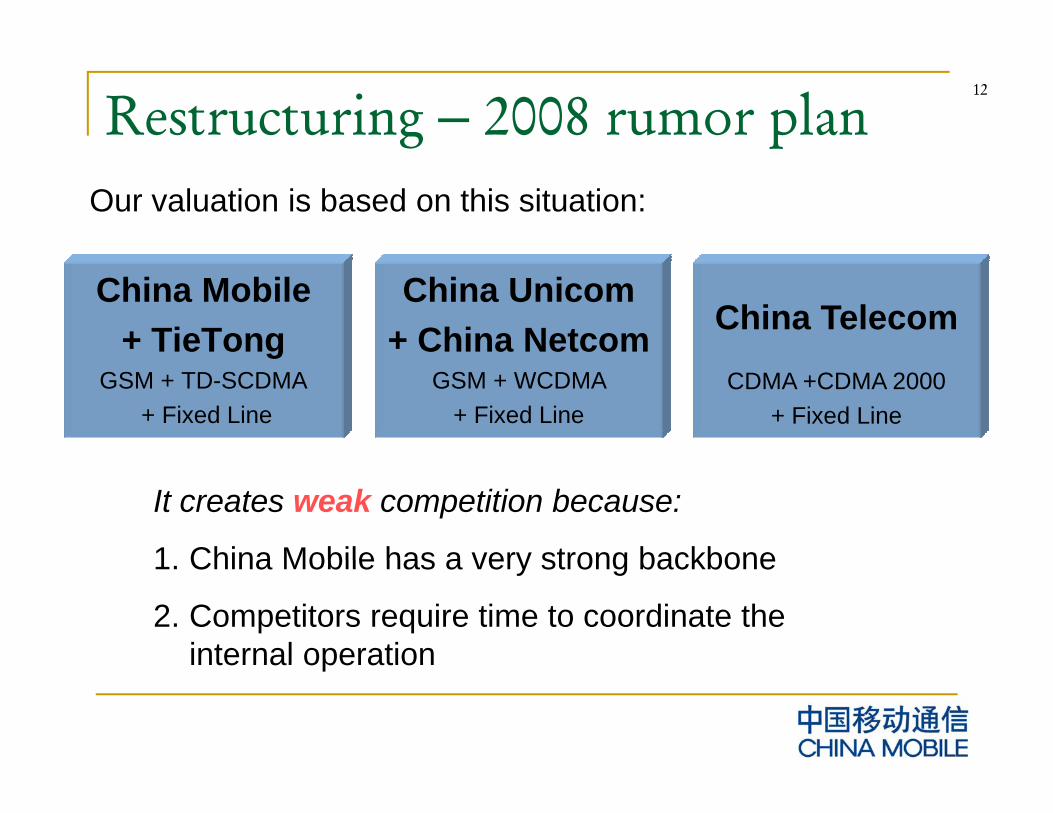
Restructuring – 2008 rumor planOur valuation is based on this situation:
China Mobile + TieTong
China Unicom + China Netcom China Telecomg
GSM + TD-SCDMA+ Fixed Line
GSM + WCDMA + Fixed Line
CDMA +CDMA 2000 + Fixed Line
It creates weak competition because:
1 China Mobile has a very strong backbone1. China Mobile has a very strong backbone
2. Competitors require time to coordinate the internal operationinternal operation
13
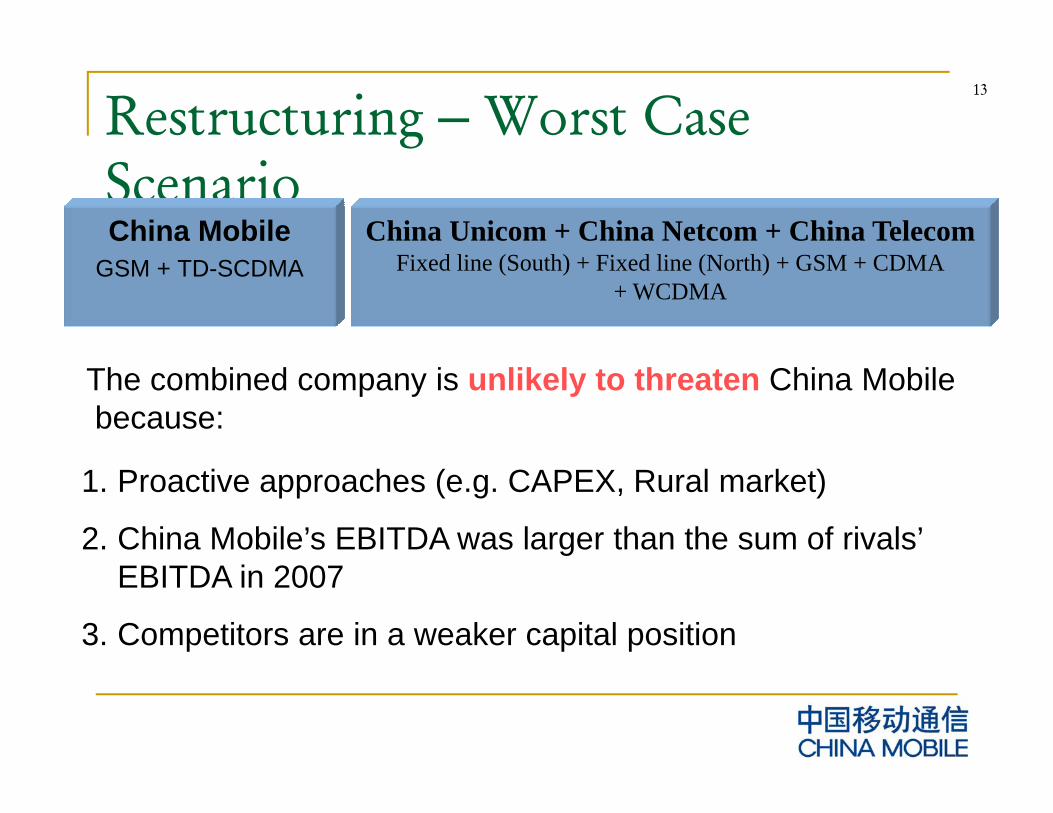
Restructuring – Worst Case ScenarioChina Mobile China Unicom + China Netcom + China Telecom
GSM + TD-SCDMA Fixed line (South) + Fixed line (North) + GSM + CDMA+ WCDMA
The combined company is unlikely to threaten China Mobilebecause:
1. Proactive approaches (e.g. CAPEX, Rural market)
2. China Mobile’s EBITDA was larger than the sum of rivals’ EBITDA in 2007
3. Competitors are in a weaker capital position
14
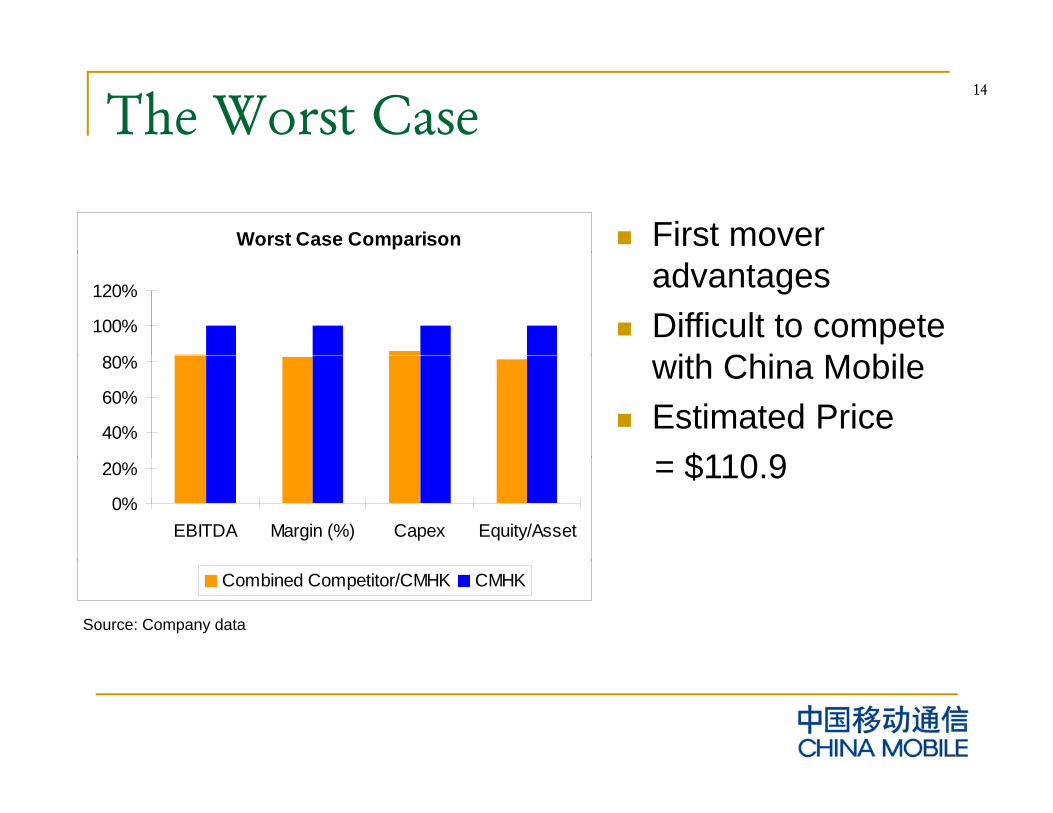
The Worst Case
Worst Case Comparison First mover
80%
100%
120% advantagesDifficult to compete
ith Chi M bil
40%
60%
80% with China MobileEstimated Price
$110 90%
20%
EBITDA Margin (%) Capex Equity/Asset
= $110.9
Source: Company data
Combined Competitor/CMHK CMHK
15
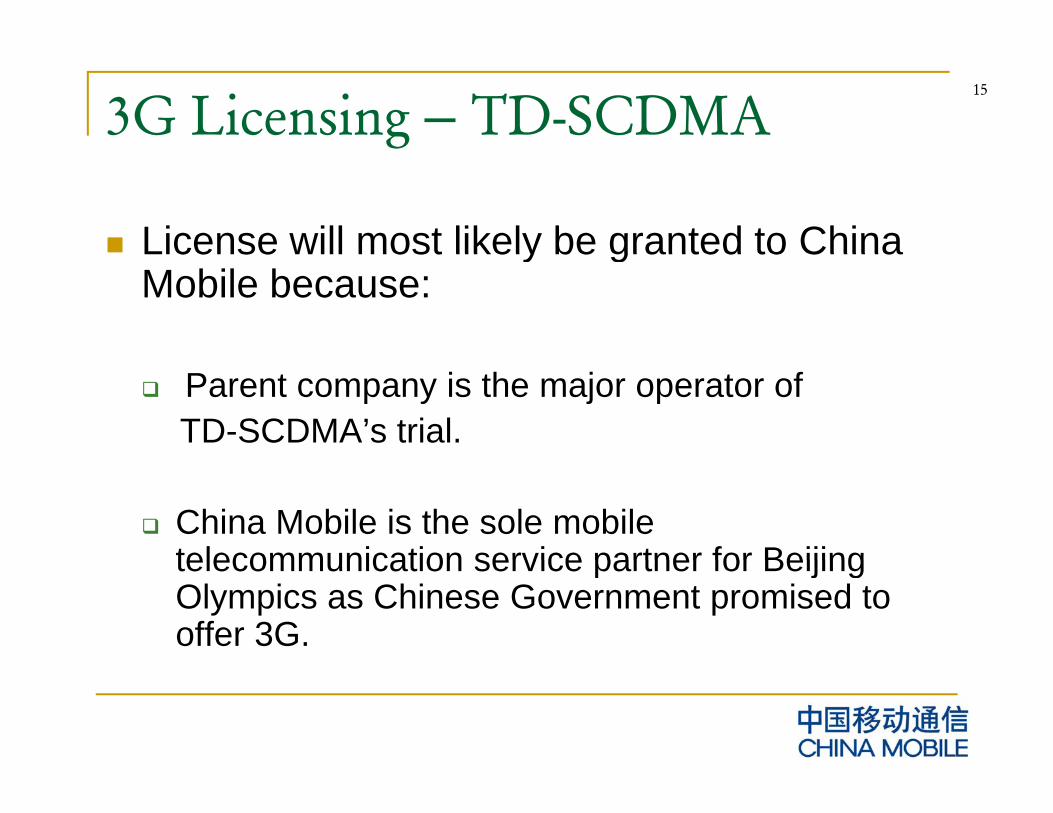
3G Licensing – TD-SCDMA
License will most likely be granted to ChinaLicense will most likely be granted to China Mobile because:
Parent company is the major operator of TD-SCDMA’s trial.
China Mobile is the sole mobile telecommunication service partner for Beijingtelecommunication service partner for Beijing Olympics as Chinese Government promised to offer 3G.
16
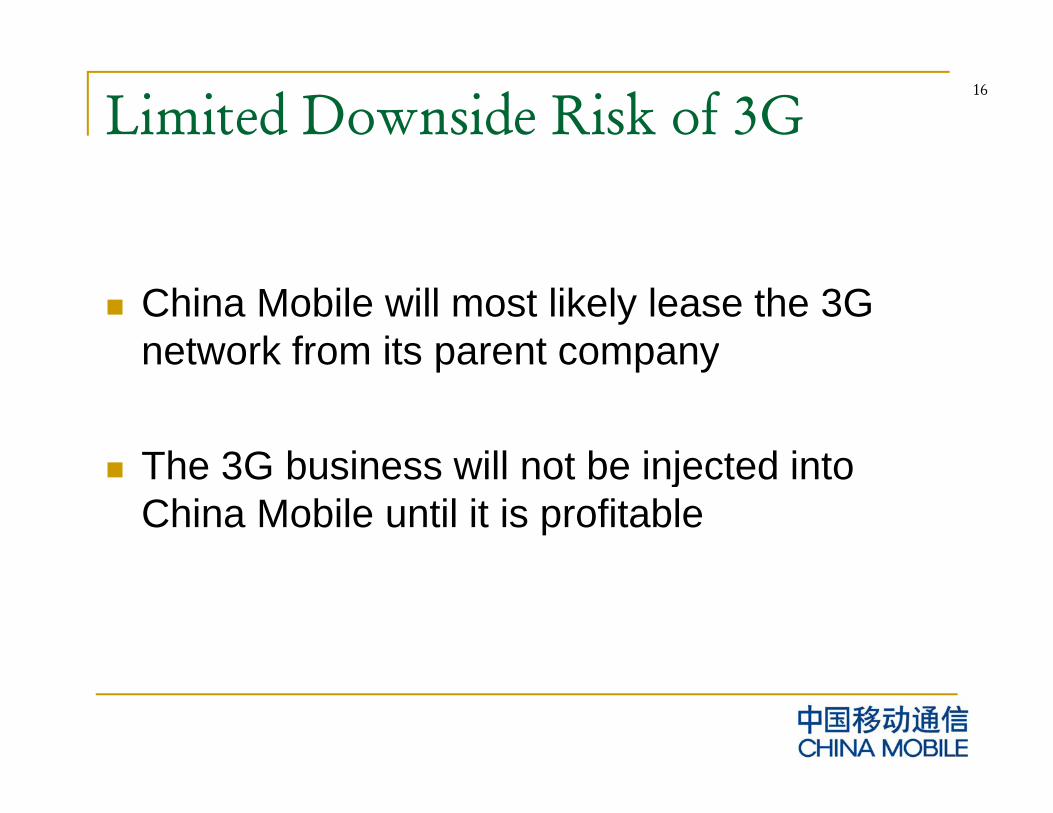
Limited Downside Risk of 3G
China Mobile will most likely lease the 3G network from its parent companynetwork from its parent company
Th 3G b i ill t b i j t d i tThe 3G business will not be injected into China Mobile until it is profitable
17
V l tiValuation
18
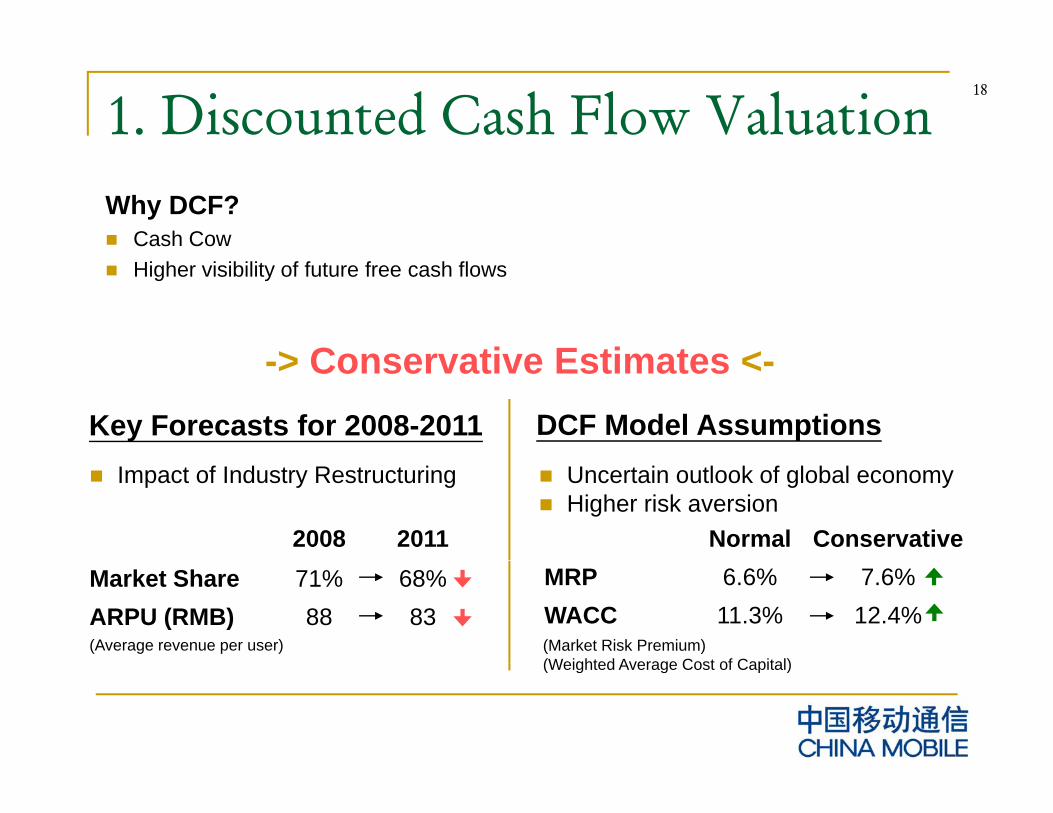
1. Discounted Cash Flow ValuationWhy DCF?
Cash CowHigher visibility of future free cash flows
> Conservative Estimates <Key Forecasts for 2008-2011 DCF Model Assumptions
-> Conservative Estimates <-
2008 2011
Impact of Industry Restructuring Uncertain outlook of global economyHigher risk aversion
Normal ConservativeMarket Share 71% 68%ARPU (RMB) 88 83(Average revenue per user)
MRP 6.6% 7.6%WACC 11.3% 12.4%(Market Risk Premium)(Weighted Average Cost of Capital)(Weighted Average Cost of Capital)
19
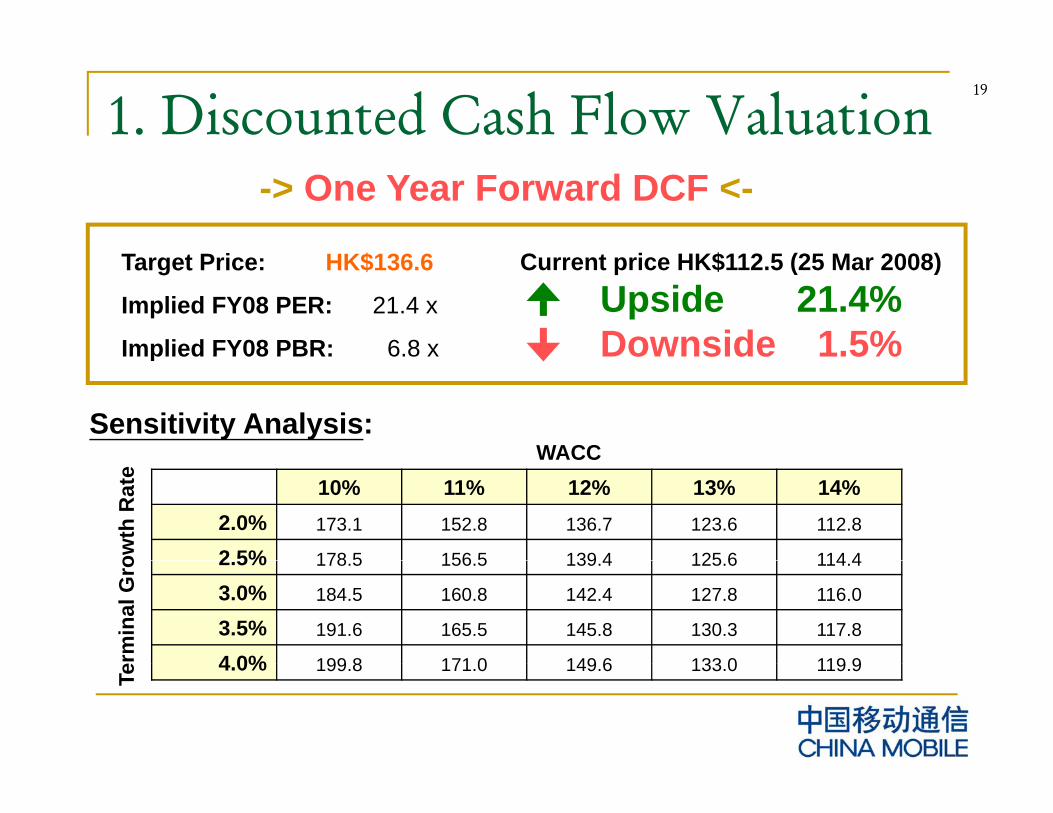
1. Discounted Cash Flow Valuation
$ C $112 (2 2008)
-> One Year Forward DCF <-
Target Price: HK$136.6
Implied FY08 PER: 21.4 x
Implied FY08 PBR: 6.8 x
Current price HK$112.5 (25 Mar 2008)
Upside 21.4%Downside 1.5%Implied FY08 PBR: 6.8 x Downside 1.5%
WACCSensitivity Analysis:
WACC10% 11% 12% 13% 14%
2.0% 173.1 152.8 136.7 123.6 112.8
2 5% 178 5 156 5 139 4 125 6 114 4owth
Rat
e
2.5% 178.5 156.5 139.4 125.6 114.4
3.0% 184.5 160.8 142.4 127.8 116.0
3.5% 191.6 165.5 145.8 130.3 117.8
4 0% 199 8 171 0 149 6 133 0 119 9rmin
al G
ro
4.0% 199.8 171.0 149.6 133.0 119.9
Te
20
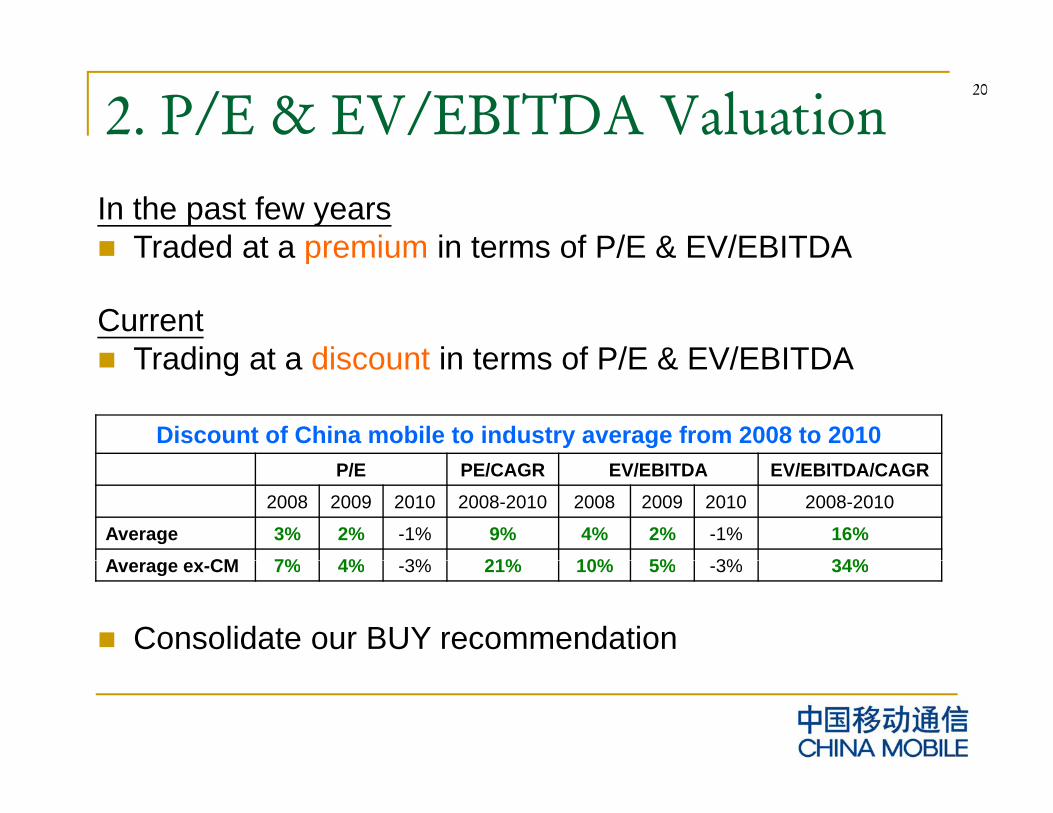
2. P/E & EV/EBITDA ValuationIn the past few years
Traded at a premium in terms of P/E & EV/EBITDATraded at a premium in terms of P/E & EV/EBITDA
CurrentTrading at a discount in terms of P/E & EV/EBITDA
Discount of China mobile to industry average from 2008 to 2010
Trading at a discount in terms of P/E & EV/EBITDA
P/E PE/CAGR EV/EBITDA EV/EBITDA/CAGR2008 2009 2010 2008-2010 2008 2009 2010 2008-2010
Average 3% 2% -1% 9% 4% 2% -1% 16%A CM 7% 4% 3% 21% 10% 5% 3% 34%Average ex-CM 7% 4% -3% 21% 10% 5% -3% 34%
Consolidate our BUY recommendation
21
Quality Stock in Turbulent Times
Solid Balance SheetSolid Balance SheetCash Holding = $10/shareMi i l i t f b i i iMinimal impact from subprime crisisSteady RMB appreciation
22
Conclusion
Conservative assumptions in our modelConservative assumptions in our modelAttractive valuationRecommendation:Recommendation:
BUYBUYBUYBUY
23
Thank you