Embed Size (px)
Citation preview

THIS REPORT CONTAINS ASSESSMENTS OF COMMODITY AND TRADE ISSUES MADE BY
USDA STAFF AND NOT NECESSARILY STATEMENTS OF OFFICIAL U.S. GOVERNMENT
POLICY
Voluntary - Public
Date: 7/28/2010
GAIN Report Number: CH100042
China - Peoples Republic of
Post: Beijing
Forest Products Annual Report
2010
Report Categories:
Solid Wood Products
Approved By:
Scott Sindelar
Prepared By:
Mark Petry, Zhang Lei & Susan Zhang
Report Highlights:
The Government of China launched a series of policies to support forestry development in 2009 and 2010. The most
important has been a successful transfer of property rights to local forest holders in many provinces, which has increased
forest management and increased resource availability. However, labor availability and increasing costs are constricting
China’s wood processing sectors. China’s overall wood products trade is forecast to pick up in 2010 after dipping in 2008
and 2009. Chinese industry is cautiously optimistic about China’s wood product exports despite concern over the U.S.
property market and the euro depreciation.
General Information:
Forest Resources:
China’s forested area totals 195 million hectares
China’s Seventh National Forest Resource Inventory Report, which was released in December 2009, concluded that China’s
forested area covers 195 million hectares with the forest stocking volume at 13,721 million cubic meters. The forest
coverage increased to 20.36 percent of the country’s total land area. Natural forest covers 119.69 [1] million hectares with
the forest stocking volume at 11,402 million cubic meters, while plantation forest covers 61.69 million hectares with forest
stocking [2] volume at 1,961 million cubic meters. Please refer to CH9132 for more information of China’s latest forest
resource inventory report.
China committed to strictly protecting forest land
The State Council approved “National Forest Land Protection and Utilization Guideline (2010-2020) [3] ” on June 9,
2010. The Guideline sets up five major missions for forest land protection in the next 10 years: 1) strict protection of
existing forest land and ensuring the moderate expansion of the forest land. By 2020, forest land should increase to 312
million Ha from the current 304 million Ha; 2) strengthen the protection of forests, and ensure the continuous increase of
forest area. By 2020, forest area should increase to 223 million ha from the current 195 million ha; 3) manage forest
scientifically, and improve the forest quality and yield; 4) optimize forest land layout and structure to maximize output; 5)
deepen the reform of collective forest property rights.
China’s forest plantation area increased rapidly as a result of forestry reform
China planted 6.3 million hectares of forest in 2009, an 18 percent increase from 2008. The increase was attributed to
China’s ongoing forestry property rights reform. The reform is designed to stimulate farmers’ initiative to plant and manage
trees as it delivers the use rights of collective forest land to farmers so that they have the property rights to the trees on their
contracted forest land. State Forestry Administration (SFA) statistics reveal that Chongqing planted 532,000 ha of forest in
2009, more than its overall forest plantation area in the past 10 years, while Fujian, Guangxi and Jiangxi provinces’ forest
plantation areas were at record highs. See the table 1 below for the area by forest type in 2009.
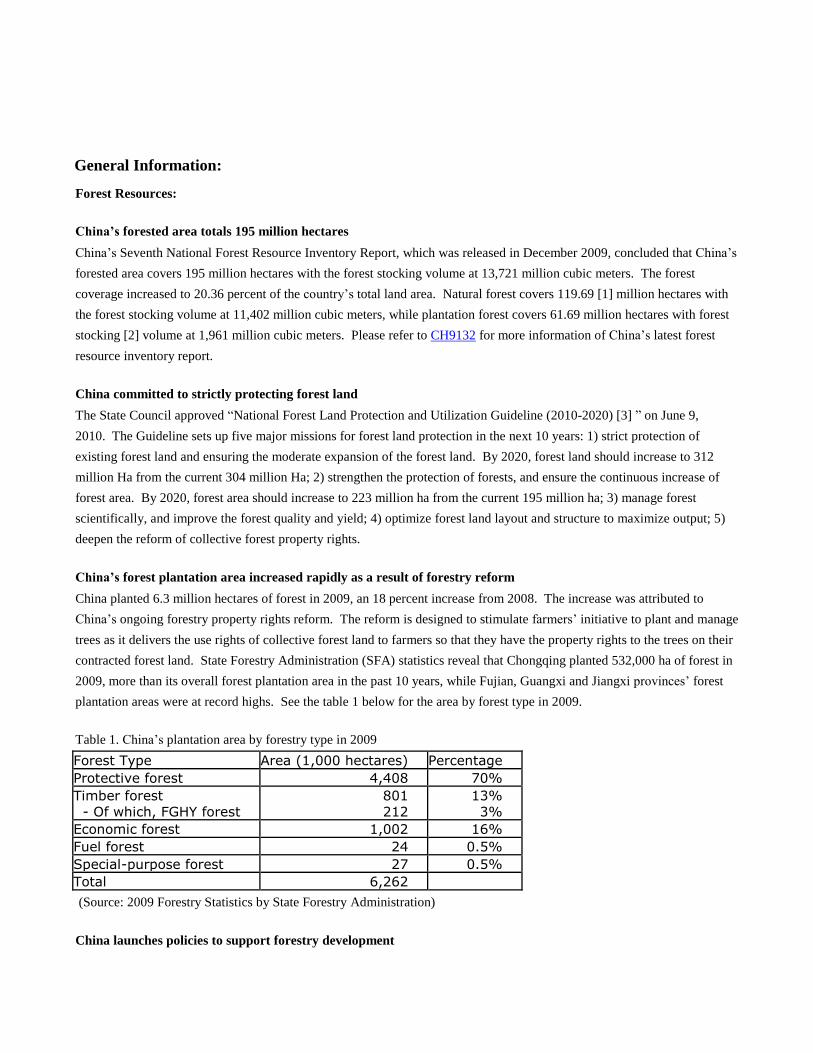
Table 1. China’s plantation area by forestry type in 2009
Forest Type Area (1,000 hectares) Percentage
Protective forest 4,408 70%
Timber forest
- Of which, FGHY forest
801
212
13%
3%
Economic forest 1,002 16%
Fuel forest 24 0.5%
Special-purpose forest 27 0.5%
Total 6,262
(Source: 2009 Forestry Statistics by State Forestry Administration)
China launches policies to support forestry development
Forestry development is attracting more and more attention from the Government of China (GOC). Many new forestry
policies have been launched since 2009 to stimulate forestry development. These include:
1. Public financial support policies:
Forestry subsidy policies has been launched: forestry seed subsidy and forest plantation subsidy trials have
been carried out since 2010, with total amount RMB200 million and RMB300 million respectively; forest
tending subsidy has been extended in 2010, with total amount spent reaching RMB2 billion; and forest
machinery has been included in the list of agriculture machinery eligible for a subsidy beginning 2010.
Compensation system for forest ecological benefit is continuously improving. Central financing on
collective public welfare forest has doubled its compensation from RMB75/ha to RMB150/ha; local
governments’ compensation varies from RMB225-900/ha.
Afforestation fund was decreased to 10 percent of sales from 20 percent in July 2009.
2. Financial service support policies:
Small forest mortgage loan has been expanded and improved. According to SFA statistics, by June 2010,
forest mortgage loan has been granted to one million farmers in 25 provinces, with the total loan
amounting to RMB22 billion.
Forest insurance coverage is expanding. Public finances subsidize forest insurance premiums in Jiangxi,
Hunan and Fujian provinces in 2009. The preferential policy has been extended to Zhejiang, Liaoning
and Yunnan provinces in 2010 and subsidy has been increased to 50 percent of the premium from the 30
percent in 2009. By June 2010, forest insurance covered 18 million hectares, with the insurance subsidy
totaling RMB114 billion.
Interest subsidy on forest loans has been expanded since October 2009. The new policy increased the
general interest subsidy from two percent to three percent and the longest subsidy period has been
extended to five years from three years.
3. Forest logging management policy has been improved. Trials on forest logging reform have been implemented in 193
counties since August 2009. The reform is designed to build simplified and transparent logging management
system. China hopes to transfer to logging registration management from the current logging quota management within five
years.
China’s forest property rights reform claims success
Chinese officials believe that forest reform has helped to increase annual forest plantation area, improve farmers’ income
and channel investment to the forest sector. China’s annual forest plantation area increased from 2.7 million ha in 2006 to
6.3 million ha in 2009 (see figure 1 below) and forest property rights reform is considered the largest contributor to the
increase. SFA announced that forest investment increased 37 percent to RMB135 billion in 2009, of which, RMB 84 billion
came from government.
Official statistics show that in the 1,818 counties carrying out forest reform, farmers’ average income amounted to
RMB4,961 in 2009, of which RMB 643 came from the forest sector. In some areas, such as Zhejiang Province, farmers’
income from forest sector accounts for as high as 55 percent of total income.
Figure 1. China’s annual forest plantation area

(Source: State Forestry Administration)
According to SFA statistics, by June 2010, the reform has been completed in 12 provinces (which are Fujian, Jiangxi,
Liaoning, Zhejiang, Yunnan, Hebei, Anhui, Hubei, Chongqing, Guizhou, Sichuan and Hunan provinces). Among the 182
million ha of collective forests, property rights on 130 million ha have been clarified and 98 million ha of forest property
certificates of have been issued.
Forest farmers’ cooperatives are expected to create large businesses
While achievements of the reform have been recognized, the industry still has some concerns. One of the major concerns is
that the reform restricts size/consolidation of management, which poses difficulties for investors. For example, in the past,
the investors needed to negotiate with the authority of a village or a town to contract 100 hectares of forest land. Now, the
investor needs to face hundreds of individual farmers. The forest farmers’ cooperatives, which are developing rapidly, are
expected to facilitate the size of business. According to SFA statistics, by June 2010 China will have over 14,000 forest
cooperatives, with over five million household members that manage over three million hectares of forest land. The number
of cooperatives and the relatively small holdings may hinder economies of scale in forest management. [1]
The figures hereafter in the report do not include Hong Kong, Macao and Taiwan. These exclusions explain why the sum
of the sub-categories is not consistent with the total acreage of 195 million hectares. [2]
Forest stocking refers to the amount of live trees on a given area. [3]
The full text of the document was not available at the time of this report.
Production:
China’s forestry output value has increased rapidly since 2006
China’s forestry output value increased to RMB1.75 trillion in 2009 from the RMB1.06 trillion in 2006. In 2009, China’s
forestry primary industry, secondary industry, and tertiary industry output value totaled RMB722 billion, RMB872 billion,

and RMB155 billion, respectively. Forestry output value in the ten provinces in East China totaled RMB821 billion, six
provinces in Middle China totaled RMB371 billion, 12 provinces in West China totaled RMB358 billion, and the three
provinces in Northeast China totaled RMB198 billion. Guangdong, Fujian and Zhejiang Provinces rank as the top three
provinces with the highest forestry output value.
Figure 2 China’s Forestry Output Value (2006-2009)
(Source: State Forestry Administration)
Labor availability and increasing costs constricting wood processing sector
According to Post’s site visits to Guangdong Province, the largest wood manufacturer in China, the increasing labor cost
and reducing labor availability are the major industry concerns. Many workers were dismissed during the recession in 2008
and early 2009, but when the market picked up in late 2009, many factories found they could not re-hire enough workers,
especially skilled workers. Meanwhile, labor prices have increased significantly. Industry sources noted that the labor cost
of furniture manufacturing increased 20 percent since mid-2009. Chinese industry voices concern that China’s low-cost
advantage is fading with the increasing costs for labor, land, environment protection, energy, and RBM appreciation.
China’s log and lumber production to increase moderately
China’s log production is estimated at 68 million cubic meters in 2010, a five percent increase from 65 million cubic meters
in 2009. China’s log production is expected to continue to moderately increase in coming years with the improvement in
logging policy and better forest management as a result of the forestry property rights reform. China’s lumber production is
estimated at 35 million m3 in 2010, a ten percent increase from the 32 million m3 in 2009, driven by the increasing demand
from processing sectors. Industry is expecting the increasing demand for lumber production because it is more cost
effective to ship.
Record-high wood-based panel production questioned

According to SFA statistics, China’s wood-based panel production reached a record high of 115 million m3 in 2009, a 23
percent increase from 2008 (see table 2 below for production of plywood, fiberboard, and particleboard). However, experts
question the data since the industry had very difficult time in the first half year of 2009, when many wood-based panel
factories closed or suspended production due to the very bearish market demand. Although the market started to pick up in
the second half year of 2009, industry experts do not believe the total production in 2009 was a record high.
Some industry experts attributed the questionable data to double counting of block board and plywood production. SFA’s
statistics listed four categories: plywood, fiberboard, particle board, and other wood-based panels. SFA categorizes the
block board in “other wood-based panels”. The industry, however, categorizes block board in plywood, which may have
resulted in the duplicate calculation. For example, Company A produced 100 m3 plywood, which included 30 m3 block
board, for an actual total production of. 100 m3. However, the total production in SFA’s statistics is 130 m3, because
plywood and block board are not in the same category. Industry experts indicated that this difference in is a long-standing
one, but the statistical error from the difference became more and more visible with the rapid increase of block board
production.
Although SFA’s statistics are questioned by the industry, there is no industry data available at the current time with which
to compare against the government data. Based on various industry contacts and sources, Post estimates China’s wood-
based panel production at 95 million cubic meters in 2009, similar to the 94 million cubic meters in 2008. Industry contacts
indicated that the export rebound and rosy domestic housing market in the second half year of 2009 helped to make up some
loses of the first half year of 2009.
Fiberboard and particleboard production expected to expand
Industry believes that more and more of China’s panel production will shift to fiberboard and particleboard from plywood
due to their competitive prices. As the largest global consumer of panel products, China’s furniture sector is becoming
more and more price-sensitive, as a result of the fierce competition both from international and domestic markets. After the
export decline in 2008-2009, more and more furniture manufacturers started to explore domestic markets to spread risk. To
reduce costs, more and more furniture manufacturers use fiberboard and particleboard as a substitute for plywood and use
domestically produced plywood as substitute of imported plywood in high-end furniture manufacturing. Industry sources
indicated that fiberboard and particleboard now account for over 60 percent of furniture’s panel consumption in Guangdong
province.
China’s panel production is concentrated in East China, in which production in Jiangsu, Henan, Shandong, Hebei, Guangxi,
Fujian, Anhui and Guangdong provinces accounts for over 75 percent of total production.
China’s wood flooring production impacted by GOC’s housing policies
To curb real estate speculation in urban areas with soaring housing prices, the GOC launched several policies to cool down
the property market in April 2010. These policies included: requesting a hike in down payments and loan rates on second
homes; a temporary hold on loans for the purchase of third homes; and a hold on all loans to borrowers from outside regions
who cannot provide proof of a year or more of local tax or social insurance payment. Industry observers claimed this was
“the strictest regulation to date” to deal with soaring prices and speculation. Official statistics revealed that property sales in
Beijing and Shanghai decreased 55 and 70 percent respectively from April to May of 2010, although the prices were still
high.

Industry contacts noted that the significant decline of property sales in cities would translate into a declining demand for
wood flooring. As opposed to furniture, wood flooring has no market in rural areas. Therefore, the flooring industry is
concerned that wood flooring production will decline in 2010 as a result of China’s new property policy and be coupled
with declining demand for exports.
According to SFA’s statistics, China’s wood flooring production totaled 378 million square meters, similar to the 377
million square meters in 2008. Solid wood flooring declined 34 percent from 2008, due to its uncompetitive prices versus
laminate and engineered flooring. As “low-carbon” products, laminate and engineered flooring are more popular than solid
wood flooring with the improvement of consumers’ environmental awareness. Zhejiang province is the largest wood
flooring producer in China, accounting for 19 percent of total production in 2009.
Figure 3. China’s Wood Flooring Production in 2009
(Source: 2009 Forestry Statistics by State Forestry Administration)
Domestic demand will drive wood furniture production
After ten years of rapid expansion driven by export demand, China’s wood furniture producers are paying more attention to
the domestic market, especially after the export strike in 2008 and 2009. Post’s market intelligence reveals that many
export-oriented manufacturers have started to explore domestic markets, which represent potentially great untapped
opportunity for this sector.
In addition to traditional furniture manufacturing centers, such as Guangdong, Zhejiang and Fujian provinces, new furniture
manufacturing bases are emerging, such as Jiangxi, Anhui and Sichuan provinces. The latter provinces are mainly
producing middle and low end furniture to meet the great demand from China’s ongoing urbanization and rural
development. When the export-oriented manufacturers begin to explore the domestic market, the cities with highest
disposable income represent the best opportunities. China’s furniture export value accounted for about 1/3 of the industry
output value in the past three years; the share is expected to decline as the domestic market grows.
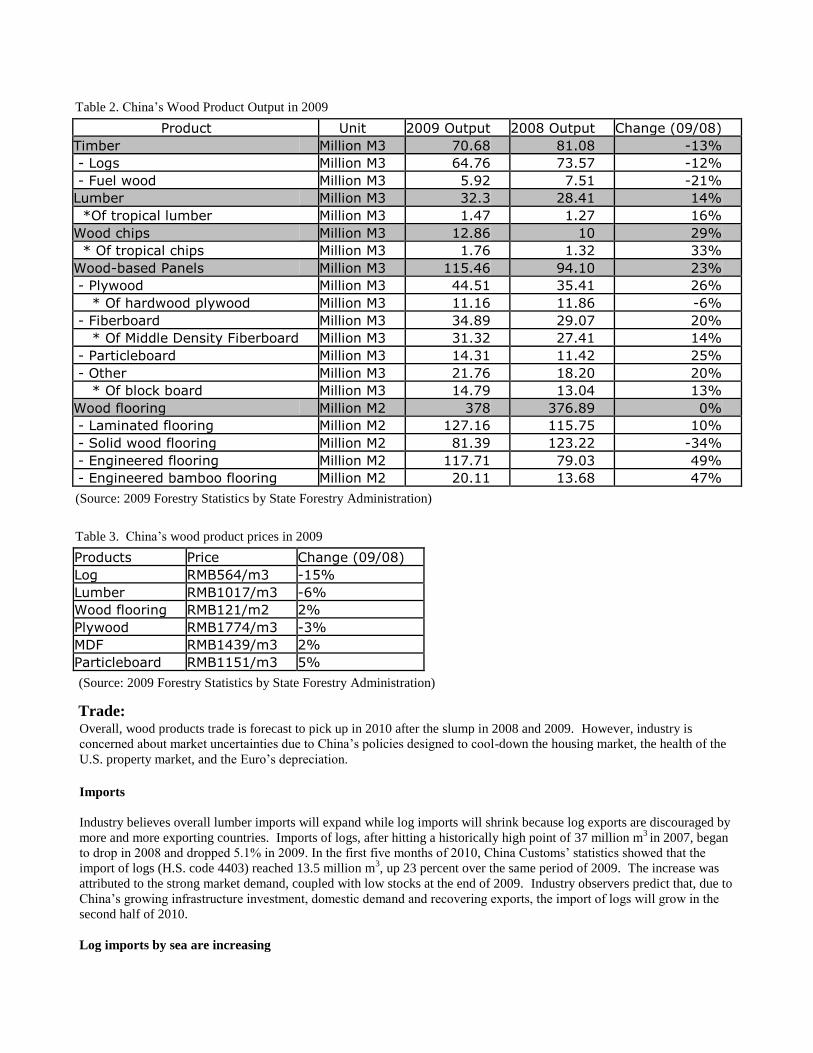
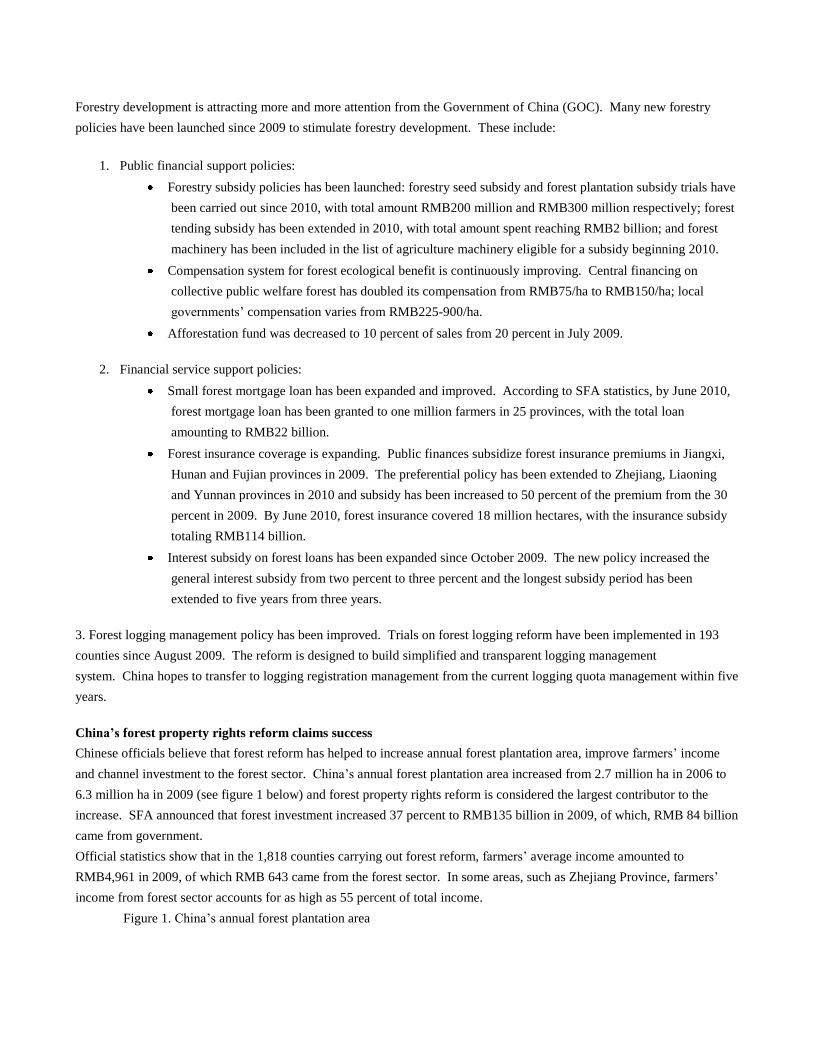
Table 2. China’s Wood Product Output in 2009
Product Unit 2009 Output 2008 Output Change (09/08)
Timber Million M3 70.68 81.08 -13%
- Logs Million M3 64.76 73.57 -12%
- Fuel wood Million M3 5.92 7.51 -21%
Lumber Million M3 32.3 28.41 14%
*Of tropical lumber Million M3 1.47 1.27 16%
Wood chips Million M3 12.86 10 29%
* Of tropical chips Million M3 1.76 1.32 33%
Wood-based Panels Million M3 115.46 94.10 23%
- Plywood Million M3 44.51 35.41 26%
* Of hardwood plywood Million M3 11.16 11.86 -6%
- Fiberboard Million M3 34.89 29.07 20%
* Of Middle Density Fiberboard Million M3 31.32 27.41 14%
- Particleboard Million M3 14.31 11.42 25%
- Other Million M3 21.76 18.20 20%
* Of block board Million M3 14.79 13.04 13%
Wood flooring Million M2 378 376.89 0%
- Laminated flooring Million M2 127.16 115.75 10%
- Solid wood flooring Million M2 81.39 123.22 -34%
- Engineered flooring Million M2 117.71 79.03 49%
- Engineered bamboo flooring Million M2 20.11 13.68 47%
(Source: 2009 Forestry Statistics by State Forestry Administration)
Table 3. China’s wood product prices in 2009
Products Price Change (09/08)
Log RMB564/m3 -15%
Lumber RMB1017/m3 -6%
Wood flooring RMB121/m2 2%
Plywood RMB1774/m3 -3%
MDF RMB1439/m3 2%
Particleboard RMB1151/m3 5%
(Source: 2009 Forestry Statistics by State Forestry Administration)
Trade: Overall, wood products trade is forecast to pick up in 2010 after the slump in 2008 and 2009. However, industry is
concerned about market uncertainties due to China’s policies designed to cool-down the housing market, the health of the
U.S. property market, and the Euro’s depreciation.
Imports
Industry believes overall lumber imports will expand while log imports will shrink because log exports are discouraged by
more and more exporting countries. Imports of logs, after hitting a historically high point of 37 million m3 in 2007, began
to drop in 2008 and dropped 5.1% in 2009. In the first five months of 2010, China Customs’ statistics showed that the
import of logs (H.S. code 4403) reached 13.5 million m3, up 23 percent over the same period of 2009. The increase was
attributed to the strong market demand, coupled with low stocks at the end of 2009. Industry observers predict that, due to
China’s growing infrastructure investment, domestic demand and recovering exports, the import of logs will grow in the
second half of 2010.
Log imports by sea are increasing

According to China Timber Distribution Association, logs from Russia are declining while log imports from Oceania and
North America are increasing. The log imports by sea increased to 63 percent of the total trade in the five months of 2010
from the 36 percent in 2005. As a result, oil price and freight cost will have a larger influence on log prices. As for logs
from Russia, there are increasing amounts of Russian logs from Far East area shipped by sea to ports, such as Taicang
(Jiangsu Province) and Lanshan (Shandong Province), which are closer to processing factories in Yangtze River Delta and
Pear River Delta.
Figure 4. China’s log imports transportation percentage
(Source: China Timber Distribution Association)
Softwood Logs: China’s softwood log imports in 2010 are forecast to increase by 10 percent, to 22 million m3, as a result
of the soaring radiata pine imports from New Zealand. Although Russia still is the largest softwood log supplier to China,
its market share declined to 68 percent in 2009 from 91 percent in 2007. In comparison, New Zealand’s market share
increased to 22 percent in 2009 from five percent in 2007. In addition to the competitive prices, industry attributed the
soaring New Zealand radiata pine imports to its use in expanded applications. Radiata pine is now not limited to packaging
material; it has been used in manufacturing of windows, furniture, plywood, and decoration. Although Russia announced
in late December 2009 that it will maintain the current export tariff for logs until January 1, 2011 (Please refer to RS1003
for updated information of Russia’s tariff policy), the uncertainty of Russia's export tariff policy has encouraged Chinese
importers to explore new suppliers, which represents great market opportunities for other softwood suppliers, such as New
Zealand, Australia, the United States, and Canada.
Figure 5. China’s softwood log import prices (June 2009-May 2010)
(Source: China Customs)
Hardwood logs: Although China’ hardwood log imports in the first five months of 2010 increased 44 percent to 4.3
million m3, industry attributed the significant increase to the very low imports during the same period of 2009. It is
predicted that China’s import of hardwood logs will drop in the future as more softwoods are used in construction and
interior decoration and emerging engineered wood products substitute for hardwood ones. In addition, the shrinking
hardwood log supply, especially tropical hardwood logs, has pushed prices higher. Papua New Guinea, Salomon Islands,
and Gabon are major tropical hardwood suppliers to China, accounting for over 60 percent of China’s hardwood log
imports. Gabon is expected to restrict log exports in the near future, while the forested area in Papua New Guinea and
Salomon Islands decreases annually by 1.7 percent and 0.5 percent, respectively. Industry experts believe that China’s
tropical hardwood log imports are unsustainable and this has encouraged the shift to softwoods and other temperate
hardwoods.
Lumber imports increased significantly
In 2009, about and 85 percent of the U.S. lumber exported to China was hardwood lumber.
Softwood lumber: China’s softwood lumber imports are forecast to increase 30 percent in 2010 and 20 percent in 2011,
driven by the demand from the construction market and low-end furniture/flooring manufacturing. Although Russia is the
largest softwood lumber supplier to China, its market share is declining. Softwood lumber imports from Canada increased
significantly in 2009, from 615,239 m3 in 2007 to 2,408,284 m3, and its market share increased from 21 percent in 2007 to
38 percent. Spruce-Pine-Fir (SPF) lumber is the largest contributor to the increase. Canadian SPF has been widely used in
China’s construction market due to its very competitive prices.
Hardwood lumber : China’s hardwood lumber imports in 2010 are forecast to increase 40 percent as a result of the growth
of exports of wood furniture and wood flooring. Thailand replaced the United States as the largest hardwood lumber
supplier to China in 2008. Hardwood lumber (H.S. code 440799) imports from Thailand increased to 966,132 m3 in 2009
from 651,628 m3 in 2007. In comparison, imports from the United States declined from 676,073 m3 in 2007 to 402,032
m3 in 2009. The industry attributes the soaring imports from Thailand to the popularity of rubber wood in furniture
processing. Rubber has been widely used in solid wood furniture processing due to its competitive price.
Export
Industry is “cautiously optimistic” about China’s wood product exports China’s wood product exports are forecast to increase 10 percent in 2010 thanks to the recovery of the global
economy. However, the industry is only “cautiously optimistic” about the market. Although the global economy is
picking up, they believe it is still fragile in terms of the wood products market. The unsteady U.S. property market and
Euro’s depreciation have brought potential threats to China’s wood product exports, especially the exports of wood
flooring and furniture. In addition, the uncertainty of the GOC’s export rebate policy worries the industry. The profit
margin of China’s wood processing sectors is generally very low, which highlights the importance of the rebate to
exporters. To encourage exports in 2010, the GOC increased rebate rate for wood furniture (H.S. code:
940330,940340,940350 and 940360) and plywood (H.S. code 4412) to 15 percent and 9 percent, respectively. The
industry worries that rebate rate for wood processing products would be reduced with the export recovery, as the GOC
classifies wood processing sectors as resource-consuming and low value-added.
Export-oriented enterprises of wood-based panels and wood floorings were more vulnerable to the downturn.
Marketing: Environmental Friendliness is a Fashion
“Low-carbon economy” has become a very hot word in China in 2010 and the wood industry is no exception.
Manufacturers began to adopt the word “low-carbon” frequently in their marketing strategies and promotion materials.
In recent years, Chinese consumers are increasingly concerned about the environmental friendliness of the wood materials
they use in interior decoration. Although solid wood products continually enjoy popularity and loyalty in high-end
markets, technology advancement and solid wood veneer development have narrowed the gap between wood products
made by solid wood, laminated wood and engineered wood in terms of presentation, comfortableness and environmental
friendliness, hence making the latter more popular with consumers in China.
The largest purchasers of engineered wood products remain institutional buyers like hotels, restaurants and offices, but
some individual consumers are turning to engineered wood products for interior decoration. Products enjoying an improved
environmental friendliness, such as E1 or E0 grade with more diversified styles and more competitive prices, are popular.
Further to the efforts to research and development of technologies that can control formaldehyde content and other health
risks in their products, manufacturers began to advocate the concept of “low-carbon processing” and “low-carbon retail” in
early 2010, aiming to save energy, reduce carbon dioxide released by their operations, and raise their corporate reputations
with the public.
Wood processing industry is seeking cost control
Currently there are over 140,000 wood processing enterprises in China, and private enterprises account for over 80 percent
of the total. Geographically, the majority of wood products processors are located in eastern and southeastern China. In the
recent two years, the wood processing industry is moving gradually from the Pearl River Delta and Yangtze River Delta to
northern and western China, to lower certain costs of production.
The new locations of manufacturing are widely separated. Inner Mongolia has emerged as a new wood processing center.
Heilongjiang province has attracted many famous wood products manufacturers, including An Xin Floors, Nature Floors,
Lacquer Craft and Ikea, to build plants there. In 2009, Chengdu from Sichuan province became the largest frameless
furniture manufacturing bases in China, with over 3,000 furniture manufacturers and a total industry output of US$ 5
billion. Meanwhile, Suqian and Hai’an of Jiangsu province, Rizhao of Shandong province, Zhangwu of Liaoning province
and the New Economic Zone of Tianjin are also developing robust wood manufacturing centers.
Domestic Market Retains Upward Trend

Domestic demand has been growing fast, especially after the Chinese government kicked off an economic stimulus plan
with an investment of $ 588 billion in 2009, which was mostly used on infrastructure construction projects. This initiative
injected great energy into the slack real estate industry, which realized sales of 937 million m2 of housing last year, an
increase of 42% over 2008. The strongly rebounded real estate market promoted the demand for North American pine,
New Zealand and Chilean radiata pine for use as wood building structures, and drove increasing consumption of interior
decoration materials and furniture.
The Chinese government decided to slow down the “overheated” real estate industry and issued a series of policies,
including increasing down payments for mortgage loan in early 2010, and the policies might slow down the increase of
demand for furniture and flooring products in 2010. However, a large volume of housing projects for low-income urban
households have been launched in 2010, so it is forecasted the domestic market for wood products will retain upward trend
in general.
New Opportunities in Rural Markets
New Distribution Channels Developed
For wood logs and lumber, wholesale markets remain the most important distribution channel for medium or small-
sized processors and interior decoration companies in China. Large construction projects and manufacturers,
though, prefer to directly purchase from wood manufacturers and importers.
Finished consumer wood products (floorings and furniture) targeted at domestic markets are mainly further
distributed through professional building material markets and specialized showrooms for urban consumers.
Construction material superstores such as B&Q and furniture retail superstores such as Red Star Macalline and
Jisheng Wellborn play a dominant role in distributing mid- to high-end wood products.
E-business is emerging as an increasingly important distribution channel for both wood raw materials and finished
wood products. Shanghai Tianqi International, which began the concept of “Online Marketing” for veneer
products, is a successful model. Tianqi started marketing their products online in 2001, and by 2009 built a nation-
wide veneer retail network with import & export value amounting to US$ 10 million.
For consumer products such as furniture, B2B, B2C and C2C E-business have all been developing. There are three
E-business models for furniture distribution. One is the on-line platforms such as Tao Bao, which already had over
10,000 furniture stores by mid-2010. The second category is the furniture distributors’ on-line stores, such as Red
Star Macalline, and Orient Home. The third category is on-line stores built up by famous brands including Qumei
Modern Furniture, Quanyou Furniture, Royal Furniture, and Ximengbao Furniture.
E-business contributed to the business growth and distribution cost control of furniture manufacturers and
distributors. Qumei, for example, used to have a 2,000 m2 demo area in each of its 600 outlets in China, but since
it launched its on-line store in Oct 2009, it reduced the demo area to around 200 m2 per store. Customers may
check and experience the furniture at display and place orders online to Qumei’s centralized manufacturing site.
Through the first half of 2010, Qumei’s E-business sales have taken 30-40% of the total online sales in 1st tier
cities and nearly 50% in 2nd
tier cities.
On-line shopping enjoys a lot of popularity among younger consumers who need to purchase furniture sets when
they get married and have become the key segment of consumers for the furniture business. Many on-line
furniture stores took advantage of the convenient communication platform provided by E-business and organize
incentive schemes for “group purchasing” to encourage large quantity orders. Some famous brands admitted that
E-business contributes an important part to their business growth, and encouraged by this, many furniture

manufacturers set up E-business Departments to further cater to this new trend in furniture distribution.
U.S. exporter opportunities
Post forecasts that over the long term, China will continue to import raw wood materials in large volumes, though imports
will not increase at the same pace as prior to 2007. U.S. hardwood lumber, especially red oak, white oak, yellow poplar,
and red alder, enjoy a good reputation for consistent quality in the China market. With its reviving real estate market, the
U.S. will remain one of China’s most important export markets. In addition, the growing demand in the domestic market
for better-quality decorative materials will also help ensure that U.S. hardwood have good prospects in the China market.
Urbanization and economic development in China is driving the demand for higher value-added wood-based panels, such
as MDF, Oriented Strand Board (OSB), and Laminated Veneer Lumber (LVL). U.S. treated softwood products and
softwood plywood that can be used as construction materials and veneer will also face a rising demand in the China market.
Further education on U.S. hardwood and softwood applications in housing structure, interior decorations and furniture
manufacturing are needed to influence city planners, architects and designers. With the increased incomes, Chinese
consumers are more attracted to trendy lifestyle elements, new technologies and healthy products to improve their life
quality. High quality and innovative U.S. products are in a good position to cater to this increasingly sophisticated demand
in China.
Production, Supply and Demand Data Statistics :
Table 1. Softwood Logs PS&D Table
Country China, Peoples Republic of
Commodity Softwood Logs 1000 CUBIC METERS
2009 Revised 2010 Estimate 2011 Forecast
USDA
Official
[Old]
Post
Estimate
[New]
USDA
Official
[Old]
Post
Estimate
[New]
USDA
Official
[Old]
Post
Estimate
[New]
Market Year
Begin 01-2009 01-2010 01-2011
Production 20800 19430 21500 20400 0 21500
Imports 15800 20300 16000 22000 0 24000
TOTAL SUPPLY 36600 39730 37500 42400 0 45500
Exports 0 0 0 0 0
Domestic
Consumption 36600 39730 37500
42400 0
45500
TOTAL
DISTRIBUTION 36600 39730 37500
42400 0
45500
Table 2. Temperate Hardwood logs PS&D Table
Country China, Peoples Republic of
Commodity Temperate Hardwood Logs 1000 CUBIC METERS
2009 Revised 2010 Estimate 2011 Forecast
USDA
Official
[Old]
Post
Estimate
[New]
USDA
Official
[Old]
Post
Estimate
[New]
USDA
Official
[Old]
Post
Estimate
[New]
Market Year 01-2009 01-2010 01-2011

Begin
Production 45000 41450 46000 43500 0 45700
Imports 2870 2140 3000 2400 0 2400
TOTAL SUPPLY 47870 43590 49000 45900 0 48100
Exports 0 0 0 0 0 0
Domestic
Consumption 47840
43590 49000
45900 0
48100
TOTAL
DISTRIBUTION 47870
43590 49000
45900 0
48100
Table 3. Tropical Hardwood Logs PS&D Table
Country China, Peoples Republic of
Commodity Tropical Hardwood Logs 1000 CUBIC METERS
2009 Revised 2010 Estimate 2011 Forecast
USDA
Official
[Old]
Post
Estimate
[New]
USDA
Official
[Old]
Post
Estimate
[New]
USDA
Official
[Old]
Post
Estimate
[New]
Market Year
Begin 01-2009 01-2010 01-2011
Production 4200 3880 4500 4100 0 4200
Imports 5330 5625 5500 6000 0 5700
TOTAL SUPPLY 9530 9505 10000 10100 0 9900
Exports 0 0 0 0 0 0
Domestic
Consumption 9530
9505 10000 10100 0 9900
TOTAL
DISTRIBUTION 9530
9505 10000 10100 0 9900
Table 4. Softwood Lumber PS&D Table
Country China, Peoples Republic of
Commodity Softwood Lumber 1000 CUBIC METERS
2009 Revised 2010 Estimate 2011 Forecast
USDA
Official
[Old]
Post
Estimate
[New]
USDA
Official
[Old]
Post
Estimate
[New]
USDA
Official
[Old]
Post
Estimate
[New]
Market Year
Begin 01-2009 01-2010 01-2011
Production 11500 12324 12600 13600 0 14900
Imports 4550 6344 5400 8250 0 9900
TOTAL SUPPLY 16050 18668 18000 21850 0 24800
Exports 150 198 200 150 0 200
Domestic
Consumption 15900 18470 17800 21700 0 24600
TOTAL 16050 18668 18000 21850 0 24800

DISTRIBUTION
Table 5. Temperate Hardwood Lumber PS&D Table
Country China, Peoples Republic of
Commodity Temperate Hardwood Lumber 1000 CUBIC METERS
2009 Revised 2010 Estimate 2011 Forecast
USDA
Official
[Old]
Post
Estimate
[New]
USDA
Official
[Old]
Post
Estimate
[New]
USDA
Official
[Old]
Post
Estimate
[New]
Market Year
Begin 01-2009 01-2010 01-2011
Production 17200 18500 19000 20400 0 22400
Imports 1200 1375 1250 1900 0 2300
TOTAL SUPPLY 18400 19875 20250 22300 0 24700
Exports 300 339 350 350 0 380
Domestic
Consumption 18100 19536 19900 21950 0 24320
TOTAL
DISTRIBUTION 18400 19875 20250 22300 0 24700
Table 6. Tropical Hardwood Lumber
Country China, Peoples Republic of
Commodity Tropical Hardwood Lumber 1000 CUBIC METERS
2009 Revised 2010 Estimate 2011 Forecast
USDA
Official
[Old]
Post
Estimate
[New]
USDA
Official
[Old]
Post
Estimate
[New]
USDA
Official
[Old]
Post
Estimate
[New]
Market Year
Begin 01-2009 01-2010 01-2011
Production 1300 1474 1400 1600 0 1750
Imports 1560 2165 1600 2800 0 3200
TOTAL SUPPLY 2860 3639 3000 4400 0 4950
Exports 15 19 20 20 0 20
Domestic
Consumption 2845 3620 2980 4380 0 4930
TOTAL
DISTRIBUTION 2860 3639 3000 4400 0 4950