Embed Size (px)
Citation preview

2
© 2008 International Institute for Sustainable Development (IISD) Published by the International Institute for Sustainable Development The International Institute for Sustainable Development contributes to sustainable development by advancing policy recommendations on international trade and investment, economic policy, climate change, measurement and assessment, and natural resources management. Through the Internet, we report on international negotiations and share knowledge gained through collaborative projects with global partners, resulting in more rigorous research, capacity building in developing countries and better dialogue between North and South. IISD’s vision is better living for all—sustainably; its mission is to champion innovation, enabling societies to live sustainably. IISD is registered as a charitable organization in Canada and has 501(c)(3) status in the United States. IISD receives core operating support from the Government of Canada, provided through the Canadian International Development Agency (CIDA), the International Development Research Centre (IDRC) and Environment Canada; and from the Province of Manitoba. The institute receives project funding from numerous governments inside and outside Canada, United Nations agencies, foundations and the priate sector. International Institute for Sustainable Development 161 Portage Avenue East, 6th Floor Winnipeg, Manitoba Canada R3B 0Y4 Tel: +1 (204) 958–7700 Fax: +1 (204) 958–7710
Click here to enter text.
China’s Electrical Power Sector, Environmental Protection and Sustainable Trade
Song Hong Aaron Cosbey Matthew Savage
December 2009
China’s Electrical Power Sector, Environmental Protection and Sustainable Trade i
© 2009 International Institute for Sustainable Development (IISD) Published by the International Institute for Sustainable Development The International Institute for Sustainable Development contributes to sustainable development by advancing policy recommendations on international trade and investment, economic policy, climate change, measurement and assessment, and natural resources management. Through the Internet, we report on international negotiations and share knowledge gained through collaborative projects with global partners, resulting in more rigorous research, capacity building in developing countries and better dialogue between North and South. IISD’s vision is better living for all—sustainably; its mission is to champion innovation, enabling societies to live sustainably. IISD is registered as a charitable organization in Canada and has 501(c)(3) status in the United States. IISD receives core operating support from the Government of Canada, provided through the Canadian International Development Agency (CIDA), the International Development Research Centre (IDRC) and Environment Canada, and from the Province of Manitoba. The institute receives project funding from numerous governments inside and outside Canada, United Nations agencies, foundations and the private sector. International Institute for Sustainable Development 161 Portage Avenue East, 6th Floor Winnipeg, Manitoba Canada R3B 0Y4 Tel: +1 (204) 958–7700 Fax: +1 (204) 958–7710 Email: [email protected] Website: www.iisd.org
China’s Electrical Power Sector, Environmental Protection and Sustainable Trade
Song Hong Aaron Cosbey Matthew Savage December 2009
This paper is produced as part of the Sustainable China Trade Project. The project is a joint effort of IISD and the Development Research Centre of the State Council of China, with research jointly conducted by Chinese and international experts. It seeks to help define the characteristics of a sustainable trade strategy for China—a strategy that helps contribute to environmental, social and economic improvements, primarily in China but also globally. Such an outcome is in line with the scientific concept of development first put forward at the 16th National Congress of the Communist Party of China in 2003, and with many of the goals of the 11th Five-Year Plan. The project will produce a series of eight working papers focusing on specific aspects of a sustainable trade strategy for China and a synthesized volume covering the body of work. The Sustainable China Trade Project is generously supported by the Swiss Agency for Development Cooperation.
China’s Electrical Power Sector, Environmental Protection and Sustainable Trade ii
Table of contents List of acronyms ................................................................................................................................................. 1
1.0 Introduction ........................................................................................................................................... 2
2.0 Linking the electricity sector to sustainability ................................................................................... 3
3.0 The present situation in China ............................................................................................................ 7
3.1 Scale and efficiency of China’s electrical power sector ................................................................................................. 7
3.2 Effects of the power industry on the environment ..................................................................................................... 12
3.3 Legal framework for environmental protection in China’s power sector ................................................................ 17
3.4 Policy instruments for environmental protection in China’s power sector ............................................................. 20
4.0 Best practices, current trends and lessons from international experience .................................. 29
4.1 Typology of relevant efficiency and low-carbon policies and measures in the electricity sector ........................ 29
4.2 International best practices in efficient and low-carbon electricity policy ............................................................... 31
4.2.1 Economic instruments ........................................................................................................................................................ 32
4.2.1.1 Removal of subsidies for carbon-intensive fuels .............................................................................................................. 32
4.2.1.2 Carbon and energy taxes .............................................................................................................................................. 32
4.2.1.3 Tradable emission permits ............................................................................................................................................. 33
4.2.1.4 Fiscal measures and capital grants ................................................................................................................................ 34
4.2.1.5 Feed-in tariffs ............................................................................................................................................................... 34
4.2.1.6 Quota obligations (renewable energy standards) with tradable certificates ....................................................................... 35
4.2.2 Regulatory instruments ....................................................................................................................................................... 36
4.2.2.1 Minimum efficiency standards and best available technologies ........................................................................................ 36
4.2.2.2 Fuel portfolio standards ................................................................................................................................................ 37
4.2.2.3 National targets ........................................................................................................................................................... 37
4.2.2.4 Grid access for distributed and remote low-carbon technologies ....................................................................................... 37
4.2.3 Other policies and measures ............................................................................................................................................... 38
4.2.3.1 Voluntary agreements ................................................................................................................................................... 38
4.2.3.2 Information and education ............................................................................................................................................ 38
4.2.3.3 Research and development investment ............................................................................................................................ 39
4.3 Application to the Chinese policy context .................................................................................................................... 39
5.0 Policy options for China ..................................................................................................................... 41
References ......................................................................................................................................................... 43

China’s Electrical Power Sector, Environmental Protection and Sustainable Trade 1
List of acronyms
CCS carbon capture and storage EU ETS European Union Emission Trading System GHG greenhouse gas OECD Organisation for Economic Co-operation and Development SDRC State Development and Reform Commission
China’s Electrical Power Sector, Environmental Protection and Sustainable Trade 2
1.0 Introduction
One of the goals of China’s 11th Five-Year Plan is to transform the growth pattern of the country’s foreign trade, moving from extensive growth to intensive growth. This will involve a movement up the value chain, away from labour-intensive production toward increasing added value. To some extent this transformation will happen naturally as China develops, but it can be hastened by deliberate policies of investing in increased capacity for innovation, focusing on education, research and development. The transformation also involves a movement away from energy- and pollution-intensive production methods. This kind of change is less likely to happen naturally and will depend critically on the creation of an enabling policy environment. The situation calls for an appropriate mix of tools, using the best of command-and-control, market-based and non-regulatory instruments in a manner that is suited to the Chinese context. Fortunately China has the rich experience of other countries to draw on; Organisation for Economic Co-operation and Development (OECD) countries have in effect conducted experiments for decades with environmental regulatory and non-regulatory instruments, and the lessons learned from those experiments will allow China to avoid other countries’ mistakes and capitalize on their successes. In this paper we analyze international experiences with instruments for environmental performance and those instruments’ relevance to a sustainable Chinese trade strategy, using the electricity sector as a case study.1
We first explore the linkages between a sustainable trade strategy for China and regulatory initiatives in the electricity sector, and ask what the empirical and theoretical evidence tells us about the impacts of such initiatives on competitiveness. We then describe the current situation in China with respect to the electrical power sector and the legal and regulatory framework that governs it. Next, we survey some of the international experience with various policy tools for achieving goals such as energy security, energy efficiency and environmental protection. Finally, we conclude with policy options relevant to the Chinese experience.
1 In the Chinese government’s classification of economic activities, the power sector refers to the industries that produce and supply electric power and heating. It includes the power production, power supply, and heat production and supply subsectors. This paper focuses on the electric power subsectors only.
China’s Electrical Power Sector, Environmental Protection and Sustainable Trade 3
2.0 Linking the electricity sector to sustainability
The electricity sector in China has a number of important linkages to sustainability in general, and in particular to a sustainable trade strategy for the country. It is, in the first place, critically important because of its environmental impacts. Globally, energy production and use is responsible for over 60 per cent of all greenhouse gas (GHG) emissions. Within China, generation of electricity is a significant contributor to pollution and environmental degradation. We estimate below that China’s thermal energy production results in the annual emission of 15.4 million tonnes of sulphur dioxide (one of the principal causes of acid rain) and 2.8 billion tonnes of carbon dioxide (almost half of China’s total carbon dioxide emissions). In the production of both pollutants, China is now a global leader (though on a per capita basis its emissions are far below those of developed countries). Guan, Peters, Weber and Hubacek (2009) estimate that fully half of China’s increase in carbon dioxide emissions between 2002 and 2005 was tied to its exports, and most of those emissions derive from the power used to produce those goods. Electricity also underpins China’s industrial sector; industrial users in 2006 accounted for 74.3 per cent of total electricity consumption. This significant reliance presents both threats and opportunities. The threats come from the prospect that any costly policies and measures adopted for the electricity sector will likely have negative impacts on large segments of the economy, at least initially. Unlike sectors that engage in a large amount of international trade or have close substitutes, the electricity sector will be able to pass through most of any cost increase to its customers (Reinaud, 2008). The opportunities are linked to policies or measures that can deliver electricity more cheaply, whether through energy efficiency, improved transmission efficiencies or other measures, and can lower costs for electricity-using firms and increase competitiveness. A large body of work tries to estimate the competitiveness impacts of national environmental regulation. The intuitive view, supported by theory, predicts that regulation imposes costs that are reflected through reduced investment, industrial relocation and increased trade imbalances. An opposing view, championed by Porter and van der Linde (1995), argues that regulation forces firms to become more efficient and, thus more competitive, particularly as compared to firms in unregulated jurisdictions. The landmark survey of empirical evidence on the question was carried out by Jaffe, Peterson, Portney and Stavins (1995, p. 157), who found that “overall, there is relatively little evidence to support the hypothesis that environmental regulations have had a large adverse effect on competitiveness, however that elusive term is defined.” A number of other analysts reached similar conclusions.2
2 See, for example, Low and Yeats (1992); Tobey (1990); McConnell and Schwab (1990); Lucas, Wheeler, and Hettige (1992); Birdsall and Wheeler. (1993); Eskeland and Harrison (1997).

China’s Electrical Power Sector, Environmental Protection and Sustainable Trade 4
Other determining factors include proximity to markets, availability of natural resource inputs, labour costs, quality of human resources, political risks, macroeconomic stability, adequate legal regimes (including intellectual property rights, contract law, investment law and an independent judiciary), infrastructure (communications, energy, transportation) and other considerations. The verdict seemed to be that costs of complying with environmental regulations were simply too small relative to these other factors to have much competitiveness impact. More recent studies, however, have criticized the early work on fundamental methodological grounds. Several exhaustive surveys3
of the research detail the various problems with that body of work, including:
• Because most studies used cross-sectional data rather than panel data, they were unable to control for characteristics specific to particular sectors and countries—differences that might have explanatory power for the different investment and location decisions (called the problem of unobserved heterogeneity). Such characteristics might include, for example, a link between dirty industries and natural resource use (meaning a reluctance to move away from those resources4) or a sector’s high transport costs (meaning manufacturing can’t move too far away from markets5
• A related problem is that many studies aggregated industry figures to calculate overall responsiveness to environmental policies. To the extent this is done, it masks the presence of strong pollution-haven effects in particularly vulnerable sectors.
), and would result in underestimated pollution-haven effects for those sectors.
• Most studies assumed that environmental policy was exogenously determined. But if there is some way in which abatement costs are linked to environmental policy (that is, policy-makers set tougher standards for big polluters and more lenient standards for insignificant ones), then if there is a pollution-haven effect, it will be to some extent offset by these linkages and will be underestimated (the so-called problem of endogeneity).
A rich body of work in the last 10 years or so has corrected for these problems in various ways and has consistently found a statistically significant pollution-haven or competitiveness effect.6
The bottom line seems to be that while on average there is no significant effect, some sectors can be strongly impacted. These tend to be sectors with high energy costs and highly polluting firms, such as aluminum smelting or iron and steel production.
3 See, in particular, Brunnermeier and Levinson (2004); Copeland and Taylor (2004) and Levinson and Taylor (2004). 4 Such an effect is found in Ederington, Levinson & Minier (2003). 5 The cement sector is an obvious example. 6 For surveys of this body of work see Brunnermeier and Levinson (2004); Copeland and Taylor (2004); Levinson and Taylor (2004); Taylor (2004) and SQW Ltd. (2006).
China’s Electrical Power Sector, Environmental Protection and Sustainable Trade 5
Confirmation for these findings comes from another line of research, which seeks to identify the competitiveness impacts of climate policies specifically—policies that mimic the types of regulations this paper considers, since they would raise the cost of thermal-generated electricity. These studies are useful in the context of this paper because they typically seek to identify both direct costs of the regulations and indirect costs, which are attributable only to increases in the cost of electricity. Most of this work focuses on the competitiveness impacts of the European Union Emission Trading System (EU ETS), introduced in January 2005. These studies indicate that only some sectors and subsectors within European industry are susceptible to any significant loss of competitiveness (Reinaud, 2008; Hourcade, Demailly, Neuhoff & Sato, 2007; Bruyn, Nelissen, Korteland, Davidson, Faber & van de Vreede, 2008). These include lime, cement and clinker kilns; primary aluminum smelters; integrated steel mills and electric arc furnace ovens; and certain chemicals, and costs for those among them that are the worst hit can increase by as much as 8 per cent. Studies from Australia (CISA, 2008) and the United States (Morgenstern, Aldy, Herrnstadt, Ho & Pizer, 2007; Aldy & Pizer, 2009) point to a similar set of sectors and subsectors, and to similar impacts. But indirect costs are typically much lower than total costs, and these are the ones that are most relevant if we are interested in the impacts of electrical sector regulation. Hourcade et al. (2007), modelling policies that they assumed would mean an electricity price increase of 10 euros per megawatt-hour, found that in the United Kingdom only four sectors had potential indirect impacts that equalled more than 4 per cent of gross value added: aluminum (9 per cent), other inorganic basic chemicals (5.7 per cent), fertilizers and nitrogen (5.3 per cent), and industrial gases (4.3 per cent). These sectors accounted for less than 0.2 per cent of the United Kingdom’s GDP. In the end, these results suggest that broad competitiveness impacts as a result of electrical sector regulation are probably not likely, and that significant impacts would be limited to a few highly energy-intensive sectors. On the other hand, a number of environmental policies for the energy sector exist that would not be costly. Energy efficiency of production and transmission, for example, typically end up having negative costs, with short payback times and positive returns on investment. These sorts of policies would increase the competitiveness of downstream industries that rely on electrical power. Even for the sorts of regulations that are costly, stringent regulation in the electricity sector has a number of significant potential benefits. The so-called co-benefits of decreasing China’s reliance on coal, for example, are enormous, and include significant potential public health benefits from clean air, increased energy security and an improved balance of payments. Stringent regulation in the area of energy also leads to increased exports of environmental goods in the clean energy sector as firms innovate in response to new, tighter rules, and then export the products of their innovation

China’s Electrical Power Sector, Environmental Protection and Sustainable Trade 6
(Constantini & Crespi, 2008). This is widely touted as evidence in support of the Porter hypothesis: strict regulation breeds greater efficiency and innovation, which actually results in an improved competitive position for regulated firms. Finally, efforts to steer China down a low-carbon energy path could pay off for China’s exports more broadly. In both the European Union and the United States, there are efforts to legislate the use of trade measures that would discriminate at the border on the basis of embedded carbon (Wooders, Reinaud & Cosbey 2009), and any policies that lowered China’s emissions from manufacturing processes would provide a shield against targeting by such measures. Such policies would also provide ammunition to academics and others who argue that China’s performance on climate change and other forms of pollution is in fact proactive and powerful (Zhang, 2008). In the end, this would impact on the so-called Brand China, and may thereby benefit China’s exports and facilitate outward investment. The links that connect energy policy, and electricity in particular, to a sustainable trade policy are clear, if complex. As described above, they include both risks and opportunities. The electricity sector is thus a useful case to consider, as it demonstrates that trade policy in a globalized world also involves policies that are not directly related to trade. In constructing a sustainable trade strategy for China, policy-makers cannot avoid the need to broaden their focus to include areas like energy policy, which have a clear impact on the final effectiveness of any such strategy.
China’s Electrical Power Sector, Environmental Protection and Sustainable Trade 7
3.0 The present situation in China
This section will describe the current status of China’s electrical power sector. It will first discuss the scale and efficiency of the various elements of the industry, and will then look at the environmental impacts of current electrical power sector activities. Finally, it will describe the existing legal and regulatory framework for the governance of the electrical power sector and the types of policy instruments currently used.
3.1 Scale and efficiency of China’s electrical power sector
By the end of 2007 the installed capacity of China’s power industry had reached 713 gigawatts, up 14.4 per cent from 2006. Over the past five years China’s installed capacity has increased by 71,000 megawatts per year, with an annual growth of 25 per cent, a miracle of power development both in China and around the world. China’s per capita installed capacity also increased, from 0.3 kilowatt in 2002 to 0.54 kilowatt in 2007, an increase of 80 per cent, and up to 11 times more than the 0.05 kilowatts China produced per capita in 1980, when the reform in the power industry began. China’s installed power capacity has ranked second in the world since 1996, just behind the United States. In 2006 the United States’ installed capacity amounted to 1,076 gigawatts, and per capita installed capacity reached 3.6 kilowatts. Thus, the per capita installed capacity of the United States is nearly seven times that of China. In 2006 Japan’s installed capacity amounted to 26 gigawatts, and per capita installed capacity reached 2 kilowatts, up to almost 4 times that of China. South Korea’s installed capacity was approximately 65 gigawatts, and per capita installed capacity reached 1.33 kilowatts, up to 2.4 times that of China. Installed hydropower capacity in China has reached 145 gigawatts, up 11.5 per cent over 2006 (see Table 1). Seven power-generating units of the Three Gorges Power Station were put into operation in 2007, with power-generation capacity of up to 14.8 gigawatts. In recent years construction has begun at many hydroelectric projects, such as Longtan, Xiaowan, Goupitan, Pubugou, Jinping, Laxiwa, Xiangjiaba and Xiluodu, some of which are already operating. The Xiluodu Power Station was opened in the Jinsha River Valley on November 8, 2007. China’s thermal power capacity was 554 gigawatts in 2007, up 14.6 per cent over 2006, but the growth rate had dropped by 9 per cent. This significant slowdown should, over time, improve what has in the past been an excessive trend of continuously growing installed thermal power capacity, and so we expect a more optimized power structure to appear gradually in the near future.

China’s Electrical Power Sector, Environmental Protection and Sustainable Trade 8
In 2007 China’s installed nuclear power capacity reached 8.9 gigawatts when the two 1-gigawatt nuclear power generating units at the Tianwan Nuclear Power Station were put into operation. The same year, China’s wind power capacity made breakout progress, and other new forms of energy production grew steadily as well. The total nationwide installed wind power capacity reached 4 gigawatts, an increase of 94.4 per cent over the previous year. The new capacity added in 2007 was almost equivalent to the total sum in all previous years. In terms of power production and supply, China grew very quickly in 2007 (see Table 2). China’s power production reached 3.2 million gigawatt-hours, up 14.9 per cent over the previous year; of this, hydropower accounted for 434,000 gigawatt-hours, an increase of 15.41 per cent; thermal power produced 2.7 million gigawatt-hours, an increase of 14.62 per cent; and nuclear power accounted for 62,000 gigawatt-hours, an increase of 16.26 per cent. In the past five years, China’s power production grew from 1.654 million gigawatt-hours in 2002 to 3.256 million in 2007, with a mean annual growth rate of 19 per cent. Over the same period, per capita power production increased from 1,474 kilowatt-hours to 2,449 kilowatt-hours, a total increase of 975 kilowatt-hours, representing a mean annual increase of approximately 200 kilowatt-hours. A significant gap exists between China and other countries with respect to per capita power production. For example, the United States’ power production in 2006 was 4.065 million gigwatt-hours, or 13,550 kilowatt-hours per person, 5.5 times the 2007 per capita production of China.7
Japan’s 2006 total power production was 1.077 million gigawatt-hours, or 8,451 kilowatt-hours per person, 3.5 times that of China. South Korea produced 391,000 gigawatt-hours in 2006, or 7,995 kilowatt-hours per person, 3.3 times China’s production.
China’s power consumption per unit of GDP is higher than that of more-developed countries. In 2006 China produced 2.834 million gigawatt-hours of power, and its GDP reached 20.9 trillion yuan, equivalent to US$2.7 trillion, making the country’s power consumption up to 10,508 kilowatt-hours per US$10,000 of GDP. But the United States’ total power production in 2006 was 4.070 million gigawatt-hours, and the country’s GDP reached US$13.2 trillion, resulting in power consumption of up to 3,078 kilowatt-hours per US$10,000. Thus, China’s power consumption based on GDP is 3.4 times that of the United States. It is also 4.79 times that of Japan and 2.07 times that of South Korea, respectively, showing a bigger gap with the developed countries. Some of this gap is undoubtedly due to China’s economic structure, which has a much smaller service sector than most developed economies. But in any case, China still has a long way to go in power development and conservation.
7 Data from 2007 were not available for other countries besides China; therefore, here and below we compare 2007 data from China to 2006 data from other countries.
China’s Electrical Power Sector, Environmental Protection and Sustainable Trade 9
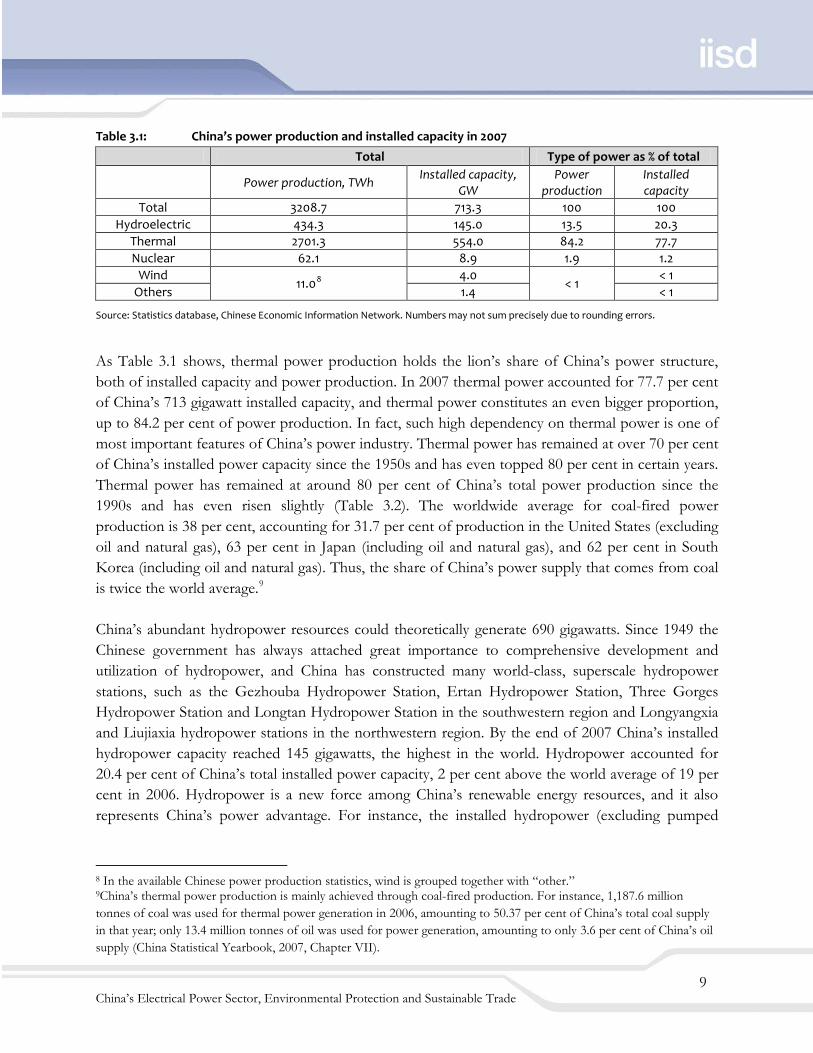
Table 3.1: China’s power production and installed capacity in 2007
Total Type of power as % of total
Power production, TWh Installed capacity,
GW Power
production Installed capacity
Total 3208.7 713.3 100 100 Hydroelectric 434.3 145.0 13.5 20.3
Thermal 2701.3 554.0 84.2 77.7 Nuclear 62.1 8.9 1.9 1.2
Wind 11.08 4.0
< 1 < 1
Others 1.4 < 1
Source: Statistics database, Chinese Economic Information Network. Numbers may not sum precisely due to rounding errors.
As Table 3.1 shows, thermal power production holds the lion’s share of China’s power structure, both of installed capacity and power production. In 2007 thermal power accounted for 77.7 per cent of China’s 713 gigawatt installed capacity, and thermal power constitutes an even bigger proportion, up to 84.2 per cent of power production. In fact, such high dependency on thermal power is one of most important features of China’s power industry. Thermal power has remained at over 70 per cent of China’s installed power capacity since the 1950s and has even topped 80 per cent in certain years. Thermal power has remained at around 80 per cent of China’s total power production since the 1990s and has even risen slightly (Table 3.2). The worldwide average for coal-fired power production is 38 per cent, accounting for 31.7 per cent of production in the United States (excluding oil and natural gas), 63 per cent in Japan (including oil and natural gas), and 62 per cent in South Korea (including oil and natural gas). Thus, the share of China’s power supply that comes from coal is twice the world average.9
China’s abundant hydropower resources could theoretically generate 690 gigawatts. Since 1949 the Chinese government has always attached great importance to comprehensive development and utilization of hydropower, and China has constructed many world-class, superscale hydropower stations, such as the Gezhouba Hydropower Station, Ertan Hydropower Station, Three Gorges Hydropower Station and Longtan Hydropower Station in the southwestern region and Longyangxia and Liujiaxia hydropower stations in the northwestern region. By the end of 2007 China’s installed hydropower capacity reached 145 gigawatts, the highest in the world. Hydropower accounted for 20.4 per cent of China’s total installed power capacity, 2 per cent above the world average of 19 per cent in 2006. Hydropower is a new force among China’s renewable energy resources, and it also represents China’s power advantage. For instance, the installed hydropower (excluding pumped
8 In the available Chinese power production statistics, wind is grouped together with “other.” 9China’s thermal power production is mainly achieved through coal-fired production. For instance, 1,187.6 million tonnes of coal was used for thermal power generation in 2006, amounting to 50.37 per cent of China’s total coal supply in that year; only 13.4 million tonnes of oil was used for power generation, amounting to only 3.6 per cent of China’s oil supply (China Statistical Yearbook, 2007, Chapter VII).
China’s Electrical Power Sector, Environmental Protection and Sustainable Trade 10
storage10
) of the United States—the world’s largest power consumer—amounted to only 77.4 gigawatts in 2006, half that of China; hydropower in the United States accounted only for 7.9 per cent of its installed power capacity, 12 per cent lower than in China.
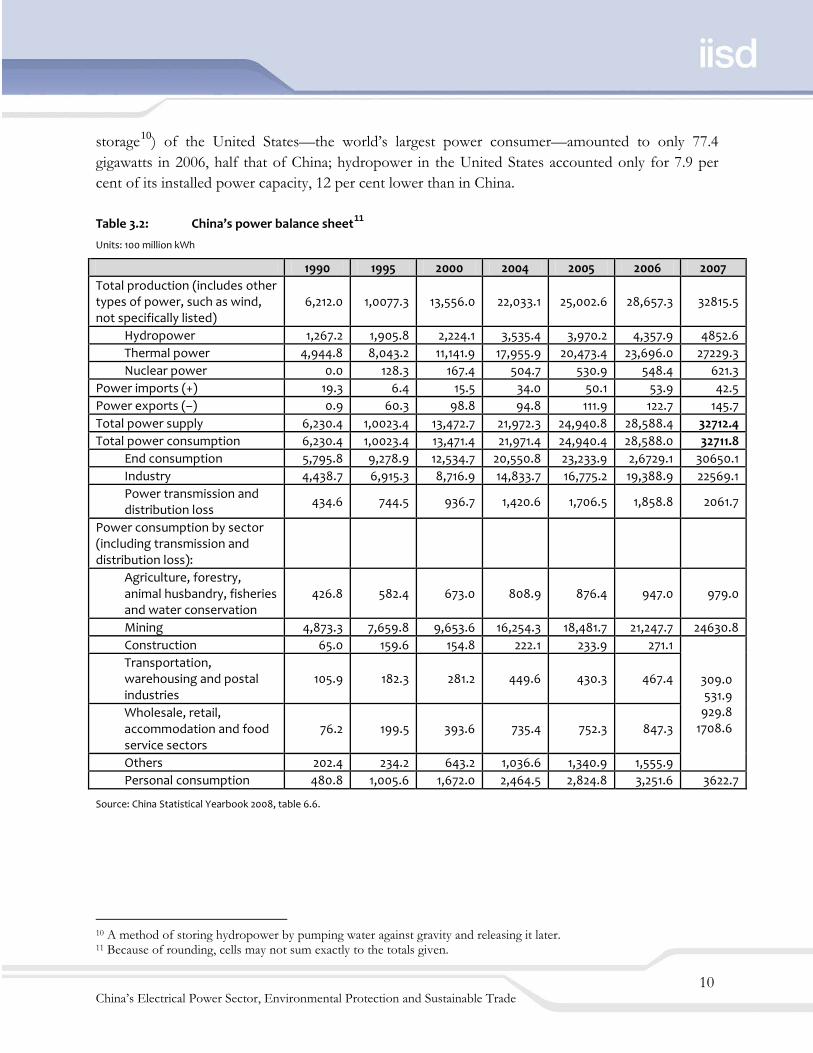
Table 3.2: China’s power balance sheet11 Units: 100 million kWh
1990 1995 2000 2004 2005 2006 2007 Total production (includes other types of power, such as wind, not specifically listed)
6,212.0 1,0077.3 13,556.0 22,033.1 25,002.6 28,657.3 32815.5
Hydropower 1,267.2 1,905.8 2,224.1 3,535.4 3,970.2 4,357.9 4852.6 Thermal power 4,944.8 8,043.2 11,141.9 17,955.9 20,473.4 23,696.0 27229.3 Nuclear power 0.0 128.3 167.4 504.7 530.9 548.4 621.3
Power imports (+) 19.3 6.4 15.5 34.0 50.1 53.9 42.5 Power exports (–) 0.9 60.3 98.8 94.8 111.9 122.7 145.7 Total power supply 6,230.4 1,0023.4 13,472.7 21,972.3 24,940.8 28,588.4 32712.4 Total power consumption 6,230.4 1,0023.4 13,471.4 21,971.4 24,940.4 28,588.0 32711.8
End consumption 5,795.8 9,278.9 12,534.7 20,550.8 23,233.9 2,6729.1 30650.1 Industry 4,438.7 6,915.3 8,716.9 14,833.7 16,775.2 19,388.9 22569.1 Power transmission and distribution loss 434.6 744.5 936.7 1,420.6 1,706.5 1,858.8 2061.7
Power consumption by sector (including transmission and distribution loss):
Agriculture, forestry, animal husbandry, fisheries and water conservation
426.8 582.4 673.0 808.9 876.4 947.0 979.0
Mining 4,873.3 7,659.8 9,653.6 16,254.3 18,481.7 21,247.7 24630.8 Construction 65.0 159.6 154.8 222.1 233.9 271.1
309.0 531.9
929.8 1708.6
Transportation, warehousing and postal industries
105.9 182.3 281.2 449.6 430.3 467.4
Wholesale, retail, accommodation and food service sectors
76.2 199.5 393.6 735.4 752.3 847.3
Others 202.4 234.2 643.2 1,036.6 1,340.9 1,555.9 Personal consumption 480.8 1,005.6 1,672.0 2,464.5 2,824.8 3,251.6 3622.7
Source: China Statistical Yearbook 2008, table 6.6.
10 A method of storing hydropower by pumping water against gravity and releasing it later. 11 Because of rounding, cells may not sum exactly to the totals given.

China’s Electrical Power Sector, Environmental Protection and Sustainable Trade 11
China’s nuclear power construction began in the 1980s. The Qinshan Nuclear Power Station, in Zhejiang Province, is the first nuclear power station designed and constructed by China. A 288-megawatt pressurized water reactor unit was installed in the first phase. The Daya Bay nuclear power station, commissioned in 1994, was the first pressurized water reactor nuclear power station in China, which was entirely imported, with two reactors, each with an installed capacity of 984 megawatts. At the end of 2007 China’s installed capacity of nuclear power reached 8.85 gigawatts, accounting for 1.2 per cent of total installed power capacity. As of 2006, 442 nuclear power stations were operating worldwide, with a total installed capacity of 370 gigawatts, accounting for 16 per cent of the world’s total installed power capacity. Thus, the proportion of China’s installed power capacity that comes from nuclear power is 15 percentage points lower than the world average. To optimize the power structure, realize energy savings and emission reductions, save fossil energy resources and increase the power supply, China formulated the Renewable Energy Law in 2005, aimed at encouraging market players to invest actively in non-fossil energy resources such as wind, solar, hydropower, bioenergy and wave power. China also promulgated a special price policy and established a wind power price subsidy fund to support the development of wind power. In recent years China’s wind power has made rapid progress. Under the 11th Five-Year Plan, China’s installed wind power capacity will reach 5 gigawatts, thirty large (100 megawatts and above) wind power projects will be completed, and several 1-gigawatt wind power bases will be constructed in provinces such as Inner Mongolia, Hebei, Jiangsu and Gansu. This goal is likely to be realized two years ahead of schedule. Influenced by the threat of global climate change, various countries, especially the developed countries, started an upsurge of new energy exploitation and construction in order to minimize the effects of fossil energy on the atmosphere and optimize the energy structure. For example, during 2005 and 2006 the installed capacity of wind power in the United States increased at a rate of 30 per cent annually; at the end of 2006 the installed wind power capacity in the United States reached 16.8 gigawatts, accounting for 1.7 per cent of the country’s total installed capacity. Some reports also indicate that more than 5 gigawatts of wind power were put into operation in 2007 in the United States. Zou (2008) have estimated that by the end of 2009, the United States will surpass Germany to become the largest wind power producer in the world, and the price of wind power will decline from its 1990s price of US$0.38 per kilowatt-hour to between US$0.04 and US$0.06, in tandem with the large-scale industrialization of wind power in the United States. As far as power transmission, at end of 2007 transmission lines carrying 220 kilovolts and above reached 327,000 kilometres in China, the capacity of China’s substations reached 1,144 million kilovolt-amperes, transregional power transmission increased from 20,700 gigawatt-hours in 2002 to 120,700 gigawatt-hours in 2007, and interprovincial power exchange grew from 80,400 gigawatt-hours in 2002 to 144,500 gigawatt-hours in 2006. Those changes show that the power grid has been
China’s Electrical Power Sector, Environmental Protection and Sustainable Trade 12
optimized to some extent. The power grid has grown at a rate of nearly 10 per cent annually since end of the 10th Five-Year Plan, and investment in power grid construction reached 245.1 billion yuan in 2007, an increase of 20.7 per cent over the previous year. China’s power industry is excessively reliant on coal. High coal demand and the vast land area of China, which stretches more than 2,000 kilometres from north to south, makes coal transportation and supply a particular challenge for China’s power supply. For instance, the train from Yangquan, Shanxi Province, takes two to three days to arrive at the coastal areas in Guangdong Province. The capacity of both road and rail transport has become saturated. If China does not accelerate the process of adjusting its power structure, instead building up more coal-fired power projects in the southeastern coastal regions, coal transportation will meet great difficulty in the event of serious natural disasters. Events such as the January 2008 coal shortage, caused by heavy snowfall, will likely reoccur. The strong coal demand will also create tension in the coal supply. China consumed 1.143 billion tonnes of coal for power generation in 2006 and 1.282 billion tonnes in 2007, an increase of 139 million tonnes, or 12 per cent. In the same two years, China’s coal production grew more than 8 per cent, and in 2007 China’s raw coal yield increased only by 143 million tonnes. The increase in coal consumption of 139 million tonnes for power generation was coupled with growing demand for coal for the production of steel, iron, petrochemicals and additional coal exports.
3.2 Effects of the power industry on the environment
The power industry is typically a pollution-intensive industry. It produces a lot of industrial waste gas, waste water and solid waste. In 2006 China’s power and heat production and supply industries accounted only for 7.6 per cent of the value of China’s industry, but accounted for 59.0 per cent, 44.8 per cent and 0.19 per cent, respectively, of the emissions of sulphur dioxide, industrial soot and industrial dust. It also produced 10.4 per cent of the emissions of industrial waste water and 20.2 per cent of all industrial solid waste (Table 3.3).

China’s Electrical Power Sector, Environmental Protection and Sustainable Trade 13
Table 3.3: Emissions of industrial airborne pollutants, waste water and solid waste by industry, 2006, as percentages of total for all industry in China
Industry Added value
Sulphur dioxide
Soot Dust Waste water
Solid waste
Coal mining and dressing 3.94 0.71 1.57 2.44 2.60 13.62 Oil and natural gas exploitation 6.57 0.15 0.13 0.04 0.54 0.08 Ferrous-metal mining and dressing
0.65 0.26 0.22 0.51 0.74 9.63
Non-ferrous-metal mining and dressing
0.74 0.48 0.28 0.28 2.03 12.91
Non-metal minerals mining and dressing
0.42 0.27 0.67 1.12 0.47 0.82
Other minerals mining 0.00 0.01 0.04 0.03 0.04 0.08 Agricultural by-product processing
3.83 0.82 2.08 0.10 4.54 1.02
Food processing 1.61 0.51 0.65 0.03 2.07 0.25 Beverages 1.58 0.57 1.14 0.03 2.69 0.57 Tobacco 2.61 0.07 0.09 0.03 0.14 0.03 Textiles 4.35 1.48 1.60 0.08 9.51 0.48
Clothing, shoes and hats 2.01 0.10 0.14 0.01 0.66 0.05
Leather, furs, down and related products
1.29 0.09 0.13 0.03 0.98 0.04
Timber processing, including wood, bamboo, rattan, palm and grass
0.75 0.23 0.48 0.21 0.25 0.09
Furniture 0.55 0.01 0.05 0.01 0.04 0.02
Paper and paper products 1.52 2.10 2.70 0.17 18.00 1.12
Printing and reproduction of media
0.61 0.01 0.03 0.00 0.06 0.01
Cultural, educational and sports products
0.51 0.00 0.01 0.06 0.04 0.00
Oil processing, coking and nuclear fuel processing 2.54 3.24 4.75 2.52 3.38 1.25
Chemical materials and chemical manufacturing
5.93 5.46 6.59 2.42 16.15 7.15
Pharmaceutical manufacturing 1.99 0.36 0.58 0.03 2.07 0.18 Chemical fibre manufacturing 0.66 0.65 0.59 0.03 2.38 0.26 Rubber manufacturing 0.79 0.23 0.23 0.01 0.29 0.07 Plastics manufacturing 1.83 0.10 0.09 0.00 0.16 0.03 Non-metal mineral products manufacturing
4.01 9.14 15.80 70.16 2.07 2.97
Ferrous-metal smelting and pressing
7.69 7.32 9.38 15.74 7.53 20.52
Non-ferrous-metal smelting and pressing
3.51 3.40 1.94 1.95 1.57 3.90
Metal products manufacturing 2.44 0.20 0.28 0.17 1.08 0.16

China’s Electrical Power Sector, Environmental Protection and Sustainable Trade 14
Industry Added value
Sulphur dioxide
Soot Dust Waste water
Solid waste
Universal equipment manufacturing
4.17 0.26 0.36 0.51 0.60 0.14
Special equipment manufacturing
2.52 0.11 0.23 0.03 0.55 0.10
Transportation equipment manufacturing
5.42 0.19 0.45 0.35 1.24 0.40
Electrical machinery and equipment manufacturing
5.07 0.05 0.09 0.01 0.40 0.03
Communication devices, computers and other electronics manufacturing
7.78 0.09 0.08 0.10 1.15 0.08
Instrumentation, culture and office equipment manufacturing
1.06 0.08 0.08 0.00 0.38 0.03
Crafts and other manufacturing 0.77 0.02 0.03 0.04 0.11 0.01 Waste resources and materials recycling and processing 0.10 0.00 0.01 0.03 0.02 0.03
Power and heat production and supply
7.59 58.97 44.74 0.19 10.44 20.51
Gas production and supply 0.21 0.10 0.19 0.03 0.16 0.08 Water production and supply 0.35 0.02 0.01 0.00 0.95 0.01 Other industries 0.00 2.13 1.48 0.51 1.92 1.24
Source: China Statistical Yearbook 2007, Chapters 12 and 14.
Coal-fired power makes up a relatively high share of China’s power structure, aggravating the environmental impact of the power industry in China. Worldwide in 2006, coal-fired power accounted for 41 per cent of installed power capacity, hydropower for 19 per cent, nuclear for 16 per cent, natural gas for 15 per cent, oil for 16 per cent and others for 1 per cent. The installed capacity of coal-fired power in China, however, has always remained over 70 per cent since 1949, and reached 78 per cent in 2006, almost twice the global average of 41 per cent (International Energy Agency [IEA], 2007). Correspondingly, China’s nuclear power, natural gas power and utilization of new energy resources are far below the world averages. Coal-fired power generation has significant environmental impacts. First, coal-fired power generation requires a large amount of water and generates much waste water. We estimate that water for the power industry, especially for thermal power, accounts for 40 per cent of China’s industrial water use. In 2006, 10.4 per cent of China’s industrial wastewater emissions originated from the power industry. Second among the environmental impacts of coal is the fact that extensive coal mining itself causes environmental pollution. Coal consumption for electrical generation in China reaches over one
Table 3.3 continued
China’s Electrical Power Sector, Environmental Protection and Sustainable Trade 15
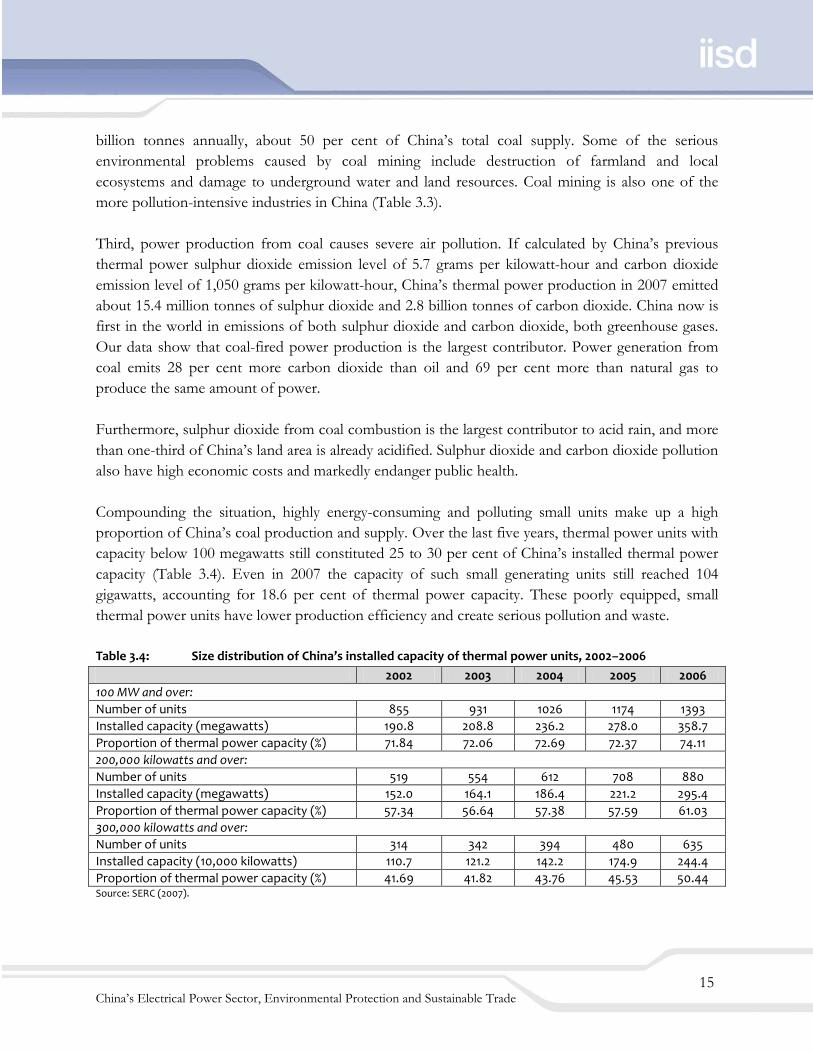
billion tonnes annually, about 50 per cent of China’s total coal supply. Some of the serious environmental problems caused by coal mining include destruction of farmland and local ecosystems and damage to underground water and land resources. Coal mining is also one of the more pollution-intensive industries in China (Table 3.3). Third, power production from coal causes severe air pollution. If calculated by China’s previous thermal power sulphur dioxide emission level of 5.7 grams per kilowatt-hour and carbon dioxide emission level of 1,050 grams per kilowatt-hour, China’s thermal power production in 2007 emitted about 15.4 million tonnes of sulphur dioxide and 2.8 billion tonnes of carbon dioxide. China now is first in the world in emissions of both sulphur dioxide and carbon dioxide, both greenhouse gases. Our data show that coal-fired power production is the largest contributor. Power generation from coal emits 28 per cent more carbon dioxide than oil and 69 per cent more than natural gas to produce the same amount of power. Furthermore, sulphur dioxide from coal combustion is the largest contributor to acid rain, and more than one-third of China’s land area is already acidified. Sulphur dioxide and carbon dioxide pollution also have high economic costs and markedly endanger public health. Compounding the situation, highly energy-consuming and polluting small units make up a high proportion of China’s coal production and supply. Over the last five years, thermal power units with capacity below 100 megawatts still constituted 25 to 30 per cent of China’s installed thermal power capacity (Table 3.4). Even in 2007 the capacity of such small generating units still reached 104 gigawatts, accounting for 18.6 per cent of thermal power capacity. These poorly equipped, small thermal power units have lower production efficiency and create serious pollution and waste. Table 3.4: Size distribution of China’s installed capacity of thermal power units, 2002–2006
2002 2003 2004 2005 2006 100 MW and over: Number of units 855 931 1026 1174 1393 Installed capacity (megawatts) 190.8 208.8 236.2 278.0 358.7 Proportion of thermal power capacity (%) 71.84 72.06 72.69 72.37 74.11 200,000 kilowatts and over: Number of units 519 554 612 708 880 Installed capacity (megawatts) 152.0 164.1 186.4 221.2 295.4 Proportion of thermal power capacity (%) 57.34 56.64 57.38 57.59 61.03 300,000 kilowatts and over: Number of units 314 342 394 480 635 Installed capacity (10,000 kilowatts) 110.7 121.2 142.2 174.9 244.4 Proportion of thermal power capacity (%) 41.69 41.82 43.76 45.53 50.44 Source: SERC (2007).

China’s Electrical Power Sector, Environmental Protection and Sustainable Trade 16
Compared with large power-generation units, small thermal power units are highly inefficient. For example, 600-megawatt supercritical units consume only 299 grams of standard coal to produce one kilowatt-hour of electricity, but 50-megawatt units consume as much as 450 grams of coal to produce the same amount. In other words, small generating units consume more than 50 per cent more coal than big modern generating units to produce the same amount of power. Of the over 1.3 billion tonnes of coal consumed by China’s power industry in 2007, small generation units (100 megawatts or below) used about 0.4 billion tonnes. Small generating units are also more polluting than large ones. In 2006 the power industry emitted over 14 million tonnes of sulphur dioxide, accounting for over half of total emissions, of which thermal power units of 100 megawatts and below were responsible for 5.4 million tonnes. In other words, small power units produced about 39 per cent of the sector’s sulphur dioxide emissions while producing less than 26 per cent of its power. Emissions from small thermal power units also include numerous nitrogen oxide compounds, soot, dust and solid waste. In short, the annual coal consumption for China’s small thermal power units, which can generate 104 gigawatts, is approximately 110 million tonnes more than that of big units of the same generating capacity, resulting in additional emissions of 220 million tonnes of carbon dioxide every year. Thus, it’s urgently required that China shut down small thermal power units, promote a clean approach to development of the power industry and improve the country’s ability to respond to climate change. Because coal-fired power is still a mainstay of the Chinese power supply and cannot reach zero emissions, the environmental impact of China’s power industry will continue to increase. More seriously, a big gap still exists between China and developed countries with respect to the efficiency of the power industry. More pollution will occur if China’s energy resources are not fully utilized. For instance, China’s coal consumption for power generation is 50 to 60 grams per kilowatt-hour higher than the highest efficiency level in the rest of the world, meaning that China unnecessarily consumes about 100 million extra tonnes of standard coal for power generation every year. Power transmission loss in China is 2.0 per cent to 2.5 per cent higher than that of internationally advanced power companies, resulting in an additional power loss of 45,000 gigawatt-hours per year, an amount roughly equivalent to the annual power consumption of a province in central China. The mean water consumption of thermal power plants is 40 to 50 per cent higher than in the world’s advanced thermal power plants, resulting in additional consumption of 1.5 billion cubic metres of water per year. China’s rapid economic development presents the likelihood of even greater societal demand for power. Through energy conservation and emission reductions, China’s coal consumption per kilowatt-hour produced could decline along with emissions of sulphur dioxide. However, since
China’s Electrical Power Sector, Environmental Protection and Sustainable Trade 17
China’s total coal consumption is still growing substantially, emissions and other environmental pressures from the entire society’s coal use will further increase. The momentum needed to reduce China’s overall pollution, or even to maintain it at current levels, has yet to be achieved.
3.3 Legal framework for environmental protection in China’s power sector
The existing legal framework for environmental protection in China’s power industry comprises the following fourteen laws:
1. Environmental Protection Law of the People’s Republic of China 2. Law of the People’s Republic of China on the Prevention and Control of Atmospheric
Pollution 3. Law of the People’s Republic of China on the Prevention and Control of Water Pollution 4. Marine Environment Protection Law of the People’s Republic of China 5. Law of the People’s Republic of China on Prevention and Control of Pollution from
Environmental Noise 6. Law of the People’s Republic of China on Prevention of Environmental Pollution Caused
by Solid Waste 7. Law of the People’s Republic of China on Prevention and Control of Radioactive Pollution 8. Law of the People’s Republic of China on Water and Soil Conservation 9. Law of the People’s Republic of China on Environmental Impact Assessment 10. Cleaner Production Promotion Law of the People’s Republic of China 11. Law of the People’s Republic of China on Energy Conservation 12. Renewable Energy Law of the People’s Republic of China 13. Power Law of the People’s Republic of China 14. Energy Law of the People’s Republic of China
The basic idea and framework of China’s environmental protection policies is that the polluter pays to pollute. Within a certain range (within the permissible range of environmental capacity), the government permits firms to pollute freely. However, the polluters must pay for any emissions over this limit. The government collects the pollutant discharge fees and uses the revenues for environmental protection and research. In recent years China has tightened its environmental protection laws and standards. For example, no matter how much air pollution polluters emit, they must pay for it, while in the past the polluters paid nothing if they produced air or water pollution below the permissible level. The implementation of China’s laws and regulations requires the government to formulate the environmental quality standards and discharge standards, formulate the discharge fee packages for different types and amounts of pollutants, and collect and use the discharge fees.

China’s Electrical Power Sector, Environmental Protection and Sustainable Trade 18
The environmental protection authority of the State Council is the Ministry of Environmental Protection, which plays a key role in formulating China’s environmental quality and emission standards. Under the Environmental Protection Law, this ministry is responsible for formulating the state’s environmental quality standards; setting the national pollutant discharge standards according to the environmental quality standards and the economic and technical conditions of the country; and establishing a supervision system, formulating supervision criteria and building up a supervision network to enhance environmental supervision and management in collaboration with relevant departments and organizations. To implement the national environmental protection laws, the State Council also formulated the Administrative Regulations on the Collection and Use of Pollutant Discharge Fees. The latest version was amended and adopted on July 1, 2003, by Decree No. 369 of the State Council of the People’s Republic of China. Article 12 of the regulations requires polluters to pay pollutant discharge fees in accordance with the following provisions:
1. Under the Law on the Prevention and Control of Atmospheric Pollution and the Marine Environment Protection Law, fees for polluting the air and ocean are based on the types and quantities of pollutants.
2. Under the Law on the Prevention and Control of Water Pollution, fees for water pollution are based on the types and quantities of pollutants, but are doubled if the pollution exceeds state or local discharge standards.
3. Under the Law on Prevention of Environmental Pollution Caused by Solid Waste, fees for industrial solid waste are based on the types and quantities of pollutants if no storage or disposal facilities and sites are built for the waste or if the storage or disposal facilities and sites for industrial solid waste don’t comply with environmental protection standards. Fees for hazardous waste discharge are based on the types and quantity of pollutants if the land-filling of hazardous waste doesn’t comply with the relevant state regulations.
4. Under the Law on Prevention and Control of Pollution from Environmental Noise, discharge fees are paid according to the noise level if the pollution from environmental noise exceeds the national environmental noise standards.
These discharge fees don’t relieve the polluters of their responsibility to prevent and control pollution or to pay compensation for pollution damages, or from any of the other responsibilities they have under the various laws and administrative regulations. Under Article 11 of these regulations, the State Council’s pricing departments, financial departments, and environmental protection and economic trade authorities formulate the national discharge fees according to industrial pollution prevention and control requirements and the

China’s Electrical Power Sector, Environmental Protection and Sustainable Trade 19
economic and technical realities of the polluters. Revision of the discharge fees occurs through an advance notice system. Lower-level governments also play a crucial role in this aspect of environmental regulation. If the national standards do not specify fees, the governments of provinces, autonomous regions and municipalities that are directly under the central government may formulate local levy standards for discharge fees and report to the State Council’s pricing and financial departments and environmental protection and economic trade authorities for filing. Under Article 12 of the regulations, the national environmental protection authorities are responsible for determining and publicizing the allowable types and quantities of pollutants and the discharge fees. Article 18 specifies that the discharge fees must be included in the budget and incorporated into special environmental protection funds. The fees are mainly used for loan granting or loan interest discounts for prevention and control of key pollution resources; regional pollution prevention and control; development, demonstration and application of new pollution prevention and control technologies and techniques; and any other pollution prevention and control projects stipulated by the State Council. The State Council’s financial departments may prepare more detailed implementation methods after soliciting the opinions of the State Council’s environmental protection authorities and other concerned departments. The environmental protection laws allow the governments of provinces, autonomous regions and municipalities directly under the central government to formulate local environmental quality standards for issues not covered under the federal environmental quality standards. Provincial and municipal governments may also formulate local pollutant discharge standards for pollutants not covered by the national pollutant discharge standards or formulate stricter local pollutant discharge standards for pollutants that are covered by the national pollutant discharge standards. These standards must then be reported to the State Council’s environmental protection authority for filing. These governments may also issue regular environmental communiqués jointly with the national environment departments. China’s environmental protection laws are mainly implemented by two approaches. First, as a national economic sector, and as the major producer of air pollution, water pollution, radioactive pollution, solid waste, environmental noise, marine pollution and more, the power industry is expected to implement the relevant environmental protection laws and regulations of China.

China’s Electrical Power Sector, Environmental Protection and Sustainable Trade 20
Second, the Chinese government formulates special environmental laws for the energy and power sectors. For instance, under Section 2 of Article 30 of the Law on Energy Conservation, which covers industrial energy conservation, the State Council’s energy conservation and other relevant departments formulate technology policies to promote energy savings at the firm level within major energy-consuming industries such as power, steel and iron, non-ferrous metals, building materials, oil processing, chemicals and coal. Through Article 31, the state encourages industrial enterprises to adopt highly efficient and energy-saving motors, boilers, furnaces, fans and pumps, and to employ co-generation technology, residual heating and pressure utilization, clean coal technology and advanced energy monitoring and control technologies. Under Article 32, enterprises supplying power to the grid are also required to buy power from clean and efficient co-generation units, residual heating and pressure-generating units and other compatible generating units, with the price subject to state regulations. Article 32 is implemented under the regulations of the State Council’s relevant departments on energy conservation and power-generation scheduling management. Article 33 prohibits the construction of coal-fired power generation units, oil generation units and coal-fired thermoelectric units. Article 5 of the Electricity Law requires companies that construct, produce, supply and utilize power to protect the environment, adopt new technology, reduce harmful emissions and prevent the pollution and other hazards. The state encourages and supports the use of renewable energy resources and clean energy generation. Environmental protection in the power industry is mainly carried out through the State Electricity Regulation Commission. The power industry association is responsible for developing management methods and implementation details that are in accordance with the environmental protection laws.
3.4 Policy instruments for environmental protection in China’s power sector
The environmental protection policy instruments frequently used in China’s power sector include administrative measures, command and control measures, and economic tools. These policy measures are reflected in recent energy conservation and emission reduction actions. At the end of 2001 China’s State Environmental Protection Administration initiated the national 10th Five-Year Plan for Environmental Protection to address the grim situation of environmental protection in China. The plan proposed energy-conservation and emission-reduction goals specifying that by 2005 sulphur dioxide emissions from the power industry would be reduced by 10 to 20 per cent from 2000 levels and the average coal consumption of coal-fired power plants would drop to 15 to 20 grams per kilowatt-hour below 2000 levels.
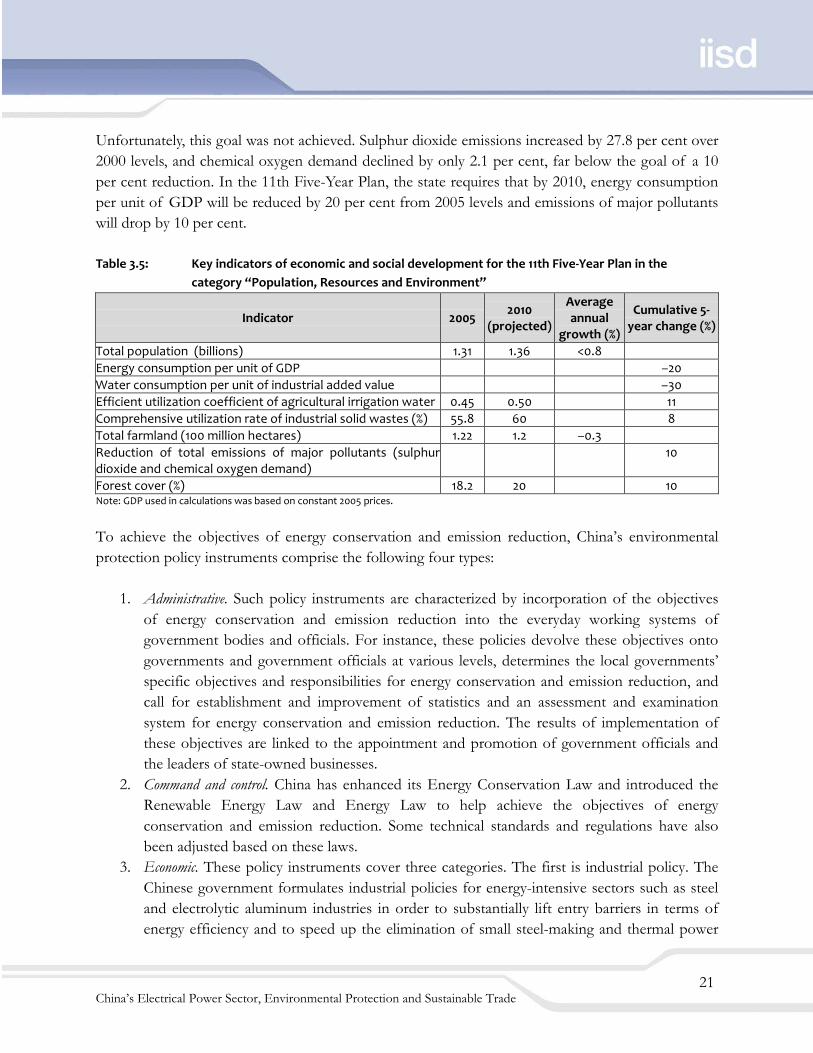
China’s Electrical Power Sector, Environmental Protection and Sustainable Trade 21
Unfortunately, this goal was not achieved. Sulphur dioxide emissions increased by 27.8 per cent over 2000 levels, and chemical oxygen demand declined by only 2.1 per cent, far below the goal of a 10 per cent reduction. In the 11th Five-Year Plan, the state requires that by 2010, energy consumption per unit of GDP will be reduced by 20 per cent from 2005 levels and emissions of major pollutants will drop by 10 per cent. Table 3.5: Key indicators of economic and social development for the 11th Five-Year Plan in the
category “Population, Resources and Environment”
Indicator 2005 2010
(projected)
Average annual
growth (%)
Cumulative 5-year change (%)
Total population (billions) 1.31 1.36 <0.8 Energy consumption per unit of GDP –20 Water consumption per unit of industrial added value –30 Efficient utilization coefficient of agricultural irrigation water 0.45 0.50 11 Comprehensive utilization rate of industrial solid wastes (%) 55.8 60 8 Total farmland (100 million hectares) 1.22 1.2 –0.3 Reduction of total emissions of major pollutants (sulphur dioxide and chemical oxygen demand)
10
Forest cover (%) 18.2 20 10 Note: GDP used in calculations was based on constant 2005 prices.
To achieve the objectives of energy conservation and emission reduction, China’s environmental protection policy instruments comprise the following four types:
1. Administrative. Such policy instruments are characterized by incorporation of the objectives of energy conservation and emission reduction into the everyday working systems of government bodies and officials. For instance, these policies devolve these objectives onto governments and government officials at various levels, determines the local governments’ specific objectives and responsibilities for energy conservation and emission reduction, and call for establishment and improvement of statistics and an assessment and examination system for energy conservation and emission reduction. The results of implementation of these objectives are linked to the appointment and promotion of government officials and the leaders of state-owned businesses.
2. Command and control. China has enhanced its Energy Conservation Law and introduced the Renewable Energy Law and Energy Law to help achieve the objectives of energy conservation and emission reduction. Some technical standards and regulations have also been adjusted based on these laws.
3. Economic. These policy instruments cover three categories. The first is industrial policy. The Chinese government formulates industrial policies for energy-intensive sectors such as steel and electrolytic aluminum industries in order to substantially lift entry barriers in terms of energy efficiency and to speed up the elimination of small steel-making and thermal power
China’s Electrical Power Sector, Environmental Protection and Sustainable Trade 22
units that have out-of-date production capabilities. The second category is research and development. China strengthens the financial support for the development and utilization of energy-saving technologies as well as improvement of relevant management systems. The third is economic measures; for example, China has established an emission trading market.
4. Voluntary. China takes resource-saving as a basic national policy and also a key element of energy policy in this new era. The country has also stepped up efforts to popularize energy conservation and emission reduction and to raise public awareness of and skills in energy conservation so as to create an energy-saving atmosphere in the entire society.
These administrative policy tools have distinct Chinese characteristics. The next part of this section will focus on how to implement these policy instruments based on the example of energy conservation and emission reduction in the power industry. In order to achieve the objectives of energy conservation and emission reductions during the period of the 11th Five-Year Plan, the Chinese government has undertaken a very important initiative: industrial restructuring. The restructuring of the power industry aims to shut down and phase out highly polluting, highly energy-consuming small thermal power plants and develop vigorously renewable energy resources. As mentioned above, thermal power units below 100 megawatts are the source of the most serious pollution and highest energy consumption in the power industry. In 2007 the State Council proposed the closure of 50 gigawatts of thermal power units during the period of the 11th Five-Year Plan, replacing them with the installed capacity of larger and more energy-saving superscale or ultra-superscale thermal power units. This means that 12 gigawatts to 13 gigawatts will be closed down annually. In 2007, the first year of this “big up/small down” strategy, the State Council put forward a conservative objective of closing down 10 gigawatts of capacity, the equivalent of a thousand 100-megawatt units. The council enacted many strong administrative policy measures to accomplish this end. First, the top leaders paid close attention and the parties concerned reached a consensus. Premier Wen Jiabao announced the objectives and measures of energy conservation and emission reduction, while the State Development and Reform Commission (SDRC)—the most powerful body in the State Council—was responsible for implementation of policies to meet these objectives. The commission set up a special big up/small down office for coordinating the work, and then published licensing measures that linked closing down small thermal power units with building big thermal power units. In this way, the approval and establishment of new big thermal power units under the control of the commission was linked to the elimination of backward small thermal power units (Guofa, 2007). This has alleviated the pressure on local government officials and business leaders, which were previously responsible for deciding whether to close down thermal power units. It also
China’s Electrical Power Sector, Environmental Protection and Sustainable Trade 23
brought the power of the (SDRC) into full play: no new projects are established until the closure objectives have been finished. Furthermore, these administrative policy measures or instruments were put into place at the same time as the directors and vice-directors of the commission were personally assuming responsibility. Second, the specific big up/small down indicators or targets were assigned to various provinces, cities or leading enterprises. For instance, the central power-generation groups played an active role in shutting down small thermal power units in 2007. Among the closed units, facilities with a total capacity of 8.8 gigawatts were closed by five central power-generation groups that held a total capacity of up to about 40 per cent of the country’s energy supply. These closures accounted for 61.1 per cent of the total capacity closed down in 2007. The remaining 38.9 per cent of capacity, totalling 5.6 gigawatts, was closed by other enterprises whose total capacity was nearly 60 per cent of the country’s energy supply. Third, those indicators or targets are used to evaluate the performance of government officials. Environmental protection indicators or targets are the keys to the promotion of government officials and leaders of state-run businesses. To achieve the objectives of energy conservation and emission reduction, including setting up big units and shutting down small units, China has used many economic policy tools as well, of which we provide three examples. First, the government cancels preferential electricity-pricing treatments for highly energy-consuming enterprises, which raises their operating costs and spurs them to take energy-conservation and emission-reduction measures. In 2007 the (SDRC) released a notice suspending the national electricity price preferential treatment for electrolytic aluminum, ferroalloy and chlor-alkali enterprises and forcing local governments to immediately stop local electricity-price preferential measures for high-energy-consuming enterprises (SDRC, 2007b). Second, the government also raises the sale price of power from thermal power plants that have been retrofitted for desulfurization. This could encourage thermal power plants to transform to protect the environment, but it also indirectly raises the cost of plants without desulfurization retrofitting. Under Article 4 of the (SDRC)’s management methods for the desulfurization price of coal-fired power generation units and the operation of desulfurization facilities, currently in trial implementation (SDRC, 2007a), the desulfurization retrofitting of existing coal-fired units is to be completed in accordance with the document SO2 Pollution Control of Existing Coal-Fired Power Plants during the 11th Five-Year Plan, released by the commission and the State Environmental Protection Agency. The price of power from facilities that have installed desulfurization equipment will be marked up by 0.015 yuan per kilowatt-hour over the existing price. For the provinces, autonomous regions and municipalities where the average sulphur content in coal is higher than 2 per cent or lower than 0.5 per cent, desulfurization price-markup standards can be formulated separately; the
China’s Electrical Power Sector, Environmental Protection and Sustainable Trade 24
provincial pricing departments may propose packages and submit them to the SDRC for review and approval. Finally, the government reduces the price of power from small thermal power plants in order to shrink the footprint of these enterprises by making them less profitable. The 2007 Notice of SDRC on Reducing the Power Sell Price of Small Thermal Power Units and Accelerating Shut-down of Small Thermal Power Units (SDRC, 2007c) encourages small thermal power units to transfer their power production quotas to efficient generating units. This regulation encourages small thermal power units closed in advance or on schedule to transfer their power production quotas to big generating units at a price that is not greater than the sell price prior to any price reduction. No price reduction is implemented for small thermal power units that have transferred their power production quotas and promised to close down. The pricing departments of the provinces, autonomous regions and municipalities work jointly with the concerned departments to formulate the methods for power producers to transfer their power production quotas from smaller to bigger units. These types of quota transfers get priority treatment. Under the provisions described in Guofa (2007), the facilities that receive price reductions include conventional thermal power with single capacity below 50 megawatts, those with a lifespan over 20 years and with single capacity below 100 megawatts, or those nearing the end of their service life and with single capacity below 200 megawatts. In terms of command-and-control policy instruments, the energy-conservation and emission-reduction concept is gradually reflected in the new amendments of laws and technical rules, as described in Section 3.3. In addition to the policies promoting the “big up/small down” transition, China has endeavoured to strongly support the development, exploitation and promotion of environmentally friendly electric power technology through science and technology policies and industrial policies aimed at vigorously boosting the development of renewable energy and optimizing the structure of the power industry. For example, China’s strong science and technology policy support led to a breakthrough in the development of supercritical and ultra-supercritical big thermal power units. The development of ultra-supercritical technology was listed in the national 863 Program’s key project plan for 2002 and the national major technical equipment development plan for 2003. To date, China has started construction on four 1-gigawatt ultra-supercritical projects totalling 10 generating units. The ultra-supercritical units are 10 per cent more efficient than the subcritical units currently used and 6 to 8 per cent more efficient than supercritical units, with coal consumption per kilowatt-hour down to 275 grams. Additionally, good results were achieved through the promotion and application of limestone/lime-gypsum wet flue-gas desulfurization technology, research on technology for dust-removing bags and equipment for large coal-fired power plants, domestic research on flue-gas desulfurization circulating pumps, and pilot research on and application of circulating fluidized bed boilers.
China’s Electrical Power Sector, Environmental Protection and Sustainable Trade 25
China has also built the world’s largest hydropower project, the Three Gorges power station, along with the world’s highest compacted concrete dam at 216.5 metres, the Longtan Dam. These major breakthroughs place China in the world’s top rank for high-dam construction technology, flood-discharge and energy-dissipation technology, large underground tunnel group construction technology, high-slope and foundation-processing technology, and giant metal structure fabrication and installation technology. Furthermore, China has rapidly improved its capabilities for design and construction of nuclear power through absorption of foreign technology and independent development. China is now capable of independently designing and manufacturing 600-megawatt pressurized-water-reactor nuclear power stations and has experience in the construction, operation and management of several nuclear power stations. All 11 nuclear power units under operation or construction in China are built with to second-generation nuclear power technology. China is making full use of its accumulated nuclear power know-how and experience, and is fully absorbing internationally advanced technology and experience while speeding up its own pace of independently designing and constructing 1-gigawatt large nuclear power units and upgrading to third-generation nuclear power. On August 18, 2007, China’s largest nuclear power project, the main facility of the Hongyanhe Nuclear Power Plant, was kicked off. The station’s four 1-gigawatt nuclear power units comprehensively adopted China’s own CPR-1000 nuclear power technology. With the use of the upgraded, second-generation technology, CNP1000 was particularly outstanding in terms of economic efficiency, marking a very important breakthrough in construction of nuclear power stations in China. The high-temperature gas-cooled reactor test nuclear power station that has already been constructed, and the fast reactor test nuclear power station that is under construction, as well as numerous research and development works on integrated nuclear steam systems and closed-type nuclear fuel-recycling systems, have strongly facilitated China’s move toward fourth-generation nuclear power utilization systems. The results from China’s research in thermonuclear fusion and its active international cooperation are also encouraging. China has already achieved indigenization of megawatt-class wind power generating units, and with the support of the national 863 Program, China is researching disc-type solar thermal power systems. In terms of research and development of photovoltaic technology, China has launched research into crystal silicon batteries, amorphous silicon film batteries, cadmium telluride, copper indium selenide and polycrystalline silicon film batteries, as well as other relevant materials. With the development of the material technology, photovoltaic power generation efficiency will improve substantially and is expected to reach 25 per cent in 2020, with the cost down to 8 yuan per watt-peak. Finally, China is studying and employing 1,000-kilovolt AC ultrahigh-voltage and ±800-kilovolt DC ultrahigh-voltage power-transmission technologies. A 750-kilovolt power-transmission pilot project
China’s Electrical Power Sector, Environmental Protection and Sustainable Trade 26
put into operation in September 2005 in the northwestern region has the highest operating voltage of any AC power transmission project in China, laying a firm basis for developing megavolt ultrahigh-voltage technology. China has drafted specifications for megavolt power-transmission equipment, while power-transmission manufacturers and research institutions have paved the way for development of independent megavolt power-transmission equipment. An ultrahigh-voltage pilot base is under construction. China also has the capability for independent design, manufacturing, construction and operation of ultrahigh-voltage DC power-transmission projects. Given the long distances and large scales involved in power transmission, China continues to strengthen the application of power-system calculation and analysis theory, power-grid stability control and world-class practical power-transmission technology, as well as conduct research on projects such as management and equipment upgrading with the purpose of improving the power grid’s transmission capability. Through years of effort, China’s power industry has made great achievements in energy conservation and greatly reduced emissions of dust, sulphur dioxide, nitrogen oxide and waste water from thermal power plants (SERC, 2007). Since 2002 China’s power-generating firms have continuously strengthened their dust emission controls, and the number of electric dust removers used in thermal power-generating units increases year by year, with continuous growth of efficiency. The mean nationwide dust-removing efficiency of 6,000-kilowatt-and-above coal-fired power plants has increased from 98 per cent to 98.5 per cent. Among the coal-fired units newly put into production, the mean efficiency of dust removers is over 99 per cent, and most of the units are designed according to the current universal dust emission threshold of 50 milligrams or less per cubic metre. Meanwhile, dust-removing technology has made a historical breakthrough, and a series of coal-fired power plants has been equipped with dust-collector bags. The biggest dust-collector bags in China, made to equip 300-megawatt units, have been put into commercial operation. The extensive commissioning of highly efficient dust-removing equipment has strongly driven the control of dust and smoke from thermal power plants. From 2002 to 2006, China’s thermal power capacity increased by 82.3 per cent, and generating capacity increased by 74.3 per cent, while dust emission increased by only 14.2 per cent. Since 2004 emission growth slowed down markedly, growing much more slowly than the electricity industry. Since 2002, power enterprises have also increased their efforts to control sulphur dioxide emissions. The power industry made major progress in controlling sulphur dioxide emissions by burning low-sulphur coal, closing down small thermal power units, implementing energy conservation and consumption reduction measures, and promoting flue-gas desulfurization. In particular, since 2006 construction of flue-gas desulfurization facilities for thermal power plants has sped up markedly. By the end of that year the capacity of the flue-gas desulfurization units at China’s thermal power

China’s Electrical Power Sector, Environmental Protection and Sustainable Trade 27
plants exceeded 150 gigawatts, accounting for about 33 per cent of the total capacity of coal-fired units, an increase of nearly 30 times that in 2000. This surpassed the proportional capacity of the United States in 2005 (31.5 per cent), but then the growth trend declined markedly, far below the speed of power development. The sector’s performance on sulphur dioxide emissions dropped noticeably, coming closer to the performance of the American coal-fired units in 2005 (5.14 grams per kilowatt-hour). Since 2002 new large coal-fired units simultaneously employed a low-nitrogen-oxide combustion method and built gas-denitrification devices in environmentally sensitive areas. A -number of existing thermal power plants were equipped with low–nitrogen-oxide burners as part of a technical transformation. As of the end of 2006, a few 300- and 600-megawatt gas-denitrification devices, totalling about 6.6 gigawatts, were put into commercial operation; as many as 39 one-gigawatt gas-denitrification devices were in the design or construction phases. Many of these units employed or intended to adopt selective catalytic reduction denitrification technology, bringing denitrification efficiency up to 50 to 85 per cent. As for control of wastewater discharge from thermal power plants, more efforts have recently been made to implement water savings in new units and put direct air-cooling technology into commercial operation. About 30 thermal power plants use urban recycled water and desalinated sea water as their freshwater sources; in conjunction with technical transformation, 20 thermal power plants now employ industrial wastewater zero-discharge technology; thermal power plants’ freshwater consumption and wastewater discharge for ash-flushing have dropped substantially; and the reuse rate of waste water across China is up to 70 per cent. Although the total wastewater discharge volume of thermal power plants increases with installed capacity and power production, the volume of wastewater discharge per unit of power generated is dropping year by year. Great achievements have been made in energy conservation, as well. For a long time the power industry adhered to a guideline of paying equal attention to development and conservation. Under the national laws, regulations and policies, better resource-saving criteria, standards and management systems have been established for the power industry, and resource conservation is considered key to planning, construction, production and operation of power stations. Coal consumption per unit of power production dropped from 383 grams per kilowatt-hour in 2002 to 366 grams per kilowatt-hour in 2006, down 4.4 per cent, or 17 grams per kilowatt-hour, with a mean annual drop of 4.25 grams per kilowatt-hour. This saved 36.4 million tonnes of standard coal. During the same period, power-transmission losses dropped from 7.5 per cent to 7.1 per cent, down by 0.4 percentage points, or 5.3 per cent.

China’s Electrical Power Sector, Environmental Protection and Sustainable Trade 28
The energy-saving and emission-reduction policy instruments are now shifting gradually from administrative measures to a market-oriented approach. In the past, China’s environmental protection efforts in the power industry were mainly dominated by the central government utilizing administrative methods. In the long run, this approach isn’t the best choice, and an economic approach is more suitable.
China’s Electrical Power Sector, Environmental Protection and Sustainable Trade 29
4.0 Best practices, current trends and lessons from international experience
This section provides a short review of international best practices relating to economic, regulatory and policy mechanisms that promote efficiency and low-carbon growth in the electricity generation and supply sector, in particular those mechanisms that encourage the switch to fossil fuel generation technologies with lower carbon emissions (for example, clean coal, carbon capture and storage (CCS), and integrated gasification combined cycle) and those that support investment in renewable energy alternatives. While end-user energy efficiency and demand-side management approaches are obviously important, this section will not assess these policy areas except for improvement in transmission and distribution efficiency. We first present a typology of potential instruments and discuss the purpose, structure and application of these instruments. Based on a literature review, we then identify international best practices in the application of these instruments, before analyzing their relevance to the electricity sector in China and their potential relevance to and application in other sectors.
4.1 Typology of relevant efficiency and low-carbon policies and measures in the electricity sector
The global energy supply will continue to be dominated by fossil fuels for several decades. Reduction of the resultant GHG emissions will require a transition to zero- and low-carbon technologies. This can happen over time as business opportunities and co-benefits are identified. However, more rapid deployment of zero- and low-carbon technologies will require energy sector reform and policy intervention. This intervention has to take into account a number of issues, such as security of supply, removal of structural advantages for fossil fuels, minimizing related environmental impacts and achieving sustainable development goals. A range of policies are already in place to encourage efficiency and the development and deployment of low-carbon power-generation technologies in both OECD countries and non-OECD countries such as China. Many industrialized countries have introduced—and later increased—grant-support schemes for producing electricity, heat and transport fuels based on low-carbon or renewable energy resources and for installing more energy-efficient power-generation plants.
China’s Electrical Power Sector, Environmental Protection and Sustainable Trade 30
As noted above in Section 3.4, most climate policies relating to energy supply fall into three categories (Metz et al., 2007):
1. Economic instruments (such as subsidies, taxes, tax exemptions and tax credits). 2. Regulatory instruments (such as mandated targets and minimum performance standards). 3. Policy processes (such as voluntary agreements and consultation, information schemes, and
research and development support for emerging technologies). While no single policy instrument can deliver the full range of desired economic and environmental outcomes, such instruments can be used in combination to achieve environmental goals in a flexible manner. The choice and combination of policies is driven by a range of considerations, including cost, environmental effectiveness, political and economic co-benefits (such as security of supply or export potential), available technologies, financial resources and public acceptance. Policy instruments and processes can be used to address different sectors and aspects of the energy supply system in order to reduce GHG intensity. These sectors and aspects fall into four primary areas:
1. Improving the operating efficiency of fossil fuel power plants. 2. Changing the use of fuels used in electricity production to lower-carbon alternatives. 3. Supporting development and deployment of low-carbon renewable energy technologies. 4. Encouraging carbon capture and sequestration from carbon-intensive power generation.
Table 4.1 provides a typology of how different policy mechanisms are used for the power generation sector.
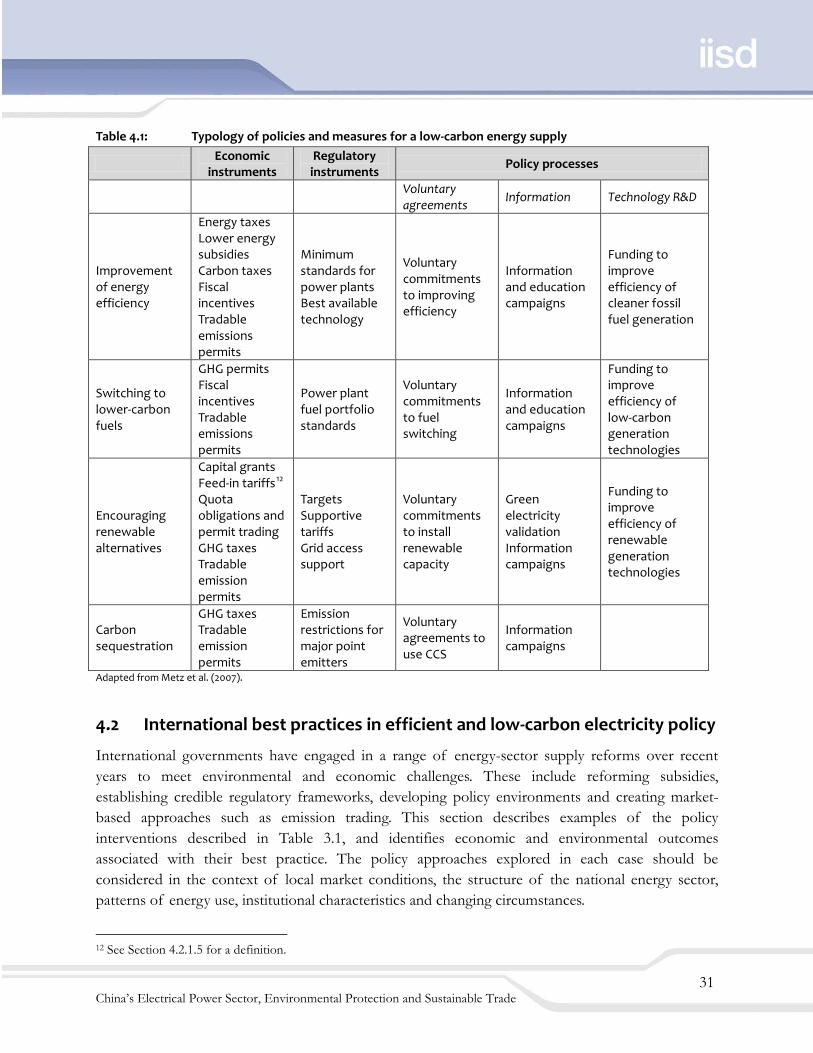
China’s Electrical Power Sector, Environmental Protection and Sustainable Trade 31
Table 4.1: Typology of policies and measures for a low-carbon energy supply
Economic instruments
Regulatory instruments
Policy processes
Voluntary agreements
Information Technology R&D
Improvement of energy efficiency
Energy taxes Lower energy subsidies Carbon taxes Fiscal incentives Tradable emissions permits
Minimum standards for power plants Best available technology
Voluntary commitments to improving efficiency
Information and education campaigns
Funding to improve efficiency of cleaner fossil fuel generation
Switching to lower-carbon fuels
GHG permits Fiscal incentives Tradable emissions permits
Power plant fuel portfolio standards
Voluntary commitments to fuel switching
Information and education campaigns
Funding to improve efficiency of low-carbon generation technologies
Encouraging renewable alternatives
Capital grants Feed-in tariffs12
Quota obligations and permit trading
GHG taxes Tradable emission permits
Targets Supportive tariffs Grid access support
Voluntary commitments to install renewable capacity
Green electricity validation Information campaigns
Funding to improve efficiency of renewable generation technologies
Carbon sequestration
GHG taxes Tradable emission permits
Emission restrictions for major point emitters
Voluntary agreements to use CCS
Information campaigns
Adapted from Metz et al. (2007).
4.2 International best practices in efficient and low-carbon electricity policy
International governments have engaged in a range of energy-sector supply reforms over recent years to meet environmental and economic challenges. These include reforming subsidies, establishing credible regulatory frameworks, developing policy environments and creating market-based approaches such as emission trading. This section describes examples of the policy interventions described in Table 3.1, and identifies economic and environmental outcomes associated with their best practice. The policy approaches explored in each case should be considered in the context of local market conditions, the structure of the national energy sector, patterns of energy use, institutional characteristics and changing circumstances.
12 See Section 4.2.1.5 for a definition.

China’s Electrical Power Sector, Environmental Protection and Sustainable Trade 32
4.2.1 Economic instruments
Economic instruments are policy mechanisms that encourage behavioural change through the use of financial incentives and disincentives without forcing market actors through laws to change their activities. They tend to be the favoured approach of policy-makers in OECD countries because of their flexibility and attractiveness to market participants. Competitive advantage can be gained by those companies that are best able to respond to and exploit new market conditions engendered by these mechanisms. Below are examples of the main types of economic instruments in use.
4.2.1.1 Removal of subsidies for carbon-intensive fuels
A 2008 study by UNEP on the reform of energy subsidies identified that financial support for indigenous energy production remains widespread, primarily to maintain employment and ensure national ownership. Nonetheless, there is a downward trend in subsidies for fossil fuel production, reflecting the steady privatization and liberalization of energy markets. This trend shows a reduction in support for coal production in particular, with many OECD countries switching support from production toward economic restructuring and redeployment of the workforce. The IEA undertook a global review of energy subsidies in 2006, published in World Energy Outlook. The report measured the shortfall between the costs of supply and the costs to consumers in the 20 largest non-OECD countries. The study found US$170 billion in support of fossil fuel production and generation for the countries surveyed, equating to about US$300 billion globally if the same level of support was assumed across all non-OECD countries (UNEP, 2008a). An example of successful subsidy reform can be found in Germany, where the coal industry had been supported for more than 50 years, primarily to support electricity production. Total subsidy support reached its peak in 1996 at €6.7 billion, despite declining levels of coal production. Since then, subsidy support had fallen to approximately €2.5 billion by 2007, although this still represented an annual support of €90,000 per employee within the industry. It has been agreed that by 2018, all subsidies to the indigenous German coal industry will be phased out (UNEP, 2008b).
4.2.1.2 Carbon and energy taxes
Several countries have successfully introduced carbon-related energy taxes in a bid to improve plant efficiency and reduce emissions. From 1970 to 1990, Sweden invested heavily in research and development related to renewable energy, but without significant deployment of these technologies. It was only with the introduction of carbon taxes in 1991 that the country made substantial progress in switching from cheaper electric and oil-fired boilers for district heating to biomass co-generation. As a result of the taxes, the use of biomass increased by more than 400 per cent during the period
China’s Electrical Power Sector, Environmental Protection and Sustainable Trade 33
from 1990 to 2000. This in itself led to a number of follow-on technological developments, such as biomass extraction technologies (Johansson and Turkenburg, 2004). Finland, the Netherlands and Norway also introduced carbon taxes in the 1990s. The United Kingdom has implemented a tax on energy use for large industrial and commercial customers, known as the Climate Change Levy (CCL). The CCL taxes electricity consumption at 0.456 pence per kilowatt-hour. The levy encourages voluntary efficiency improvements by raising the price of electricity, but allows exemptions of up to 80 per cent if participants meet certain efficiency-improvement targets. Renewable electricity is also exempted from the levy. The CCL has been extremely successful in encouraging major energy users to cut their emissions, and it is expected that the instrument will deliver at least five million tonnes of carbon dioxide reductions by 2010.
4.2.1.3 Tradable emission permits
Emission trading schemes have developed as a key policy option to reduce carbon intensity in the electricity sector because of the economic efficiency with which they operate. Creating liquid carbon markets can help economies identify and realize economical ways to reduce emissions of GHGs and other energy-related pollutants or to improve efficiency of energy use. Newman, Beg, Corfee-Merlot, McGlynn and Ellis (2002) estimated that emission trading has reduced the cost of meeting Kyoto targets in OECD regions from 0.2 per cent of GDP without trading to 0.1 per cent. The largest tradable permit schemes include the EU ETS and the Kyoto Protocol’s Clean Development Mechanism and Joint Implementation mechanism. Other schemes are in development in Australia, New Zealand and the United States. The EU ETS is the major policy instrument within the European Union for reducing GHG emissions. Although some European member states have introduced unilateral energy and carbon taxes, it was decided in 1999 that a cap-and-trade system would be more economically efficient. More than 10,000 sites are currently included in the scheme, representing approximately half of the total carbon dioxide emissions within the European Union. Electricity and heat production facilities with 20 megawatt capacity or more represent a key target group within the scheme. Svendsen and Vesterdal (2003) argued that the electricity sector was the best suited of all sectors to be covered by the EU ETS, because it was responsible for one-third of the total carbon dioxide emissions in the European Union, many low-cost carbon dioxide emission-reduction opportunities existed within the sector, companies were relatively well-informed of the overall opportunities to reduce carbon dioxide emissions, which would lead to early trading, and the sector was already tightly regulated. As a result, the power sector has the largest GHG-reduction burden under the EU ETS. Allocations were made at a national level, without any overall sectoral target for EU power-sector emissions.
China’s Electrical Power Sector, Environmental Protection and Sustainable Trade 34
During the second phase, from 2005 to 2008, the power sector has been consistently short on emission allowances and has had to purchase them in the market to cover its emissions. This is primarily due to the allocation process at the national level, where individual governments have assigned short positions to their electricity producers. A number of issues have arisen related to the participation of the power sector in the EU ETS. The most important of these is the perception of windfall profits by participating power generators that passed along the “costs” (based on market value) of their freely issued allowances to their customers. To counter this, full auctioning of permits to the electricity sector will begin in Phase 3, starting in 2012.
4.2.1.4 Fiscal measures and capital grants
Fiscal measures relate to tax and expenditure policy and have been used extensively to support the development of renewable electricity generation. One example is the Japan Solar Roofs program, launched in 1994, which offered a combination of both tax rebates and concessional finance to residential grid-connected photovoltaic systems. The scheme was scaled up in 1997, when it was extended to include developers of larger residential housing complexes. The scheme has resulted in Japan becoming the world’s largest installer of grid-connected photovoltaic systems and manufacturer of solar photovoltaic panels. Over the eight-year program lifetime, from 1994 to 2002, installed capacity increased at an annual rate in excess of 42 per cent, with more than 420 megawatts in place at the end of the program. During this period, the fiscal support was reduced as costs of production fell, with rebates reaching 12 per cent by the end of the program, down from the initial level of 50 per cent (Metz et al., 2007).
4.2.1.5 Feed-in tariffs
Feed-in tariffs are a commitment to pay a given price (tariff) for certain types of power provided to the grid; typically they are granted for renewable energy, and they thereby provide long price certainty for renewable-energy producers. They have been widely and successfully deployed throughout Europe to support renewable technologies. The most notable successes have been found in Denmark, Germany and Spain. Governments set a price at which the country’s electricity supply companies must purchase all renewable energy delivered to the distribution grid. Price premiums are passed on to consumers in the form of higher electricity bills. Savage (2004) estimates that total support for renewables in the form of feed-in tariffs was in excess of €1 billion in 2001, primarily in Germany, Italy and Spain. Several developing countries, including China, Brazil and India, have adopted similar policies. Incentives to support low-carbon electricity are considered more efficient than capital investment grants, as they encourage market deployment while also promoting increases in production

China’s Electrical Power Sector, Environmental Protection and Sustainable Trade 35
efficiency. In terms of delivering installed renewable energy capacity, feed-in tariffs fulfill a similar function as that of quantity-based instruments such as quotas and green certificates (described below). Experience in the European Union indicates that feed-in tariffs have been more successful in bringing forward the deployment of renewables than have obligations, probably as a result of their longer-term certainty and the perceived incentives of guaranteed prices. Feed-in tariffs were central to the development of the wind power industry in Denmark. This was dropped in favour of a system of tradable permits and renewable obligations in 1999. Investors reacted to this development by slowing investment, and as a result, the rate of increase in renewable capacity has not recovered to its former levels (Johansson & Turkenburg, 2004). In the 1990s Germany adopted an integrated policy approach for renewable energy that combined both tariff support for renewables and a range of other policy instruments to reduce the risks associated with capital investment. This policy package resulted in the country becoming the world leader in installed wind capacity (recently overtaken by the United States) and second in installed photovoltaic capacity. Spain passed a similar feed-in law in 1994, and in 2008 the country ranked third in installed capacity, behind Germany and the United States (Metz et al., 2007).
4.2.1.6 Quota obligations (renewable energy standards) with tradable certificates
Purchase quotas or obligations set targets for the proportion of electricity (usually percentage based) that electricity retailers should source from a certain fuel type. While these might normally be considered regulatory rather than economic instruments, they are usually implemented with tradable permits, making them hybrid instruments. So if a retailer sources more than required from the privileged sources, it can sell the excess certificates of compliance to other retailers. These instruments have been used in many countries to accelerate the transition to renewable energy systems and to achieve the same outcomes as feed-in tariffs (Martinot, 2005). For example, 75 per cent of the wind capacity installed in the United States between 1998 and 2004 was installed in states with renewable energy standards, and experience shows that if certificates are delivered under long-term agreements, effectiveness and compliance can be high. This mechanism has been deployed for renewables and combined heat and power in several EU member states. Energy distribution companies must either prove the origin of purchase, pay a penalty or produce the required amount themselves, creating an artificial demand and price premium for renewable generation. If the overall system target cannot be met, prices rise until new market entrants and investors are attracted. Tradable certificates often accompany such schemes. The cost of this subsidy is borne by consumers.
China’s Electrical Power Sector, Environmental Protection and Sustainable Trade 36
A good example of an obligation is the United Kingdom’s Renewables Obligation, which evolved from the United Kingdom’s Non-Fossil Fuel Obligation. The Renewables Obligation requires licensed electricity suppliers in the United Kingdom to source an increasing proportion of electricity from renewable sources. This figure was initially set at 3 per cent for the period from 2002 to 2003, and under current political commitments will rise to 10.4 per cent by the period of 2011 to 2012, then by 1 per cent annually for the five years following. The Renewables Obligation creates small additional costs for electricity suppliers, which are then passed through to industries, businesses and domestic consumers as part of their electricity bills. The Renewables Obligation has delivered in excess of 6 gigawatts of renewable generation, with another 18 gigawatts planned. The United Kingdom’s energy regulator, Ofgem, has estimated that the Renewables Obligation cost the average British household £7.35 per year in 2007 (approximately £200 million total), and has forecast that this will rise to £11.41 by 2010 to 2011 (Scottish Executive, 2009). The Renewables Obligation is currently being reformed by the introduction of differentiated support levels based on technology, a process known as banding. This will encourage the development of higher-cost technologies, such as offshore wind and biomass, as power producers have initially met their obligations primarily through investment in lowest-cost onshore wind.
4.2.2 Regulatory instruments
Regulatory instruments are policy mechanisms that use governments’ traditional powers of regulation to change behaviour. They include standard setting and permitting, and rather than relying on economic incentives, they simply dictate what practices are expected of the entities they cover. We describe the main sorts of regulatory instruments relevant to the electricity sector below.
4.2.2.1 Minimum efficiency standards and best available technologies
By setting minimum efficiency standards, prohibiting inefficient technologies and implementing best available technology requirements, governments can ensure that new power plants meet improved efficiency standards. Currently, subcritical fossil fuel power plants can achieve efficiency between 36 per cent and 40 per cent. Supercritical designs have efficiencies in the low– to mid–40 per cent range, with new “ultra-supercritical” designs reaching about 48 per cent efficiency. For example, Australia mandates minimum standards for new power plants through its Generation Efficiency Standards program. This program sets thermal efficiency standards for natural gas plants (52 per cent), black coal (42 per cent) and brown coal (31 per cent). It also requires performance reporting for all existing power plants with capacity above 30 megawatts or above 50 gigawatt-hours per annum. The program expects to deliver annual carbon dioxide savings of 4 million tonnes (IEA, 2009).

China’s Electrical Power Sector, Environmental Protection and Sustainable Trade 37
4.2.2.2 Fuel portfolio standards
As described earlier, governments can mandate, through obligations or standards, that power producers generate electricity from certain types of fuels. This is most commonly applied in the context of renewable portfolio standards, where power producers are required to generate a percentage of their output using low-carbon, renewable technologies. This is common practice in the United States, where most states have implemented such legislation. Portfolio standards can be accompanied by regulation to force electricity distributors to disclose the mix of fuels and related emissions for their power supply. This requires standardization of the classification system for fuel descriptions and prescribed descriptions of what constitutes a green energy source (see Section 4.2.3.2).
4.2.2.3 National targets
Goals and quantitative targets for low-carbon energy at both national and regional levels increase the size of the markets and provide greater policy stability for project developers. For example, EU leaders reached agreement in principle in March 2007 that 20 per cent of energy should be produced from renewable fuels by 2020 as part of the European Union’s drive to cut emissions of carbon dioxide, with a provision to increase this target to 30 per cent if there is global agreement on a strong climate regime to succeed the Kyoto Protocol. This has clear implications for the electricity sector, where the current share of renewables will need to double to more than 30 per cent in order to deliver on this 2020 target. In 2009 Australia implemented a similar target of 20 per cent renewable electricity by 2020. As noted above, China has committed to a goal of generating 15 per cent of power from renewables by 2020. Some concerns exist that such targets will prove to be an expensive way of meeting GHG emission reductions, though they may support the development of renewable manufacturing and installation capacity.
4.2.2.4 Grid access for distributed and remote low-carbon technologies
Interconnection standards refer to the regulations set by states to allow the connection of distributed generation sources to the grid. Different countries and regions have specific procedures that can make this problematic. For example, Spain struggled to deploy solar photovoltaic technologies, despite feed-in tariffs similar to those in Germany’s successful program. The absence of grid-connection regulations and national technical standards was the key issue, and once these were put in place in 2001, the program developed to make Spain the leading country in the world, with 2 gigawatts of photovoltaic capacity installed in 2008 alone (Del Rio & Unruh, 2007).
China’s Electrical Power Sector, Environmental Protection and Sustainable Trade 38
4.2.3 Other policies and measures
In addition to regulatory and market-based approaches, governments have a number of other sorts of policies and measures at their disposal when they seek to shape the behaviour of actors in electricity markets. We describe some of the most prevalent below.
4.2.3.1 Voluntary agreements
A number of countries have set up voluntary agreements within the power sector to reduce emissions. Voluntary agreements are usually between the state and commercial power companies and act as a substitute for or extension of existing environmental laws or policies. Voluntary agreements may differ in the degree of regulatory control and the extent to which the commitment is binding. In the United States, for example, the power sector participates in the Climate VISION program through the Electric Power Industry Climate Initiative (EPICI) and its Power Partners program, which has been developed in cooperation with the U.S. Department of Energy. The group represents 100 per cent of the power generators in the United States. The aim is to improve emission intensity within the electricity sector by 3 to 5 per cent over the 2000 to 2002 baseline by 2012, through a number of demand-side management programs, transmission and distribution upgrades, expansion of natural gas, landfill gas recovery and carbon sequestration activities. The program is currently on course to exceed its targets (International Utility Efficiency Partnerships, 2004). Voluntary agreements may also be extended to other areas, such as renewable energy investment or emission trading. In Korea the Renewable Portfolio Agreement saw six major power suppliers agree to invest US$1.26 billion during the period from 2006 to 2009. In Japan a voluntary emission trading scheme has been implemented in preference over a mandatory scheme.
4.2.3.2 Information and education
Public awareness is seen as increasingly important policy component to encourage green electricity development. These schemes provide end consumers with clear information on the fuel mix used to generate power and allow for the option to increase tariffs to fund a higher proportion of low-carbon energy, combining information and choice. These programs include public education aspects, but are also built on industry and government partnerships, particularly for smaller renewable energy developers.
China’s Electrical Power Sector, Environmental Protection and Sustainable Trade 39
4.2.3.3 Research and development investment
The need for further investments in research and development of all low-carbon emission and efficiency technologies is key to decarbonization of the power sector. Most important among these technologies is CCS, which has the potential to mitigate the growth in emissions from coal plants in rapidly industrializing countries such as China. In early 2009 both the United States and the European Union announced significant research and development and demonstration funds for CCS technology. Committed funding in the United States for early-stage deployment is currently US$4.3 billion, while carbon credits set aside specifically for CCS in the European Union could total over €12 billion by 2014. The European Technology Platform for Zero Emission Fossil Fuel Power Plants has unveiled its report for the rapid development of a network of CCS demonstration plants across Europe (European Technology Platform for Zero Emission Fossil Fuel Power Plants, 2008).
4.3 Application to the Chinese policy context
While coal remains the most economical means of responding to rapid increases in domestic energy demand in China, there are nonetheless significant national concerns about the impacts of climate change, both in competitiveness and environmental terms. As described above, China has already advanced the development of policy frameworks to create a more energy-efficient and less carbon-intensive power sector. Measures include a new law introduced in 2006 to promote renewable energy (with a 15 per cent renewable energy standard by 2020), measures to increase the efficiency of new power plants (larger, more efficient units; state-of-the-art technologies) and increase efficiency in existing plants, and plans for the early shutdown of inefficient coal power plants (units less than 50 to 100 megawatts). In 2001 China began the Township Electrification Program, a large-scale fiscal support program for stand-alone rural renewable energy systems. From 2002 to 2004, almost 700 townships received 20 megawatts of village-scale solar photovoltaic and 800 kilowatts of wind. The government provided US$240 million to subsidize the capital costs of equipment, and about one million rural dwellers were provided with electricity (Metz et al., 2007). Best practice in the international policy arena would be of direct relevance in a number of other areas. In terms of economic instruments, the introduction of carbon-related energy taxation or an emission trading scheme appears to be a likely option. China’s central bank has explored the potential structure for a domestic emission trading scheme, and both Beijing and Tianjin have expressed interest in setting up carbon-trading platforms. Investment in research and development for improving the environmental and economic efficiency of low-carbon alternatives to coal and for developing CCS technology also provides attractive routes for the Chinese power sector. Cooperation and trial demonstration projects for carbon sequestration are underway in cooperation with the European Union.
China’s Electrical Power Sector, Environmental Protection and Sustainable Trade 40
China should also recognize the co-benefits of low-carbon and efficient electricity policy. For example, policy support for clean coal, CCS, and renewable technologies will not only reduce carbon dioxide emissions but also mitigate the future risks of carbon pricing, create valuable opportunities for technology exports and improve energy security by exploiting domestic resources. Non-carbon emissions will, however, increase, as some 30 per cent more coal is required to create the same amount of energy under current CCS technologies, so clearly efficiency and renewables offer more co-benefits, such as technology exports, hedges against carbon pricing and energy security.
China’s Electrical Power Sector, Environmental Protection and Sustainable Trade 41
5.0 Policy options for China
China has come a long way in advancing toward a regime of electrical power generation and distribution that is more efficient and lower in carbon emissions. But by international standards it still has far to go; significant potential exists for China to contribute to the goals of energy efficiency, energy security, reduced air pollution and health impacts, and an easy flow of China’s manufactured exports to major developed-country markets. Based on the analysis above, several policy options are worth mentioning:
• Continue to learn from the experience of others. Countries around the world are pursuing similar goals, and they provide an excellent laboratory for what does and does not work. China should continue to learn from these experiences and adapt them to the unique realities of the Chinese context. The case-study approach, using new measures in specific regions or cities, seems to be appropriate and should be continued.
• Conduct research to identify and quantify costs and benefits. While it is clear that significant co-benefits might result from a successful strategy of minimizing pollution and pursuing energy efficiency, it is not clear how these benefits measure up to the potential costs of such actions. Do the health benefits of a feed-in tariff, for example, compare favourably to the costs of implementing the measure? This sort of analysis will provide a useful basis for Chinese policy-makers as they go forward.
• Use a mix of tools. Traditionally China resorted to command-and-control-type regulatory approaches, but in recent years has begun to experiment with a mix of tools that includes more economic instruments such as taxes, subsidies and market-based measures as well as other policy instruments. This mixed approach, taking the best of various types of tools to deal with China’s challenges, is ideal and should be continued. This evolution in regulation is similar to the evolution from a purely market-based economy to a mixed managed economy, and has great potential to produce the desired results.
• Price carbon. One of the key tools that China should consider is a regime to price carbon, such as a cap-and-trade scheme or a carbon tax. Coupled with other regulatory instruments, these have enormous potential to drive innovation and deliver a wide variety of economic and social co-benefits.
In the final analysis, these sorts of changes will not be carried out by makers of trade policy. However, they have clear and significant potential benefits for China’s trade prospects. For one thing, increased efficiency of production and distribution of electricity will increase the productivity and competitive advantage of China’s manufacturers that rely on electrical power. As well, such measures will almost certainly insulate Chinese exports from climate-related border measures aimed

China’s Electrical Power Sector, Environmental Protection and Sustainable Trade 42
at levelling the playing field between Chinese and developed-country producers. In the European Union such measures are contemplated in the third phase of the EU ETS, which begins in 2012. In the United States it looks certain that such measures will form part of the U.S. president’s effort to address climate change: the American Clean Energy and Security Act of 2009. But any such measures will find it difficult to target China if China can easily show that it is taking strong measures that have the effect of reducing the emissions embodied in China’s exports. Such measures should be adopted for China’s own purposes, and not necessarily to fulfill other countries’ expectations of Chinese behaviour. They should be implemented as part of a drive to achieve energy policy objectives and to achieve the sorts of social and economic co-benefits described above. But if they are successful, they will also necessarily have the desirable effect of improving China’s trade and environmental relations with its major export market countries.

China’s Electrical Power Sector, Environmental Protection and Sustainable Trade 43
References
Aldy, J. E., & Pizer, W. (2009). The competitiveness impacts of climate change mitigation policies. Arlington, VA: Pew Center on Global Climate Change.
Birdsall, N., & Wheeler, D. (1993). Trade policy and industrial pollution in Latin America: Where are the pollution havens? Journal of Environment & Development, 2(1), 137–149.
Brunnermeier, S., & Levinson, A. (2004). Examining the evidence on environmental regulations and industry location. Journal of Environment and Development, 13(1), 6–41.
Bruyn, S., Nelissen, D., Korteland, M., Davidson, M., Faber, J., & van de Vreede, G. (2008). Impacts on competitiveness from EU ETS: An analysis of the Dutch industry. Delft, Netherlands: CE.
CISA. (2008). A national production, trade and emissions database. Report for the Australian Government Department on Climate Change, Centre for Integrated Sustainability Analysis, University of Sydney.
Constantini, V., & Crespi, F. (2008). Environmental regulation and the export dynamics of energy technologies. Ecological Economics, 66, 447–460.
Copeland, B. R., & Taylor, M. S. (2004). Trade, growth and the environment. Journal of Economic Literature, 42(1): 7–71.
Del Rio, P., & Unruh, G. (2007). Overcoming the lock-out of renewable energy technologies in Spain: The cases of wind and solar electricity. Renewable & Sustainable Energy Review, 11(7), 1498–1513.
Ederington, J., & Minier, J. (2003). Is environmental policy a secondary trade barrier? An empirical analysis. Canadian Journal of Economics, 36(1), 137–154.
Ederington, J., Levinson, A., & Minier, J. (2003). Footloose and pollution-free. NBER Working Paper No. W9718. Cambridge, MA: National Bureau of Economic Research.
Eskeland, G. S., & Harrison, A. E. (1997). Moving to greener pastures? Multinationals and the pollution haven hypothesis. World Bank Policy Research Working Paper No. 1744. Washington, D.C.: World Bank.
Guan, D., Peters, G. P., Weber, C. L., & Hubacek, K. (2009). Journey to world top emitter: An analysis of the driving forces of China’s recent CO2 surge. Geophysical Research Letters, 36.
Guofa (State Development and Reform Committee). (2007). State Council’s several opinions regarding acceleration of shutting down small thermal power generating units.
Hourcade, J.-C., Demailly, D., Neuhoff, K., & Sato, M. (2007). Climate strategies report: Differentiation and dynamics of EU ETS industrial competitiveness impacts. Cambridge, U.K.: Climate Strategies.
International Energy Agency (IEA). (2007). World energy outlook 2007. Paris: IEA. International Energy Agency (IEA). (2009). Energy efficiency policies and measures database.
Retrieved from http://www.iea.org/textbase/pm/?mode=pm&id=594&action=detail
China’s Electrical Power Sector, Environmental Protection and Sustainable Trade 44
International Utility Efficiency Partnerships (IUEP). (2004). Memorandum of understanding between the United States electric power sector and the Department of Energy. Retrieved from http://www.iuep.org/climate_vision_mou.pdf 02 October 2009
Jaffe, A. B., Peterson, S. R., Portney, P. R., & Stavins, R. N. (1995). Environmental regulation and the competitiveness of U.S. manufacturing: What does the evidence tell us? Journal of Economic Literature, 33(1), 132–163.
Johansson, T. B., & Turkenburg, W. (2004). Policies for renewable energy in the European Union and its member states—an overview. Energy for Sustainable Development, 8(1), 5–24.
Levinson, A., and Taylor, S. (2004). Unmasking the pollution haven effect. NBER Working Paper No. W10629. Cambridge, MA: National Bureau of Economic Research.
Low, P., & Yeats, A. (1992). Do “dirty” industries migrate? In P. Low (Ed.), International Trade and Environment, World Bank Discussion Paper No. 159. Washington, D.C.: World Bank.
Lucas, R. E. B., Wheeler, D., & Hettige, H. (1992). Economic development, environmental regulation, and international migration of toxic industrial pollution: 1960–1988. Pp. 67–86 in P. Low (Ed.), International Trade and Environment, World Bank Discussion Paper No. 159. Washington, D.C.: World Bank.
Martinot, E. (Ed.). (2005). Renewables 2005: Global status report. REN21 Renewable Energy Policy Network. Retrieved from http://www.ren21.net/globalstatusreport/g2005.asp
McConnell, V. D., & Schwab, R. M. (1990). The impact of environmental regulation on industry location decisions: The motor vehicle industry. Land Economics, 66(1), 67–81.
Metz, B., Davidson, O. R., Bosch, P. R., & Meyer, L.A. (Eds.). (2007). Climate change 2007: Mitigation. Contribution of Working Group III to the Fourth Assessment Report of the Intergovernmental Panel on Climate Change. Cambridge, U.K., and New York, NY: Cambridge University Press.
Morgenstern, R., Aldy, J., Herrnstadt, E., Ho, M., & Pizer, W. (2007). Competitiveness impacts of carbon dioxide pricing policies on manufacturing. Issues Brief 7. Washington, D.C.: Resources for the Future.
Newman, J., Beg, N., Corfee-Merlot, J., McGlynn, G., & Ellis, J. (2002). Climate change and energy, trends, drivers, outlook and policy options. Paris: OECD Publication Service.
Porter, M., & van der Linde, C. (1995). Green and competitive: Ending the stalemate. Harvard Business Review, September/October 1995, 120–134.
Reinaud, J. (2008). Issues behind competitiveness and carbon leakage: Focus on heavy industry. IEA Information Paper. Paris: OECD/IEA.
Scottish Executive. (2009). The renewables obligation order 2009. (SSI/2009/140). Edinburgh: Scottish Executive.
State Development and Reform Commission (SDRC). (2007a). Management methods for desulfurization price of coal-fired power generation units and operation of desulfurization facilities (trial implementation). SDRC electricity price No. [2007] 1176.
China’s Electrical Power Sector, Environmental Protection and Sustainable Trade 45
State Development and Reform Commission (SDRC). (2007b). Notice of relevant problems of further fulfillment of distinct EP price policy. SDRC electricity price No. 2655.
State Development and Reform Commission (SDRC). (2007). Notice of SDRC on reducing the power sell price of small thermal power units and accelerating shut-down of small thermal power units.
SERC. (2007). Review of the development of the power industry since the 16th Party Congress, http://www.serc.gov.cn/opencms/export/serc/jgyj/ztbg/news/20071016.pdf
Shino, K., & Ikki, O. (2003). National survey report of PV power applications in Japan, 2002. Paris: IEA. SQW Ltd. (2006). Exploring the relationship between environmental regulation and competitiveness: Literature
review. Report prepared for the Department for Environment, Food and Rural Affairs, U.K. Svendsen, G. T., & Vesterdal, M. (2003). How to design greenhouse gas trading in the EU? Energy
Policy, 31, 1531–1539. Taylor, S. M. (2004). Unbundling the pollution haven hypothesis. Advances in Economic Analysis and
Policy, 4(2), art. 8. Tobey, J. A. (1990). The effects of domestic environmental policies on patterns of world trade: An
empirical test. Kyklos, 43(2), 191–209 UNEP. (2008a). Reforming energy subsidies: Opportunities to contribute to the climate change agenda (No. 1).
Retrieved from http://www.unep.org/pdf/PressReleases/Reforming_Energy_Subsidies.pdf UNEP. (2008b). Reforming energy subsidies: Opportunities to contribute to the climate change agenda (No. 2).
Retrieved from http://www.unep.org/pdf/PressReleases/Reforming_Energy_Subsidies2.pdf Wooders, P., Reinaud, J., & Cosbey, A. (2009). Options for policy makers: Addressing competitiveness, leakage
and climate change. Winnipeg: IISD. European Technology Platform for Zero Emission Fossil Fuel Power Plants (ZEP). (2008). EU
demonstration programme for CO2 capture and storage (CCS). Retrieved from http://www.zero -emissionplatform.eu/website/docs/ETP%20ZEP/EU%20Demonstration%20Programme %20for%20CCS%20-%20ZEP's%20Proposal.pdf
Zhang, Z. X. (2008). Is it fair to treat China as a Christmas tree to hang everybody’s complaints? Putting its own energy saving into perspective. Munich Personal RePEc Article No. 12,276. Retrieved from
http://mpra.ub.uni-muenchen.de/12276Zou, Y. (2008). An analysis on the development level and structure of China’s power industry. Retrieved from
http://www.serc.gov.cn/jgyj/ztbg/200804/t20080401_8796.htm


![[] Electrical Protection Handbook(Bookos.org)](https://img.pdfslide.net/doc/110x75/55cf9d56550346d033ad2db9/-electrical-protection-handbookbookosorg.jpg)