Embed Size (px)
Citation preview
FEDERAL RESERVE BANK OF SAN FRANCISCO
WORKING PAPER SERIES
The views in this paper are solely the responsibility of the authors and should not be interpreted as reflecting the views of the Federal Reserve Bank of San Francisco or the Board of Governors of the Federal Reserve System. This paper was produced under the auspices of the Center for Pacific Basin Studies within the Economic Research Department of the Federal Reserve Bank of San Francisco.
China's Exporters and Importers: Firms, Products, and Trade Partners
Kalina Manova
Stanford University
Zhiwei Zhang International Monetary Fund
June 2008
Working Paper 2008-28 http://www.frbsf.org/publications/economics/papers/2008/wp08-28bk.pdf
China's Exporters and Importers: Firms, Products, and Trade Partners
Kalina Manova* Stanford University
Zhiwei Zhang†
International Monetary Fund
June 27, 2008 Preliminary and incomplete. Please do not distribute.
Abstract. This paper provides a detailed overview of China’s participation in international trade using newly available data on the universe of globally engaged Chinese firms over the 2003-2005 period. We document the distribution of trade flows, product- and trade-partner intensity across both exporting and importing firms, and study the relationship between firms’ intensive and extensive margins of trade. We also compare trade patterns across firms of different organizational structure, distinguishing between domestic private firms, domestic state‐owned firms, foreign-owned firms, and joint ventures. We explore the variation in foreign ownership across sectors, and find results consistent with recent theoretical and empirical work on the role of credit constraints and contractual imperfections in international trade and investment. Finally, we examine the rapid expansion of China’s trade over the 2003‐2005 period, and decompose it into its extensive and intensive margins. We also use monthly data and study the frequent churning and reallocation of trade flows across firms and across products and trade partners within firms. JEL Classification codes: F10, F14, F23. Keywords: exporters, importers, multinational firms, margins of trade. _____________________ * Kalina Manova, Department of Economics, Stanford University, 579 Serra Mall, Stanford, CA 94305, [email protected]. † Zhiwei Zhang, International Monetary Fund, [email protected].
Introduction
Since joining the World Trade Organization in December 2001, China has rapidly expanded its
international trade participation and experienced a dramatic rise in multinational firm activity. In
the two years between 2003 and 2005 alone, Chinese exports grew by 86% while imports
increased by 66%, to reach $548.4 billion and $483.5 billion, respectively. Foreign-owned firms
and joint ventures have steadily captured 75% of these trade flows, but the former have expanded
faster. These aggregate patterns mask substantial reallocations and variation in activity across
firms with different ownership structure, sector affiliation and trade profile.
This paper provides a detailed overview of China’s participation in international trade
using newly available data on the universe of globally engaged Chinese firms over the 2003-2005
period. These data make it possible to examine the activities of both exporting and importing
firms, and study their product and trade partner intensity. It also allows the comparison of trade
patterns across firms of different ownership structure, distinguishing between domestic private
firms, domestic state‐owned firms, foreign‐owned firms, and joint ventures. Finally, the monthly
frequency of the data permit the analysis of firm, product and trade partner dynamics.
This level of richness and detail in firm-level trade data has so far only been available for
the U.S., and is unprecedented for other developed or developing countries. In particular, only one
other recent study (Bernard, Jensen and Schott, 2007, henceforth BJS) has examined U.S.
importing firms in addition to exporting firms, with the earlier literature focusing on exporters
only. BJS also compare the performance of domestic firms to the affiliates of foreign companies,
though they cannot distinguish between U.S.-owned and foreign-owned multinationals.1 In
contrast, we distinguish between joint ventures and the affiliates of foreign-owned multinationals,
and separate domestic private from state-owned firms. By virtue of China's size, rapid trade
expansion and range of institutional frictions, these data offer insight into firms' trade participation
decisions in general and their salience in constrained environments.
We first document the distribution of trade flows, product- and trade-partner intensity
across firms of different ownership type. Half of all trading firms both export and import goods
and capture fully 90% of trade by value. Foreign-owned firms are substantially more likely to
engage in two-way trade than joint ventures and state-owned firms, which are in turn more likely
1 They can also distinguish between trade flows that occur at arm's length or between related parties, while our dataset does not contain this information.
1

to do so than privately held domestic firms. The distribution of trade flows across firms is
extremely skewed, with firms at the 90th percentile exporting (importing) 200 (1,700) times more
than firms at the 10th percentile. Thus, the top 1% of firms (in terms of trade flows) are responsible
for 51% and 60% of all exports and imports, respectively, while the top 10% of firms conduct
80%-90% of all trade. These patterns appear independent of firm ownership type.
The lion’s share of China’s exports and imports are captured by a few multi‐product firms
that transact with a large number of destination or source countries. While 23% (19%) of all firms
export (import) only one product, they capture a mere 5.6% (2.2%) of all exports (imports). By
contrast, only 4.4% of exporters export more than 30 products, but they contribute 30% to all
exports. Similarly, only 2.6% of importers import more than 100 products, but they account for
42% of all imports. The distribution of trade-partner intensity across firms exhibits similar
patterns. On average, importers transact in more products than exporters, especially among
foreign-owned firms. On the other hand, exporters engage in trade with more countries than
importers do. This is consistent with the idea that the affiliates of foreign multinationals import
intermediate products for further processing, final assembly and potentially re-exporting.
These results add to a growing empirical literature on firms' participation in international
trade and the superior performance of exporting firms relative to non-exporters in terms of
productivity, employment, wages, skill- and capital-intensity.2 Our work is closest to that of BJS,
who examine the universe of U.S. trading firms. They document a distribution of trade flows
across U.S. firms that is even more skewed than the one we observe for China: the top 1% of
trading firms (by trade flows) account for 81% of U.S. trade. Compared to our results for China,
BJS also observe a fatter left tail in the distribution of product- and trade-partner intensity, and a
more extreme concentration of trade among trading firms with the most trade partners and the
broadest product scope.3 Finally, a much smaller fraction of trading firms both export and import
in the U.S. (17%) than in China (51%).
One possible explanation for these differences between the U.S. and China may be the role
of credit constraints and access to external financing. A number of recent papers have argued that
financial frictions limit firms' ability to become exporters and to export larger volumes (see
2 See, for example, Bernard and Jensen (1995, 1999) for the U.S., Bernard and Wagner (1997) for Germany, Clerides, Lach and Tybout (1998) for Columbia, Mexico and Morocco, and Aw, Chung and Roberts (2000) for Korea and Taiwan among others. 3 Eaton, Kortum and Kramarz (2004 a,b) find similar results for French manufacturing exporters' trade partners.
2
below). Given the stronger level of financial development in the U.S. and the evidence that smaller
firms are more credit constrained4, smaller firms may find it easier to start exporting from the U.S.
than from China. By the same logic, it may be possible for firms that trade fewer products with
fewer countries to survive in the U.S. but not in China. We find results consistent with this
explanation by comparing the export and import performance of Chinese firms with different
ownership structure. This comparison rests on the premise that foreign ownership allows affiliates
to access internal financing from their parent company, while state-ownership provides easier
access to financing from China's state banks relative to private ownership.
When we look at the relationship between the extensive and intensive margins of trade at
the firm-level, interesting patterns emerge. Among domestic firms (both state-owned and
privately-held), firms that trade more products trade less per product. Among foreign-owned firms
and joint ventures, this relationship is non-monotonic and follows a U-shape: trade per product is
lowest for firms with an intermediate level of product intensity. When we break down firms by
trade partner intensity, trade profile becomes more important than ownership structure: Importers
which source products from more countries import more per country regardless of ownership type.
Exporters, on the other hand, exhibit a U-shape: average exports per destination are lowest for
firms in the middle of the distribution by number of trade-partners.
These results contribute to an active recent literature on the operations of multi-product
firms. Bernard, Redding and Schott (2006b) propose that firm productivity is a combination of
firm-level ability and firm-product-level expertise. Since higher firm-level ability raises a firm's
productivity across all products, their model predicts a positive correlation between a firm's
product scope and exports per product.5 More recently, Arkolakis and Muendler (2007) find a
negative correlation between product scope and average worldwide exports per product in a panel
of Brazilian manufacturing exporters. However, they show that this correlation is positive within a
given destination country. They extend the Melitz (2003) model to a multi-product firm context,
and introduce product-level fixed costs of exporting to any given country. They conclude that
these costs need to strictly increase in product scope at the destination to rationalize their findings.
Our results suggest that there may be important differences between the cost structure of exporting
4 See, for example, Beck, Demirgüç-Kunt, Laeven and Levine (2005), Beck, Demirgüç-Kunt and Maksimovic (2005), and Forbes (2007). 5 See also Chaney (2008) on the response of the extensive and intensive margins of trade to trade costs in the presence of single-product firms and firm heterogeneity.
3
and importing at the country-product level. In addition, firm ownership type may affect either the
trade costs firms face or firms' ability to finance these costs.
In the second part of the paper, we establish some systematic patterns in the relative
prevalence of foreign ownership across sectors. We find evidence consistent with recent
theoretical and empirical work on the role of credit constraints and contractual imperfections in
determining international trade and investment. For example, Manova (2007) shows that
financially developed countries are more likely to become exporters and to export greater volumes
and a broader range of products to more destination countries. Importantly, these patterns are more
pronounced in financially vulnerable sectors that, for technological reasons, require more external
finance or are endowed with fewer collateralizable assets.6 There is also evidence that the
affiliates of multinational firms benefit from access to internal financing from their parent
company and thus have an advantage over domestic firms. For example, Desai, Foley and Forbes
(2008) show that foreign affiliates respond faster and more effectively to profitable export
opportunities than domestic firms. Following large real exchange rate devaluations, foreign
affiliates receive more financing from their parent company which allows them to increase sales,
assets and investment, while local firms contract or do not expand. However, Desai, Foley and
Forbes (2008) are not able to observe firms' export levels directly.
The detailed nature of our data allows us to more directly examine the link between credit
constraints, foreign ownership and trade. We find that foreign-owned firms capture a larger share
of Chinese exports and imports in financially vulnerable industries. While joint ventures, state-
owned and privately-held domestic firms are more common in financially less vulnerable sectors,
the former exhibit a much more balanced cross-sectoral distribution. These results are consistent
with a credit‐constraints view of international trade whereby foreign ownership provides access to
cheaper internal finance, while state ownership facilitates financing from local state‐owned banks.
Moreover, while the prior literature has focused on the effects of financial frictions on exporting,
our results suggest they may play an equally important role in importing.
We also find evidence consistent with recent property-rights models of firms' decision to
locate production abroad and keep it within firm boundaries. In a series of papers, Antràs (2003)
and Antràs and Helpman (2004, 2008) have shown that in the presence of imperfect
6 See also Beck (2002, 2003), Becker and Greenberg (2005) and Manova (2008) among others for evidence on the effects of credit constraints on aggregate country-level exports. Greenaway, Guariglia and Kneller (2007) show that U.K. exporters are less financially constrained than non-exporting firms.
4
contractibility, firms will choose to outsource or integrate their suppliers depending on the relative
importance of the two parties' relationship-specific investments. In line with the predictions of
these models, Antràs (2003) finds that a larger share of U.S. trade occurs intra-firm instead of
arm's length in capital- and R&D-intensive sectors. Feenstra and Hanson (2005), Yeaple (2006),
Nunn and Trefler (2008), and Bernard, Jensen, Redding and Schott (2008) have presented further
evidence for the property-rights approach using alternative sector-level measures of input
relationship-specificity and contractibility.7
While our data do not allow us to distinguish between intra-firm and arm's-length trade
flows, we are able to document the cross-sector variation in the share of Chinese exports and
imports conducted by the affiliates of foreign multinationals. We find that this share is relatively
higher in more R&D-intensive sectors. By comparison, joint ventures are almost evenly
represented in high- and low-R&D industries, while domestic firms (both private and state-owned)
are substantially more active in sectors with low R&D intensity. A similar pattern emerges when
we use product differentiation as a proxy for relationship-specificity (as in Nunn and Trefler,
2008): foreign affiliates and joint ventures mediate a larger share of trade flows in differentiated
goods relative to homogeneous products. On the other hand, the variation in firm ownership across
sectors with different levels of capital intensity exhibits some surprising patterns. The share of
exports captured by foreign-owned (domestic) firms is highest (lowest) in sectors with medium
levels of capital intensity. By contrast, foreign affiliates account for a larger fraction of imports in
industries with low and medium capital-intensity, while domestic firms are more active in
industries with high capital intensity.
In the last part of the paper, we examine the rapid expansion of China’s exports and
imports over the 2003‐2005 period, and decompose trade growth into its extensive and intensive
margins. Total exports (imports) increased by 86% (66%) over these two years, with more than
70% of this growth due to surviving firms expanding their trade flows. At the firm level, half of
these gains reflect deepening in exports and imports of surviving products to existing trade-
partners, while the other half comes from expansion in product scope and trade-partners.
Aggregating across all firms, however, almost the entire growth in exports and imports can be
attributed to the intensive margin: Average Chinese trade flows per product and average Chinese
7 See Antràs, Desai and Foley (2007) for a model which endogenizes the integration decision of multinational firms in the presence of credit constraints, relationship specific investments and contractual imperfections.
5

trade flows per trade partner increased at roughly the same rate as overall Chinese trade. These
results indicate that the biggest boost to Chinese trade came from firms expanding into products
and destination / source countries that other firms were already tapping.
These aggregate trade patterns mask significant churning and reallocations across firms, as
well as across products and trade partners within firms. Between January of 2003 and December
of 2005, the number of exporters and importers grew by 45% and 22% respectively, with the
number of private domestic and foreign-owned firms expanding and the number of state-owned
firms and joint ventures contracting. Foreign-owned firms and joint ventures are substantially
more likely to continue trading from one period to the next than state-owned companies, which
have in turn better chances than domestic private firms. Trading firms are prone to exit from and
re-enter into exporting or importing, and more than 20% of all firms do so more than once. Firms
that trade continuously over the 36 months in our data frequently change their product
composition, even within a given destination or source country. On average, roughly 40% of all
bilaterally traded products are replaced with new ones from month to month, with this ratio
negatively correlated with foreign ownership. The same is true of firms' trade partners.
These results complement evidence in the prior empirical literature on the importance of
firm and product churning in exporting.8 They also speak to the relevance of theoretical models of
intra-industry firm dynamics and intra-firm product turnover (Melitz 2003, Bernard, Redding and
Schott, 2006b,c, Costantini and Melitz, 2007).
The remainder of the paper is organized as follows. The next section describes the data on
Chinese trading firms. Section 2 documents the distribution of exports and imports across firms of
different ownership structure, and examines their product and trade partner intensity. Section 3
explores the relative prevalence of foreign ownership across sectors with different characteristics.
Section 4 decomposes China's trade growth into its extensive and intensive margins, and reviews
firm, product, and trade-partner dynamics. The last section concludes.
1. Data
We analyze a unique new database on the universe of globally engaged Chinese firms over the
2003-2005 period. These data have been collected by the Chinese Customs Office and made
8 See Pavcnik (2002), Alessandria and Choi (2007), Bernard, Redding and Schott (2006a), Besedes and Prusa (2006a,b, 2007), BJS and Eaton, Eslava, Kugler and Tybout (2008).
6
available by the Chinese authorities. They report imports and exports for all Chinese firms which
participated in international trade during this three year period. We observe firm-level trade values
(in US dollars) by product and trade partner for 243 destination/source countries and 7,526
different products in the 8-digit Harmonized System classification. For each (firm, trade partner,
product) triplet, the data also record the means of transportation (out of 19 possibilities such as air,
ship, etc.), the customs office where the transaction was processed (out of 42 offices), the region
or city in China where the product was exported from or imported to (out of 710 locations), and
any potential transfer country or region (such as Hong Kong). The dataset also provides
information on the quantities traded in one of 12 different units of measure (such as pieces,
kilograms, square meters, etc.). Finally, each firm is assigned one of 7 potential ownership types,
which we group into 4 categories: domestic state-owned firms, domestic privately-owned firms
(including collectively-owned firms), fully foreign-owned affiliates and joint ventures (foreign
ownership <100%). While the data is available at a monthly frequency, for most of the analysis we
focus on annual trade values in the most recent year in the panel, 2005. We use higher-frequency
data to examine firm, product and trade-partner dynamics in Section 5.
Some state-owned companies are pure “trading” companies which do not engage in
manufacturing and serve exclusively as intermediaries between domestic producers (buyers) and
foreign buyers (producers). In this paper, we focus on the operations of firms that both produce
and trade goods, and leave the study of “trading” companies for future work. While the data does
not classify such “trading” state-owned firms, we use key words in firms’ names to identify them.9
We can nevertheless not be sure that we have excluded all such enterprises and comment on this
as appropriate. In the rest of the paper we refer to all firms remaining in our data as trading firms.
2. China's trading firms, traded products and trade partners
In this section we document the distribution of exports and imports across firms with different
ownership type and examine their product and trade partner intensity. We also explore the
relationship between the extensive margin (number of products or trade partners) and intensive
margin (average trade per product or trade partner) of trade at the firm level. This part of the paper
intentionally stays close to the structure in BJS to allow for easier comparison of the results for
China and the U.S.. 9 We drop 23,073 “trading” firms which mediate a quarter of China’s trade by value.
7
2.1 Exporting and importing firms
In 2005, 114,483 Chinese firms participated in international trade. As Table 1 shows, half of these
firms engaged in both exporting and importing. However, this ratio varies significantly across
firms with different ownership structure. Foreign-owned firms are substantially more likely to
conduct two-way trade (67%) than joint ventures (53%) and state-owned firms (48%), which are
in turn more likely to do so than privately held domestic firms (31%). These numbers are
markedly higher than those BJS report for the United States: In 2000, 17.5% of all U.S. trading
firms both exported and imported. Moreover, in the U.S. this share was very similar for domestic
and multinational firms.
Most of the variation across Chinese firms of different ownership types comes from firms'
decision to import in addition to exporting than the other way around. Thus, the fraction of firms
that only import but do not export is roughly 15% in every ownership group, while the share of
firms that only export decreases with foreign ownership.10,11 This is consistent with the idea that
multinational companies (MNCs) operating affiliates in China are likely to import intermediate
inputs for further processing and/or final assembly before re-exporting to third destinations. By
splicing the production chain into tasks with different factor intensities, MNCs can exploit cross-
country differences in factor prices.
Table 2 shows the total value of Chinese trade flows and its breakdown by firm ownership
type. In 2005, China's exports and imports amounted to $548.2 billion and $483.3 billion,
respectively. Fully 90% of all trade was conducted by firms that both export and import. While
foreign-owned firms were 38% of all trading firms, they captured half of all exports and imports.
Joint ventures accounted for another quarter of aggregate trade flows. Privately-held domestic
firms were more than five times as numerous as state-owned firms (see Table 1), but they traded
much less on average and were much less likely to both export and import. For these reasons,
private domestic companies contributed much less to exports (13%) than their numbers would
suggest (32%), while state-owned firms (6.3%) claimed a larger than proportional share of exports
(10.3%). This pattern is even more extreme for imports.
10 Throughout the paper, when we say that a variable increases in foreign ownership, we will mean that it is higher for foreign-owned firms than for joint ventures, and in turn higher for joint ventures than for domestic firms. 11 Note, however, that a similar share of state-owned firms and joint ventures only export.
8
In line with results in the prior empirical literature for other countries, we find that the
distribution of trade flows across Chinese firms is extremely skewed. As Table 3 illustrates, firms
at the 90th percentile by export value export over 200 times more than firms at the 10th percentile.
This ratio is an astounding 1,700 for importing firms. This difference is mostly driven by a much
fatter left tail in the distribution of imports than exports: While importers tend to import less than
exporters export at any percentile level, this difference is greatest for the very small trading firms.
This may indicate differences between the cost structure of importing and exporting (such as a
lower fixed cost for the former) that make low levels of imports optimal for some importers but
low levels of exports unfeasible for exporters.
Simple averages suggest that state-owned firms trade greater volumes than foreign owned
firms, which have a slight advantage over joint ventures and a more pronounced lead over private
domestic firms. These differences appear to be driven by the top 25% of state-owned firms and a
generally longer and fatter right tail in their distribution of firm-level trade values. This speaks to
the anecdotal evidence that a sizeable share of state-owned firms specialize in trading and serving
as intermediaries between domestic and foreign buyers and producers, but do not conduct much
manufacturing themselves. It is likely that the filter we used to exclude these firms has missed
some of these big trading companies.
As these skewed distributions would imply, the vast majority of Chinese trade is conducted
by a few very active firms (see Table 4). The top 1% of firms (in terms of trade flows) are
responsible for 51% and 60% of all exports and imports, respectively, while the top 10% of firms
capture 80%-90% of all trade. The bottom half of all exporters account for less than 2% of China's
exports and the bottom 75% of all importers channel less than 3% of China's imports. Among
private firms, the concentration of exports and imports in the top 1%-5% firms increases with
foreign ownership. The distribution of trade values across state-owned firms does not fit neatly in
this pattern as it is much more concentrated for imports than for exports. Of note, BJS report an
even more skewed distribution for the United States, with the top 1% of firms performing 81% of
U.S. trade. This suggests that there is a fringe of firms which can viably export and import at a
small scale in the United States, but not in China.
9
2.2 Exporters' and importers' product intensity
There is tremendous variation in product and trade partner intensity across Chinese exporters and
importers. There are also some systematic differences across firms of different ownership type.
On average, Chinese importers transact in more products than exporters, although the
distribution of product intensity has a much longer right tail among exporters. As Table 5 shows,
the average number of products traded is 9.3 for exporters and 17.1 for importers, where goods are
classified according to the 8-digit HS system. This comparison, however, masks important
differences across firms with different organizational structures. Note first that state-owned
companies have a higher than average product intensity, and import and export roughly the same
number of products on average (21.5 and 22.9 respectively). Some transact in the broadest range
of goods observed across all firms, reaching a maximum of 1,610 products exported and 767
products imported.12 These are likely trading companies that engage in little or no manufacturing.
Interesting patterns emerge among private firms. Foreign affiliates and joint ventures
import roughly three times as many products on average as they export. In contrast, the average
private domestic firm exports 50% more products than it imports. In absolute levels, average
import product intensity is increasing in foreign ownership, while that of exports is decreasing.
Similarly, the maximum number of products traded by any foreign-owned firm or joint venture is
higher for importers than for exporters, while the converse holds for private domestic firms. Recall
(Table 1) that a much bigger share of foreign firms than private domestic firms both export and
import. The evidence on product intensity thus reinforces the idea that foreign firms are likely to
engage in vertical and export-platform FDI in China, and to assemble (many) imported products
into (fewer) final goods for re-exporting.
The lion's share of China's trade is conducted by a few firms that trade the broadest range
of products. Table 6 reports the distribution of firms across different bins by product intensity
(odd-numbered columns) and the percent share of total exports or imports firms in each bin
capture (even-numbered columns). While 23% (19%) of all exporters (importers) trade only one
product, they mediate only 5.6% (2.2%) of all exports (imports). By contrast, only 4.4% of
exporters export more than 30 products, but they contribute 30% to all exports. Similarly, only
2.6% of importers import more than 100 products, but they account for 42% of all imports.
12 The overall maximum number of products imported is 868, held by private domestic firms.
10
In comparison, BJS report a significantly more skewed distribution of firms across
product-intensity bins for the United States. In 2000, 38% of all U.S. exporters and 32% of all
U.S. importers traded exactly one product, but they captured a mere 0.7% of all trade. By contrast,
15% of all U.S. exporters and 21% of all U.S. importers transacted in more than 10 products, but
they mediated more than 92% of all U.S. trade flows. Combined with the conclusion from the end
of the previous section, this suggests that firms which trade small volumes in a few (or even only
one) products may be viable in the United States but not in China.
2.3 Exporters' and importers' trade partner intensity
When we turn to the trade partner intensity of Chinese firms, we also find a very skewed
distribution. On average, exporters sell in 7.5 destination markets, while importers source products
from 4 origin countries (Table 8). This pattern is also reflected in the maximum number of trade
partners among all exporters (144) and importers (67). It is also the case that, among firms with
the same ownership structure, the average exporter transacts with more trade partners than the
average importer. However, this difference is greatest for domestic firms (both state-owned and
privately-held) and decreases with foreign ownership. Perhaps surprisingly, foreign owned firms
on average export to fewer destination markets (6.0) than joint ventures (7.4), which in turn sell in
fewer countries than private domestic firms (8.7). By contrast, the opposite ranking obtains for
importing, with foreign firms sourcing products from more countries than private domestic firms.
State-owned firms transact with the greatest number of destination markets (11.2) and source
countries (5.6) on average.
These results may indicate that foreign-owned companies and joint ventures operate a
more global production network than private domestic firms, and source intermediate inputs from
more countries to minimize production costs. A number of explanations may account for foreign
firms' relatively lower export trade partner intensity. Foreign affiliates and joint ventures may
conduct intermediate stages of production in China, and re-export unfinished goods for further
processing to affiliates in other countries. Since foreign firms likely do not maintain affiliates in
all final consumer markets, they may record a lower trade partner intensity in China compared to
domestic firms. In addition, foreign-owned firms may produce more specialized goods that fewer
(more developed) countries demand or that require marketing and repackaging in entrepôt centers
like Hong Kong. By contrast, domestic firms may specialize in serving as distribution networks
11
(state-owned firms) or in manufacturing standardized intermediate inputs for final good producers
in many countries (private domestic firms). This explanation would be consistent with the
property rights view of MNCs (see section 3.1 below).
As with firms' product-intensity, the bulk of China's trade is conducted by a few firms that
transact with the greatest number of countries. Table 9 presents the distribution of firms across
different bins by trade partner intensity (odd-numbered columns) and the percent share of total
exports or imports firms in each bin capture (even-numbered columns). While 27% (35%) of all
exporters (importers) trade with only one country, they account for only 6.2% (2.4%) of all
exports (imports). By contrast, only 4.1% of exporters sell to more than 30 markets, but they
mediate a third of all exports. The distribution of imports across firms is even more skewed: only
0.3% of importers source products from more than 30 countries, but they contribute almost a
quarter of all imports. The 22% (8%) of exporters (importers) that trade with more than 10
countries channel two thirds of China's trade.
Combining the results for product- and trade-partner intensity, we conclude that China's
exports and imports are concentrated in a few multi-product firms that transact with a large
number of destination or source countries. The left half of Table 11 illustrates the joint distribution
of firms by product intensity (rows) and trade partner intensity (columns), while the right half of
the table records the percent share of total exports or imports firms in each bin capture. Most firms
trade a few products with a few countries, and enter in the upper left corner of the table. However,
the lion's share of trade is mediated by the few firms that are active in many products and
countries in the lower right corner. For example, 12.3% (16.3%) of all exporters (importers) trade
exactly one product with one country, but their trade amounts to only 1.4% (0.6%) of all exports
(imports). In contrast, the 2.9% exporters and 5.4% importers who trade more than 30 products
with more than 10 countries are responsible for 27% and 54% of total Chinese exports and
imports, respectively.
Our results on firm trade partner intensity once again highlight important differences
between Chinese and U.S. firms. BJS document a significantly more skewed distribution of trade
flows across firms with different trade partner intensity in the United States. In 2000, more than
half of all U.S. trading firms transacted with exactly one country, but they captured a mere 3-4%
of all trade. By contrast, 8% (4%) of all U.S. exporters (importers) traded with more than 10
countries, but they conducted 78% (86%) of all U.S. exports (imports). Summarizing the evidence
12
so far, there are more firms which trade small volumes in a few products with a few countries in
the United States than in China.
One possible explanation for the distinctions between the U.S. and China may be
differences in firms' access to external financing in the two countries. A number of recent papers
have argued that financial frictions limit firms' ability to become exporters and to export larger
volumes. For example, Manova (2007) proposes a Melitz (2003) type model in which firms face
credit constraints in the financing of export costs and financial contractibility varies across
countries. In that framework, more productive firms have higher export revenues and find it easier
to incentivize investors and obtain the necessary outside finance to produce and export. Hence the
productivity cut-off for exporting will be lower in economies with better financial development. In
addition, in the presence of destination-country specific fixed costs of exporting, firms will be able
to sell in more markets when they have more access to external financing. At the same time, less
productive, small firms which would optimally export to only the most profitable destinations will
be more likely to survive in financially developed countries. While Manova (2007) doesn't explore
multi-product firms, an extension of the model with product- or product-market specific fixed
export costs could generate similar results for firms' product intensity. These predictions square
well with evidence in the corporate finance literature that smaller firms are more credit
constrained.13 Finally, note that the trade literature has not proposed comparable firm-level models
of importing. Nevertheless, the results for exporting would naturally translate if importing also
entails fixed costs and importers are heterogeneous in marginal costs.
Given that the United States have much better developed loan and equity markets than
China, smaller firms may find it easier to start exporting from the U.S. than from China. By the
same logic, it may be possible for less productive firms that optimally trade fewer products with
fewer countries to survive in the U.S. but not in China. This would explain the more skewed
distributions BJS document for the United States than we record for China. Our results for the
variation in trade patterns across firms with different ownership structure provide further evidence
consistent with this explanation. Foreign affiliates, and to a lesser degree joint ventures, have
access to internal financing from their parent or related foreign company. This can justify why
foreign-owned firms tend to perform better (in terms of total firm trade flows, product and trade-
13 See, for example, Beck, Demirgüç-Kunt, Laeven and Levine (2005), Beck, Demirgüç-Kunt and Maksimovic (2005), and Forbes (2007).
13
partner intensity) than joint ventures, which in turn lead private domestic firms. At the same time,
state ownership facilitates access to local financing from China's state banks relative to private
ownership. This may be why state-owned firms outperform private domestic firms, and are in
some respects comparable to foreign firms. We examine the credit constraints hypothesis more
carefully in section 3.2 below.
2.4 Firms' intensive and extensive margin of trade
We next study the relationship between the extensive and intensive margins of trade at the firm-
level, and find that firm ownership and trade profile (exporter or importer) play an important role.
In Table 7, we first document how the average value of exports and imports per product
(product scale) varies with product scope and organizational structure. The simple correlation
between product intensity and product scale is close to zero for both for exporters and importers.
These weak correlations mask important differences between Chinese-owned and foreign-owned
firms. Among domestic firms (both state-owned and privately-held), firms that trade more
products trade less per product. Among foreign-owned firms and joint ventures, this relationship is
non-monotonic and follows a U-shape: trade per product is lowest for firms with an intermediate
level of product intensity. This pattern describes both exporters and importers.
These results contribute to an active recent literature on the operations of multi-product
firms. A few different opposing forces could generate either a positive or a negative relationship
between the extensive and the intensive margin. Assume first that all products potentially available
to a firm are identical in terms of cost structure and profitability. When firm-level economies of
scale are more important than product-level economies of scale, larger firms should both
produce/export more products and produce/export more per product. This would be the case if, for
example, technological know-how, managerial control and marketing research for a specific
destination market were easily deployable across products. On the other hand, firms may face
limited managerial capacity and experience diminishing returns to scope but increasing returns to
scale. When the latter effect dominates, the intensive and extensive margins would be negatively
correlated.
In recent work, Bernard, Redding and Schott (2006b) propose that firm productivity is a
combination of firm-level ability and firm-product-level expertise. In this framework, the products
available to a firm differ in their cost structure and profitability. Since higher firm-level ability
14
raises a firm's productivity across all products, this model predicts a positive correlation between a
firm's product scope and exports per product. BJS in fact observe such a positive correlation in
their data for U.S. firms. On the other hand, an extension of the Manova (2007) model to multi-
product firms could generate a negative relationship between scope and scale. If firms can export a
variety of products with different levels of profitability, they would choose to export the most
profitable goods subject to their credit constraint. Thus firms would optimally expand their
product range in decreasing order of product profitability until they exhaust the external financing
available to them. (More productive) firms that face less financial constraints will go further down
this product ladder, record higher product intensity, and have lower product scale because they
will sell smaller values of less profitable goods on the margin.
Our results suggest that the credit-constraints and limited managerial capacity effects may
dominate in the case of domestic firms in China (both state-owned and privately-held). As for
foreign affiliates and joint ventures, they appear subject to the same forces to a lesser degree,
potentially because they have access to internal financing or higher-skilled management. The U-
shape these firms exhibit suggests that they also experience powerful increasing returns to scale.
One possible explanation for this distinction is that foreign-owned firms operate in sectors
intensive in technological knowledge and generalizable firm-level ability that can be deployed
across products. The results in section 3.1 below are consistent with this observation.
We also examine the relationship between firms’ intensive and extensive margin by
looking at their trade partner intensity and their average exports (imports) per country. As Table
10 shows, we no longer observe sharp differences across firm ownership types. Instead, firms’
trade profile becomes important: Importers which source products from more countries import
more per country regardless of ownership type. Exporters, on the other hand, exhibit a U-shape:
average exports per destination are lowest for firms in the middle of the distribution by number of
trade-partners.
In Table 12, we classify firms according to both their product- (rows) and trade partner
intensity (columns). For each bin, we then report average firm sales by country-product. Looking
at the first row and column in each panel is instructive. Among firms that only transact with one
country, product scale is decreasing in product scope. Among firms that only trade one product,
trade partner intensity and scale are positively correlated for importers and negatively correlated
15

for exporters. Less obvious patterns emerge in the rest of the matrix because of the complex
underlying relationships we have seen in Tables 7 and 10.
These results add to recent evidence from a panel of Brazilian manufacturing exporters in
Arkolakis and Muendler (2007). They find a negative correlation between product scope and
average worldwide exports per product, but a positive correlation within a given destination
country. They extend the Melitz (2003) model to a multi-product firm context, and introduce
product-level fixed costs of exporting to any given country. They conclude that these costs need to
strictly increase in product scope at the destination to rationalize their findings.14 On the other
hand, BJS report a positive correlation between trade partner intensity and average trade per
country for U.S. exporters and importers.
Taken as a whole, this earlier evidence and our own results suggest that we have yet to
understand a range of firm-level decisions in international trade. In particular, there may be
important differences between the cost structure of exporting and importing at the country-product
level. In addition, firms’ organizational structure may affect their production/trade costs or their
ability to finance these costs. Finally, the disparities across country studies highlight the
importance of the institutional environment in which firms operate.
3. Foreign ownership across sectors
While the incentives for firms to relocate (parts of) their production process to a foreign country
have been well understood for a while,15 the decision to conduct foreign operations within the
boundaries of the firm has only recently been examined. Understanding the location and
integration decisions of multinational companies is important, not least because one third of world
trade is intra-firm trade between affiliated parties and another one third is trade between an MNC
affiliate and an unrelated party (Zeile, 1997).
There is substantial variation in MNC activity across sectors, which has proven very
helpful in isolating key determinants of firms' organizational choices. In this section, we explore
the relative prevalence of foreign ownership across industries with different characteristics. We
find evidence consistent with recent theoretical and empirical work on the role of credit constraints
and contractual imperfections in shaping international trade and investment. 14 We plan to examine the correlation between product scope and trade per product within destinations in the future. 15 See, for example, Brainard (1997), Markusen and Venables (2000) and Helpman, Melitz and Yeaple (2004) for models of horizontal FDI, and Helpman (1984) for a treatment of vertical FDI.
16
3.1 Foreign ownership and imperfect contractibility
In a series of papers, Antràs (2003) and Antràs and Helpman (2004, 2008) have shown that, in the
presence of imperfect contractibility, firms will choose to outsource or integrate their suppliers
depending on the relative importance of the two parties' relationship-specific investments. When
ex ante contracts are not enforceable, final- and intermediate-good producers will bargain ex post,
when any investment is sunk. If both agents need to make relationship-specific investments which
offer a low outside option, there will be a two-sided hold-up problem, and both parties will
underinvest. However, ownership provides residual rights of control, and can be used to align the
incentives of the agent whose investment is relatively more important. Assuming that the
headquarters of multinational firms are responsible for headquarter services (such as R&D and
brand development) and capital investments, these models predict that we should see relatively
more integration (FDI activity) and less outsourcing in capital- and R&D-intensive sectors.
In line with these predictions, Antràs (2003) and Yeaple (2006) find that a larger share of
U.S. trade occurs intra-firm instead of arm's length in capital- and R&D-intensive sectors. Nunn
and Trefler (2008) present further evidence for the property-rights approach using an alternative
sector-level index of input relationship-specificity and contractibility. They use the Rauch (1999)
classification and input-output tables to construct a measure of the share of inputs in a sector that
are differentiated (i.e. not traded on an organized exchange or listed in reference-price
publications).16 Finally, Feenstra and Hanson (2005) study the organization of Chinese exporting
firms by distinguishing between plant ownership and control over inputs (Chinese or foreign).
While our data do not allow us to separately identify intra-firm and arm's-length trade
flows, we are able to document the cross-sector variation in the share of Chinese exports and
imports conducted by the affiliates of foreign multinationals. As joint ventures balance foreign
with domestic ownership, we expect that there distribution across sectors will fall between that of
foreign affiliates and domestic companies.
We first show that foreign affiliates and joint ventures in China mediate a larger share of
Chinese trade in differentiated goods relative to domestic companies.17 Table 13 summarizes the
16 Nunn (2007) uses a similar measure of relationship-specificity of inputs across sectors to show that in the presence of contractual frictions, country level contract enforcement becomes a source of comparative advantage. See also Bernard, Jensen, Redding and Schott (2008) who propose a different sector measure of product contractibility based on the degree of intermediation in the exports of that product. 17 We use Rauch's (1999) methodology to classify HS-8 products in our data as differentiated or homogeneous.
17
distribution of trade flows by ownership structure and product type. Foreign firms capture 47% of
all exports and 57% of all imports of differentiated goods, compared to 27% and 13% respectively
for domestic firms (state-owned and privately-held combined). In contrast, only 18% (35%) of all
exports (imports) of homogeneous goods are conducted by foreign firms. As expected, joint
ventures fall in between these extremes and account for 27-30% of trade in both product
categories.
We also find results consistent with the property rights model of MNC activity when we
distinguish between sectors with low and high levels of R&D intensity (Table 14).18 Foreign-
owned firms account for 59% of all Chinese trade in high R&D intensity sectors, compared to
30% of all exports and 41% of all imports of low R&D intensity goods. By contrast, local firms
are substantially more active in sectors with low R&D intensity (41% of exports and 31% of
imports) relative to sectors intensive in R&D (15% and 16%). Perhaps not surprisingly, the share
of trade flows captured by joint ventures always falls between that of foreign and domestic firms,
and, at 25%-29%, does not vary significantly across sectors. Similar patterns obtain when we
divide sectors into low, medium and high R&D intensity.
In contrast to these results for product differentiation and R&D intensity, the variation in
firm ownership across sectors with different levels of capital intensity exhibits some surprising
patterns. As Table 15 illustrates, the share of exports captured by foreign-owned firms is highest
(60%) in sectors with medium levels of capital intensity. Moreover, that share is twice as high for
low capital intensity industries (40%) as for high intensity sectors (22%). On the other hand,
domestic firms (state-owned and privately-held combined) account for 51% of exports in high-,
14% in medium- and 34% in low- capital intensity industries. As for imports, foreign affiliates on
average contribute 60% to trade in low and medium capital-intensity industries, but only 37% for
very capital intensive goods. At the same time, domestic importers are most active in industries
with the highest capital-to-labor ratios. Joint ventures are responsible for roughly the same fraction
of exports and imports in all sectors (25%-30%).
There are a number of reasons why our findings for the relationship between capital
intensity and foreign ownership may differ from those in the prior literature. Recall that we can
only observe the sector in which firms export or import, but cannot distinguish between arms-
18 The data on sectors' capital- and R&D intensity comes from Kroszner, Laeven and Klingebiel (2007). Although both variables are continuous, many sectors exhibit R&D intensity levels close to 0 so we only distinguish between low and high R&D intensity. On the other hand, we group sectors into low, medium and high capital intensity.
18
length and intra-firm trade. It may thus well be the case that the share of intra-firm trade in total
Chinese trade is highest in the most capital intensive sectors. For this to be the case, however,
there would have to be substantial differences between the share of intra-firm trade specifically
among foreign firms in different sectors – differences big enough to overturn the ranking of
foreign affiliates’ share in total Chinese exports. An alternative explanation may be that these
simple split-sample summary statistics mask important differences across firms and sectors that
need to be controlled for. Finally, these results speak more to the scale at which firms operate than
the efficiency or profitability of their capital investments. It is possible that institutional frictions
and governmental support for certain industries may distort firm outcomes. These potential
rationalizations remain speculative, and our results somewhat of a puzzle.
3.2 Foreign ownership and credit constraints
Standard international trade models emphasize cross-country differences in factor endowments
and productivity levels as sources of comparative advantage, and tend to overpredict the volume
of trade relative to what is observed in the data. While these classical models assume free
reallocation of resources across sectors, a new and quickly growing literature examines the role of
institutional frictions. In particular, a number of theoretical and empirical papers have shown that,
in the presence of credit constraints, financial development becomes a source of comparative
advantage.19 For example, Manova (2007) shows that financially developed countries are more
likely to become exporters and to export greater volumes and a broader range of products to more
destination countries. Importantly, these patterns are more pronounced in financially vulnerable
sectors that, for technological reasons, require more external finance or are endowed with fewer
collateralizable assets.20
While local financial markets are important and may be the only option for many firms,
foreign portfolio and direct investment provide an alternative source of financing. Manova (2008),
for example, shows that countries which liberalize their equity markets experience a rise in their
exports that is disproportionately greater in sectors intensive in outside finance and in sectors with
few tangible assets. There is also evidence that the affiliates of multinational firms benefit from 19 See Kletzer and Bardhan (1987), Beck (2002), Matsuyama (2005), Ju and Wei (2005), and Chaney (2005) for different models of credit constraints and international trade. For related empirical evidence see also Beck (2002, 2003), Becker and Greenberg (2005), and Greenaway, Guariglia and Kneller (2007). 20 Rajan and Zingales (1998), Braun (2003), and Claessens and Laeven (2003) introduced these sectoral measures and used them to show that financially developed countries grow relatively faster in financially vulnerable sectors.
19
access to internal financing from their parent company and thus have an advantage over domestic
firms. For instance, Desai, Foley and Forbes (2008) find that foreign affiliates respond faster and
more effectively to profitable export opportunities than domestic firms. Following large real
exchange rate devaluations, affiliates receive more financing from their parent company which
allows them to increase sales, assets and investment, while local firms contract or do not expand.
The evidence in the prior literature suggests that multinational firms may have a
comparative advantage and be more active in financially vulnerable sectors relative to domestic
firms. Unfortunately, Desai, Foley and Forbes (2008) are not able to observe firms' export levels
directly. In recent work, Antràs, Desai and Foley (2007) propose a model which endogenizes the
integration decision of multinational firms in the presence of credit constraints, relationship
specific investments and contractual imperfections. In their framework, multinational firms are
more likely to integrate their foreign suppliers in financially less developed countries in order to
incentivize local investors to finance these suppliers. Parent companies are also likely to partly
fund their affiliates’ operations. Using data on the activities of U.S. multinationals abroad, Antràs,
Desai and Foley (2007) find support for these prediction. They do not, however, examine foreign
affiliate exports, how they compare to those of domestic firms, or how they vary across sectors.
The detailed nature of our data allows us to more directly examine the link between credit
constraints, foreign ownership and trade. In Table 16, we study the distribution of trade flows
across firms with different organizational structure. We find that foreign-owned firms capture a
larger share of Chinese exports and imports in industries which require more external finance.21
For example, they channel 65% of all imports in sectors with the greatest need for outside capital,
but only 48% of imports in the bottom third sectors. The corresponding numbers for exports are
53% and 42%. In contrast, state-owned and privately-held domestic firms are more common in
industries with low and medium levels of external finance dependence. State enterprises have
some advantage over private domestic firms and are relatively more active in sectors with
moderate requirements for outside funds. As in the previous section, joint ventures fall between
fully foreign-owned and fully domestic firms.
We obtain very similar results when we consider the relative prevalence of organizational
structures across sectors at different levels of asset tangibility (Table 17). The share of exports and
21 The data on sectors' external finance dependence and asset tangibility comes from Kroszner, Laeven and Klingebiel (2007), and is constructed following the methodology of Rajan and Zingales (1998) and Claessens and Laeven (2003).
20
imports mediated by foreign firms is strictly decreasing in sectors’ endowments of collateralizable
assets, while that of domestic firms is strictly increasing. Hence, while multinational affiliates are
responsible for more than 60% of trade flows in industries with the lowest levels of asset
tangibility, they capture only 23% of exports and 35% of imports in sectors with the highest asset
tangibility. Conversely, domestic firms are much more active in the latter industries (48% of
exports and 36% of imports) than in the former (13% of exports and 11% of imports).
These results are consistent with a credit‐constraints view of international trade and
investment, whereby foreign ownership provides access to cheaper internal finance, while state
ownership facilitates financing from local Chinese state‐owned banks. They also highlight the
importance of better understanding the interaction between firms’ location, integration and
financing decisions. While the prior literature has focused on the effects of financial frictions on
exporting, our findings suggest that they may play an equally important role in importing. In
current work, Manova, Wei and Zhang (2008) pursue these questions and examine the role of
credit constraints and foreign ownership in Chinese firms’ trade participation.
4. Trade expansion and firm dynamics
4.1 China’s trade expansion, 2003 – 2005
In 2003, China's aggregate exports and imports amounted to over $290 billion each. Over the next
two years alone, the cumulative growth rate of trade was an astonishing 86% for exports and 66%
for imports. Since China joined the World Trade Organization only in December 2001, this rapid
trade expansion can be seen as China's fast convergence to a new steady state of integration in
world markets. In the last part of the paper, we examine this process, and decompose China's trade
growth into its extensive and intensive margins.
We first describe the evolution in the number of trading firms in China and the number of
products and countries China as a whole traded in. As Table 18 indicates, the number of exporters
almost doubled from 65.5 thousand in 2003 to 96.6 thousand in 2005, while the number of
importing firms grew by a third, from 57.4 to 76.4 thousand. Exports and imports per firm
expanded as well, at a more moderate rate of 25%. Aggregating across all firms, and focusing on
the variety of products China exported and imported, almost the entire growth in trade flows can
be attributed to the intensive margin: Average Chinese exports and imports per product increased
21
at roughly the same rate as overall Chinese trade, with only a 2-3% broadening of product scope.
Similar results obtain for the number of China's trade partners and average exports/imports per
country. Thus, the biggest boost to Chinese trade came from new and existing firms expanding
into products and destination / source countries that other firms had already been active in.
This period of Chinese trade expansion provides an opportunity to understand firms' export
and import decisions, and to examine how firms respond to trade liberalization. To that end, Table
19 provides a more detailed decomposition of China's trade growth by distinguishing between
surviving exporters and importers (which traded in both 2003 and 2005), new firms (which did not
trade in 2003 but did in 2005) and exiting firms (which stopped trading between 2003 and 2005).
More than 70% of Chinese trade growth can be attributed to surviving firms expanding their trade
flows. New exporters and importers contributed about 30%, while exiting firms slowed down
trade growth by only 1%.
We also explore adjustments on the intensive and extensive margin at the firm level by
focusing on the surviving firms that traded both in 2003 and 2005. Most of their expansion (60%
for exporters and 70% for importers) reflects deepening in trade flows within existing trade partner
relationships in surviving products. However, firms also reallocate a big proportion of their
activity across products and trade partners. For example, the exports of new products that
surviving firms start selling contributed 30% to total Chinese exports expansion, while exporters
that discontinued some of their products cost 13% of China's total exports. Similarly, firm entry
into new destination countries boosted overall export growth by 19%, while exit from some
markets deducted 7%. Firms are also prone to change the products they sell within a given market
even if they don't withdraw from it completely. The exports of new products to existing trade
partners added 33% to China's exports expansion, but half of that gain was neutralized by firms
discontinuing some products in these markets.22 Similar numbers obtain for importers, and the
adjustments they make to the products they import and the source countries they transact with.
These results speak to the relevance of theoretical models of intra-industry firm dynamics
and intra-firm product turnover in general, and in response to trade liberalization in particular. For
example, Melitz (2003) and Costantini and Melitz (2007) model firm-level adjustments to trade
liberalizations, and emphasize the reallocation of market shares across firms with different
22 Note that a firm need not start exporting an entirely new product, but simply introduce products it was already exporting to some countries in a new country.
22
productivity levels in the presence of fixed and sunk costs of exporting. Pavcnik (2002) and
Bernard, Jensen and Schott (2006) document the importance of these reallocations in response to
tariff reductions in Columbia and the U.S., respectively. Bernard, Redding and Schott (2006b)
provide a model of multi-product firms, and examine the reallocation of trade flows both across
firms and across products within firms. Goldberg, Khandelwal, Pavcnik and Topalova (2008)
however find limited empirical support for this model using data on the behavior of Indian firms
around trade reforms. In work in progress, Manova and Zhang study the response of multi-product
firms in China to the removal of quotas under the Multi-Fiber Agreement.23
4.2 Firm, product and trade partner dynamics
The decomposition of China's trade expansion between 2003 and 2005 highlights the role of
reallocations across and within firms in response to trade liberalization. At the same time, this
two-year comparison masks much more frequent churning and reallocations across firms, products
and trade partners. The monthly frequency of our data allows us to track firms over a 36-month
period, and document the continuous adjustments they make to their product scope and trade
partner intensity.
Between January of 2003 and December of 2005, the overall number of exporters and
importers grew by 45% and 22% respectively (Table 20). These rates varied substantially across
firms with different organizational structure, but were always higher for exporters than for
importers. The number of private domestic firms that trade more than doubled, while the number
of state-owned exporters (importers) contracted by 9% (14%). Foreign-owned affiliates became
significantly more numerous (48% for exports and 32% for imports), while more joint ventures
started exporting (6%) but some stopped importing (9%).
These net growth rates in firm numbers mask substantial reallocations across firms. Thirty-
two percent of all exporters and 40% of all importers traded in January 2003 but not in December
2005, and were active in 15.6 and 13.5 of the 36 months, respectively. Overall, 12% of all
exporters and 20% of all importers stop trading each month, but on average just as many new ones
enter to replace them. Foreign-owned exporters and importers are more likely to survive from one
23 See also Eaton, Eslava, Kugler and Tybout (2008) for evidence on reallocations across and within firms in Colombia.
23
month to the next (90% and 84% respectively) than joint ventures, which have in turn better
chances than domestic firms.
Trading firms are prone to exit from and re-enter into exporting or importing. Only 40% of
all exporters and 29% of all importers are active in all 36 months in 2003-2005, with these
fractions increasing in foreign ownership. Less than 10% of all firms trade continuously over this
period but for one spell of non-trading, while more than 20% switch their status more frequently.
Survival rates are slightly higher and churning less common at a quarterly frequency, but firm
dynamics exhibit otherwise similar patterns.
Firms that trade continuously over the 36 months in our data frequently change their
product composition, even within a given destination or source country. We report summary
statics about these firms' trade partner dynamics in Table 21. The average number of destination
and source countries per firm increased by 26% for exporters and 13% for importers between
January 2003 and December 2005, with little variation across ownership type. However, firms on
average replace a third of their trade partners every month. This share is decreasing in foreign
ownership, and is higher for private domestic firms than for state-owned companies. Only slightly
less churning occurs at a quarterly frequency.
In the last table, Table 22, we study the product composition of firms that trade in all 36
months, and find frequent reallocations across products. In any given month, exporters (importers)
are likely to replace 30% (35%) of their products with new ones. They also adjust the mix of
products they sell in each country: On average, 45% (40%) of all bilaterally exported (imported)
products are replaced with new ones from month to month. As with trade partner dynamics,
foreign owned firms exhibit less product churning than joint ventures, which in turn maintain a
more stable product composition than state-owned firms. Privately held domestic companies
adjust their product scope most frequently.
A consistent pattern that emerges from these firm, product and trade partner dynamics is
that foreign firms exhibit less churning. One possible explanation for this result is the role of
profitability or cost shocks in the presence of credit constraints. Easier access to finance helps
firms cover any continuation costs and increases their chance of survival. By the same logic, with
product- or country-specific shocks, financially constrained firms may be more likely to
discontinue some products or stop trading with some countries. Since foreign ownership provides
access to internal financing and state ownership facilitates access to Chinese state-owned banks,
24
credit constraints offer one explanation for our results. Using bilateral trade data at the country-
product level, Manova (2007) indeed finds that financially developed countries feature higher
product survival rates and lower product turnover, especially in financially vulnerable sectors that
require more external finance or are endowed with fewer tangible assets.24
These results complement the evidence in BJS, Bernard, Redding and Schott (2006a),
Alessandria and Choi (2007), and Besedes and Prusa (2006 a,b) on the frequency and
determinants of firm and product churning in exporting. These papers have emphasized the
productivity gains associated with within-firms reallocations in activity across products. Further
empirical evidence on firms' product and trade-partner adjustments over time will shed more light
on firms' trade participation decisions and the cost structure of exporting and importing. In
particular, the more frequent churning of products than trade partners suggests that trade may
entail bigger sunk costs of entering into new markets or sourcing from new countries than trading
new products with the same country.
5. Conclusion
This paper provides a detailed overview of China’s participation in international trade using newly
available data on the universe of globally engaged Chinese firms over the 2003-2005 period. The
lion’s share of Chinese exports and imports are mediated by a few multi-product firms which
transact with many countries. Overall, the affiliates of foreign multinationals outperform joint
ventures and state-owned enterprises in terms of trade flows, product- and trade partner intensity,
which in turn lead private domestic companies. We compare our results to those for the United
States reported in prior work, and propose that credit constraints and differences in the
institutional environment across countries may explain the differences in trade patterns.
We also explore the variation in foreign ownership across sectors, and find results
consistent with recent theoretical and empirical work on the role of credit constraints and
contractual imperfections in international trade and investment. Finally, we decompose China’s
rapid trade expansion over the 2003-2005 period into its extensive and intensive margins, and find
that almost half of the growth was due to surviving firms expanding their trade in surviving
24 Note, however, that in the presence of sunk costs of trading, easier access to financing may increase churning because firms have a lower option value of staying in during a bad shock. Our results suggest that this effect is dominated by the liquidity shock effect which goes in the opposite direction.
25
products within the same trade partners. These aggregate patterns mask substantial churning
across firms and across products and trade partners within firms. We provide some stylized facts
on firm, product and trade partner dynamics using the monthly frequency in our data.
Our results contribute to the recent theoretical and empirical literature on multi-product
heterogeneous firms in international trade, provide a number of novel stylized facts and raise some
interesting questions. First, we document broadly similar patterns for exporting and importing.
While most prior work has focused on exporting, our findings suggest that importers behave in
similar ways. One aspect of firm-level trade flows that remains to be better understood is the
relationship between firms’ intensive and extensive margins. Our results also speak to the role of
credit constraints and contractual imperfections, and suggest that such frictions have many
implications that are yet to be examined. Finally, our findings highlight the importance of inter-
firm dynamics and firm-level adjustments in product scope and trade partners, in general and in
response to trade liberalization in particular.
The detailed nature of our dataset will allow us to address many of these questions in
future work. These include the effects of credit constraints on firm level exporting and importing
outcomes; the response of multi-product firms to the removal of quotas under the Multi-Fiber
Agreement; firms’ adjustments to real exchange rate shocks; and the location of multinational
firms’ affiliates and network effects among firms, among others.
References Alessandria, G. and H. Choi (2007). "Do Sunk Costs of Exporting Matter for Net Export
Dynamics?" Quarterly Journal of Economics 122 (1), p.289-336. Antràs, P. (2003). “Firms, Contracts, and Trade Structure.” Quarterly Journal of Economics 118
(4), p. 1374-1418. Antras, P., Desai, M. and F. Foley (2007). "Multinational Firms, FDI Flows and Imperfect Capital
Markets." NBER Working Paper 12855. Antràs, P. and E. Helpman (2004). “Global Sourcing.” Journal of Political Economy 112, p.552–
80. Antràs, P. and E. Helpman (2008). "Contractual Frictions and Global Sourcing," forthcoming in E.
Helpman, D. Marin, and T. Verdier (eds.), The Organization of Firms in a Global Economy, Harvard University Press.
Arkolakis, C. and M. Mundler (2007). “The Extensive Margin of Exporting Goods: A Firm-level Analysis.” Yale University mimeo.
26

Aw, B., Chung, S., and M. Roberts (2000). “Productivity and Turnover in the Export Market: Micro-level Evidence from the Republic of Korea and Taiwan (China).” World Bank Economic Review 14 (1), p.65-90.
Beck, T. (2002). “Financial Development and International Trade. Is There a Link?” Journal of International Economics 57, p.107-31.
Beck, T. (2003). “Financial Dependence and International Trade.” Review of International Economics 11, p.296-316.
Beck, T., Demirgüç-Kunt, A., Laeven L. and R. Levine (2005). "Finance, Firm Size, and Growth." NBER Working Paper 10983.
Beck, T., Demirgüç-Kunt, A. and V. Maksimovic (2005). "Financial and Legal Constraints to Firm Growth: Does Size Matter?" Journal of Finance 60 (1), p.137-77.
Becker, B. and D. Greenberg (2005). “Financial Development and International Trade.” University of Illinois at Urbana-Champaign mimeo.
Bernard, A. and J. Jensen (1999). “Exceptional Exporter Performance: Cause, Effect or Both?” Journal of International Economics 47(1), p.1-25.
Bernard, A. and J. Jensen (1995). “Exporters, Jobs, and Wages in U.S. Manufacturing, 1976-1987.” Brookings Papers on Economic Activity, Microeconomics.
Bernard, A., Jensen, J. and P. Schott (2007). "Importers, Exporters, and Multinationals: A Portrait of Firms in the U.S. that Trade Goods." Tuck School of Business at Dartmouth mimeo.
Bernard, Jensen, Schott (2006). "Survival of the Best Fit: Exposure to Low Wage Countries and The (Uneven) Growth of US Manufacturing Plants." Journal of International Economics 68, p.219-37.
Bernard, A., Jensen, J., Redding, S. and P. Schott (2008). “Intra-Firm Trade and Product Contractability.” Tuck School of Business at Dartmouth mimeo.
Bernard, A., Redding, S. and P. Schott (2006a). "Multi-Product Firms and Product Switching." NBER Working Paper 12293.
Bernard, A., Redding, S. and P. Schott (2006b). "Multi-Product Firms and Trade Liberalization." NBER Working Paper 12782.
Bernard, A., Redding, S. and P. Schott (2006c). "Products and Productivity." Tuck School of Business at Dartmouth mimeo.
Bernard, A. and J. Wagner (1997). “Exports and Success in German Manufacturing.” Weltwirtschaftliches Archiv 133(1), p.134-57.
Besedes, T. and T. Prusa (2006a). "Ins, Outs, and the Duration of Trade." Canadian Journal of Economics 39(1), p.266-95.
Besedes, T. and T. Prusa (2006b). "Product Differentiation and Duration of US Import Trade." Journal of International Economics 70(2), p.339-58.
Besedes, T. and T. Prusa (2007). "The Role of Extensive and Intensive Marginsd and Export Growth." NBER Working Paper 13628.
Brainard, L. (1997). "An Empirical Assessment of the Proximity-Concentration Trade-off Between Multinational Sales and Trade." American Economic Review 87(4), p.520-44.
27
Braun, M. (2003). "Financial Contractibility and Asset Hardness." University of California - Los Angeles mimeo.
Chaney, T. (2005). “Liquidity Constrained Exporters.” University of Chicago mimeo. Chaney, T. (2008). “Distorted Gravity: The Intensive and Extensive Margins of International
Trade.” American Economic Review (forthcoming). Claessens, S. and L. Laeven (2003). "Financial Development, Property Rights, and Growth."
Journal of Finance 58(6), p.2401-37. Clerides, S., Lach, S. and J. Tybout (1998). “Is Learning by Exporting Important? Micro-dynamic
Evidence from Colombia, Mexico, and Morocco." Quarterly Journal of Economics 113 (3), p.903-47.
Costantini, J. and M. Melitz (2007). “The Dynamics of Firm Level Adjustment to Trade Liberalization.” CEPR mimeo.
Desai,M., Foley, F. and K. Forbes (2008). "Financial Constraints and Growth: Multinational and Local Firm Responses to Currency Depreciations." Review of Financial Studies (forthcoming).
Eaton, J., Eslava, Kugler and J. Tybout (2008). "The Margins of Entry into Exports Markets: Evidence from Columbia," in E. Helpman, D. Marin and T. Verdier, eds., The Organization of Firms in a Global Economy, forthcoming, Harvard University Press.
Eaton, J., Kortum, S. and F. Kramarz (2004a). "An Anatomy of International Trade: Evidence from French Firms." New York University mimeo.
Eaton, J., Kortum, S. and F. Kramarz (2004b). "Dissecting Trade: Firms, Industries, and Export Destinations." American Economic Review Papers and Proceedings 94(2), p. 150-54.
Feenstra, R. and G. Hanson (2005). “Ownership and Control in Outsourcing to China: Estimating the Property-Rights Theory of the Firm.” Quarterly Journal of Economics 120(2), p.729–61.
Forbes, K. (2007). "One Cost of the Chilean Capital Controls: Increased Financial Constraints for Smaller Traded Firms." Journal of International Economics 71(2), p.294-323.
Goldberg, P., Khandelwal, A., Pavcnik, N. and P. Topalova (2008). “Multi-product Firms and Product Turnover in the Developing World: Evidence from India.” Princeton University mimeo.
Greenaway, D., Guariglia, A. and R. Kneller (2007). "Financial Factors and Exporting Decisions." Journal of International Economics 73(2), p.377-95.
Helpman, E. (1984). “A Simple Theory of International Trade with Multinational Corporations.” Journal of Political Economy 92, p.451-471.
Helpman, E., Melitz, M., and S. Yeaple (2004). "Export versus FDI with Heterogeneous Firms." American Economic Review 94(1), p.300-16.
Ju, J. and S.-J. Wei (2005). "Endowment versus Finance: A Wooden Barrel Theory of International Trade." CEPR Discussion Paper 5109.
Kletzer, K. and P. Bardhan (1987). “Credit Markets and Patterns of International Trade.” Journal of Development Economics 27, p.57-70.
Kroszner, D., Laeven, L. and R. Klingebiel (2007). “Banking Crises, Financial Dependence, and Growth." Journal of Financial Economics 84(1), p.187-228.
28
29
Manova, K. (2007). "Credit Constraints, Heterogeneous Firms and International Trade." Stanford University mimeo.
Manova, K. (2008). "Credit Constraints, Equity Market Liberalizations and International Trade." Journal of International Economics (forthcoming).
Markusen, J. and A. Venables (2000). "The Theory of Endowment, Intra-industry and Multi-national Trade." Journal of International Economics 52, p.209-234.
Matsuyama, K. (2005). “Credit Market Imperfections and Patterns of International Trade and Capital Flows.” Journal of the European Economic Association 3, p. 714-23.
Melitz, M. (2003). "The Impact of Trade on Intra-Industry Reallocations and Aggregate Industry Productivity." Econometrica 71(6), p.1695-725.
Mitton, T. (2006). “Stock Market Liberalization and Operating Performance at the Firm Level.” Journal of Financial Economics 81, p.625-47.
Nunn, N. (2007). "Relationship-Specificity, Incomplete Contracts, and the Pattern of Trade." Quarterly Journal of Economics 122(2), p.569-600.
Nunn, N. and D. Trefler (2008). "The Boundaries of the Multinational Firm: An Empirical Analysis," forthcoming in E. Helpman, D. Marin, and T. Verdier (eds.), The Organization of Firms in a Global Economy, Harvard University Press.
Pavcnik, N. (2002). "Trade Liberalization, Exit, and Productivity Improvements: Evidence from Chilean Plants." The Review of Economic Studies 69, p.245-76.
Rajan, R. and L. Zingales (1998). "Financial Dependence and Growth." American Economic Review 88, p.559-86.
Rauch, J. (1999). "Networks Versus Markets in International Trade." Journal of International Economics 48, p.7-35.
Svaleryd, H. and J. Vlachos (2005). “Financial Markets, the Pattern of Industrial Specialization and Comparative Advantage: Evidence from OECD Countries.” European Economic Review 49, p.113-44.
Yeaple, S. (2006). “Offshoring, Foreign Direct Investment, and the Structure of U.S. Trade.” Journal of the European Economic Association 4, p.602–11.
Zeile, W. (1997). “U. S. Intrafirm Trade in Goods.” Survey of Current Business 77, p.23–38.
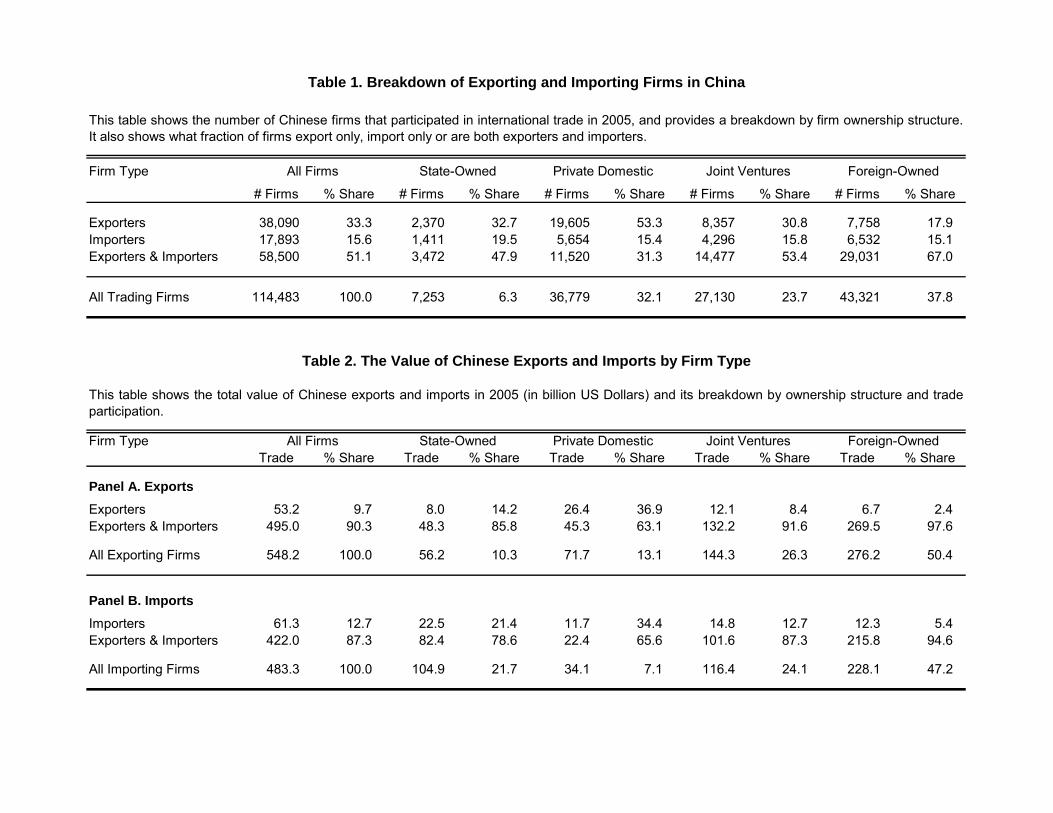
Foreign-Owned
firm ownership structure.
ship structure and trade
Foreign-Owned
Table 1. Breakdown of Exporting and Importing Firms in China
This table shows the number of Chinese firms that participated in international trade in 2005, and provides a breakdown byIt also shows what fraction of firms export only, import only or are both exporters and importers.
Firm Type All Firms State-Owned Private Domestic Joint Ventures
# Firms % Share # Firms % Share # Firms % Share # Firms % Share # Firms % Share
Exporters 38,090 33.3 2,370 32.7 19,605 53.3 8,357 30.8 7,758 17.9Importers 17,893 15.6 1,411 19.5 5,654 15.4 4,296 15.8 6,532 15.1Exporters & Importers 58,500 51.1 3,472 47.9 11,520 31.3 14,477 53.4 29,031 67.0
All Trading Firms 114,483 100.0 7,253 6.3 36,779 32.1 27,130 23.7 43,321 37.8
Table 2. The Value of Chinese Exports and Imports by Firm Type
This table shows the total value of Chinese exports and imports in 2005 (in billion US Dollars) and its breakdown by ownerparticipation.
Firm Type All Firms State-Owned Private Domestic Joint VenturesTrade % Share Trade % Share Trade % Share Trade % Share Trade % Share
Panel A. ExportsExporters 53.2 9.7 8.0 14.2 26.4 36.9 12.1 8.4 6.7 2.4Exporters & Importers 495.0 90.3 48.3 85.8 45.3 63.1 132.2 91.6 269.5 97.6
All Exporting Firms 548.2 100.0 56.2 10.3 71.7 13.1 144.3 26.3 276.2 50.4
Panel B. ImportsImporters 61.3 12.7 22.5 21.4 11.7 34.4 14.8 12.7 12.3 5.4Exporters & Importers 422.0 87.3 82.4 78.6 22.4 65.6 101.6 87.3 215.8 94.6
All Importing Firms 483.3 100.0 104.9 21.7 34.1 7.1 116.4 24.1 228.1 47.2
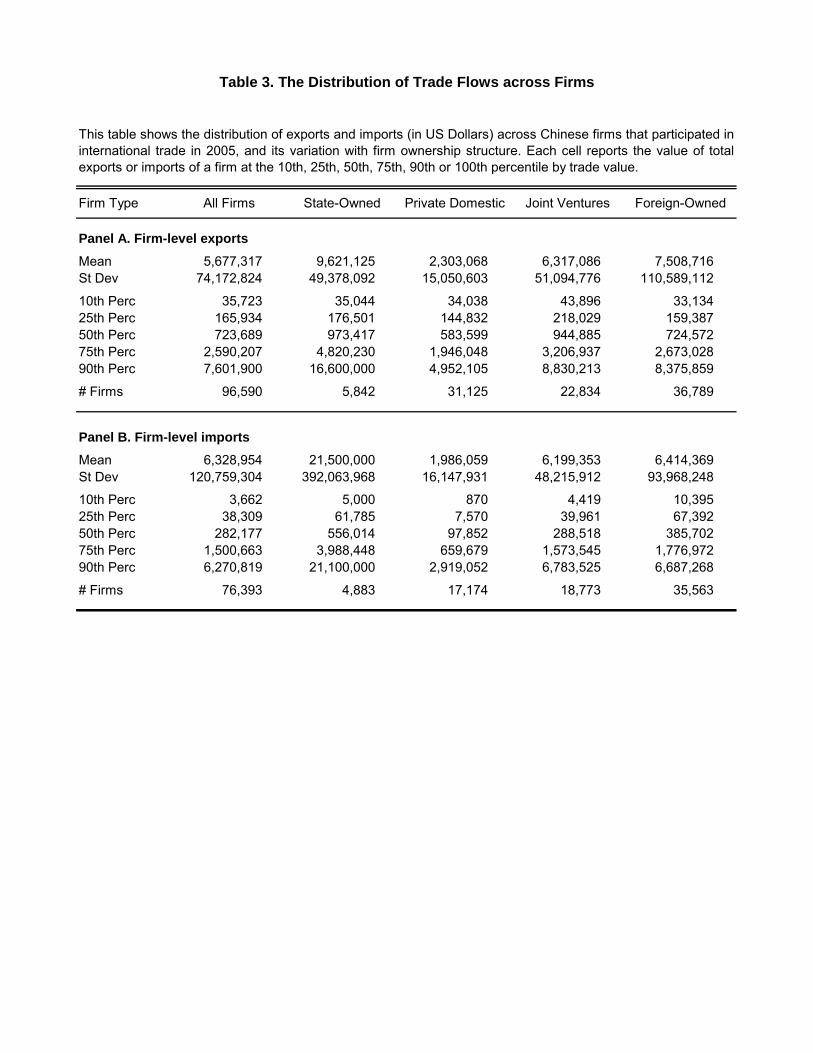
Table 3. The Distribution of Trade Flows across Firms
This table shows the distribution of exports and imports (in US Dollars) across Chinese firms that participated ininternational trade in 2005, and its variation with firm ownership structure. Each cell reports the value of totalexports or imports of a firm at the 10th, 25th, 50th, 75th, 90th or 100th percentile by trade value.
Firm Type All Firms State-Owned Private Domestic Joint Ventures Foreign-Owned
Panel A. Firm-level exportsMean 5,677,317 9,621,125 2,303,068 6,317,086 7,508,716St Dev 74,172,824 49,378,092 15,050,603 51,094,776 110,589,112
10th Perc 35,723 35,044 34,038 43,896 33,13425th Perc 165,934 176,501 144,832 218,029 159,38750th Perc 723,689 973,417 583,599 944,885 724,57275th Perc 2,590,207 4,820,230 1,946,048 3,206,937 2,673,02890th Perc 7,601,900 16,600,000 4,952,105 8,830,213 8,375,859
# Firms 96,590 5,842 31,125 22,834 36,789
Panel B. Firm-level importsMean 6,328,954 21,500,000 1,986,059 6,199,353 6,414,369St Dev 120,759,304 392,063,968 16,147,931 48,215,912 93,968,248
10th Perc 3,662 5,000 870 4,419 10,39525th Perc 38,309 61,785 7,570 39,961 67,39250th Perc 282,177 556,014 97,852 288,518 385,70275th Perc 1,500,663 3,988,448 659,679 1,573,545 1,776,97290th Perc 6,270,819 21,100,000 2,919,052 6,783,525 6,687,268
# Firms 76,393 4,883 17,174 18,773 35,563
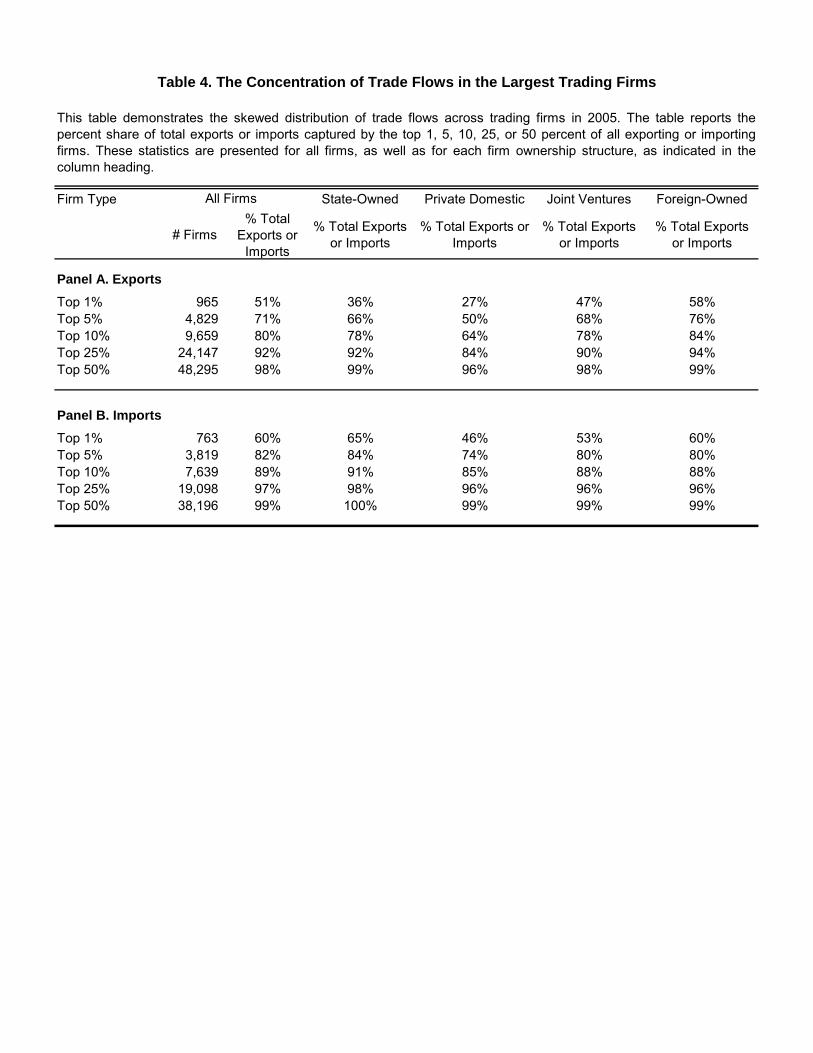
Table 4. The Concentration of Trade Flows in the Largest Trading Firms
This table demonstrates the skewed distribution of trade flows across trading firms in 2005. The table reports thepercent share of total exports or imports captured by the top 1, 5, 10, 25, or 50 percent of all exporting or importingfirms. These statistics are presented for all firms, as well as for each firm ownership structure, as indicated in thecolumn heading.
Firm Type All Firms State-Owned Private Domestic Joint Ventures Foreign-Owned
# Firms% Total
Exports or Imports
% Total Exports or Imports
% Total Exports or Imports
% Total Exports or Imports
% Total Exports or Imports
Panel A. ExportsTop 1% 965 51% 36% 27% 47% 58%Top 5% 4,829 71% 66% 50% 68% 76%Top 10% 9,659 80% 78% 64% 78% 84%Top 25% 24,147 92% 92% 84% 90% 94%Top 50% 48,295 98% 99% 96% 98% 99%
Panel B. ImportsTop 1% 763 60% 65% 46% 53% 60%Top 5% 3,819 82% 84% 74% 80% 80%Top 10% 7,639 89% 91% 85% 88% 88%Top 25%Top 25% 19 09819,098 97%97% 98%98% 96%96% 96%96% 96%96%Top 50% 38,196 99% 100% 99% 99% 99%
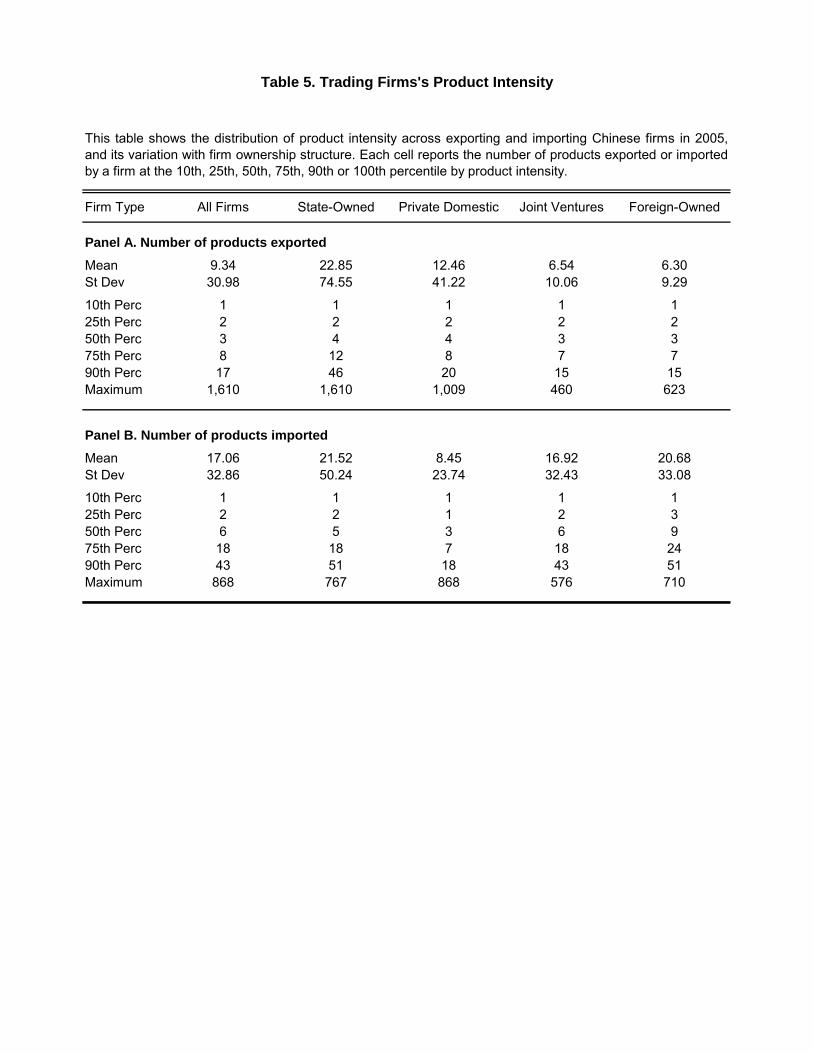
Table 5. Trading Firms's Product Intensity
This table shows the distribution of product intensity across exporting and importing Chinese firms in 2005,and its variation with firm ownership structure. Each cell reports the number of products exported or importedby a firm at the 10th, 25th, 50th, 75th, 90th or 100th percentile by product intensity.
Firm Type All Firms State-Owned Private Domestic Joint Ventures Foreign-Owned
Panel A. Number of products exportedMean 9.34 22.85 12.46 6.54 6.30St Dev 30.98 74.55 41.22 10.06 9.29
10th erc P 1 1 1 1 125th erc P 2 2 2 2 250th erc P 3 4 4 3 375th Perc 8 12 8 7 790th Perc 17 46 20 15 15Maximum 1,610 1,610 1,009 460 623
Panel B. Number of products importedMean 17.06 21.52 8.45 16.92 20.68St Dev 32.86 50.24 23.74 32.43 33.08
10th erc P 1 1 1 1 125th erc P 2 2 1 2 350th erc P 6 5 3 6 975th Perc 18 18 7 18 2490th Perc 43 51 18 43 51Maximum 868 767 868 576 710
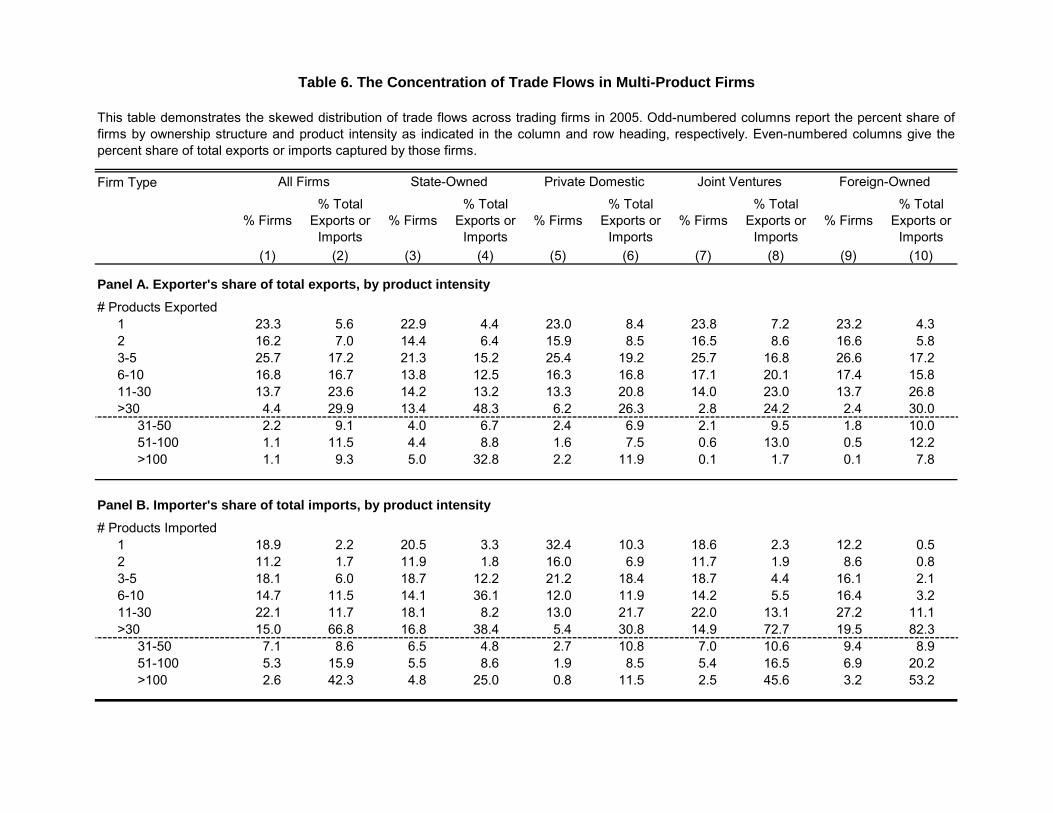
t the percent share ofbered columns give the
Foreign-Owned
Table 6. The Concentration of Trade Flows in Multi-Product Firms
This table demonstrates the skewed distribution of trade flows across trading firms in 2005. Odd-numbered columns reporfirms by ownership structure and product intensity as indicated in the column and row heading, respectively. Even-numpercent share of total exports or imports captured by those firms.
Firm Type All Firms State-Owned Private Domestic Joint Ventures
% Firms%
ExpIm
Total orts or ports
% Firms% Total
Exports orImports
% Firms% To
ExporImpo
tal ts or rts
% Firms E% Total xports or Imports
% Firms% Total
Exports or Imports
(1) (2) (3) (4) (5) (6) (7) (8) (9) (10)
Panel A. Exporter's share of total exports, by product intensity# Products Exported
1 23.3 5.6 22.9 4.4 23.0 8.4 23.8 7.2 23.2 4.32 16.2 7.0 14.4 6.4 15.9 8.5 16.5 8.6 16.6 5.83-5 25.7 17.2 21.3 15.2 25.4 19.2 25.7 16.8 26.6 17.26-10 16.8 16.7 13.8 12.5 16.3 16.8 17.1 20.1 17.4 15.811-30 13.7 23.6 14.2 13.2 13.3 20.8 14.0 23.0 13.7 26.8>30 4.4 29.9 13.4 48.3 6.2 26.3 2.8 24.2 2.4 30.0
31-50 2.2 9.1 4.0 6.7 2.4 6.9 2.1 9.5 1.8 10.051-100 1.1 11.5 4.4 8.8 1.6 7.5 0.6 13.0 0.5 12.2>100 1.1 9.3 5.0 32.8 2.2 11.9 0.1 1.7 0.1 7.8
Panel B. Importer's share of total imports, by product intensity# Products Imported
1 18.9 2.2 20.5 3.3 32.4 10.3 18.6 2.3 12.2 0.52 11.2 1.7 11.9 1.8 16.0 6.9 11.7 1.9 8.6 0.83-5 18.1 6.0 18.7 12.2 21.2 18.4 18.7 4.4 16.1 2.16-10 14.7 11.5 14.1 36.1 12.0 11.9 14.2 5.5 16.4 3.211-30 22.1 11.7 18.1 8.2 13.0 21.7 22.0 13.1 27.2 11.1>30 15.0 66.8 16.8 38.4 5.4 30.8 14.9 72.7 19.5 82.3
31-50 7.1 8.6 6.5 4.8 2.7 10.8 7.0 10.6 9.4 8.951-100 5.3 15.9 5.5 8.6 1.9 8.5 5.4 16.5 6.9 20.2>100 2.6 42.3 4.8 25.0 0.8 11.5 2.5 45.6 3.2 53.2
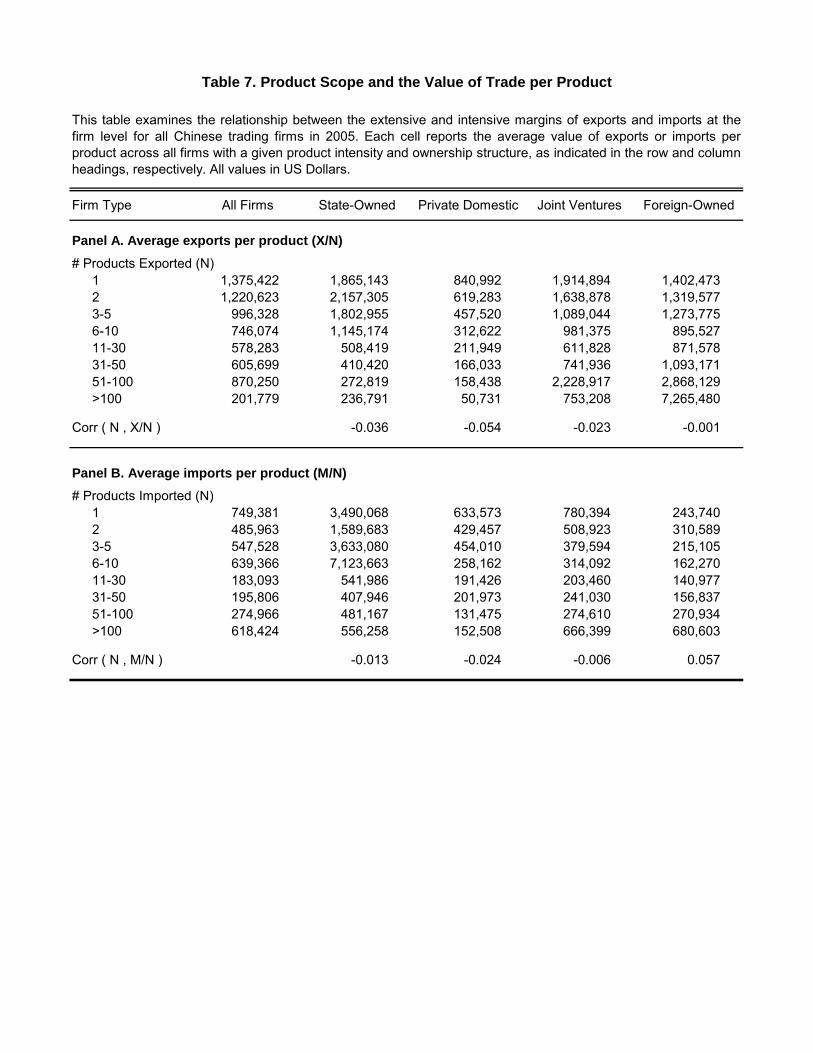
d t I t
Table 7. Product Scope and the Value of Trade per Product
This table examines the relationship between the extensive and intensive margins of exports and imports at thefirm level for all Chinese trading firms in 2005. Each cell reports the average value of exports or imports perproduct across all firms with a given product intensity and ownership structure, as indicated in the row and columnheadings, respectively. All values in US Dollars.
Firm Type All Firms State-Owned Private Domestic Joint Ventures Foreign-Owned
Panel A. Average exports per product (X/N)# Products Exported (N)
1 1,375,422 1,865,143 840,992 1,914,894 1,402,4732 1,220,623 2,157,305 619,283 1,638,878 1,319,5773-5 996,328 1,802,955 457,520 1,089,044 1,273,7756-10 746,074 1,145,174 312,622 981,375 895,52711-30 578,283 508,419 211,949 611,828 871,57831-50 605,699 410,420 166,033 741,936 1,093,17151-100 870,250 272,819 158,438 2,228,917 2,868,129>100 201,779 236,791 50,731 753,208 7,265,480
Corr ( N , X/N ) -0.036 -0.054 -0.023 -0.001
Panel B. Average imports per product (M/N)# P d t I t d (N)# Pro uc s mpor ed (N)
1 749,381 3,490,068 633,573 780,394 243,7402 485,963 1,589,683 429,457 508,923 310,5893-5 547,528 3,633,080 454,010 379,594 215,1056-10 639,366 7,123,663 258,162 314,092 162,27011-30 183,093 541,986 191,426 203,460 140,97731-50 195,806 407,946 201,973 241,030 156,83751-100 274,966 481,167 131,475 274,610 270,934>100 618,424 556,258 152,508 666,399 680,603
Corr ( N , M/N ) -0.013 -0.024 -0.006 0.057
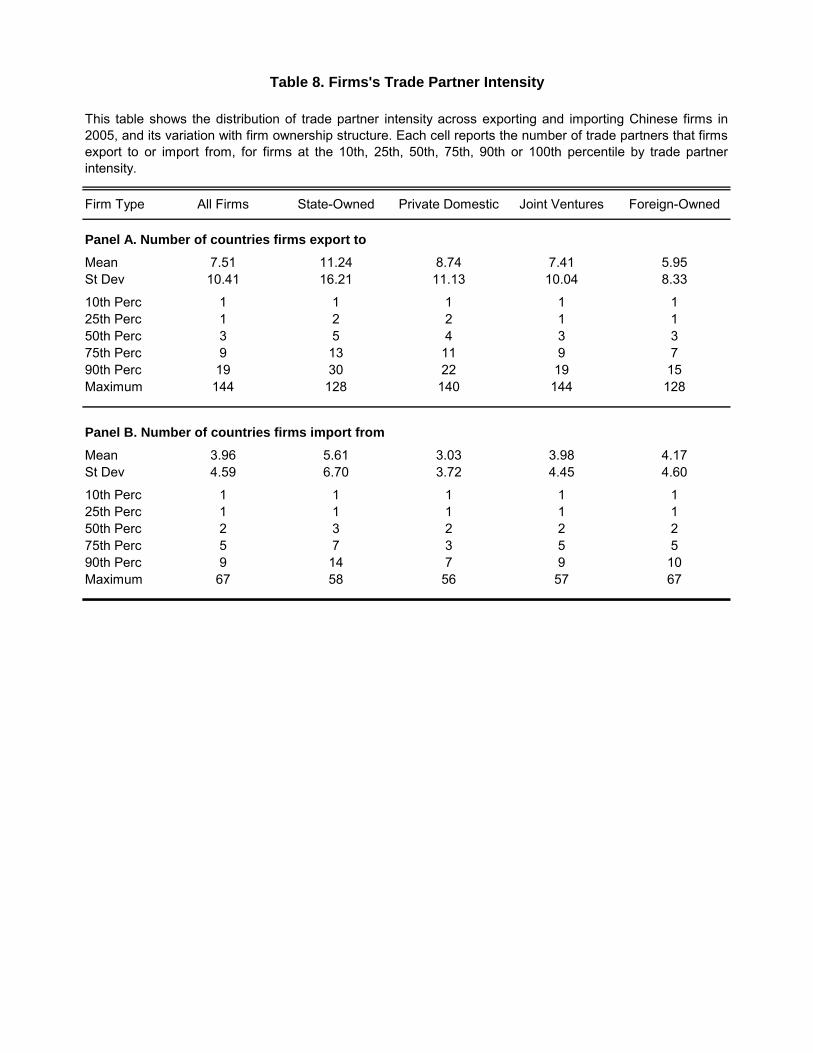
P 1 1 1 1 1
Table 8. Firms's Trade Partner Intensity
This table shows the distribution of trade partner intensity across exporting and importing Chinese firms in2005, and its variation with firm ownership structure. Each cell reports the number of trade partners that firmsexport to or import from, for firms at the 10th, 25th, 50th, 75th, 90th or 100th percentile by trade partnerintensity.
Firm Type All Firms State-Owned Private Domestic Joint Ventures Foreign-Owned
Panel A. Number of countries firms export toMean 7.51 11.24 8.74 7.41 5.95St Dev 10.41 16.21 11.13 10.04 8.33
10th erc P 1 1 1 1 125th erc P 1 2 2 1 150th erc P 3 5 4 3 375th Perc 9 13 11 9 790th Perc 19 30 22 19 15Maximum 144 128 140 144 128
Panel B. Number of countries firms import fromMean 3.96 5.61 3.03 3.98 4.17St Dev 4.59 6.70 3.72 4.45 4.60
10th P10th erc 1 1 1 1 125th erc P 1 1 1 1 150th erc P 2 3 2 2 275th erc P 5 7 3 5 590th erc P 9 14 7 9 10Maximum 67 58 56 57 67
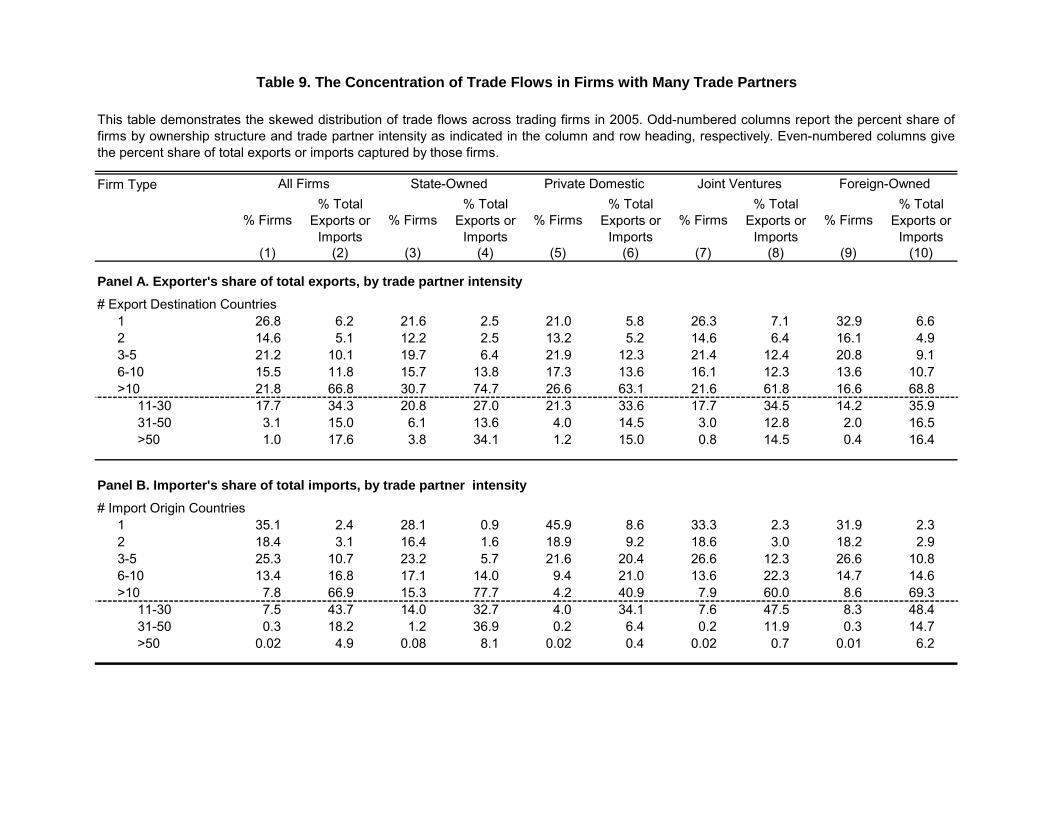
t the percent share ofnumbered columns give
Foreign-Owned
Table 9. The Concentration of Trade Flows in Firms with Many Trade Partners
This table demonstrates the skewed distribution of trade flows across trading firms in 2005. Odd-numbered columns reporfirms by ownership structure and trade partner intensity as indicated in the column and row heading, respectively. Even-the percent share of total exports or imports captured by those firms.
Firm Type All Firms State-Owned Private Domestic Joint Ventures
% Firms%
ExpIm
Total orts or ports
% Firms% Total
Exports orImports
% Firms% To
ExporImp
tal ts or
orts% Firms E
% Total xports or Imports
% Firms% Total
Exports or Imports
(1) (2) (3) (4) (5) (6) (7) (8) (9) (10)
Panel A. Exporter's share of total exports, by trade partner intensity# Export Destination Countries
1 26.8 6.2 21.6 2.5 21.0 5.8 26.3 7.1 32.9 6.62 14.6 5.1 12.2 2.5 13.2 5.2 14.6 6.4 16.1 4.93-5 21.2 10.1 19.7 6.4 21.9 12.3 21.4 12.4 20.8 9.16-10 15.5 11.8 15.7 13.8 17.3 13.6 16.1 12.3 13.6 10.7>10 21.8 66.8 30.7 74.7 26.6 63.1 21.6 61.8 16.6 68.8
11-30 17.7 34.3 20.8 27.0 21.3 33.6 17.7 34.5 14.2 35.931-50 3.1 15.0 6.1 13.6 4.0 14.5 3.0 12.8 2.0 16.5>50 1.0 17.6 3.8 34.1 1.2 15.0 0.8 14.5 0.4 16.4
Panel B. Importer's share of total imports, by trade partner intensity# Import Origin Countries
1 35.1 2.4 28.1 0.9 45.9 8.6 33.3 2.3 31.9 2.32 18.4 3.1 16.4 1.6 18.9 9.2 18.6 3.0 18.2 2.93-5 25.3 10.7 23.2 5.7 21.6 20.4 26.6 12.3 26.6 10.86-10 13.4 16.8 17.1 14.0 9.4 21.0 13.6 22.3 14.7 14.6>10 7.8 66.9 15.3 77.7 4.2 40.9 7.9 60.0 8.6 69.3
11-30 7.5 43.7 14.0 32.7 4.0 34.1 7.6 47.5 8.3 48.431-50 0.3 18.2 1.2 36.9 0.2 6.4 0.2 11.9 0.3 14.7>50 0.02 4.9 0.08 8.1 0.02 0.4 0.02 0.7 0.01 6.2
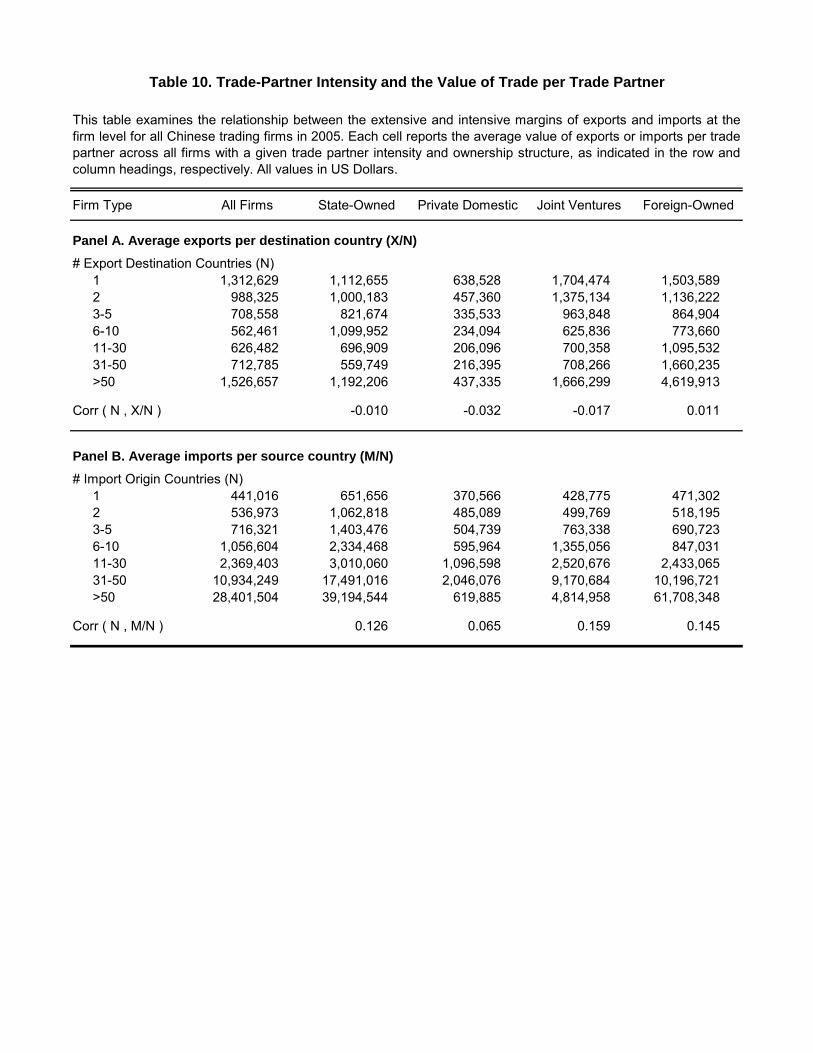
1
Table 10. Trade-Partner Intensity and the Value of Trade per Trade Partner
This table examines the relationship between the extensive and intensive margins of exports and imports at thefirm level for all Chinese trading firms in 2005. Each cell reports the average value of exports or imports per tradepartner across all firms with a given trade partner intensity and ownership structure, as indicated in the row andcolumn headings, respectively. All values in US Dollars.
Firm Type All Firms State-Owned Private Domestic Joint Ventures Foreign-Owned
Panel A. Average exports per destination country (X/N)# Export Destination Countries (N)
1 1,312,629 1,112,655 638,528 1,704,474 1,503,5892 988,325 1,000,183 457,360 1,375,134 1,136,2223-5 708,558 821,674 335,533 963,848 864,9046-10 562,461 1,099,952 234,094 625,836 773,66011-30 626,482 696,909 206,096 700,358 1,095,53231-50 712,785 559,749 216,395 708,266 1,660,235>50 1,526,657 1,192,206 437,335 1,666,299 4,619,913
Corr ( N , X/N ) -0.010 -0.032 -0.017 0.011
Panel B. Average imports per source country (M/N)# Import Origin Countries (N)
1 441 016441,016 651 656651,656 370 566370,566 428 775428,775 471 302471,3022 536,973 1,062,818 485,089 499,769 518,1953-5 716,321 1,403,476 504,739 763,338 690,7236-10 1,056,604 2,334,468 595,964 1,355,056 847,03111-30 2,369,403 3,010,060 1,096,598 2,520,676 2,433,06531-50 10,934,249 17,491,016 2,046,076 9,170,684 10,196,721>50 28,401,504 39,194,544 619,885 4,814,958 61,708,348
Corr ( N , M/N ) 0.126 0.065 0.159 0.145
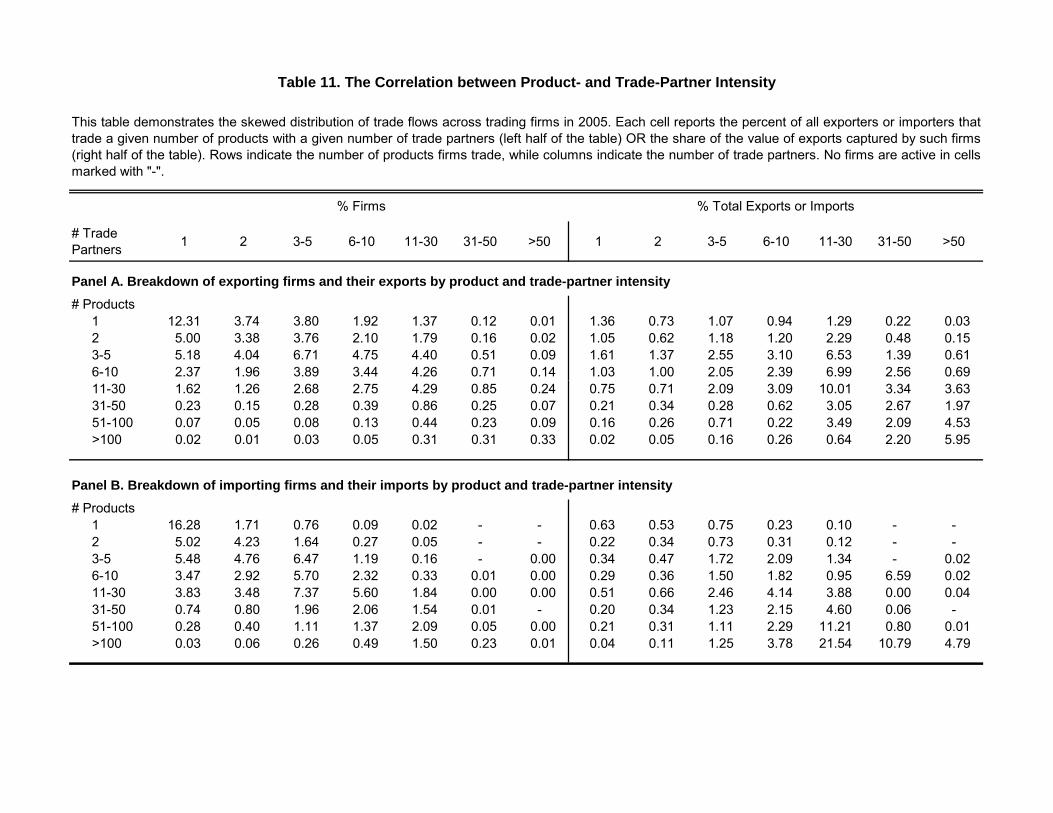
ports
exporters or importers thatports captured by such firms. No firms are active in cells
Table 11. The Correlation between Product- and Trade-Partner Intensity
This table demonstrates the skewed distribution of trade flows across trading firms in 2005. Each cell reports the percent of alltrade a given number of products with a given number of trade partners (left half of the table) OR the share of the value of ex(right half of the table). Rows indicate the number of products firms trade, while columns indicate the number of trade partnersmarked with "-".
% Firms % Total Exports or Im
# Trade Partners 1 2 3-5 6-10 11-30 31-50 >50 1 2 3-5 6-10 11-30 31-50 >50
Panel A. Breakdown of exporting firms and their exports by product and trade-partner intensity# Products
1 12.31 3.74 3.80 1.92 1.37 0.12 0.01 1.36 0.73 1.07 0.94 1.29 0.22 0.032 5.00 3.38 3.76 2.10 1.79 0.16 0.02 1.05 0.62 1.18 1.20 2.29 0.48 0.153-5 5.18 4.04 6.71 4.75 4.40 0.51 0.09 1.61 1.37 2.55 3.10 6.53 1.39 0.616-10 2.37 1.96 3.89 3.44 4.26 0.71 0.14 1.03 1.00 2.05 2.39 6.99 2.56 0.6911-30 1.62 1.26 2.68 2.75 4.29 0.85 0.24 0.75 0.71 2.09 3.09 10.01 3.34 3.6331-50 0.23 0.15 0.28 0.39 0.86 0.25 0.07 0.21 0.34 0.28 0.62 3.05 2.67 1.9751-100 0.07 0.05 0.08 0.13 0.44 0.23 0.09 0.16 0.26 0.71 0.22 3.49 2.09 4.53>100 0.02 0.01 0.03 0.05 0.31 0.31 0.33 0.02 0.05 0.16 0.26 0.64 2.20 5.95
Panel B. Breakdown of importing firms and their imports by product and trade-partner intensity# Products
1 16.28 1.71 0.76 0.09 0.02 - - 0.63 0.53 0.75 0.23 0.10 - -2 5.02 4.23 1.64 0.27 0.05 - - 0.22 0.34 0.73 0.31 0.12 - -3-5 5.48 4.76 6.47 1.19 0.16 - 0.00 0.34 0.47 1.72 2.09 1.34 - 0.026-10 3.47 2.92 5.70 2.32 0.33 0.01 0.00 0.29 0.36 1.50 1.82 0.95 6.59 0.0211-30 3.83 3.48 7.37 5.60 1.84 0.00 0.00 0.51 0.66 2.46 4.14 3.88 0.00 0.0431-50 0.74 0.80 1.96 2.06 1.54 0.01 - 0.20 0.34 1.23 2.15 4.60 0.06 -51-100 0.28 0.40 1.11 1.37 2.09 0.05 0.00 0.21 0.31 1.11 2.29 11.21 0.80 0.01>100 0.03 0.06 0.26 0.49 1.50 0.23 0.01 0.04 0.11 1.25 3.78 21.54 10.79 4.79
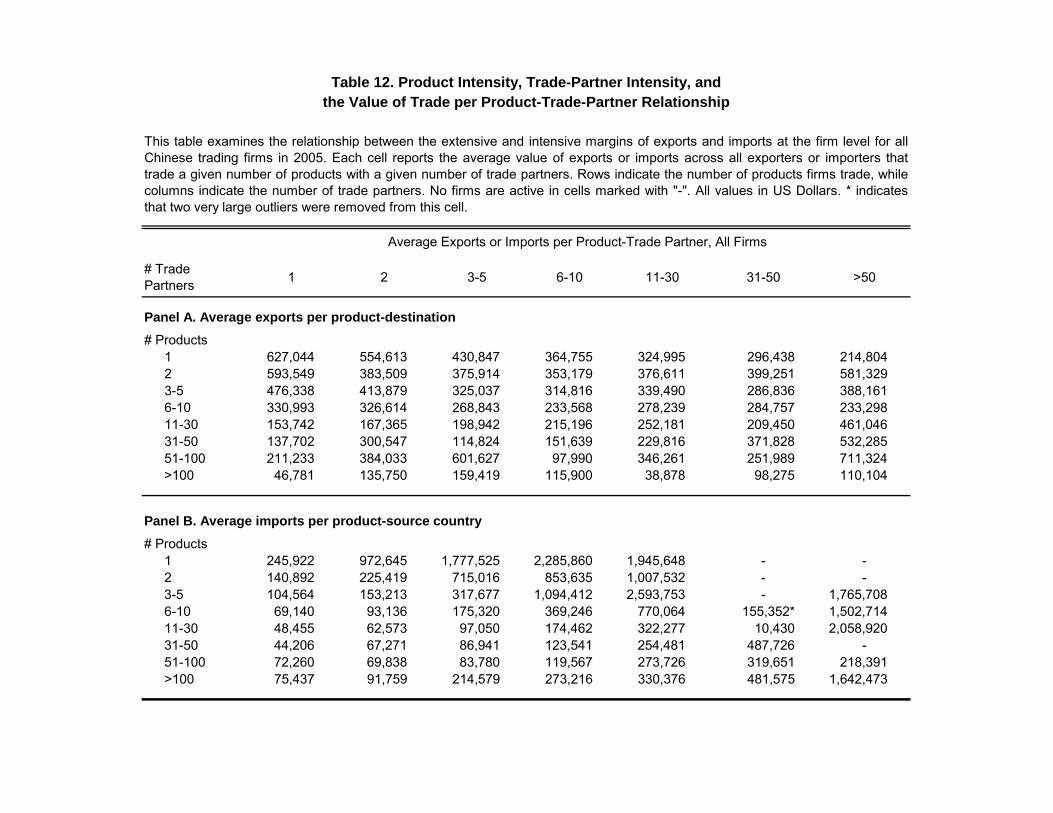
firm level for allimporters that
ms trade, whiles. * indicates
Table 12. Product Intensity, Trade-Partner Intensity, andthe Value of Trade per Product-Trade-Partner Relationship
This table examines the relationship between the extensive and intensive margins of exports and imports at theChinese trading firms in 2005. Each cell reports the average value of exports or imports across all exporters ortrade a given number of products with a given number of trade partners. Rows indicate the number of products fircolumns indicate the number of trade partners. No firms are active in cells marked with "-". All values in US Dollarthat two very large outliers were removed from this cell.
Average Exports or Imports per Product-Trade Partner, All Firms
# Trade Partners 1 2 3-5 6-10 11-30 31-50 >50
Panel A. Average exports per product-destination# Products
1 627,044 554,613 430,847 364,755 324,995 296,438 214,8042 593,549 383,509 375,914 353,179 376,611 399,251 581,3293-5 476,338 413,879 325,037 314,816 339,490 286,836 388,1616-10 330,993 326,614 268,843 233,568 278,239 284,757 233,29811-30 153,742 167,365 198,942 215,196 252,181 209,450 461,04631-50 137,702 300,547 114,824 151,639 229,816 371,828 532,28551-100 211,233 384,033 601,627 97,990 346,261 251,989 711,324>100 46,781 135,750 159,419 115,900 38,878 98,275 110,104
Panel B. Average imports per product-source country# Products
1 245,922 972,645 1,777,525 2,285,860 1,945,648 - -2 140,892 225,419 715,016 853,635 1,007,532 - -3-5 104,564 153,213 317,677 1,094,412 2,593,753 - 1,765,7086-10 69,140 93,136 175,320 369,246 770,064 155,352* 1,502,71411-30 48,455 62,573 97,050 174,462 322,277 10,430 2,058,92031-50 44,206 67,271 86,941 123,541 254,481 487,726 -51-100 72,260 69,838 83,780 119,567 273,726 319,651 218,391>100 75,437 91,759 214,579 273,216 330,376 481,575 1,642,473
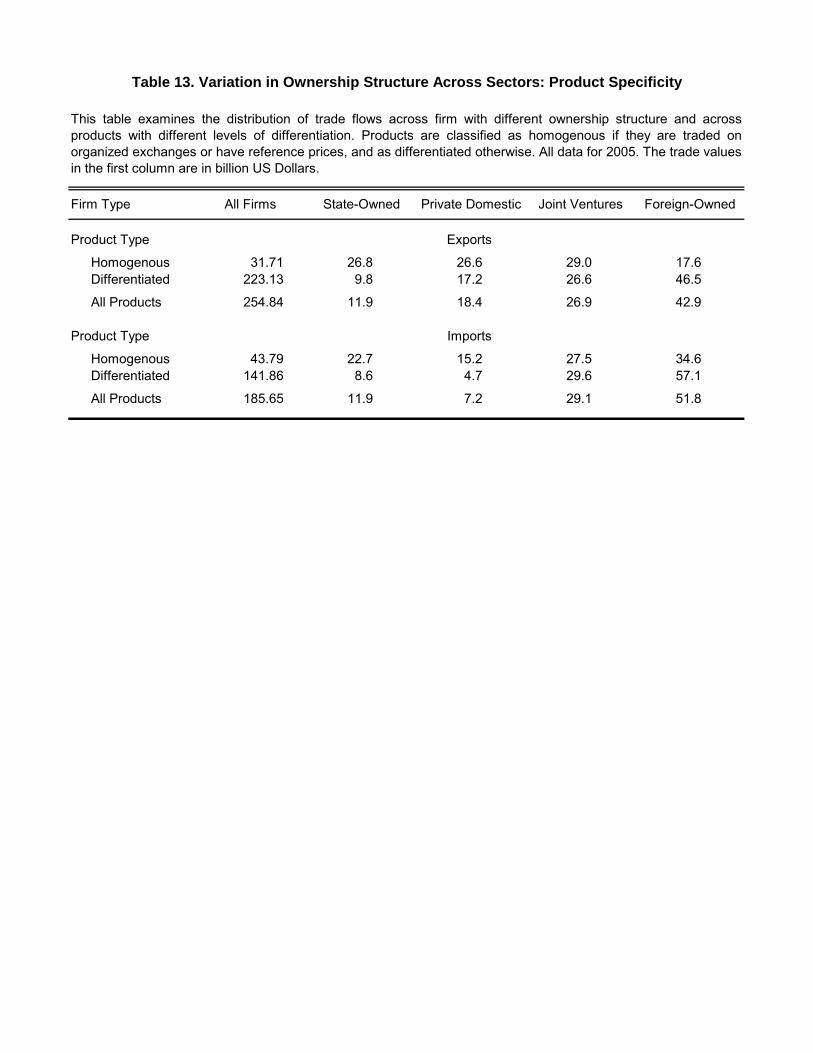
Table 13. Variation in Ownership Structure Across Sectors: Product Specificity
This table examines the distribution of trade flows across firm with different ownership structure and acrossproducts with different levels of differentiation. Products are classified as homogenous if they are traded onorganized exchanges or have reference prices, and as differentiated otherwise. All data for 2005. The trade valuesin the first column are in billion US Dollars.
Firm Type All Firms State-Owned Private Domestic Joint Ventures Foreign-Owned
Product Type Exports
Homogenous 31.71 26.8 26.6 29.0 17.6Differentiated 223.13 9.8 17.2 26.6 46.5
All Products 254.84 11.9 18.4 26.9 42.9
Product Type Imports
Homogenous 43.79 22.7 15.2 27.5 34.6Differentiated 141.86 8.6 4.7 29.6 57.1
All Products 185.65 11.9 7.2 29.1 51.8
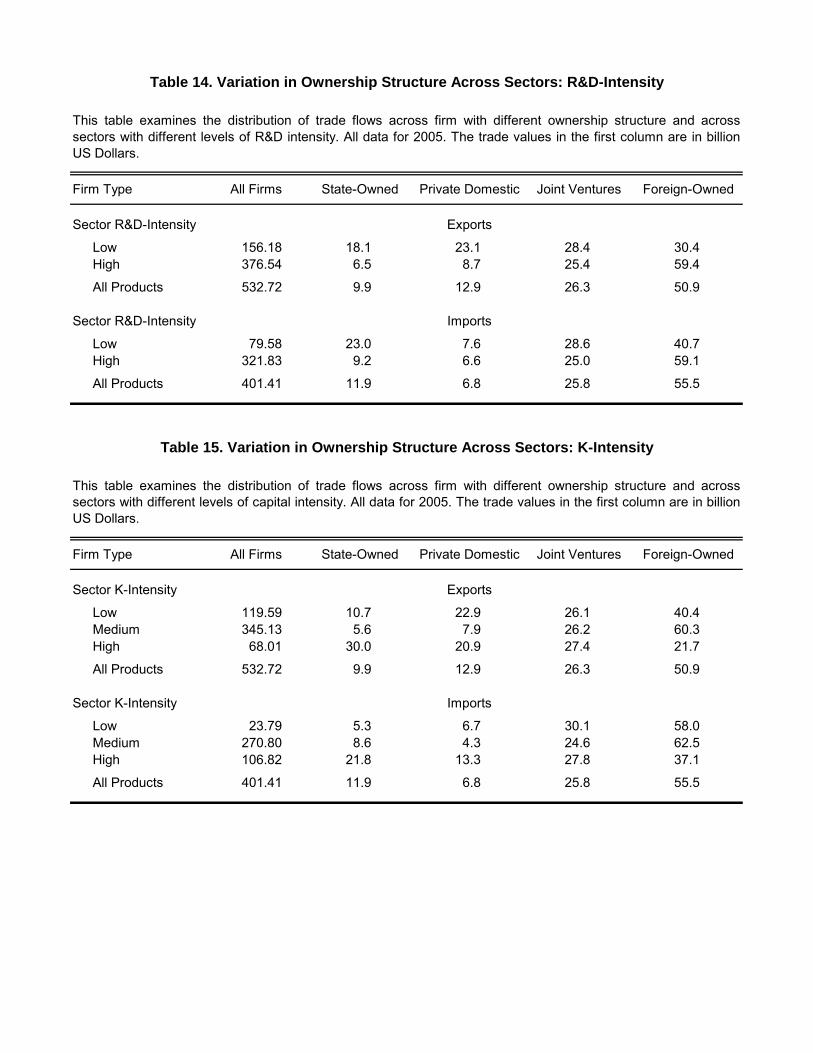
p
Table 14. Variation in Ownership Structure Across Sectors: R&D-Intensity
This table examines the distribution of trade flows across firm with different ownership structure and acrosssectors with different levels of R&D intensity. All data for 2005. The trade values in the first column are in billionUS Dollars.
Firm Type All Firms State-Owned Private Domestic Joint Ventures Foreign-Owned
Sector R&D-Intensity Exports
Low 156.18 18.1 23.1 28.4 30.4High 376.54 6.5 8.7 25.4 59.4
All Products 532.72 9.9 12.9 26.3 50.9
Sector R&D-Intensity Imports
Low 79.58 23.0 7.6 28.6 40.7High 321.83 9.2 6.6 25.0 59.1
All Products 401.41 11.9 6.8 25.8 55.5
Table 15. Variation in Ownership Structure Across Sectors: K-Intensity
This table examines the distribution of trade flows across firm with different ownership structure and acrosssectors with different levels of capital intensity. All data for 2005. The trade values in the first column are in billionUS Dollars.
Firm Type All Firms State-Owned Private Domestic Joint Ventures Foreign-Owned
Sector K-Intensity Exports
Low 119.59 10.7 22.9 26.1 40.4Medium 345.13 5.6 7.9 26.2 60.3High 68.01 30.0 20.9 27.4 21.7
All Products 532.72 9.9 12.9 26.3 50.9
Sector K-Intensity Imports
Low 23.79 5.3 6.7 30.1 58.0Medium 270.80 8.6 4.3 24.6 62.5High 106.82 21.8 13.3 27.8 37.1
All Products 401.41 11.9 6.8 25.8 55.5
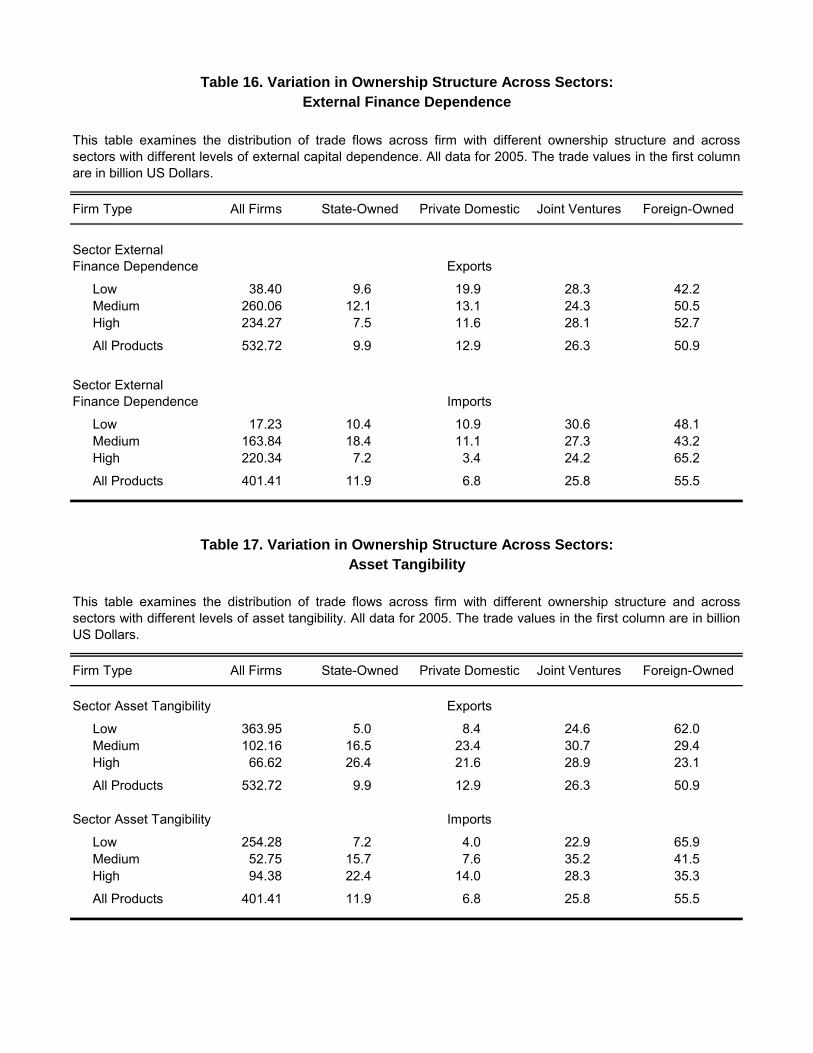
Table 16. Variation in Ownership Structure Across Sectors:External Finance Dependence
This table examines the distribution of trade flows across firm with different ownership structure and acrosssectors with different levels of external capital dependence. All data for 2005. The trade values in the first columnare in billion US Dollars.
Firm Type All Firms State-Owned Private Domestic Joint Ventures Foreign-Owned
Sector External Finance Dependence Exports
Low 38.40 9.6 19.9 28.3 42.2Medium 260.06 12.1 13.1 24.3 50.5High 234.27 7.5 11.6 28.1 52.7
All Products 532.72 9.9 12.9 26.3 50.9
Sector External Finance Dependence Imports
Low 17.23 10.4 10.9 30.6 48.1Medium 163.84 18.4 11.1 27.3 43.2High 220.34 7.2 3.4 24.2 65.2
All Products 401.41 11.9 6.8 25.8 55.5
Table 17. Variation in Ownership Structure Across Sectors:Asset Tangibility
This table examines the distribution of trade flows across firm with different ownership structure and acrosssectors with different levels of asset tangibility. All data for 2005. The trade values in the first column are in billionUS Dollars.
Firm Type All Firms State-Owned Private Domestic Joint Ventures Foreign-Owned
Sector Asset Tangibility Exports
Low 363.95 5.0 8.4 24.6 62.0Medium 102.16 16.5 23.4 30.7 29.4High 66.62 26.4 21.6 28.9 23.1
All Products 532.72 9.9 12.9 26.3 50.9
Sector Asset Tangibility Imports
Low 254.28 7.2 4.0 22.9 65.9Medium 52.75 15.7 7.6 35.2 41.5High 94.38 22.4 14.0 28.3 35.3
All Products 401.41 11.9 6.8 25.8 55.5
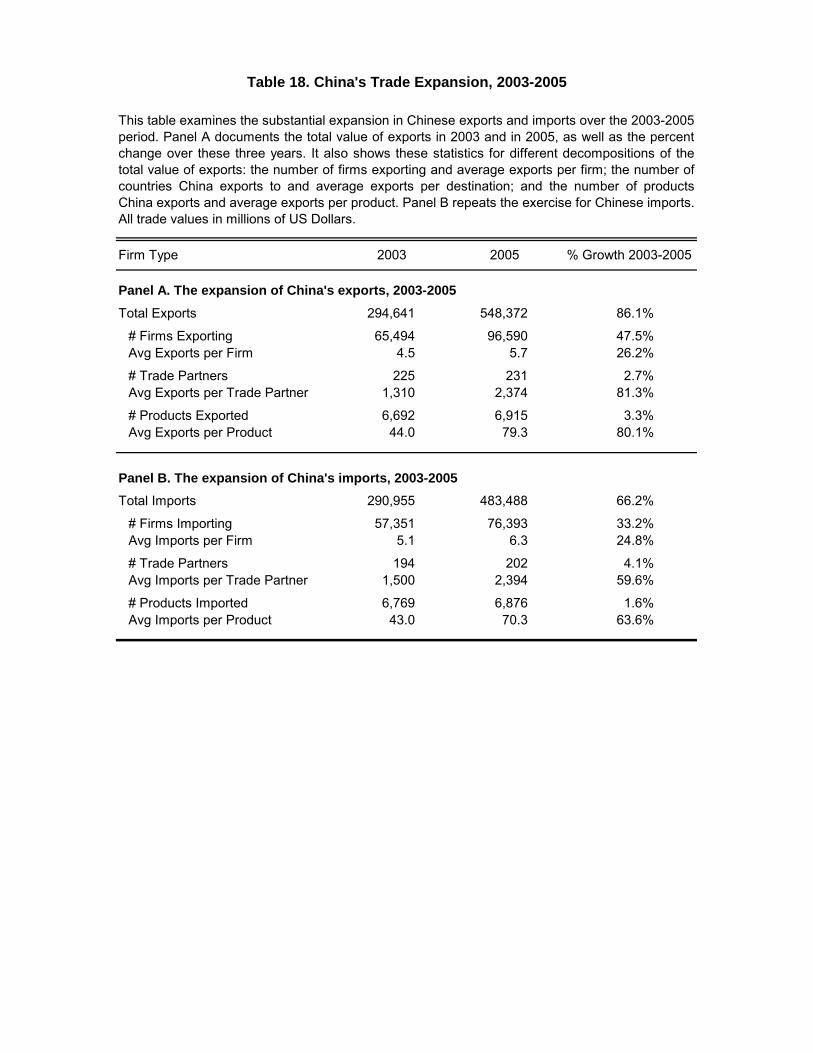
Table 18. China's Trade Expansion, 2003-2005
This table examines the substantial expansion in Chinese exports and imports over the 2003-2005period. Panel A documents the total value of exports in 2003 and in 2005, as well as the percentchange over these three years. It also shows these statistics for different decompositions of thetotal value of exports: the number of firms exporting and average exports per firm; the number ofcountries China exports to and average exports per destination; and the number of productsChina exports and average exports per product. Panel B repeats the exercise for Chinese imports.All trade values in millions of US Dollars.
Firm Type 2003 2005 % Growth 2003-2005
Panel A. The expansion of China's exports, 2003-2005Total Exports 294,641 548,372 86.1%
# Firms Exporting 65,494 96,590 47.5%Avg Exports per Firm 4.5 5.7 26.2%
# Trade Partners 225 231 2.7%Avg Exports per Trade Partner 1,310 2,374 81.3%
# Products Exported 6,692 6,915 3.3%Avg Exports per Product 44.0 79.3 80.1%
Panel B. The expansion of China's imports, 2003-2005Total Imports 290,955 483,488 66.2%
# Firms Importing 57,351 76,393 33.2%Avg Imports per Firm 5.1 6.3 24.8%
# Trade Partners 194 202 4.1%Avg Imports per Trade Partner 1,500 2,394 59.6%
# Products Imported 6,769 6,876 1.6%Avg Imports per Product 43.0 70.3 63.6%
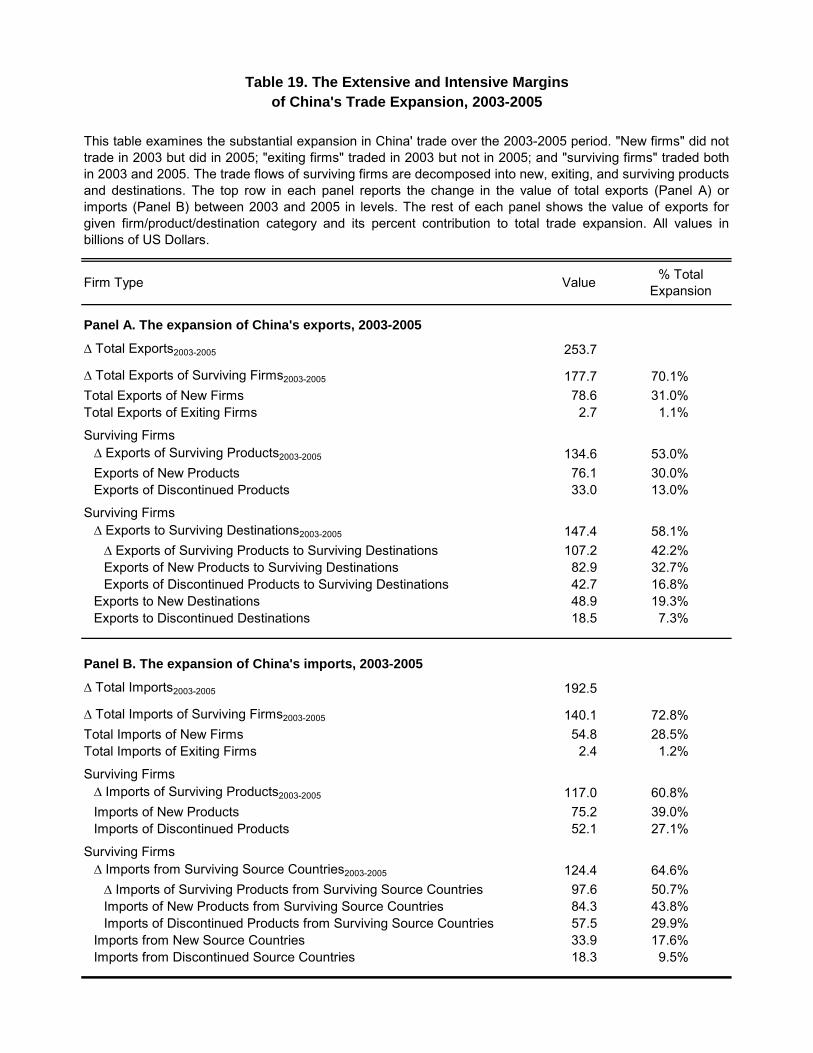
0
Table 19. The Extensive and Intensive Marginsof China's Trade Expansion, 2003-2005
This table examines the substantial expansion in China' trade over the 2003-2005 period. "New firms" did nottrade in 2003 but did in 2005; "exiting firms" traded in 2003 but not in 2005; and "surviving firms" traded bothin 2003 and 2005. The trade flows of surviving firms are decomposed into new, exiting, and surviving productsand destinations. The top row in each panel reports the change in the value of total exports (Panel A) orimports (Panel B) between 2003 and 2005 in levels. The rest of each panel shows the value of exports forgiven firm/product/destination category and its percent contribution to total trade expansion. All values inbillions of US Dollars.
Firm Type Value % Total Expansion
Panel A. The expansion of China's exports, 2003-2005
∆ Total Exports2003-2005 253.7
∆ Total Exports of Surviving Firms2003-2005 177.7 70.1%Total Exports of New Firms 78.6 31.0%Total Exports of Exiting Firms 2.7 1.1%
Surviving Firms∆ Exports of Surviving Products2003-2005 134.6 53.0%Exports of New Products 76.1 30.0%Exports of Discontinued ProductsExports of Discontinued Products 33 033. 13 0%13.0%
Surviving Firms∆ Exports to Surviving Destinations2003-2005 147.4 58.1%∆ Exports of Surviving Products to Surviving Destinations 107.2 42.2%Exports of New Products to Surviving Destinations 82.9 32.7%Exports of Discontinued Products to Surviving Destinations 42.7 16.8%
Exports to New Destinations 48.9 19.3%Exports to Discontinued Destinations 18.5 7.3%
Panel B. The expansion of China's imports, 2003-2005
∆ Total Imports2003-2005 192.5
∆ Total Imports of Surviving Firms2003-2005 140.1 72.8%Total Imports of New Firms 54.8 28.5%Total Imports of Exiting Firms 2.4 1.2%
Surviving Firms∆ Imports of Surviving Products2003-2005 117.0 60.8%Imports of New Products 75.2 39.0%Imports of Discontinued Products 52.1 27.1%
Surviving Firms∆ Imports from Surviving Source Countries2003-2005 124.4 64.6%∆ Imports of Surviving Products from Surviving Source Countries 97.6 50.7%Imports of New Products from Surviving Source Countries 84.3 43.8%Imports of Discontinued Products from Surviving Source Countries 57.5 29.9%
Imports from New Source Countries 33.9 17.6%Imports from Discontinued Source Countries 18.3 9.5%

Switch only once 3,950 8% 257 6% 794 9% 1,182 7% 1,717 9%
of firms that trade innership type in Jan 2003.
firm entry rate. Panels C and D repeat the analysis with quarterly data over the 2003-2005 period.
Monthly Survival Rate 88% 86% 85% 89% 90%Monthly Entry Rate 13% 14% 17% 11% 11%
Table 20. Firm Dynamics: Entry and Exit from Exporting and Importing
This table examines fithe beginning and in t
rm entry and exit fromhe end of the period, w
exporting and importinhile even-numbered c
g over the 2003-2005olumns give the percen
period. Odd-numberedt share of these firms
columns report the numberof all firms with that ow
Panels A and B decompose firms into surviving firms (which traded in Jan 2003 and Dec 2005), exiting firms (which traded in Jan 03 but not in Dec 05), andentering firms (which traded in Dec 05, but not in Jan 03). The bottom two rows report the probability that firms trading in month t also trade in t+1 , as well as the
Firm Type All Firms State-Owned Private Domestic Joint Ventures Foreign-Owned# Firms % Firms # Firms % Firms # Firms % Firms # Firms % Firms # Firms % Firms
(1) (2) (3) (4) (5) (6) (7) (8) (9) (10)
Panel A. Firm dynamics in exporting, monthly data, Jan 2003 - Dec 2005Firms in Jan 2003 49,644 100% 4,371 100% 9,286 100% 16,249 100% 19,738 100%Firms in Dec 2005 72,219 145% 3,970 91% 21,931 236% 17,185 106% 29,133 148%Surviving Firms 33,771 68% 2,355 54% 5,835 63% 10,473 64% 15,108 77%
In all 36 mos. 19,679 40% 1,368 31% 2,965 32% 6,177 38% 9,169 46%
Switch > once 10,142 20% 730 17% 2,076 22% 3,114 19% 4,222 21%Avg. # mos. in 33.7 33.3 33.2 33.8 34.0
Exiting Firms 15,873 32% 2,016 46% 3,451 37% 5,776 36% 4,630 23%Avg. # mos. in 15.6 14.1 15.1 16.0 16.3
Entering Firms 38,448 77% 1,615 37% 16,096 173% 6,712 41% 14,025 71%Avg. # mos. in 17.6 17.5 16.6 18.6 18.3
Panel B. Firm dynamics in importing, monthly data, Jan 2003 - Dec 2005Firms in Jan 2003 37,248 100% 3,096 100% 3,926 100% 11,747 100% 18,479 100%Firms in Dec 2005 45,480 122% 2,670 86% 7,748 197% 10,660 91% 24,402 132%Surviving Firms 22,360 60% 1,475 48% 1,579 40% 6,341 54% 12,965 70%
In all 36 mos. 10,708 29% 638 21% 412 10% 3,019 26% 6,639 36%Switch only once 2,699 7% 144 5% 187 5% 731 6% 1,637 9%Switch > onceAvg. # mos. in
8,953 24%32.4
693 22%31.3
98029.0
25% 2,591 22% 4,689 25%32.3 33.0
Exiting Firms 14,888 40% 1,621 52% 2,347 60% 5,406 46% 5,514 30%Avg. # mos. in 13.5 12.9 11.0 13.8 14.4
Entering Firms 23,120 62% 1,195 39% 6,169 157% 4,319 37% 11,437 62%Avg. # mos. in 16.4 16.6 13.2 16.4 18.1
Monthly Survival Rate 80% 78% 67% 79% 84%Monthly Entry Rate 21% 22% 34% 20% 17%
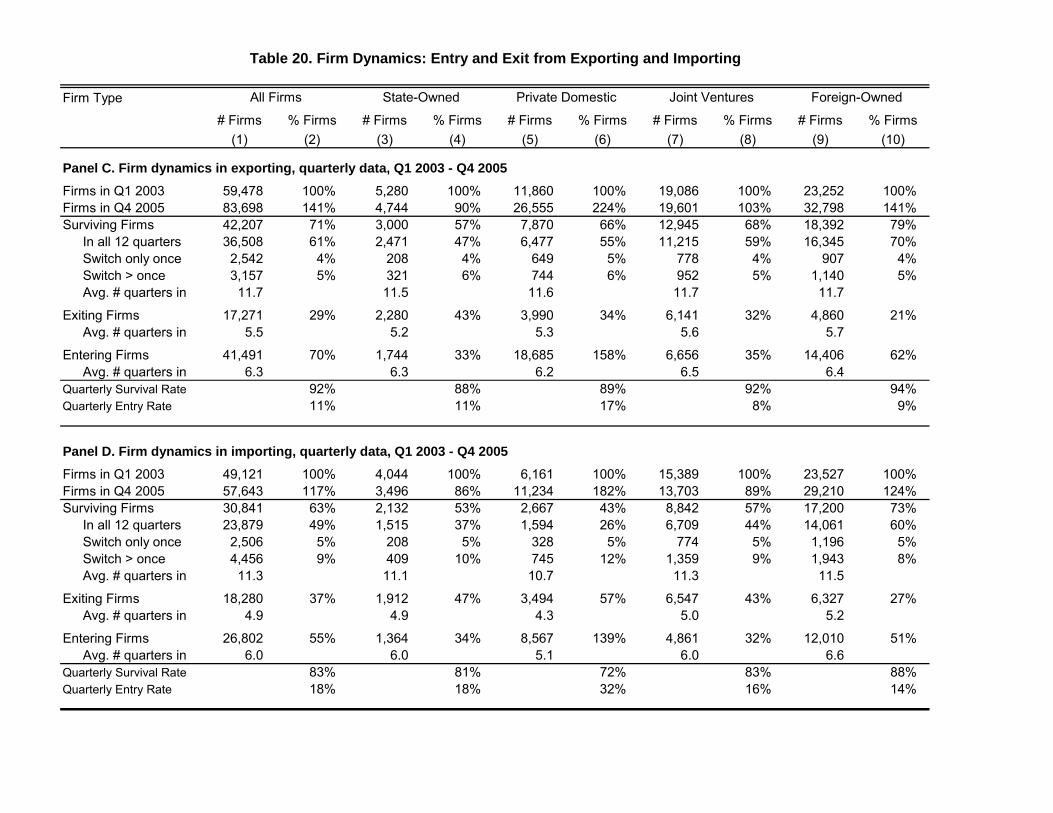
Fi
PFFSur
Ex
PFFSur
Ex
T
# # rm Fi % rm s Firm2) 10)
l y g a erly da , Q 2005i 100% 100% 1 6 100%i 141% 90% 141%
57% 66% 79%ter 47% 55% 70%
w 208 5%321 6%
s 11.5
iting F 43% 34% 21%s 5 .6
i 4 33% 1 62%s 6 .5
Ta rm Dy ry t r ing and Im i
m Pr ic ned
er 88% 89% 94%te 11% 17%
y g u erly da , Q 2005i 100% 100% 100%i 117% 86% 124%
53% 43% 73%ter 37% 26% 60%
208 5% 5%409 10% 12%
s 11.1
iting F 47% 57% 27%s 4 .0
i 34% 51%s 6 .0
81% 72% 88%te 18% 32% 14%
s
4%5%
9%
8%
% Firms # Firms %(8) (9) (
100% 23,252103% 32,79868% 18,39259% 16,345
4% 9075% 1,140
11.7
32% 4,8605.7
35% 14,4066.4
port ng
int Ventures Foreign-Ow
92%8%
100% 23,52789% 29,21057% 17,20044% 14,061
5% 1,1969% 1,943
11.5
43% 6,3275.2
32% 12,0106.6
83%16%
# Firm(7)
19,08
Jo
19,60112,94511,215
77895211.7
6,1415
6,6566
15,38913,7038,8426,709
7741,35911.3
6,5475
4,8616
s Fi(6)
100%224%
158%
est
100%182%
139%
om Export
s
0
ivate Dom
5.3
56.2
4.3
5.1
rm(5)
1,86
f
26,5557,8706,477
64974411.6
3,990
8,68
6,16111,234
2,6671,594
32874510.7
3,494
8,567
#
and Exi
s
4
4%6%
4
5%
Fi(4)
- Q
ned
Q
%
003
Ent
Ow
2003 -
s
1 2
cs:
tate-
.2
4.3
1
.9
.0
Firm(3)
ta5,280
nami
S
4,7443,0002,471
2,280
1,7
ta4,0443,4962,1321,515
1,912
1,364
rms
rt
71%61%4%5%
29%
70%
Fi
92%11%
art
63%49%5%9%
37%
55%
83%18%
% Fi(
, qu
e 20.
s
, q
rtin
bl
ir
rtin
rms)
o
All F
,542,15711.7
5.5
4916.3
o
,506,45611.3
4.9
6.0
Fi(1
exp59,47883,69842,20736,50823
17,271
41,
imp49,12157,64330,84123,87924
18,280
26,802
mics in
mics in
na
se
in
in
inate
na
se
in
in
inate
rm d 2003 2005
s
y once
ter
ter
ster
ival Ra R
d 2003 2005
s
once
ter
ter
ster
ival R Ra
Fi14irm
onl > onc
ms
irm
urv Entry
irm14irm
only > onc
ms
irm
Surv Entry
ype
C. in Q in Q
iving FIn all 12 quar
itchitch
Avg. # quar
irAvg. # quar
ng FAvg. # quar
ly S
l D. F in Q in Q
iving FIn all 12 quar
itchitch
Avg. # quar
irAvg. # quar
ng FAvg. # quar
rm
anermsrms
v
SSw
Enter
uartuarterly
anermsrms
v
SwSw
Enter
uarterlyuarterly
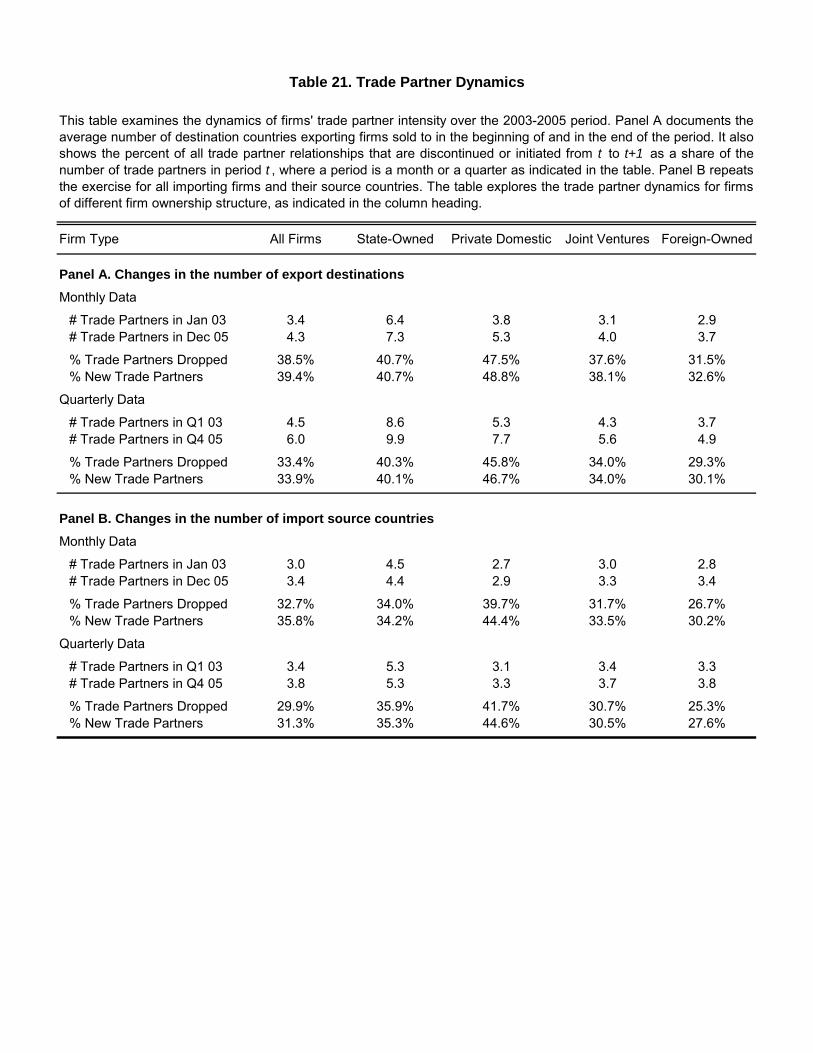
Firm Type All Firms State-Owned Private Domestic Joint Ventures Foreign-Owned
Panel A. Changes in the number of export destinationsMonthly Data
# Trade Partners in Jan 03 3.4 6.4 3.8 3.1 2.9# Trade Partners in Dec 05 4.3 7.3 5.3 4.0 3.7
% Trade Partners Dropped 38.5% 40.7% 47.5% 37.6% 31.5%% New Trade Partners 39.4% 40.7% 48.8% 38.1% 32.6%
Quarterly Data
# Trade Partners in Q1 03 4.5 8.6 5.3 4.3 3.7# Trade Partners in Q4 05 6.0 9.9 7.7 5.6 4.9
% Trade Partners Dropped 33.4% 40.3% 45.8% 34.0% 29.3%% New Trade Partners 33.9% 40.1% 46.7% 34.0% 30.1%
Table 21. Trade Partner Dynamics
This table examines the dynamics of firms' trade partner intensity over the 2003-2005 period. Panel A documents theaverage number of destination countries exporting firms sold to in the beginning of and in the end of the period. It alsoshows the percent of all trade partner relationships that are discontinued or initiated from t to t+1 as a share of thenumber of trade partners in period t , where a period is a month or a quarter as indicated in the table. Panel B repeatsthe exercise for all importing firms and their source countries. The table explores the trade partner dynamics for firmsof different firm ownership structure, as indicated in the column heading.
Panel B. Changes in the number of import source countriesMonthly Data
# Trade Partners in Jan 03 3.0 4.5 2.7 3.0 2.8# Trade Partners in Dec 05 3.4 4.4 2.9 3.3 3.4
% Trade Partners Dropped 32.7% 34.0% 39.7% 31.7% 26.7%% New Trade Partners 35.8% 34.2% 44.4% 33.5% 30.2%
Quarterly Data
# Trade Partners in Q1 03 3.4 5.3 3.1 3.4 3.3# Trade Partners in Q4 05 3.8 5.3 3.3 3.7 3.8
% Trade Partners Dropped 29.9% 35.9% 41.7% 30.7% 25.3%% New Trade Partners 31.3% 35.3% 44.6% 30.5% 27.6%
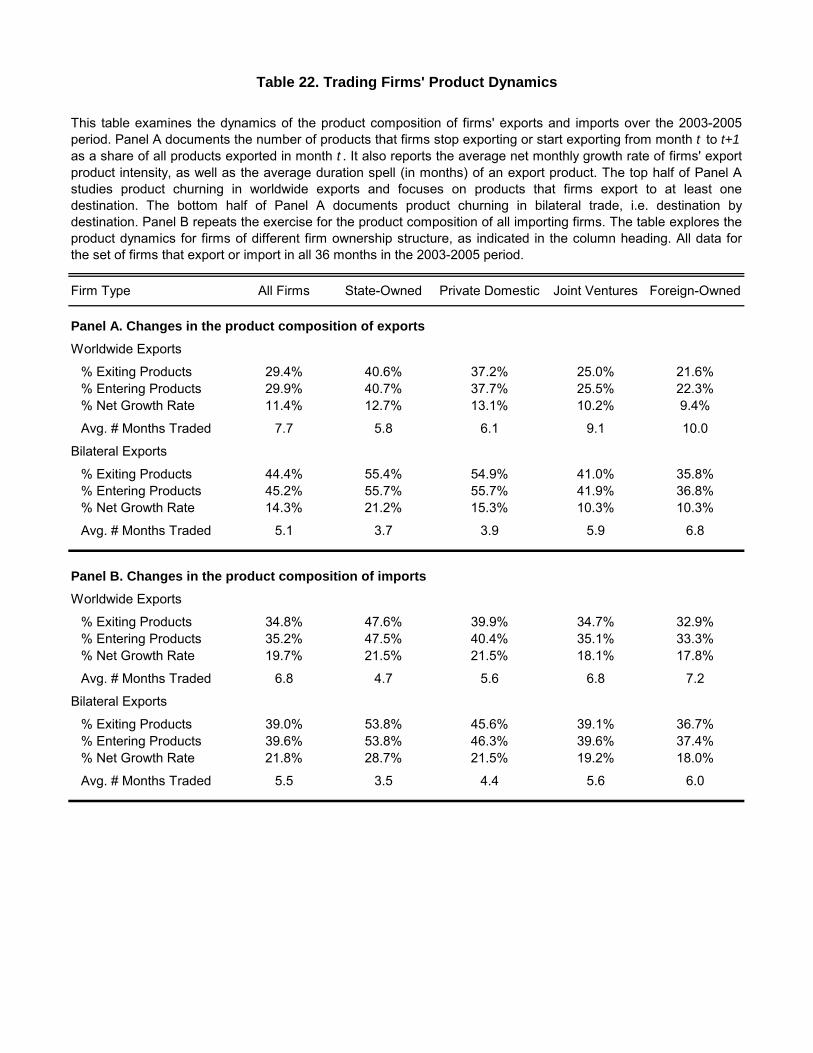
Firm Type All Firms State-Owned Private Domestic Joint Ventures Foreign-Owned
Panel A. Changes in the product composition of exportsWorldwide Exports
% Exiting Products 29.4% 40.6% 37.2% 25.0% 21.6%% Entering Products 29.9% 40.7% 37.7% 25.5% 22.3%% Net Growth Rate 11.4% 12.7% 13.1% 10.2% 9.4%
Avg. # Months Traded 7.7 5.8 6.1 9.1 10.0
Bilateral Exports
% Exiting Products 44.4% 55.4% 54.9% 41.0% 35.8%% Entering Products 45 2% 55 7% 55 7% 41 9% 36 8%
Table 22. Trading Firms' Product Dynamics
This table examines the dynamics of the product composition of firms' exports and imports over the 2003-2005period. Panel A documents the number of products that firms stop exporting or start exporting from month t to t+1 as a share of all products exported in month t . It also reports the average net monthly growth rate of firms' exportproduct intensity, as well as the average duration spell (in months) of an export product. The top half of Panel Astudies product churning in worldwide exports and focuses on products that firms export to at least onedestination. The bottom half of Panel A documents product churning in bilateral trade, i.e. destination bydestination. Panel B repeats the exercise for the product composition of all importing firms. The table explores theproduct dynamics for firms of different firm ownership structure, as indicated in the column heading. All data forthe set of firms that export or import in all 36 months in the 2003-2005 period.
% Entering Products 45.2% 55.7% 55.7% 41.9% 36.8%% Net Growth Rate 14.3% 21.2% 15.3% 10.3% 10.3%
Avg. # Months Traded 5.1 3.7 3.9 5.9 6.8
Panel B. Changes in the product composition of importsWorldwide Exports
% Exiting Products 34.8% 47.6% 39.9% 34.7% 32.9%% Entering Products 35.2% 47.5% 40.4% 35.1% 33.3%% Net Growth Rate 19.7% 21.5% 21.5% 18.1% 17.8%
Avg. # Months Traded 6.8 4.7 5.6 6.8 7.2
Bilateral Exports
% Exiting Products 39.0% 53.8% 45.6% 39.1% 36.7%% Entering Products 39.6% 53.8% 46.3% 39.6% 37.4%% Net Growth Rate 21.8% 28.7% 21.5% 19.2% 18.0%
Avg. # Months Traded 5.5 3.5 4.4 5.6 6.0