Embed Size (px)
Citation preview

Munich Personal RePEc Archive
Chinese statistics: classification systems
and data sources
Holz, Carsten A
7 January 2013
Online at https://mpra.ub.uni-muenchen.de/43869/
MPRA Paper No. 43869, posted 18 Jan 2013 16:47 UTC
1
Chinese Statistics: Classification Systems and Data Sources
China has become a popular geographic area of research. Researchers make extensive use of Chinese official statistics, but these statistics are often not well understood. This article first clarifies three major issues that affect a wide range of Chinese statistics—from output and employment data to industry profitability—and then elaborates on data sources. The three data issues are changes over time to the sectoral classification system, changes to the ownership classification system, and changes to the coverage of the industry sector. Many of these changes have gone unnoticed or remain poorly understood, leaving the researcher puzzled about varying labels, apparently inconsistent data, and discontinued time series. The second part of the paper offers a gateway to a wealth of Chinese statistics whose existence is not widely known. It also points out the limitations of some of these sources and provides an overview of the secondary literature that discusses the meaning and quality of particular Chinese statistics. Journal of Economic Literature classification codes. all China:
C82 Data Collection and Data Estimation Methodology; Computer Programs — Methodology for Collecting, Estimating, and Organizing Macroeconomic Data
R1 General Regional Economics P27 Socialist Systems and Transitional Economies — Performance and Prospects O53 Economywide Country Studies — Asia including Middle East
Keywords (all: China): national income accounting, national statistical system, China Standard Industrial Classification System, industrial statistics coverage, ownership classification system, national statistical data sources/limitations/explanations
Carsten A. Holz [email protected]
Stanford Center for International Development
Stanford University 366 Galvez Street
Stanford, CA 94305-6015
7 January 2013

2
Chinese Statistics: Classification Systems and Data Sources
1. INTRODUCTION
China researchers frequently draw on Chinese official statistics for their analysis. These statistics are used for a wide range of purposes, from academic research to policy analysis and the evaluation of business opportunities. Two commonly used sources of Chinese official statistics are the CEIC China Premium Database (http://www.ceicdata.com/China.html) and the National Bureau of Statistics’ website (http://www.stats.gov.cn). However, one soon finds that while the CEIC database reports a large number of datasets, many series run for only a limited amount of time, and precise definitions as well as details on the coverage of statistics units are hard to come by. Similarly, on the NBS website one is either led to an online copy of the Statistical Yearbook—which all too often leaves one to one’s own devices in figuring out what exactly a particular series means, why it was discontinued, or what the implications of a change in label are—or to a database with limited time series data. A short journal article cannot explain “all” Chinese statistics. What this article does is to clarify three issues that affect almost all Chinese statistics that economists are typically interested in (such as output and employment data), data classified by ownership, and detailed industry statistics. The mystery of discontinued series or changes in labels is often quickly resolved if one is aware that the sectoral classification system changed four times during the reform period, that state ownership can mean something very different at different points in time and depending on the concept used, and that detailed industry data have experienced an extraordinary large number of statistical breaks over the reform period. This is the subject of the first part of this paper. For China scholars and non-China scholars alike, finding data beyond what is covered in the two databases mentioned above (including the Statistical Yearbook) is often a daunting task, and quickly abandoned in favor of some easily constructed proxy. But an astounding volume of data is regularly compiled and published in China. The legacy of a planned economy (with its need for a large volume of data) combined with a current government actively engaged in economic policy means that official data in China are plentiful, far beyond what one finds in a typical developing economy. While one has to be careful about what the data mean, the abundance of statistics is an economist’s paradise. The second part of this paper provides a list of key data sources, provides comments on the limitations of some of the sources, and points out secondary literature that explains particular Chinese data.
2. CLASSIFICATION SYSTEMS
Working with Chinese data, ideally one would want all data series follow the same sectoral classification system. This is not always the case as the sectoral classification system was revised repeatedly and at any given point in time not always applied equally to all variables. The

3
ownership classification system changed in 1998, while in industry the sectoral classification and the enterprise coverage of the DRIEs was revised repeatedly.
2.1 Sectoral classification
At both the national and the provincial levels, data are usually available for the economy as a whole as well as by sector. The main sectoral breakdown of the economy in the national income and product accounts (NIPA) is into primary, secondary, and tertiary sectors. The primary sector, i.e., agriculture, comprises farming, forestry, animal husbandry, and fisheries. Comprehensive data on all subsectors are typically limited. The secondary sector comprises industry and construction. For industry, data are available on up to 41 individual industrial sectors, with the precise number depending on the classification system in use at a given point in time. Time series data by industrial sector are available only for the directly reporting industrial enterprises (DRIEs), i.e., those enterprises that report regularly to the statistics xitong (functional bureaucracy), for variables ranging from output to employment, balance sheet, and profit and loss account data. The DRIE data for individual industrial sectors are reported in the industry statistics and are not reported as part of the NIPA. Tertiary sector data are available in the NIPA and in the employment statistics for an exhaustive set of subsectors (though in the employment statistics not always covering all employees). The most detailed breakdown of the tertiary sector is into 12 to 15 subsectors, depending on classification system. China’s sectoral classification system changed four times in the reform period:
Prior to 1984, the NBS used a classification system that had not been formally approved by China’s authority in charge of standards.
The first formal classification standard (GB, guobiao) was issued in 1984, labeled GB/T4754-1984 (in the following abbreviated “GB1984”).
GB1984 was revised in 1994 (GB/T4754-1994, or “GB1994”), following a trial revision in 1992.
In 2002, GB2002 was issued (GB/T4754-2002, “GB2002”). In 2011, GB2011 was issued (GB/T4754-2011, “GB2011”).
An official list of sectoral categories is available for GB1984, GB2002, and GB 2011, not for the pre-1984 classifcation system or for GB 1994.1 A general description of the changes between GB1994 and GB2002 is given in the first through seventh issues of the 2003 edition of the NBS magazine Zhongguo tongji. NBS (2011) shows the correspondence between GB2002 and GB2011 and between GB2011 and the International Standard Industrial Classificataion of All Economic Activities (ISIC/Rev. 3). The pre-1984 classification system and GB1994 are deduced as follows. The sectoral employment data in the 1990 population census, as presented in the Population Census 1990, are in perfect accordance with the published GB1984, and the same holds for the 2010 population census and GB2002. This suggests that the available sectoral employment data of the 1982 population census may also match the (unpublished) pre-1984 classification system, and the available sectoral employment data of the 2000 population census may also match the (unpublished) GB1994. The discussion in the magazine Zhongguo tongji of the changes between
4
GB1994 and GB2002 likewise suggests that the classification of employment values in the population census 2000 is in accordance with GB1994. Appendix 1 through Appendix 5 present the five classification systems at the one- and two-digit level:
pre-1984 as deduced from 1982 population census data,
GB1984 as available in official publications and used in the population census of 1990,
GB1994 as deduced from population census data of 2000,
GB2002 as available in official publications and used in the population census of 2010,
and GB2011 as available in official publications. The first four appendices include the population census employment values of the corresponding years 1982, 1990, 2000, and 2010 (since 2000 collected for only a subset of the population, in the censuses’ long-form survey) in order to give some indication of the relative size of the different sectors. Employment rather than output values are included because output values are not available at the two-digit level for all sectors. Appendix 6 presents the International Standard Industrial Classification of All Economic Activities (ISIC), Revision 3.1. China’s domestic classification systems at no point match ISIC 2, 3, 3.1, or 4 (draft version). The first and last columns of Appendix 1 through Appendix 5 show the transitions between the different standards. Table 1 summarizes the major changes over time. Thus, (i) GB1984 for the first time separately listed agricultural (and water conservancy) services as subsector of the primary sector (Appendix 2, first column, top rows), (ii) disaggregated and relabeled industrial subsectors (presumably keeping the aggregate of industry unchanged), and (iii) retained the pre-1984 tertiary sector subsector classifications. The two standards appear largely compatible for the three main economic sectors (primary, secondary, and tertiary sectors) and also at the one-digit classification level with 13 (exhaustive) sectors. The only concern is that the subsector ‘agricultural (and water conservancy) services’ in 1984 was newly listed as part of the primary sector; it was not included anywhere in the pre-1984 classification. If it was subsumed in other agricultural subsectors in the pre-1984 classification, then the two standards are compatible at the level of the three main economic sectors. If, however, it was moved from the tertiary sector to the primary sector, then the two standards are not fully compatible at the level of the three main economic sectors—the discrepancy would be small as ‘agriculture (and water conservancy) services’ accounted for only 0.20 percent of economy-wide employment in 1990. In GB1994, the overall 13-sector one-digit classification turned into a 16-sector classification. Water conservancy moved from the primary to the tertiary sector (to become part of geological prospecting and water management). The effect on the primary and tertiary sector aggregates is likely small, with only 0.07 percent of economywide employment (as captured by the long-form survey of the 2000 population census) in water conservancy. Apart from the switch of water conservancy from the primary to the tertiary sector, the three main economic sectors are compatible between GB1984 and GB1994. The industry subsector classification changed again, but the aggregate of industry appears unchanged. Construction lost one small subsector, but that subsector may have been integrated in a different construction subsector. The tertiary sector subsector classification underwent a major revision that makes comparisons of tertiary sector subsectors between GB1984 and GB1994 near-impossible.
5
In GB2002, the total number of one-digit sectors increased to 20, with the classification now extending over four levels (menlei, dalei, zhonglei, xiaolei).2 The description of the changes in GB2002 (in comparison to GB1994) provided in the first through seventh issues of the magazine Zhongguo tongji in 2003 suggests a wide range of re-classifications, including across the three economic sectors. For example, in GB2002, one two-digit and one three-digit sector moved from industry into agriculture.3 One lower-level agricultural sector (‘household sideline businesses,’ jiating lianying fuye) is dissolved into the corresponding other (including industrial) sectors. In industry, the main changes are reallocations of three-digit sectors between industrial two-digit sectors. In construction, one significant change is the switch of institutions involved in preparatory work for construction from the construction sector to the tertiary sector (into polytechnic services). In the tertiary sector, the one-digit classification is revised and expanded, with reclassifications of lower-level sectors. Overall, the three main economic sectors appear only approximately compatible between GB1994 and GB2002, with minor and bi-directional changes between economic sectors. In addition, the coverage of the tertiary sector may have been extended to economic activities that were previously not included in the calculation of GDP. GB2011 retains unchanged the three main economic sectors as in the GB2002, as well as the total of 20 one-digit sectors. The innovations are changes in labels, changes in the order of tertiary sector subsectors, and reclassifications within the secondary and tertiary sectors.4 GB 2011 went into effect on 1 November 2011 and first applies to the data of 2012.
[Table 1 about here] In identifying the data relevant for productivity analysis, the issue of classification systems matters for ensuring consistency over time as well as across variables. Official data often come without an explicit statement as to which classification system is being used and it must then be deduced from the labels of individual sectors. At times, a published time series follows different classification systems in different years, or one table in the Statistical Yearbook reports data following two different classification systems, without this being made explicit.
2.2 Ownership classification
In 1998, the NBS revised its ownership classification. Table 2 compares the ownership classification in use since 1998 with that in use prior to 1998. The collective-owned employee stock cooperatives are no longer included in a summary statistic on collective-owned enterprises but are now listed separately.5 “State-owned enterprises” now refers only to the unreformed, or “traditional,” or “pure” SOEs, i.e., SOEs established or organized under the 1988 SOE Law. The SOE classification now also excludes the 100 percent state-owned limited liability companies as well as the joint operations between two or more state-owned enterprises. A stock company subcategory was added to each of three ownership types: private enterprises, HKMT (Hong Kong, Macao, Taiwan) enterprises and (non-HKMT) foreign-invested enterprises. This implies that the separate “ownership” category called “stock companies” now excludes stock companies in private, HKMT, or foreign ownership. The “ownership” category “limited liability companies” newly includes 100 percent state-owned limited liability companies. It continues to exclude privately owned limited liability companies (which are included in the private enterprise category). Presumably, the same pattern holds for HKMT and wholly foreign-owned enterprises in the form of limited liability companies. Since 1998, the individual-owned economy (getiyu) is no longer included in the owernship classification as these self-employed are not formally registered as enterprises. This category
6
comprised the household “enterprises” (or collaborations between household “enterprises”) with fewer than eight persons.
[Table 2 about here] With the category state-owned enterprises now only covering the unreformed SOEs, a separate, new category of “state-owned and state-controlled enterprises” (SOSCEs) outside the formal ownership classification appeared in many statistics to capture state ownership in the various enterprise forms. The SOSCEs comprise the
pre-1998 definition SOEs, i.e.,
unreformed (or: pure) SOEs, SOE-SOE joint operation enterprises, and solely state-owned limited liability companies,
+ all (other) enterprises (including limited liability companies and stock companies) in which the state has a controlling stake.6
The effect of these redefinitions is the existence of three different concepts of state ownership
in the official statistics:
the pre-1998 SOE category (unreformed SOEs, solely state-owned limited liability companies, SOE-SOE joint operation enterprises),
the SOE category since 1998 (unreformed SOEs),
and the SOSCEs (since 1998).7 A direct comparison between the three concepts is first possible for 1999. In 1999, the gross
output value (GOV) of unreformed SOEs was 2.2 trillion yuan; the GOV of unreformed SOEs, SOE-SOE joint operation enterprises, and solely state-owned limited liability companies (pre-1998 definition of SOEs) was 2.6 trillion yuan; and the GOV of SOSCEs was 3.6 trillion yuan (Statistical Yearbook 2001, p. 401). In 2010, the three values were 5.7, 8.5, and 18.6 trillion yuan (Statistical Yearbook 2011, pp. 499, 510). I.e., SOSCE GOV grew much more rapidly than the output of the unreformed SOEs or the output of the pre-1998 SOE category, and any political interest in a large state share in the economy suggests the use of the new concept of SOSCEs. But compared to an almost ten-fold increase in nominal GOV of all DRIEs in this period, SOEs in all three definitions fell behind with a three-fold, three-fold, and five-fold increase only. The SOSCE share in DRIE GOV over this period fell from 49 percent to 27 percent.
2.3 Industrial sector statistics
The NBS releases annual data on the DRIEs by industrial (two-digit) sector. These data are frequently of interest as they comprise output, balance sheet, and profit and loss account data; since 1998, employment values of the DRIEs are also reported in the same tables. The fact that all data come in one and the same (or a split) table eliminates any compatibility issues between variables. However, some of the changes to the sectoral classification system over time affect these industrial two-digit sectors. Less obvious is the changing coverage of the DRIEs over time. Two-digit sectoral data for a larger set of enterprises than the DRIEs are available only in the infrequent industrial and economic censuses. With the help of these censuses it is possible to
7
estimate to what extent the DRIEs—on which detailed annual data are available—are representative of all industry.
2.3.1 Sectoral classification system and coverage of DRIEs
In NBS publications, consistent classifications are in use for the following periods:
1980-84 (13 industrial sectors, with a very limited number of variables),
1980 and 1984-1992 (30 industrial sectors following GB1984),
1993-1997 (39 industrial sectors following GB1994),
1998-2002 (37 industrial sectors following GB1994),
2003-2011 (39 industrial sectors following GB2002),
and 2012- (41 industrial sectors following GB2011). For each variable, in each period, the sum across sectors comes close to, or equals, the reported “total” DRIE value. When the sum across sectors does not equal the total, the implicit residual could reflect the (in all years) exclusion of military industry. A sector “weapons and ammunition manufacturing” is included in GB1994 (only), with no data reported. In GB2002 this sector disappears, not to re-appear at any other location of the classification sytem. In 1995, the residual industry sector is relatively small in size, accounting for 3 percent of employment and enterprise numbers and for 2 percent of GOV; however, the typical DRIE in that sector is relatively large in terms of output or employment per enterprise. The coverage of the DRIEs first changed in 1998.
Through 1997, the DRIEs were defined as “industrial enterprises with independent accounting systems at the township level and above.”
Since 1998, the DRIEs are defined as “industrial state-owned enterprises (de facto SOSCEs) with (de facto) independent accounting systems and all industrial non-SOSCEs with independent accounting systems and annual sales revenue in excess of 5m yuan.”8
The short-form label of the DRIEs in the Chinese statistics changed correspondingly, from “above-norm” to “enterprises above designated size.” Subsequently, the coverage of the DRIEs was redefined three times, and the 2004 economic census led to the capture of previously excluded enterprises. These changes are discussed in the following. Two minor redefinitions occurred in 2005 and in 2007.9 In 2005, the term “sales revenue” was changed to “revenue from principal business.”10 In 2007, the separate inclusion of all state-owned enterprises disappeared and only the size criterion was retained. Starting in 2007, thus, the DRIEs comprise “all industrial enterprises with independent accounting systems and annual revenue from principal business in excess of 5m yuan.” Starting in 2011, the size criterion changed from 5m yuan to 20m yuan.11 Otherwise, the earlier definition was retained. A statistical break occurred around 2004, following the 2004 economic census, with revisions to some DRIE data. Thus, the Statistical Yearbook 2005 (p. 493)—based on pre-economic census data compilation methods—covered 219,463 DRIEs in 2004. Economic census
8
data of 2004 are incorporated in subsequent issues of the Statistical Yearbook, with the 2007 issue being the first one to report key data on more than just the current year, with a set of data for the years since 1998 (p. 508). The earlier 2004 number of DRIEs is revised to 276,474, a 26.0 percent upward revision. GOV is revised upward by 7.7 percent. Value-added is not revised. Data for the earlier years, 1998 through 2003, are not revised. (Statistical Yearbook 2005, p. 488) The only explanation that can reconcile the apparent discrepancy between the revision to enterprise numbers and GOV but not value-added in 2004 is if the definition of what constitutes an enterprise changed in 2004. For example, if companies that comprise several factories were previously counted as one enterprise but are now newly counted as several enterprises, the number of enterprises and GOV increases, but value-added remains unchanged. However, the number of employees is also revised (as are profit and loss account data), from a pre-economic census 60.9862m to 66.2209m, an increase of 10.9 percent (Statistical Yearbook 2005, p. 494, 2007, p. 510). This suggests that the economic census newly captured a significant number of enterprises which, given the proportion of the revision to the enterprise number (+26 percent) vs. GOV (+7.7 percent) and employment (+10.9 percent), are of relatively small size, possibly just barely making the 5m yuan sales revenue mark. That the NBS did not correspondingly revise value-added questions the quality of the output data. The value-added data are more likely to be deficient than the GOV data because enterprise accountants have no immediate interest in value-added but in GOV (sales revenue plus changes in inventories). The NBS obtains value-added by applying ratios to GOV values.12 Overall, the changes to the coverage of the DRIEs reduces the possibility of consistent time series analysis:
The re-definition of the DRIEs in 1998 creates a severe statistical break.
While the group of DRIEs changes every year in response to the entry or exit of firms, and to changes in the size of existing firms around the size threshold, in 2004 a set of enterprises that previously avoided reporting was newly included. These are likely to be relatively small enterprises. It causes a statistical break in all DRIE-related time series except value-added, where a break, possibly wrongly, does not occur.
The impact of the two redefinitions of 2005 and 2007 on the overall values of the DRIEs should be minor because revenue from principal business is likely to be less than one percentage point different from sales revenue, and because nearly all industrial state-owned enterprises have annual revenue from principal business in excess of 5m yuan.13
The 2011 change in the size criterion will likely have a significant impact. Together, the changes to the sectoral classification system and the changes to the coverage of the DRIEs imply consistent data for the following periods:
1980-84: 13 industrial sectors, with a very limited number of variables, for the pre-1998 coverage of the DRIEs;
1980 and 1984-1992: 30 industrial sectors following GB1984, for the pre-1998 coverage of the DRIEs;
1993-1997: 39 industrial sectors following GB1994, for the pre-1998 coverage of the DRIEs;

9
1998-2002: 37 industrial sectors following GB1994, for the post-1997 coverage of the DRIEs;
2003-2004: 39 industrial sectors following GB2002, for the post-1997 coverage of the DRIEs using pre-economic census 2004 data;
2004-2005 or -2007 or -2010: 39 industrial sectors following GB2002, for the post-1997 coverage of the DRIEs using post-economic census 2004 data, with two minor re-definitions in 2005 and 2007 (revenue from principal business as criterion rather than sales revenue, and the omission of “all state-owned enterprises” as a separate category from the definition);
2011: 39 industrial sectors following GB2002, for the post-1997 coverage of the DRIEs using post-economic census data and a new size criterion of 20m yuan;
and 2012-: 41 industrial sectors following GB2011, for the post-1997 coverage of the DRIEs using post-economic census data and a new size criterion of 20m yuan.
2.3.2 Representativeness of the DRIEs in the aggregate
Researchers often generalize their findings from DRIE data—the only comprehensive annual industry data available—to all of China’s industrial sector (and may not make explicit that their industry data are limited to the DRIEs). But the production structure of DRIEs could differ significantly from that of other industrial enterprises. At the aggregate level, a comparison between DRIEs and all industry is possible using output and employment data.The share of DRIEs in industry value-added has fallen continuously from above 95 percent in 1979 to 75 percent in 1992 and reached a low of 61 percent in 1997 (Figure 1, with estimated DRIE value-added through 1992). After the statistical break in the definition of the DRIEs in 1997-1998, their share in industry value-added in the NIPA rose from 58 percent in 1998 to 87 percent in 2004, presumably reflecting the fact that an increasing number of industrial enterprises reached annual sales revenue of 5m yuan. Following the 2004 economic census, industry value-added was retrospectively revised upward, slightly lowering the share of DRIEs (whose value-added was not revised). Figure 1 suggests two data problems. First, the jump in the share of the DRIEs from 75 percent in 1992 to 91 percent in 1993 and the subsequent equally drastic decline to 76 percent in 1994 (and to 62 percent in 1995) is not plausible. The concept of value-added was newly introduced in 1993 (with data on value-added of the DRIEs retrospectively available for the years since 1992). The NBS may have experienced difficulty in compiling value-added data in the early years, including the proper handling of the also newly introduced value-added tax.14 Alternatively, the industry value-added data reported in the NIPA could be problematic.15 A second problem are the 2006 and 2007 shares of DRIEs in the value-added of industry, at 99.7 percent and 109.2 percent (and the rapid rise to such high shares over the previous years). The 2006 share seems far too high, given that in the previous year, 2005, the DRIEs accounted for 93 percent of value-added of all industry. The 2007 share, in excess of 100 percent, is logically not possible. These values question the quality of either the DRIE data or the quality of the NIPA data. Publication of DRIE value-added data was discontinued in 2008. DRIE value-added data could be problematic because value-added is a national income accounting concept, not an enterprise management concept. The closest measure that enterprise managers (and their accountants) are likely to care about is sales revenue. Sales revenue plus net additions to inventories approximately equals GOV,16 with typically a difference between sales

10
revenue and GOV on the order of 1 percent only. The NBS can calculate value-added by applying a ratio to the GOV data. This ratio has changed little over time. The average of the years 1990-1999, for all of industry, was 3.50 with a coefficient of variation of 0.03; in 1998-2007, for the DRIEs, the average was 3.45 with a coefficient of variation of also 0.03.17 If the quality of the ratios is poor, then DRIE value-added data may be of poor quality. For industry value-added in the NIPA, the NBS could rely on industry and economic censuses to obtain somewhat reliable measures of value-added for the census years, and fill in the years in between (or since a census) by using the annual changes in DRIE GOV. Figure 2 shows a similar trend for the case of employment, but at a lower level throughout. The share of DRIEs in industry employment fell from 0.67 in 1980 to 0.40 in 2001, before rising again, to 0.57, in 2010. With the redefinition of the group of DRIEs in 2011, the share value fell back to 0.54. Thus, while DRIEs consistently account for the bulk of industrial output, their share in employment never exceeded 0.67, fell to values as low as 0.40, and leveled out at a value around 0.54 in recent years.
[Figure 1 and Figure 2 about here]
2.3.3 Representativeness of the DRIEs in individual industries
At the level of individual industrial sectors, representativeness can come in one or both of two ways. The DRIEs could account for a very large share of that sector, in which case the DRIEs constitute (almost) all activities of that sector, or the typical DRIE in that sector could be very similar to the typical non-DRIE in that sector. Analysis of the DRIE share in individual industries is possible for 1995, 2004, and 2008 using data from the 1995 industrial census and from the 2004 and 2008 economic censuses. For 1995, data on all enterprises within any one individual industrial sector are not available; what are available by individual industrial sector are data on “industrial enterprises at the village level and above plus private, joint, and individual-owned industrial enterprises with annual sales revenue in excess of 1m yuan,” here abbreviated “village+ enterprises.” The only missing enterprises are private, joint, and individual-owned industrial enterprises with annual sales revenue below 1m yuan (“small private+ enterprises”). In the aggregate across industry, the “village+ enterprises” in 1995 accounted for 85 percent of industrial GOV, with data on value-added not available. The DRIEs accounted for 67 percent of industrial GOV and for 62 percent of industrial value-added.18 Table 3 examines the output volume of DRIEs (and SOEs) in comparison to the “village+ enterprises,” (industrial) sector by sector, for the three variables on which data for the “village+ enterprises” are available: enterprise numbers, GOV (no value-added data are available), and employment.19 Five monopolistic sectors stand out, in which the DRIEs account for more than 90 percent of the GOV of the “village+ enterprises:” ‘petroleum and natural gas extraction,’ ‘tobacco processing,’ and the three utilities sectors. DRIEs (and SOEs) account for a large share in the GOV or in the employment of the “village+ enterprises” in those sectors in which the GOV or the value-added per DRIE (value-added data are available for DRIEs and SOEs) or the number of employees per enterprise is large. This suggests that when the DRIE share in the “village+ enterprises” (in terms of output or employment) is low, the DRIE share in the larger aggregate of all industry is likely to be even lower. This is the case because the (in terms of sales revenue and employment) “small private+ enterprises” by definition are likely to crowd into sectors with low output and employment

11
(strong correlates to sales revenue) per enterprise. The degree of representativeness indicated by the DRIE share in “village+ enterprises” thus is likely to exaggerate the DRIE share in all industry more for sectors in which the DRIE share is low than for sectors in which the DRIE share is high. Table 6 reports the significance levels of the core correlation coefficients for all three years, 1995, 2004, and 2008, with 2004 and 2008 discussed below; throughout, the results are reported excluding a small number (3-5) of monopoly sectors, and are mostly identical if these sectors are included.20 In 1995, the DRIEs account for less than 50 percent of “village+ enterprise” GOV in two sectors (5, 16), and for 80 percent or more in 21 sectors. In the latter 21 sectors— which accounted for 70 percent of DRIE value-added and for 59 percent of “village+ enterprise” GOV —one might consider the DRIEs as relatively representative of that sector since they constitute the bulk of activities of that sector, while in the former two they may not be. Sectors in which the DRIEs’ share in the GOV of “village+ enterprise” is in the 60-70 percent range may have quite a few “small private+ enterprises.” For example, the garments industry, the leather industry, and the timber industry (sectors 13-15) all come with low DRIE value-added per enterprise (and are not known monopoly industries), which suggests they are natural entry industries for the “small private+ enterprises.” How similar are the DRIEs to the non-DRIEs, especially in those sectors in which DRIEs account for a small share of output or employment? The correlation coefficients between non-DRIE and DRIE (or SOSCE) values of GOV per enterprise and GOV per employee are significantly positive (but not those of employment per enterprise). I.e., when GOV per enterprise in the DRIEs of a particular sector is low, it is also low for the non-DRIEs. Except that for the non-DRIEs, values tend to be lower throughout than for the DRIEs (or SOSCEs). Thus, in 1995, the non-DRIE values as a fraction of the DRIE values, in the aggregate across all sectors, were: GOV per enterprise 0.18, employment per enterprise 0.20, and GOV per employee 0.90. The non-DRIE value of GOV per employee relative to the DRIE value was highest in ‘printing and record pressing’ (sector 18), at 0.64, and second-highest in ‘furniture manufacturing’ (sector 16), at 0.61. Going a step further, in case the share of DRIEs in output or employment of a particular sector is relatively small, are the non-DRIE characteristics then particularly close to the DRIE characteristics, i.e., is the ratio of non-DRIE to DRIE values high (approaching unity)? If so, then if DRIEs account for only a small share of a sector, they can still be representative of the whole sector if the enterprises on which data are only available in censuses are very similar to the DRIEs (on which annual data are available). For 1995, the answer is to the negative. The non-DRIEs are not similar to the DRIEs in sectors in which DRIEs have a low share. There is either no correlation (for GOV per enterprise or per employee), or the correlation is positive (for employees per enterprise), in which case DRIEs and non-DRIEs share the same characteristics only in sectors with a large share of DRIEs. I.e., in 1995, in sectors with low DRIE penetration, these DRIEs are not representative of all enterprises. This changes by 2004. By 2004, the DRIEs accounted for 91 percent of the GOV of all industry and 93 percent of industry value-added in 2004.21 However, there are two caveats. First, the economic census does not consider (and thus not include in its total) the individual-owned “enterprises”—which are not formal enterprises. Nevertheless, given that the aggregate relative size of the individual-owned enterprises is unlikely to have increased since the 1995 industrial census, the share of DRIEs in total industrial output (including the individual-owned enterprises) is likely larger in 2004 than in
12
1995. A second caveat are the implausibly high shares of the DRIEs in 2006 and 2007 (Figure 1), possibly also questioning the quality of the earlier data, of 2004. Table 4 provides a breakdown by individual industrial sector of DRIE and “all industry” values reported in the 2004 economic census. The share of DRIEs (SOSCEs) in the number of enterprises, in GOV, or in employment of all industry is positively correlated with the enterprise size measured as DRIE (SOSCE) GOV per enterprise or employment per enterprise, as well as with GOV per employee (with the one exception that the SOSCE share in the number of industrial enterprises is not correlated with enterprise size values). In other words, as in 1995, in an industry in which the average DRIE (SOSCE) is relatively large, DRIEs (SOSCEs) account for a relatively large share of the output of that industry. Corresponding value-added data are not available by individual industrial sector for the group of all enterprises.22 By 2004, DRIEs accounted for at least 50 percent of GOV in every single industrial sector. They accounted for less than 70 percent of GOV in only four sectors (which, together, accounted for 2.2 percent of aggregate industrial GOV). The DRIE share was higher than 80 percent in 29 out of the 39 sector, with GOV of these sectors accounting for 88.8 percent of aggregate industrial GOV. The employment picture is slightly different: DRIE shares in sectoral employment are lower, with shares below 50 percent in three sectors, and shares above 80 percent in 11 sectors only. GOV and employment shares, though, are highly correlated, for DRIEs as well as for SOSCEs. How similar are the DRIEs to the non-DRIEs, especially in those sectors in which DRIEs account for a small share of output or employment? The correlation coefficients between non-DRIE and DRIE (or SOSCE) values of the three ratios (GOV per enterprise, employment per enterprise, and GOV per employee) are significantly positive throughout. When GOV per enterprise (etc.) in the DRIEs of a particular sector is low, it is also low for the non-DRIEs, except that for the non-DRIEs, values tend to be lower throughout than for the DRIEs (or SOSCEs). Thus, in 2004, the non-DRIE values as a fraction of the DRIE values, in the aggregate across all sectors, were: GOV per enterprise 0.03, employment per enterprise 0.10, and GOV per employee 0.25. The non-DRIE value of GOV per employee relative to the DRIE value was highest in water production and distribution (sector 39), at 0.64, and second highest in the manufacture of articles for culture etc. (sector 18) at 0.45. In contrast to the findings for 1995, if the share of DRIEs in output or employment of a particular sector is small in 2004, then the non-DRIE characteristics consistently come close to the DRIE characteristics. This means that if the share of DRIEs in output or employment of a particular sector is small, the typical DRIE in that sector strongly resembles—or: is representative of—the typical non-DRIE in that sector. In contrast, when the DRIEs account for a very large share of output or employment in a sector, the typical DRIE in that sector is unlikely to have the same characteristics as the typical non-DRIEs in that sector, but given that the DRIEs account for a very large share of output and employment in that sector, there is little else in this sector besides DRIEs. Thus, by 2004 DRIEs are representative of all enterprises in an industrial sector either because they strongly dominate that sector or—if they don’t strongly dominate the sector—because their characteristics are similar to those of the non-DRIEs. In 2008, DRIEs accounted for 93 percent of the GOV of all industry (which excludes the individual-owned economy), with no value-added data on DRIEs available any more. Table 5 provides the sectoral breakdown. All patterns hold as in 2004: when DRIEs (or SOSCEs) are relatively large in terms of output or employment per enterprise, they account for a large share of that sector’s output, total number of enterprises (though not for SOSCEs), and employment. In

13
34 out of the 39 industrial sectors, DRIEs accounted for 80 percent or more of output; in terms of employment shares, only two sectors had DRIE shares below 50 percent, while 14 sectors had DRIE shares above 80 percent. DRIE and SOSCE values for the three ratios (GOV or employment per enterprise, GOV per employee) continue to be highly positively correlated with the non-DRIE values. Compared to 2004, the (double-) ratios of Non-DRIE to DRIE values are even smaller: 0.02, 0.10, and 0.20. For GOV per employee, the highest ratio is 0.46 in water production and distribution, closely followed by relatively high ratios throughout the first half of the manufacturing sectors. Also as in 2004, if the share of DRIEs in output or employment of a sector is low then the characteristics of the typical DRIE in that sector are close to the characteristics of the typical non-DRIE in that sector. The conclusion thus, again, is that in sectors with a relatively small share of DRIEs, non-DRIEs are similar to DRIEs, i.e., DRIEs are representative of non-DRIEs, while in sectors with a relatively large share of DRIEs there is little else besides DRIEs to begin with. Overall, Figure 1 with aggregate data suggests that the DRIEs are more representative of all industrial enterprises early in the reform period and in the 2000s than in the 1990s. Questions remain about the quality of output data in the late 2000s and about the extent of the individual-owned economy that is missing from the industry totals. The detailed sectoral data suggest that in 2004 and 2008 DRIEs are representative of all industry in virtually all sectors, either by virtue of accounting for much of output and employment in a sector or by virture of having the same characteristics as the non-DRIEs; this is less the case in 1995.
[Table 3, Table 4, Table 5, and Table 6 about here]
3. SOURCES OF CHINESE STATISTICS
Data availability differs between the pre-reform and the reform period. Statistics going back to the early years of the PRC usually start with the year 1952, some with 1949. Data for the period 1949/52 through 1977 are relatively scarce. The quality of the data of some pre-reform years, such as the years of the “Great Leap Forward” and the “Cultural Revolution,” are likely to be poor as data for these years were assembled retrospectively in later years. Recent statistical publications, when reporting time series data, tend not to report pre-reform period data but to start with the year 1978. The statistics xitong publishes economic data ranging from NIPA aggregates to price indices and labor market indicators, as well as various socio-demographic data. Some of these data have been collected by the statistics xitong itself, and some are obtained from other government departments. Each government department may also issue its own statistical publication(s). The NBS explains some of the data that it publishes, while a research literature explains Chinese data and examines its quality.
3.1 Data publications
Some statistical publications cover a wide range of variables, comprising different areas of the economy and/or society, typically for a particular year; the key example is the Statistical
Yearbook (of China). Others cover a narrower range of variables over a longer period of time, or

14
focus on a particular topic in a particular year with limited time series data. Some publications are one-off publications, reporting on one particular event, typically a census. Provincial data are included in some national-level publications and are also published by each province, in the form of provincial statistical yearbooks and occasionally other provincial statistical publications.23 These provide more detail on a particular province than national-level publications do. The statistics departments of some municipalities also publish data compilations, usually in the form of municipal statistical yearbooks. Localities may publish separate compendia with long-run data for the particular locality or with statistics on a particular sector or topic (such as provincial industry statistics). Most publications are in Chinese only. Bilingual publications, or English language editions, are explicitly noted below. Annual yearbooks, which come with a particular year in the title, typically do not contain data for the year given in the title but data for the previous year (and often also for earlier years). The year given in the title tends to be the year in which the book was published. The data reported in the Statistical Yearbook are available online at the NBS website (at www.stats.gov.cn), with several months’ time lag, free of charge, and starting with the 1996 issue.24 The website further provides quarterly and monthly data on selected indicators since 2001 (2002 in the English version), as well as data on recent censuses. The provision of data via this website appears to be under constant improvement both in terms of the range of data provided and in terms of the time span covered. The English language version of the website tends to be lagging behind.25 The NBS website (in the Chinese version) also provides links to the statistics webpages of other government organizations and of provincial statistics departments. Some provincial statistics departments—and a few municipal/prefectural statistics departments—also provide data online. Many of the recent statistical yearbooks come with a data CD that contains all data printed in the yearbook; some of the data on the CD have more decimals than the data printed in the yearbook (apparent only when one examines the individual cells of a spreadsheet provided on the CD). Outside China, the CEIC Data “China Premium Database” (http://www.ceicdata.com/) provides a wide range of data. Another source of Chinese statistics is the “China Data Center” at the University of Michigan (http://www.umich.edu/~iinet/chinadata/). It draws on NBS data as well as on data from other Chinese government institutions; some of these are integrated into a geographic information system.
3.1.1 Annual data
The NBS publishes annual data in approximately two dozen statistical yearbooks. The primary publication is the Statistical Yearbook (China Statistical Yearbook, Zhongguo tongji nianjian), available starting in October of each year with data through the previous year. The data from a particular year first appear in a brief “Statistical communiqué on the economic and social development in year XXXX” (also: “Statistical Bulletin;” XXXX nian
guomin jingji he shehui fazhan tongji gongbao) published in February of the following year, and then in a more extensive Statistical Abstract (China Statistical Abstract, Zhongguo tongji
zhaiyao) in May.26 The comprehensive Statistical Yearbook then follows in fall, typically with a September publication date and availability sometime in October. The Statistical Yearbook 2012
15
comprises 25 sections on topics ranging from the NIPA (primarily GDP-related data) to investment, prices, and culture/sports/public health.27
The first Chinese language issue of the Statistical Yearbook series is of 1981 (with “1981” in the title), reporting data through 1981. Starting with the subsequent issue, the year in the title is one year ahead of the data reported; thus, the second Chinese language issue is labeled “1983” and reports data through 1982. The Statistical Yearbook has been bilingual since the 1994 edition. Separate English editions (Statistical Yearbook of China) appear to have been published parallel to the Chinese editions for 1981 through 1993. Since the 1996 issue, the Statistical Yearbook comes with an introductory passage to each of its sections where data and data sources are explained. Definitions of variables are appended at the end ofeach section. The data coverage of the Statistical Yearbook focuses on the previous year, with occasionally data reported for some or all years since 1978. In the case of GDP, the Statistical Yearbook series usually offers one revision of annual GDP data. Thus, each issue of the Statistical Yearbook contains “first confirmed” GDP data for the most recent year and revised (“second confirmed”) GDP data for the second-most recent year.28 The NBS publishes a number of statistical yearbooks on specialized topics. A list of such yearbooks follows below, with all dates, here and below, referring to the date in the title of the book (which may not be the publication date, but often is), and XXXX/YYYY in this section referring to one yearbook with a period XXXX through YYYY in the title.29 Those statistical yearbooks that have been referenced earlier in this article with an abbreviated title are included in the list below as well as in the bibliography at the end of the article.
China Agricultural Product Price Survey Yearbook (Zhongguo nongchanpin jiage
diaocha nianjian); published annually since 2004.
China and Urban Living and Price Yearbook (Zhongguo ji chengshi (zhen) shenghuo yu
wujia nianjian); published annually since 2006, bilingual. Successor to the China Price
and Urban Citizen and Houshold Income/Expenditure Survey Statistical Yearbook and to the China Price Statistical Yearbook.
China Basic Statistical Unit Statistical Yearbook (Zhongguo jiben danwei tongji
nianjian); published annually since 1999.
China City Statistical Yearbook (Zhongguo chengshi tongji nianjian); published annually since 1985, with a combined 1993/1994 volume. Separate English volumes (China
Urban Statistics) for each year 1985-88 (and possibly through 1990).
China Commodity Trade Market Statistical Yearbook (Zhongguo shangpin jiaoyi
shichang tongji nianjian); published annually since 2001, with as title of the 2003 volume China Commodity Trade Market Yearbook (Zhongguo shangpin jiaoyi shichang
nianjian).
China Construction Statistical Yearbook (Zhongguo jianzhuye tongji nianjian); published annually since 1996. The predecessor is China Construction Statistical Material (Zhongguo jianzhuye tongji ziliao), published for 1952/85, 1986/87, 1988/89, and 1990/91.
China County [City] Social and Economic Statistical Yearbook (Zhongguo xian [shi]
shehui jingji tongji nianjian); published annually since 2000 (in 2000 labeled Outline (gaiyao), rather than Yearbook).

16
China Energy Statistical Yearbook (Zhongguo nengyuan tongji nianjian); issues of 1986, 1989, 1991, 1991/1996, 1997/1999, 2000/2002, and then annually since 2004, bilingual since the 1991/1996 issue.
China Foreign Economy Statistical Yearbook (Zhongguo duiwai jingji tongji nianjian); issues of 1994 (with data for 1990-1993), 1996, and then annually starting 1998, bilingual. The successor is the China Trade and Foreign Economy Statistical Yearbook.
China Industrial Economy Statistical Yearbook (Zhongguo gongye jingji tongji nianjian), here abbreviated Industrial Yearbook; issues of (in the title) 1988, 1989, 1990, 1991, 1992, 1993, 1994, 1995, 1998, 2001, 2002, 2003, 2004, and then annually since 2006. Some issues carry detailed data of two previous years (rather than only one). The predecessor is the China Industrial Statistical Material (Zhongguo gongye jingji tongji
ziliao), with issues of 1949/1984, 1986, and 1987.
China Investment in Fixed Assets Yearbook (Zhongguo guding zichan touzi tongji
nianjian); issues of 1950/95, 1997, 1998, 1999, and then annually since 2003. The predecessor is the China Investment in Fixed Assets Statistical Material (Zhongguo
guding zichan touzi tongji ziliao), with issues of 1950/1985, 1986/1987, 1988/1989, and 1990/1991.
China Labor Statistical Yearbook (Zhongguo laodong tongji nianjian); published annually since 1991, bilingual since 1995. A 1989 and a 1990 issue are available as China Labor and Wage Statistical Yearbook (Zhongguo laodong gongzi tongji nianjian).
China Market Statistical Yearbook (Zhongguo shichang tongji nianjian); published annually between 1993 and 2004. The successor is the China Trade and Foreign
Economy Statistical Yearbook.
China Markets Yearbook (Zhongguo shichang nianjian); published in 1999 (1996 data), 2000 (1998 data), 2001 (2000 data), 2003 (2001 data), 2004 (2002 data), 2005 (2003 data), and 2006 (2004 data), bilingual. Discontinued with the 2006 volume. The predecessor is the China Industrial Markets Yearbook, bilingual; it was published in 1997 with 1995 data. The China (/Industrial) Markets Yearbook reports NBS industry data through changing (non-NBS) outlets. The yearbook contains detailed four-digit sectoral data for selected variables on approximately 500 industrial sectors, including a list of the ten largest enterprises in each sector, and including an incomplete ownership breakdown.30
China Population Statistical Yearbook (Zhongguo renkou tongji nianjian); published annually since 1988, bilingual since 1996.
China Price and Urban Citizen and Houshold Income/Expenditure Survey Statistical
Yearbook (Zhongguo jiage ji chengzhen jumin jiating shouzhi diaocha tongji nianjian); published annually between 2000 and 2005; the successor is the China and Urban Living
and Price Yearbook. The predecessor is the China Commodity Price and Urban Citizen
and Household Income/Expenditure Survey Statistical Yearbook (Zhongguo wujia ji
chengzhen jumin jiating shouzhi diaocha tongji nianjian) with issues of 1996, 1997, 1998, and 1999, itself preceded by the China Urban Citizen and Household
Income/Expenditure Survey Material (Zhongguo chengzhen jumin jiating shouzhi
diaocha ziliao) with issues of 1988, 1989, 1990, 1991, and 1994.
China Price Statistical Yearbook (Zhongguo wujia tongji nianjian ); published in 1988, 1989, 1990, 1991, 1992, and 1994. The successor is the China and Urban Living and
Price Yearbook.

17
China Real Estate Statistical Yearbook (Zhongguo fangdichan tongji nianjian); published annually since 1999, with combined volumes 2002/2003 and 2005/2006, bilingual.
China Regional Economy Statistical Yearbook (Zhongguo quyu jingji tongji nianjian); published annually since 2000, bilingual.
China Rural Household Survey Yearbook (Zhongguo nongcun zhuhu diaocha nianjian); published in 1992, and then annually since 2000.
China Rural Statistical Yearbook (Zhongguo nongcun tongji nianjian); published annually since 1985.
China Science and Technology Statistical Yearbook (Zhongguo keji tongji nianjian); published annually since 1991, bilingual since 1998.
China Trade and Foreign Economy Statistical Yearbook (Zhongguo maoyi waijing tongji
nianjian); published annually since 2006, bilingual. Successor to the China Foreign
Economy Statistical Yearbook and to the China Market Statistical Yearbook.
Compendium of Nationwide Agricultural Product Cost and Income Material (Quanguo
nongchanpin chengben shouyi ziliao huibian); published annually since 2002. Two summary volumes for 1953-1997 were published not by the NBS but by the China Price
Publishing House (Zhongguo wujia chubanshe), in 2003, with a title Compendium of
Nationwide Major Agricultural Product Cost and Income Material Since the Foundation
of the Country, 1953-1997 (Jianguo yilai quanguo zhuyao nongchanpin chengben shouyi
ziliao huibian 1953-1997).
International Statistical Yearbook (Guoji tongji nianjian); published annually since 1995, bilingual since 2002.
Several statistical yearbooks were initiated in 2006. These include the bilingual China
Environment Statistical Yearbook (Zhongguo huanjing tongji nianjian), the Chinese Society
Statistical Yearbook (Zhongguo shehui tongji nianjian), the Industrial Enterprise Science and
Technology Activities Statistical Material (Gongye qiye keji huodong tongji ziliao), and the China Tertiary Sector Statistical Yearbook (Zhongguo disan chanye tongji nianjian). The first issue of the bilingual China Population and Employment Statistical Yearbook (Zhongguo renkou
he jiuye tongji nianjian) appeared in 2007. Other central government departments also publish statistical yearbooks. Sometimes the particular government department itself publishes the book; at other times a special “editorial committee” is set up with no explicit link to a government department. Such statistical yearbooks include:
China Agricultural Statistical Material (Zhongguo nongye tongji ziliao); published annually since 1987 by the Agriculture Ministry.
China Civil Affairs Statistical Yearbook (Zhongguo minzheng tongji nianjian); published annually since 1990 by the Civil Affairs Ministry.
China Culture and Cultural Relics Statistical Yearbook (Zhongguo wenhua wenwu tongji
nianjian); published annually since 1997 by the Culture Ministry.
China Economic Yearbook (Zhongguo jingji nianjian); published annually since 1981 (by an identically named publishing company).
China Education Cost Statistical Yearbook (Zhongguo jiaoyu jingfei tongji nianjian); published annually since 1996 by the Education Ministry.
18
China Education Statistical Yearbook (Zhongguo jiaoyu tongji nianjian); issues of 1987, 1989, 1990, 1991/1992, and then annually since 1998; bilingual since approximately 1989; published as China Education Facilities Statistical Yearbook (Zhongguo jiaoyu
shiye tongji nianjian) with annual issues of 1992 through 1997, bilingual. A separate volume China Education Yearbook (Zhongguo jiaoyu nianjian) exists with issues of 1949/1981, 1982/1984, 1985/1986, and then for every year since 1988. Published by the Education Ministry.
China Labor Union Statistical Yearbook (Zhongguo gonghui tongji nianjian); published annually since 1993 by the All-China Labor Federation, with a combined 1995/1996 volume, bilingual since 2000.
China Land and Natural Resources Statistical Yearbook (Zhongguo guotu ziyuan tongji
nianjian); published annually since 2005 by the PRC Land and Natural Resource Ministry.
China Rural Finance Statistical Yearbook (Zhongguo nongcun jinrong tongji nianjian); published annually between 1991 and 1996 by the Agricultural Bank of China, with a separate compendium China Rural Finance Statistical Yearbook 1979-1989 (Zhongguo
nongcun jinrong tongji 1979-1989).
China Securities and Futures Statistical Yearbook (Zhongguo zhengquan qihuo tongji
nianjian); published annually since 1996, bilingual.
China Tourism Statistical Yearbook (Zhongguo lüyou tongji nianjian); published annually since 1985 by the PRC State Tourism Bureau, bilingual (at least since 1992), with supplement (Chinese only).
China Urban Construction Statistical Annual Report (Zhongguo chengshi jianshe tongji
nianbao), published for 1997/1998, 1999/2000, and then annually since 2001.31 The predecessor is the China Urban Construction Yearbook (Zhongguo chengshi jianshe
nianjian), published for 1986/1987 and 1988/1989.
PRC Customs Statistical Yearbook (Zhonghua renmin gongheguo haiguan tongji
nianjian); published annually since 1990 by the PRC Customs Administration (with the 1990 title China Customs Statistical Yearbook, Zhongguo haiguan tongji nianjian). Separate annual volumes in English under the title China Customs Statistics Yearbook.
TVE Yearbook (China Township [and Village] Enterprise Yearbook, Zhongguo
xiangzhen qiye nianjian); published annually since 1989 by the Agriculture Ministry, with one compendium for 1978/1987.
Urban Water Supply Statistical Yearbook (Chengshi gongshui tongji nianjian); published in 1986, 1999, and 2006 (and perhaps for other years) by the China Urban Water Supply Association.
Statistical yearbooks are published for numerous sectors of the economy, ranging from coal to cotton. They are usually published by some enterprise association of that sector or some overarching government department or conglomerate. They tend to be in Chinese only. One example is the banking sector. Each (state-owned) commercial bank publishes its own statistical yearbook series. Early issues were stamped “internal” (neibu). More recent issues may no longer come with such a stamp but are often de facto internal publications; they may carry an ISBN number but not be available for sale to the public. Provincial central bank branches (now regional central bank branches) used to publish their own provincial statistical yearbooks on all commercial banking in their province/region, and these volumes are not publicly available.
19
General yearbooks published by government departments or associations often contain content (including statistics) that is of interest to economists.32 Of particular interest are the following three yearbooks:
China Finance Yearbook (Zhongguo jinrong nianjian); published annually since 1986. Separate (severely abbreviated) English editions are available as Almanac of China’s Finance and Banking for, at least, 1991, 1995, 1996, and then for every year since 1998 (and possibly for every year since 1990).
China Fiscal Yearbook (Zhongguo caizheng nianjian); published annually since 1992 with a bilingual statistics section since 2002.
China Price Yearbook (Zhongguo wujia nianjian); published annually since 1989, with a 2001/2002 combined volume.
Beyond explicitly statistical yearbooks and beyond general yearbooks with significant statistics sections, a wide range of “reports,” “development reports,” “blue books,” and “white books” are published annually, some of these by the NBS.33 The focus is on a specific theme with statistics only offered as supporting documentation.
3.1.2 Monthly and quarterly data
The NBS has been publishing monthly data in a series of magazines. These are:
China Statistics Monthly (Zhongguo tongji yuebao); published (at least) July 1985 through end-1989, in Chinese only.
China Statistics Monthly; published April 1988 (vol. 1, issue 1) through Jan/Feb/March 1992 (vol. 4, issues 10-11-12), in English.
China Monthly Statistics; published since 1992, in English. In addition, since September 2000 the NBS has been publishing China Monthly Economic
Indicators (Zhongguo jingji jingqi yuebao), a bilingual publication that focuses on economic data.34 Some monthly data are available on the NBS website (http://www.stats.gov.cn), as are quarterly data. The NBS does not have a quarterly statistical print publication. However, it occasionally publishes quarterly GDP data in the form of small booklets (Quarterly GDP 1992-
2001, Quarterly GDP 1992-2005). The People’s Bank of China publishes monthly (and for some series quarterly) data in the bilingual People’s Bank of China Quarterly Statistical Bulletin (Zhongguo renmin yinhang tongji
jibao), starting 1996. While this publication focuses on financial variables, it also covers a few other variables such as output measures, and in contrast to the NBS publications typically reports values for several months in each issue. The Customs General Administration publishes China’s Customs Statistics, with quarterly data from June 1983 through 1992 (bilingual in 1985-89, in English starting August 1989 or January 1990), and monthly data (in English) since 1993.

20
3.1.3 Census and survey data, input-output tables
The NBS has published numerous individual publications in response to specific events, typically a census or survey. All of these publications are in Chinese. Recent (abbreviated) titles include:
Agricultural Census 1996.
Agricultural Census 2006.
Economic Census 2004. Four volumes.
Economic Census 2008. Five volumes.
Industrial Census 1985.
Industrial Census 1995. Three volumes.
Population Census 1982.
Population Census 1990. Four volumes.
Population Census 2000. Three volumes.
Population Census 2010. Three volumes.
Population Survey 1987.
Population Survey 1995.
Population Survey 2005.
Tertiary Sector Census 1993.
Input-Output Table 1987, and, separately, 1990, 1992, 1995, 1997, 2002, and 2007. Similar volumes are usually published at the provincial level by each province’s statistics department; those focusing on input-output tables tend to be considered internal publications. At the national level, additional, more elaborate publications exist internally for some censuses, such as the industrial census in 1985. NBS survey data are not available to the public. On an individual basis, researchers have negotiated the purchase of data from the NBS, or obtained data through personal connections. This includes, with data for one or more years, the complete set of (individual) enterprise-level data for the DRIEs, datasets on large and medium-sized industrial enterprises (a subset of the DRIEs),35 and population census data.36 The Universities Service Center—the leading China library, located at the Chinese University of Hong Kong—sells a number of datasets, compiled not only by the NBS.37 The China Data Center at the University of Michigan sells some NBS census data.38 Data from a number of other surveys are publicly available. These include the China Household Income Project (CHIP) survey conducted by the Institute of Economics at the Chinese Academy of Social Sciences,39 and the China Health and Retirement Longitudinal Study (CHARLS) conducted by the National School of Development at the China Center for Economic Research at Peking University.40
3.1.4 Long-run data
In irregular intervals, the NBS publishes compendia that cover a limited set of indicators at the national and provincial levels over an extended period of time. These include:

21
China’s Regional Economy in Seventeen Years of Reform and Opening (Gaige kaifang
shiqi nian de zhongguo diqu jingji), here abbreviated Seventeen Years of Reform. Bilingual. Covers the years 1978 through 1995.
Comprehensive Statistical Materials on 50 Years of the New China (Xin zhongguo wushi
nian tongji ziliao huibian), here abbreviated Fifty Years. Bilingual. Covers the years 1949/1952 through 1998.
Comprehensive Statistical Materials on 55 Years of the New China (Xin zhongguo
wushiwu nian tongji ziliao huibian), here abbreviated Fifty-five Years. Bilingual. Covers the years 1949/1952 through 2004.
Comprehensive Statistical Materials on 60 Years of the New China (Xin zhongguo liushi
nian tongji ziliao huibian), here abbreviated Sixty Years. Bilingual. Covers the years 1949/1952 through 2008.
For NIPA data, the most recently published volume (Sixty Years) is preferable to the earlier volumes as it incorporates the 2006 benchmark revision to GDP data following the 2004 economic census. At the provincial level, the data from Guangdong and Hainan, and from Sichuan and Chongqing often require special attention. Hainan was part of Guangdong until it became a separate province in April 1988. The Statistical Yearbook 1989 with data for 1988 reports Hainan data separately for the first time. All four long-run compendia report Guangdong and Hainan data separately. Chongqing was part of Sichuan until it became a separate province in 1997. The Statistical Yearbook 1998 with data for 1997 reports Chongqing data separately for the first time. In Seventeen Years of Reform, Sichuan includes Chongqing in all years; no separate data on Chonging are included. The Fifty Years, Fifty-five Years, and Sixty Years
compendia report Sichuan and Chongqing data separately.41 The NBS has published a number of special publications with GDP data. The first is a retrospective compilation of NIPA data following the System of National Accounts for the pre-reform period and through 1995. The Chinese version is GDP 1952-95 (Historical Data on
China’s Gross Domestic Product 1952-1995, Zhongguo guonei shengchan zongzhi hesuan lishi
ziliao 1952-1995), followed by, with one extra year, GDP 1952-96 (abbreviated title). The English version was published by Hsueh Tien-tung and Li Qiang (1999). 42 These compilations cover sectoral value-added in the production approach to the calculation of GDP, as well as expenditure data at the national level and at the provincial level, and income data at the provincial level only. The data reflect the benchmark revision following the 1993 tertiary sector census, except in the case of Guangdong, whose data are unadjusted data, i.e., they do not incorporate this benchmark revision (GDP 1952-95, preface). The bilingual GDP 1996-2002 provides data for the subsequent years 1996-2002. It also reproduces and, for some provinces, revises data for 1952, 1978, 1985, 1990, and 1990 (with the coverage not always complete). The National Income Accounts Yearbook 2004 is a one-off publication with national GDP data for 2000-2003 as well as a variety of other NIPA data. The bilingual GDP 1952-2004, with data for 1952-2004, incorporates the 2006 benchmark revision following the economic census of 2004. The national data cover 1952-2004 and the provincial data 1993-2004. Since the publication of GDP 1952-2004, no further volume on NIPA data has been published. Many of the data series are included in Sixty Years and in the annual Statistical Yearbook.
22
Other publications related to the NIPA include two volumes on flow-of-funds statistics: Flow
of Funds 1998-2002 (bilingual) and Flow of Funds 1992-2004 (bilingual). The first reports both national and provincial data; the second reports national data only. More recent national flow of funds data are reported annually in the Statistical Yearbook, though typically with a 2-year time lag. Besides the comprehensive historical data and the detailed GDP data, the NBS occasionally publishes historical data on a specific topic. Such publications include, with detailed titles provided in the references: Industry, Transport, and Energy 50 Years (covering 1949-1999), Investment 1950-2000 (bilingual), Population Statistics 1949-1985, and Agriculture 1949-2004.
3.2 Explanations of Chinese data
Explanations of Chinese statistics can be found in a number of NBS publications. These range from compendia of rules and regulations to explanations of Chinese statistics offered by NBS staff, usually in Chinese. The explanations are not always sufficient and a research literature has developed, mainly in English, to examine Chinese data.
3.2.1 NBS publications and publications by NBS staff
Each section of the Statistical Yearbook comes with an introduction that explains how the data were obtained and ends with definitions of the variables used in the section. (Both, introduction and definitions are bilingual in the bilingual issues of the Statistical Yearbook.) Other statistical yearbooks often contain variable definitions, with occasionally some further explanations in a preface. The NBS regularly publishes compendia of rules and regulations (NBS 1988, 1992, 1995, 1996, 2001a, 2004). Some of these compendia offer insights into how specific data are being compiled. The last two volumes no longer carry the stamp “internal” but are still not publicly available. Since 2004, either no further issues have been published, or none has found its way to locations accessible to researchers. In 1992, 1993, 1995, 1996, 1997, and 1998 the NBS also published an internal Statistical
Work Yearbook with details on statistical work and reform of the statistical system in the particular year. It contained a section on rules and regulations issued in that year. Similar to the compendia of rules and regulations, since 1998 either no further issues have been published, none has found its way to locations accessible to researchers. The compilation of GDP data is explained in great detail in NBS (1997), Xu Xianchun (2000b), OECD (2000), and NBS (2007). The English language OECD (2000) was largely written by Xu Xianchun and Ye Yanfei, both NBS employees. Xu Xianchun (2004) provides a brief overview in English. NBS publications on GDP compilation include NBS (1997) and NBS (2007), in Chinese; NBS (2007) incorporates the changes in the calculation of GDP introduced in the wake of the 2004 economic census. The NBS also publishes a number of specialized volumes that deal with data compilation in particular sectors. For example, NBS Industry and Transport Division (1999) explains the compilation of industry statistics and NBS (2003) explains China’s statistical survey system. NBS Industry and Transport Division (2003) provides details on the (then) new classification
23
system (GB2002) for the industry sector. The NBS monthly magazine Zhongguo tongji frequently explains changes to current statistical compilation practices.
3.2.2 Research literature
Since the mid-1990s, researchers have routinely explored the meaning of specific official Chinese data. The large and growing body of literature in English covers every area of Chinese statistics from agricultural labor force data to alternative real growth rates of industry. The following is a list of some of the literature, by topic. If a source covers more than one topic, it is listed under what appears to be the most relevant topic. Complete references are provided in the reference list at the end of the book.
Agriculture: Kenneth Walker (1982), Cao Qingbo (1999).
Agricultural land and irrigation: James Nickum (1995), Vaclav Smil (1999).
Alternative industry/GDP growth estimates: Harry Wu (1993, 2002), Angus Maddison (1998), Carsten Holz (2006a,b).
Capital: Chen Kuan et al. (1988), Carsten Holz (2006c,d), Gregory Chow (2006a).
Data sources: Carsten Herrmann-Pillath, Daniel Kirchert and Pan Jiancheng (2002), Susan Xue (2004).
Employment, unemployment, and migration data: Thomas Rawski and Robert Mead (1998), Dorothy Solinger (2001, 2002), Liu Ta and Chan Kam Wing (2001), Thomas Rawski (2002a), Daniel Goodkind and Loraine West (2002), John Giles, Albert Park, and Zhang Juwei (2005), Cai Fang (2004), John Knight and Xue Jinjun (2006), Shi Zhenhua (2009).
Energy statistics: Jeffrey Logan (2001), Jonathan Sinton (2001), Jonathan Sinton and David Fridley (2000, 2002).
Evaluation of Chinese GDP and GDP growth estimates (occasionally including other variables besides GDP): F. Gerard Adams and Chen Yimin (1996), Harry Wu (2000, 2007), Meng Lian and Wang Xiaolu (2000), Thomas Rawski and Xiao Wei (2001), Wang Xiaolu and Meng Lian (2001), Thomas Rawski (2001a, 2001b, 2002b), Albert Keidel (2001b), Oleksandr Movshuk (2002), Lawrence Klein and Suleyman Ozmucur (2002-2003), Nicholas Lardy (2002-2003), Pan Zhenwen and An Yuli (2003), Friedrich Wu (2003), Carsten Holz (2003, 2004a, 2006a, 2006b, 2008a, 2008b), Angus Maddison (2006), Gregory Chow (2006b); in Chinese: Xu Xianchun and Tian Xiaoqing (1997), Xu Xianchun (1999a,b,c, 2000a, 2001, 2002, 2003, 2006), Yue Ximing and Zhang Shuguang (2002), Song Xiaochuan (2007), Aaron Mehrotra and Jenni Pääkkönen (2011), Masahi Hoshino (2011).
Evaluation of early PRC statistics: Choh-Ming Li (1962), Yoshiro Matsuda (1965), Dwight Perkins (1966), R. P. Sinha (1975), Thomas Rawski (1976), S. Lee Travers (1982), Eduard Vermeer (1986), Gregory Chow (1986), Yoshiro Matsuda (1990).
General description of Chinese statistics, definitions (in Chinese except where noted): Deng Liqun et al. (1990), Statistics Manual (1990), Zheng Jiaxiang (1994), Economics
Dictionary: Statistics (1996), Liu Chengxiang, Liu Ke, and Jin Zhaofeng (2000), Zheng Jingping (2001, English).
24
History of official statistics in China (in Chinese): Deng Liqun et al. (1990), Li Huicun and Mo Yueda (1993).
Household income surveys: World Bank (1992, Appendix 1), Chen Shaohua and Martin Ravallion (1996), Martin Ravallion and Chen Shaohua (1999), Chris Bramall (2001), John Gibson, Huang Jikun, and Scott Rozelle (2001).
Industry statistics: Carsten Holz and Yi-min Lin (2001a, 2001b), Calla Wiemer and Tian Xiuhua (2001).
Population statistics: Ansley Coale (1981), Thomas Scharping (2001, 2003, 2005a, 2005b, 2005c), Kam Wing Chan (2003), Zhou Yixing and Laurence Ma (2005), Kam Wing Chan and Man Wang (2008), Li Shuozhu, Zhang Yexia, and Marcus Feldman (2010).
Poverty statistics: Albert Park and Wang Sangui (2001).
Prices: Imad Moosa (1997), D. Gale Johnson (2002), Loren Brandt and Carsten Holz (2006).
Private enterprises: Ole Odgaard (1990-1991).
Survey research in China: Tang Wenfang (2002/2003).
Statistical system (including coverage in one article of a wide variety of statistics): Huang Yasheng (1996), Sean Dougherty (1997), OECD (2000), Cai Yongshun (2000), Albert Keidel (2001a), Carsten Herrmann-Pillath, Daniel Kirchert and Pan Jiancheng (2002), Carsten Holz (2002, 2004b, 2005a), Susan Xue (2004), Gregory Chow (2006b), Xu Xianchun (2009).
Trade statistics (historical data): Thomas Lyons (2003), Andrea Eberhard-Bréard (2006), Robert Bickers (2006).
Transport statistics: Ralph Huenemann (2001).
Urbanization: Kam Wing Chan and Hu Ying (2003), Kam Wing Chan (2007). A 2012 book by Tom Orlik on Understanding China’s Economic Indicators describes key Chinese statistics (indicators, variables) ranging from GDP to financial indicators. Each section covers one indicator, or one set of indicators, and includes an explanation of the degree of market sensitivity, what the indicator is, where the Chinese and English data are released on the internet, when they are released, how frequently they are released, who produces the data, if the data are revised or not, why they are important, how they are calculated, how to interpret them, and what impact they have on the market.
4. CONCLUSION
While China is gradually adopting international standards in the compilation of its statistics—such as the United Nation’s System of National Accounts in the compilation of NIPA statistics—a number of data issues remain specific to China. If one is not aware of the changing sectoral classification system over time, one runs the danger of combining non-compatible time series from different sources into one time series. Alternatively, one is unable to conduct long-run analysis when, in fact, a particular series does not change much across classification changes despite the adoption of new labels. Analsyis that focuses on ownership runs the danger of severely under-estimating the state sector if only data on “state-owned enterprises” are included, or of combining non-compatible time series if the 1998 statistical break is not given

25
consideration. Conclusions drawn from work with industrial data run the danger of ignoring that the available data cover only a subset of industry and may not be representative of all industry, and that the data series come with a number of re-definitions in enterprise coverage over time that make time series analysis difficult. Despite such data complications, economic analysis based on Chinese data faces a bright future because of the abundance of statistics published by China’s statistical authority and Chinese government departments. The availability of data for China far exceeds what one might expect for a developing country at China’s level of development. Once one is aware of the manifold data sources and what the data mean, the field of statistics-based research on China is wide open.

26
References
Chinese names are given last name first if they appear in pinyin notation in the original source. To avoid confusion between pinyin and non-pinyin names, when last names are rendered first in Chinese-sounding names, these last names are fully capitalized. Adams, F. Gerard, and CHEN Yimin. “Skepticism about Chinese GDP Growth – the Chinese
GDP Elasticity of Energy Consumption.” Journal of Economic and Social Measurement 22, no. 4 (1996): 231-40.
Agricultural Census 1996. Zhongguo di yi ci nongye pucha ziliao zonghe tiyao (Comprehensive synopsis of China’s first agricultural census). Beijing: Zhongguo tongji chubanshe, 1998.
Agricultural Census 2006. Zhongguo di er ci quanguo nongye pucha ziliao zonghe tiyao (Comprehensive synopsis of China’s second national agricultural census). Beijing: Zhongguo tongji chubanshe, 2008.
Agriculture 1949-2004. Zhongguo nongye tongji ziliao huibian (Compendium of China’s Agricultural Statistical Material). Beijing: Zhongguo tongji chubanshe, 2006.
Bickers, Robert. “Purloined Letters: History and the Chinese Maritime Customs Service.” Modern Asian Studies 40, no. 3 (2006): 691-723.
Bramall, Chris. “The Quality of China’s Household Income Surveys.” The China Quarterly, no. 167 (Sept. 2001): 689-705.
Brandt, Loren, and Carsten A. Holz. “Spatial Price Differences in China: Estimates and Implications.” Economic Development and Cultural Change 55, no. 1 (Oct. 2006): 43-86.
CAI Fang. “The Consistency of China Statistics on Employment: Stylized Facts and Implications to Public Policies.” Chinese Economy 37, no. 5 (Sept.-Oct. 2004): 74-89.
CAI Yongshun. “Between State and Peasant: Local Cadres and Statistical Reporting in Rural China.” The China Quarterly, no. 163 (Sept. 2000): 783-805.
CAO Qingbo. “China’s Agricultural Data and Statistics System and the 1997 Agricultural Census.” In Agriculture in China and OECD Countries: Past Policies and Future Challenges, OECD Proceedings, Paris: OECD, 1999, pp. 214-23.
Chan, Kam Wing. “Chinese Census 2000: New Opportunities and Challenges.” The China
Review 3, no. 2 (Fall 2003): 1-12. _____. “Misconceptions and Complexities in the Study of China’s Cities: Definitions, Statistics,
and Implications.” Eurasian Geography and Economics 48, no. 4 (July-Aug. 2007): 383-412. Chan, Kam Wing, and Hu Ying. “Urbanization in the 1990s: New Definition, Different Series,
and Revised Trends.” The China Review 3, no. 2 (Fall 2003): 49-71. Chan, Kam Wing, and Wang, Man. “Remapping China's Regional Inequalities, 1990-2006: A
New Assessment of de Facto and de Jure Population Data.” Eurasian Geography and
Economics 49, no. 1 (Jan.-Feb. 2008): 21-56. CHEN Kuan, Gary H. Jefferson, Thomas G. Rawski, WANG Hongchang and ZHENG Yuxin.
“New Estimates of Fixed Investment and Capital Stock for Chinese State Industry.” The
China Quarterly, no. 114 (June 1988): 243-66. CHEN Shaohua, and Martin Ravallion. “Data in Transition: Assessing Rural Living Standards in
Southern China.” China Economic Review 7, no. 1 (Spring 1996): 23-56. Chow, Gregory C. “Chinese Statistics.” The American Statistician 40, no. 3 (1986): 191-6.
27
_____. “Capital Formation and Economic Growth in China.” Quarterly Journal of Economics
108, no. 3 (Aug. 1993): 809-42. _____. “New Capital Estimates for China: Comments.” China Economic Review 17, no. 2
(2006a): 186-92. _____. “Are Chinese Official Statistics Reliable?” CESifo Economic Studies 52, no. 2 (June
2006b): 396-414. Coale, Ansley J. “A Further Note on Chinese Population Statistics.” Population and
Development Review 7, no. 3 (Sept. 1981): 512-8. DENG Liqun, MA Hong, and WU Heng. Dangdai zhongguo de tongji shiye (Statistics in current
China). Beijing: Zhongguo shehui kexue chubanshe, 1990. DING Sai, and John Knight. China’s Remarkable Economic Growth. Oxford: Oxford University
Press, 2012. Dougherty, Sean. “What’s in a Number: Worries about Reliability Plague All Who Use Chinese
Statistics.” East Asian Executive Reports, September 15, 1997; also as “The Reliability of Chinese Statistics,” China Online, 1997.
Eberhard-Bréard, Andrea. “Robert Hart and China’s Statistical Revolution.” Modern Asian
Studies 40, no. 3 (2006): 605-29. Economic Census 2004. Zhongguo jingji pucha nianjian—2004 (China Economic Census
Yearbook—2004). Four volumes. Beijing: Zhongguo tongji chubanshe, (May) 2006. Economic Census 2008. Zhongguo jingji pucha nianjian—2008 (China Economic Census
Yearbook—2008). Five volumes. Beijing: Zhongguo tongji chubanshe, (May) 2010. Economics Dictionary: Statistics. Jingji da cijian tongjijuan (Big Economics Dictionary,
Statistics Volume). Shanghai: Shanghai cishu chubanshe, 1996. Fifty Years. Xin zhongguo wushi nian tongji ziliao huibian (Comprehensive statistical materials
on 50 years of new China). Beijing: Zhongguo tongji chubanshe, 1999. Fifty-five Years. Xin zhongguo wushiwu nian tongji ziliao huibian (Comprehensive statistical
materials on 55 years of new China [1949-2004]). Beijing: Zhongguo tongji chubanshe, 2005. GDP 1952-95. Zhongguo guonei shengchan zongzhi hesuan lishi ziliao 1952-1995 (Historical
data on China’s gross domestic product 1952-1995). Dalian: Dongbei caijing daxue chubanshe, 1997.
GDP 1952-96. Zhongguo guonei shengchan zongzhi hesuan lishi ziliao (zhaiyao, 1952-1996) (Historical data on China’s gross domestic product (abstract, 1952-1996)). Beijing: Zhongguo tongji chubanshe, 1998.
GDP 1952-2004. Zhongguo guonei shengchan zongzhi hesuan lishi ziliao 1952-2004 (Historical data on China’s gross domestic product 1952-2004). Beijing: Zhongguo tongji chubanshe, 2007.
GDP 1996-2002. Zhongguo guonei shengchan zongzhi hesuan lishi ziliao 1996-2002 (Historical data on China’s gross domestic product 1996-2002). Beijing: Zhongguo tongji chubanshe, 2003.
Gibson, John, Huang Jikun, and Scott Rozelle. “Why Is Income Inequality So Low in China Compared to Other Countries? The Effect of Household Survey Methods.” Economics
Letters 71, no. 3 (June 2001): 329-333. Giles, John, Albert Park, and ZHANG Juwei. “What Is China’s True Unemployment Rate?”
China Economic Review 16, no. 2 (2005): 149-70. Goodkind, Daniel, and Loraine A. West. “China’s Floating Population: Definitions, Data and
Recent Findings.” Urban Studies 39, no. 12 (Nov. 2002): 2237-50.

28
Herrmann-Pillath, Carsten, Daniel Kirchert and PAN Jiancheng. “Prefecture-level Statistics as a Source of Data for Research into China’s Regional Development.” The China Quarterly, no. 172 (Dec. 2002): 956-85.
Holz, Carsten. “Institutional Constraints on the Quality of Statistics in a Developing and Transitional Economy: the Case of China.” China Information 16, no. 1 (2002): 25-67.
_____. “‘Fast, Clear and Accurate:’ How Reliable Are Chinese Output and Economic Growth Statistics?” The China Quarterly, no. 173 (March 2003): 122-63.
_____. “Deconstructing China’s GDP Statistics.” China Economic Review 15, no. 2 (2004a): 164-202.
_____. “China’s Statistical System in Transition: Challenges, Data Problems, and Institutional Innovations.” Review of Income and Wealth 50, no. 3 (Sept. 2004b): 381-409.
_____. “The Institutional Arrangements for the Production of Statistics (OECD---China Governance Project).” OECD Statistics working paper, STD/DOC (2005a) 1, 19 Jan. 2005a. At: http://www.olis.oecd.org/olis/2005doc.nsf/43bb6130e5e86e5fc12569fa 005d004c/79bd1182713f436ec1256f8e0033ebb2/$FILE/JT00177141.PDF
_____. “The Quantity and Quality of Labor in China 1978-2000-2025.” Manuscript, Hong Kong University of Science and Technology, May 2005b.
_____. “China’s Reform Period Economic Growth: How Reliable Are Angus Maddison’s Estimates? Review of Income and Wealth 52, no. 1 (March 2006a): 85-119.
_____. “China’s Reform Period Economic Growth: How Reliable Are Angus Maddison’s Estimates? Response to Angus Maddison’s Reply.” Review of Income and Wealth 52, no. 3 (Sept. 2006b): 471-5.
_____. “New Capital Estimates for China.” China Economic Review 17, no. 2 (2006c): 142-85. With appendices available at http://ihome.ust.hk/~socholz.
_____. “Response to Gregory C. Chow’s ‘New Capital Estimates for China: Comments.’ China
Economic Review 17, no. 2 (2006d): 193-7. _____. “China's 2004 Economic Census and 2006 Benchmark Revision of GDP Statistics: More
Questions Than Answers.” The China Quarterly, no. 193 (Jan. 2008a): 150-63. _____. “China’s Economic Growth 1978-2025: What We Know Today about China's Economic
Growth Tomorrow.” World Development 36, no. 10 (Oct. 2008b): 1665-1691. _____. “Measuring Productivity Change in China, 1952-2010.” Mimeo, Stanford Center for
International Development, Stanford University, 2013. Holz, Carsten A., and Yi-min Lin. “Pitfalls of China’s Industrial Statistics: Inconsistencies and
Specification Problems.” The China Review 1, no. 1 (Fall 2001a): 29-71. _____. “The 1997-1998 Break in Industrial Statistics: Facts and Appraisal.” China Economic
Review 12, no. 4 (2001b): 303-16. Hoshino, Masahi. “Measurement of GDP Per Capita and Regional Disparities in China, 1979-
2009. Research Institute for Economics & Business Administration, Kobe University, Discussion Paper Series DP2011-17, 2011.
Hsueh Tien-tung, and LI Qiang. China's National Income, 1952-1995. Boulder, CO: Westview Press, 1999.
HUANG Yasheng. “The Statistical Agency in China’s Bureaucratic System.” Communist and
Post-Communist Studies 29, no. 1 (March 1996): 59-75. Huenemann, Ralph W. “Are China’s Recent Transport Statistics Plausible?” China Economic
Review 12, no. 4 (2001): 368-72.
29
Industrial Census 1985. Zhonghua renmin gongheguo yi jiu ba wu nian gongye pucha ziliao
(jianyaoben) (Materials of the 1985 PRC industrial census, summary volume). Beijing: Zhongguo tongji chubanshe, 1989.
Industrial Census 1995. Zhonghua renmin gongheguo 1995 nian quanguo gongye pucha ziliao
(Materials of the 1995 PRC national industrial census). Three volumes. Beijing: Zhongguo tongji chubanshe, 1997.
Industrial Yearbook. Zhongguo gongye jingji tongji nianjian (China Industrial Economy Statistical Yearbook). Beijing: Zhongguo tongji chubanshe, various years, starting 1988.
Industry, Transport, and Energy 50 Years. Zhongguo gongye jiaotong nengyuan 50 nian tongji
ziliao huibian 1949-1999 (Compendium of 50 Years of Statistics on China’s Industry, Transport and Energy, 1949-1999). Compiled by the NBS Industry and Transport Statistics
Division. Beijing: Zhongguo tongji chubanshe, 2000.
Input-Output Table. Zhongguo touru chanchu biao (China Input-Output Table). Beijing: Zhongguo tongji chubanshe, various years.
Investment 1950-2000. Zhongguo guding zichan touzi tongji shudian 1950-2000 (China Investment in Fixed Asset Statistics 1950-2000). Beijing: Zhongguo tongji chubanshe, 2002.
Johnson, D. Gale. “Have the urban-rural disparities increased since 1978 in China?” 2001. Paper No. 01-05, Office of Agricultural Economics Research, University of Chicago. Published (in Chinese) in China Economic Quarterly 1, no. 3 (April 2002): 553-562.
Keidel, Albert. Keidel, Albert. “Practical Issues in Using the Chinese Statistical System.” China
Perspectives, no. 33 (Jan./Feb. 2001a): 35-41. _____. “China’s GDP Expenditure Accounts.” China Economic Review 12, no. 4 (2001b): 355-
67. Klein, Lawrence, and Suleyman Ozmucur. “The Estimation of China’s Economic Growth Rate.”
Journal of Economic and Social Measurement 28, no. 4 (2002-2003):187-202. Knight, John, and XUE Jinjun. “How High Is Urban Unemployment in China?” Journal of
Chinese Economic and Business Studies 4, no. 2 (July 2006): 91-107. Lardy, Nicholas. “Evaluating Economic Indicators in Post-WTO China.” Issues and Studies
38/39, no. 4/38-1/39 (Dec. 2002/March 2003): 249-68. Li Choh-Ming. The Statistical System of Communist China. Berkeley: University of California
Press, 1962. LI Deshui. “Guanyu GDP de ji dian sikao” (Some considerations on GDP). Jingji yanjiu, no. 4
(2004): 26-8. LI Huicun and MO Yueda. Zhongguo tongji shi (History of Chinese statistics). Beijing:
Zhongguo tongji chubanshe, 1993. LI Mei and HE Jianfeng. “Nongcun zhuhu diaocha gongzuo de jidian tihui” (Some experiences
in rural household survey work). Zhongguo tongji, no. 8/2009 (August 2009): 33f. LI Shuzhuo, Zhang Yexia, and Marcus W. Feldman. “Birth Registration in China: Practices,
Problems and Policies.” Population Research and Policy Review 29, no. 3 (June 2010): 297-317.
LIU Chengxiang, LIU Ke, JIN Zhaofeng. Ruhe shiyong tongji nianjian (How to use the Statistical Yearbook). Beijing: Zhongguo tongji chubanshe, 2000.
LIU Ta and Chan Kam Wing. “National Statistics on Internal Migration in China.” China
Information 15, no. 2 (2001): 75-113. Logan, Jeffrey. “Diverging Energy and Economic Growth in China: Where Has All the Coal
Gone.” Pacific and Asian Journal of Energy 11, no. 1 (June 2001): 1-13.
30
Lyons, Thomas P. China Maritime Customs and China’s Trade Statistics 1859-1948. Trumansburg, NY: Willow Creek Press, 2003.
Maddison, Angus. Chinese Economic Performance in the Long Run. Paris: Development Centre of the Organisation for Economic Co-operation and Development, 1998.
_____. “Do Official Statistics Exaggerate China’s GDP Growth? A Reply to Carsten Holz.” Review of Income and Wealth 52, no. 1 (March 2006): 121-6.
Matsuda, Yoshiro. “Methods of Compiling Crop Statistics in China.” The Developing Economies
3, no. 3 (Sept. 1965): 323-42. _____. “Survey Systems and Sampling Designs of Chinese Household Surveys, 1952-87.” The
Developing Economies 28, no. 3 (Sept. 1990): 329-52. Mehrotra, Aaron, and Jenni Pääkkönen. “Comparing China’s GDP Statistics with Coincident
Indicators.” Journal of Comparative Economics 39, no. 3 (Sept. 2011): 406-11. MENG Lian and WANG Xiaolu. “Dui zhongguo jingji zengzhang tongji shuju kexindu de guji”
(An evaluation of the reliability of China’s statistics on economic growth). Jingji yanjiu, no. 10 (Oct. 2000): 3-13.
Movshuk, Oleksandr. “The Reliability of China’s Growth Figures: A Survey of Recent Statistical Controversies.” The Journal of Econometric Study of Northeast Asia 4, no. 1 (2002): 31-45.
Moosa, Imad A. “Does the Chinese Official CPI Underestimate Inflation?” Applied Economics
Letters 4, no. 5 (May 1997): 301-4. NBS. National Bureau of Statistics.
1988. Tongji zhidu fangfa wenjian xuanbian 1950-1987 (Selected methods and documents on the statistical system 1950-1987). Beijing: Zhongguo tongji chubanshe, 1988.
30 Sept. 1990. “1990 nian gongye chanpin bubian jiage” (1990 constant prices of industrial products). In NBS (1995), pp. 768-72.
1992. Tongji gongzuo zhongyao wenjian xuanbian 1988-1990 (Selected important documents on statistical work 1988-1990). Beijing: Zhongguo tongji chubanshe, 1992.
1995. Tongji zhidu fangfa wenjian xuanbian 1987-1993 (Selected documents on the methods of the statistical system 1987-1993). Beijing, Guojia tongjiju tongji sheji guanlisi (Design and Administration Department of the NBS), no specific publisher, 1995.
1996. Tongji gongzuo zhongyao wenjian xuanbian 1991-1995 (Selected important documents on statistical work 1991-1995). Beijing: Zhongguo tongji chubanshe, 1996.
1997. Zhongguo niandu guonei shengchan zongzhi jisuan fangfa (Calculation method of China’s annual gross domestic product). NBS National Income Accounts Division. Beijing: Zhongguo tongji chubanshe. (This is one of seven small volumes explaining compilation practices of different NIPA statistics in China.)
2003. Guojia tongji diaocha zhidu (State statistical survey system). No publisher given. 14 May 2003. “Sanci chanye huafen guiding” (Stipulation on the three-sector classification);
based on the “Guomin jingji hangye fenlei” (Sectoral classification of the national economy), GB/T4754-2002. In China Infobank.
2004. Tongji gongzuo zhongyao wenjian xuanbian 2001-2003 (Selection of important documents on statistical work 2001-2003). Beijing: Zhongguo tongji chubanshe, 2004.
2007. Zhongguo jingji pucha niandu guonei shengchan zongzhi hesuan fangfa (Calculation method of China’s annual gross domestic product from China’s economic census). NBS National Income Accounts Division. Beijing: Zhongguo tongji chubanshe, 2007.
2008. Guomin jingji hangye fenlei zhushi (Explanatory notes on the [2002] sectoral classification system). Beijing: Zhongguo tongji chubanshe, 2008.
31
2011. Guomin jingji hangye fenlei zhushi 2011(Explanatory notes on the 20011 sectoral classification system). Beijing: Zhongguo tongji chubanshe, 2011.
NBS Industry and Transport Division. “Gongye zengzhang sudu zhong de ‘shuifen’ you duoda?” (How big is the ‘water content’ in industrial growth?), Jingji yanjiu cankao ziliao, no. 42 (19 March 1989): 2-5.
_____. Xinbian gongye tongji gongzuo zhinan (New guide to industrial statistics). Beijing: Zhongguo tongji chubanshe, 1999.
_____. Gongye hangye yu chanpin huafen gongzuo shouce (Handbook on classification of industrial sectors and products). Beijing: Zhongguo tongji chubanshe, 2003.
Nickum, James E. Dam Lies and Other Statistics: Taking the Measure of Irrigation in China,
1931-91. East-West Center Occasional Papers, Environment Series, no. 18, January 1995. Odgaard, Ole. “Inadequate and Inaccurate Chinese Statistics: the Case of Private Rural
Enterprises.” China Information 5, no. 3 (Winter 1990-1991): 29-38. OECD (Organisation for Economic Co-operation and Development). National Accounts for
China: Sources and Methods. Paris: OECD Publications, 2000. Orlik, Tom. Understanding China’s Economic Indicators: Translating the Data into Investment
Opportunities. Upper Saddle River, New Jersey: FT Press Science, 2012. PAN Zhenwen, and AN Yuli. “Yi wan yi de chaju cong he er lai: dui guojiaji, shengji hesuan
shuju chaju de sikao” (Where is the one-trillion difference from? Some thoughts on the difference between national and provincial accounts data). Zhongguo tongji, no. 11 (Nov. 2003): 8f.
Park, Albert, and WANG Sangui. “China’s Poverty Statistics.” China Economic Review 12, no. 4 (2001): 384-98.
Perkins, Dwight H. Market Control and Planning in Communist China. Cambridge, Massachusetts: Harvard University Press: 1966. Appendix A: Reliability of Chinese Statistics (pp. 215-25).
Population Census 1982. Zhongguo 1982 nian renkou pucha ziliao (Tabulation of the 1982 Population Census of China). Compiled by the State Council Population Census Office and the NBS Population Division. Beijing: Zhongguo tongji chubanshe, 1985.
Population Census 1990. Zhongguo 1990 nian renkou pucha ziliao (Tabulation of the 1990 Population Census of China). Compiled by the State Council Population Census Office and the NBS Population Division. Four volumes. Beijing: Zhongguo tongji chubanshe, 1993.
Population Census 2000. Zhongguo 2000 nian renkou pucha ziliao (Tabulation of the 2000 Population Census of China). Compiled by the State Council Population Census Office and the NBS Population, Society, and Technology Division. Three volumes. Beijing: Zhongguo tongji chubanshe, 2002.
Population Statistics 1949-1985. Zhonghua renmin gongheguo renkou tongji ziliao huibian (PRC Population Statistics Compendium 1949-1985). By the NBS Division for Population Statistics and the Public Security’s Division 3. Beijing: Zhongguo caizheng jingji chubanshe, 1988.
Population Survey 1987. Zhongguo 1987 nian 1% renkou chouyang diaocha ziliao. (Tabulation of the 1987 1% Population Sample Survey of the People’s Republic of China). Compiled by the NBS Population Division. Beijing: Zhongguo tongji chubanshe, 1988.
Population Survey 1995. Zhongguo 1995 nian 1% renkou chouyang diaocha ziliao. (National Tabulation of the 1995 1% Population Sample Survey). Beijing: Zhongguo tongji chubanshe, 2005.
32
Population Survey 2005. 1995 nian quanguo 1% renkou chouyang diaocha ziliao. (Tabulation of the 1995 1% Population Sample Survey of the People’s Republic of China). Beijing: Zhongguo tongji chubanshe, 1997.
Ravallion, Martin, and CHEN Shaohua. “When Economic Reform Is Faster Than Statistical Reform: Measuring and Explaining Income Inequality in Rural China.” Oxford Bulletin of
Economics and Statistics 61, no. 1 (Feb. 1999): 33-56. Rawski, Thomas G. “On the reliability of Chinese economic data: discussion.” Journal of
Development Studies 12, no. 4 (1976): 438-41. _____. “China by the Numbers: How Reform Has Affected China’s Economic Statistics.” China
Perspectives, no. 33 (Jan./Feb. 2001a): 25-34. _____. “What Is Happening to China’s GDP Statistics?” China Economic Review 12, no. 4
(2001b): 347-54. _____. “Where Will the Jobs Come From?” China Economic Quarterly 6, no. 4 (2002a): 39-43. _____. “Measuring China’s Recent GDP Growth: Where Do We Stand.” Manuscript, 29 August
2002(b), at http://www.pitt.edu/~tgrawski/papers2002/. Rawski, Thomas G., and Robert W. Mead. “On the Trail of China’s Phantom Farmers.” World
Development 26, no. 5 (May 1998): 767-81. Rawski, Thomas G., and XIAO Wei. “China Economic Review Symposium on Chinese
Economic Statistics: Introduction.” China Economic Review 12, no. 4 (2001): 298-302. Scharping, Thomas. “Hide-and-Seek: China’s Elusive Population Data.” China Economic
Review 12, no. 4 (2001): 323-32. _____. Birth Control in China 1949-2000: Population Policy and Demographic Development.
(With an “Epilogue: The Population Census of November 2000.”) London and New York: RoutledgeCurzon, 2003.
_____. “Chinese Fertility Trends in the Last Twenty Years: A Comparative Analysis of Birth Numbers and School Data.” In Census Office Under the State Council (ed.), 2000 Population
Census of China - Proceedings of International Seminar, Beijing, 2005a, pp. 183-199. _____. “Tight Policies, Loose Numbers: Problems of Census and Population Statistics.”
Manuscript, 2005b. _____. Birth Control in China 1949-2000: Population Policy and Demographic Development.
London/New York: RoutledgeCurzon, 2005c. Seventeen Years. Gaige kaifang shiqi nian de zhongguo diqu jingji (China’s Regional Economy
in Seventeen Years of Reform and Opening). Beijing: Zhongguo tongji chubanshe, 1996. SHI Zhenhua. “Shiye tongji fangfa de queshi yu wanshan” (Shortcomings of the method for
calculating unemployment statistics, and improvements). Zhongguo tongji, no. 4/2009 (April 2009): 53f.
Sinha, R. P. “Chinese Agriculture: A Quantitative Look.” Journal of Development Studies 11, no. 3 (1975): 202-23.
Sinton, Jonathan E. “Accuracy and Reliability of China’s Energy Statistics.” China Economic
Review 12, no. 4 (2001): 373-83. Sinton, Jonathan E., and David G. Fridley. “What Goes Up: Recent Trends in China’s Energy
Consumption.” Energy Policy 28, no. 10 (2000): 671-87. _____. “A Guide to China’s Energy Statistics.” The Journal of Energy Literature 8, no. 1 (2002):
22-35. Sixty Years. Xin zhongguo liushi nian tongji ziliao huibian (Comprehensive atatistical materials
on 60 years of the New China [1949-2008]). Beijing: Zhongguo tongji chubanshe, 2010.
33
Smil, Vaclav. “China’s Agricultural Land.” The China Quarterly, no. 158 (June 1999): 414-429. Solinger, Dorothy J. “Why We Cannot Count the ‘Unemployed’.” The China Quarterly, no. 167
(Sept. 2001): 671-88. _____. “The View from Wuhan: China’s Uncountable Unemployed.” China Economic Quarterly
6, no. 4 (2002): 34-9. SONG Xiaochuan. “Zhongguo de GDP ji qi tuogan tongji wenti” (China’s GDP and its various
problems). Jingji yanjiu, no. 8/2007 (Aug. 2007): 21-30. Statistical Bulletin. Zhonghua renmin gongheguo XX nian guomin jingji he shehui fazhan tongji
gongbao (PRC statistical bulletin on the economic and social development of the year XX). Issued by the NBS and available at http://www.stats.gov.cn/tjgb/ (accessed on 28 April 2006).
Statistical Work Yearbook. Zhongguo tongji gongzuo nianjian (China Statistical Work Yearbook). Beijing: Zhongguo tongji chubanshe, various years.
Statistical Yearbook. Zhongguo tongji nianjian (China Statistical Yearbook). Beijing: Zhongguo tongji chubanshe, various years starting with the 1981 issue (1981 in the title), and since published annually, with the second issue labeled “1983.”
Statistics Manual. Zhongguo jingji tongji shiyong daquan (Practical manual on economic statistics of China). Beijing: Zhongguo renmin daxue chubanshe, 1990.
TANG Wenfang. “An Introduction to Survey Research in Urban China.” Issues & Studies 38, no. 4, and vol. 39, no. 1 (Dec. 2002/ March 2003): 269-88.
Tertiary Sector Census 1993. Zhongguo shouci di san chanye pucha ziliao: 1991~1992 (Materials on China’s first tertiary sector census: 1991-1992). Four volumes (with continuing page numbers). Beijing: Zhongguo tongji chubanshe, 1995.
Travers, S. Lee. “Bias in Chinese Economic Statistics: The Case of the Typical Example Investigation.” The China Quarterly, no. 91 (Sept. 1982): 478-85.
Vermeer, Eduard B. “Chinese Economic Data: How Much and How Good.” China Information 1, no. 2 (Aug. 1986): 49-54.
Walker, Kenneth R. “Interpreting Chinese Grain Consumptin Statistics.” The China Quarterly, no. 92 (Dec. 1982): 575-88.
WANG Xiaolu, and MENG Lian. “A Reevaluation of China’s Economic Growth.” China
Economic Review 12, no. 4 (2001): 338-46. Wiemer, Calla, and TIAN Xiuhua. “The Measurement of Small-Scale Industry for China’s GDP
Accounts.” China Economic Review 12, no. 4 (2001): 317-22. World Bank. China: Strategies for Reducing Poverty in the 1990s. Washington, D.C.: The World
Bank, 1992. Wu, Friedrich. “Chinese Economic Statistics—Caveat Emptor!” Post-Communist Economies 15,
no. 1 (March 2003): 127-45. Wu, Harry X. “The Real Chinese Gross Domestic Product (GDP) for the Pre-Reform Period
1952-77.” Review of Income and Wealth 39, no. 1 (March 1993): 63-87. _____. “China’s GDP Level and Growth Performance: Alternative Estimates and the
Implications.” Review of Income and Wealth 46, no. 4 (Dec. 2000): 475-99. _____. “How Fast Has Chinese Industry Grown?—Measuring the Real Output of Chinese
Industry, 1949-97.” Review of Income and Wealth 48, no. 2 (June 2002): 179-204. _____. “The Chinese GDP Growth Rate Puzzle: How Fast Has the Chinese Economy Grown?”
Asian Economic Papers 6, no. 1 (Winter 2007): 1-23. XU Xianchun. “Zhongguo jingji zengzhang jiujing shi duoshao?” (How high is China’s
economic growth rate actually?) Guoqing guoli luntan, no. 2 (February 1999a): 10-12.

34
_____. “Shijie yinhang gaogu zhongguo GDP shuju” (The World Bank overestimates China’s GDP). Zhongguo guoqing guoli, no. 1 (1999b): 7-10.
_____. “Shijie yinhang dui zhongguo guanfang GDP shuju de tiaozheng he chongxin renke” (The official Chinese GDP figures as adjusted and approved by the World Bank). Jingji
yanjiu, no. 6 (June 1999c): 52-8. _____. “Zhongguo guonei shengchan zongzhi hesuan zhong cunzai de ruogan wenti yanjiu”
(Some problems in the calculation of China’s GDP). Jingji yanjiu, no. 2 (Feb. 2000a): 10-16. _____. Zhongguo guonei shengchan zongzhi hesuan (Calculation of China’s GDP). Beijing:
Beijing daxue chubanshe, 2000(b). _____. “Woguo GDP hesuan yu xianxing SNA de GDP hesuan zhijian de ruogan chayi” (Some
discrepancies in China’s GDP compilation in comparison to the current SNA GDP compilation methods). Jingji yanjiu, no. 11 (Nov. 2001): 63-8.
_____. “Study on Some Problems in Estimating China’s Gross Domestic Product.” Review of
Income and Wealth 48, no. 2 (June 2002): 205-15. _____. Zhongguo guomin jingji hesuan yu hongguan jingji wenti yanjiu (Research into China’s
national income accounting and issues of macroeconomics). Beijing: Zhongguo tongji chubanshe, 2003. (Incorporates much of the earlier journal publications)
_____. “China’s Gross Domestic Product Estimation.” China Economic Review 15, no. 3 (2004): 302-22.
_____. “Guanyu jingji pucha niandu GDP hesuan de bianhua” (Changes in the calculation of annual GDP in the economic census). Jingji yanjiu, no. 2 (February), 2006: 16-20.
_____. “The Establishment, Reform, and Development of China’s System of National Accounts.” Review of Income and Wealth 55, special issue 1 (July 2009): 442-65.
XU Xianchun and TIAN Xiaoqing. “Zhongguo guonei shengchan zongzhi lishi shuju (1952-1977 nian) de ziliao shouji he cesuan fangfa” (Compilation and estimation of data used in establishing China’s GDP (1952-1977)). Jingji yanjiu, no. 9 (Sept. 1997): 65-71.
Xue, Susan. “China’s Statistical System and Resources.” Journal of Government Information 30, no. 1 (2004): 87-109.
YUE Ximing and ZHANG Shuguang. “Woguo fuwuye zengjiazhi de hesuan wenti” (Problems in the calculation of the value-added of services in China). Jingji yanjiu, no. 12 (2002): 51-9.
ZHENG Jiaxiang. Zhongguo tongji shiwu (Chinese statistics). Beijing: Bejing gongye daxue chubanshe, 1994.
ZHENG Jingping. “China’s Official Statistics: Growing with Full Vitality.” China Economic
Review 12, no. 4 (2001): 333-7. ZHOU Yixing, and Laurence J. C. Ma. “China’s Urban Population Statistics: A Critical
Evaluation.” Eurasian Geography and Economics 46, no. 4 (June 2005): 272-89.
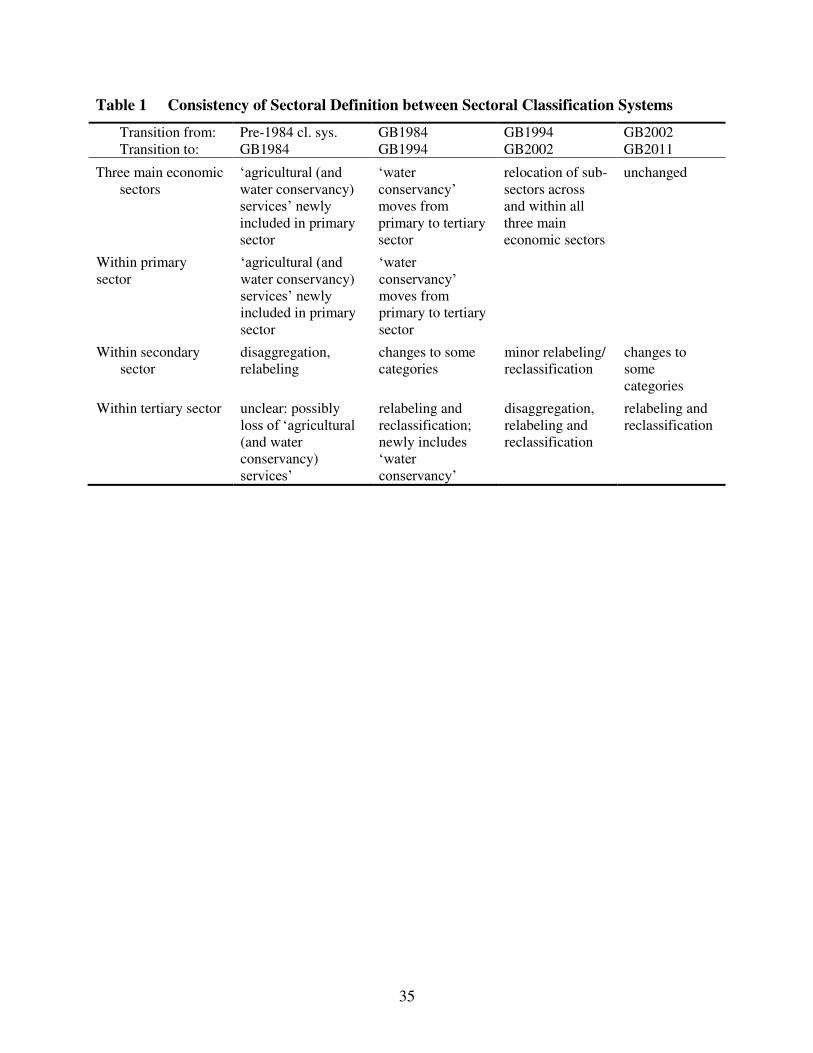
35
Table 1 Consistency of Sectoral Definition between Sectoral Classification Systems
Transition from: Pre-1984 cl. sys. GB1984 GB1994 GB2002 Transition to: GB1984 GB1994 GB2002 GB2011
Three main economic sectors
‘agricultural (and water conservancy) services’ newly included in primary sector
‘water conservancy’ moves from primary to tertiary sector
relocation of sub-sectors across and within all three main economic sectors
unchanged
Within primary sector
‘agricultural (and water conservancy) services’ newly included in primary sector
‘water conservancy’ moves from primary to tertiary sector
Within secondary sector
disaggregation, relabeling
changes to some categories
minor relabeling/ reclassification
changes to some categories
Within tertiary sector unclear: possibly loss of ‘agricultural (and water conservancy) services’
relabeling and reclassification; newly includes ‘water conservancy’
disaggregation, relabeling and reclassification
relabeling and reclassification

36
Table 2. Industrial Enterprise Ownership Classification: Prior to and Since 1998
Classification prior to 1998 Data 1995 Notes Classification since 1998 Data 2004
Number of enter-prises
Employment (%)
Number of enter-prises
Employment (%)
All DRIE All DRIE All DRIE All DRIE
Total 7341517 510381 100.0 100.0 Total 1375263 276474 100.0 100.0
100 Domestic enterprises 1269098 219309 78.6 73.5
1 State-owned economy 118000 87905 31.6 52.1 11a Unreformed SOEs 110 SOEs 25339 23417 9.6 13.3 11b Solely state-invested LLC new 151 12 State-owned joint operations new 141
2 Collective-owned economy 1465628 363840 39.8 36.0 21a COEs 120 COEs 141772 18095 7.4 5.1 21b Employee stock. coop. new 130 22 Collective-owned joint oper. new 142
prev. 21 130 Employee stock coop. 50097 8215 2.2 1.8
5 Joint operation economy 5903 5493 0.6 1.0 140 Joint operation enterpr. 6547 1439 0.5 0.4 prev. 12 141 State-owned 756 278 0.1 0.1 prev. 22 142 Collective-owned 2924 395 0.2 0.1
51 State-/coll.-owned j.o. ent. 143 State-/coll.-owned 1064 427 0.1 0.1 52 State-owned/private j.o. ent. into 149 149 Others 1803 339 0.1 0.1 53 Coll.-owned, private j.o. ent. into 149 54 State/coll./private j.o. ent. into 149
6 Shareholding economy 5873 5559 1.7 3.0 62 Limited liability companies 150 Limited liability comp. 102392 41234 18.2 22.8
prev. 11 151 Solely state-invested 2083 1449 4.0 5.5 159 Others 100309 39785 14.2 17.2
61 Stock companies 160 Stock companies 17427 7171 5.4 7.1
3 Private economy 287483 2708 3.3 0.2 170 Private enterprises 902647 119357 34.7 22.9 31 Private sole proprietorships 171 Private sole propr. 459709 26525 12.2 3.9 32 Private partnerships 172 Private partnerships 92023 6049 2.9 0.9 33 Private LLC 173 Private LLC 327629 82078 18.2 16.8
new 174 Private stock comp. 23286 4705 1.3 1.2
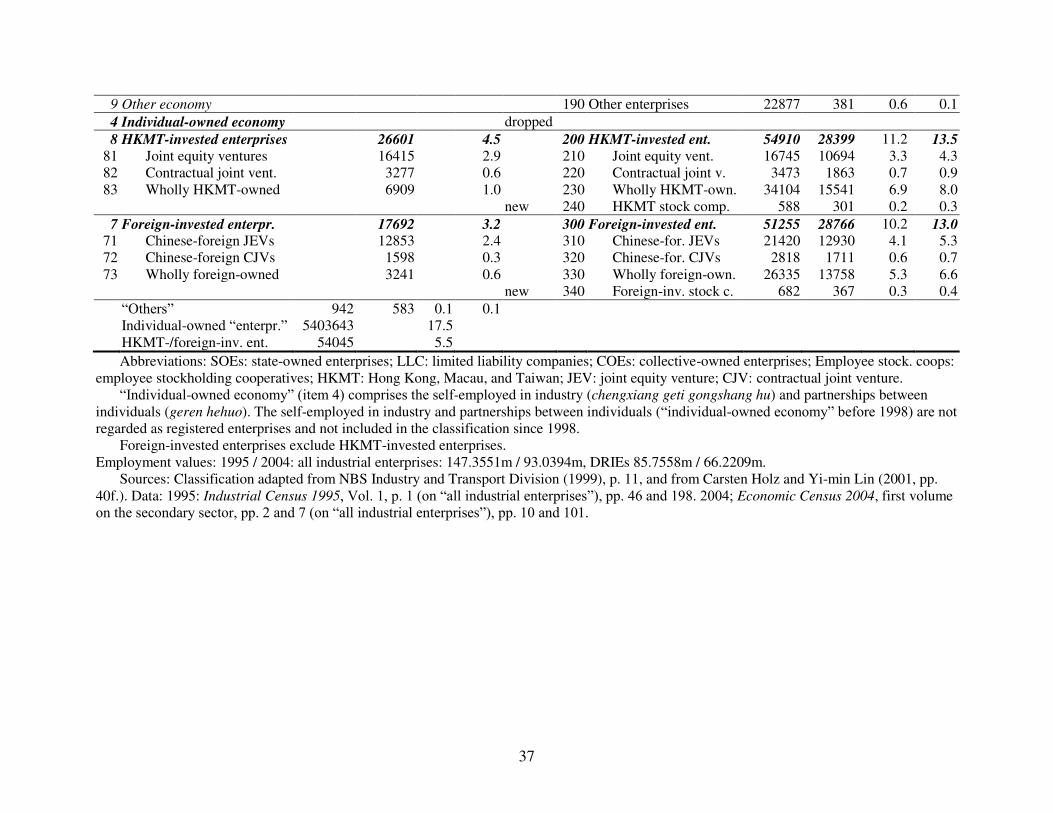
37
9 Other economy 190 Other enterprises 22877 381 0.6 0.1
4 Individual-owned economy dropped
8 HKMT-invested enterprises 26601 4.5 200 HKMT-invested ent. 54910 28399 11.2 13.5 81 Joint equity ventures 16415 2.9 210 Joint equity vent. 16745 10694 3.3 4.3 82 Contractual joint vent. 3277 0.6 220 Contractual joint v. 3473 1863 0.7 0.9 83 Wholly HKMT-owned 6909 1.0 230 Wholly HKMT-own. 34104 15541 6.9 8.0
new 240 HKMT stock comp. 588 301 0.2 0.3
7 Foreign-invested enterpr. 17692 3.2 300 Foreign-invested ent. 51255 28766 10.2 13.0 71 Chinese-foreign JEVs 12853 2.4 310 Chinese-for. JEVs 21420 12930 4.1 5.3 72 Chinese-foreign CJVs 1598 0.3 320 Chinese-for. CJVs 2818 1711 0.6 0.7 73 Wholly foreign-owned 3241 0.6 330 Wholly foreign-own. 26335 13758 5.3 6.6
new 340 Foreign-inv. stock c. 682 367 0.3 0.4
“Others” 942 583 0.1 0.1 Individual-owned “enterpr.” 5403643 17.5 HKMT-/foreign-inv. ent. 54045 5.5
Abbreviations: SOEs: state-owned enterprises; LLC: limited liability companies; COEs: collective-owned enterprises; Employee stock. coops: employee stockholding cooperatives; HKMT: Hong Kong, Macau, and Taiwan; JEV: joint equity venture; CJV: contractual joint venture. “Individual-owned economy” (item 4) comprises the self-employed in industry (chengxiang geti gongshang hu) and partnerships between individuals (geren hehuo). The self-employed in industry and partnerships between individuals (“individual-owned economy” before 1998) are not regarded as registered enterprises and not included in the classification since 1998. Foreign-invested enterprises exclude HKMT-invested enterprises. Employment values: 1995 / 2004: all industrial enterprises: 147.3551m / 93.0394m, DRIEs 85.7558m / 66.2209m. Sources: Classification adapted from NBS Industry and Transport Division (1999), p. 11, and from Carsten Holz and Yi-min Lin (2001, pp. 40f.). Data: 1995: Industrial Census 1995, Vol. 1, p. 1 (on “all industrial enterprises”), pp. 46 and 198. 2004; Economic Census 2004, first volume on the secondary sector, pp. 2 and 7 (on “all industrial enterprises”), pp. 10 and 101.

38
Data on value-added of the DRIEs for the years prior to 1992 are not available. For 1980 and 1982-1991, the ratio of industry value-added to industry net material product is applied to the net material product values of the DRIEs. For the years 1979 and 1981, when DRIE net material product values are not available, DRIE value-added is derived based on the ratio of DRIE GOV to constructed DRIE value-added in 1980 and 1982; for 1979 and 1981, the ratios of 1980 and 1982 are linearly interpolated and then multiplied with the 1979 and 1981 DRIE GOV values. (A 1978 DRIE GOV value is not available.) Linear interpolation is justified by the trend in the ratio during the period 1980 and 1982 through the 1990s. Value-added of the DRIEs is not revised following the 2004 economic census (the Statistical
Yearbook 2008, p. 492, reports values for 1998-2004 that are unchanged from the previously published ones). The chart uses two sets of data for industry value-added in the NIPA: the first set was published just before the results of the 2004 economic census were incorporated into the NIPA, the second set is based on the (since 1993) following the 2004 economic census retrospectively revised industry value-added. Since industry value-added in the NIPA was revised upward, the share of DRIEs in the revised NIPA values is lower than in the pre-revision values; i.e., the lower line (since 1993) in the chart is based on post-economic census 2004 retrospectively revised industry value-added in the NIPA. The data on DRIE value-added end in 2007. Sources: Industry value-added: pre-economic census: Statistical Yearbook 2005, p. 51; post-economic census: Statistical Yearbook 2008, p. 37. Industry net material product (1978-1992): Statistical Yearbook
1993, p. 33. DRIE value-added: Statistical Yearbook 1993, p. 417, 1994, p. 378, 1995, p. 388, 1996, p. 414, 1997, p. 424, 1998, p. 444, 1999, p. 432, 2000, p. 414, 2001, p. 410, 2002, p. 432, 2003, p. 468, 2005, p. 488, 2007, p. 508, 2008, p. 492. DRIE net material product (1980, 1982-1992): Statistical Yearbook
1984, p. 216, 1986, p. 278, 1987, p. 263, 1988, p. 320, 1989, p. 292, 1990, p. 419, 1991, p. 399, 1992, p. 411, 1993, p. 417, Industrial Yearbook 1986, p. 21; DRIE GOV (1980, 1982-1992): Seventeen Years, p. 146.
Figure 1. DRIE Share in Value-Added of Industry
0.55
0.60
0.65
0.70
0.75
0.80
0.85
0.90
0.95
1.00
1.05
1.10
1979 1982 1985 1988 1991 1994 1997 2000 2003 2006
Post-economic census
industry value added

39
All values are mid-year values. Industry employment: secondary sector employment times the share of industry in secondary sector employment. Secondary sector employment values of the years prior to 1990 are adjusted (see Holz, 2013). Values for the share of industry in secondary sector employment are available from the population censuses (1982, 1990, 2000, and 2010) and population surveys (1987, 1995, 2005). Share values of other years are interpolated; identical annual growth rates are assumed for all years between two adjacent census/survey dates. The census and survey values for the years through 1990 are of 1 July, and since then of 1 November of that year. The census value of 1 November 1995 was adjusted to turn it into a 1 July 1995 value. To obtain annual values for the years since 1996, the annual growth rate from 1 November in the first year of the interval to 1 November in the last year of the interval was applied to the each year’s 1 July value (in this interval). Employment values for the DRIEs are “average annual total employment” in 1994-2011, with the values for 1994-1997 obtained as DRIE value-added divided by (published) DRIE labor productivity (which yields an identical value to the published average annual total employment value for 1998, the first year for which this particular employment series is published). For the years prior to 1994, DRIE employment values are “average annual staff and workers,” in the one overlapping year 1993 identical up to a difference of 0.0006 percent to the “average annual total employment.” Sources: Secondary sector employment: Statistical Yearbook 2012, p 128. Shares of industry in secondary sector employment: Population Census and Population Survey volumes of the corresponding years. DRIE employment: 1998-2011: Statistical Yearbook 2012, p. 510; 1994-1998: Statistical Yearbook
1995, pp. 385, 401, 1996, pp. 411, 427, 1997, pp. 414, 437, 1998, 444, 459, 1999, 432, 437 (labor productivity and value-added); 1978-1994 (as available): Industrial Statistical Yearbook 1993, p. 90, 1994, p. 81, 1995, p. 79.
Figure 2. DRIE Share in Industry Employment
0.38
0.43
0.48
0.53
0.58
0.63
0.68
1978 1981 1984 1987 1990 1993 1996 1999 2002 2005 2008 2011
Share of DRIEs in industryemployment

40
Table 3. Coverage of Industrial Sectors, 1995
Number of enterprises Gross Output Value DRIE Employment Village+
(“all”) DRIEs
(% of all)
SOS-CEs (% of all)
Vill-age+
(b yuan)
DRIEs (%
of all)
GOV per
DRIE (m
yuan)
SOS-CEs (% of all)
GOV per
SOS-CE
(m.y.)
VA per ent. (m
yuan)
Vill-age+ (m)
DRIEs (%
of all)
Empl. per
DRIE
SOS-CEs (%
of all)
Empl. per
SOS-CE
I II III IV V VI VII VIII IX X XI XII XIII XIV
National total 1286134 39.7 6.8 6963 78.9 11 37.2 29 3.0 111.2 77.1 168 40.1 508
Mining 103396 30.2 5.2 446 79.7 11 62.2 52 6.1 13.7 81.2 357 62.4 1599
1 Coal mining and processing 31628 37.8 6.6 142 81.2 10 63.1 43 5.0 7.2 85.0 510 65.2 2230 2 Petroleum and natural gas extraction 176 76.1 30.7 144 99.4 1066 94.8 2524 701.0 1.5 99.0 11096 98.6 27417 3 Ferrous metals mining and processing 7700 27.8 3.4 20 56.6 5 25.6 19 1.9 0.5 67.9 162 35.2 678 4 Nonferrous metals mining/processing 7330 51.5 12.9 41 77.8 9 44.3 19 3.0 0.9 85.1 213 56.5 562 5 Nonmetal minerals mining/processing 52262 22.6 2.3 81 45.0 3 14.4 10 1.1 2.4 51.7 103 22.4 444 6 Other minerals mining and processing n.a. n.a. n.a. n.a. n.a. 3 n.a. 7 1.0 n.a. n.a. n.a. n.a. n.a. 7 Logging, transport of timber/bamboo 4300 28.8 18.1 18 93.9 13 90.5 20 7.3 1.2 96.0 954 94.5 1494 Manufacturing 1121197 41.1 6.7 6105 79.3 11 34.0 28 2.6 91.3 76.2 151 36.1 439
8 Food processing 173348 17.7 5.7 416 73.1 10 37.9 16 1.6 3.7 68.2 83 44.5 169 9 Food manufacturing 32163 50.2 16.5 129 77.1 6 29.4 7 1.3 2.1 78.4 101 42.0 165 10 Beverage manufacturing 32936 44.7 11.0 133 86.7 8 46.1 17 2.4 1.9 82.2 104 51.6 267 11 Tobacco processing 11745 3.6 2.6 104 97.0 237 93.9 322 144.8 0.4 85.5 779 79.8 1017 12 Textile industry 58988 43.5 7.4 558 82.5 18 32.7 42 3.5 10.1 87.0 344 44.8 1045 13 Garments and other fiber products 46513 43.0 2.4 224 65.6 7 4.6 9 1.7 4.2 65.8 138 6.0 228 14 Leather, furs, down; related products 23150 45.2 3.7 141 68.9 9 5.8 10 1.9 2.4 65.7 148 10.0 279 15 Timber, bamboo, cane, etc. 39447 39.2 3.2 70 57.5 3 10.1 6 0.6 1.6 67.3 71 16.6 213 16 Furniture manufacturing 23981 36.5 2.5 47 48.5 3 4.3 3 0.6 1.0 53.9 59 6.4 102 17 Papermaking and paper products 31287 44.4 6.1 145 69.9 7 26.1 20 1.7 2.7 70.2 134 29.1 407 18 Printing and record pressing 23935 64.5 14.8 56 74.0 3 30.1 5 0.8 1.4 81.0 72 40.1 154 19 Stationery, educ. and sports goods 10923 50.9 4.8 53 69.5 7 7.4 8 1.6 1.3 58.2 131 8.3 197 20 Petroleum proc. and coking products 6892 39.7 5.7 217 93.6 74 82.6 457 20.5 0.9 84.7 294 64.4 1563 21 Raw chemical materials and products 49897 56.9 11.7 448 85.2 13 47.8 37 3.3 5.6 87.3 173 56.5 546 22 Medical and pharmaceutical products 6844 78.7 30.7 103 93.0 18 47.7 23 4.9 1.3 93.3 219 58.0 350 23 Chemical fibers 2550 52.3 9.7 87 92.7 61 32.1 113 15.2 0.6 90.3 427 46.8 1189
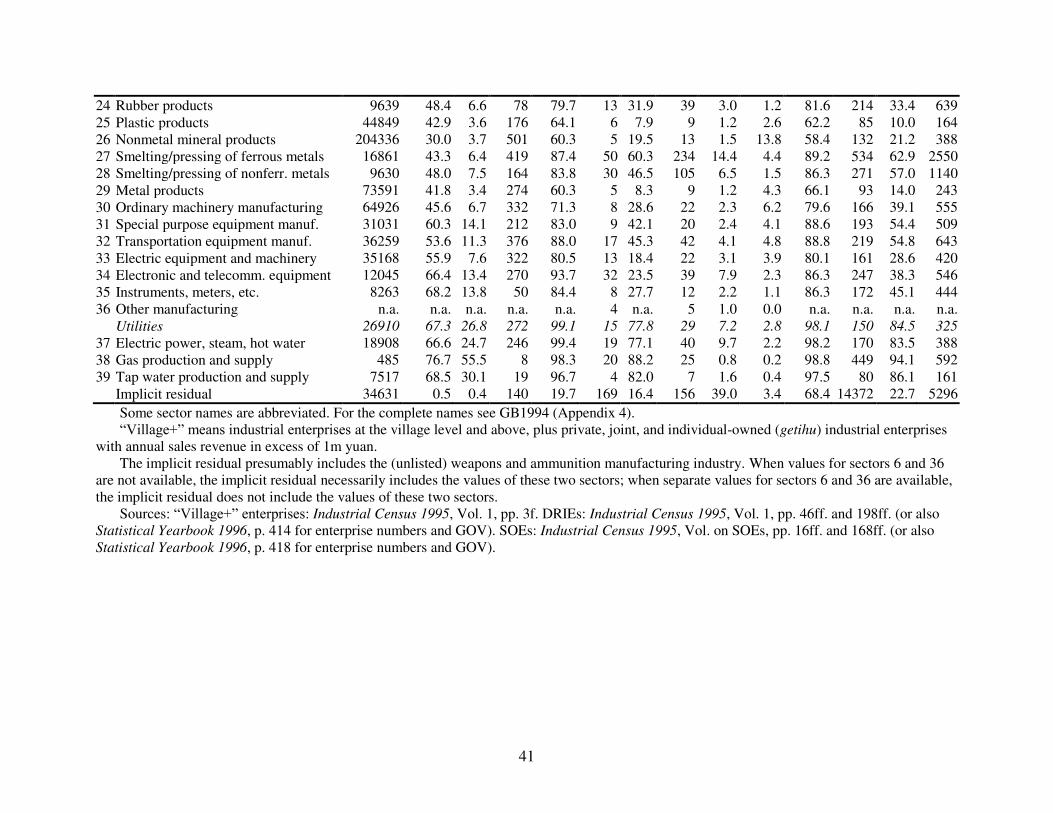
41
24 Rubber products 9639 48.4 6.6 78 79.7 13 31.9 39 3.0 1.2 81.6 214 33.4 639 25 Plastic products 44849 42.9 3.6 176 64.1 6 7.9 9 1.2 2.6 62.2 85 10.0 164 26 Nonmetal mineral products 204336 30.0 3.7 501 60.3 5 19.5 13 1.5 13.8 58.4 132 21.2 388 27 Smelting/pressing of ferrous metals 16861 43.3 6.4 419 87.4 50 60.3 234 14.4 4.4 89.2 534 62.9 2550 28 Smelting/pressing of nonferr. metals 9630 48.0 7.5 164 83.8 30 46.5 105 6.5 1.5 86.3 271 57.0 1140 29 Metal products 73591 41.8 3.4 274 60.3 5 8.3 9 1.2 4.3 66.1 93 14.0 243 30 Ordinary machinery manufacturing 64926 45.6 6.7 332 71.3 8 28.6 22 2.3 6.2 79.6 166 39.1 555 31 Special purpose equipment manuf. 31031 60.3 14.1 212 83.0 9 42.1 20 2.4 4.1 88.6 193 54.4 509 32 Transportation equipment manuf. 36259 53.6 11.3 376 88.0 17 45.3 42 4.1 4.8 88.8 219 54.8 643 33 Electric equipment and machinery 35168 55.9 7.6 322 80.5 13 18.4 22 3.1 3.9 80.1 161 28.6 420 34 Electronic and telecomm. equipment 12045 66.4 13.4 270 93.7 32 23.5 39 7.9 2.3 86.3 247 38.3 546 35 Instruments, meters, etc. 8263 68.2 13.8 50 84.4 8 27.7 12 2.2 1.1 86.3 172 45.1 444 36 Other manufacturing n.a. n.a. n.a. n.a. n.a. 4 n.a. 5 1.0 0.0 n.a. n.a. n.a. n.a. Utilities 26910 67.3 26.8 272 99.1 15 77.8 29 7.2 2.8 98.1 150 84.5 325
37 Electric power, steam, hot water 18908 66.6 24.7 246 99.4 19 77.1 40 9.7 2.2 98.2 170 83.5 388 38 Gas production and supply 485 76.7 55.5 8 98.3 20 88.2 25 0.8 0.2 98.8 449 94.1 592 39 Tap water production and supply 7517 68.5 30.1 19 96.7 4 82.0 7 1.6 0.4 97.5 80 86.1 161 Implicit residual 34631 0.5 0.4 140 19.7 169 16.4 156 39.0 3.4 68.4 14372 22.7 5296
Some sector names are abbreviated. For the complete names see GB1994 (Appendix 4). “Village+” means industrial enterprises at the village level and above, plus private, joint, and individual-owned (getihu) industrial enterprises with annual sales revenue in excess of 1m yuan. The implicit residual presumably includes the (unlisted) weapons and ammunition manufacturing industry. When values for sectors 6 and 36 are not available, the implicit residual necessarily includes the values of these two sectors; when separate values for sectors 6 and 36 are available, the implicit residual does not include the values of these two sectors. Sources: “Village+” enterprises: Industrial Census 1995, Vol. 1, pp. 3f. DRIEs: Industrial Census 1995, Vol. 1, pp. 46ff. and 198ff. (or also Statistical Yearbook 1996, p. 414 for enterprise numbers and GOV). SOEs: Industrial Census 1995, Vol. on SOEs, pp. 16ff. and 168ff. (or also Statistical Yearbook 1996, p. 418 for enterprise numbers and GOV).

42
Table 4. Coverage of Industrial Sectors, 2004
Number of enterprises Gross Output Value DRIE Employment All
industry DRIEs
(% of all)
SOS-CEs (% of all)
All in-
dustry (b
yuan)
DRIEs (%
of all)
GOV per
DRIE (m
yuan)
SOS-CEs (% of all)
GOV per
SOS-CE
(m.y.)
VA per ent. (m
yuan)
All in-dustry
(m)
DRIEs (%
of all)
Empl. per
DRIE
SOS-CEs (%
of all)
Empl. per
SOS-CE
I II III IV V VI VII VIII IX X XI XII XIII XIV
National total 1375263 20.1 2.6 22232 90.7 73 31.6 197 27 93.04 71.2 240 21.2 554
Mining 78919 13.6 2.6 1242 86.9 100 63.7 381 75 8.68 73.3 592 53.6 2243
1 Mining and washing of coal 26843 19.6 4.1 474 85.9 77 63.6 277 50 5.40 77.7 800 59.2 2941 2 Extraction of petroleum and nat. gas 482 38.0 23.0 463 99.4 2514 90.9 3791 2767 0.98 97.9 5252 96.4 8528 3 Mining/proc. of ferrous metal ores 10262 16.2 1.4 98 73.9 44 21.1 142 20 0.62 62.6 233 23.4 995 4 Mining/pr. of non-ferrous metal ores 6087 24.1 5.6 91 87.7 55 35.5 95 28 0.55 71.9 267 34.5 550 5 Mining/processing of nonmetal ores 34981 6.2 1.1 115 51.1 27 13.6 41 13 1.13 37.7 195 15.2 447 6 Mining of other ores 264 4.5 1.1 1 55.9 48 0.2 1 19 0.01 23.0 142 1.4 33 Manufacturing (and processing) 1258586 20.4 2.2 19396 90.4 68 25.0 179 23 80.81 70.1 221 15.2 453
7 Food from agricultural products 69669 20.2 3.0 954 87.4 59 10.2 47 19 2.96 66.3 139 10.0 144 8 Foods 29896 18.5 3.0 329 88.2 52 10.0 36 21 1.60 69.4 201 10.4 184 9 Beverages 25526 13.6 3.0 274 89.2 70 22.9 82 33 1.22 68.7 242 22.2 353
10 Tobacco 287 73.2 58.5 260 100.0 1236 98.9 1528 1084 0.20 98.4 947 92.4 1111 11 Textiles 83103 29.1 1.5 1166 88.8 43 8.0 74 14 7.63 77.0 243 11.8 716 12 Textile wearing apparel, footw., caps 48286 24.9 0.8 467 85.6 33 2.2 27 12 4.82 68.9 276 2.6 327 13 Leather, fur, feather, related products 22699 28.2 0.6 313 88.3 43 1.0 21 15 2.76 76.5 330 1.2 223 14 Timber, wood, bamboo 39938 12.6 0.9 200 69.2 28 6.2 36 9 1.58 48.8 153 7.1 325 15 Furniture 23913 12.7 0.6 150 77.2 38 3.8 40 13 1.08 60.1 215 1.9 145 16 Paper and paper products 39721 18.8 1.3 397 84.9 45 12.2 91 15 2.01 64.9 175 10.1 380 17 Printing, reprod. of recording media 41241 12.5 3.8 174 68.7 23 16.8 19 10 1.27 50.0 124 14.9 122 18 Articles for culture, education, sport 14622 23.1 0.9 143 85.2 36 2.8 32 11 1.49 72.4 318 2.2 258 19 Petroleum, coking, nuclear fuel 7163 28.2 3.9 909 98.2 442 76.6 2503 100 0.78 87.2 337 45.1 1265 20 Raw chem. materials & products 75179 25.0 3.0 1403 92.3 69 30.6 191 23 4.45 73.4 174 26.2 517 21 Medicines 11296 41.7 7.4 337 96.3 69 26.5 107 31 1.32 86.3 243 27.3 433 22 Chemical fibers 3383 45.4 3.6 199 97.9 127 25.1 407 37 0.43 90.6 255 31.1 1093 23 Rubber 15190 20.9 1.7 205 88.8 57 15.1 123 20 1.09 74.0 255 12.1 522 24 Plastics 69751 17.6 0.9 525 79.8 34 5.9 49 11 2.92 60.1 143 3.5 160
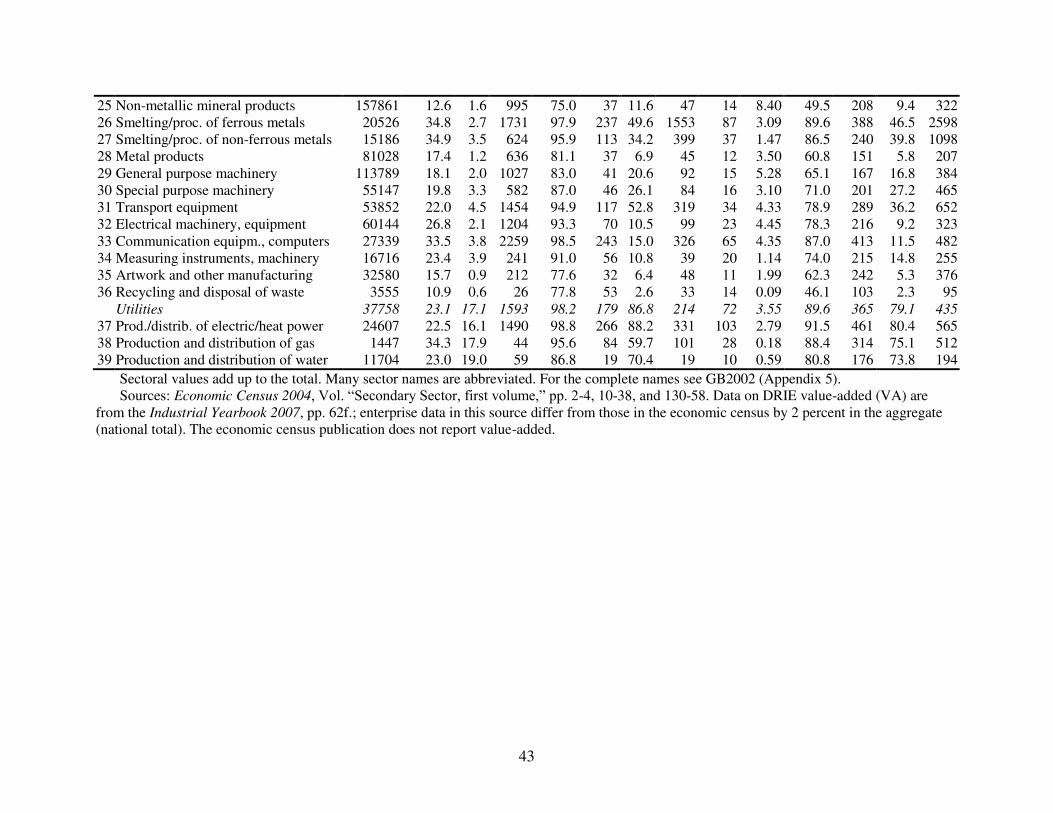
43
25 Non-metallic mineral products 157861 12.6 1.6 995 75.0 37 11.6 47 14 8.40 49.5 208 9.4 322 26 Smelting/proc. of ferrous metals 20526 34.8 2.7 1731 97.9 237 49.6 1553 87 3.09 89.6 388 46.5 2598 27 Smelting/proc. of non-ferrous metals 15186 34.9 3.5 624 95.9 113 34.2 399 37 1.47 86.5 240 39.8 1098 28 Metal products 81028 17.4 1.2 636 81.1 37 6.9 45 12 3.50 60.8 151 5.8 207 29 General purpose machinery 113789 18.1 2.0 1027 83.0 41 20.6 92 15 5.28 65.1 167 16.8 384 30 Special purpose machinery 55147 19.8 3.3 582 87.0 46 26.1 84 16 3.10 71.0 201 27.2 465 31 Transport equipment 53852 22.0 4.5 1454 94.9 117 52.8 319 34 4.33 78.9 289 36.2 652 32 Electrical machinery, equipment 60144 26.8 2.1 1204 93.3 70 10.5 99 23 4.45 78.3 216 9.2 323 33 Communication equipm., computers 27339 33.5 3.8 2259 98.5 243 15.0 326 65 4.35 87.0 413 11.5 482 34 Measuring instruments, machinery 16716 23.4 3.9 241 91.0 56 10.8 39 20 1.14 74.0 215 14.8 255 35 Artwork and other manufacturing 32580 15.7 0.9 212 77.6 32 6.4 48 11 1.99 62.3 242 5.3 376 36 Recycling and disposal of waste 3555 10.9 0.6 26 77.8 53 2.6 33 14 0.09 46.1 103 2.3 95
Utilities 37758 23.1 17.1 1593 98.2 179 86.8 214 72 3.55 89.6 365 79.1 435
37 Prod./distrib. of electric/heat power 24607 22.5 16.1 1490 98.8 266 88.2 331 103 2.79 91.5 461 80.4 565 38 Production and distribution of gas 1447 34.3 17.9 44 95.6 84 59.7 101 28 0.18 88.4 314 75.1 512 39 Production and distribution of water 11704 23.0 19.0 59 86.8 19 70.4 19 10 0.59 80.8 176 73.8 194
Sectoral values add up to the total. Many sector names are abbreviated. For the complete names see GB2002 (Appendix 5). Sources: Economic Census 2004, Vol. “Secondary Sector, first volume,” pp. 2-4, 10-38, and 130-58. Data on DRIE value-added (VA) are from the Industrial Yearbook 2007, pp. 62f.; enterprise data in this source differ from those in the economic census by 2 percent in the aggregate (national total). The economic census publication does not report value-added.
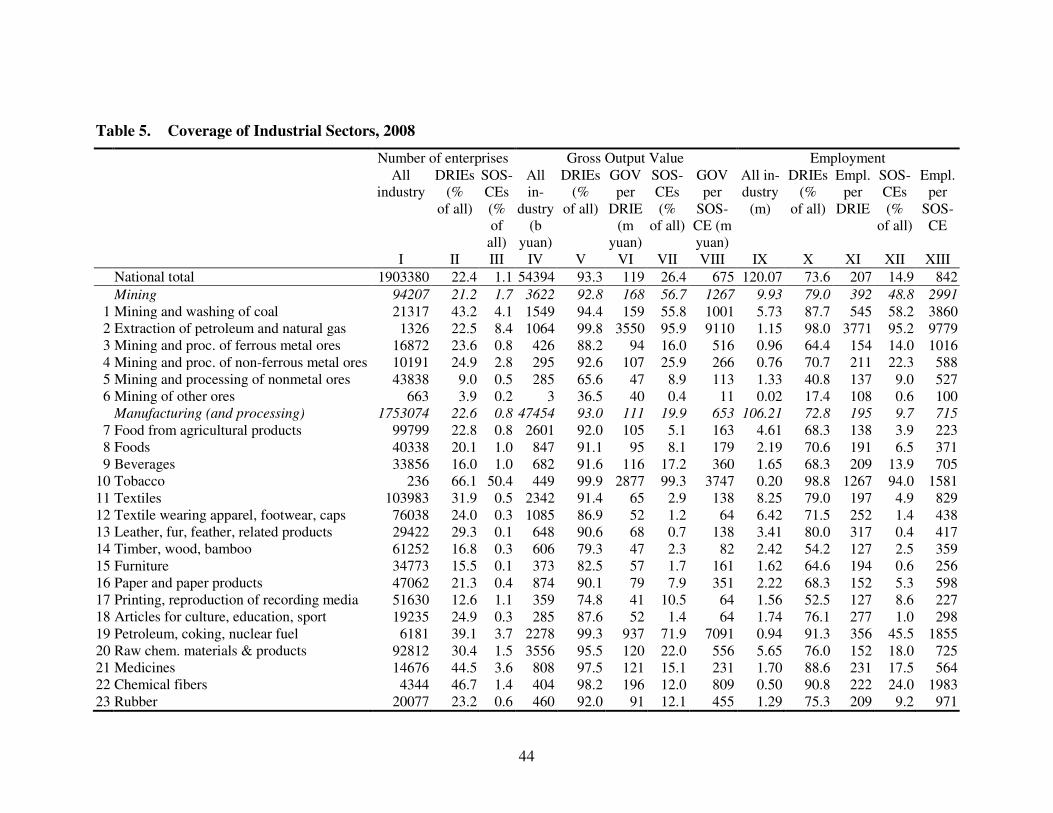
44
Table 5. Coverage of Industrial Sectors, 2008
Number of enterprises Gross Output Value Employment All
industry DRIEs
(% of all)
SOS-CEs (% of
all)
All in-
dustry (b
yuan)
DRIEs (%
of all)
GOV per
DRIE (m
yuan)
SOS-CEs (%
of all)
GOV per
SOS-CE (m yuan)
All in-dustry
(m)
DRIEs (%
of all)
Empl. per
DRIE
SOS-CEs (%
of all)
Empl. per
SOS-CE
I II III IV V VI VII VIII IX X XI XII XIII
National total 1903380 22.4 1.1 54394 93.3 119 26.4 675 120.07 73.6 207 14.9 842
Mining 94207 21.2 1.7 3622 92.8 168 56.7 1267 9.93 79.0 392 48.8 2991
1 Mining and washing of coal 21317 43.2 4.1 1549 94.4 159 55.8 1001 5.73 87.7 545 58.2 3860 2 Extraction of petroleum and natural gas 1326 22.5 8.4 1064 99.8 3550 95.9 9110 1.15 98.0 3771 95.2 9779 3 Mining and proc. of ferrous metal ores 16872 23.6 0.8 426 88.2 94 16.0 516 0.96 64.4 154 14.0 1016 4 Mining and proc. of non-ferrous metal ores 10191 24.9 2.8 295 92.6 107 25.9 266 0.76 70.7 211 22.3 588 5 Mining and processing of nonmetal ores 43838 9.0 0.5 285 65.6 47 8.9 113 1.33 40.8 137 9.0 527 6 Mining of other ores 663 3.9 0.2 3 36.5 40 0.4 11 0.02 17.4 108 0.6 100 Manufacturing (and processing) 1753074 22.6 0.8 47454 93.0 111 19.9 653 106.21 72.8 195 9.7 715
7 Food from agricultural products 99799 22.8 0.8 2601 92.0 105 5.1 163 4.61 68.3 138 3.9 223 8 Foods 40338 20.1 1.0 847 91.1 95 8.1 179 2.19 70.6 191 6.5 371 9 Beverages 33856 16.0 1.0 682 91.6 116 17.2 360 1.65 68.3 209 13.9 705
10 Tobacco 236 66.1 50.4 449 99.9 2877 99.3 3747 0.20 98.8 1267 94.0 1581 11 Textiles 103983 31.9 0.5 2342 91.4 65 2.9 138 8.25 79.0 197 4.9 829 12 Textile wearing apparel, footwear, caps 76038 24.0 0.3 1085 86.9 52 1.2 64 6.42 71.5 252 1.4 438 13 Leather, fur, feather, related products 29422 29.3 0.1 648 90.6 68 0.7 138 3.41 80.0 317 0.4 417 14 Timber, wood, bamboo 61252 16.8 0.3 606 79.3 47 2.3 82 2.42 54.2 127 2.5 359 15 Furniture 34773 15.5 0.1 373 82.5 57 1.7 161 1.62 64.6 194 0.6 256 16 Paper and paper products 47062 21.3 0.4 874 90.1 79 7.9 351 2.22 68.3 152 5.3 598 17 Printing, reproduction of recording media 51630 12.6 1.1 359 74.8 41 10.5 64 1.56 52.5 127 8.6 227 18 Articles for culture, education, sport 19235 24.9 0.3 285 87.6 52 1.4 64 1.74 76.1 277 1.0 298 19 Petroleum, coking, nuclear fuel 6181 39.1 3.7 2278 99.3 937 71.9 7091 0.94 91.3 356 45.5 1855 20 Raw chem. materials & products 92812 30.4 1.5 3556 95.5 120 22.0 556 5.65 76.0 152 18.0 725 21 Medicines 14676 44.5 3.6 808 97.5 121 15.1 231 1.70 88.6 231 17.5 564 22 Chemical fibers 4344 46.7 1.4 404 98.2 196 12.0 809 0.50 90.8 222 24.0 1983 23 Rubber 20077 23.2 0.6 460 92.0 91 12.1 455 1.29 75.3 209 9.2 971
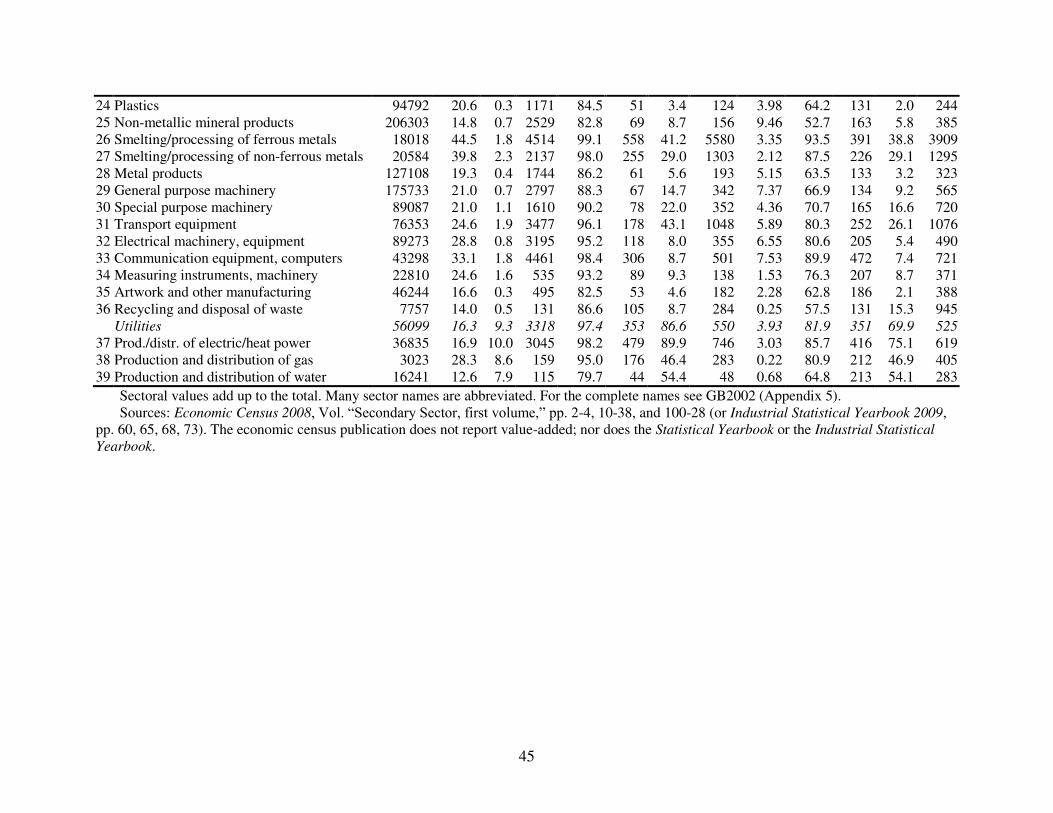
45
24 Plastics 94792 20.6 0.3 1171 84.5 51 3.4 124 3.98 64.2 131 2.0 244 25 Non-metallic mineral products 206303 14.8 0.7 2529 82.8 69 8.7 156 9.46 52.7 163 5.8 385 26 Smelting/processing of ferrous metals 18018 44.5 1.8 4514 99.1 558 41.2 5580 3.35 93.5 391 38.8 3909 27 Smelting/processing of non-ferrous metals 20584 39.8 2.3 2137 98.0 255 29.0 1303 2.12 87.5 226 29.1 1295 28 Metal products 127108 19.3 0.4 1744 86.2 61 5.6 193 5.15 63.5 133 3.2 323 29 General purpose machinery 175733 21.0 0.7 2797 88.3 67 14.7 342 7.37 66.9 134 9.2 565 30 Special purpose machinery 89087 21.0 1.1 1610 90.2 78 22.0 352 4.36 70.7 165 16.6 720 31 Transport equipment 76353 24.6 1.9 3477 96.1 178 43.1 1048 5.89 80.3 252 26.1 1076 32 Electrical machinery, equipment 89273 28.8 0.8 3195 95.2 118 8.0 355 6.55 80.6 205 5.4 490 33 Communication equipment, computers 43298 33.1 1.8 4461 98.4 306 8.7 501 7.53 89.9 472 7.4 721 34 Measuring instruments, machinery 22810 24.6 1.6 535 93.2 89 9.3 138 1.53 76.3 207 8.7 371 35 Artwork and other manufacturing 46244 16.6 0.3 495 82.5 53 4.6 182 2.28 62.8 186 2.1 388 36 Recycling and disposal of waste 7757 14.0 0.5 131 86.6 105 8.7 284 0.25 57.5 131 15.3 945
Utilities 56099 16.3 9.3 3318 97.4 353 86.6 550 3.93 81.9 351 69.9 525
37 Prod./distr. of electric/heat power 36835 16.9 10.0 3045 98.2 479 89.9 746 3.03 85.7 416 75.1 619 38 Production and distribution of gas 3023 28.3 8.6 159 95.0 176 46.4 283 0.22 80.9 212 46.9 405 39 Production and distribution of water 16241 12.6 7.9 115 79.7 44 54.4 48 0.68 64.8 213 54.1 283
Sectoral values add up to the total. Many sector names are abbreviated. For the complete names see GB2002 (Appendix 5). Sources: Economic Census 2008, Vol. “Secondary Sector, first volume,” pp. 2-4, 10-38, and 100-28 (or Industrial Statistical Yearbook 2009, pp. 60, 65, 68, 73). The economic census publication does not report value-added; nor does the Statistical Yearbook or the Industrial Statistical
Yearbook.

46
Table 6. Significance Levels of Correlations across Sectors (in %)
GOV per enterprise Employees per enterprise
GOV per employee
DRIEs SOEs non-DRIE/ DRIE
DRIEs SOEs non-DRIE/ DRIE
DRIEs SOEs non-DRIE/ DRIE
1995 DRIE share in the # of enterprises n.s. n.s. n.s. n.s. n.s. n.s. n.s. n.s. n.s. DRIE share in GOV 0.1 5 (-)0.1 0.1 1 (-)1 1 5 n.s. DRIE share in employment 1 10 (-)0.1 0.1 1 (-)0.1 n.s. n.s. n.s. SOE share in the # of enterprises n.s. n.s. n.s. n.s. n.s. n.s. n.s. n.s. n.s. SOE share in GOV 1 0.1 (-)0.1 0.1 0.1 (-)0.1 10 1 n.s. SOE share in employment 5 5 (-)0.1 0.1 0.1 (-)0.1 n.s. n.s. n.s. Same variable: DRIE and … 0.1 (-)0.1 0.1 (-)0.1 0.1 (-)0.1 Same variable: Non-DRIE and … 0.1 5 n.s. n.s. n.s. 1 0.1 0.1 n.s.
2004 DRIE share in the # of enterprises 1 5 (-)0.1 5 5 (-)1 5 10 (-)5 DRIE share in GOV 1 5 (-)0.1 5 10 (-)0.1 1 1 (-)1 DRIE share in employment 1 5 (-)0.1 1 1 (-)0.1 5 5 (-)10 SOE share in the # of enterprises n.s. n.s. n.s. n.s. n.s. (-)1 n.s. n.s. n.s. SOE share in GOV 1 0.1 (-)1 1 0.1 (-)0.1 5 1 n.s. SOE share in employment 5 5 (-)5 1 0.1 (-)0.1 n.s. n.s. n.s. Same variable: DRIE and … 0.1 (-)0.1 0.1 (-)0.1 0.1 (-)0.1 Same variable: Non-DRIE and … 0.1 0.1 n.s. 0.1 1 n.s. 0.1 0.1 (-)5
2008 DRIE share in the # of enterprises 0.1 1 (-)0.1 0.1 0.1 (-)0.1 1 5 (-)1 DRIE share in GOV 5 5 (-)0.1 1 5 (-)0.1 5 5 (-)0.1 DRIE share in employment 1 1 (-)0.1 0.1 0.1 (-)0.1 1 5 (-)1 SOE share in the # of enterprises 10 n.s. (-)10 10 n.s. (-)5 n.s. n.s. n.s. SOE share in GOV 0.1 0.1 (-)1 1 0.1 (-)1 0.1 0.1 (-)10 SOE share in employment 0.1 1 (-)5 1 0.1 (-)1 1 5 n.s. Same variable: DRIE and … 0.1 (-)0.1 0.1 (-)0.1 0.1 (-)0.1 Same variable: Non-DRIE and … 1 1 n.s. 0.1 1 n.s. 0.1 0.1 (-)1
Numbers are significance levels in percent. “n.s.” means not significant at the 10 percent level. SOEs: SOEs in 1995, SOSCEs in 2004 and 2008. Monopoly sectors are omitted from the analysis. In 1995, these are the five sectors ‘extraction of petroleum and natural gas,’ ‘tobacco processing,’ ‘electric power, steam, and hot water production and supply,’ ‘gas production and supply,’ and ‘tap water production and supply;’ insufficient data are available for the two sectors ‘other minerals mining and processing,’ and ‘other manufacturing.’ In 2004 and 2008, the monopoly sectors are the three sectors ‘extraction of petroleum and natural gas,’ ‘manufacture of tobacco,’ and ‘production and distribution of electric power and heat power.’ The findings are very similar if the monopoly sectors are included. Sources: see previous three tables.
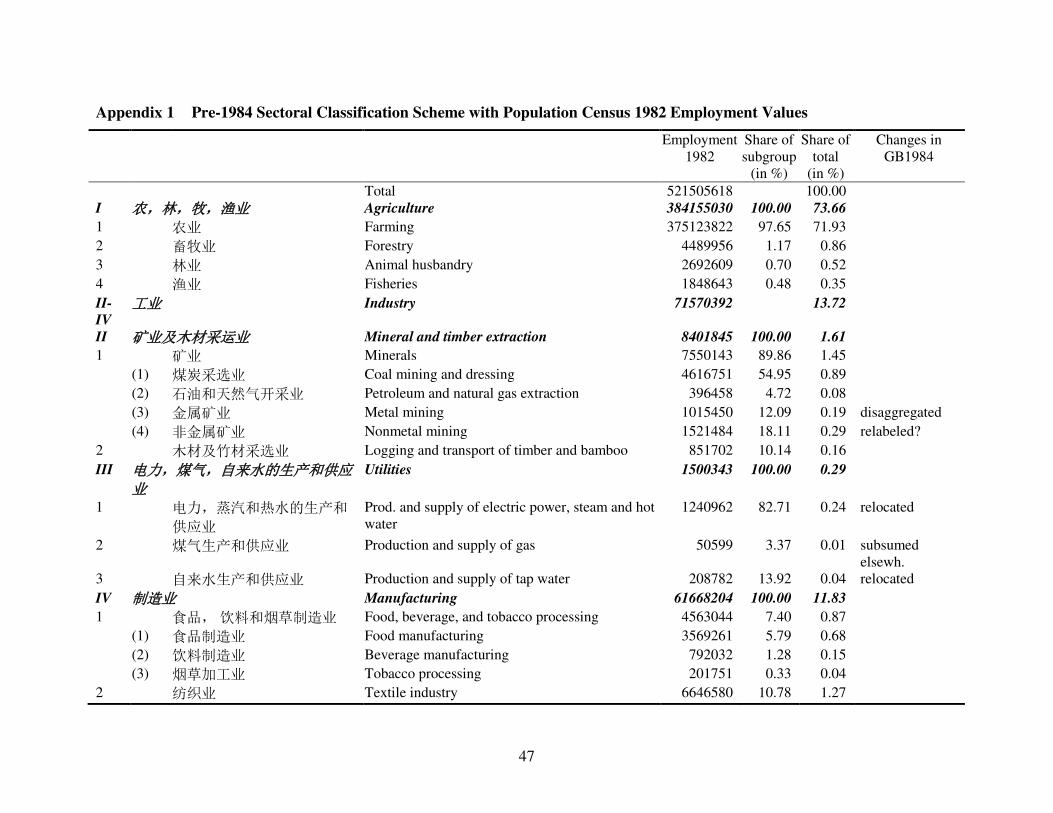
47
Appendix 1 Pre-1984 Sectoral Classification Scheme with Population Census 1982 Employment Values
Employment 1982
Share of subgroup
(in %)
Share of total
(in %)
Changes in GB1984
Total 521505618 100.00 I 农,林,牧,渔业 Agriculture 384155030 100.00 73.66
1 农业 Farming 375123822 97.65 71.93
2 畜牧业 Forestry 4489956 1.17 0.86
3 林业 Animal husbandry 2692609 0.70 0.52
4 渔业 Fisheries 1848643 0.48 0.35
II-
IV 工业 Industry 71570392 13.72
II 矿业及木材采运业 Mineral and timber extraction 8401845 100.00 1.61
1 矿业 Minerals 7550143 89.86 1.45
(1) 煤炭采选业 Coal mining and dressing 4616751 54.95 0.89
(2) 石油和天然气开采业 Petroleum and natural gas extraction 396458 4.72 0.08
(3) 金属矿业 Metal mining 1015450 12.09 0.19 disaggregated
(4) 非金属矿业 Nonmetal mining 1521484 18.11 0.29 relabeled?
2 木材及竹材采选业 Logging and transport of timber and bamboo 851702 10.14 0.16
III 电力,煤气,自来水的生产和供应业
Utilities 1500343 100.00 0.29
1 电力,蒸汽和热水的生产和
供应业
Prod. and supply of electric power, steam and hot water
1240962 82.71 0.24 relocated
2 煤气生产和供应业 Production and supply of gas 50599 3.37 0.01 subsumed elsewh.
3 自来水生产和供应业 Production and supply of tap water 208782 13.92 0.04 relocated
IV 制造业 Manufacturing 61668204 100.00 11.83
1 食品, 饮料和烟草制造业 Food, beverage, and tobacco processing 4563044 7.40 0.87
(1) 食品制造业 Food manufacturing 3569261 5.79 0.68
(2) 饮料制造业 Beverage manufacturing 792032 1.28 0.15
(3) 烟草加工业 Tobacco processing 201751 0.33 0.04
2 纺织业 Textile industry 6646580 10.78 1.27
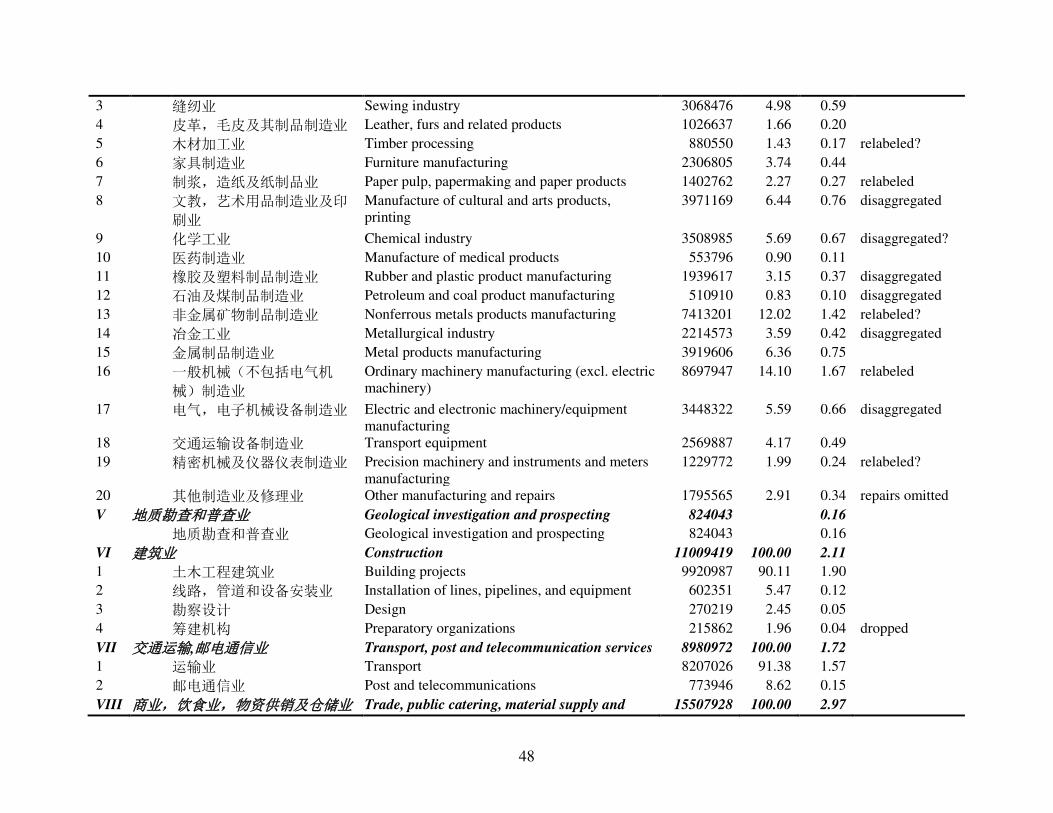
48
3 缝纫业 Sewing industry 3068476 4.98 0.59
4 皮革,毛皮及其制品制造业 Leather, furs and related products 1026637 1.66 0.20
5 木材加工业 Timber processing 880550 1.43 0.17 relabeled?
6 家具制造业 Furniture manufacturing 2306805 3.74 0.44
7 制浆,造纸及纸制品业 Paper pulp, papermaking and paper products 1402762 2.27 0.27 relabeled
8 文教,艺术用品制造业及印
刷业
Manufacture of cultural and arts products, printing
3971169 6.44 0.76 disaggregated
9 化学工业 Chemical industry 3508985 5.69 0.67 disaggregated?
10 医药制造业 Manufacture of medical products 553796 0.90 0.11
11 橡胶及塑料制品制造业 Rubber and plastic product manufacturing 1939617 3.15 0.37 disaggregated
12 石油及煤制品制造业 Petroleum and coal product manufacturing 510910 0.83 0.10 disaggregated
13 非金属矿物制品制造业 Nonferrous metals products manufacturing 7413201 12.02 1.42 relabeled?
14 冶金工业 Metallurgical industry 2214573 3.59 0.42 disaggregated
15 金属制品制造业 Metal products manufacturing 3919606 6.36 0.75
16 一般机械(不包括电气机
械)制造业
Ordinary machinery manufacturing (excl. electric machinery)
8697947 14.10 1.67 relabeled
17 电气,电子机械设备制造业 Electric and electronic machinery/equipment manufacturing
3448322 5.59 0.66 disaggregated
18 交通运输设备制造业 Transport equipment 2569887 4.17 0.49
19 精密机械及仪器仪表制造业 Precision machinery and instruments and meters manufacturing
1229772 1.99 0.24 relabeled?
20 其他制造业及修理业 Other manufacturing and repairs 1795565 2.91 0.34 repairs omitted
V 地质勘查和普查业 Geological investigation and prospecting 824043 0.16
地质勘查和普查业 Geological investigation and prospecting 824043 0.16
VI 建筑业 Construction 11009419 100.00 2.11
1 土木工程建筑业 Building projects 9920987 90.11 1.90
2 线路,管道和设备安装业 Installation of lines, pipelines, and equipment 602351 5.47 0.12
3 勘察设计 Design 270219 2.45 0.05
4 筹建机构 Preparatory organizations 215862 1.96 0.04 dropped
VII 交通运输,邮电通信业 Transport, post and telecommunication services 8980972 100.00 1.72
1 运输业 Transport 8207026 91.38 1.57
2 邮电通信业 Post and telecommunications 773946 8.62 0.15
VIII 商业,饮食业,物资供销及仓储业 Trade, public catering, material supply and 15507928 100.00 2.97

49
marketing cooperatives, and storage 1 商业 Trade 12079932 77.90 2.32
2 饮食业 Public catering 1979667 12.77 0.38
3 物资供销 Material supply and marketing cooperatives 818903 5.28 0.16
4 仓储业 Storage 629426 4.06 0.12
IX 住宅管理,公用事业管理和居民服务业
Housing admin., public facilities, and
household serv.
2441405 100.00 0.47 relabeled,
expanded?
1 房地产管理事业 Real estate administration 324389 13.29 0.06
2 公用事业 Public facilities 544823 22.32 0.10
3 居民服务业 Resident services 1572193 64.40 0.30
X 卫生,体育和社会福利事业 Health care, sports, and social welfare facilities 4101355 100.00 0.79
1 卫生事业 Health care 3945368 96.20 0.76
2 体育事业 Sports 53405 1.30 0.01
3 社会福利事业 Social welfare facilities 102582 2.50 0.02
XI 教育,文化艺术事业 Education, culture and arts 12382079 100.00 2.37
1 教育事业 Education 11284817 91.14 2.16
2 文化艺术事业 Culture and arts 1097262 8.86 0.21
XII 科学研究和综合技术服务 Scientific research and polytechnic services 1202272 100.00 0.23
1 科学研究 Scientific research 988837 82.25 0.19
2 综合技术服务事业 Polytechnic services 213435 17.75 0.04
XIII 金融,保险业 Finance and insurance 1022975 100.00 0.20
1 金融业 Finance 1011653 98.89 0.19
2 保险业 Insurance 11322 1.11 0.00
XIV 国家机关,政党和群众团体 Government agencies, Party agencies, and
social organizations
8018546 100.00 1.54
1 国家机关 Government agencies 6051618 75.47 1.16
2 政党机关 Party agencies 419238 5.23 0.08
3 群众团体 Social organizations 339088 4.23 0.07
4 企业管理机关 Enterprise administrative agencies 1208602 15.07 0.23
XV 其他行业 Others 289202 0.06
其他行业 Others 289202 0.06
This appendix presents the classification system in use in the 1982 population census. Source: Population Census 1982, pp. 440, 444.

50
Appendix 2 Sectoral Classification System GB/T4754-1984 with Population Census 1990 Employment Values
Changes from pre-1984 classification
Employment 1990
Share of subgroup
(in %)
Share of total (in %)
Changes in GB1994
Total 647244706 100.00 I 农,林,牧,渔,水利业 Agriculture and water conservancy 467593223 100.00 72.24
1 农业 Farming 458158168 97.98 70.79
2 林业 Forestry 1923440 0.41 0.30
3 畜牧业 Animal husbandry 3204832 0.69 0.50
4 渔业 Fisheries 2381572 0.51 0.37
new 5 水利业 Water conservancy 603082 0.13 0.09 relocated
new 6 农,林,牧,渔,
水利服务业
Agricultural (and water conservancy) services
1322129 0.28 0.20 dropped water
II 工业 Industry 86578757 100.00 13.38
1 煤炭采选业 Coal mining and dressing 5432001 6.27 0.84
2 石油和天然气开采
业
Petroleum and natural gas extraction 541316 0.63 0.08
newly disaggregated
3 黑色金属矿采选业 Ferrous metals mining and dressing 446528 0.52 0.07
newly disaggregated
4 有色金属矿采选业 Nonferrous metals mining and dressing
829008 0.96 0.13
relabeled? 5 建筑材料及其他非
金属矿采选业
Construction and other nonmetal minerals mining and dressing
1185680 1.37 0.18 relabeled
newly disaggregated
6 采盐业 Salt mining 277520 0.32 0.04 dropped
new 7 其他矿采选业 Other minerals mining and dressing 1570 0.00 0.00
8 木材及竹材采运业 Logging and transport of timber, bamboo
861004 0.99 0.13
9 自来水生产和供应
业
Production and supply of tap water 353872 0.41 0.05 relocated
10 食品制造业 Food manufacturing 4599086 5.31 0.71 newly disaggregated
11 饮料制造业 Beverage manufacturing 1466453 1.69 0.23
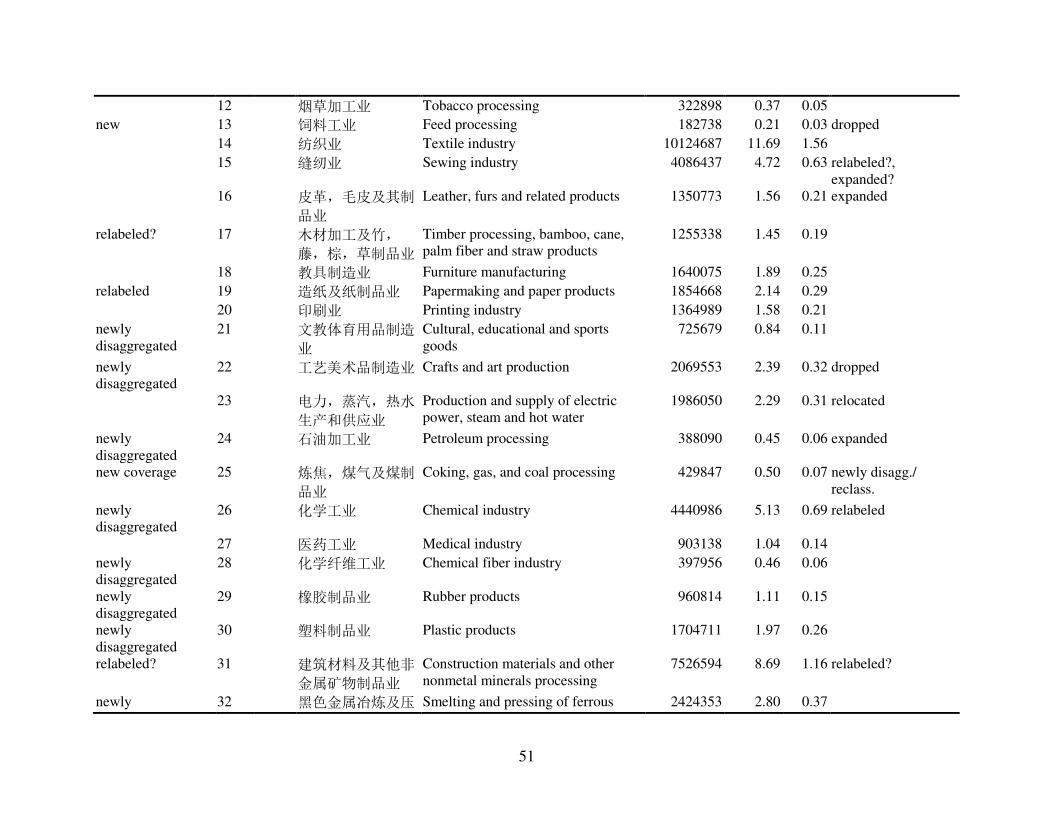
51
12 烟草加工业 Tobacco processing 322898 0.37 0.05
new 13 饲料工业 Feed processing 182738 0.21 0.03 dropped
14 纺织业 Textile industry 10124687 11.69 1.56
15 缝纫业 Sewing industry 4086437 4.72 0.63 relabeled?, expanded?
16 皮革,毛皮及其制
品业
Leather, furs and related products 1350773 1.56 0.21 expanded
relabeled? 17 木材加工及竹,
藤,棕,草制品业
Timber processing, bamboo, cane, palm fiber and straw products
1255338 1.45 0.19
18 教具制造业 Furniture manufacturing 1640075 1.89 0.25
relabeled 19 造纸及纸制品业 Papermaking and paper products 1854668 2.14 0.29
20 印刷业 Printing industry 1364989 1.58 0.21
newly disaggregated
21 文教体育用品制造
业
Cultural, educational and sports goods
725679 0.84 0.11
newly disaggregated
22 工艺美术品制造业 Crafts and art production 2069553 2.39 0.32 dropped
23 电力,蒸汽,热水
生产和供应业
Production and supply of electric power, steam and hot water
1986050 2.29 0.31 relocated
newly disaggregated
24 石油加工业 Petroleum processing 388090 0.45 0.06 expanded
new coverage 25 炼焦,煤气及煤制
品业
Coking, gas, and coal processing 429847 0.50 0.07 newly disagg./ reclass.
newly disaggregated
26 化学工业 Chemical industry 4440986 5.13 0.69 relabeled
27 医药工业 Medical industry 903138 1.04 0.14
newly disaggregated
28 化学纤维工业 Chemical fiber industry 397956 0.46 0.06
newly disaggregated
29 橡胶制品业 Rubber products 960814 1.11 0.15
newly disaggregated
30 塑料制品业 Plastic products 1704711 1.97 0.26
relabeled? 31 建筑材料及其他非
金属矿物制品业
Construction materials and other nonmetal minerals processing
7526594 8.69 1.16 relabeled?
newly 32 黑色金属冶炼及压 Smelting and pressing of ferrous 2424353 2.80 0.37
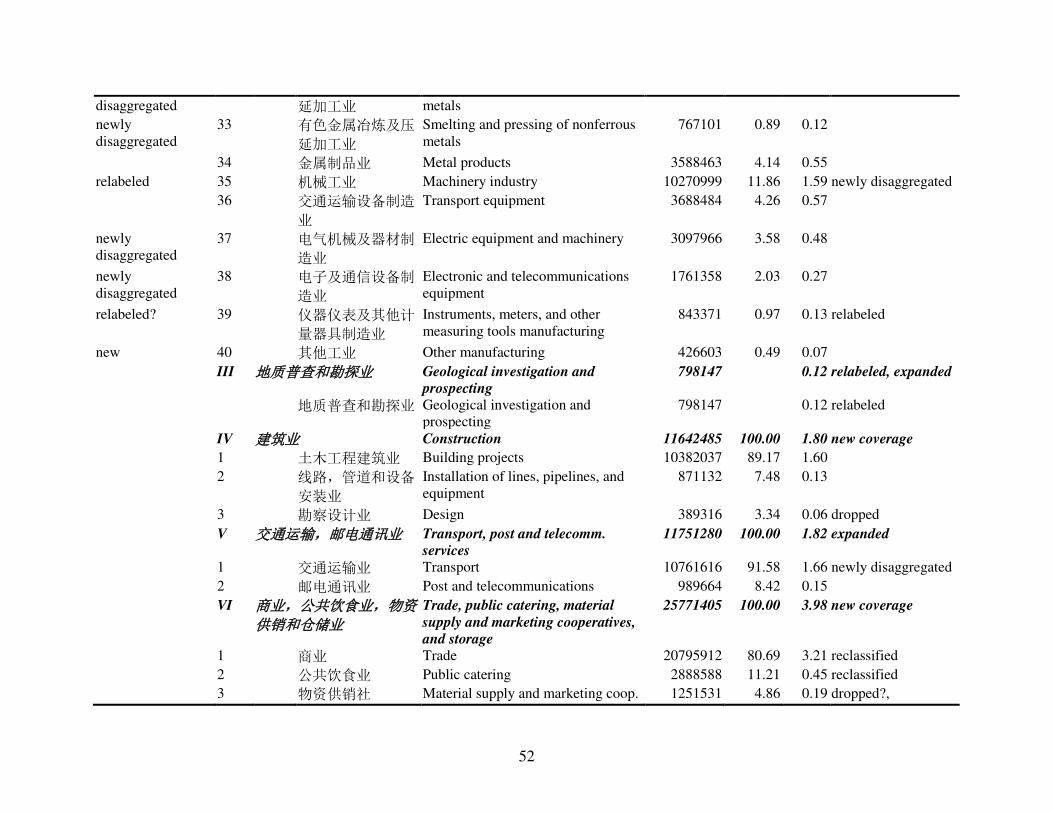
52
disaggregated 延加工业 metals
newly disaggregated
33 有色金属冶炼及压
延加工业
Smelting and pressing of nonferrous metals
767101 0.89 0.12
34 金属制品业 Metal products 3588463 4.14 0.55
relabeled 35 机械工业 Machinery industry 10270999 11.86 1.59 newly disaggregated
36 交通运输设备制造
业
Transport equipment 3688484 4.26 0.57
newly disaggregated
37 电气机械及器材制
造业
Electric equipment and machinery 3097966 3.58 0.48
newly disaggregated
38 电子及通信设备制
造业
Electronic and telecommunications equipment
1761358 2.03 0.27
relabeled? 39 仪器仪表及其他计
量器具制造业
Instruments, meters, and other measuring tools manufacturing
843371 0.97 0.13 relabeled
new 40 其他工业 Other manufacturing 426603 0.49 0.07
III 地质普查和勘探业 Geological investigation and
prospecting
798147 0.12 relabeled, expanded
地质普查和勘探业 Geological investigation and prospecting
798147 0.12 relabeled
IV 建筑业 Construction 11642485 100.00 1.80 new coverage
1 土木工程建筑业 Building projects 10382037 89.17 1.60
2 线路,管道和设备
安装业
Installation of lines, pipelines, and equipment
871132 7.48 0.13
3 勘察设计业 Design 389316 3.34 0.06 dropped
V 交通运输,邮电通讯业 Transport, post and telecomm.
services
11751280 100.00 1.82 expanded
1 交通运输业 Transport 10761616 91.58 1.66 newly disaggregated
2 邮电通讯业 Post and telecommunications 989664 8.42 0.15
VI 商业,公共饮食业,物资供销和仓储业
Trade, public catering, material
supply and marketing cooperatives,
and storage
25771405 100.00 3.98 new coverage
1 商业 Trade 20795912 80.69 3.21 reclassified
2 公共饮食业 Public catering 2888588 11.21 0.45 reclassified
3 物资供销社 Material supply and marketing coop. 1251531 4.86 0.19 dropped?,
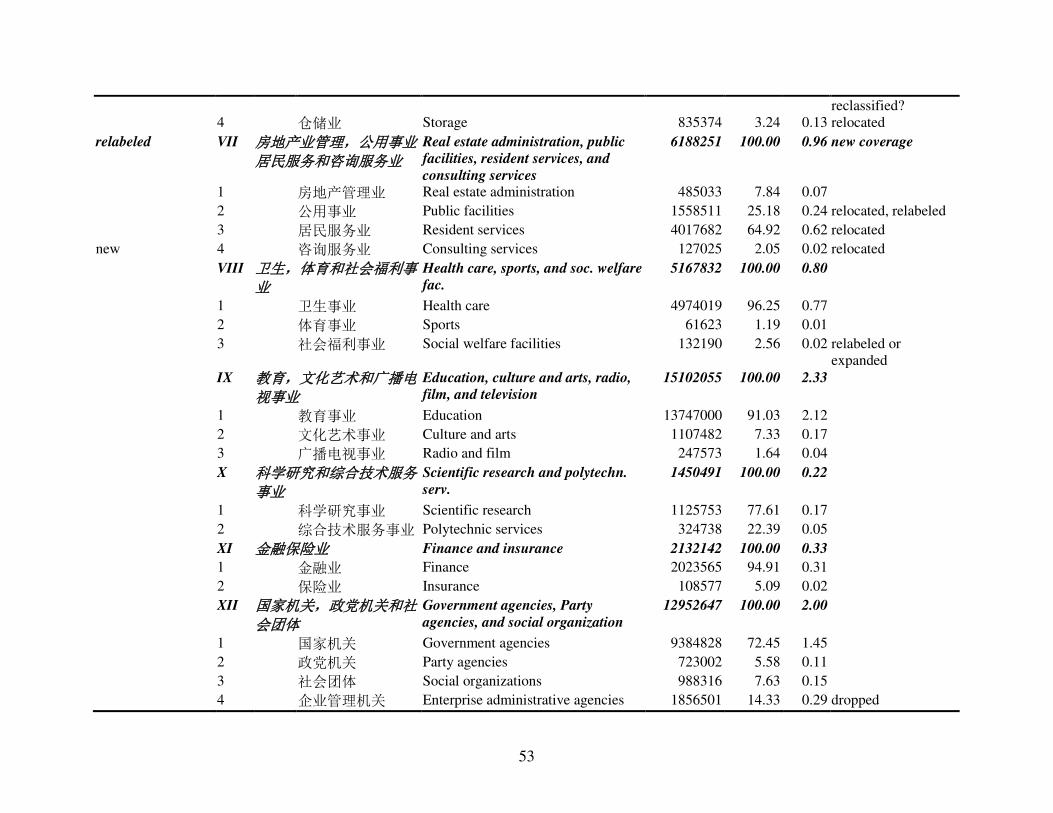
53
reclassified? 4 仓储业 Storage 835374 3.24 0.13 relocated
relabeled VII 房地产业管理,公用事业居民服务和咨询服务业
Real estate administration, public
facilities, resident services, and
consulting services
6188251 100.00 0.96 new coverage
1 房地产管理业 Real estate administration 485033 7.84 0.07
2 公用事业 Public facilities 1558511 25.18 0.24 relocated, relabeled
3 居民服务业 Resident services 4017682 64.92 0.62 relocated
new 4 咨询服务业 Consulting services 127025 2.05 0.02 relocated
VIII 卫生,体育和社会福利事业
Health care, sports, and soc. welfare
fac.
5167832 100.00 0.80
1 卫生事业 Health care 4974019 96.25 0.77
2 体育事业 Sports 61623 1.19 0.01
3 社会福利事业 Social welfare facilities 132190 2.56 0.02 relabeled or expanded
IX 教育,文化艺术和广播电视事业
Education, culture and arts, radio,
film, and television
15102055 100.00 2.33
1 教育事业 Education 13747000 91.03 2.12
2 文化艺术事业 Culture and arts 1107482 7.33 0.17
3 广播电视事业 Radio and film 247573 1.64 0.04
X 科学研究和综合技术服务事业
Scientific research and polytechn.
serv.
1450491 100.00 0.22
1 科学研究事业 Scientific research 1125753 77.61 0.17
2 综合技术服务事业 Polytechnic services 324738 22.39 0.05
XI 金融保险业 Finance and insurance 2132142 100.00 0.33
1 金融业 Finance 2023565 94.91 0.31
2 保险业 Insurance 108577 5.09 0.02
XII 国家机关,政党机关和社会团体
Government agencies, Party
agencies, and social organization
12952647 100.00 2.00
1 国家机关 Government agencies 9384828 72.45 1.45
2 政党机关 Party agencies 723002 5.58 0.11
3 社会团体 Social organizations 988316 7.63 0.15
4 企业管理机关 Enterprise administrative agencies 1856501 14.33 0.29 dropped

54
XIII 其他行业 Others 115991 0.02
其他行业 Others 115991 0.02
Sources: NBS (1988), pp. 623-702, for classification; Population Census 1990, Vol. 2, pp. 296-339 (with embedded identical classification).

55
Appendix 3 Sectoral Classification System GB/T4754-1994 with Population Census 2000 Employment Values
Changes from GB1984
Long-form employ-
ment 2000
Share of subgroup
(in %)
Share of total (in %)
Changes in GB2002
Total 66874889 100.00 new coverage I 农,林,牧,渔业 Agriculture 43051661 100.00 64.38
1 农业 Farming 41224929 95.76 61.64
2 林业 Forestry 157140 0.37 0.23
3 畜牧业 Animal husbandry 1189778 2.76 1.78
4 渔业 Fisheries 336224 0.78 0.50
5 农,林,牧,渔服务
业
Agricultural services 143590 0.33 0.21
II 采掘业 Mining and quarrying 697862 100.00 1.04
6 煤炭采选业 Coal mining and dressing 378844 54.29 0.57 relabeled
7 石油和天然气开采业 Petroleum and natural gas extraction 50104 7.18 0.07
8 黑色金属矿采选业 Ferrous metals mining and dressing 41443 5.94 0.06
9 有色金属矿采选业 Nonferrous metals mining and dressing 67155 9.62 0.10
relabeled 10 非金属矿采选业 Nonmetal minerals mining and dressing 126882 18.18 0.19
11 其他矿采选业 Other minerals mining and dressing 5781 0.83 0.01 relabeled
12 木材及竹材采运业 Logging and transp. of timber and bamboo 27653 3.96 0.04 into agriculture
III 制造业 Manufacturing 8333044 100.00 12.46
newly disaggregated 13 食品加工业 Food processing 397453 4.77 0.59 reclassified
newly disaggregated 14 食品制造业 Food manufacturing 226006 2.71 0.34
15 饮料制造业 Beverage manufacturing 134691 1.62 0.20
16 烟草加工业 Tobacco processing 34126 0.41 0.05
17 纺织业 Textile industry 806700 9.68 1.21 subcategory to agric.
relabeled?, expanded?
18 服装及其他纤维制品
制造业
Garments and other fiber products 747232 8.97 1.12 expanded/ relabeled?
expanded 19 皮革,毛皮,羽绒及
其制品业
Leather, furs, down and related products 296565 3.56 0.44 relabeled
20 木材加工及竹,藤,
棕,草制品业
Timber processing, bamboo, cane, palm fiber and straw products
229120 2.75 0.34
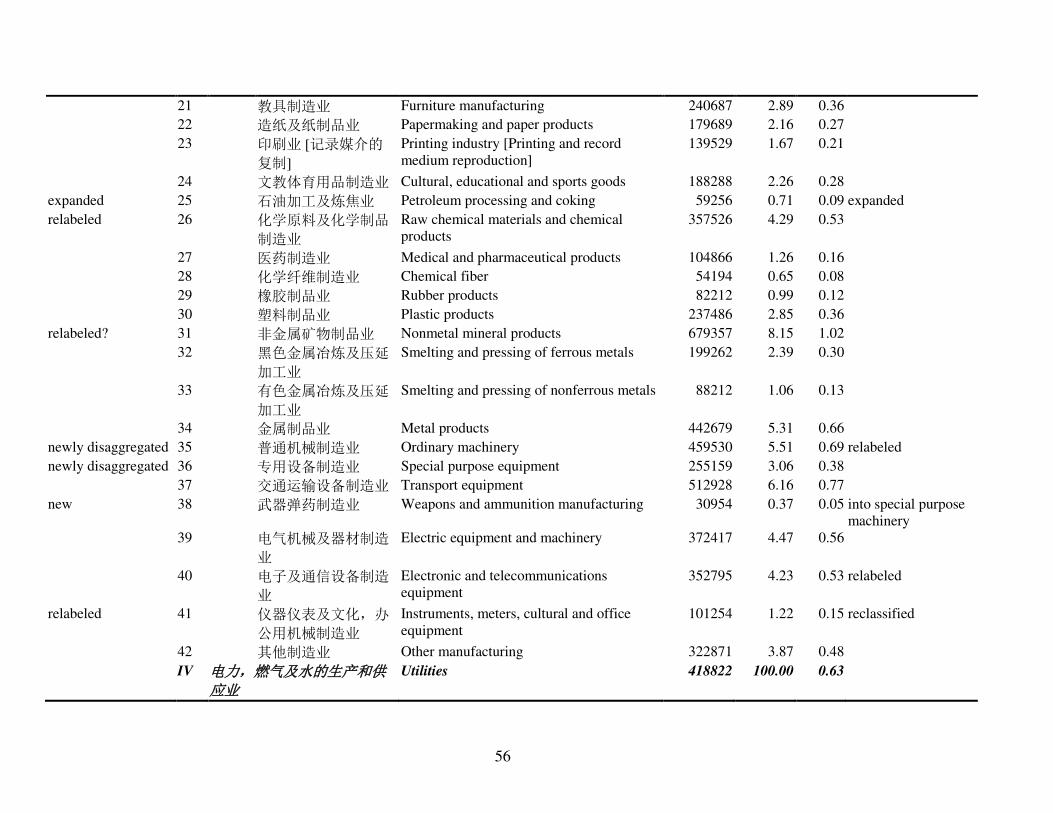
56
21 教具制造业 Furniture manufacturing 240687 2.89 0.36
22 造纸及纸制品业 Papermaking and paper products 179689 2.16 0.27
23 印刷业 [记录媒介的
复制]
Printing industry [Printing and record medium reproduction]
139529 1.67 0.21
24 文教体育用品制造业 Cultural, educational and sports goods 188288 2.26 0.28
expanded 25 石油加工及炼焦业 Petroleum processing and coking 59256 0.71 0.09 expanded
relabeled 26 化学原料及化学制品
制造业
Raw chemical materials and chemical products
357526 4.29 0.53
27 医药制造业 Medical and pharmaceutical products 104866 1.26 0.16
28 化学纤维制造业 Chemical fiber 54194 0.65 0.08
29 橡胶制品业 Rubber products 82212 0.99 0.12
30 塑料制品业 Plastic products 237486 2.85 0.36
relabeled? 31 非金属矿物制品业 Nonmetal mineral products 679357 8.15 1.02
32 黑色金属冶炼及压延
加工业
Smelting and pressing of ferrous metals 199262 2.39 0.30
33 有色金属冶炼及压延
加工业
Smelting and pressing of nonferrous metals 88212 1.06 0.13
34 金属制品业 Metal products 442679 5.31 0.66
newly disaggregated 35 普通机械制造业 Ordinary machinery 459530 5.51 0.69 relabeled
newly disaggregated 36 专用设备制造业 Special purpose equipment 255159 3.06 0.38
37 交通运输设备制造业 Transport equipment 512928 6.16 0.77
new 38 武器弹药制造业 Weapons and ammunition manufacturing 30954 0.37 0.05 into special purpose machinery
39 电气机械及器材制造
业
Electric equipment and machinery 372417 4.47 0.56
40 电子及通信设备制造
业
Electronic and telecommunications equipment
352795 4.23 0.53 relabeled
relabeled 41 仪器仪表及文化,办
公用机械制造业
Instruments, meters, cultural and office equipment
101254 1.22 0.15 reclassified
42 其他制造业 Other manufacturing 322871 3.87 0.48
IV 电力,燃气及水的生产和供应业
Utilities 418822 100.00 0.63
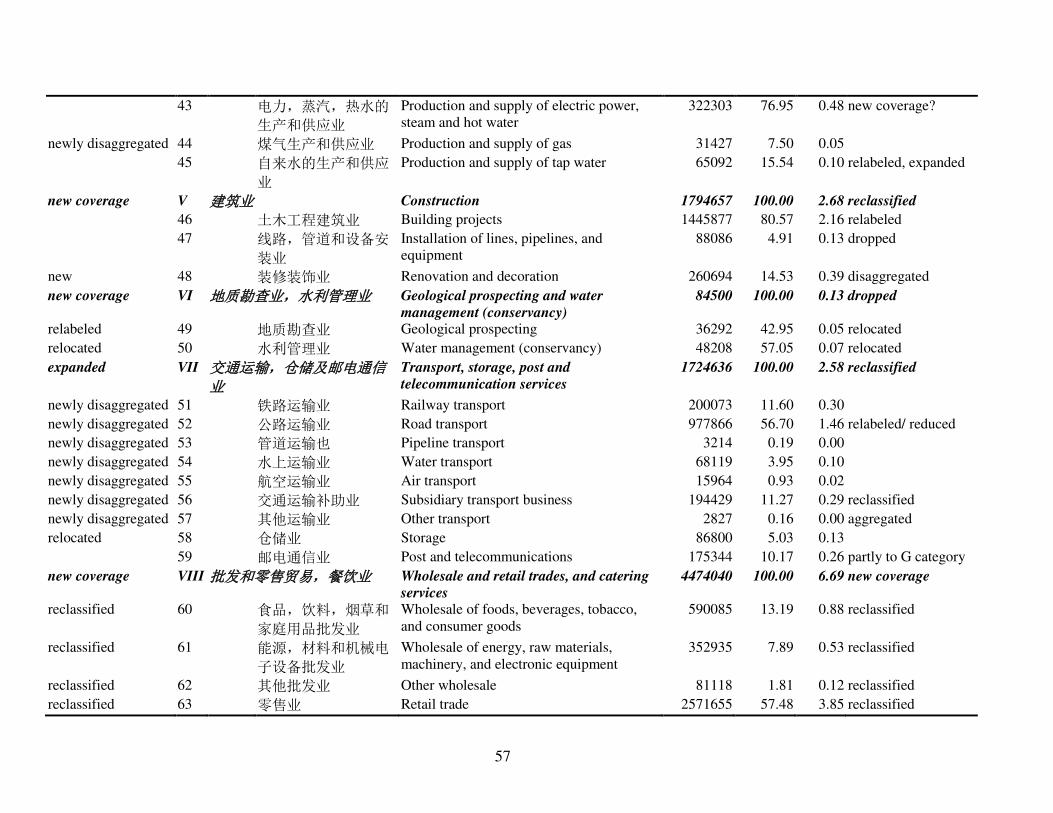
57
43 电力,蒸汽,热水的
生产和供应业
Production and supply of electric power, steam and hot water
322303 76.95 0.48 new coverage?
newly disaggregated 44 煤气生产和供应业 Production and supply of gas 31427 7.50 0.05
45 自来水的生产和供应
业
Production and supply of tap water 65092 15.54 0.10 relabeled, expanded
new coverage V 建筑业 Construction 1794657 100.00 2.68 reclassified
46 土木工程建筑业 Building projects 1445877 80.57 2.16 relabeled
47 线路,管道和设备安
装业
Installation of lines, pipelines, and equipment
88086 4.91 0.13 dropped
new 48 装修装饰业 Renovation and decoration 260694 14.53 0.39 disaggregated
new coverage VI 地质勘查业,水利管理业 Geological prospecting and water
management (conservancy)
84500 100.00 0.13 dropped
relabeled 49 地质勘查业 Geological prospecting 36292 42.95 0.05 relocated
relocated 50 水利管理业 Water management (conservancy) 48208 57.05 0.07 relocated
expanded VII 交通运输,仓储及邮电通信业
Transport, storage, post and
telecommunication services
1724636 100.00 2.58 reclassified
newly disaggregated 51 铁路运输业 Railway transport 200073 11.60 0.30
newly disaggregated 52 公路运输业 Road transport 977866 56.70 1.46 relabeled/ reduced
newly disaggregated 53 管道运输也 Pipeline transport 3214 0.19 0.00
newly disaggregated 54 水上运输业 Water transport 68119 3.95 0.10
newly disaggregated 55 航空运输业 Air transport 15964 0.93 0.02
newly disaggregated 56 交通运输补助业 Subsidiary transport business 194429 11.27 0.29 reclassified
newly disaggregated 57 其他运输业 Other transport 2827 0.16 0.00 aggregated
relocated 58 仓储业 Storage 86800 5.03 0.13
59 邮电通信业 Post and telecommunications 175344 10.17 0.26 partly to G category
new coverage VIII 批发和零售贸易,餐饮业 Wholesale and retail trades, and catering
services
4474040 100.00 6.69 new coverage
reclassified 60 食品,饮料,烟草和
家庭用品批发业
Wholesale of foods, beverages, tobacco, and consumer goods
590085 13.19 0.88 reclassified
reclassified 61 能源,材料和机械电
子设备批发业
Wholesale of energy, raw materials, machinery, and electronic equipment
352935 7.89 0.53 reclassified
reclassified 62 其他批发业 Other wholesale 81118 1.81 0.12 reclassified
reclassified 63 零售业 Retail trade 2571655 57.48 3.85 reclassified
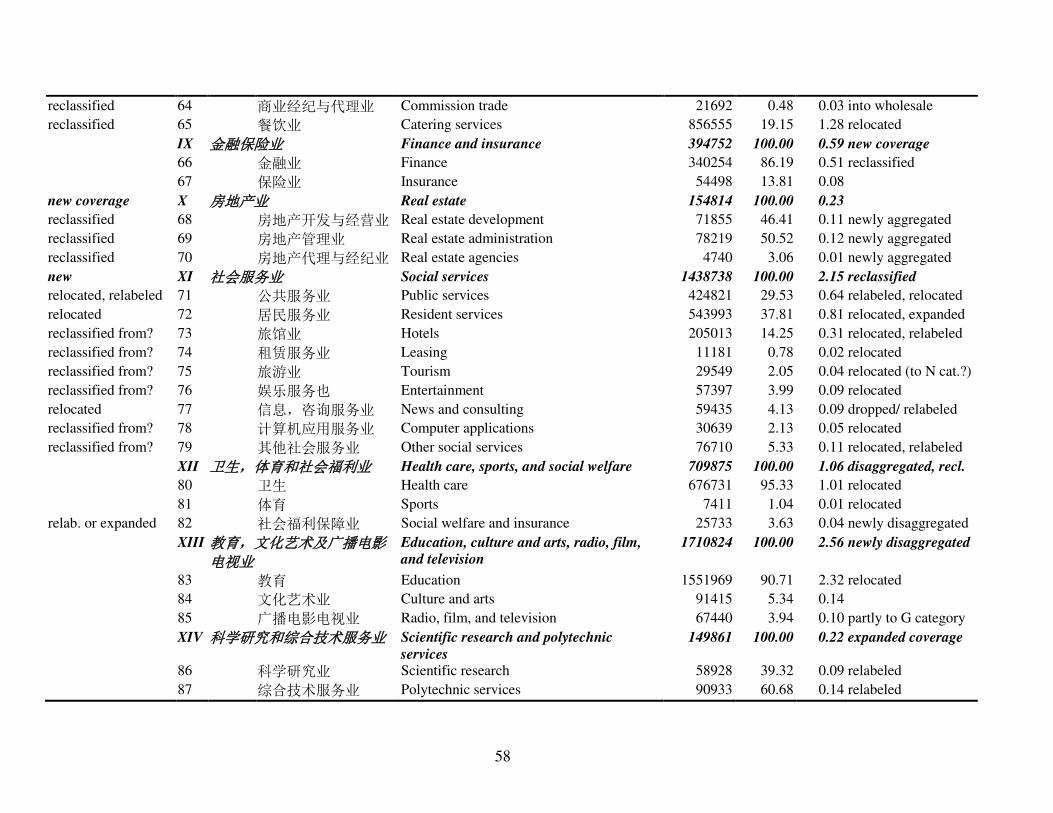
58
reclassified 64 商业经纪与代理业 Commission trade 21692 0.48 0.03 into wholesale
reclassified 65 餐饮业 Catering services 856555 19.15 1.28 relocated
IX 金融保险业 Finance and insurance 394752 100.00 0.59 new coverage
66 金融业 Finance 340254 86.19 0.51 reclassified
67 保险业 Insurance 54498 13.81 0.08
new coverage X 房地产业 Real estate 154814 100.00 0.23
reclassified 68 房地产开发与经营业 Real estate development 71855 46.41 0.11 newly aggregated
reclassified 69 房地产管理业 Real estate administration 78219 50.52 0.12 newly aggregated
reclassified 70 房地产代理与经纪业 Real estate agencies 4740 3.06 0.01 newly aggregated
new XI 社会服务业 Social services 1438738 100.00 2.15 reclassified
relocated, relabeled 71 公共服务业 Public services 424821 29.53 0.64 relabeled, relocated
relocated 72 居民服务业 Resident services 543993 37.81 0.81 relocated, expanded
reclassified from? 73 旅馆业 Hotels 205013 14.25 0.31 relocated, relabeled
reclassified from? 74 租赁服务业 Leasing 11181 0.78 0.02 relocated
reclassified from? 75 旅游业 Tourism 29549 2.05 0.04 relocated (to N cat.?)
reclassified from? 76 娱乐服务也 Entertainment 57397 3.99 0.09 relocated
relocated 77 信息,咨询服务业 News and consulting 59435 4.13 0.09 dropped/ relabeled
reclassified from? 78 计算机应用服务业 Computer applications 30639 2.13 0.05 relocated
reclassified from? 79 其他社会服务业 Other social services 76710 5.33 0.11 relocated, relabeled
XII 卫生,体育和社会福利业 Health care, sports, and social welfare 709875 100.00 1.06 disaggregated, recl.
80 卫生 Health care 676731 95.33 1.01 relocated
81 体育 Sports 7411 1.04 0.01 relocated
relab. or expanded 82 社会福利保障业 Social welfare and insurance 25733 3.63 0.04 newly disaggregated
XIII 教育,文化艺术及广播电影电视业
Education, culture and arts, radio, film,
and television
1710824 100.00 2.56 newly disaggregated
83 教育 Education 1551969 90.71 2.32 relocated
84 文化艺术业 Culture and arts 91415 5.34 0.14
85 广播电影电视业 Radio, film, and television 67440 3.94 0.10 partly to G category
XIV 科学研究和综合技术服务业 Scientific research and polytechnic
services
149861 100.00 0.22 expanded coverage
86 科学研究业 Scientific research 58928 39.32 0.09 relabeled
87 综合技术服务业 Polytechnic services 90933 60.68 0.14 relabeled

59
XV 国家机关,党政机关和社会团体
Government agencies, Party agencies, and
social organization
1572764 100.00 2.35 relabeled
88 国家机关 Government agencies 1220264 77.59 1.82
89 政党机关 Party agencies 74782 4.75 0.11 newly disaggregated
90 社会团体 Social organizations 36971 2.35 0.06 relabeled
new 91 基层群众自治组织 Autonomous grassroots organizations 240747 15.31 0.36
XVI 其他行业 Others 164039 0.25 dropped
92 其他行业 Others 164039 0.25 dropped
This appendix presents the classification system in use in the long-form employment survey conducted as part of the 2000 population census. Item 23, terms in [] are from the industry section of the Statistical Yearbook. English language titles are in part from the industry section and from the NIPA section of the Statistical Yearbook. The economy-wide number of laborers (rather than only the long-form number of laborers) can be obtained by multiplying by the ratio of the total population to the number of persons who filled in the long form (1,242,612,226 / 118,067,424). Source: Population Census 2000, Vol. 2, pp. 881-934; with population values from Vol. 1, p. 215 and Vol. 2, p. 800; employment values are available only from the “long-form” survey of a subset of the total population. A category-by-category description of the main changes between GB1994 and GB2002 is provided in the first seven issues of the magazine Zhongguo tongji of 2003.
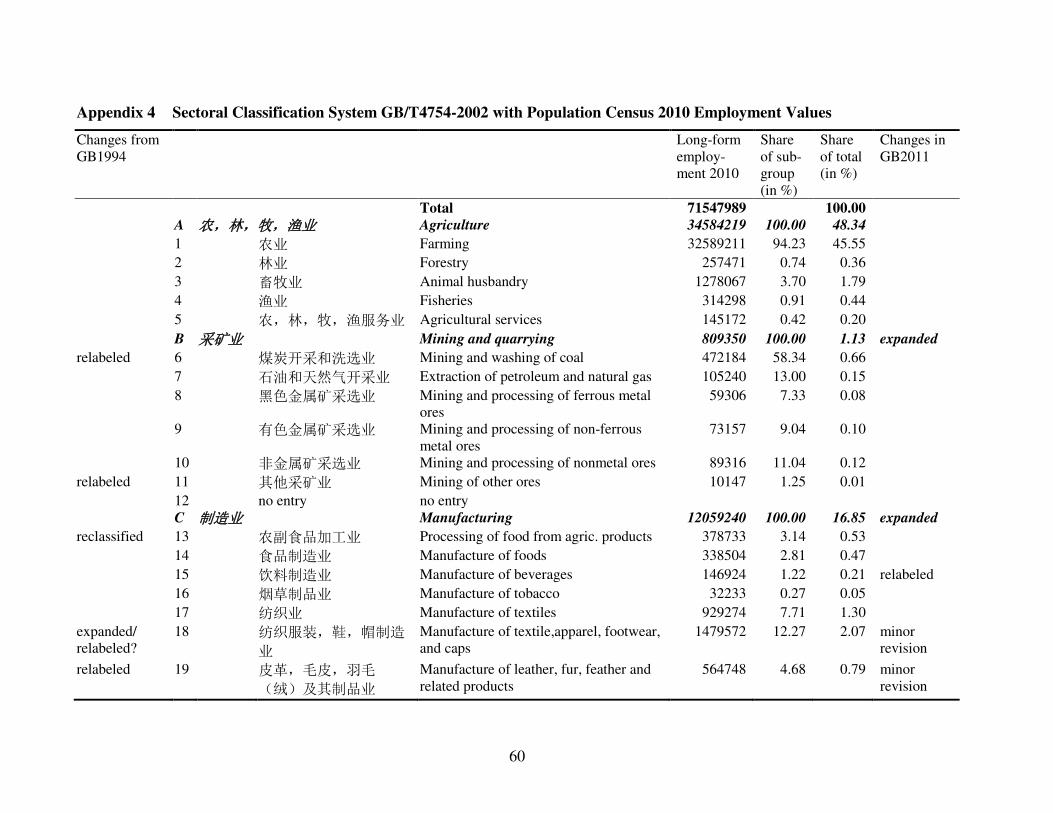
60
Appendix 4 Sectoral Classification System GB/T4754-2002 with Population Census 2010 Employment Values
Changes from GB1994
Long-form employ-ment 2010
Share of sub-group (in %)
Share of total (in %)
Changes in GB2011
Total 71547989 100.00
A 农,林,牧,渔业 Agriculture 34584219 100.00 48.34
1 农业 Farming 32589211 94.23 45.55
2 林业 Forestry 257471 0.74 0.36
3 畜牧业 Animal husbandry 1278067 3.70 1.79
4 渔业 Fisheries 314298 0.91 0.44
5 农,林,牧,渔服务业 Agricultural services 145172 0.42 0.20
B 采矿业 Mining and quarrying 809350 100.00 1.13 expanded
relabeled 6 煤炭开采和洗选业 Mining and washing of coal 472184 58.34 0.66
7 石油和天然气开采业 Extraction of petroleum and natural gas 105240 13.00 0.15
8 黑色金属矿采选业 Mining and processing of ferrous metal ores
59306 7.33 0.08
9 有色金属矿采选业 Mining and processing of non-ferrous metal ores
73157 9.04 0.10
10 非金属矿采选业 Mining and processing of nonmetal ores 89316 11.04 0.12
relabeled 11 其他采矿业 Mining of other ores 10147 1.25 0.01
12 no entry no entry C 制造业 Manufacturing 12059240 100.00 16.85 expanded
reclassified 13 农副食品加工业 Processing of food from agric. products 378733 3.14 0.53
14 食品制造业 Manufacture of foods 338504 2.81 0.47
15 饮料制造业 Manufacture of beverages 146924 1.22 0.21 relabeled
16 烟草制品业 Manufacture of tobacco 32233 0.27 0.05
17 纺织业 Manufacture of textiles 929274 7.71 1.30
expanded/ relabeled?
18 纺织服装,鞋,帽制造
业
Manufacture of textile,apparel, footwear, and caps
1479572 12.27 2.07 minor revision
relabeled 19 皮革,毛皮,羽毛
(绒)及其制品业
Manufacture of leather, fur, feather and related products
564748 4.68 0.79 minor revision
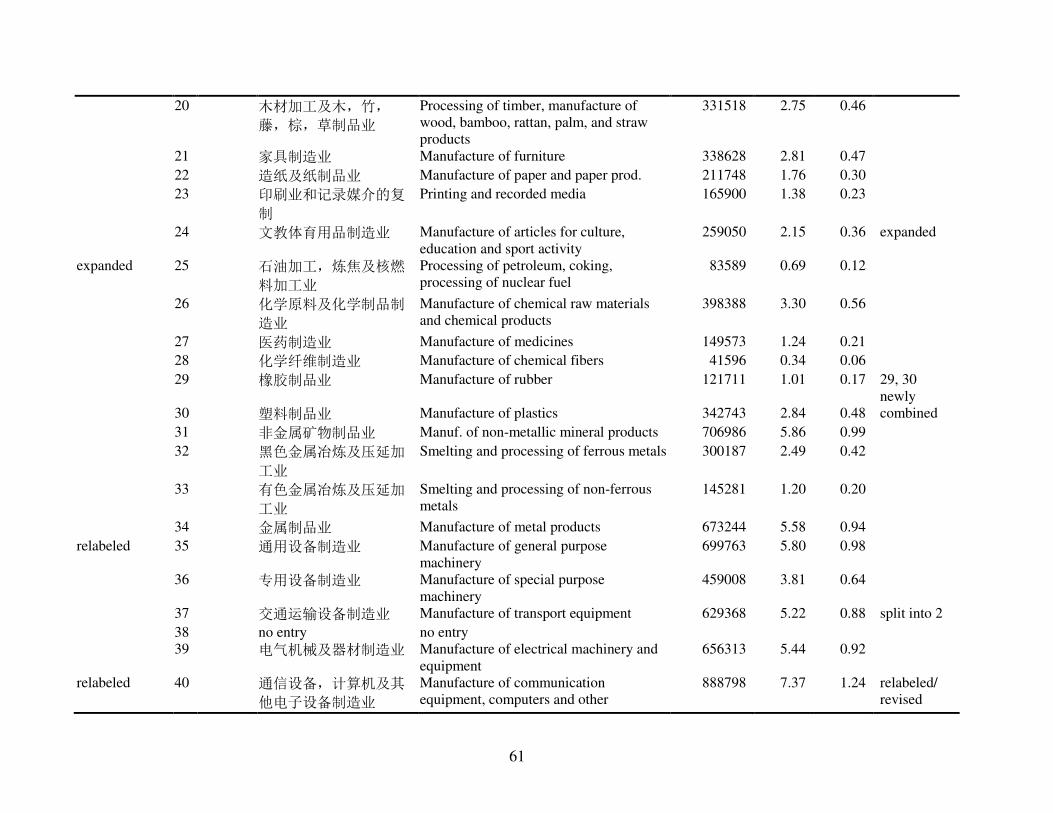
61
20 木材加工及木,竹,
藤,棕,草制品业
Processing of timber, manufacture of wood, bamboo, rattan, palm, and straw products
331518 2.75 0.46
21 家具制造业 Manufacture of furniture 338628 2.81 0.47
22 造纸及纸制品业 Manufacture of paper and paper prod. 211748 1.76 0.30
23 印刷业和记录媒介的复
制
Printing and recorded media 165900 1.38 0.23
24 文教体育用品制造业 Manufacture of articles for culture, education and sport activity
259050 2.15 0.36 expanded
expanded 25 石油加工,炼焦及核燃
料加工业
Processing of petroleum, coking, processing of nuclear fuel
83589 0.69 0.12
26 化学原料及化学制品制
造业
Manufacture of chemical raw materials and chemical products
398388 3.30 0.56
27 医药制造业 Manufacture of medicines 149573 1.24 0.21
28 化学纤维制造业 Manufacture of chemical fibers 41596 0.34 0.06
29 橡胶制品业 Manufacture of rubber 121711 1.01 0.17 29, 30 newly
30 塑料制品业 Manufacture of plastics 342743 2.84 0.48 combined
31 非金属矿物制品业 Manuf. of non-metallic mineral products 706986 5.86 0.99
32 黑色金属冶炼及压延加
工业
Smelting and processing of ferrous metals 300187 2.49 0.42
33 有色金属冶炼及压延加
工业
Smelting and processing of non-ferrous metals
145281 1.20 0.20
34 金属制品业 Manufacture of metal products 673244 5.58 0.94
relabeled 35 通用设备制造业 Manufacture of general purpose machinery
699763 5.80 0.98
36 专用设备制造业 Manufacture of special purpose machinery
459008 3.81 0.64
37 交通运输设备制造业 Manufacture of transport equipment 629368 5.22 0.88 split into 2
38 no entry no entry 39 电气机械及器材制造业 Manufacture of electrical machinery and
equipment 656313 5.44 0.92
relabeled 40 通信设备,计算机及其
他电子设备制造业
Manufacture of communication equipment, computers and other
888798 7.37 1.24 relabeled/ revised

62
electronic equipment reclassified 41 仪器仪表及文化,办公
用机械制造业
Manufacture of measuring instruments and machinery for cultural activity and office work
167201 1.39 0.23 only: measuring instrum.
expanded, relabeled
42 工艺品及其他制造业 Manufacture of artwork and other manufacturing
330012 2.74 0.46 -> into/to new 24, 41
new 43 废弃资源和废旧材料回
收加工业
Recycling and disposal of waste 88647 0.74 0.12 relabeled/ revised
D 电力,燃气及水的生产和供应业 Utilities 495991 100.00 0.69 relabeled
new coverage? 44 电力,热力的生产和供
应业
Production and distribution of electric power and heat power
373771 75.36 0.52
45 煤气生产和供应业 Production and distribution of gas 46714 9.42 0.07
relabeled, expanded
46 水的生产和供应业 Production and distribution of tap water 75506 15.22 0.11
E 建筑业 Construction 3919862 100.00 5.48
reclassified 47 房屋和土木工程建筑业 Construction of buildings, and civil engineering
2903099 74.06 4.06 2nd part as new categ.
newly disaggregated
48 建筑安装业 Renovation 223706 5.71 0.31
newly disaggregated
49 建筑装饰业 Decoration 715783 18.26 1.00
newly disaggregated
50 其他建筑业 Other construction 77274 1.97 0.11 folded into previous
reclassified F 交通运输,仓储和邮政业 Transport, storage, and postal services 2544704 100.00 3.56 51 铁路运输业 Railway transport 223215 8.77 0.31
relabeled/ reduced?
52 道路运输业 Road transport 1355227 53.26 1.89
from “public services”
53 城市公共交通业 Urban public transport 471165 18.52 0.66 -> into 52 (new 54)
54 水上运输业 Water transport 73118 2.87 0.10
55 航空运输业 Air transport 43768 1.72 0.06
56 管道运输业 Pipeline transport 4495 0.18 0.01
newly aggregated
57 装卸搬运和其他运输服
务业
Loading/unloading, removal, and other transport services
214563 8.43 0.30 relabeled

63
58 仓储业 Storage 71099 2.79 0.10
59 邮政业 Postal services 88054 3.46 0.12
new G 信息传输,计算机服务和软件业 Information transfer, computer services,
and software
439412 100.00 0.61 relabeled/
revised? new 60 电信和其他信息传输服
务业
Telecommunications and other information transfer services
274219 62.41 0.38 relabeled/ revised
relocated 61 计算机服务业 Computer services 72086 16.41 0.10 omitted
new 62 软件业 Software 93107 21.19 0.13 expansion
new coverage H 批发和零售业 Wholesale and retail trades 6656937 100.00 9.30 reclassified 63 批发业 Wholesale trade 1341148 20.15 1.87
not listed 64 reclassified 65 零售业 Retail trade 5315789 79.85 7.43
new I 住宿和餐饮业 Accommodation and catering 1953185 100.00 2.73 relocated, relabeled
66 住宿业 Accommodation 321228 16.45 0.45
relocated 67 餐饮业 Catering 1631957 83.55 2.28
new coverage J 金融业 Finance 581162 100.00 0.81
reclassified 68 银行业 Banking 340234 58.54 0.48 relabeled
reclassified 69 证券业 Securities 34156 5.88 0.05 relabeled
70 保险业 Insurance 159718 27.48 0.22
reclassified 71 其他金融活动 Other financial activities 47054 8.10 0.07
new coverage K 房地产业 Real estate 481021 100.00 0.67 newly aggregated
72 房地产业 Real estate 481021 100.00 0.67
new L 租赁和商务服务业 Leasing and commercial services 491322 100.00 0.69 relocated 73 租赁业 Leasing 39510 8.04 0.06
new 74 商务服务业 Commercial services 451812 91.96 0.63
expanded
coverage
M 科学研究,技术服务和地质勘查业
Scientific research, polytechnic services,
and geological prospecting
229615 100.00 0.32 reduced
relabeled 75 研究与实验发展 Research and experimental development 65755 28.64 0.09
relabeled 76 专业技术服务业 Polytechnic services 111617 48.61 0.16
new 77 科技交流和推广服务业 Scientific exchange and distribution 21665 9.44 0.03 relabeled
relocated 78 地质勘查业 Geological prospecting 30578 13.32 0.04 into new 74
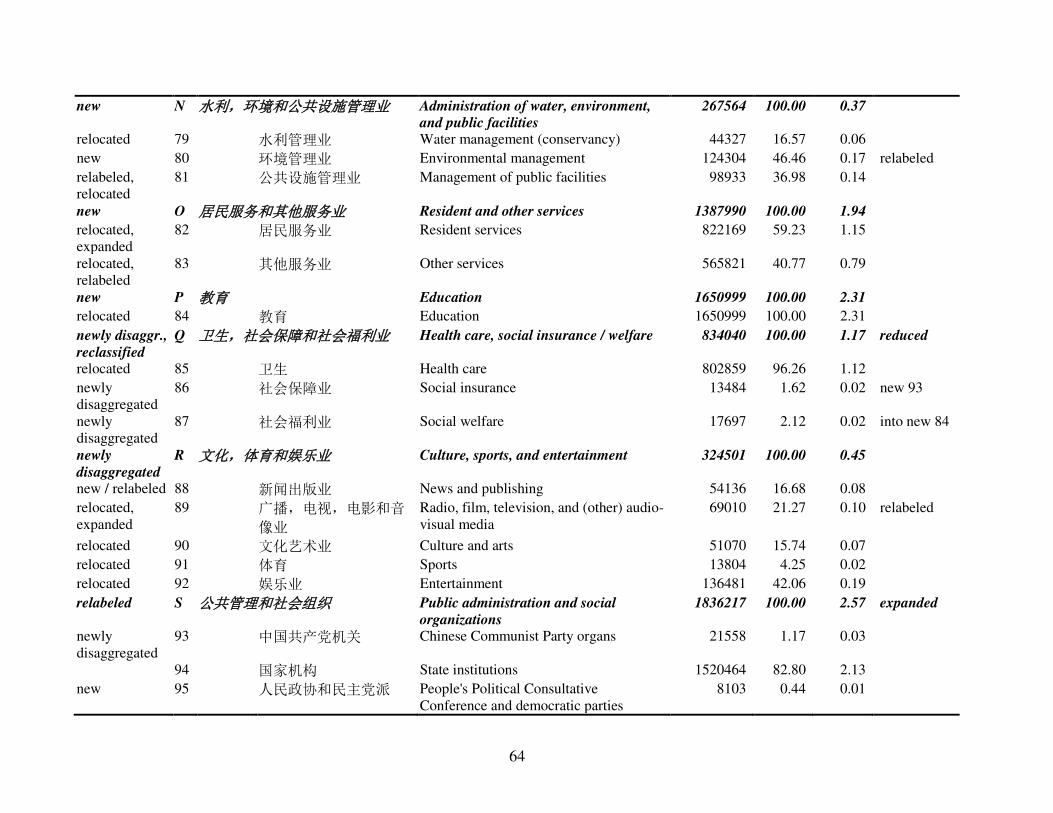
64
new N 水利,环境和公共设施管理业 Administration of water, environment,
and public facilities
267564 100.00 0.37
relocated 79 水利管理业 Water management (conservancy) 44327 16.57 0.06
new 80 环境管理业 Environmental management 124304 46.46 0.17 relabeled
relabeled, relocated
81 公共设施管理业 Management of public facilities 98933 36.98 0.14
new O 居民服务和其他服务业 Resident and other services 1387990 100.00 1.94
relocated, expanded
82 居民服务业 Resident services 822169 59.23 1.15
relocated, relabeled
83 其他服务业 Other services 565821 40.77 0.79
new P 教育 Education 1650999 100.00 2.31
relocated 84 教育 Education 1650999 100.00 2.31
newly disaggr.,
reclassified
Q 卫生,社会保障和社会福利业 Health care, social insurance / welfare 834040 100.00 1.17 reduced
relocated 85 卫生 Health care 802859 96.26 1.12
newly disaggregated
86 社会保障业 Social insurance 13484 1.62 0.02 new 93
newly disaggregated
87 社会福利业 Social welfare 17697 2.12 0.02 into new 84
newly
disaggregated
R 文化,体育和娱乐业 Culture, sports, and entertainment 324501 100.00 0.45
new / relabeled 88 新闻出版业 News and publishing 54136 16.68 0.08
relocated, expanded
89 广播,电视,电影和音
像业
Radio, film, television, and (other) audio-visual media
69010 21.27 0.10 relabeled
relocated 90 文化艺术业 Culture and arts 51070 15.74 0.07
relocated 91 体育 Sports 13804 4.25 0.02
relocated 92 娱乐业 Entertainment 136481 42.06 0.19
relabeled S 公共管理和社会组织 Public administration and social
organizations
1836217 100.00 2.57 expanded
newly disaggregated
93 中国共产党机关 Chinese Communist Party organs 21558 1.17 0.03
94 国家机构 State institutions 1520464 82.80 2.13
new 95 人民政协和民主党派 People's Political Consultative Conference and democratic parties
8103 0.44 0.01
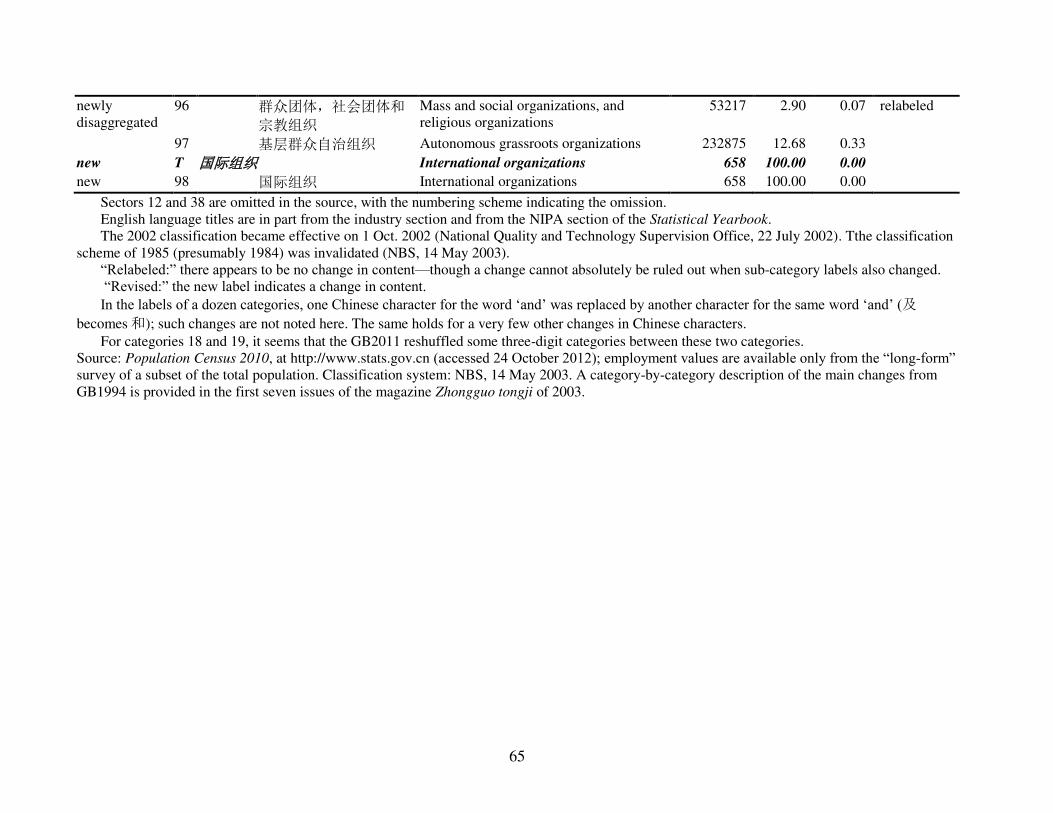
65
newly disaggregated
96 群众团体,社会团体和
宗教组织
Mass and social organizations, and religious organizations
53217 2.90 0.07 relabeled
97 基层群众自治组织 Autonomous grassroots organizations 232875 12.68 0.33
new T 国际组织 International organizations 658 100.00 0.00 new 98 国际组织 International organizations 658 100.00 0.00
Sectors 12 and 38 are omitted in the source, with the numbering scheme indicating the omission. English language titles are in part from the industry section and from the NIPA section of the Statistical Yearbook. The 2002 classification became effective on 1 Oct. 2002 (National Quality and Technology Supervision Office, 22 July 2002). Tthe classification scheme of 1985 (presumably 1984) was invalidated (NBS, 14 May 2003). “Relabeled:” there appears to be no change in content—though a change cannot absolutely be ruled out when sub-category labels also changed. “Revised:” the new label indicates a change in content. In the labels of a dozen categories, one Chinese character for the word ‘and’ was replaced by another character for the same word ‘and’ (及becomes 和); such changes are not noted here. The same holds for a very few other changes in Chinese characters.
For categories 18 and 19, it seems that the GB2011 reshuffled some three-digit categories between these two categories. Source: Population Census 2010, at http://www.stats.gov.cn (accessed 24 October 2012); employment values are available only from the “long-form” survey of a subset of the total population. Classification system: NBS, 14 May 2003. A category-by-category description of the main changes from GB1994 is provided in the first seven issues of the magazine Zhongguo tongji of 2003.

66
Appendix 5 Sectoral Classification System GB/T4754-2011
Changes from GB2002
A 农,林,牧,渔业 Agriculture
1 农业 Farming
2 林业 Forestry
3 畜牧业 Animal husbandry
4 渔业 Fisheries
5 农,林,牧,渔服务业 Agricultural services
expanded B 采矿业 Mining and quarrying
6 煤炭开采和洗选业 Mining and washing of coal
7 石油和天然气开采业 Extraction of petroleum and natural gas
8 黑色金属矿采选业 Mining and processing of ferrous metal ores
9 有色金属矿采选业 Mining and processing of non-ferrous metal ores
10 非金属矿采选业 Mining and processing of nonmetal ores
new 11 开采辅助活动 Ancillary mining activities
12 其他采矿业 Mining of other ores
expanded C 制造业 Manufacturing
13 农副食品加工业 Processing of food from agric. products
14 食品制造业 Manufacture of foods
relabeled 15 酒,饮料和精制茶制造
业
Manufacture of alcohol, beverages, and refined tea
16 烟草制品业 Manufacture of tobacco
17 纺织业 Manufacture of textiles
minor revision 18 纺织服装,服饰业 Manufacture of textiles, clothing; apparel industry
minor revision 19 皮革,毛皮,羽毛及其
制品和制鞋业
Manufacture of leather, fur, feather and related products; footwear industry
20 木材加工和木,竹,
藤,棕,草制品业
Processing of timber, manufacture of wood, bamboo, rattan, palm, and straw products
21 家具制造业 Manufacture of furniture
22 造纸和纸制品业 Manufacture of paper and paper prod.
23 印刷和记录媒介复制业 Printing and recorded media
newly includes part of old 42
24 文教,工美,体育和娱
乐用品制造业
Manufacture of articles for culture, education, art, sports, and entertainment
25 石油加工,炼焦和核燃
料加工业
Processing of petroleum, coking, processing of nuclear fuel
26 化学原料和化学制品制
造业
Manufacture of chemical raw materials and chemical products
27 医药制造业 Manufacture of medicines
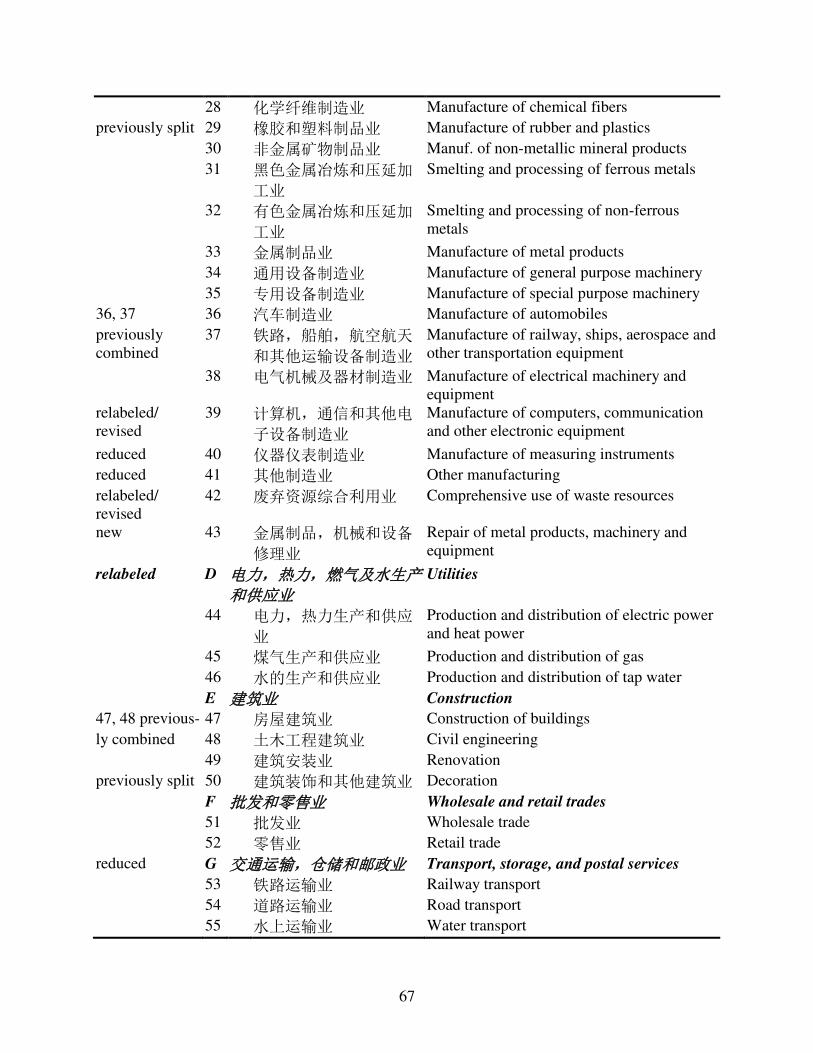
67
28 化学纤维制造业 Manufacture of chemical fibers
previously split 29 橡胶和塑料制品业 Manufacture of rubber and plastics
30 非金属矿物制品业 Manuf. of non-metallic mineral products
31 黑色金属冶炼和压延加
工业
Smelting and processing of ferrous metals
32 有色金属冶炼和压延加
工业
Smelting and processing of non-ferrous metals
33 金属制品业 Manufacture of metal products
34 通用设备制造业 Manufacture of general purpose machinery
35 专用设备制造业 Manufacture of special purpose machinery
36, 37 36 汽车制造业 Manufacture of automobiles
previously combined
37 铁路,船舶,航空航天
和其他运输设备制造业
Manufacture of railway, ships, aerospace and other transportation equipment
38 电气机械及器材制造业 Manufacture of electrical machinery and equipment
relabeled/ revised
39 计算机,通信和其他电
子设备制造业
Manufacture of computers, communication and other electronic equipment
reduced 40 仪器仪表制造业 Manufacture of measuring instruments
reduced 41 其他制造业 Other manufacturing
relabeled/ revised
42 废弃资源综合利用业 Comprehensive use of waste resources
new 43 金属制品,机械和设备
修理业
Repair of metal products, machinery and equipment
relabeled D 电力,热力,燃气及水生产和供应业
Utilities
44 电力,热力生产和供应
业
Production and distribution of electric power and heat power
45 煤气生产和供应业 Production and distribution of gas
46 水的生产和供应业 Production and distribution of tap water
E 建筑业 Construction
47, 48 previous- 47 房屋建筑业 Construction of buildings
ly combined 48 土木工程建筑业 Civil engineering
49 建筑安装业 Renovation
previously split 50 建筑装饰和其他建筑业 Decoration
F 批发和零售业 Wholesale and retail trades
51 批发业 Wholesale trade
52 零售业 Retail trade
reduced G 交通运输,仓储和邮政业 Transport, storage, and postal services
53 铁路运输业 Railway transport
54 道路运输业 Road transport
55 水上运输业 Water transport
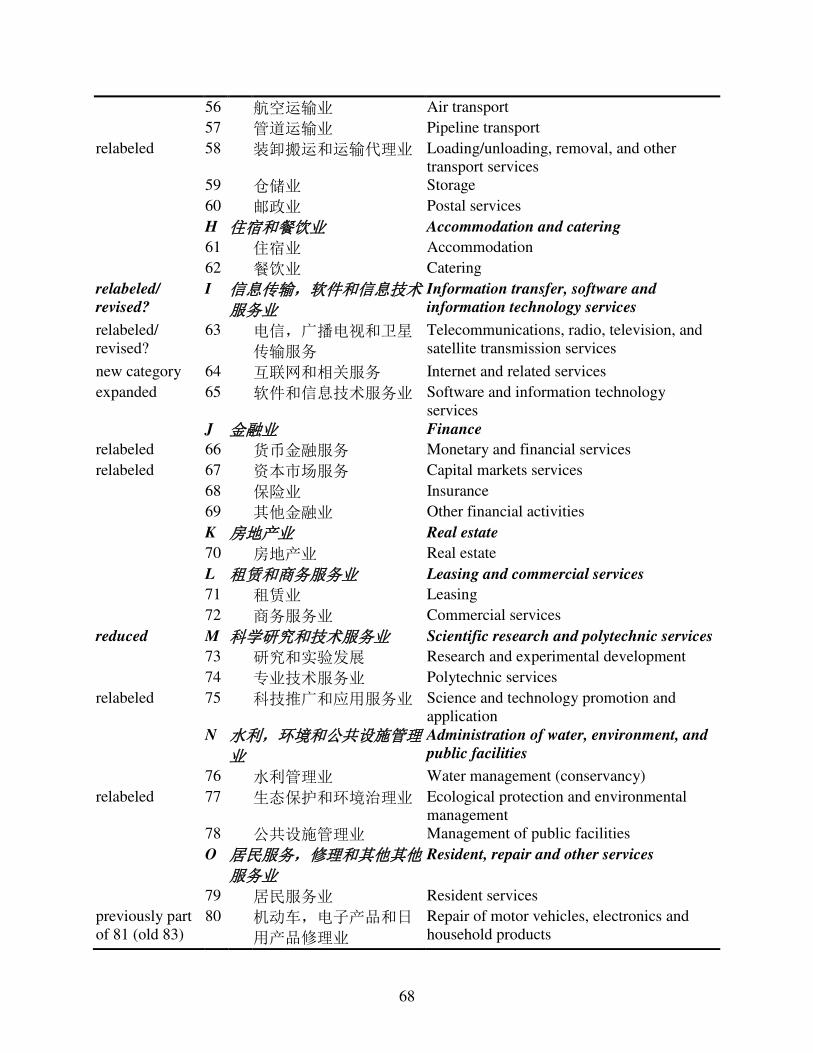
68
56 航空运输业 Air transport
57 管道运输业 Pipeline transport
relabeled 58 装卸搬运和运输代理业 Loading/unloading, removal, and other transport services
59 仓储业 Storage
60 邮政业 Postal services
H 住宿和餐饮业 Accommodation and catering
61 住宿业 Accommodation
62 餐饮业 Catering
relabeled/
revised?
I 信息传输,软件和信息技术服务业
Information transfer, software and
information technology services
relabeled/ revised?
63 电信,广播电视和卫星
传输服务
Telecommunications, radio, television, and satellite transmission services
new category 64 互联网和相关服务 Internet and related services
expanded 65 软件和信息技术服务业 Software and information technology services
J 金融业 Finance
relabeled 66 货币金融服务 Monetary and financial services
relabeled 67 资本市场服务 Capital markets services
68 保险业 Insurance
69 其他金融业 Other financial activities
K 房地产业 Real estate
70 房地产业 Real estate
L 租赁和商务服务业 Leasing and commercial services
71 租赁业 Leasing
72 商务服务业 Commercial services
reduced M 科学研究和技术服务业 Scientific research and polytechnic services
73 研究和实验发展 Research and experimental development
74 专业技术服务业 Polytechnic services
relabeled 75 科技推广和应用服务业 Science and technology promotion and application
N 水利,环境和公共设施管理业
Administration of water, environment, and
public facilities
76 水利管理业 Water management (conservancy)
relabeled 77 生态保护和环境治理业 Ecological protection and environmental management
78 公共设施管理业 Management of public facilities
O 居民服务,修理和其他其他服务业
Resident, repair and other services
79 居民服务业 Resident services
previously part of 81 (old 83)
80 机动车,电子产品和日
用产品修理业
Repair of motor vehicles, electronics and household products
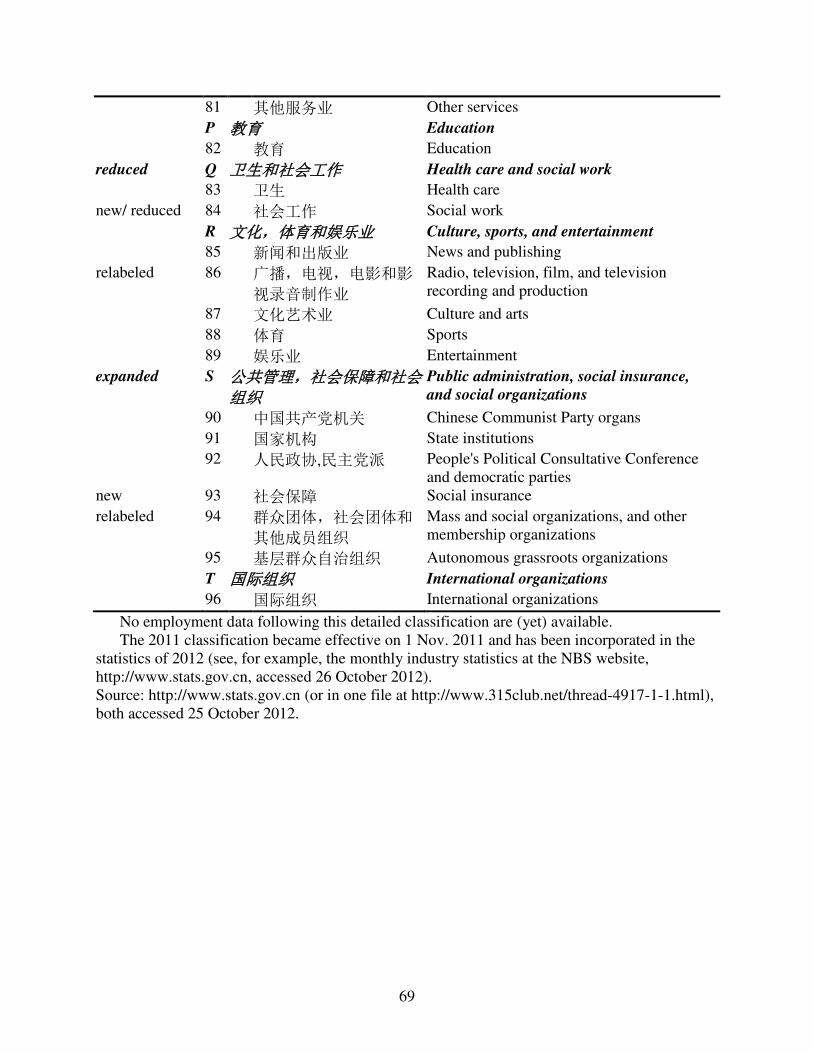
69
81 其他服务业 Other services
P 教育 Education
82 教育 Education
reduced Q 卫生和社会工作 Health care and social work
83 卫生 Health care
new/ reduced 84 社会工作 Social work
R 文化,体育和娱乐业 Culture, sports, and entertainment
85 新闻和出版业 News and publishing
relabeled 86 广播,电视,电影和影
视录音制作业
Radio, television, film, and television recording and production
87 文化艺术业 Culture and arts
88 体育 Sports
89 娱乐业 Entertainment
expanded S 公共管理,社会保障和社会组织
Public administration, social insurance,
and social organizations
90 中国共产党机关 Chinese Communist Party organs
91 国家机构 State institutions
92 人民政协,民主党派 People's Political Consultative Conference and democratic parties
new 93 社会保障 Social insurance
relabeled 94 群众团体,社会团体和
其他成员组织
Mass and social organizations, and other membership organizations
95 基层群众自治组织 Autonomous grassroots organizations
T 国际组织 International organizations
96 国际组织 International organizations
No employment data following this detailed classification are (yet) available. The 2011 classification became effective on 1 Nov. 2011 and has been incorporated in the statistics of 2012 (see, for example, the monthly industry statistics at the NBS website, http://www.stats.gov.cn, accessed 26 October 2012). Source: http://www.stats.gov.cn (or in one file at http://www.315club.net/thread-4917-1-1.html), both accessed 25 October 2012.

70
Appendix 6 ISIC Rev. 3.1
A - Agriculture, hunting and forestry 01 - Agriculture, hunting and related service activities 02 - Forestry, logging and related service activities B - Fishing 05 - Fishing, aquaculture and service activities incidental to fishing C - Mining and quarrying 10 - Mining of coal and lignite; extraction of peat 11 - Extraction of crude petroleum and natural gas; service activities incidental to oil and gas
extraction, excluding surveying 12 - Mining of uranium and thorium ores 13 - Mining of metal ores 14 - Other mining and quarrying D - Manufacturing 15 - Manufacture of food products and beverages 16 - Manufacture of tobacco products 17 - Manufacture of textiles 18 - Manufacture of wearing apparel; dressing and dyeing of fur 19 - Tanning and dressing of leather; manufacture of luggage, handbags, saddlery, harness and
footwear 20 - Manufacture of wood and of products of wood and cork, except furniture; manufacture of articles
of straw and plaiting materials 21 - Manufacture of paper and paper products 22 - Publishing, printing and reproduction of recorded media 23 - Manufacture of coke, refined petroleum products and nuclear fuel 24 - Manufacture of chemicals and chemical products 25 - Manufacture of rubber and plastics products 26 - Manufacture of other non-metallic mineral products 27 - Manufacture of basic metals 28 - Manufacture of fabricated metal products, except machinery and equipment 29 - Manufacture of machinery and equipment n.e.c. 30 - Manufacture of office, accounting and computing machinery 31 - Manufacture of electrical machinery and apparatus n.e.c. 32 - Manufacture of radio, television and communication equipment and apparatus 33 - Manufacture of medical, precision and optical instruments, watches and clocks 34 - Manufacture of motor vehicles, trailers and semi-trailers 35 - Manufacture of other transport equipment 36 - Manufacture of furniture; manufacturing n.e.c. 37 - Recycling
E - Electricity, gas and water supply 40 - Electricity, gas, steam and hot water supply 41 - Collection, purification and distribution of water
F - Construction 45 - Construction
G - Wholesale and retail trades; repair of motor vehicles, motorcycles and personal and household goods 50 - Sale, maintenance and repair of motor vehicles and motorcycles; retail sale of automotive fuel 51 - Wholesale trade and commission trade, except of motor vehicles and motorcycles 52 - Retail trade, except of motor vehicles and motorcycles; repair of personal and household goods
H - Hotels and restaurants

71
55 - Hotels and restaurants I - Transport, storage and communications
60 - Land transport; transport via pipelines 61 - Water transport 62 - Air transport 63 - Supporting and auxiliary transport activities; activities of travel agencies 64 - Post and telecommunications
J - Financial intermediation 65 - Financial intermediation, except insurance and pension funding 66 - Insurance and pension funding, except compulsory social security 67 - Activities auxiliary to financial intermediation
K - Real estate, renting and business activities 70 - Real estate activities 71 - Renting of machinery and equipment without operator and of personal and household goods 72 - Computer and related activities 73 - Research and development 74 - Other business activities
L - Public administration and defence; compulsory social security 75 - Public administration and defence; compulsory social security
M - Education 80 - Education
N - Health and social work 85 - Health and social work
O - Other community, social and personal service activities 90 - Sewage and refuse disposal, sanitation and similar activities 91 - Activities of membership organizations n.e.c. 92 - Recreational, cultural and sporting activities 93 - Other service activities
P - Activities of private households as employers and undifferentiated production activities of private households 95 - Activities of private households as employers of domestic staff 96 - Undifferentiated goods-producing activities of private households for own use 97 - Undifferentiated service-producing activities of private households for own use
Q - Extraterritorial organizations and bodies 99 - Extraterritorial organizations and bodies
Source: http://unstats.un.org/UNSD/cr/registry/regcst.asp?Cl=17&Lg=1, accessed 7 June 2006.

72
References
1 GB1984 is reproduced in an internal compendium of statistics regulations (NBS, 1988, pp. 623-702). For GB2002, a list of two-digit and three-digit categories (of the complete four-digit classification) is available in the online rules and regulations database of China Infobank (NBS, 14 May 2003). A complete list of four-digit sectors was available on the NBS website in separate pdf files for all two-digit sectors (http://www.stats.gov.cn, accessed on 16 January 2008) prior to the issuing of GB2011. GB2002 was also published in form of a book, with detailed explanations, as NBS (2008). GB2011 is now available online (http://www.stats.gov.cn, accessed on 23 October 2012), and has also been published as a book (NBS, 2011). 2 According to the magazine Zhongguo tongji (no. 1, January 2003, p. 26), at the fourth level, the classification largely matches that of ISIC Rev. 3, with a more refined breakdown in GB2002 in some cases, and a less refined breakdown in other cases. The NBS reports that it has the correspondences between GB2002 and ISIC Rev. 3 programmed into its computer system so that it can easily produce sectoral statistics that match ISIC Rev. 3, while its regularly published statistics follow GB2002. Out of the twenty two-digit sectors in GB2002, ten are reported to match a ISIC Rev. 3 one-digit sector. 3 These are ‘logging and transport of timber and bamboo’ (previously a sector within ‘quarrying and mining’), and ‘preliminary processing of textile fibers’ (previously a sector of the ‘textile industry,’ which in turn is part of ‘manufacturing’). 4 An article at http://baike.baidu.com/view/4301731.htm, accessed on 24 October 2012, provides an overview of the changes. 5 Employee stock cooperatives, or just “stock cooperatives,” are sometimes also called “employee shareholding companies;” these are not companies established in accordance with China’s Company Law. 6 Control can come in two forms. Absolute state control (guoyou juedui konggu) implies that the state holds more than 50 percent of total capital (ziben). Relative state control (guoyou xiangdui konggu) implies that although the state holds less than 50 percent of total capital, (i) the state share is relatively large compared to the shares of other ownership categories, i.e., “relative state control” in its narrow meaning (xiangdui konggu), or (ii) even though one or more other ownership categories have a larger capital share than the state, the state in effect holds the control rights by agreement (xieyi kongzhi). Both forms of state-controlled companies are included. 7 An even larger “state” category than the SOSCEs, with one further component, appears to have been abandoned in the published statistics. The further component consists of all (other) enterprises in which the state has a stake (or companies in which the state has less than a controlling stake), with the economic data counted towards the SOE category in proportion to the state’s equity share, where the share of legal persons in paid-in capital is ignored for the purpose of the calculation. For details, see Carsten Holz and Yi-min Lin (2001b). 8 The official new DRIE definition of 1998 neither mentions the SOSCEs nor the limitation to enterprises with “independent accounting systems” (Statistical Yearbook 1999, p. 419). The inclusion of all SOSCEs is apparent from their being listed as a sub-category of the DRIEs (p. 426). The limitation to enterprises with independent account systems is originally only being hinted at (Statistical Yearbook 1999, p. 448), but then becomes clearer in subsequent issues of the Statistical Yearbook: the DRIE statistics are limited to legal-person enterprises with independent accounting systems (for example, Statistical Yearbook 2012, p. 558). 9 For the two redefinitions of 2005 and 2007 see Statistical Yearbook 2006, p. 504, and Statistical Yearbook
2008, p. 484 (or the note at the bottom of p. 485). 10 For the difference between sales revenue and revenue from principal business, see, for example, Industrial
Yearbook 2007, pp. 54 and 58. 11 A note on p. 501 of the Statistical Yearbook 2012 reads: “Industrial enterprises above designated size are all state-owned enterprises and non-state owned enterprises with annual revenue from principal business over 5m yuan from 1998 to 2006, from 2007 to 2010 industrial enterprises with annual revenue from principal business over 5m yuan, and since 2011 industrial enterprises with revenue from principal business in excess of 20m yuan.” This statement contradicts the definitions provided in several earlier issues of the Statistical Yearbook in that prior to 2005, the criterion was based on “sales revenue” rather than on “revenue from principal business.” 12 The 2008 economic census did not lead to any revisions to the number of enterprises or employees, or to changes in balance sheet and profit and loss account items. GOV was revised downward by 0.03 percent; value-added data are no longer published. 13 The 2004 economic census (Economic Census 2004, first secondary sector volume, pp. 2, 7, 10 and 101) suggests that even before the redefinition of the DRIEs in 2007, the DRIEs did not include all SOSCEs (but nearly
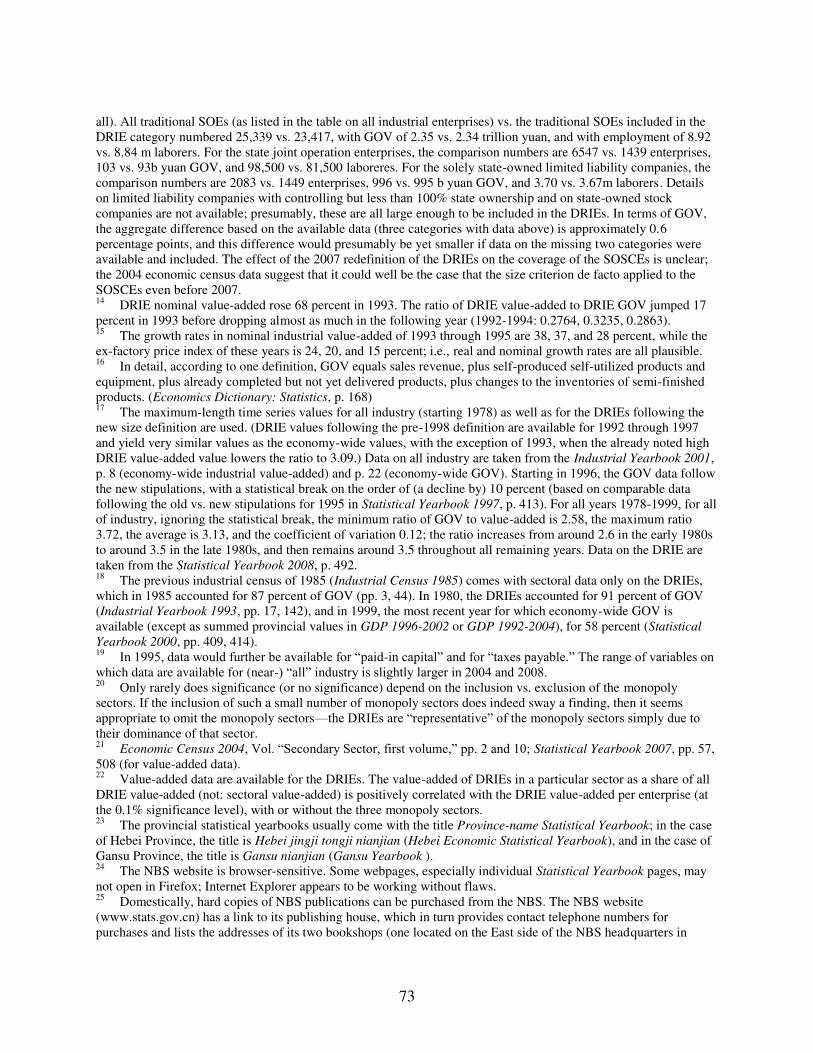
73
all). All traditional SOEs (as listed in the table on all industrial enterprises) vs. the traditional SOEs included in the DRIE category numbered 25,339 vs. 23,417, with GOV of 2.35 vs. 2.34 trillion yuan, and with employment of 8.92 vs. 8.84 m laborers. For the state joint operation enterprises, the comparison numbers are 6547 vs. 1439 enterprises, 103 vs. 93b yuan GOV, and 98,500 vs. 81,500 laboreres. For the solely state-owned limited liability companies, the comparison numbers are 2083 vs. 1449 enterprises, 996 vs. 995 b yuan GOV, and 3.70 vs. 3.67m laborers. Details on limited liability companies with controlling but less than 100% state ownership and on state-owned stock companies are not available; presumably, these are all large enough to be included in the DRIEs. In terms of GOV, the aggregate difference based on the available data (three categories with data above) is approximately 0.6 percentage points, and this difference would presumably be yet smaller if data on the missing two categories were available and included. The effect of the 2007 redefinition of the DRIEs on the coverage of the SOSCEs is unclear; the 2004 economic census data suggest that it could well be the case that the size criterion de facto applied to the SOSCEs even before 2007. 14 DRIE nominal value-added rose 68 percent in 1993. The ratio of DRIE value-added to DRIE GOV jumped 17 percent in 1993 before dropping almost as much in the following year (1992-1994: 0.2764, 0.3235, 0.2863). 15 The growth rates in nominal industrial value-added of 1993 through 1995 are 38, 37, and 28 percent, while the ex-factory price index of these years is 24, 20, and 15 percent; i.e., real and nominal growth rates are all plausible. 16 In detail, according to one definition, GOV equals sales revenue, plus self-produced self-utilized products and equipment, plus already completed but not yet delivered products, plus changes to the inventories of semi-finished products. (Economics Dictionary: Statistics, p. 168) 17 The maximum-length time series values for all industry (starting 1978) as well as for the DRIEs following the new size definition are used. (DRIE values following the pre-1998 definition are available for 1992 through 1997 and yield very similar values as the economy-wide values, with the exception of 1993, when the already noted high DRIE value-added value lowers the ratio to 3.09.) Data on all industry are taken from the Industrial Yearbook 2001, p. 8 (economy-wide industrial value-added) and p. 22 (economy-wide GOV). Starting in 1996, the GOV data follow the new stipulations, with a statistical break on the order of (a decline by) 10 percent (based on comparable data following the old vs. new stipulations for 1995 in Statistical Yearbook 1997, p. 413). For all years 1978-1999, for all of industry, ignoring the statistical break, the minimum ratio of GOV to value-added is 2.58, the maximum ratio 3.72, the average is 3.13, and the coefficient of variation 0.12; the ratio increases from around 2.6 in the early 1980s to around 3.5 in the late 1980s, and then remains around 3.5 throughout all remaining years. Data on the DRIE are taken from the Statistical Yearbook 2008, p. 492. 18 The previous industrial census of 1985 (Industrial Census 1985) comes with sectoral data only on the DRIEs, which in 1985 accounted for 87 percent of GOV (pp. 3, 44). In 1980, the DRIEs accounted for 91 percent of GOV (Industrial Yearbook 1993, pp. 17, 142), and in 1999, the most recent year for which economy-wide GOV is available (except as summed provincial values in GDP 1996-2002 or GDP 1992-2004), for 58 percent (Statistical
Yearbook 2000, pp. 409, 414). 19 In 1995, data would further be available for “paid-in capital” and for “taxes payable.” The range of variables on which data are available for (near-) “all” industry is slightly larger in 2004 and 2008. 20 Only rarely does significance (or no significance) depend on the inclusion vs. exclusion of the monopoly sectors. If the inclusion of such a small number of monopoly sectors does indeed sway a finding, then it seems appropriate to omit the monopoly sectors—the DRIEs are “representative” of the monopoly sectors simply due to their dominance of that sector. 21 Economic Census 2004, Vol. “Secondary Sector, first volume,” pp. 2 and 10; Statistical Yearbook 2007, pp. 57, 508 (for value-added data). 22 Value-added data are available for the DRIEs. The value-added of DRIEs in a particular sector as a share of all DRIE value-added (not: sectoral value-added) is positively correlated with the DRIE value-added per enterprise (at the 0.1% significance level), with or without the three monopoly sectors. 23 The provincial statistical yearbooks usually come with the title Province-name Statistical Yearbook; in the case of Hebei Province, the title is Hebei jingji tongji nianjian (Hebei Economic Statistical Yearbook), and in the case of Gansu Province, the title is Gansu nianjian (Gansu Yearbook ). 24 The NBS website is browser-sensitive. Some webpages, especially individual Statistical Yearbook pages, may not open in Firefox; Internet Explorer appears to be working without flaws. 25 Domestically, hard copies of NBS publications can be purchased from the NBS. The NBS website (www.stats.gov.cn) has a link to its publishing house, which in turn provides contact telephone numbers for purchases and lists the addresses of its two bookshops (one located on the East side of the NBS headquarters in
74
Beijing). Internationally, Asia Economic Information & Consultancy Limited, located in Hong Kong, in the author’s experience reliably supplies the full range of NBS publications (contact [email protected]). 26 The statistical communiqué is published before the annual meeting of the National People’s Congress and the publication of the annual economic and social development plan for the current year. The statistical bulletin focuses on the just completed year and usually does not publish revised figures for the previous year. The NBS also publishes statistical communiqués on other, specific topics, at irregular intervals. 27 Two of the 25 sections are on Hong Kong and Macao. Two appendices cover Taiwan and a world comparison of countries. 28 On the publication practice for GDP, also see OECD (2000, p 11). 29 The holdings of Chinese statistical publications in libraries, from the China library at Chinese University of Hong Kong (the ‘Universities Service Center’) and the Library of Congress to the libraries of some of the best universities in the West, are incomplete for most publications series. Their bibliographic records of what has been published (but is not necessarily held by the particular library) differ at times, as does the recording of which issues of a series are bilingual. While I have checked the physical copies of most issues of most series, I have not been able to check every single one. 30 For each of the approximately 500 industrial sectors, the total values for nine variables are reported, as are the values for state-owned enterprises, collective-owned enterprises, and foreign and overseas Chinese funded enterprises. These three ownership categories are not exhaustive (the sum of the three values, for any particular variable, does not add up to the total). The ownership category “state-owned enterprises” comprises only the unreformed SOEs (or the unreformed SOEs, SOE-SOE joint enterprises, and 100 percent state-owned limited liability companies). 31 Zhou Yixing and Laurence Ma (2005, p. 276) state that this source became public in 2001 only and “has long been published for internal use” in the years before. 32 Also see Susan Xue (2004) for a list of (non-statistical) yearbooks published by ministries and commissions. 33 See, for the example, the China Rural Poverty Report (Zhongguo nongcun pinkun jiance baogao), published annually by the NBS since 2000. 34 The NBS release dates of key monthly data are published on the inside back page of recent issues of China
Monthly Statistics. 35 Researchers report difficulties in working with longitudinal industrial enterprise data as approximately 10 percent of enterprise identifiers change in any given year due to changes in the ownership classification of a particular enterprise, or in its address, or in its industry classification, or in its size classification (large, with three sub-categories, medium, small). 36 Disaggregated, individual-level data from the annual household income and expenditure surveys conducted by the NBS appear only exceptionally available to researchers. According to Ding and Knight (2012, p. 218), the NBS income definition in these surveys excludes the value of owner-occupied housing and undercounts subsidies, including housing subsidies. 37 See http://www.usc.cuhk.edu.hk/DCS/Catalog.aspx, accessed 13 November 2012, and if this particular page should ever disappear, find their data catalog via their main page http://www.usc.cuhk.edu.hk. 38 See http://chinadatacenter.org/, accessed 13 November 2012. 39 See http://www.socwork.gu.se/english/research/Poverty/China_Household/, accessed 13 November 2012. The CHIP surveys cover the years 1998, 1995, 2002, and 2007. According to Ding and Knight (2012, pp. 218, 215), in contrast to the NBS household survey income measure, the CHIP definition includes housing-related income components and more fully captures subsidies; furthermore, while the NBS practice is to exclude from the urban sample households with rural household registration, the CHIP surveys of 2002 and 2007 include separate samples on rural-urban migrants, in 2002 with sampling based on households and confined to migrant households, and in 2007 with sampling based on employment. 40 See http://charls.ccer.edu.cn/charls/, accessed 13 November 2012. 41 Fifty Years reports only scarce data on Hainan and Chongqing: some of the Hainan data only start in 1978, while Chongqing data are available for the years 1996-1998 only. In Fifty-five Years and Sixty Years, many of the pre-1978 data gaps for Hainan have been filled, while Chongqing data start, depending on the variable, in 1949, 1952, 1978, or in some later year of the reform period. 42 Elsewhere, the first, minimal set of reform period NIPA data, following the System of National Accounts, appeared in the Statistical Yearbook 1988, covering the years since 1978.


![Chinese Short-Text Classification Based on Topic Model ...€¦ · long-text classification has popularized the application of this model in short-text classification. [11] derived](https://img.pdfslide.net/doc/110x75/60033845ec709f23c262d561/chinese-short-text-classification-based-on-topic-model-long-text-classification.jpg)