Embed Size (px)
Citation preview

OAKMARK FUNDSTHIRD QUARTER REPORT | JUNE 30 , 2019
OAKMARK FUND
OAKMARK SELECT FUND
OAKMARK EQUITY AND INCOME FUND
OAKMARK GLOBAL FUND
OAKMARK GLOBAL SELECT FUND
OAKMARK INTERNATIONAL FUND
OAKMARK INTERNATIONAL SMALL CAP FUND
Toppan Merrill - Harris-Oakmark Harris Associates Investment Trust N-30B-2 033-38953 06-30-2019 ED | thunt | 14-Aug-19 09:45 | 19-12672-1.aa | Sequence: 1CHKSUM Content: 56 Layout: 63562 Graphics: 63406 CLEAN
JOB: 19-12672-1 CYCLE#;BL#: 8 TRIM: 8.250 x 10.750 AS: Chicago: 877-427-2185COLORS: ~HTML color, Black, ~note-color 2, PANTONE 364 U, ~watermark GRAPHICS: Harris_FC artwork_tree_364.eps V1.5

Commentary on Oakmark and Oakmark Select Funds 1
Oakmark FundSummary Information 4
Portfolio Manager Commentary 5
Schedule of Investments 6
Oakmark Select FundSummary Information 10
Portfolio Manager Commentary 11
Schedule of Investments 12
Oakmark Equity and Income FundSummary Information 14
Portfolio Manager Commentary 15
Schedule of Investments 17
Oakmark Global FundSummary Information 24
Portfolio Manager Commentary 25
Schedule of Investments 27
Oakmark Global Select FundSummary Information 30
Portfolio Manager Commentary 31
Schedule of Investments 32
Oakmark International FundSummary Information 34
Portfolio Manager Commentary 35
Schedule of Investments 36
Oakmark International Small Cap FundSummary Information 40
Portfolio Manager Commentary 41
Schedule of Investments 42
Disclosures and Endnotes 45
Trustees and Officers 47
FORWARD-LOOKING STATEMENT DISCLOSURE
One of our most important responsibilities as mutual fundmanagers is to communicate with shareholders in an open anddirect manner. Some of our comments in our letters toshareholders are based on current management expectationsand are considered “forward-looking statements.” Actual futureresults, however, may prove to be different from ourexpectations. You can identify forward-looking statements bywords such as “estimate”, “may”, “will”, “expect”, “believe”,
“plan” and other similar terms. We cannot promise futurereturns. Our opinions are a reflection of our best judgment atthe time this report is compiled, and we disclaim any obligationto update or alter forward-looking statements as a result of newinformation, future events, or otherwise.
Oakmark.com
Oakmark Funds2019 Third Quarter Report
TABLE OF CONTENTS
Beginning on January 1, 2021, as permitted by regulations
adopted by the U.S. Securities and Exchange Commission, paper
copies of the Oakmark Funds’ annual and semi-annual share-
holder reports will no longer be sent by mail, unless you specifi-
cally request paper copies of the reports. Instead, the reports
will be made available on Oakmark.com, and you will be noti-
fied by mail each time a report is posted and provided with a
website link to access the report. If you already elected to re-
ceive shareholder reports electronically, you will not be affected
by this change and you need not take any action. You may elect
to receive shareholder reports and other communications from
the Funds electronically anytime by contacting your financial
intermediary (such as a broker-dealer or bank) or, if you hold
your shares directly with the Funds, by calling 1-800-OAKMARK
(625-6275) or visiting Oakmark.com.
You may elect to receive all future reports in paper free of
charge. If you invest through a financial intermediary, you can
contact your financial intermediary to request that you con-
tinue to receive paper copies of your shareholder reports.
If you hold your shares directly with the Funds, you can
call 1-800-OAKMARK (625-6275) to let the Funds know you wish
to continue receiving paper copies of your shareholder reports.
Your election to receive reports in paper will apply to all Funds
you hold directly or all Funds you hold through your financial
intermediary, as applicable.
Toppan Merrill - Harris-Oakmark Harris Associates Investment Trust N-30B-2 033-38953 06-30-2019 ED | thunt | 14-Aug-19 09:45 | 19-12672-1.ac | Sequence: 1CHKSUM Content: 33102 Layout: 61100 Graphics: 0 CLEAN
JOB: 19-12672-1 CYCLE#;BL#: 8 TRIM: 8.250 x 10.750 AS: Chicago: 877-427-2185COLORS: PANTONE 364 U, ~note-color 2, Black, ~note-color 3 GRAPHICS: none V1.5

“An expert is one who knows more and more about less and less untilhe knows everything about nothing.”
-William Mayo, a founder of Mayo Clinic
We all know the story of Tiger Woods learning to imitate hisfather’s golf swing at just six months old. So last month, whenGary Woodland won the U.S. Open, it was a victory for all thelate bloomers who played many sports while growing up. Inhigh school, Woodland played shortstop on a championshipbaseball team and he was a Division II college basketball player.In “How Basketball and Baseball Helped Gary Woodland MasterGolf1,” The New York Times reported, “a funny thing happenedto Woodland as he was supposedly wasting his time on othersports instead of focusing all of his attention on golf. Helearned many transferable skills and life lessons that made hima better player and, he believes, a more grounded and well-rounded person,” and, “Being at the plate or free-throw linewith the game on the line taught Woodland how to embracethe pressure and discomfort instead of succumbing to it.” I canalmost hear the sighs of relief from parents who’ve been toldthat their multi-sport children have already fallen too farbehind to excel at a specific sport.
Like Woodland who benefitted from being a generalist insports, we at Oakmark benefit from having investment analystswho are generalists. Although investment firms generally assigntheir analysts to specialize in just one industry, we believe thatanalysts who examine a wide breadth of companies provide farmore value to the investment process than those who focus onone narrow industry.
When analysts come to work at Oakmark, we have already con-firmed that they share our long-term value investmentphilosophy. If they don’t, they don’t survive the interviewprocess. From day one, they can look within any industry forbusinesses that are undervalued, growing and run for the bene-fit of shareholders. We believe that level of freedom allows us toattract and retain more talent, speeds development, improvesresearch department flexibility, and most importantly, results inthe robust debate our process requires. Because our analystslook for the most compelling values wherever they may lie, it isquite common that multiple analysts will follow stocks in thesame industry. This enables each analyst to provide critical feed-back about the others’ investment ideas. For example, considerwhat happens when an Oakmark analyst presents a new bankstock. Because most of our team members either cover one ofour bank holdings or have considered recommending one wedon’t own, they can each contribute to a debate of the newidea’s investment merit.
In the book Range: Why Generalists Triumph in a SpecialistWorld2, author David Epstein argues that many fields have goneso overboard with specialization that generalists are now the
more valuable problem solvers. Epstein states that “highly cre-dentialed experts can become so narrow-minded that theyactually get worse with experience, even while becoming moreconfident—a dangerous combination.” Through numerousexamples, Epstein differentiates between “kind” and “wicked”environments. He says a “kind” learning environment isdefined by psychologist Robin Hogarth as one where “patternsrepeat over and over, and feedback is extremely accurate andusually very rapid.” Specialists can thrive in “kind” environ-ments. As a simplistic example, learning to play tic-tac-toe isthe epitome of a kind environment: The rules are fixed, pat-terns repeat and feedback is both accurate and rapid. Withoutstudy, simple repetition quickly produces an unbeatable playerwho could tie for World Champion.
Unfortunately, most of life occurs in less kind learning environ-ments. Hogarth calls the opposite of a kind environment“wicked.” As Epstein relays, “In wicked domains the rules of thegame are often unclear or incomplete, there may or may not berepetitive patterns and they may not be obvious, and feedbackis often delayed, inaccurate, or both.” On the continuumbetween kind and wicked environments, investing seems to bemuch closer to the wicked end.
We can cite business conditions that often lead to successfulinvestments, but we can also show examples when those sameconditions led to failures. Bad news for a company typicallypushes its stock price down, but sometimes, when the news hasalready been thoroughly discounted, the announcement canactually make the stock price go up. We can buy a stock thatlooks unbelievably cheap and then the stock price drops evenlower. Investors with less patience or conviction will often giveup before the pendulum swings and the positive results begin.
Our own value approach, which has been successful over thelong run, can still go through difficult periods, like today, whenour five-year trailing performance lags behind the market aver-ages. Though we’ve been through these periods before and haveseen the rebound that often follows, we also know that “pastperformance is no guarantee of future results.” Becoming suc-cessful at investing has very little in common with becomingsuccessful at tic-tac-toe. The learning environments are about asdifferent as they could be.
To demonstrate the value of generalist thinking in wicked envi-ronments, Epstein cites the story of a chemist at Eli Lilly whoposted some questions online that had baffled Lilly’s chemists.Relatively quickly, solutions came rolling in—most from indi-viduals who worked in unrelated fields. The project was sosuccessful that it was spun off into a separate company,InnoCentive, which enables experts in any field to post com-plex problems online and provide rewards for anyone who cansolve them. A little more than one-third of the posted problems
Oakmark.com 1
Oakmark and Oakmark Select Funds June 30, 2019
Portfolio Manager Commentary
William C. Nygren, CFAPortfolio Manager
[email protected]@oakmark.com
At Oakmark, we are long-term investors. We attempt to identifygrowing businesses that are managed to benefit theirshareholders. We will purchase stock in those businesses onlywhen priced substantially below our estimate of intrinsic value.After purchase, we patiently wait for the gap between stock priceand intrinsic value to close.
See accompanying Disclosures and Endnotes on page 45.
Toppan Merrill - Harris-Oakmark Harris Associates Investment Trust N-30B-2 033-38953 06-30-2019 ED | thunt | 14-Aug-19 09:45 | 19-12672-1.ba | Sequence: 1CHKSUM Content: 52345 Layout: 33312 Graphics: 4449 CLEAN
JOB: 19-12672-1 CYCLE#;BL#: 8 TRIM: 8.250 x 10.750 AS: Chicago: 877-427-2185COLORS: PANTONE 364 U, ~note-color 2, Black, ~note-color 3 GRAPHICS: william_nygren_photo.eps V1.5

have been completely solved—an impressive statistic, consider-ing teams of specialists had been stumped! According toEpstein, InnoCentive also discovered that the broader the back-grounds are for those who try to solve the problems, the morelikely it is that the problems are answered.
Investing involves a search for solutions to complex prob-lems—a “wicked” environment not well suited to extremespecialization—yet in a typical investment firm, one analystwill be responsible for one industry. Let’s say an investmentfirm has an analyst assigned to the chemical industry. Thatindividual will know a tremendous amount of detail about adozen chemical companies. Rank ordering those 12 companiesbased on business quality is that individual’s forte. Knowing theexpected news flow of the next six months is also an importantpart of that job. But this individual is focused only on chemicalcompanies. A question such as “Is DuPont a better businessthan credit card issuer Capital One?” would probably be metwith a blank stare. The more important question, “Which islikely to be the better long-term investment?” is one an indus-try specialist is not trained to answer.
At Oakmark, we believe it is easier for our generalists to acquirespecialist-level knowledge than it is for a specialist to learn howto place that knowledge into a useful context. When our gener-alists need deeper knowledge in a specific industry, they willsearch for relevant articles, listen to podcasts, talk with experi-enced management teams, consult with experts in the field andinterview the industry specialists at brokerage firms. Comparedto my early career, the internet has made it much easier toaccess specialist knowledge. However, knowing what to do withall of that information—which is the domain of the general-ist—remains as difficult now as it was then.
Having generalists also makes Oakmark a more flexible com-pany that can question its own assumptions. When we believethat a stock we own would benefit from a fresh look, our direc-tor of research will assign it to a different analyst. Because ouranalysts have all studied companies from many different indus-tries, this is nothing out of the ordinary for them—and a freshset of eyes often produces a valuable new perspective. Imaginehow different that would be if you asked the analyst who hasspent a career following 12 chemical companies to suddenlypick up coverage of, say, computer giant IBM. It simplywouldn’t work. In addition, our “devil’s advocate” process relieson generalists. Each of our analysts thinks about every stock weown. If they disagree with a holding, they present the sell caseon a stock someone else covers. At specialist firms, the autoanalyst isn’t thinking about—and might not even be awareof—the firm’s cable TV position. Presenting the case against itwould be nearly impossible.
A final advantage of the generalist model is that it provides ana-lysts with better training for becoming portfolio managers. Allof Oakmark’s current portfolio managers previously worked asgeneralist analysts. If industry specialists want to become port-folio managers, it is an open question as to how adept they willbe at making cross-industry comparisons. Yet every day, a port-folio manager has to make judgments like whether Alphabet ismore attractive than Ford or whether Citigroup is a betterinvestment than Merck. Our analysts constantly make those
judgments as they decide which companies to recommend forpurchase. For a specialist, that’s a brand new way of thinking.
For every prodigy like Tiger Woods there’s a Gary Woodlandwhose skills were honed from generalist experience. So if yourchild enjoys playing soccer, baseball and basketball, but thebaseball coach says it’s time to drop the others, you probablywon’t ruin your child’s life by ignoring that advice. And as youthink beyond sports, remember Epstein’s conclusion that themore uncertain the environment, the more likely it is that ageneralist will have greater success than a specialist. We believeOakmark’s track record shows that our shareholders benefitfrom the broad perspective of our analysts. I believe our workenvironment also benefits: Woodland credited the breadth ofhis background for making him more coachable, grounded andwell rounded. Those same traits in our analysts make Oakmarka better place to work.
2 OAKMARK FUNDS
See accompanying Disclosures and Endnotes on page 45.
Oakmark and Oakmark Select Funds June 30, 2019
Portfolio Manager Commentary (continued)
Toppan Merrill - Harris-Oakmark Harris Associates Investment Trust N-30B-2 033-38953 06-30-2019 ED | thunt | 14-Aug-19 09:45 | 19-12672-1.ba | Sequence: 2CHKSUM Content: 58661 Layout: 36853 Graphics: 0 CLEAN
JOB: 19-12672-1 CYCLE#;BL#: 8 TRIM: 8.250 x 10.750 AS: Chicago: 877-427-2185COLORS: PANTONE 364 U, ~note-color 2, Black, ~note-color 3 GRAPHICS: none V1.5

This page intentionally left blank.
Oakmark.com 3
Toppan Merrill - Harris-Oakmark Harris Associates Investment Trust N-30B-2 033-38953 06-30-2019 ED | thunt | 14-Aug-19 09:45 | 19-12672-1.ba | Sequence: 3CHKSUM Content: 55492 Layout: 49473 Graphics: 61853 CLEAN
JOB: 19-12672-1 CYCLE#;BL#: 8 TRIM: 8.250 x 10.750 AS: Chicago: 877-427-2185COLORS: PANTONE 364 U, ~note-color 2, Black, ~note-color 3 GRAPHICS: oakmark_funds_364_20%_logo.eps V1.5

4 OAKMARK FUNDS
See accompanying Disclosures and Endnotes on page 45.
VALUE OF A $10,000 INVESTMENTSince Inception - 08/05/91 (Unaudited)
PERFORMANCE Average Annual Total Returns (as of 06/30/19)
Total Return Since Inception(Unaudited) Last 3 Months 1-year 3-year 5-year 10-year Inception Date
Oakmark Fund (Investor Class) 3.22% 0.39% 13.11% 7.76% 14.42% 12.37% 08/05/91S&P 500 Index 4.30% 10.42% 14.19% 10.71% 14.70% 9.78%Dow Jones Industrial Average4 3.21% 12.20% 16.80% 12.29% 15.03% 10.75%Lipper Large-Cap Value Fund Index5 3.56% 7.36% 11.43% 7.60% 12.36% 8.81%Oakmark Fund (Advisor Class) 3.23% 0.50% N/A N/A N/A 9.19% 11/30/16Oakmark Fund (Institutional Class) 3.26% 0.57% N/A N/A N/A 9.24% 11/30/16Oakmark Fund (Service Class) 3.14% 0.11% 12.78% 7.43% 14.07% 8.01% 04/05/01
The graph and table above do not reflect the deduction of taxes that a shareholder would pay on Fund distributions or the redemption of Fund shares.Past performance is no guarantee of future results. The performance data quoted represents past performance. Current performance may belower or higher than the performance data quoted. Total return includes change in share prices and, in each case, includes reinvestment of dividendsand capital gain distributions. The investment return and principal value vary so that an investor’s shares when redeemed may be worth more orless than the original cost. To obtain the most recent month-end performance, please visit Oakmark.com.
$10,000
$50,000
$90,000
Oakmark Fund(Investor Class) $258,808
$210,000
$170,000
$130,000
$250,000
$290,000
S&P 500 Index3
$135,267
1991 2007 201120092005 20152013 201920172003200119951993 19991997
TOP TEN EQUITY HOLDINGS6 % of Net Assets
Citigroup, Inc. 3.4Alphabet, Inc., Class C 3.4Netflix, Inc. 3.4Bank of America Corp. 3.0Ally Financial, Inc. 2.9Capital One Financial Corp. 2.9Charter Communications, Inc., Class A 2.7TE Connectivity, Ltd. 2.6Apple, Inc. 2.6Comcast Corp., Class A 2.5
SECTOR ALLOCATION % of Net Assets
Financials 26.4Information Technology 15.3Communication Services 14.6Consumer Discretionary 13.1Industrials 10.3Energy 6.1Health Care 5.9Consumer Staples 1.8Short-Term Investments and Other 6.5
FUND STATISTICSTicker* OAKMXNumber of Equity Holdings 52Net Assets $17.8 billionWeighted Average Market Cap $141.4 billionMedian Market Cap $42.7 billionGross Expense Ratio - Investor Class (as of 09/30/18)* 0.89%Net Expense Ratio - Investor Class (as of 09/30/18)*† 0.85%
* This information is related to the Investor Class. Please visitOakmark.com for information related to the Advisor, Institutional andService Classes.
† The net expense ratio reflects a contractual advisory fee waiveragreement through January 27, 2020.
Oakmark Fund June 30, 2019
Summary Information
Toppan Merrill - Harris-Oakmark Harris Associates Investment Trust N-30B-2 033-38953 06-30-2019 ED | thunt | 14-Aug-19 09:45 | 19-12672-1.ca | Sequence: 1CHKSUM Content: 4111 Layout: 12800 Graphics: 6829 CLEAN
JOB: 19-12672-1 CYCLE#;BL#: 8 TRIM: 8.250 x 10.750 AS: Chicago: 877-427-2185COLORS: ~note-color 3, ~HTML color, Black, ~HTML color 2, PANTONE 364 U, ~note-color 2, ~watermark GRAPHICS: 12672-1_Oakmark_Fund_L.eps V1.5

The Oakmark Fund increased 3.2% for the second quarter of2019, which lagged slightly behind the 4.3% gain for theS&P 5003, the Fund’s benchmark. The Fund benefited fromOccidental Petroleum’s acquisition offer for Anadarko Petro-leum and we sold our Anadarko holding following an increaseof over 50% for the quarter. A significant decline in oil pricesallowed us to replace Anadarko with three new exploration andproduction (E&P) companies. U.S.-focused E&Ps have meaning-fully improved their capital efficiency profile through the oildownturn. We expect them to generate excess returns giventheir position at the low end of the global cost curve. All threeof our new E&P holdings operate top-quality acreage in the pre-mier U.S. onshore region (the Permian Basin), are led byreturns-focused management teams and maintain strong bal-ance sheets. We remind shareholders that energy holdings rep-resent just 7% of the Fund, which is only slightly higher thanthe S&P 500 energy weighting of 5.2%, but our holdings have ahigher level of operating leverage, which magnifies their impacton the Fund’s performance.
The Oakmark Fund’s best contributing sectors during the secondquarter were information technology and financials, which areour two largest sectors. Our worst contributing sectors were healthcare and energy. The Fund’s best contributing individual securitieswere Anadarko (+55%) and American International Group (+24%)and the worst contributing securities were Regeneron Pharmaceu-ticals (–24%) and Chesapeake Energy (–36%). Regeneron’s stockprice fell due to concerns around potential drug pricing regulationand new competition for their best-selling drug Eylea. We con-tinue to believe Regeneron sets drug prices responsibly and weanticipate future growth from new drug launches and the com-pany’s strong R&D pipeline. Regeneron is valued at an attractivelow-teens P/E7 when adjusting R&D to peer averages and adjust-ing SG&A for product launch costs.
During the quarter, we added new positions in ConchoResources, Diamondback Energy and EOG Resources.
Concho Resources Inc. (CXO-$103.18)Concho Resources, in our opinion, is one of the highest qualityoil and gas producers in the U.S. and it maintains an enormousacreage position in the most attractive parts of the PermianBasin. This large inventory of future drilling locations shouldallow Concho to invest at high returns for years to come. Themarket is currently valuing this strategically attractive set ofassets at a discount to recent private market transactions andbelow Permian peers on a per acre basis, despite the company’ssuperior economics and strong management team. Concho hasa long history of creating value for shareholders through bothefficient operations and savvy capital allocation. We expectshareholders can once again be rewarded as the company devel-ops and monetizes its acreage footprint.
Diamondback Energy, Inc. (FANG-$108.97)Diamondback Energy is an oil and gas producer with a high-quality acreage position located entirely in the Permian Basin.CEO Travis Stice and his management team have producedindustry-leading returns by focusing on low-cost operations andbest execution. We like the management team’s focus on pershare value and we believe the market doesn’t appreciate Dia-mondback’s acreage quality and drilling inventory followingthe company’s acquisition of Energen. Diamondback is growingproduction 15% per year with a mid-single digit FCF yield andthe business is valued at a significant discount to net asset valueand historical per acre multiples.
EOG Resources, Inc. (EOG-$93.16)EOG Resources launched the U.S. oil production renaissance byapplying fracturing technology to oil basins across North America.Because of this first-mover advantage, the company has typicallypaid far less than competitors for similar acreage positions. Webelieve that EOG’s return-focused culture will continue to driveinnovation and efficiency. The company expects that over 90% ofthe wells the company will drill over the next 10-12 years willgenerate economic returns at a $40 per barrel oil price. This lowposition on the cost curve makes EOG one of the lowest riskE&Ps, while the company’s continued innovation (experimentalplays, enhanced oil recovery and drilling technology investment)provides upside that few competitors can match.
William C. Nygren, CFAPortfolio Manager
Kevin Grant, CFAPortfolio Manager
Oakmark.com 5
Oakmark Fund June 30, 2019
Portfolio Manager Commentary
See accompanying Disclosures and Endnotes on page 45.
Toppan Merrill - Harris-Oakmark Harris Associates Investment Trust N-30B-2 033-38953 06-30-2019 ED | thunt | 14-Aug-19 09:45 | 19-12672-1.ca | Sequence: 2CHKSUM Content: 28679 Layout: 57630 Graphics: 12834 CLEAN
JOB: 19-12672-1 CYCLE#;BL#: 8 TRIM: 8.250 x 10.750 AS: Chicago: 877-427-2185COLORS: ~note-color 3, ~HTML color, Black, ~HTML color 2, PANTONE 364 U, ~note-color 2, ~watermark GRAPHICS: Kevin Grant_small_photo.eps, william_nygren_photo.eps V1.5

Oakmark Fund June 30, 2019 (Unaudited)
Schedule of Investments (in thousands)
COMMON STOCKS - 93.5%FINANCIALS - 26.4%DIVERSIFIED FINANCIALS - 15.8%
Ally Financial, Inc. 16,905 $523,886Capital One Financial Corp. 5,743 521,102The Charles Schwab Corp. 9,600 385,824State Street Corp. 6,200 347,572The Bank of New York Mellon Corp. 6,920 305,501Moody’s Corp. 1,506 294,229The Goldman Sachs Group, Inc. 1,105 226,083S&P Global, Inc. 862 196,282
2,800,479
BANKS - 8.3%
Citigroup, Inc. 8,730 611,362Bank of America Corp. 18,500 536,500Wells Fargo & Co. 7,110 336,445
1,484,307
INSURANCE - 2.3%
American International Group, Inc. 7,655 407,875 4,692,661
INFORMATION TECHNOLOGY - 15.3%SOFTWARE & SERVICES - 6.6%
MasterCard, Inc., Class A 1,160 306,855Gartner, Inc. (a) 1,800 289,692Visa, Inc., Class A 1,655 287,225Automatic Data Processing, Inc. 1,670 276,101
1,159,873
TECHNOLOGY HARDWARE & EQUIPMENT - 5.2%
TE Connectivity, Ltd. 4,836 463,158Apple, Inc. 2,337 462,539
925,697
SEMICONDUCTORS & SEMICONDUCTOR EQUIPMENT - 3.5%
Intel Corp. 6,755 323,362Texas Instruments, Inc. 2,620 300,671
624,033 2,709,603
COMMUNICATION SERVICES - 14.6%MEDIA & ENTERTAINMENT - 14.6%
Alphabet, Inc., Class C (a) 558 603,424Netflix, Inc. (a) (b) 1,624 596,528Charter Communications, Inc., Class A (a) 1,200 474,216Comcast Corp., Class A 10,638 449,792Facebook, Inc., Class A (a) 2,013 388,567News Corp., Class A 6,452 87,032
2,599,559
Shares Value
CONSUMER DISCRETIONARY - 13.1%AUTOMOBILES & COMPONENTS - 5.7%
Fiat Chrysler Automobiles N.V. 28,160 $389,173General Motors Co. 9,650 371,814Aptiv PLC 2,200 177,826Delphi Technologies PLC 3,733 74,666
1,013,479
RETAILING - 4.4%
Booking Holdings, Inc. (a) 195 365,569eBay, Inc. 6,500 256,750Qurate Retail, Inc. (a) 12,115 150,110
772,429
CONSUMER SERVICES - 3.0%
Hilton Worldwide Holdings, Inc. 2,779 271,629MGM Resorts International 9,400 268,558
540,187 2,326,095
INDUSTRIALS - 10.3%CAPITAL GOODS - 7.7%
General Electric Co. 42,460 445,830Parker-Hannifin Corp. 2,289 389,197Cummins, Inc. 1,720 294,705Caterpillar, Inc. 1,750 238,507
1,368,239
TRANSPORTATION - 2.6%
American Airlines Group, Inc. 8,274 269,812FedEx Corp. 1,130 185,535
455,347 1,823,586
ENERGY - 6.1%
Apache Corp. 10,640 308,235Diamondback Energy, Inc. 1,700 185,249Concho Resources, Inc. 1,700 175,406EOG Resources, Inc. 1,800 167,688Halliburton Co. 5,800 131,892Chesapeake Energy Corp. (a) 59,934 116,871
1,085,341
HEALTH CARE - 5.9%HEALTH CARE EQUIPMENT & SERVICES - 3.5%
CVS Health Corp. 6,094 332,060HCA Healthcare, Inc. 1,494 201,984Baxter International, Inc. 1,116 91,413
625,457
PHARMACEUTICALS, BIOTECHNOLOGY & LIFE SCIENCES - 2.4%
Regeneron Pharmaceuticals, Inc. (a) 1,332 416,852 1,042,309
Shares Value
6 OAKMARK FUNDS
Toppan Merrill - Harris-Oakmark Harris Associates Investment Trust N-30B-2 033-38953 06-30-2019 ED | thunt | 14-Aug-19 09:45 | 19-12672-1.cb | Sequence: 1CHKSUM Content: 64579 Layout: 13818 Graphics: 0 CLEAN
JOB: 19-12672-1 CYCLE#;BL#: 8 TRIM: 8.250 x 10.750 AS: Chicago: 877-427-2185COLORS: ~note-color 2, PANTONE 364 U, Black, ~note-color 3 GRAPHICS: none V1.5

Oakmark Fund June 30, 2019 (Unaudited)
Schedule of Investments (in thousands) (continued)
COMMON STOCKS - 93.5% (continued)CONSUMER STAPLES - 1.8%FOOD, BEVERAGE & TOBACCO - 1.8%
Constellation Brands, Inc., Class A 1,650 $324,951
TOTAL COMMON STOCKS - 93.5%(COST $10,857,105) 16,604,105
Value
TOTAL PURCHASED OPTIONS - 0.0% (c)(COST $11,822) 8,550
Par Value Value
SHORT-TERM INVESTMENTS - 6.2%GOVERNMENT AND AGENCY SECURITIES - 3.1%
Federal National Mortgage Association,2.24%, due 07/01/19 (d) $400,000 400,000
Federal Home Loan Bank,2.13%, due 07/01/19 (d) 150,000 150,000
TOTAL GOVERNMENT AND AGENCY SECURITIES - 3.1%(Cost $550,000) 550,000
U.S. GOVERNMENT BILL - 2.8%United States Treasury Bill,
2.40%, due 07/09/19 (d)(Cost $499,737) 500,000 499,737
REPURCHASE AGREEMENT - 0.3%Fixed Income Clearing Corp. Repurchase Agreement, 1.50% dated 06/28/19 due 07/01/19, repurchase price $48,180, collateralized by a United States Treasury Note, 2.375% due 03/15/22, value plus accrued interest of $49,138 (Cost: $48,174) 48,174 48,174
TOTAL SHORT-TERM INVESTMENTS - 6.2%(COST $1,097,911) 1,097,911
TOTAL INVESTMENTS - 99.7%(COST $11,966,838) 17,710,566
Foreign Currencies (Cost $0) - 0.0% (e) 0(f)
Other Assets In Excess of Liabilities - 0.3% 51,099
TOTAL NET ASSETS - 100.0% $17,761,665
(a) Non-income producing security
(b) All or a portion of this investment is held in connection with one or more holdingswithin the Fund.
(c) See options table for description of purchased options.
(d) The rate shown represents the annualized yield at the time of purchase; not a couponrate.
(e) Amount rounds to less than 0.1%.
(f) Amount rounds to less than $1,000.
Oakmark.com 7
Shares Value
Toppan Merrill - Harris-Oakmark Harris Associates Investment Trust N-30B-2 033-38953 06-30-2019 ED | thunt | 14-Aug-19 09:45 | 19-12672-1.cb | Sequence: 2CHKSUM Content: 59791 Layout: 43632 Graphics: 0 CLEAN
JOB: 19-12672-1 CYCLE#;BL#: 8 TRIM: 8.250 x 10.750 AS: Chicago: 877-427-2185COLORS: ~note-color 2, PANTONE 364 U, Black, ~note-color 3 GRAPHICS: none V1.5

Oakmark Fund June 30, 2019 (Unaudited)
Schedule of Investments (in thousands) (continued)
8 OAKMARK FUNDS
PURCHASED OPTIONS
Premiums Exercise Expiration Number of Notional Market (Received) UnrealizedDescription Price Date Contracts Amount Value by Fund Gain/(Loss)
CALLS
National Oilwell Varco, Inc. $23.00 07/19/2019 57,000 $126,711 $2,565 $5,132 $(2,567)DXC Technology Co. 55.00 07/19/2019 38,000 209,570 5,985 6,690 (705)
$336,281 $8,550 $11,822 $(3,272)
WRITTEN OPTIONS
Premiums Exercise Expiration Number of Notional Market (Received) UnrealizedDescription Price Date Contracts Amount Value by Fund Gain/(Loss)
CALLS
Netflix, Inc. $410.00 10/18/2019 (71) $(2,608) $(108) $(213) $105Netflix, Inc. 400.00 09/20/2019 (500) (18,366) (645) (1,558) 913Netflix, Inc. 390.00 09/20/2019 (800) (29,386) (1,310) (2,569) 1,259
$(50,360) $(2,063) $(4,340) $2,277
PUTS
National Oilwell Varco, Inc. $21.00 07/19/2019 (61,000) $(135,603) $(1,952) $(5,671) $3,719DXC Technology Co. 52.50 07/19/2019 (40,000) (220,600) (2,500) (9,238) 6,738
$(356,203) $(4,452) $(14,909) $10,457
Toppan Merrill - Harris-Oakmark Harris Associates Investment Trust N-30B-2 033-38953 06-30-2019 ED | thunt | 14-Aug-19 09:45 | 19-12672-1.cb | Sequence: 3CHKSUM Content: 35367 Layout: 21147 Graphics: 0 CLEAN
JOB: 19-12672-1 CYCLE#;BL#: 8 TRIM: 8.250 x 10.750 AS: Chicago: 877-427-2185COLORS: ~note-color 2, PANTONE 364 U, Black, ~note-color 3 GRAPHICS: none V1.5

This page intentionally left blank.
Oakmark.com 9
Toppan Merrill - Harris-Oakmark Harris Associates Investment Trust N-30B-2 033-38953 06-30-2019 ED | thunt | 14-Aug-19 09:45 | 19-12672-1.da | Sequence: 1CHKSUM Content: 44524 Layout: 5393 Graphics: 61853 CLEAN
JOB: 19-12672-1 CYCLE#;BL#: 8 TRIM: 8.250 x 10.750 AS: Chicago: 877-427-2185COLORS: PANTONE 364 U, ~note-color 3, Black, ~note-color 2 GRAPHICS: oakmark_funds_364_20%_logo.eps V1.5

10 OAKMARK FUNDS
Oakmark Select Fund June 30, 2019
Summary Information
VALUE OF A $10,000 INVESTMENTSince Inception - 11/01/96 (Unaudited)
PERFORMANCE Average Annual Total Returns (as of 06/30/19)
Total Return Since Inception(Unaudited) Last 3 Months 1-year 3-year 5-year 10-year Inception Date
Oakmark Select Fund (Investor Class) 4.53% -6.90% 7.04% 3.55% 12.65% 11.47% 11/01/96S&P 500 Index 4.30% 10.42% 14.19% 10.71% 14.70% 8.54% Lipper Multi-Cap Value Fund Index8 3.25% 3.04% 8.91% 5.57% 11.60% 7.41% Oakmark Select Fund (Advisor Class) 4.56% -6.77% N/A N/A N/A 2.37% 11/30/16Oakmark Select Fund (Institutional Class) 4.56% -6.74% N/A N/A N/A 2.40% 11/30/16Oakmark Select Fund (Service Class) 4.47% -7.07% 6.74% 3.24% 12.32% 8.27% 12/31/99
The graph and table do not reflect the deduction of taxes that a shareholder would pay on Fund distributions or the redemption of Fund shares.Past performance is no guarantee of future results. The performance data quoted represents past performance. Current performance may belower or higher than the performance data quoted. Total return includes change in share prices and, in each case, includes reinvestment of dividendsand capital gain distributions. The investment return and principal value vary so that an investor’s shares when redeemed may be worth more orless than the original cost. To obtain the most recent month-end performance, please visit Oakmark.com.
$10,000
$50,000
$30,000
$90,000
$110,000
$70,000
$150,000
$130,000
Oakmark Select Fund (Investor Class) $117,198
S&P 500 Index3 $64,087
19991997 2001 20072003 2005 20192009 2011 2013 20172015
TOP TEN EQUITY HOLDINGS6 % of Net Assets
Alphabet, Inc., Class C 9.2CBRE Group, Inc., Class A 8.3Citigroup, Inc. 7.1Ally Financial, Inc. 7.0TE Connectivity, Ltd. 5.3Fiat Chrysler Automobiles N.V. 4.8Bank of America Corp. 4.7Charter Communications, Inc., Class A 4.7American International Group, Inc. 4.5Netflix, Inc. 4.4
SECTOR ALLOCATION % of Net Assets
Financials 27.5Communication Services 18.3Consumer Discretionary 15.2Real Estate 8.3Information Technology 8.3Industrials 8.0Energy 6.4Health Care 4.1Short-Term Investments and Other 4.1
FUND STATISTICSTicker* OAKLXNumber of Equity Holdings 21Net Assets $4.8 billionWeighted Average Market Cap $136.4 billionMedian Market Cap $32.3 billionGross Expense Ratio - Investor Class (as of 09/30/18)* 1.04%Net Expense Ratio - Investor Class (as of 09/30/18)*† 0.97%
* This information is related to the Investor Class. Please visitOakmark.com for information related to the Advisor, Institutional andService Classes.
† The net expense ratio reflects a contractual advisory fee waiveragreement through January 27, 2020.
See accompanying Disclosures and Endnotes on page 45.
Toppan Merrill - Harris-Oakmark Harris Associates Investment Trust N-30B-2 033-38953 06-30-2019 ED | thunt | 14-Aug-19 09:45 | 19-12672-1.da | Sequence: 2CHKSUM Content: 44744 Layout: 2996 Graphics: 51413 CLEAN
JOB: 19-12672-1 CYCLE#;BL#: 8 TRIM: 8.250 x 10.750 AS: Chicago: 877-427-2185COLORS: ~note-color 3, ~HTML color, Black, ~HTML color 2, PANTONE 364 U, ~note-color 2, ~watermark GRAPHICS: 12672-1_Select_Fund_L.eps V1.5
Oakmark.com 11
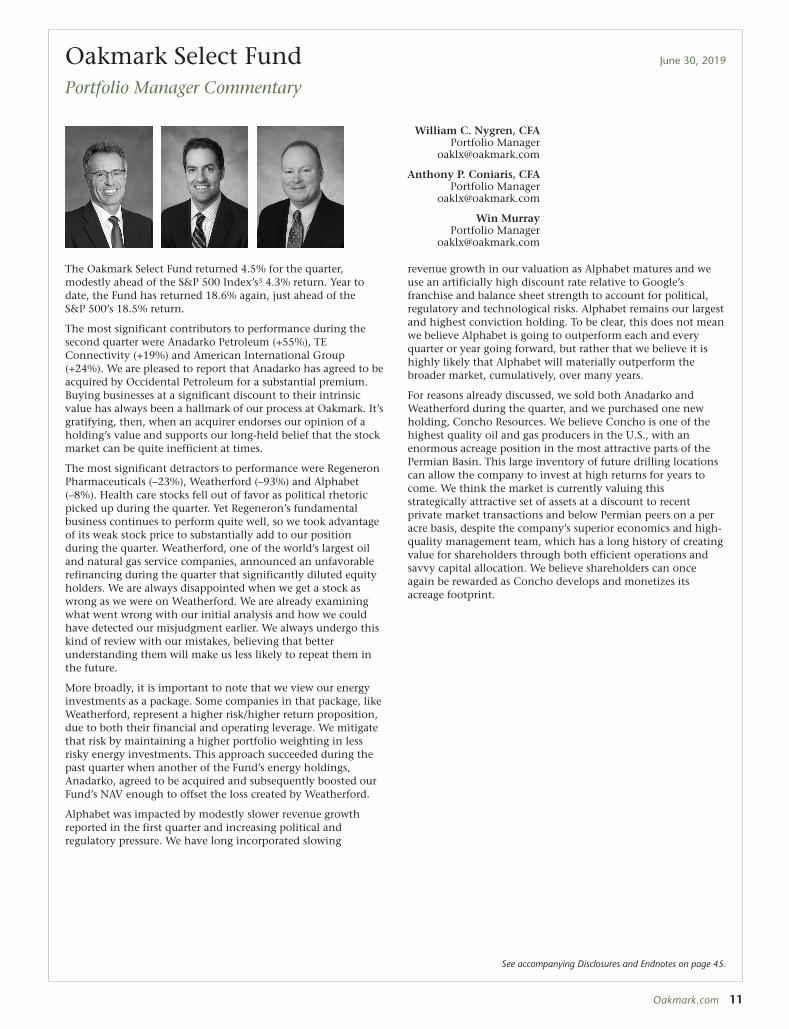
The Oakmark Select Fund returned 4.5% for the quarter,modestly ahead of the S&P 500 Index’s3 4.3% return. Year todate, the Fund has returned 18.6% again, just ahead of theS&P 500’s 18.5% return.
The most significant contributors to performance during thesecond quarter were Anadarko Petroleum (+55%), TEConnectivity (+19%) and American International Group(+24%). We are pleased to report that Anadarko has agreed to beacquired by Occidental Petroleum for a substantial premium.Buying businesses at a significant discount to their intrinsicvalue has always been a hallmark of our process at Oakmark. It’sgratifying, then, when an acquirer endorses our opinion of aholding’s value and supports our long-held belief that the stockmarket can be quite inefficient at times.
The most significant detractors to performance were RegeneronPharmaceuticals (–23%), Weatherford (–93%) and Alphabet(–8%). Health care stocks fell out of favor as political rhetoricpicked up during the quarter. Yet Regeneron’s fundamentalbusiness continues to perform quite well, so we took advantageof its weak stock price to substantially add to our positionduring the quarter. Weatherford, one of the world’s largest oiland natural gas service companies, announced an unfavorablerefinancing during the quarter that significantly diluted equityholders. We are always disappointed when we get a stock aswrong as we were on Weatherford. We are already examiningwhat went wrong with our initial analysis and how we couldhave detected our misjudgment earlier. We always undergo thiskind of review with our mistakes, believing that betterunderstanding them will make us less likely to repeat them inthe future.
More broadly, it is important to note that we view our energyinvestments as a package. Some companies in that package, likeWeatherford, represent a higher risk/higher return proposition,due to both their financial and operating leverage. We mitigatethat risk by maintaining a higher portfolio weighting in lessrisky energy investments. This approach succeeded during thepast quarter when another of the Fund’s energy holdings,Anadarko, agreed to be acquired and subsequently boosted ourFund’s NAV enough to offset the loss created by Weatherford.
Alphabet was impacted by modestly slower revenue growthreported in the first quarter and increasing political andregulatory pressure. We have long incorporated slowing
revenue growth in our valuation as Alphabet matures and weuse an artificially high discount rate relative to Google’sfranchise and balance sheet strength to account for political,regulatory and technological risks. Alphabet remains our largestand highest conviction holding. To be clear, this does not meanwe believe Alphabet is going to outperform each and everyquarter or year going forward, but rather that we believe it ishighly likely that Alphabet will materially outperform thebroader market, cumulatively, over many years.
For reasons already discussed, we sold both Anadarko andWeatherford during the quarter, and we purchased one newholding, Concho Resources. We believe Concho is one of thehighest quality oil and gas producers in the U.S., with anenormous acreage position in the most attractive parts of thePermian Basin. This large inventory of future drilling locationscan allow the company to invest at high returns for years tocome. We think the market is currently valuing thisstrategically attractive set of assets at a discount to recentprivate market transactions and below Permian peers on a peracre basis, despite the company’s superior economics and high-quality management team, which has a long history of creatingvalue for shareholders through both efficient operations andsavvy capital allocation. We believe shareholders can onceagain be rewarded as Concho develops and monetizes itsacreage footprint.
William C. Nygren, CFAPortfolio Manager
Anthony P. Coniaris, CFAPortfolio Manager
Win MurrayPortfolio Manager
See accompanying Disclosures and Endnotes on page 45.
Oakmark Select Fund June 30, 2019
Portfolio Manager Commentary
Toppan Merrill - Harris-Oakmark Harris Associates Investment Trust N-30B-2 033-38953 06-30-2019 ED | thunt | 14-Aug-19 09:45 | 19-12672-1.da | Sequence: 3CHKSUM Content: 6760 Layout: 22 Graphics: 55663 CLEAN
JOB: 19-12672-1 CYCLE#;BL#: 8 TRIM: 8.250 x 10.750 AS: Chicago: 877-427-2185COLORS: ~note-color 3, ~HTML color, Black, ~HTML color 2, PANTONE 364 U, ~note-color 2, ~watermark GRAPHICS: Win Murray_small_photo.eps, Anthony Coniaris_small.eps, william_nygren_photo.eps V1.5

Oakmark Select Fund June 30, 2019 (Unaudited)
Schedule of Investments (in thousands)
12 OAKMARK FUNDS
COMMON STOCKS - 95.9%FINANCIALS - 27.5%BANKS - 11.7%
Citigroup, Inc. 4,812 $336,984Bank of America Corp. 7,701 223,318
560,302
DIVERSIFIED FINANCIALS - 11.3%
Ally Financial, Inc. 10,730 332,523Capital One Financial Corp. 2,285 207,332
539,855
INSURANCE - 4.5%
American International Group, Inc. 3,995 212,864 1,313,021
COMMUNICATION SERVICES - 18.3%MEDIA & ENTERTAINMENT - 18.3%
Alphabet, Inc., Class C (a) 406 438,471Charter Communications, Inc., Class A (a) 564 222,881Netflix, Inc. (a) (b) 576 211,650
873,002
CONSUMER DISCRETIONARY - 15.1%AUTOMOBILES & COMPONENTS - 7.4%
Fiat Chrysler Automobiles N.V. 16,634 229,883Lear Corp. 900 125,343
355,226
CONSUMER SERVICES - 5.5%
MGM Resorts International 5,147 147,050Hilton Worldwide Holdings, Inc. 1,166 114,011
261,061
RETAILING - 2.2%
Qurate Retail, Inc. (a) 8,689 107,659 723,946
REAL ESTATE - 8.3%
CBRE Group, Inc., Class A (a) 7,748 397,447
INFORMATION TECHNOLOGY - 8.3%TECHNOLOGY HARDWARE & EQUIPMENT - 5.3%
TE Connectivity, Ltd. 2,623 251,225
SOFTWARE & SERVICES - 3.0%
MasterCard, Inc., Class A 545 144,169 395,394
INDUSTRIALS - 8.0%CAPITAL GOODS - 4.4%
General Electric Co. 20,140 211,470
TRANSPORTATION - 3.6%
American Airlines Group, Inc. 5,240 170,876 382,346
Shares Value
ENERGY - 6.3%
Concho Resources, Inc. 1,500 $154,770Apache Corp. 5,149 149,160
303,930
HEALTH CARE - 4.1%PHARMACEUTICALS, BIOTECHNOLOGY & LIFE SCIENCES - 4.1%
Regeneron Pharmaceuticals, Inc. (a) 620 194,060
TOTAL COMMON STOCKS - 95.9%(COST $2,901,495) 4,583,146
Par Value Value
SHORT-TERM INVESTMENTS - 4.8%GOVERNMENT AND AGENCY SECURITIES - 3.7%Federal Home Loan Bank,
2.13%, due 07/01/19 (c)(Cost $175,000) $175,000 175,000
Total Government and Agency Securities(Cost $175,000) 175,000
REPURCHASE AGREEMENT - 1.1%Fixed Income Clearing Corp. Repurchase Agreement, 1.50% dated 06/28/19 due 07/01/19, repurchase price $53,219, collateralized by a United States Treasury Note, 1.875% due 03/31/22, value plus accrued interest of $54,278 (Cost: $53,212) 53,212 53,212
TOTAL SHORT-TERM INVESTMENTS - 4.8%(COST $228,212) 228,212
TOTAL INVESTMENTS - 100.7%(COST $3,129,707) 4,811,358
Liabilities In Excess of Other Assets - (0.7)% (34,051)
TOTAL NET ASSETS - 100.0% $4,777,307
(a) Non-income producing security
(b) All or a portion of this investment is held in connection with one or more holdingswithin the Fund.
(c) The rate shown represents the annualized yield at the time of purchase; not acoupon rate.
Shares Value
Toppan Merrill - Harris-Oakmark Harris Associates Investment Trust N-30B-2 033-38953 06-30-2019 ED | thunt | 14-Aug-19 09:45 | 19-12672-1.db | Sequence: 1CHKSUM Content: 48563 Layout: 25591 Graphics: 0 CLEAN
JOB: 19-12672-1 CYCLE#;BL#: 8 TRIM: 8.250 x 10.750 AS: Chicago: 877-427-2185COLORS: ~note-color 2, PANTONE 364 U, Black, ~note-color 3 GRAPHICS: none V1.5

Oakmark Select Fund June 30, 2019 (Unaudited)
Schedule of Investments (in thousands) (continued)
WRITTEN OPTIONS
Premiums Exercise Expiration Number of Notional Market (Received) Unrealized Description Price Date Contracts Amount Value by Fund Gain/(Loss)
CALLS
Netflix, Inc. $410.00 10/18/2019 (29) $(1,065) $(44) $(87) $43
$(1,065) $(44) $(87) $43
Oakmark.com 13
Toppan Merrill - Harris-Oakmark Harris Associates Investment Trust N-30B-2 033-38953 06-30-2019 ED | thunt | 14-Aug-19 09:45 | 19-12672-1.db | Sequence: 2CHKSUM Content: 41820 Layout: 17017 Graphics: 0 CLEAN
JOB: 19-12672-1 CYCLE#;BL#: 8 TRIM: 8.250 x 10.750 AS: Chicago: 877-427-2185COLORS: ~note-color 2, PANTONE 364 U, Black, ~note-color 3 GRAPHICS: none V1.5

14 OAKMARK FUNDS
Oakmark Equity and Income Fund June 30, 2019
Summary Information
VALUE OF A $10,000 INVESTMENTSince Inception - 11/01/95 (Unaudited)
PERFORMANCE Average Annual Total Returns (as of 06/30/19)
Total Return Since Inception(Unaudited) Last 3 Months 1-year 3-year 5-year 10-year Inception Date
Oakmark Equity and Income Fund (Investor Class) 3.45% 4.63% 9.30% 4.94% 8.72% 9.84% 11/01/95Lipper Balanced Fund Index 3.39% 6.79% 8.18% 5.79% 9.09% 6.88%S&P 500 Index 4.30% 10.42% 14.19% 10.71% 14.70% 9.13%Barclays U.S. Govt./Credit Index 3.53% 8.52% 2.41% 3.11% 4.09% 5.19%Oakmark Equity and Income Fund (Advisor Class) 3.45% 4.75% N/A N/A N/A 7.44% 11/30/16Oakmark Equity and Income Fund (Institutional Class) 3.49% 4.84% N/A N/A N/A 7.48% 11/30/16Oakmark Equity and Income Fund (Service Class) 3.37% 4.30% 9.00% 4.63% 8.38% 8.21% 07/12/00
The graph and table above do not reflect the deduction of taxes that a shareholder would pay on Fund distributions or the redemption of Fund shares.Past performance is no guarantee of future results. The performance data quoted represents past performance. Current performance may belower or higher than the performance data quoted. Total return includes change in share prices and, in each case, includes reinvestment of dividendsand capital gain distributions. The investment return and principal value vary so that an investor’s shares when redeemed may be worth more orless than the original cost. To obtain the most recent month-end performance, please visit Oakmark.com.
$10,000
S&P 500 Index3 $78,986
Lipper Balanced FundIndex9 $48,260
Barclays U.S. Govt./Credit Index10 $33,072
$70,000
$40,000
$100,000
20011999 20072003 2005 201920172009 2011 2013 20151995 1997
Oakmark Equity and IncomeFund (Investor Class) $92,157
TOP TEN EQUITY HOLDINGS6 % of Net Assets
Bank of America Corp. 5.5General Motors Co. 5.2TE Connectivity, Ltd. 4.6MasterCard, Inc., Class A 3.5Nestlé SA 3.2Citigroup, Inc. 2.4Philip Morris International, Inc. 2.4Alphabet, Inc., Class C 2.4CVS Health Corp. 2.1Charter Communications, Inc., Class A 2.1
SECTOR ALLOCATION % of Net Assets
Equity InvestmentsFinancials 12.3Consumer Discretionary 11.5Information Technology 9.6Consumer Staples 7.9Health Care 5.7Communication Services 5.2Industrials 4.2Energy 2.4Real Estate 1.3Materials 1.0Total Equity Investments 61.0
Preferred Stocks 0.1Fixed Income Investments
Corporate Bonds 18.4Government and Agency Securities 11.5Covertible Bonds 0.1Total Fixed Income Investments 30.0
Short-Term Investments and Other 8.9
FUND STATISTICSTicker* OAKBXNumber of Equity Holdings 41Net Assets $12.5 billionWeighted Average Market Cap $131.6 billionMedian Market Cap $32.3 billionGross Expense Ratio - Investor Class (as of 09/30/18)* 0.88%Net Expense Ratio - Investor Class (as of 09/30/18)*† 0.78%
* This information is related to the Investor Class. Please visitOakmark.com for information related to the Advisor, Institutional andService Classes.
† The net expense ratio reflects a contractual advisory fee waiveragreement through January 27, 2020.
See accompanying Disclosures and Endnotes on page 45.
Toppan Merrill - Harris-Oakmark Harris Associates Investment Trust N-30B-2 033-38953 06-30-2019 ED | thunt | 14-Aug-19 09:45 | 19-12672-1.ea | Sequence: 1CHKSUM Content: 31734 Layout: 10481 Graphics: 5902 CLEAN
JOB: 19-12672-1 CYCLE#;BL#: 8 TRIM: 8.250 x 10.750 AS: Chicago: 877-427-2185COLORS: ~note-color 3, ~HTML color, Black, ~HTML color 2, PANTONE 364 U, ~note-color 2, ~watermark GRAPHICS: 12672-1_Equity_Income_L.eps V1.5

Clyde S. McGregor, CFAPortfolio Manager
M. Colin Hudson, CFAPortfolio Manager
Edward J. Wojciechowski, CFAPortfolio Manager
Negative Interest Rates?A few years ago, we told the story of a Danish sex therapist whohad recently refinanced the mortgage on her workplace andwas now pleased to receive a monthly check from her bank inthe amount of seven euros. We thought that this illustrated theabsurdity of negative interest rates. We also believed that some-thing this eccentric could not persist. How wrong we were! Atthe end of June, more than $12 trillion (yes, trillion!) faceamount of bonds from outside the U.S. were trading at pricesguaranteed to repay their owners less than their acquisitioncost—i.e., they were priced with negative interest rates. The keyGerman government bond (the bund) may be the best knownexample of this phenomenon, trading at prices that yield ratesaround –40 basis points (–0.4%) on the 10-year issue. Many fac-tors have contributed to this outcome. In particular, the German government has managed its budget to yield surplusesand the European Central Bank has been buying up bonds in itseffort to stimulate economic activity. To date, however, it is notobvious that the activities of these central banks have producedtheir desired outcomes: higher inflation and economic growth.
These central bank actions make us uncomfortable. Interestrates are the price of money, and prices usually function bestwhen given the freedom to move. In the U.S., we still havemodestly positive interest rates, though there is constant politi-cal pressure to push them even lower. In addition, foreignmoney that is fleeing negative rates elsewhere is migrating tothe U.S. in search of some yield, which is also keeping U.S. rateslow. For any of us who lived through the Carter/Reagan era,today’s rates appear incredible, although we also remember thehigh price inflation from that time.
Managing the fixed income component of the Fund is espe-cially challenging in this rate environment. We continuallylook for opportunities to enhance the Fund’s income genera-tion without taking on undue risk. And when rates rise to rea-sonable levels, we increase the fixed income allocation andlengthen duration. In the same manner, when interest ratesdecline meaningfully, we stay quiet in managing the fixedincome allocation, allowing that allocation to attrite and dura-tion to shrink. Do not expect to find bonds with negative yieldsin this portfolio.
Extremely low interest rates also affect equity markets. Equitiesare long-duration assets—their income stream (dividends) isgenerally modest and their terminal value uncertain. Interestrates help to determine the discount rate that investors usewhen valuing equities. As rates decline, so do discount rates.And lower discount rates make future cash flows more valuable.Low interest rates, therefore, have played an important role ingrowth stocks’ dominance over value stocks since the financialcrisis. As value investors, our understanding of value evolves asthe investing environment changes. Although the current term
structure of interest rates is far from ideal, it is our charge tosucceed for our shareholders in all circumstances, including thisabnormal interest rate environment.
Quarter ReviewThe quarter ending June 30 experienced considerable stockmarket volatility. Securities markets delivered strong results inApril and June, while May proved quite painful for investors.Calendar demarcations do not usually have much meaning forthe pattern of investment returns, but they did in the recentquarter. The Equity and Income Fund earned 3.5% in the quar-ter, which compares to the Lipper Balanced Fund Index’s9, theFund’s performance benchmark, 3.4% return. For the calendarsix months, the Fund gained 12.5%, compared to 12.2% for theLipper. The Fund’s nine-month fiscal-year return was 2.1%,compared to 3.6% for the Lipper. The annualized compoundrate of return since the Fund’s inception in 1995 is 9.8%, whilethe corresponding return to Lipper is 6.9%.
TE Connectivity, Anadarko Petroleum, Mastercard, Nestlé andArconic were the largest contributors to return in the quarter.The largest detractors were Foot Locker, Philip Morris Interna-tional, National Oilwell Varco, Alphabet and Regeneron Phar-maceuticals. Short-term earnings concerns caused price declinesin Foot Locker, Philip Morris and Regeneron. Energy stocks,such as National Oilwell Varco, performed poorly as the price ofoil declined into bear market territory during the quarter.Alphabet and other large technology companies saw their pricesretreat as political discourse turned quite negative on the group.Trade war fears also roiled markets and individual stocks. Forthe calendar six months, Mastercard, TE Connectivity, GeneralMotors, Bank of America and Nestlé contributed most, whileCVS Health, Foot Locker, National Oilwell Varco, Regeneronand LivaNova were the biggest detractors from return. For thenine months of the Fund’s fiscal year, General Motors, Nestlé,Mastercard, TE Connectivity and Diageo led the contributors’list, while National Oilwell Varco, CVS Health, State Street,LivaNova and Alphabet detracted.
Despite the difficult environment for the energy industry,Anadarko made it onto this quarter’s contributor list when itbecame the subject of a takeover competition between Chevronand Occidental Petroleum, the latter of which won the contest.We exited the position with a 28% gain for the Fund. We arealways glad to see our valuation judgments validated when acorporate transaction occurs. This transaction, however, did notfully validate our thesis for Anadarko as our price expectationswere materially higher. The price of oil has declined signifi-cantly since mid-May as U.S. oil production continues to bur-geon (the U.S. is now the largest oil-producing country), andindustry participants may be forecasting lower prices for longer.The Anadarko transaction and other market activity force us to
Oakmark.com 15
Oakmark Equity and Income Fund June 30, 2019
Portfolio Manager Commentary
See accompanying Disclosures and Endnotes on page 45.
Toppan Merrill - Harris-Oakmark Harris Associates Investment Trust N-30B-2 033-38953 06-30-2019 ED | thunt | 14-Aug-19 09:45 | 19-12672-1.ea | Sequence: 2CHKSUM Content: 27979 Layout: 27146 Graphics: 56664 CLEAN
JOB: 19-12672-1 CYCLE#;BL#: 8 TRIM: 8.250 x 10.750 AS: Chicago: 877-427-2185COLORS: ~note-color 3, ~HTML color, Black, ~HTML color 2, PANTONE 364 U, ~note-color 2, ~watermark GRAPHICS: ed_wojciechowski_photo.eps, M._Colin_Hudson_small.eps, clyde_mcgregor_photo.eps V1.5

reassess our understanding of exploration and production company values.
Transaction ActivityDuring the quarter, the Fund added three new positions andalso exited three holdings. Beginning alphabetically, Constella-tion Brands is the top imported beer company in the U.S. andone of the world’s leading wine producers. We believe that thecompany’s valuation is compelling due to the robust long-termgrowth outlook of its strong beer and wine brands. Over thepast five years, Constellation’s beer segment—which includesCorona, Modelo and Pacifico, among other brands—has grownits sales volume and revenue at a 10% and 12% compoundannual growth rate, respectively. The company accomplishedthis impressive growth at a time when industry volume growthremained relatively flat. Despite a market-leading, medium-term growth outlook that calls for high single-digit revenuegrowth within its beer segment and low-to-mid single-digitgrowth within its wine and spirits portfolio, we believe Constel-lation trades at a meaningful discount to its peers, many ofwhich are experiencing slow to no growth. The company hasalso established a strategic partnership and large ownershipstake in the world’s largest publicly traded cannabis company,Canopy Growth Group. We believe this partnership positionsConstellation to potentially become one of the bigger benefici-aries in a category that some project could exceed $200 billionin global demand over the next 10 to 15 years. On our one-yearforward earnings estimate, Constellation trades in line with theearnings multiple for the overall market without giving thecompany any value for its significant stake in Canopy. Due to asubstantial stock price decline associated with fears aboutincreasing Mexican tariffs, we were able to invest in this above-average business at just an average price.
Our second purchase was Diamondback Energy, an oil and gasproducer with a high-quality acreage position located entirelyin the Permian Basin. The Permian Basin is the largest and low-est cost basin within the U.S., positioning Diamondback at thebottom of the global cost curve. CEO Travis Stice and his man-agement team have produced industry-leading returns at Dia-mondback by focusing on low-cost operations and bestexecution. We like management’s focus on per share value andwe believe the market doesn’t appreciate Diamondback’sacreage quality and drilling inventory following its acquisitionof Energen. Diamondback is growing production 15% perannum with a mid-single-digit free cash flow yield and trades ata significant discount to net asset value and historical per acremultiples.
The final purchase was TD Ameritrade, which makes a return tothe portfolio after being sold at a similar price during the fourthquarter of 2017. Ameritrade provides brokerage services to retailand independent registered investment advisors. The companyhas continually gained market share and is usually ranked nearthe top for overall satisfaction among online brokers. Manage-ment has supplemented this strong organic growth with smartcapital allocation, including the very accretive acquisition ofScottrade. Due to worries about declining interest rates, thestock price has declined by nearly 20% and now trades at lessthan 12x our estimate of year-ahead earnings. Although lowerrates will provide a headwind, we still believe that with contin-ued high single-digit net new asset growth and share repur-chase, EPS should grow over the next couple of years. Trading at
a large discount to our estimate of intrinsic value, we are happyto welcome this well-managed, high-return business back to theportfolio.
The three stocks we exited were Anadarko (discussed above),Qurate Retail and Bank of New York Mellon. Qurate was a smallholding that entered the portfolio when the company acquiredFund holding Home Shopping Network. Qurate’s business fun-damentals have failed to meet our expectations, so we decidedto take the tax loss and move on. Bank of New York Mellon hasperformed reasonably well since we purchased the stock andalthough we still believe that it is undervalued, we decided tosell the position and buy Ameritrade, which we believe is evenmore undervalued.
As always, we thank our shareholders for entrusting their assetsto the Fund and welcome your questions and comments.
16 OAKMARK FUNDS
Oakmark Equity and Income Fund June 30, 2019
Portfolio Manager Commentary (continued)
See accompanying Disclosures and Endnotes on page 45.
Toppan Merrill - Harris-Oakmark Harris Associates Investment Trust N-30B-2 033-38953 06-30-2019 ED | thunt | 14-Aug-19 09:45 | 19-12672-1.ea | Sequence: 3CHKSUM Content: 16987 Layout: 63019 Graphics: 0 CLEAN
JOB: 19-12672-1 CYCLE#;BL#: 8 TRIM: 8.250 x 10.750 AS: Chicago: 877-427-2185COLORS: PANTONE 364 U, ~note-color 3, Black, ~note-color 2 GRAPHICS: none V1.5

Oakmark Equity and Income Fund June 30, 2019 (Unaudited)
Schedule of Investments (in thousands)
COMMON STOCKS - 61.0%FINANCIALS - 12.3%BANKS - 8.0%
Bank of America Corp. 23,855 $691,792Citigroup, Inc. 4,360 305,310
997,102
DIVERSIFIED FINANCIALS - 3.2%
Ally Financial, Inc. 8,256 255,857State Street Corp. 1,551 86,960TD Ameritrade Holding Corp. 1,201 59,949
402,766
INSURANCE - 1.1%
American International Group, Inc. 2,551 135,894 1,535,762
CONSUMER DISCRETIONARY - 11.5%AUTOMOBILES & COMPONENTS - 8.7%
General Motors Co. 16,861 649,662BorgWarner, Inc. 5,652 237,254Lear Corp. 1,433 199,509
1,086,425
RETAILING - 1.8%
Foot Locker, Inc. 3,520 147,541Booking Holdings, Inc. (a) 41 76,001
223,542
CONSUMER SERVICES - 0.5%
MGM Resorts International 2,351 67,175
CONSUMER DURABLES & APPAREL - 0.5%
Carter’s, Inc. 664 64,796 1,441,938
INFORMATION TECHNOLOGY - 9.6%SOFTWARE & SERVICES - 5.0%
MasterCard, Inc., Class A 1,648 435,840Oracle Corp. 2,236 127,362CoreLogic, Inc. (a) 1,293 54,086
617,288
TECHNOLOGY HARDWARE & EQUIPMENT - 4.6%
TE Connectivity, Ltd. 6,053 579,708 1,196,996
CONSUMER STAPLES - 7.8%FOOD, BEVERAGE & TOBACCO - 7.8%
Nestlé SA (b) 3,834 396,435Philip Morris International, Inc. 3,802 298,540Diageo PLC (b) 1,467 252,759Constellation Brands, Inc., Class A 174 34,189
981,923
Shares Value
HEALTH CARE - 5.7%HEALTH CARE EQUIPMENT & SERVICES - 4.9%
CVS Health Corp. 4,911 $267,620UnitedHealth Group, Inc. 787 192,094HCA Healthcare, Inc. 736 99,458LivaNova PLC (a) 757 54,509
613,681
PHARMACEUTICALS, BIOTECHNOLOGY & LIFE SCIENCES - 0.8%
Regeneron Pharmaceuticals, Inc. (a) 302 94,557 708,238
COMMUNICATION SERVICES - 5.2%MEDIA & ENTERTAINMENT - 5.2%
Alphabet, Inc., Class C (a) 275 296,710Charter Communications, Inc., Class A (a) 672 265,640Comcast Corp., Class A 2,120 89,633
651,983
INDUSTRIALS - 4.2%CAPITAL GOODS - 3.4%
Arconic, Inc. 5,816 150,172Johnson Controls International plc 3,165 130,763Carlisle Cos., Inc. 718 100,842WESCO International, Inc. (a) 890 45,060
426,837
TRANSPORTATION - 0.8%
American Airlines Group, Inc. 2,924 95,337 522,174
ENERGY - 2.4%
National Oilwell Varco, Inc. 4,684 104,122Diamondback Energy, Inc. 637 69,403Apergy Corp. (a) 1,926 64,593PDC Energy, Inc. (a) 1,791 64,592
302,710
REAL ESTATE - 1.3%
The Howard Hughes Corp. (a) 735 91,040Gaming and Leisure Properties, Inc. REIT 1,833 71,435
162,475
MATERIALS - 1.0%Glencore PLC 35,440 123,027
TOTAL COMMON STOCKS - 61.0%(COST $4,401,726) 7,627,226
PREFERRED STOCKS - 0.1%FINANCIALS - 0.1%
GMAC Capital Trust I (c), 8.30% (3 mo. USD LIBOR + 5.785%), 498 13,000
TOTAL PREFERRED STOCKS - 0.1%(COST $13,007) 13,000
Shares Value
Oakmark.com 17
Toppan Merrill - Harris-Oakmark Harris Associates Investment Trust N-30B-2 033-38953 06-30-2019 ED | thunt | 14-Aug-19 09:45 | 19-12672-1.eb | Sequence: 1CHKSUM Content: 57856 Layout: 17912 Graphics: 0 CLEAN
JOB: 19-12672-1 CYCLE#;BL#: 8 TRIM: 8.250 x 10.750 AS: Chicago: 877-427-2185COLORS: ~note-color 2, PANTONE 364 U, Black, ~note-color 3 GRAPHICS: none V1.5

Oakmark Equity and Income Fund June 30, 2019 (Unaudited)
Schedule of Investments (in thousands) (continued)
18 OAKMARK FUNDS
FIXED INCOME - 30.0%CORPORATE BONDS - 18.4%FINANCIALS - 4.7%
Ally Financial, Inc.3.75%, due 11/18/19 $23,340 $23,3873.875%, due 05/21/24 7,950 8,139
American Express Credit Corp.2.60%, due 09/14/20 2,945 2,956
American International Group, Inc.3.30%, due 03/01/21 14,665 14,863
Aon Corp.5.00%, due 09/30/20 14,745 15,235
Bank of America Corp.2.151%, due 11/09/20 6,970 6,9494.45%, due 03/03/26 5,000 5,393
BNP Paribas SA, 144A7.625% (USD 5 Year Swap rate + 6.314%) (c) (d) (e) 5,000 5,294
Capital One NA1.85%, due 09/13/19 39,255 39,201
Citigroup, Inc.3.352%(3 mo. USD LIBOR + 0.897%), due 04/24/25 (c) 22,860 23,6143.40%, due 05/01/26 15,000 15,5264.05%, due 07/30/22 13,338 13,917
CNO Financial Group, Inc.5.25%, due 05/30/25 5,895 6,352
Credit Suisse Group AG, 144A7.50%(USD 5 Year Swap rate + 4.598%) (c) (d) (e) 30,000 33,0006.25%(USD 5 Year Swap rate + 3.455%) (c) (d) (e) 7,000 7,289
Credit Suisse Group Funding Guernsey, Ltd.3.125%, due 12/10/20 25,000 25,1933.80%, due 06/09/23 14,750 15,297
E*TRADE Financial Corp.2.95%, due 08/24/22 11,965 12,0833.80%, due 08/24/27 4,975 5,009
JPMorgan Chase & Co.2.972%, due 01/15/23 29,765 30,1973.514%(3 mo. USD LIBOR + 0.610%), due 06/18/22 (c) 24,870 25,4163.811%(3 mo. USD LIBOR + 1.230%), due 10/24/23 (c) 19,910 20,211
Moody’s Corp.4.50%, due 09/01/22 13,040 13,7942.625%, due 01/15/23 12,201 12,2645.50%, due 09/01/20 3,780 3,914
MSCI, Inc., 144A5.25%, due 11/15/24 (d) 24,830 25,6375.375%, due 05/15/27 (d) 6,965 7,4534.75%, due 08/01/26 (d) 5,925 6,1475.75%, due 08/15/25 (d) 2,950 3,097
Principal Life Global Funding II, 144A2.15%, due 01/10/20 (d) 19,910 19,8782.375%, due 11/21/21 (d) 6,970 6,973
Reinsurance Group of America, Inc.3.95%, due 09/15/26 4,905 5,120
Par Value Value
S&P Global, Inc.4.00%, due 06/15/25 $17,150 $18,6222.95%, due 01/22/27 9,810 9,9394.40%, due 02/15/26 1,970 2,1713.30%, due 08/14/20 1,970 1,991
The Charles Schwab Corp.3.25%, due 05/21/21 19,895 20,280
The Goldman Sachs Group, Inc.2.35%, due 11/15/21 14,616 14,6013.20%, due 02/23/23 7,000 7,1642.30%, due 12/13/19 6,970 6,9674.332%(3 mo. USD LIBOR + 1.750%), due 10/28/27 (c) 2,975 3,0362.625%, due 04/25/21 2,000 2,0072.875%, due 02/25/21 1,000 1,0072.55%, due 10/23/19 980 980
Wells Fargo & Co.3.069%, due 01/24/23 14,930 15,1623.813%(3 mo. USD LIBOR + 1.230%), due 10/31/23 (c) 8,603 8,766
Wells Fargo Bank NA3.625%, due 10/22/21 10,000 10,2822.15%, due 12/06/19 9,900 9,891 591,664
CONSUMER DISCRETIONARY - 3.7%
Adient US LLC, 144A7.00%, due 05/15/26 (d) 15,965 16,404
Amazon.com, Inc.3.15%, due 08/22/27 9,950 10,459
Booking Holdings, Inc.3.60%, due 06/01/26 14,730 15,5323.55%, due 03/15/28 9,950 10,3712.75%, due 03/15/23 6,965 7,063
BorgWarner, Inc.4.625%, due 09/15/20 10,810 11,063
Boyd Gaming Corp.6.00%, due 08/15/26 4,975 5,230
Caesars Resort Collection LLC / CRC Finco, Inc., 144A5.25%, due 10/15/25 (d) 25,870 25,951
CCO Holdings LLC / CCO Holdings Capital Corp., 144A5.125%, due 05/01/27 (d) 250 259
Charter Communications Operating LLC / Charter Communications Operating Capital3.579%, due 07/23/20 29,148 29,4094.20%, due 03/15/28 9,950 10,3364.50%, due 02/01/24 2,985 3,181
Delphi Technologies PLC, 144A5.00%, due 10/01/25 (d) 18,341 16,369
Dollar Tree, Inc.3.288% (3 mo. USD LIBOR + 0.700%), due 04/17/20 (c) 6,965 6,966
Expedia Group, Inc.5.00%, due 02/15/26 28,360 30,891
Foot Locker, Inc.8.50%, due 01/15/22 4,340 4,817
Par Value Value
Toppan Merrill - Harris-Oakmark Harris Associates Investment Trust N-30B-2 033-38953 06-30-2019 ED | thunt | 14-Aug-19 09:45 | 19-12672-1.eb | Sequence: 2CHKSUM Content: 52273 Layout: 29650 Graphics: 0 CLEAN
JOB: 19-12672-1 CYCLE#;BL#: 8 TRIM: 8.250 x 10.750 AS: Chicago: 877-427-2185COLORS: ~note-color 2, PANTONE 364 U, Black, ~note-color 3 GRAPHICS: none V1.5

Oakmark Equity and Income Fund June 30, 2019 (Unaudited)
Schedule of Investments (in thousands) (continued)
FIXED INCOME - 30.0% (continued)CORPORATE BONDS - 18.4% (continued)
General Motors Co.4.875%, due 10/02/23 $41,400 $43,905
General Motors Financial Co., Inc.3.50%, due 07/10/19 $4,975 $4,976
Hyatt Hotels Corp.4.375%, due 09/15/28 7,960 8,421
International Game Technology PLC, 144A6.50%, due 02/15/25 (d) 19,600 21,4136.25%, due 02/15/22 (d) 14,800 15,6326.25%, due 01/15/27 (d) 200 219
KFC Holding Co/Pizza Hut Holdings LLC/Taco Bell of America LLC, 144A5.25%, due 06/01/26 (d) 1,000 1,0495.00%, due 06/01/24 (d) 1,000 1,034
Lear Corp.5.25%, due 01/15/25 11,060 11,4594.25%, due 05/15/29 7,955 8,036
Lithia Motors, Inc., 144A5.25%, due 08/01/25 (d) 1,990 2,050
Marriott International, Inc.3.60%, due 04/15/24 6,960 7,2544.00%, due 04/15/28 4,975 5,241
MGM Resorts International5.75%, due 06/15/25 2,985 3,247
Penn National Gaming, Inc., 144A5.625%, due 01/15/27 (d) 9,950 9,826
Penske Automotive Group, Inc.5.50%, due 05/15/26 11,343 11,8255.375%, due 12/01/24 3,580 3,678
Sands China, Ltd.5.40%, due 08/08/28 5,000 5,4305.125%, due 08/08/25 3,000 3,2164.60%, due 08/08/23 2,000 2,102
Scientific Games International, Inc., 144A5.00%, due 10/15/25 (d) 19,910 20,109
Starbucks Corp.3.80%, due 08/15/25 9,950 10,6194.00%, due 11/15/28 2,985 3,253
Station Casinos LLC, 144A5.00%, due 10/01/25 (d) 1,990 1,995
Tapestry, Inc.3.00%, due 07/15/22 12,145 12,1594.125%, due 07/15/27 4,975 5,003
Tempur Sealy International, Inc.5.50%, due 06/15/26 3,125 3,242
The Gap, Inc.5.95%, due 04/12/21 1,965 2,052
The William Carter Co., 144A5.625%, due 03/15/27 (d) 1,750 1,833
Under Armour, Inc.3.25%, due 06/15/26 12,565 11,857
Wolverine World Wide, Inc., 144A5.00%, due 09/01/26 (d) 12,140 11,988
Yum! Brands, Inc.3.875%, due 11/01/23 6,329 6,412 464,836
Par Value Value
HEALTH CARE - 2.3%
Abbott Laboratories2.90%, due 11/30/21 $16,625 $16,900
AbbVie, Inc.3.75%, due 11/14/23 6,965 7,252
Becton Dickinson and Co.2.675%, due 12/15/19 22,756 22,7633.30%, due 03/01/23 11,204 11,3313.194%(3 mo. USD LIBOR + 0.875%), due 12/29/20 (c) 7,463 7,4643.363%, due 06/06/24 2,985 3,0742.894%, due 06/06/22 2,985 3,026
Centene Corp.4.75%, due 05/15/22 20,084 20,511
CVS Health Corp.4.00%, due 12/05/23 18,198 19,0465.00%, due 12/01/24 6,880 7,5104.75%, due 12/01/22 6,880 7,3062.25%, due 08/12/19 2,884 2,883
Edwards Lifesciences Corp.4.30%, due 06/15/28 6,965 7,530
Express Scripts Holding Co.3.30%, due 02/25/21 4,915 4,980
HCA, Inc.6.50%, due 02/15/20 9,895 10,1235.00%, due 03/15/24 7,465 8,1335.625%, due 09/01/28 2,985 3,2314.25%, due 10/15/19 1,990 1,9985.375%, due 09/01/26 500 539
IQVIA, Inc., 144A5.00%, due 10/15/26 (d) 7,800 8,054
Johnson & Johnson2.90%, due 01/15/28 9,955 10,236
McKesson Corp.3.65%, due 11/30/20 19,890 20,2943.95%, due 02/16/28 2,985 3,095
Quest Diagnostics, Inc.4.70%, due 04/01/21 5,128 5,314
Thermo Fisher Scientific, Inc.3.00%, due 04/15/23 1,970 2,020
Universal Health Services, Inc., 144A4.75%, due 08/01/22 (d) 32,695 32,9815.00%, due 06/01/26 (d) 12,805 13,221
Zimmer Biomet Holdings, Inc.4.625%, due 11/30/19 10,345 10,4283.169%(3 mo. USD LIBOR + 0.750%), due 03/19/21 (c) 4,975 4,9703.15%, due 04/01/22 3,810 3,8703.70%, due 03/19/23 2,985 3,080 283,163
COMMUNICATION SERVICES - 2.0%
Comcast Corp.3.45%, due 10/01/21 9,950 10,2383.30%, due 10/01/20 9,950 10,0863.95%, due 10/15/25 4,975 5,367
Discovery Communications LLC2.80%, due 06/15/20 3,930 3,938
Par Value Value
Oakmark.com 19
Toppan Merrill - Harris-Oakmark Harris Associates Investment Trust N-30B-2 033-38953 06-30-2019 ED | thunt | 14-Aug-19 09:45 | 19-12672-1.eb | Sequence: 3CHKSUM Content: 4084 Layout: 30040 Graphics: 0 CLEAN
JOB: 19-12672-1 CYCLE#;BL#: 8 TRIM: 8.250 x 10.750 AS: Chicago: 877-427-2185COLORS: ~note-color 2, PANTONE 364 U, Black, ~note-color 3 GRAPHICS: none V1.5

Oakmark Equity and Income Fund June 30, 2019 (Unaudited)
Schedule of Investments (in thousands) (continued)
20 OAKMARK FUNDS
FIXED INCOME - 30.0% (continued)CORPORATE BONDS - 18.4% (continued)
DISH DBS Corp.5.875%, due 11/15/24 $10,435 $9,8745.00%, due 03/15/23 9,940 9,604
Electronic Arts, Inc.4.80%, due 03/01/26 19,655 21,8023.70%, due 03/01/21 14,740 15,004
Intelsat Jackson Holdings SA, 144A8.00%, due 02/15/24 (d) 26,069 27,177
Live Nation Entertainment, Inc., 144A4.875%, due 11/01/24 (d) 14,935 15,3645.375%, due 06/15/22 (d) 6,975 7,0625.625%, due 03/15/26 (d) 4,975 5,218
Netflix, Inc.4.875%, due 04/15/28 31,840 32,8355.875%, due 02/15/25 11,940 13,1645.875%, due 11/15/28 6,965 7,7115.375%, due 02/01/21 1,990 2,057
Netflix, Inc., 144A5.375%, due 11/15/29 (d) 4,970 5,2796.375%, due 05/15/29 (d) 2,985 3,393
Omnicom Group, Inc. / Omnicom Capital, Inc.3.625%, due 05/01/22 30,425 31,4106.25%, due 07/15/19 2,950 2,954
Tribune Media Co.5.875%, due 07/15/22 1,000 1,017
Zayo Group LLC / Zayo Capital, Inc.6.00%, due 04/01/23 14,745 15,077 255,631
INDUSTRIALS - 1.8%
Bacardi, Ltd., 144A4.45%, due 05/15/25 (d) 14,900 15,840
BAT Capital Corp.2.297%, due 08/14/20 19,900 19,8593.557%, due 08/15/27 6,965 6,928
Delta Air Lines, Inc.3.40%, due 04/19/21 11,590 11,7643.80%, due 04/19/23 9,425 9,676
Fortune Brands Home & Security, Inc.4.00%, due 06/15/25 13,430 14,1314.00%, due 09/21/23 9,945 10,468
General Electric Co.5.00% (3 mo. USD LIBOR + 3.330%) (c) (e) 12,430 11,988
Hilton Domestic Operating Co., Inc.5.125%, due 05/01/26 16,915 17,655
Southwest Airlines Co.2.65%, due 11/05/20 12,148 12,199
Stanley Black & Decker, Inc.4.25%, due 11/15/28 6,965 7,737
Uber Technologies, Inc., 144A8.00%, due 11/01/26 (d) 11,430 12,1747.50%, due 11/01/23 (d) 10,000 10,600
Union Pacific Corp.3.75%, due 07/15/25 9,950 10,6343.50%, due 06/08/23 6,965 7,2603.20%, due 06/08/21 6,965 7,089
Par Value Value
United Technologies Corp.3.65%, due 08/16/23 $4,975 $5,2103.95%, due 08/16/25 1,990 2,1463.35%, due 08/16/21 1,990 2,034
Wabtec Corp.3.71% (3 mo. USD LIBOR + 1.300%), due 09/15/21 (c) 4,975 4,961
Welbilt, Inc.9.50%, due 02/15/24 4,915 5,321
WESCO Distribution, Inc.5.375%, due 06/15/24 13,675 14,0175.375%, due 12/15/21 5,305 5,345 225,036
INFORMATION TECHNOLOGY - 1.6%
Avnet, Inc.4.875%, due 12/01/22 8,275 8,7763.75%, due 12/01/21 4,710 4,798
Broadcom Corp. / Broadcom Cayman Finance, Ltd.3.00%, due 01/15/22 14,930 14,9693.625%, due 01/15/24 9,955 10,0492.375%, due 01/15/20 9,955 9,9383.50%, due 01/15/28 4,975 4,723
CDW LLC / CDW Finance Corp.5.00%, due 09/01/23 19,243 19,5805.00%, due 09/01/25 9,955 10,366
CommScope, Inc., 144A5.50%, due 06/15/24 (d) 23,854 22,7575.50%, due 03/01/24 (d) 3,480 3,5716.00%, due 03/01/26 (d) 3,480 3,5675.00%, due 06/15/21 (d) 995 993
Dell International LLC / EMC Corp., 144A5.45%, due 06/15/23 (d) 14,725 15,8704.42%, due 06/15/21 (d) 2,940 3,030
Itron, Inc., 144A5.00%, due 01/15/26 (d) 11,035 11,283
Lam Research Corp.2.75%, due 03/15/20 19,660 19,6772.80%, due 06/15/21 4,910 4,947
Motorola Solutions, Inc.3.75%, due 05/15/22 5,592 5,7464.60%, due 02/23/28 2,985 3,132
Qorvo, Inc.5.50%, due 07/15/26 4,975 5,265
Symantec Corp., 144A5.00%, due 04/15/25 (d) 1,000 1,025
Tyco Electronics Group SA3.70%, due 02/15/26 9,830 10,2392.35%, due 08/01/19 1,812 1,811 196,112
REAL ESTATE - 1.1%
CBRE Services, Inc.5.25%, due 03/15/25 24,930 27,5204.875%, due 03/01/26 19,665 21,405
GLP Capital, LP / GLP Financing II, Inc. REIT4.875%, due 11/01/20 14,975 15,2355.375%, due 11/01/23 12,000 12,8665.75%, due 06/01/28 4,975 5,482
Par Value Value
Toppan Merrill - Harris-Oakmark Harris Associates Investment Trust N-30B-2 033-38953 06-30-2019 ED | thunt | 14-Aug-19 09:45 | 19-12672-1.eb | Sequence: 4CHKSUM Content: 25443 Layout: 25591 Graphics: 0 CLEAN
JOB: 19-12672-1 CYCLE#;BL#: 8 TRIM: 8.250 x 10.750 AS: Chicago: 877-427-2185COLORS: ~note-color 2, PANTONE 364 U, Black, ~note-color 3 GRAPHICS: none V1.5
Oakmark Equity and Income Fund June 30, 2019 (Unaudited)
Schedule of Investments (in thousands) (continued)
FIXED INCOME - 30.0% (continued)CORPORATE BONDS - 18.4% (continued)
5.25%, due 06/01/25 $4,975 $5,3305.375%, due 04/15/26 3,925 4,2454.375%, due 04/15/21 1,965 1,999
MGM Growth Properties Operating Partnership, LP / MGP Finance Co-Issuer, Inc. REIT5.625%, due 05/01/24 2,945 3,173
Omega Healthcare Investors, Inc. REIT4.375%, due 08/01/23 15,046 15,6305.25%, due 01/15/26 9,835 10,649
The Howard Hughes Corp., 144A5.375%, due 03/15/25 (d) 12,440 12,853
Ventas Realty, LP REIT3.125%, due 06/15/23 2,490 2,5363.50%, due 02/01/25 900 932 139,855
CONSUMER STAPLES - 0.6%
Diageo Capital PLC3.875%, due 05/18/28 5,000 5,4653.00%, due 05/18/20 5,000 5,0283.50%, due 09/18/23 4,800 5,024
Kraft Heinz Foods Co., 144A4.875%, due 02/15/25 (d) 6,260 6,457
Mead Johnson Nutrition Co.4.125%, due 11/15/25 13,955 15,1003.00%, due 11/15/20 6,885 6,947
Mondelez International Holdings Netherlands BV, 144A2.00%, due 10/28/21 (d) 8,585 8,5061.625%, due 10/28/19 (d) 7,764 7,737
Post Holdings, Inc., 144A5.00%, due 08/15/26 (d) 2,000 2,0285.50%, due 03/01/25 (d) 500 5165.75%, due 03/01/27 (d) 500 516
Smithfield Foods, Inc., 144A2.70%, due 01/31/20 (d) 6,420 6,4073.35%, due 02/01/22 (d) 4,975 4,9632.65%, due 10/03/21 (d) 3,980 3,9234.25%, due 02/01/27 (d) 995 1,013 79,630
ENERGY - 0.4%
Apergy Corp.6.375%, due 05/01/26 16,119 16,240
Cenovus Energy, Inc.5.70%, due 10/15/19 3,642 3,671
Oceaneering International, Inc.4.65%, due 11/15/24 8,485 8,315
Schlumberger Holdings Corp., 144A4.00%, due 12/21/25 (d) 9,830 10,405
Weatherford International LLC9.875%, due 03/01/25 9,950 5,099 43,730
Par Value Value
MATERIALS - 0.2%
Glencore Funding LLC, 144A3.00%, due 10/27/22 (d) $9,950 $10,0083.875%, due 10/27/27 (d) 9,950 9,924 19,932
Total Corporate Bonds (Cost $2,228,875) 2,299,589
GOVERNMENT AND AGENCY SECURITIES - 11.5%U.S. GOVERNMENT NOTES - 11.3%
1.25%, due 07/15/20 (f) 491,831 495,004United States Treasury Notes
1.75%, due 10/31/20 223,550 223,1662.375%, due 12/31/20 198,945 200,5151.375%, due 12/15/19 99,500 99,1851.625%, due 07/31/20 99,485 99,1552.00%, due 11/30/22 74,625 75,2981.75%, due 03/31/22 74,645 74,6922.125%, due 12/31/22 49,745 50,4231.875%, due 11/30/21 49,785 49,9431.50%, due 11/30/19 24,875 24,8112.125%, due 01/31/21 24,570 24,682 1,416,874
U.S. GOVERNMENT AGENCIES - 0.2%
Federal Farm Credit Bank,1.68%, due 08/16/21 17,165 17,027
Total Government and Agency Securities(Cost $1,423,886) 1,433,901
CONVERTIBLE BOND - 0.1%
Chesapeake Energy Corp.,5.50%, due 09/15/26(Cost $14,532) 14,915 11,905
TOTAL FIXED INCOME - 30.0%(COST $3,667,293) 3,745,395
SHORT-TERM INVESTMENTS - 8.7%GOVERNMENT AND AGENCY SECURITIES - 4.2%
Federal Home Loan Bank,2.13%, due 07/01/19 (g) 225,000 225,000
Federal National Mortgage Association,2.24%, due 07/01/19 (g) 300,000 300,000
Total Government and Agency Securities(Cost $525,000) 525,000
COMMERCIAL PAPER - 3.7%
Walgreens Boots,2.61% - 3.19%, due 07/08/19 - 08/30/19 (g) 139,000 138,560
General Mills, Inc., 144A,2.49% - 2.54%, due 07/02/19 - 07/19/19 (d) (g) 90,250 90,191
Par Value Value
Oakmark.com 21
Toppan Merrill - Harris-Oakmark Harris Associates Investment Trust N-30B-2 033-38953 06-30-2019 ED | thunt | 14-Aug-19 09:45 | 19-12672-1.eb | Sequence: 5CHKSUM Content: 24578 Layout: 30040 Graphics: 0 CLEAN
JOB: 19-12672-1 CYCLE#;BL#: 8 TRIM: 8.250 x 10.750 AS: Chicago: 877-427-2185COLORS: ~note-color 2, PANTONE 364 U, Black, ~note-color 3 GRAPHICS: none V1.5

Oakmark Equity and Income Fund June 30, 2019 (Unaudited)
Schedule of Investments (in thousands) (continued)
22 OAKMARK FUNDS
SHORT-TERM INVESTMENTS - 8.7% (continued)COMMERCIAL PAPER - 3.7% (continued)
Campbell Soup Co., 144A,2.96% - 3.18%,due 07/18/19 - 09/09/19 (d) (g) $79,750 $79,511
Schlumberger Holdings Corp., 144A,2.54% - 2.56%, due 07/02/19 - 07/10/19 (d) (g) 69,750 69,722
Kellogg Co., 144A,2.52% - 2.57%, due 07/01/19 - 07/09/19 (d) (g) 66,000 65,986
Abbvie, Inc., 144A,2.47%, due 07/10/19 (d) (g) 24,750 24,735
Total Commercial Paper(Cost $468,707) 468,705
REPURCHASE AGREEMENT - 0.7%Fixed Income Clearing Corp. Repurchase Agreement, 1.50% dated 06/28/19 due 07/01/19, repurchase price $92,400, collateralized by United States Treasury Notes, 1.875% - 2.375% due 03/15/22 - 03/31/22, aggregate value plus accrued interest of $94,239 (Cost: $92,388) 92,388 92,388
CORPORATE BONDS - 0.1%FINANCIALS - 0.1%
Ally Financial, Inc,4.13%, due 03/30/20 (g) 4,970 5,018
Reinsurance Group of America, Inc.,6.45%, due 11/15/19 (g) 10,257 10,402
15,420Total Corporate Bonds
(Cost $15,376) 15,420
TOTAL SHORT-TERM INVESTMENTS - 8.7%(COST $1,101,471) 1,101,513
TOTAL INVESTMENTS - 99.8%(COST $9,183,497) 12,487,134
Foreign Currencies - 0.0% (h) 0(i)
Other Assets In Excess of Liabilities - 0.2% 19,038
NET ASSETS - 100.0% $12,506,172
Par Value Value(a) Non-income producing security
(b) Sponsored American Depositary Receipt
(c) Floating Rate Note. Rate shown is as of June 30, 2019.
(d) Security exempt from registration under Rule 144A of the Securities Act of1933, as amended. These securities may be resold, normally only to qualifiedinstitutional buyers.
(e) Security is perpetual and has no stated maturity date.
(f) Interest rate for this security is a stated rate. Interest payments are determinedbased on an inflation-adjusted principal amount.
(g) The rate shown represents the annualized yield at the time of purchase; not acoupon rate.
(h) Amount rounds to less than 0.1%.
(i) Amount rounds to less than $1,000.
Abbreviations:
REIT: Real Estate Investment Trust
Toppan Merrill - Harris-Oakmark Harris Associates Investment Trust N-30B-2 033-38953 06-30-2019 ED | thunt | 14-Aug-19 09:45 | 19-12672-1.eb | Sequence: 6CHKSUM Content: 56326 Layout: 53835 Graphics: 0 CLEAN
JOB: 19-12672-1 CYCLE#;BL#: 8 TRIM: 8.250 x 10.750 AS: Chicago: 877-427-2185COLORS: ~note-color 2, PANTONE 364 U, Black, ~note-color 3 GRAPHICS: none V1.5

This page intentionally left blank.
Oakmark.com 23
Toppan Merrill - Harris-Oakmark Harris Associates Investment Trust N-30B-2 033-38953 06-30-2019 ED | thunt | 14-Aug-19 09:45 | 19-12672-1.fa | Sequence: 1CHKSUM Content: 44714 Layout: 5160 Graphics: 61853 CLEAN
JOB: 19-12672-1 CYCLE#;BL#: 8 TRIM: 8.250 x 10.750 AS: Chicago: 877-427-2185COLORS: PANTONE 364 U, ~note-color 3, Black, ~note-color 2 GRAPHICS: oakmark_funds_364_20%_logo.eps V1.5

24 OAKMARK FUNDS
See accompanying Disclosures and Endnotes on page 45.
VALUE OF A $10,000 INVESTMENTSince Inception - 08/04/99 (Unaudited)
PERFORMANCE Average Annual Total Returns (as of 06/30/19)
Total Return Since Inception(Unaudited) Last 3 Months 1-year 3-year 5-year 10-year Inception Date
Oakmark Global Fund (Investor Class) 4.31% -2.03% 12.31% 3.59% 10.00% 9.66% 08/04/99MSCI World Index 4.00% 6.33% 11.77% 6.60% 10.72% 4.88%Lipper Global Fund Index12 3.13% 3.34% 10.79% 5.57% 9.71% 5.35%Oakmark Global Fund (Advisor Class) 4.31% -1.93% N/A N/A N/A 9.04% 11/30/16Oakmark Global Fund (Institutional Class) 4.34% -1.86% N/A N/A N/A 9.12% 11/30/16Oakmark Global Fund (Service Class) 4.20% -2.32% 11.98% 3.26% 9.62% 9.66% 10/10/01
The graph and table do not reflect the deduction of taxes that a shareholder would pay on Fund distributions or the redemption of Fund shares.Past performance is no guarantee of future results. The performance data quoted represents past performance. Current performance may belower or higher than the performance data quoted. Total return includes change in share prices and, in each case, includes reinvestment of dividendsand capital gain distributions. The investment return and principal value vary so that an investor’s shares when redeemed may be worth more orless than the original cost. To obtain the most recent month-end performance, please visit Oakmark.com.
$0
$70,000
$10,000
$20,000
$30,000
$60,000
$40,000
$50,000
2005200320011999 20192017201520132007 2009 2011
Oakmark Global Fund(Investor Class) $62,687
MSCI World Index11 $25,792
TOP TEN EQUITY HOLDINGS6 % of Net AssetsBayer AG 5.4MasterCard, Inc., Class A 5.1TE Connectivity, Ltd. 4.5Bank of America Corp. 4.4General Motors Co. 4.3CNH Industrial N.V. 4.2Alphabet, Inc., Class C 4.0Daimler AG 4.0Credit Suisse Group AG 3.9Citigroup, Inc. 3.6
SECTOR ALLOCATION % of Net AssetsFinancials 21.2Consumer Discretionary 18.3Information Technology 16.9Communication Services 13.9Industrials 13.9Health Care 6.9Materials 3.7Energy 1.5Consumer Staples 0.9Short-Term Investments and Other 2.9
FUND STATISTICSTicker* OAKGXNumber of Equity Holdings 43Net Assets $1.7 billionWeighted Average Market Cap $103.9 billionMedian Market Cap $30.7 billionGross Expense Ratio - Investor Class (as of 09/30/18)* 1.21%Net Expense Ratio - Investor Class (as of 09/30/18)*† 1.15%
* This information is related to the Investor Class. Please visitOakmark.com for information related to the Advisor, Institutional andService Classes.
† The net expense ratio reflects a contractual advisory fee waiveragreement through January 27, 2020.
GEOGRAPHIC ALLOCATION
* Euro currency countries comprise 17.4% of equity investments.
% of Equity
Asia (cont’d) 5.6South Korea 1.0India 0.3
Africa 2.6South Africa 2.6
Australasia 2.4Australia 2.4
Latin America 1.3Mexico 1.3
% of Equity
North America 46.8United States 46.8
Europe 41.3Germany* 14.7United Kingdom 13.8Switzerland 10.1Ireland* 2.7
Asia 5.6Japan 3.3Taiwan 1.0
Oakmark Global Fund June 30, 2019
Summary Information
Toppan Merrill - Harris-Oakmark Harris Associates Investment Trust N-30B-2 033-38953 06-30-2019 ED | thunt | 14-Aug-19 09:45 | 19-12672-1.fa | Sequence: 2CHKSUM Content: 47687 Layout: 29105 Graphics: 50664 CLEAN
JOB: 19-12672-1 CYCLE#;BL#: 8 TRIM: 8.250 x 10.750 AS: Chicago: 877-427-2185COLORS: ~note-color 3, ~HTML color, Black, ~HTML color 2, PANTONE 364 U, ~note-color 2, ~watermark GRAPHICS: 12672-1_Global_Fund_L.eps V1.5

Oakmark.com 25
Quarter UpdateIn the June quarter, the Oakmark Global Fund gained 4.3%,while the MSCI World Index11 returned 4% and the LipperGlobal Fund Index12 returned 3.1%. These numbers seem tosuggest a pleasant rally in the period, but those who follow themarket closely know that it was anything but. After slowingdown in March from a strong start to the year, stock marketspicked up the pace in April, generating unusually strongreturns. This more than completely reversed in May, however,as international politics and trade considerations appeared tofrighten investors. With the flip of the calendar to June, mar-kets turned upward, and they did so with vigor. In the U.S., thestock market came close to producing its best June monthlyreturn ever. It is unusual for the market to synchronize itsmovement with the calendar, but these are unusual times.
For the past three months, the U.S., Switzerland and Germanycontributed most to the Fund’s return, while Ireland, Mexicoand the U.K. detracted most significantly. The individual hold-ings that contributed most to return were TE Connectivity(U.S.), Arconic (U.S.), Mastercard (U.S.), Bayer (Germany) andJulius Baer Group (Switzerland). Fund holdings that detractedthe most from return were Tenet Healthcare (U.S.), RyanairHoldings (Ireland), Alphabet (U.S.), Grupo Televisa (Mexico)and Lloyds Banking Group (U.K.).
For the calendar six months, the Fund gained 17.4% versus 17%for the MSCI World Index and 16.2% for the Lipper GlobalFund Index. Finally, for the nine months of the Fund’s fiscalyear, the Fund lost 2.1%, which contrasts to a 1.3% gain for theMSCI World Index and 0.0% for the Lipper Global Fund Index.Since the Fund’s inception in 1999, it has achieved a compoundannual rate of return of 9.7%, which compares to 4.9% for theMSCI World Index and 5.4% for the Lipper Global Fund Index.
In the past calendar six months, the U.S., U.K. and Switzerlandled the contributors’ list, while Mexico and Ireland were theonly detractors. Individual significant contributors were Master-card, Citigroup (U.S.), TE Connectivity, Arconic and Julius Baer.Grupo Televisa, Ryanair, National Oilwell Varco and Multi-choice (South Africa—received in a corporate action and thensold) were the only detractors. For the fiscal year that beganOctober 1, the countries that contributed the most to theFund’s return were the U.S., South Africa and India, while Mexico, Germany and Ireland detracted. The five largest con-tributors to the Fund’s return in the period were Mastercard,General Motors (U.S.), Travis Perkins (U.K.), Naspers (SouthAfrica) and TE Connectivity. The Fund holdings that detracted
the most were Grupo Televisa, National Oilwell Varco, Ryanair,Credit Suisse (Switzerland) and Tenet Healthcare.
The U.S. allocation grew modestly in the quarter, but thisresulted from stronger relative performance rather than tradingactivity. The Fund now owns five emerging markets issues,which may be a record. Compared to the MSCI World Index,the Fund has significant country overweights in Switzerland,Germany and the U.K., while it is underweight Japan and theU.S. (though the U.S. has by far the largest Fund weight). Interms of industries, the overweight commitments are financials,consumer discretionary (primarily automotive) and communi-cation services, where Alphabet is the largest holding. TheFund’s significant underweights are consumer staples, energyand health care. We continue to seek out attractive ideas in theunderweight sectors, but, especially in health care and staples,we have found it difficult to identify issues that meet our valuecriteria. In contrast, the financial and consumer discretionarygroups are replete with conservatively valued issues as investorsattempt to discount the effects of suppressed interest rates andthe timing of the next recession. We believe that our holdingsin these industries are valued appropriately for these risks.
Portfolio ActivityDuring the quarter, we added one new international holding,while the U.S. count dropped by one when the takeover offerfor USG was completed. Samsung Electronics (South Korea) is aname we have followed for some time and held in the past.Recent share price weakness once again afforded us the oppor-tunity to initiate a position in this company at a discount toour estimate of its intrinsic value. As a reminder, we find thatSamsung enjoys several competitive advantages, including adiverse product line-up, strong global distribution and scale.Along with producing a robust portfolio of consumer electron-ics and mobile phones, the company is a world-leading manu-facturer of semiconductors, a business segment that we findparticularly attractive because we believe it provides ongoingrevenue and profit. Moreover, due to Samsung’s leading marketposition and financial strength, it has been able to either main-tain or increase both research and development and capitalexpenditures even during down cycles. We also appreciate thecompany’s solid balance sheet, strong free cash flow generationand track record of returning capital to shareholders via divi-dends and share repurchases. All of these attributes add to ourconfidence that Samsung is committed to adding value for itsshareholders.
David G. Herro, CFAPortfolio Manager
Clyde S. McGregor, CFAPortfolio Manager
Anthony P. Coniaris, CFAPortfolio Manager
Jason E. Long, CFAPortfolio Manager
See accompanying Disclosures and Endnotes on page 45.
Oakmark Global Fund June 30, 2019
Portfolio Manager Commentary
Toppan Merrill - Harris-Oakmark Harris Associates Investment Trust N-30B-2 033-38953 06-30-2019 ED | thunt | 14-Aug-19 09:45 | 19-12672-1.fa | Sequence: 3CHKSUM Content: 17601 Layout: 50528 Graphics: 56025 CLEAN
JOB: 19-12672-1 CYCLE#;BL#: 8 TRIM: 8.250 x 10.750 AS: Chicago: 877-427-2185COLORS: ~note-color 3, ~HTML color, Black, ~HTML color 2, PANTONE 364 U, ~note-color 2, ~watermark GRAPHICS: jason_long_photo.eps, Anthony Coniaris_small.eps, clyde_mcgregor_photo.eps, David Herro photo 2018 S.eps V1.5

Oakmark Global Fund June 30, 2019
Portfolio Manager Commentary (continued)
In this report from the second quarter four years ago, we wrotethe following about USG: “New holding USG is the largest pro-ducer of wallboard in the U.S. and a leading manufacturer ofother building products. After spending five years in bank-ruptcy related to asbestos in the early 2000s, USG finallyreached an agreement to emerge—with its equity intact—onprecisely the same month in 2006 that housing starts enteredone of the deepest and longest downturns in U.S. history. Nineyears later, housing starts are still significantly depressed rela-tive to trend and USG’s profits even more so. It’s no surprisethat investors aren’t tripping over themselves to buy shares ofUSG. But looking further out, as housing and other construc-tion markets fully recover, we believe USG will be earning con-siderably more and producing substantial free cash flow, as thecompany benefits from large tax assets which help to shelterearnings1.” When we invested in USG, we were completelyunfamiliar with Knauf, the privately held German companythat recently acquired USG. Knauf’s management saw its busi-ness as complementary to USG’s and the company also recog-nized the undervaluation in USG’s share price. As it happened,Knauf roughly agreed with our understanding of the intrinsicvalue of USG.
General Motors UpdateSix months ago, we wrote about General Motors’ (GM) transfor-mation, particularly the rapid growth in value of the company’sCruise Automation unit. During the past quarter, Cruise’s valua-tion increased again, taking it from last year’s $14.5 billion tothe $19 billion level. All of the previous investors participatedin this investing round and various institutional investors,including T. Rowe Price, joined for the first time. Assuming thatGM continues to own roughly 75% of Cruise, it now representsmore than one-quarter of the company’s public market value.All of this is for an enterprise yet to earn revenues, much lessprofit. We continue to believe that investors have not properlyrewarded GM management for their efforts to transform thecompany.
Currency HedgesWe defensively hedge a portion of the Fund’s exposure to cur-rencies that we believe to be overvalued versus the U.S. dollar.As of quarter end, we found the Swiss franc to be overvaluedand have hedged approximately 12% of the Fund’s franc exposure.
Thank you for being our partners in the Oakmark Global Fund.Please feel free to contact us with your questions or comments.
26 OAKMARK FUNDS
See accompanying Disclosures and Endnotes on page 45.
Toppan Merrill - Harris-Oakmark Harris Associates Investment Trust N-30B-2 033-38953 06-30-2019 ED | thunt | 14-Aug-19 09:45 | 19-12672-1.fa | Sequence: 4CHKSUM Content: 29431 Layout: 29721 Graphics: 0 CLEAN
JOB: 19-12672-1 CYCLE#;BL#: 8 TRIM: 8.250 x 10.750 AS: Chicago: 877-427-2185COLORS: PANTONE 364 U, ~note-color 3, Black, ~note-color 2 GRAPHICS: none V1.5
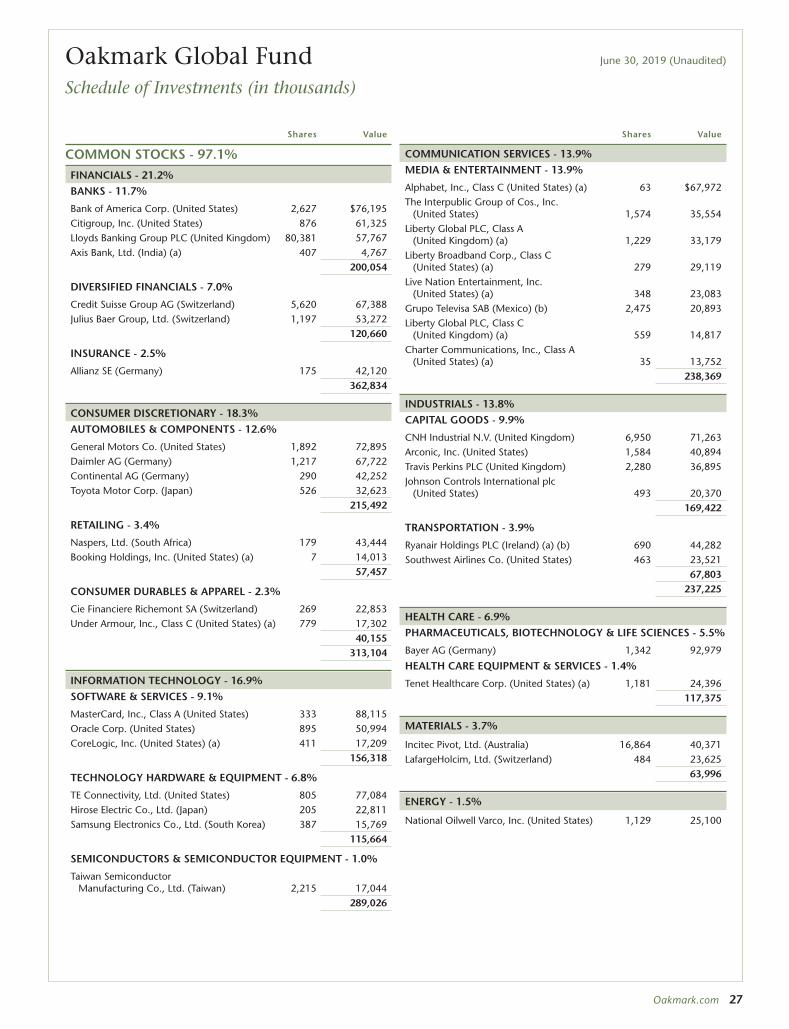
Oakmark Global Fund June 30, 2019 (Unaudited)
Schedule of Investments (in thousands)
COMMON STOCKS - 97.1%FINANCIALS - 21.2%BANKS - 11.7%
Bank of America Corp. (United States) 2,627 $76,195Citigroup, Inc. (United States) 876 61,325Lloyds Banking Group PLC (United Kingdom) 80,381 57,767Axis Bank, Ltd. (India) (a) 407 4,767
200,054
DIVERSIFIED FINANCIALS - 7.0%
Credit Suisse Group AG (Switzerland) 5,620 67,388Julius Baer Group, Ltd. (Switzerland) 1,197 53,272
120,660
INSURANCE - 2.5%
Allianz SE (Germany) 175 42,120 362,834
CONSUMER DISCRETIONARY - 18.3%AUTOMOBILES & COMPONENTS - 12.6%
General Motors Co. (United States) 1,892 72,895Daimler AG (Germany) 1,217 67,722Continental AG (Germany) 290 42,252Toyota Motor Corp. (Japan) 526 32,623
215,492
RETAILING - 3.4%
Naspers, Ltd. (South Africa) 179 43,444Booking Holdings, Inc. (United States) (a) 7 14,013
57,457
CONSUMER DURABLES & APPAREL - 2.3%
Cie Financiere Richemont SA (Switzerland) 269 22,853Under Armour, Inc., Class C (United States) (a) 779 17,302
40,155 313,104
INFORMATION TECHNOLOGY - 16.9%SOFTWARE & SERVICES - 9.1%
MasterCard, Inc., Class A (United States) 333 88,115Oracle Corp. (United States) 895 50,994CoreLogic, Inc. (United States) (a) 411 17,209
156,318
TECHNOLOGY HARDWARE & EQUIPMENT - 6.8%
TE Connectivity, Ltd. (United States) 805 77,084Hirose Electric Co., Ltd. (Japan) 205 22,811Samsung Electronics Co., Ltd. (South Korea) 387 15,769
115,664
SEMICONDUCTORS & SEMICONDUCTOR EQUIPMENT - 1.0%
Taiwan Semiconductor Manufacturing Co., Ltd. (Taiwan) 2,215 17,044
289,026
Shares Value
COMMUNICATION SERVICES - 13.9%MEDIA & ENTERTAINMENT - 13.9%
Alphabet, Inc., Class C (United States) (a) 63 $67,972The Interpublic Group of Cos., Inc.
(United States) 1,574 35,554Liberty Global PLC, Class A
(United Kingdom) (a) 1,229 33,179Liberty Broadband Corp., Class C
(United States) (a) 279 29,119Live Nation Entertainment, Inc.
(United States) (a) 348 23,083Grupo Televisa SAB (Mexico) (b) 2,475 20,893Liberty Global PLC, Class C
(United Kingdom) (a) 559 14,817Charter Communications, Inc., Class A
(United States) (a) 35 13,752 238,369
INDUSTRIALS - 13.8%CAPITAL GOODS - 9.9%
CNH Industrial N.V. (United Kingdom) 6,950 71,263Arconic, Inc. (United States) 1,584 40,894Travis Perkins PLC (United Kingdom) 2,280 36,895Johnson Controls International plc
(United States) 493 20,370 169,422
TRANSPORTATION - 3.9%
Ryanair Holdings PLC (Ireland) (a) (b) 690 44,282Southwest Airlines Co. (United States) 463 23,521
67,803 237,225
HEALTH CARE - 6.9%PHARMACEUTICALS, BIOTECHNOLOGY & LIFE SCIENCES - 5.5%
Bayer AG (Germany) 1,342 92,979
HEALTH CARE EQUIPMENT & SERVICES - 1.4%
Tenet Healthcare Corp. (United States) (a) 1,181 24,396 117,375
MATERIALS - 3.7%
Incitec Pivot, Ltd. (Australia) 16,864 40,371LafargeHolcim, Ltd. (Switzerland) 484 23,625
63,996
ENERGY - 1.5%
National Oilwell Varco, Inc. (United States) 1,129 25,100
Shares Value
Oakmark.com 27
Toppan Merrill - Harris-Oakmark Harris Associates Investment Trust N-30B-2 033-38953 06-30-2019 ED | thunt | 14-Aug-19 09:45 | 19-12672-1.fb | Sequence: 1CHKSUM Content: 23082 Layout: 41860 Graphics: 0 CLEAN
JOB: 19-12672-1 CYCLE#;BL#: 8 TRIM: 8.250 x 10.750 AS: Chicago: 877-427-2185COLORS: ~note-color 2, PANTONE 364 U, Black, ~note-color 3 GRAPHICS: none V1.5

Oakmark Global Fund June 30, 2019 (Unaudited)
Schedule of Investments (in thousands) (continued)
28 OAKMARK FUNDS
COMMON STOCKS - 97.1% (continued)CONSUMER STAPLES - 0.9%HOUSEHOLD & PERSONAL PRODUCTS - 0.8%
Reckitt Benckiser Group PLC (United Kingdom) 174 $13,708
FOOD, BEVERAGE & TOBACCO - 0.1%
Diageo PLC (United Kingdom) 42 1,818 15,526
TOTAL COMMON STOCKS - 97.1% (COST $1,353,203) 1,662,555
Par Value Value
SHORT-TERM INVESTMENTS - 2.7%REPURCHASE AGREEMENT - 1.5%Fixed Income Clearing Corp. Repurchase Agreement, 1.50% dated 06/28/19 due 07/01/19, repurchase price $25,734, collateralized by a United States Treasury Note, 1.875% due 03/31/22, value plus accrued interest of $26,246 (Cost: $25,731) $25,731 25,731
GOVERNMENT AND AGENCY SECURITIES - 1.2%Federal Home Loan Bank,
2.13%, due 07/01/19 (c) (Cost $20,000) 20,000 20,000
TOTAL SHORT-TERM INVESTMENTS - 2.7% (COST $45,731) 45,731
TOTAL INVESTMENTS - 99.8% (COST $1,398,934) 1,708,286
Foreign Currencies (Cost $332) - 0.0% (d) 332
Other Assets In Excess of Liabilities - 0.2% 3,732
TOTAL NET ASSETS - 100.0% $1,712,350
(a) Non-income producing security
(b) Sponsored American Depositary Receipt
(c) The rate shown represents the annualized yield at the time of purchase; not acoupon rate.
(d) Amount rounds to less than 0.1%.
Shares Value
Toppan Merrill - Harris-Oakmark Harris Associates Investment Trust N-30B-2 033-38953 06-30-2019 ED | thunt | 14-Aug-19 09:45 | 19-12672-1.fb | Sequence: 2CHKSUM Content: 52747 Layout: 25591 Graphics: 0 CLEAN
JOB: 19-12672-1 CYCLE#;BL#: 8 TRIM: 8.250 x 10.750 AS: Chicago: 877-427-2185COLORS: ~note-color 2, PANTONE 364 U, Black, ~note-color 3 GRAPHICS: none V1.5

Oakmark Global Fund June 30, 2019 (Unaudited)
Schedule of Investments (in thousands) (continued)
FORWARD FOREIGN CURRENCY CONTRACT
Local Base Unrealized Contract Contract Settlement Valuation at Appreciation/ Amount Amount Date 6/30/19 (Depreciation)
Foreign Currency Sold:
Swiss Franc 19,820 $20,262 12/18/19 $20,618 $(356)
$20,618 $(356)
Oakmark.com 29
Toppan Merrill - Harris-Oakmark Harris Associates Investment Trust N-30B-2 033-38953 06-30-2019 ED | thunt | 14-Aug-19 09:45 | 19-12672-1.fb | Sequence: 3CHKSUM Content: 3223 Layout: 18200 Graphics: 0 CLEAN
JOB: 19-12672-1 CYCLE#;BL#: 8 TRIM: 8.250 x 10.750 AS: Chicago: 877-427-2185COLORS: ~note-color 2, PANTONE 364 U, Black, ~note-color 3 GRAPHICS: none V1.5

Oakmark Global Select Fund June 30, 2019
Summary Information
30 OAKMARK FUNDS
See accompanying Disclosures and Endnotes on page 45.
VALUE OF A $10,000 INVESTMENTSince Inception - 10/02/06 (Unaudited)
PERFORMANCE Average Annual Total Returns (as of 06/30/19)
Total Return Since Inception(Unaudited) Last 3 Months 1-year 3-year 5-year 10-year Inception Date
Oakmark Global Select Fund (Investor Class) 3.86% -2.43% 9.89% 4.20% 10.93% 7.33% 10/02/06MSCI World Index 4.00% 6.33% 11.77% 6.60% 10.72% 5.83%Lipper Global Fund Index12 3.13% 3.34% 10.79% 5.57% 9.71% 5.46%Oakmark Global Select Fund (Advisor Class) 3.80% -2.38% N/A N/A N/A 5.55% 11/30/16Oakmark Global Select Fund (Institutional Class) 3.87% -2.33% N/A N/A N/A 5.61% 11/30/16
The graph and table do not reflect the deduction of taxes that a shareholder would pay on Fund distributions or the redemption of Fund shares.Past performance is no guarantee of future results. The performance data quoted represents past performance. Current performance may belower or higher than the performance data quoted. Total return includes change in share prices and, in each case, includes reinvestment of dividendsand capital gain distributions. The investment return and principal value vary so that an investor’s shares when redeemed may be worth more orless than the original cost. To obtain the most recent month-end performance, please visit Oakmark.com.
$5,000
$25,000
$30,000
$10,000
$20,000
$15,000
Oakmark Global Select Fund(Investor Class) $24,621
MSCI World Index11 $20,586
2019201720152013201120092007
TOP TEN EQUITY HOLDINGS6 % of Net AssetsAlphabet, Inc., Class C 7.3CNH Industrial N.V. 7.3Daimler AG 7.1Bank of America Corp. 6.6Lloyds Banking Group PLC 6.0Credit Suisse Group AG 6.0TE Connectivity, Ltd. 5.8Charter Communications, Inc., Class A 5.5Citigroup, Inc. 5.5Fiat Chrysler Automobiles N.V. 4.8
SECTOR ALLOCATION % of Net AssetsFinancials 31.1Consumer Discretionary 15.7Communication Services 12.8Information Technology 12.5Industrials 10.1Consumer Staples 4.5Materials 3.9Energy 3.1Health Care 3.1Short-Term Investments and Other 3.1
FUND STATISTICSTicker* OAKWXNumber of Equity Holdings 21Net Assets $1.9 billionWeighted Average Market Cap $130.5 billionMedian Market Cap $46.3 billionGross Expense Ratio - Investor Class (as of 09/30/18)* 1.19%Net Expense Ratio - Investor Class (as of 09/30/18)*† 1.12%
* This information is related to the Investor Class. Please visitOakmark.com for information related to the Advisor, Institutional andService Classes.
† The net expense ratio reflects a contractual advisory fee waiveragreement through January 27, 2020.
GEOGRAPHIC ALLOCATION
* Euro currency countries comprise 7.3% of equity investments.
% of Equity
Europe 47.7United Kingdom 23.3Switzerland 17.1Germany* 7.3
% of Equity
North America 45.4United States 45.4
Asia 6.9South Korea 3.8Taiwan 3.1
Toppan Merrill - Harris-Oakmark Harris Associates Investment Trust N-30B-2 033-38953 06-30-2019 ED | thunt | 14-Aug-19 09:45 | 19-12672-1.ga | Sequence: 1CHKSUM Content: 32364 Layout: 15351 Graphics: 8856 CLEAN
JOB: 19-12672-1 CYCLE#;BL#: 8 TRIM: 8.250 x 10.750 AS: Chicago: 877-427-2185COLORS: ~note-color 3, ~HTML color, Black, ~HTML color 2, PANTONE 364 U, ~note-color 2, ~watermark GRAPHICS: 12672-1_Global_Select_L.eps V1.5

The Oakmark Global Select Fund returned 3.9% for the quarterended June 30, 2019, slightly underperforming the MSCI WorldIndex11, which returned 4.0%. Importantly, the Fund hasreturned an average of 7.3% per year since its inception inOctober 2006, outperforming the MSCI World Index’s annual-ized gain of 5.8% over the same period.
TE Connectivity, the dominant manufacturer of sensors andconnectors, was a top contributor for the quarter, returning19%. During the quarter, TE Connectivity announced positivesecond-quarter earnings that surpassed consensus estimates.Company management also indicated that full-year EPS wouldbe in line with last year. The auto business segment outgrewauto production by 300 basis points this quarter and shouldoutgrow production by a larger amount for the full year. Webelieve the auto segment can continue to significantly outgrowauto production in the coming years. Management alsoannounced a new restructuring plan for the high-performingtransportation segment during the quarter. This segment hasbeen operating at full capacity for the past five years and man-agement plans to consolidate some plants in high-cost coun-tries and restructure the supply chain. In our view, TEConnectivity is becoming a collection of secularly advantagedconnector businesses that can grow revenue in the mid-singledigits, can maintain operating margins in the high teens andcan return around a 50% return on tangible capital. Our invest-ment thesis for the company remains intact.
Alphabet, the parent company of Google, was a large detractorfor the quarter, returning –8%. Alphabet’s first-quarter earningswere released in late April and were in line with our expecta-tions, given that the company’s total revenue grew 19% to$36.3 billion. Although this was less than other previous first-quarter periods for the company, we do not view it as outsidethe typical range or historic growth variability. However, otherinvestors viewed the lower revenue negatively, and the shareprice fell. In addition, investors reacted negatively to news thatthe Justice Department would open an antitrust investigationagainst Google. While we continue to monitor the situation, webelieve the valuation for Alphabet remains attractive, offering acompelling reason to own.
During the quarter, we sold our investment in Alphabet Class A,but we maintained our position in Alphabet Class C. We alsosold our position in General Electric and used the proceeds topurchase Regeneron Pharmaceuticals. We believe the companyprovides a better risk-return profile for our shareholders.
Regeneron’s business model is focused on innovation and webelieve its research and development (R&D) capabilities are sig-nificant assets that the market has overlooked. The companyutilizes genetics and a proprietary antibody platform to developits drugs and has received approval for seven drugs, all internally developed. We believe that its recent drug launchesin immunology and oncology should provide a long runway ofgrowth. Regeneron also spends twice as much on R&D as a per-centage of sales compared to its peers. Although we expect thisspending to produce good returns, it depresses consensus earn-ings because R&D costs are expensed immediately. The company would trade at 12x 2020 P/E7, instead of 16x P/E, if itsR&D costs were adjusted to peer levels. Regeneron’s currentprice is also well below biotech M&A multiples. Lastly, manage-ment owns over 10% of Regeneron’s shares, which aligns thecompany’s interests with shareholders.
Geographically, 48% of the Fund’s holdings were allocated toequities in Europe and the U.K., while approximately 45% wereinvested in U.S. companies and 7% in Asian equities.
We continue to believe the Swiss franc is overvalued versus theU.S. dollar. As a result, we defensively hedged a portion of theFund’s exposure. Approximately 13% of the Swiss franc expo-sure was hedged at quarter end.
We thank you for your continued support.
See accompanying Disclosures and Endnotes on page 45.
Oakmark Global Select Fund June 30, 2019
Portfolio Manager Commentary
Oakmark.com 31
William C. Nygren, CFAPortfolio Manager
David G. Herro, CFAPortfolio Manager
Anthony P. Coniaris, CFAPortfolio Manager
Eric Liu, CFAPortfolio Manager
Toppan Merrill - Harris-Oakmark Harris Associates Investment Trust N-30B-2 033-38953 06-30-2019 ED | thunt | 14-Aug-19 09:45 | 19-12672-1.ga | Sequence: 2CHKSUM Content: 49257 Layout: 53876 Graphics: 25174 CLEAN
JOB: 19-12672-1 CYCLE#;BL#: 8 TRIM: 8.250 x 10.750 AS: Chicago: 877-427-2185COLORS: ~note-color 3, ~HTML color, Black, ~HTML color 2, PANTONE 364 U, ~note-color 2, ~watermark GRAPHICS: Eric Liu_small_photo.eps, Anthony Coniaris_small.eps, David Herro photo 2018 S.eps, william_nygren_photo.eps V1.5

Oakmark Global Select Fund June 30, 2019 (Unaudited)
Schedule of Investments (in thousands)
32 OAKMARK FUNDS
COMMON STOCKS - 96.9%FINANCIALS - 31.1%BANKS - 18.0%
Bank of America Corp. (United States) 4,282 $124,163Lloyds Banking Group PLC (United Kingdom) 158,491 113,902Citigroup, Inc. (United States) 1,479 103,574
341,639
INSURANCE - 7.1%
American International Group, Inc. (United States) 1,534 81,753
Willis Towers Watson PLC (United States) 274 52,463 134,216
DIVERSIFIED FINANCIALS - 6.0%
Credit Suisse Group AG (Switzerland) 9,423 112,984 588,839
CONSUMER DISCRETIONARY - 15.7%AUTOMOBILES & COMPONENTS - 11.8%
Daimler AG (Germany) 2,402 133,607Fiat Chrysler Automobiles N.V.
(United Kingdom) 6,550 90,520 224,127
CONSUMER DURABLES & APPAREL - 3.9%
Cie Financiere Richemont SA (Switzerland) 868 73,686 297,813
COMMUNICATION SERVICES - 12.9%MEDIA & ENTERTAINMENT - 12.9%
Alphabet, Inc., Class C (United States) (a) 129 139,054Charter Communications, Inc., Class A
(United States) (a) 264 104,327 243,381
INFORMATION TECHNOLOGY - 12.5%TECHNOLOGY HARDWARE & EQUIPMENT - 9.5%
TE Connectivity, Ltd. (United States) 1,157 110,856Samsung Electronics Co., Ltd. (South Korea) 1,712 69,695
180,551
SEMICONDUCTORS & SEMICONDUCTOR EQUIPMENT - 3.0%
Taiwan Semiconductor Manufacturing Co., Ltd. (Taiwan) 7,394 56,896
237,447
INDUSTRIALS - 10.1%CAPITAL GOODS - 7.3%
CNH Industrial N.V. (United Kingdom) 13,442 137,840
TRANSPORTATION - 2.8%
Kuehne + Nagel International AG (Switzerland) 365 54,207 192,047
Shares Value
CONSUMER STAPLES - 4.5%HOUSEHOLD & PERSONAL PRODUCTS - 2.9%
Reckitt Benckiser Group PLC (United Kingdom) 693 $54,711
FOOD, BEVERAGE & TOBACCO - 1.6%
Diageo PLC (United Kingdom) 712 30,594 85,305
MATERIALS - 3.9%
LafargeHolcim, Ltd. (Switzerland) 1,503 73,398
ENERGY - 3.1%
Apache Corp. (United States) 2,056 59,565
HEALTH CARE - 3.1%PHARMACEUTICALS, BIOTECHNOLOGY & LIFE SCIENCES - 3.1%
Regeneron Pharmaceuticals, Inc. (United States) (a) 186 58,187
TOTAL COMMON STOCKS - 96.9% (COST $1,621,775) 1,835,982
Par Value Value
SHORT-TERM INVESTMENTS - 2.8%REPURCHASE AGREEMENT - 1.5%Fixed Income Clearing Corp. Repurchase Agreement, 1.50% dated 06/28/19 due 07/01/19, repurchase price $27,594, collateralized by a United States Treasury Note, 2.375% due 03/15/22, value plus accrued interest of $28,147 (Cost: $27,591) $27,591 27,591
GOVERNMENT AND AGENCY SECURITIES - 1.3%Federal Home Loan Bank,
2.13%, due 07/01/19 (b) (Cost $25,000) 25,000 25,000
TOTAL SHORT-TERM INVESTMENTS - 2.8% (COST $52,591) 52,591
TOTAL INVESTMENTS - 99.7% (COST $1,674,366) 1,888,573
Foreign Currencies (Cost $0) - 0.0% (c) 0(d)
Other Assets In Excess of Liabilities - 0.3% 6,414
TOTAL NET ASSETS - 100.0% $1,894,987
(a) Non-income producing security
(b) The rate shown represents the annualized yield at the time of purchase; not a couponrate.
(c) Amount rounds to less than 0.1%.
(d) Amount rounds to less than $1,000.
Shares Value
Toppan Merrill - Harris-Oakmark Harris Associates Investment Trust N-30B-2 033-38953 06-30-2019 ED | thunt | 14-Aug-19 09:45 | 19-12672-1.gb | Sequence: 1CHKSUM Content: 43507 Layout: 47425 Graphics: 0 CLEAN
JOB: 19-12672-1 CYCLE#;BL#: 8 TRIM: 8.250 x 10.750 AS: Chicago: 877-427-2185COLORS: ~note-color 2, PANTONE 364 U, Black, ~note-color 3 GRAPHICS: none V1.5

Oakmark Global Select Fund June 30, 2019 (Unaudited)
Schedule of Investments (in thousands) (continued)
FORWARD FOREIGN CURRENCY CONTRACT
Local Base Unrealized Contract Contract Settlement Valuation at Appreciation/ Amount Amount Date 6/30/19 (Depreciation)
Foreign Currency Sold:
Swiss Franc 38,413 $39,269 12/18/19 $39,959 $(690)
$39,959 $(690)
Oakmark.com 33
Toppan Merrill - Harris-Oakmark Harris Associates Investment Trust N-30B-2 033-38953 06-30-2019 ED | thunt | 14-Aug-19 09:45 | 19-12672-1.gb | Sequence: 2CHKSUM Content: 61737 Layout: 17017 Graphics: 0 CLEAN
JOB: 19-12672-1 CYCLE#;BL#: 8 TRIM: 8.250 x 10.750 AS: Chicago: 877-427-2185COLORS: ~note-color 2, PANTONE 364 U, Black, ~note-color 3 GRAPHICS: none V1.5

34 OAKMARK FUNDS
VALUE OF A $10,000 INVESTMENTSince Inception - 09/30/92 (Unaudited)
PERFORMANCE Average Annual Total Returns (as of 06/30/19)
Total Return Since Inception(Unaudited) Last 3 Months 1-year 3-year 5-year 10-year Inception Date
Oakmark International Fund (Investor Class) 3.36% -6.53% 10.52% 1.47% 9.03% 9.19% 09/30/92MSCI World ex U.S. Index 3.79% 1.29% 9.01% 2.04% 6.75% 5.93%MSCI EAFE Index14 3.68% 1.08% 9.11% 2.25% 6.90% 5.79%Lipper International Fund Index15 3.54% 0.08% 8.81% 2.63% 7.22% 6.70%Oakmark International Fund (Advisor Class) 3.36% -6.42% N/A N/A N/A 5.97% 11/30/16Oakmark International Fund (Institutional Class) 3.45% -6.35% N/A N/A N/A 6.04% 11/30/16Oakmark International Fund (Service Class) 3.29% -6.78% 10.22% 1.14% 8.66% 7.31% 11/04/99
The graph and table above do not reflect the deduction of taxes that a shareholder would pay on Fund distributions or the redemption of Fund shares.Past performance is no guarantee of future results. The performance data quoted represents past performance. Current performance may belower or higher than the performance data quoted. Total return includes change in share prices and, in each case, includes reinvestment of dividendsand capital gain distributions. The investment return and principal value vary so that an investor’s shares when redeemed may be worth more orless than the original cost. To obtain the most recent month-end performance, please visit Oakmark.com.
$0
$20,000
$40,000
$140,000
$120,000
$100,000
$60,000
$80,000
Oakmark International Fund (Investor Class) $104,926
MSCI World ex. U.S. Index13 $46,655
199719951993 20011999 2003 20072005 201920172009 2011 20152013
TOP TEN EQUITY HOLDINGS6 % of Net AssetsBNP Paribas SA 4.1Bayer AG 3.7Intesa Sanpaolo SpA 3.7Credit Suisse Group AG 3.5Daimler AG 3.3Continental AG 3.3Glencore PLC 3.3CNH Industrial N.V. 3.2Bayerische Motoren Werke AG 2.9Hennes & Mauritz AB (H&M) 2.8
SECTOR ALLOCATION % of Net AssetsFinancials 24.3Consumer Discretionary 22.6Industrials 19.9Communication Services 9.4Materials 8.0Health Care 4.4Information Technology 4.4Consumer Staples 2.1Energy 1.2Short-Term Investments and Other 3.6
FUND STATISTICSTicker* OAKIXNumber of Equity Holdings 62Net Assets $32.9 billionWeighted Average Market Cap $42.9 billionMedian Market Cap $22.4 billionGross Expense Ratio - Investor Class (as of 09/30/18)* 1.01%Net Expense Ratio - Investor Class (as of 09/30/18)*† 0.96%
* This information is related to the Investor Class. Please visitOakmark.com for information related to the Advisor, Institutional andService Classes.
† The net expense ratio reflects a contractual advisory fee waiveragreement through January 27, 2020.
GEOGRAPHIC ALLOCATION
* Euro currency countries comprise 40.8% of equity investments.
% of EquityEurope 80.5
United Kingdom 21.5Germany* 17.8France* 12.3Switzerland 11.8Sweden 6.4Netherlands* 4.4Italy* 3.8Ireland* 2.5
Asia 12.2Japan 4.9South Korea 3.5China 1.3
% of EquityAsia (cont’d) 12.2
Taiwan 1.1Indonesia 1.1India 0.3
Australasia 2.3Australia 2.3
North America 2.2Canada 1.5United States 0.7
Africa 2.1South Africa 2.1
Latin America 0.7Mexico 0.7
See accompanying Disclosures and Endnotes on page 45.
Oakmark International Fund June 30, 2019
Summary Information
Toppan Merrill - Harris-Oakmark Harris Associates Investment Trust N-30B-2 033-38953 06-30-2019 ED | thunt | 14-Aug-19 09:45 | 19-12672-1.ia | Sequence: 1CHKSUM Content: 29616 Layout: 49006 Graphics: 35759 CLEAN
JOB: 19-12672-1 CYCLE#;BL#: 8 TRIM: 8.250 x 10.750 AS: Chicago: 877-427-2185COLORS: ~note-color 3, ~HTML color, Black, ~HTML color 2, PANTONE 364 U, ~note-color 2, ~watermark GRAPHICS: 12672-1_INTERNATIONAL_L.eps V1.5

The Oakmark International Fund returned 3.4% for the quarterended June 30, 2019, slightly underperforming the MSCI Worldex U.S. Index13, which returned 3.8% over the same period.However, the Fund has returned an average of 9.2% per yearsince its inception in September 1992, outperforming the MSCIWorld ex U.S. Index, which has averaged 5.9% per year over thesame period.
WPP, a U.K.-based marketing and advertising company, was atop contributor for the quarter, returning 24%. WPP’s first-quarter earnings were in line with our expectations, while thenew business the company won during the quarter amountedto an estimated $2 billion in annual billings compared to$4 billion for the full year in 2018. The company’s sale processof its Kantar business is generating solid interest and manage-ment indicates they are on plan with the divestment process.In addition, strategic changes and restructuring are progressing according to plan.
Ryanair, headquartered in Ireland and the leading ultra-low-costair carrier in Europe, was a large detractor from performance forthe quarter, returning –14%. During the quarter, the companyannounced underlying 2019 fiscal-year results that were belowexpectations on the back of a weaker revenue environment.Passenger revenue was up only 0.6% as passenger growth of 8%was nearly entirely offset by falling yields with pricingdown 6%. Unfortunately, fuel prices are up nearly 20%, butprice discounting from higher cost competitors has preventedRyanair from passing on these higher fuel prices to passengers.We believe that increased competition in this industry willresult in consolidation, which will bring a more rational pricingenvironment to the market place. We think Ryanair continuesto be extremely well positioned given its structural cost advan-tage compared to its competitors and it maintains a strong bal-ance sheet that enables the management team to take along-term approach toward creating value. We support manage-ment’s growth aspirations and believe the company can continue to gain market share over its higher cost peers, thoughin the short term its earnings could remain volatile.
During the quarter, we sold our holding of Experian (Ireland) asit approached our estimate of fair value. We also initiated aposition in EssilorLuxottica (France), a designer, manufacturerand retailer of ophthalmic lenses, and Swatch (Switzerland), aglobal watch designer and manufacturer.
We continue to believe the Swiss franc is overvalued versus theU.S. dollar. As a result, we defensively hedged a portion of theFund’s exposure. Approximately 13% of the Swiss franc expo-sure was hedged at quarter end.
Geographically, we ended the quarter with approximately80.5% of our holdings in Europe and the U.K., 12.2% in Asia,and 2.2% in Australasia. The remaining positions are 2.1% inSouth Africa, 1.5% in Canada, 0.7% in the U.S. and 0.7% inMexico.
We thank you for your continued support.
David G. Herro, CFAPortfolio Manager
Michael L. Manelli, CFAPortfolio Manager
Oakmark.com 35
See accompanying Disclosures and Endnotes on page 45.
Oakmark International Fund June 30, 2019
Portfolio Manager Commentary
Toppan Merrill - Harris-Oakmark Harris Associates Investment Trust N-30B-2 033-38953 06-30-2019 ED | thunt | 14-Aug-19 09:45 | 19-12672-1.ia | Sequence: 2CHKSUM Content: 1227 Layout: 30449 Graphics: 8826 CLEAN
JOB: 19-12672-1 CYCLE#;BL#: 8 TRIM: 8.250 x 10.750 AS: Chicago: 877-427-2185COLORS: ~note-color 3, ~HTML color, Black, ~HTML color 2, PANTONE 364 U, ~note-color 2, ~watermark GRAPHICS: Michael_Manelli_small_photo.eps, David Herro photo 2018 S.eps V1.5
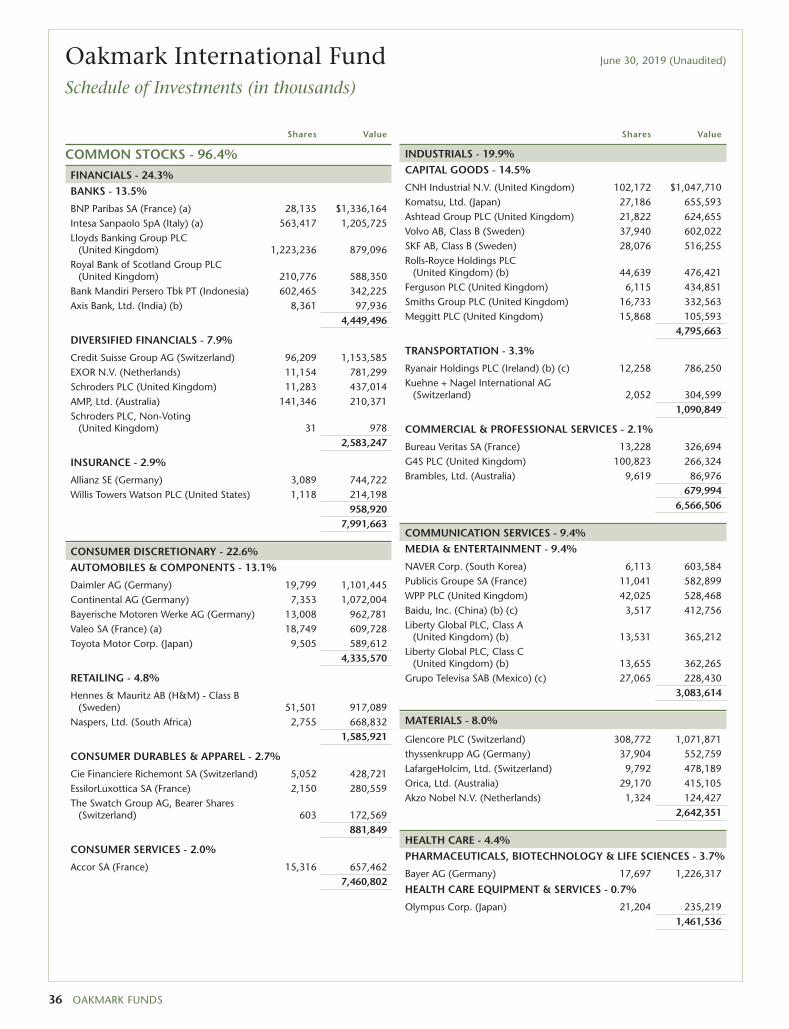
Oakmark International Fund June 30, 2019 (Unaudited)
Schedule of Investments (in thousands)
36 OAKMARK FUNDS
COMMON STOCKS - 96.4%FINANCIALS - 24.3%BANKS - 13.5%
BNP Paribas SA (France) (a) 28,135 $1,336,164Intesa Sanpaolo SpA (Italy) (a) 563,417 1,205,725Lloyds Banking Group PLC
(United Kingdom) 1,223,236 879,096Royal Bank of Scotland Group PLC
(United Kingdom) 210,776 588,350Bank Mandiri Persero Tbk PT (Indonesia) 602,465 342,225Axis Bank, Ltd. (India) (b) 8,361 97,936
4,449,496
DIVERSIFIED FINANCIALS - 7.9%
Credit Suisse Group AG (Switzerland) 96,209 1,153,585EXOR N.V. (Netherlands) 11,154 781,299Schroders PLC (United Kingdom) 11,283 437,014AMP, Ltd. (Australia) 141,346 210,371Schroders PLC, Non-Voting
(United Kingdom) 31 978 2,583,247
INSURANCE - 2.9%
Allianz SE (Germany) 3,089 744,722Willis Towers Watson PLC (United States) 1,118 214,198
958,920 7,991,663
CONSUMER DISCRETIONARY - 22.6%AUTOMOBILES & COMPONENTS - 13.1%
Daimler AG (Germany) 19,799 1,101,445Continental AG (Germany) 7,353 1,072,004Bayerische Motoren Werke AG (Germany) 13,008 962,781Valeo SA (France) (a) 18,749 609,728Toyota Motor Corp. (Japan) 9,505 589,612
4,335,570
RETAILING - 4.8%
Hennes & Mauritz AB (H&M) - Class B (Sweden) 51,501 917,089
Naspers, Ltd. (South Africa) 2,755 668,832 1,585,921
CONSUMER DURABLES & APPAREL - 2.7%
Cie Financiere Richemont SA (Switzerland) 5,052 428,721EssilorLuxottica SA (France) 2,150 280,559The Swatch Group AG, Bearer Shares
(Switzerland) 603 172,569 881,849
CONSUMER SERVICES - 2.0%
Accor SA (France) 15,316 657,462 7,460,802
Shares Value
INDUSTRIALS - 19.9%CAPITAL GOODS - 14.5%
CNH Industrial N.V. (United Kingdom) 102,172 $1,047,710Komatsu, Ltd. (Japan) 27,186 655,593Ashtead Group PLC (United Kingdom) 21,822 624,655Volvo AB, Class B (Sweden) 37,940 602,022SKF AB, Class B (Sweden) 28,076 516,255Rolls-Royce Holdings PLC
(United Kingdom) (b) 44,639 476,421Ferguson PLC (United Kingdom) 6,115 434,851Smiths Group PLC (United Kingdom) 16,733 332,563Meggitt PLC (United Kingdom) 15,868 105,593
4,795,663
TRANSPORTATION - 3.3%
Ryanair Holdings PLC (Ireland) (b) (c) 12,258 786,250Kuehne + Nagel International AG
(Switzerland) 2,052 304,599 1,090,849
COMMERCIAL & PROFESSIONAL SERVICES - 2.1%
Bureau Veritas SA (France) 13,228 326,694G4S PLC (United Kingdom) 100,823 266,324Brambles, Ltd. (Australia) 9,619 86,976
679,994 6,566,506
COMMUNICATION SERVICES - 9.4%MEDIA & ENTERTAINMENT - 9.4%
NAVER Corp. (South Korea) 6,113 603,584Publicis Groupe SA (France) 11,041 582,899WPP PLC (United Kingdom) 42,025 528,468Baidu, Inc. (China) (b) (c) 3,517 412,756Liberty Global PLC, Class A
(United Kingdom) (b) 13,531 365,212Liberty Global PLC, Class C
(United Kingdom) (b) 13,655 362,265Grupo Televisa SAB (Mexico) (c) 27,065 228,430
3,083,614
MATERIALS - 8.0%
Glencore PLC (Switzerland) 308,772 1,071,871thyssenkrupp AG (Germany) 37,904 552,759LafargeHolcim, Ltd. (Switzerland) 9,792 478,189Orica, Ltd. (Australia) 29,170 415,105Akzo Nobel N.V. (Netherlands) 1,324 124,427
2,642,351
HEALTH CARE - 4.4%PHARMACEUTICALS, BIOTECHNOLOGY & LIFE SCIENCES - 3.7%
Bayer AG (Germany) 17,697 1,226,317
HEALTH CARE EQUIPMENT & SERVICES - 0.7%
Olympus Corp. (Japan) 21,204 235,219 1,461,536
Shares Value
Toppan Merrill - Harris-Oakmark Harris Associates Investment Trust N-30B-2 033-38953 06-30-2019 ED | thunt | 14-Aug-19 09:45 | 19-12672-1.ib | Sequence: 1CHKSUM Content: 34527 Layout: 25591 Graphics: 0 CLEAN
JOB: 19-12672-1 CYCLE#;BL#: 8 TRIM: 8.250 x 10.750 AS: Chicago: 877-427-2185COLORS: ~note-color 2, PANTONE 364 U, Black, ~note-color 3 GRAPHICS: none V1.5

Oakmark International Fund June 30, 2019 (Unaudited)
Schedule of Investments (in thousands) (continued)
COMMON STOCKS - 96.4% (continued)INFORMATION TECHNOLOGY - 4.4%SEMICONDUCTORS & SEMICONDUCTOR EQUIPMENT - 2.6%
ASML Holding N.V. (Netherlands) 2,396 $500,610Taiwan Semiconductor
Manufacturing Co., Ltd. (Taiwan) 45,602 350,903 851,513
TECHNOLOGY HARDWARE & EQUIPMENT - 1.8%
Samsung Electronics Co., Ltd. (South Korea) 12,909 525,454Omron Corp. (Japan) 1,347 70,209
595,663 1,447,176
CONSUMER STAPLES - 2.1%FOOD, BEVERAGE & TOBACCO - 1.1%
Danone SA (France) 1,518 128,577Nestlé SA (Switzerland) 1,203 124,512Diageo PLC (United Kingdom) 2,256 96,973
350,062
HOUSEHOLD & PERSONAL PRODUCTS - 0.8%
Reckitt Benckiser Group PLC (United Kingdom) 3,448 272,087
FOOD & STAPLES RETAILING - 0.2%
Alimentation Couche-Tard, Inc., Class B (Canada) 1,079 67,874
690,023
ENERGY - 1.3%Cenovus Energy, Inc. (Canada) 46,577 410,800
TOTAL COMMON STOCKS - 96.4%(COST $33,989,520) 31,754,471
Par Value Value
SHORT-TERM INVESTMENTS - 3.1%GOVERNMENT AND AGENCY SECURITIES - 2.1%Federal National Mortgage Association,
2.24%, due 07/01/19 (d) $500,000 500,000Federal Home Loan Bank,
2.13%, due 07/01/19 (d) 200,000 200,000
Total Government and Agency Securities(Cost $700,000) 700,000
Shares Value
COMMERCIAL PAPER - 0.7%General Mills, Inc., 144A,
2.49% - 2.57%, due 07/10/19 - 07/22/19 (d) (e) $75,000 $74,924
Kellogg Co., 144A,2.54% - 2.57%, due 07/01/19 - 07/03/19 (d) (e) 40,000 39,997
Walgreens Boots,2.61% - 2.7%, due 07/25/19 - 08/09/19 (d) 32,000 31,931
Abbvie, Inc., 144A,2.47%, due 07/10/19 (d) (e) 25,000 24,985
Campbell Soup Co., 144A,3.18%, due 08/05/19 (d) (e) 25,000 24,925
Schlumberger Holdings Corp., 144A,2.54%, due 07/08/19 (d) (e) 15,000 14,993
TOTAL COMMERCIAL PAPER - 0.7%(COST $211,755) 211,755
REPURCHASE AGREEMENT - 0.3%
Fixed Income Clearing Corp. Repurchase Agreement, 1.50% dated 06/28/19 due 07/01/19, repurchase price $110,682, collateralized by a United States Treasury Note, 2.375% due 03/15/22, value plus accrued interest of $112,885 (Cost: $110,669) 110,669 110,669
TOTAL SHORT-TERM INVESTMENTS - 3.1%(COST $1,022,424) 1,022,424
TOTAL INVESTMENTS - 99.5%(COST $35,011,944) 32,776,895
Foreign Currencies (Cost $1,514) - 0.0% (f) 1,514
Other Assets In Excess of Liabilities - 0.5% 170,878
TOTAL NET ASSETS - 100.0% $32,949,287
(a) A portion of the security out on loan.
(b) Non-income producing security
(c) Sponsored American Depositary Receipt
(d) The rate shown represents the annualized yield at the time of purchase; not acoupon rate.
(e) Security exempt from registration under Rule 144A of the Securities Act of 1933, asamended. These securities may be resold, normally only to qualified institutionalbuyers.
(f) Amount rounds to less than 0.1%.
Par Value Value
Oakmark.com 37
Toppan Merrill - Harris-Oakmark Harris Associates Investment Trust N-30B-2 033-38953 06-30-2019 ED | thunt | 14-Aug-19 09:45 | 19-12672-1.ib | Sequence: 2CHKSUM Content: 47361 Layout: 30040 Graphics: 0 CLEAN
JOB: 19-12672-1 CYCLE#;BL#: 8 TRIM: 8.250 x 10.750 AS: Chicago: 877-427-2185COLORS: ~note-color 2, PANTONE 364 U, Black, ~note-color 3 GRAPHICS: none V1.5

Oakmark International Fund June 30, 2019 (Unaudited)
Schedule of Investments (in thousands) (continued)
38 OAKMARK FUNDS
FORWARD FOREIGN CURRENCY CONTRACT
Local Base Unrealized Contract Contract Settlement Valuation at Appreciation/ Amount Amount Date 6/30/19 (Depreciation)
Foreign Currency Sold:
Swiss Franc 327,871 $335,181 12/18/19 $341,069 $(5,888)
$341,069 $(5,888)
Toppan Merrill - Harris-Oakmark Harris Associates Investment Trust N-30B-2 033-38953 06-30-2019 ED | thunt | 14-Aug-19 09:45 | 19-12672-1.ib | Sequence: 3CHKSUM Content: 27669 Layout: 62947 Graphics: 0 CLEAN
JOB: 19-12672-1 CYCLE#;BL#: 8 TRIM: 8.250 x 10.750 AS: Chicago: 877-427-2185COLORS: ~note-color 2, PANTONE 364 U, Black, ~note-color 3 GRAPHICS: none V1.5

This page intentionally left blank.
Oakmark.com 39
Toppan Merrill - Harris-Oakmark Harris Associates Investment Trust N-30B-2 033-38953 06-30-2019 ED | thunt | 14-Aug-19 09:45 | 19-12672-1.ja | Sequence: 1CHKSUM Content: 43857 Layout: 7160 Graphics: 61853 CLEAN
JOB: 19-12672-1 CYCLE#;BL#: 8 TRIM: 8.250 x 10.750 AS: Chicago: 877-427-2185COLORS: PANTONE 364 U, ~note-color 3, Black, ~note-color 2 GRAPHICS: oakmark_funds_364_20%_logo.eps V1.5

Oakmark International Small Cap Fund June 30, 2019
Summary Information
40 OAKMARK FUNDS
VALUE OF A $10,000 INVESTMENTSince 06/30/08 (Unaudited)
PERFORMANCE Average Annual Total Returns (as of 06/30/19)
Total Return Since Inception(Unaudited) Last 3 Months 1-year 3-year 5-year 10-year Inception Date
Oakmark International Small Cap Fund (Investor Class) 4.62% -6.13% 7.77% 1.44% 8.65% 8.77% 11/01/95MSCI World ex U.S. Small Cap Index 1.76% -6.17% 8.38% 3.39% 9.19% N/AMSCI World ex U.S. Index13 3.79% 1.29% 9.01% 2.04% 6.75% 5.17%Lipper International Small Cap Fund Index17 2.86% -5.47% 8.28% 3.42% 9.71% N/AOakmark International Small Cap Fund (Advisor Class) 4.61% -6.13% N/A N/A N/A 6.44% 11/30/16Oakmark International Small Cap Fund (Institutional Class) 4.63% -5.98% N/A N/A N/A 6.54% 11/30/16Oakmark International Small Cap Fund (Service Class) 4.50% -6.30% 7.43% 1.14% 8.33% 8.68% 01/08/01
The graph and table do not reflect the deduction of taxes that a shareholder would pay on Fund distributions or the redemption of Fund shares.Past performance is no guarantee of future results. The performance data quoted represents past performance. Current performance may belower or higher than the performance data quoted. Total return includes change in share prices and, in each case, includes reinvestment of dividendsand capital gain distributions. The investment return and principal value vary so that an investor’s shares when redeemed may be worth more orless than the original cost. The performance of the Fund does not reflect the 2% redemption fee imposed on shares redeemed within 90 days ofpurchase. To obtain the most recent month-end performance, please visit Oakmark.com.
2009 2011 2013 2015 2017 2019
$5,000
MSCI World ex.U.S. Small CapIndex16 $24,094
Oakmark InternationalSmall Cap Fund(Investor Class) $22,924
$20,000
$25,000
$15,000
$10,000
$30,000
TOP TEN EQUITY HOLDINGS6 % of Net AssetsKonecranes OYJ 3.7Julius Baer Group, Ltd. 3.5BNK Financial Group, Inc. 3.4Duerr AG 3.2Azimut Holding SpA 3.0Incitec Pivot, Ltd. 2.9Sugi Holdings Co., Ltd. 2.8Element Fleet Management Corp. 2.6Controladora Vuela Cia de Aviacion SAB de CV 2.6Travis Perkins PLC 2.5
SECTOR ALLOCATION % of Net AssetsIndustrials 39.8Financials 17.7Consumer Discretionary 8.6Communication Services 8.5Health Care 6.1Materials 5.0Consumer Staples 4.9Information Technology 4.5Real Estate 1.2Short Term Investments and Other 3.8
FUND STATISTICSTicker* OAKEXNumber of Equity Holdings 63Net Assets $1.5 billionWeighted Average Market Cap $3.5 billionMedian Market Cap $2.9 billionGross Expense Ratio - Investor Class (as of 09/30/18)* 1.36%Net Expense Ratio - Investor Class (as of 09/30/18)* 1.36%
* This information is related to the Investor Class. Please visitOakmark.com for information related to the Advisor, Institutional andService Classes.
See accompanying Disclosures and Endnotes on page 45.
GEOGRAPHIC ALLOCATION
* Euro currency countries comprise 26.9% of equity investments.
% of EquityEurope 69.3
United Kingdom 22.9Switzerland 10.2Italy* 6.4Finland* 6.3Sweden 4.1Netherlands* 3.9Germany* 3.3Denmark 2.7Norway 2.5France* 2.3Spain* 2.2Belgium* 1.2Portugal* 0.7
% of EquityEurope (cont’d) 69.3
Greece* 0.6Asia 14.6
South Korea 5.5Japan 4.8Indonesia 3.0India 1.0Hong Kong 0.3
Australasia 8.1Australia 6.8New Zealand 1.3
Latin America 4.8Mexico 4.8
North America 3.2Canada 3.2
Toppan Merrill - Harris-Oakmark Harris Associates Investment Trust N-30B-2 033-38953 06-30-2019 ED | thunt | 14-Aug-19 09:45 | 19-12672-1.ja | Sequence: 2CHKSUM Content: 39036 Layout: 35048 Graphics: 25076 CLEAN
JOB: 19-12672-1 CYCLE#;BL#: 8 TRIM: 8.250 x 10.750 AS: Chicago: 877-427-2185COLORS: ~note-color 3, ~HTML color, Black, ~HTML color 2, PANTONE 364 U, ~note-color 2, ~watermark GRAPHICS: 12672-1_INT_SMALL_CAP_L.eps V1.5

Oakmark International Small Cap Fund June 30, 2019
Portfolio Manager Commentary
For the quarter ended June 30, 2019, the Oakmark InternationalSmall Cap Fund returned 4.6%, comparing favorably to theMSCI World ex U.S. Small Cap Index16, which returned 1.8% forthe same period. Since the Fund’s inception in November 1995,it has returned an average of 8.8% per year.
For a second quarter in a row, the largest contributor to Fundperformance was Azimut Holding. Based in Milan, Azimut is anItalian asset management company that maintains significantinternational operations in 16 other countries. During the quar-ter, the company announced strong first-quarter results thatreflected a 36% increase in fees. We anticipated this fee growthbecause of the strong market performance and because of thechanges that Azimut made to its fee structure, which wedescribed in our last quarterly letter. We, however, don’t expectthat this pace of growth will continue. That said, we believe thecompany seems well positioned to continue to produce positiveresults. Management has successfully controlled costs, whichhas led to a more than 200% increase in profits this year, com-pared to the prior year. In addition, the company paid out itspreviously announced dividend during the quarter, whichamounted to approximately a 9% yield. Management also reit-erated during the quarter that it expects to exceed its businessplan target of €300 million of net profit in 2019. Our discus-sions with company executives confirm that they remainfocused on profitably growing Azimut’s international business.We think these investments in international operations shouldcreate shareholder value over time. We continue to remainenthusiastic about the longer term prospects for this holding.
The largest detractor from performance for the quarter was OntexGroup—a producer of disposable personal hygiene productsoffered in Europe, Asia, the Americas and Africa. First-quarterresults from Ontex were weaker than expected due to a2% decline in reported revenues. Raw materials and FX alsocontinue to hurt the company’s profitability. Yet, Ontex gener-ated 6% organic growth in the Americas, Middle East and Africaregions. After a weak 2018, company management is not sittingidle. In addition to announcing a significant cost-efficiencyplan, the management team reviewed the entire business anddecided to consolidate five business segments into three(Europe, health care and Americas/Middle East/Africa), includ-ing making leadership changes within these segments. Webelieve these changes can better position the company forfuture growth. Finally, Ontex also has the opportunity toincrease its U.S. presence through its affiliation with a largeretailer, which could help offset some of its weaker markets.
We initiated four new holdings this quarter: Fluidra, a verticallyintegrated manufacturer, supplier and retailer of residential andcommercial swimming pool components based in Spain; BBAAviation, a previous Fund holding, located in the U.K., whichprovides flight support and aftermarket services and systems;Hong Kong Broadband Network, a telecommunications company
and the second-largest residential fixed line service provider inHong Kong; and Loomis, headquartered in Sweden, the world’ssecond-largest cash-in-transit and cash management operator inthe world. We eliminated our positions in Salvatore Ferragamo(Italy) and Totvs (Brazil) during the quarter.
Geographically, we ended the quarter with approximately 69%of our holdings in Europe and the U.K., 14% in Asia, and 8% inAustralasia. The remaining positions are in the Americas with5% in Latin America (Mexico) and 3% in North America(Canada).
We continue to believe both the Swiss franc and Norwegiankrone are still overvalued versus the U.S. dollar and remainhedged against these two currencies in the Fund. However, as aresult of the strengthening dollar, our hedge exposuresdecreased during the quarter and we ended June with hedgeson 12% of the Fund’s franc exposure and 20% of the kroneexposure.
As always, we thank you for your confidence and support.
Oakmark.com 41
David G. Herro, CFAPortfolio Manager
Michael L. Manelli, CFAPortfolio Manager
Justin D. Hance, CFAPortfolio Manager
See accompanying Disclosures and Endnotes on page 45.
Toppan Merrill - Harris-Oakmark Harris Associates Investment Trust N-30B-2 033-38953 06-30-2019 ED | thunt | 14-Aug-19 09:45 | 19-12672-1.ja | Sequence: 3CHKSUM Content: 54814 Layout: 1313 Graphics: 24512 CLEAN
JOB: 19-12672-1 CYCLE#;BL#: 8 TRIM: 8.250 x 10.750 AS: Chicago: 877-427-2185COLORS: ~note-color 3, ~HTML color, Black, ~HTML color 2, PANTONE 364 U, ~note-color 2, ~watermark GRAPHICS: justin_hance_photo.eps, Michael_Manelli_small_photo.eps, David Herro photo 2018 S.eps V1.5

Oakmark International Small Cap Fund June 30, 2019 (Unaudited)
Schedule of Investments (in thousands)
42 OAKMARK FUNDS
COMMON STOCKS - 96.2%INDUSTRIALS - 39.8%CAPITAL GOODS - 18.1%
Konecranes OYJ (Finland) 1,442 $55,053Duerr AG (Germany) 1,390 47,366Travis Perkins PLC (United Kingdom) 2,280 36,895Sulzer AG (Switzerland) 232 25,355Metso OYJ (Finland) 612 24,032Morgan Advanced Materials PLC
(United Kingdom) 6,394 22,574Howden Joinery Group PLC (United Kingdom) 3,371 21,707Bucher Industries AG (Switzerland) 36 12,543Outotec OYJ (Finland) (a) 2,212 11,681Wajax Corp. (Canada) 506 6,076Fluidra SA (Spain) (a) 345 4,559dormakaba Holding AG (Switzerland) 2 1,311
269,152
COMMERCIAL & PROFESSIONAL SERVICES - 16.7%
Mitie Group PLC (United Kingdom) 19,059 35,410Hays PLC (United Kingdom) 15,023 29,972Applus Services SA (Spain) 2,014 27,367ISS A/S (Denmark) 898 27,113Babcock International Group PLC
(United Kingdom) 4,652 27,067Randstad N.V. (Netherlands) 459 25,219Pagegroup PLC (United Kingdom) 3,821 24,891IWG PLC (Switzerland) 4,822 20,851Loomis AB, Class B (Sweden) 459 15,760SThree PLC (United Kingdom) 4,227 15,299
248,949
TRANSPORTATION - 5.0%
Controladora Vuela Cia de Aviacion SAB de CV (Mexico) (a) (b) 4,088 38,348
DSV AS (Denmark) 120 11,769Freightways, Ltd. (New Zealand) 1,600 9,074BBA Aviation PLC (United Kingdom) 2,190 7,849Panalpina Welttransport Holding AG
(Switzerland) (a) 28 6,412 73,452
591,553
FINANCIALS - 17.7%DIVERSIFIED FINANCIALS - 12.4%
Julius Baer Group, Ltd. (Switzerland) 1,167 51,964Azimut Holding SpA (Italy) 2,318 44,627Element Fleet Management Corp. (Canada) 5,350 39,055EFG International AG (Switzerland) 4,002 27,711Standard Life Aberdeen PLC (United Kingdom) 5,638 21,093
184,450
Shares Value
BANKS - 5.3%
BNK Financial Group, Inc. (South Korea) 7,751 $50,278DGB Financial Group, Inc. (South Korea) 4,109 29,005
79,283 263,733
CONSUMER DISCRETIONARY - 8.6%AUTOMOBILES & COMPONENTS - 4.8%
Pirelli & C SpA (Italy) 4,918 29,067Autoliv, Inc. (Sweden) 380 26,801Dometic Group AB (Sweden) 1,585 15,873
71,741
RETAILING - 2.0%
GrandVision N.V. (Netherlands) 1,316 30,576
CONSUMER SERVICES - 1.8%
Autogrill SpA (Italy) 1,647 17,259Dignity PLC (United Kingdom) 1,099 9,035
26,294 128,611
COMMUNICATION SERVICES - 8.4%MEDIA & ENTERTAINMENT - 4.3%
Criteo SA (France) (a) (b) 1,398 24,051Megacable Holdings SAB de CV (Mexico) 4,089 17,369NOS SGPS SA (Portugal) 1,517 9,967SKY Network Television, Ltd. (New Zealand) 12,123 9,610Hakuhodo DY Holdings, Inc. (Japan) 228 3,833
64,830
TELECOMMUNICATION SERVICES - 4.1%
Tower Bersama Infrastructure Tbk PT (Indonesia) 85,377 22,904
Sarana Menara Nusantara Tbk PT (Indonesia) 399,442 19,933
Bharti Infratel, Ltd. (India) 3,753 14,520HKBN, Ltd. (Hong Kong) 1,959 3,531
60,888 125,718
HEALTH CARE - 6.1%HEALTH CARE EQUIPMENT & SERVICES - 6.1%
Healius, Ltd. (Australia) 16,936 35,908ConvaTec Group PLC (United Kingdom) 19,233 35,611Ansell, Ltd. (Australia) 985 18,564
90,083
MATERIALS - 5.0%
Incitec Pivot, Ltd. (Australia) 17,965 43,009DS Smith PLC (United Kingdom) 4,939 22,738Titan Cement Co. SA (Greece) 420 8,189
73,936
Shares Value
Toppan Merrill - Harris-Oakmark Harris Associates Investment Trust N-30B-2 033-38953 06-30-2019 ED | thunt | 14-Aug-19 09:45 | 19-12672-1.jb | Sequence: 1CHKSUM Content: 20387 Layout: 58981 Graphics: 0 CLEAN
JOB: 19-12672-1 CYCLE#;BL#: 8 TRIM: 8.250 x 10.750 AS: Chicago: 877-427-2185COLORS: ~note-color 2, PANTONE 364 U, Black, ~note-color 3 GRAPHICS: none V1.5

Oakmark International Small Cap Fund June 30, 2019 (Unaudited)
Schedule of Investments (in thousands) (continued)
COMMON STOCKS - 96.2% (continued)CONSUMER STAPLES - 4.9%FOOD & STAPLES RETAILING - 2.8%
Sugi Holdings Co., Ltd. (Japan) 892 $42,093HOUSEHOLD & PERSONAL PRODUCTS - 2.1%
Ontex Group N.V. (Belgium) 1,074 17,315Kimberly-Clark de Mexico SAB de CV,
Class A (Mexico) (a) 7,105 13,212 30,527
72,620
INFORMATION TECHNOLOGY - 4.5%SOFTWARE & SERVICES - 2.4%
Atea ASA (Norway) (a) 2,617 35,585TECHNOLOGY HARDWARE & EQUIPMENT - 2.1%
Hirose Electric Co., Ltd. (Japan) 209 23,266Ingenico Group SA (France) 96 8,450
31,716 67,301
REAL ESTATE - 1.2%
LSL Property Services PLC (United Kingdom) 5,853 15,609Countrywide PLC (United Kingdom) (a) 33,681 1,803
17,412
TOTAL COMMON STOCKS - 96.2% (COST $1,457,619) 1,430,967
Par Value Value
SHORT-TERM INVESTMENTS - 3.4%REPURCHASE AGREEMENT - 1.8%Fixed Income Clearing Corp. Repurchase Agreement, 1.50% dated 06/28/19 due 07/01/19, repurchase price $26,546, collateralized by a United States Treasury Note, 2.375% due 03/15/22, value plus accrued interest of $27,076 (Cost: $26,543) $26,543 26,543
Shares Value
GOVERNMENT AND AGENCY SECURITIES - 1.6%Federal Home Loan Bank,
2.13%, due 07/01/19 (c) (Cost $25,000) $25,000 $25,000
TOTAL SHORT-TERM INVESTMENTS - 3.4% (COST $51,543) 51,543
TOTAL INVESTMENTS - 99.6% (COST $1,509,162) 1,482,510
Foreign Currencies (Cost $1,647) - 0.1% 1,648
Other Assets In Excess of Liabilities - 0.3% 3,564
TOTAL NET ASSETS - 100.0% $1,487,722
(a) Non-income producing security
(b) Sponsored American Depositary Receipt
(c) The rate shown represents the annualized yield at the time of purchase; not acoupon rate.
Par Value Value
Oakmark.com 43
Toppan Merrill - Harris-Oakmark Harris Associates Investment Trust N-30B-2 033-38953 06-30-2019 ED | thunt | 14-Aug-19 09:45 | 19-12672-1.jb | Sequence: 2CHKSUM Content: 18334 Layout: 36524 Graphics: 0 CLEAN
JOB: 19-12672-1 CYCLE#;BL#: 8 TRIM: 8.250 x 10.750 AS: Chicago: 877-427-2185COLORS: ~note-color 2, PANTONE 364 U, Black, ~note-color 3 GRAPHICS: none V1.5

Oakmark International Small Cap Fund June 30, 2019 (Unaudited)
Schedule of Investments (in thousands) (continued)
44 OAKMARK FUNDS
FORWARD FOREIGN CURRENCY CONTRACTS
Local Base Unrealized Contract Contract Settlement Valuation at Appreciation/ Amount Amount Date 6/30/19 (Depreciation)
Foreign Currency Sold:
Norwegian Krona 62,157 $7,209 03/18/20 $7,317 $(108)Swiss Franc 14,433 14,755 12/18/19 15,014 (259)
$22,331 $(367)
Toppan Merrill - Harris-Oakmark Harris Associates Investment Trust N-30B-2 033-38953 06-30-2019 ED | thunt | 14-Aug-19 09:45 | 19-12672-1.jb | Sequence: 3CHKSUM Content: 57314 Layout: 62947 Graphics: 0 CLEAN
JOB: 19-12672-1 CYCLE#;BL#: 8 TRIM: 8.250 x 10.750 AS: Chicago: 877-427-2185COLORS: ~note-color 2, PANTONE 364 U, Black, ~note-color 3 GRAPHICS: none V1.5

Reporting to Shareholders. The Funds reduce the number ofduplicate prospectuses, annual and semi-annual reports yourhousehold receives by sending only one copy of each to thoseaddresses shared by two or more accounts. Call the Funds at1-800-OAKMARK (625-6275) to request individual copies ofthese documents. The Funds will begin sending individualcopies 30 days after receiving your request.
Before investing in any Oakmark Fund, you should carefullyconsider the Fund’s investment objectives, risks, managementfees and other expenses. This and other important informationis contained in the Funds’ prospectus and a Fund’s summaryprospectus. Please read the prospectus and summary prospectuscarefully before investing. For more information, please visitOakmark.com or call 1-800-OAKMARK (625-6275).
The discussion of the Funds’ investments and investment strat-egy (including current investment themes, the portfolio man-agers’ research and investment process, and portfoliocharacteristics) represents the Funds’ investments and the viewsof the portfolio managers and Harris Associates L.P., the Funds’investment adviser, at the time of this report, and are subject tochange without notice.
All Oakmark Funds: Investing in value stocks presents the riskthat value stocks may fall out of favor with investors and under-perform growth stocks during given periods.
Oakmark, Oakmark Equity and Income, Oakmark Global, Oak-mark International, and Oakmark International Small CapFunds: The Funds’ portfolios tend to be invested in a relativelysmall number of stocks. As a result, the appreciation or depreci-ation of any one security held will have a greater impact on theFunds’ net asset value than it would if the Funds invest in alarger number of securities. Although that strategy has thepotential to generate attractive returns over time, it alsoincreases the Funds’ volatility.
Oakmark Select and Oakmark Equity and Income Funds: Thestocks of medium-sized companies tend to be more volatilethan those of large companies and have underperformed thestocks of small and large companies during some periods.
Because the Oakmark Select and Oakmark Global Select Fundsare non-diversified, the performance of each holding will havea greater impact on the Funds’ total return and may make theFunds’ returns more volatile than a more diversified fund.
Oakmark Global, Oakmark Global Select, Oakmark Interna-tional and Oakmark International Small Cap Funds: Investingin foreign securities presents risks which in some ways may begreater than U.S. investments. Those risks include: currencyfluctuation; different regulation, accounting standards, tradingpractices and levels of available information; generally highertransaction costs; and political risks.
The percentages of hedge exposure for each foreign currency arecalculated by dividing the market value of all same-currencyforward contracts by the market value of the underlying equityexposure to that currency.
The Oakmark Equity and Income Fund invests in medium- andlower quality debt securities that have higher yield potential butpresent greater investment and credit risk than higher qualitysecurities. These risks may result in greater share price volatility.
Oakmark International Small Cap Fund: The stocks of smallercompanies often involve more risk than the stocks of larger com-panies. Stocks of small companies tend to be more volatile andhave a smaller public market than stocks of larger companies.Small companies may have a shorter history of operations than
larger companies, may not have as great an ability to raise addi-tional capital and may have a less diversified product line, mak-ing them more susceptible to market pressure.
Endnotes:
1. Crouse, Karen. “How Basketball and Baseball Helped GaryWoodland Master Golf.” The New York Times, June 17, 2019.
2. Epstein, David. “Range: Why Generalists Triumph in aSpecialist World.” May 28, 2019.
3. The S&P 500 Total Return Index is a float-adjusted,capitalization-weighted index of 500 U.S. large-capitalization stocks representing all major industries. It is awidely recognized index of broad U.S. equity marketperformance. Returns reflect the reinvestment of dividends.This index is unmanaged and investors cannot investdirectly in this index.
4. The Dow Jones Industrial Average is a price-weightedmeasure of 30 U.S. blue-chip companies. The index coversall industries except transportation and utilities. This indexis unmanaged and investors cannot invest directly in thisindex.
5. The Lipper Large-Cap Value Fund Index measures theequal-weighted performance of the 30 largest U.S. large-capvalue funds as defined by Lipper. This index is unmanagedand investors cannot invest directly in this index.
6. Portfolio holdings are subject to change without notice andare not intended as recommendations of individual stocks.
7. The Price-Earnings Ratio (“P/E”) is the most commonmeasure of the expensiveness of a stock.
8. The Lipper Multi-Cap Value Fund Index measures theequal-weighted performance of the 30 largest U.S. multi-cap value funds as defined by Lipper. This index isunmanaged and investors cannot invest directly in thisindex.
9. The Lipper Balanced Fund Index measures the equal-weighted performance of the 30 largest U.S. balanced fundsas defined by Lipper. This index is unmanaged andinvestors cannot invest directly in this index.
10. The Barclays U.S. Government/Credit Index measures thenon-securitized component of the U.S. Aggregate Index. Itincludes investment grade, U.S. dollar-denominated, fixed-rate Treasuries, government-related and corporate securities.This index is unmanaged and investors cannot investdirectly in this index.
11. The MSCI World Index (Net) is a free float-adjusted, marketcapitalization-weighted index that is designed to measurethe global equity market performance of developedmarkets. The index covers approximately 85% of the freefloat-adjusted market capitalization in each country. Thisbenchmark calculates reinvested dividends net ofwithholding taxes. This index is unmanaged and investorscannot invest directly in this index.
12. The Lipper Global Fund Index measures the equal-weightedperformance of the 30 largest global equity funds as definedby Lipper. This index is unmanaged and investors cannotinvest directly in this index.
13. The MSCI World ex U.S. Index (Net) is a free float-adjusted,market capitalization-weighted index that is designed tomeasure international developed market equityperformance, excluding the U.S. The index covers
Disclosures and Endnotes
Oakmark.com 45
Toppan Merrill - Harris-Oakmark Harris Associates Investment Trust N-30B-2 033-38953 06-30-2019 ED | thunt | 14-Aug-19 09:45 | 19-12672-1.na | Sequence: 1CHKSUM Content: 20309 Layout: 8586 Graphics: 0 CLEAN
JOB: 19-12672-1 CYCLE#;BL#: 8 TRIM: 8.250 x 10.750 AS: Chicago: 877-427-2185COLORS: PANTONE 364 U, ~note-color 2, Black, ~note-color 3 GRAPHICS: none V1.5

Disclosures and Endnotes (continued)
approximately 85% of the free float-adjusted marketcapitalization in each country. This benchmark calculatesreinvested dividends net of withholding taxes. This index isunmanaged and investors cannot invest directly in thisindex.
14. The MSCI EAFE Index (Net) is designed to represent theperformance of large- and mid-cap securities across 21developed markets, including countries in Europe,Australasia and the Far East, excluding the U.S. and Canada.The index covers approximately 85% of the free float-adjusted market capitalization in each of the 21 countries.This benchmark calculates reinvested dividends net ofwithholding taxes. This index is unmanaged and investorscannot invest directly in this index.
15. The Lipper International Fund Index measures the equal-weighted performance of the 30 largest international equityfunds, as defined by Lipper. This index is unmanaged andinvestors cannot invest directly in this index.
16. The MSCI World ex U.S. Small Cap Index (Net) is designedto measure performance of small-cap stocks across 22 of 23developed markets (excluding the U.S.). The index coversapproximately 14% of the free float-adjusted marketcapitalization in each country. This benchmark calculatesreinvested dividends net of withholding taxes. This index isunmanaged and investors cannot invest directly in thisindex.
17. The Lipper International Small-Cap Fund Index measuresthe equal-weighted performance of the 30 largestinternational small-cap equity funds as defined by Lipper.This index is unmanaged and investors cannot investdirectly in this index.
46 OAKMARK FUNDS
Toppan Merrill - Harris-Oakmark Harris Associates Investment Trust N-30B-2 033-38953 06-30-2019 ED | thunt | 14-Aug-19 09:45 | 19-12672-1.na | Sequence: 2CHKSUM Content: 10929 Layout: 54161 Graphics: 0 CLEAN
JOB: 19-12672-1 CYCLE#;BL#: 8 TRIM: 8.250 x 10.750 AS: Chicago: 877-427-2185COLORS: PANTONE 364 U, ~note-color 2, Black, ~note-color 3 GRAPHICS: none V1.5

Oakmark FundsTrustees and Officers
TrusteesAllan J. Reich—ChairThomas H. HaydenHugh T. Hurley, IIIPatricia LouieChristine M. MakiLaurence C. Morse, Ph.D.Mindy M. PosoffSteven S. RogersKristi L. Rowsell
OfficersKristi L. Rowsell—President and Principal Executive OfficerAnthony P. Coniaris—Executive Vice PresidentKevin G. Grant—Executive Vice PresidentJoseph J. Allessie—Vice President*Megan J. Claucherty—Vice PresidentRick Dercks—Vice President*Justin D. Hance—Vice PresidentDavid G. Herro—Vice PresidentM. Colin Hudson—Vice PresidentJohn J. Kane—Vice PresidentChristopher W. Keller—Vice PresidentEric Liu—Vice PresidentJason E. Long—Vice PresidentMichael L. Manelli—Vice PresidentClyde S. McGregor—Vice PresidentThomas W. Murray—Vice PresidentMichael J. Neary—Vice PresidentMichael A. Nicolas—Vice PresidentWilliam C. Nygren—Vice PresidentVineeta D. Raketich—Vice PresidentZachary D. Weber—Vice President, Principal Financial Officer
and TreasurerBenjamin D. Wiesenfeld—Vice President, Chief Compliance
Officer, Assistant Secretary and Anti-Money Laundering OfficerEdward J. Wojciechowski—Vice PresidentRana J. Wright—Vice President, Secretary and Chief Legal Officer
* Mr. Allessie and Mr. Dercks each assumed his respectiveduties effective April 24, 2019.
Other Information
Investment AdviserHarris Associates L.P.111 S. Wacker DriveChicago, Illinois 60606-4319
Transfer AgentDST Asset Manager Solutions, Inc.Quincy, Massachusetts
Legal CounselK&L Gates LLPWashington, D.C.
Independent Registered Public Accounting FirmDeloitte & Touche LLPChicago, Illinois
Contact UsPlease call 1-800-OAKMARK(1-800-625-6275)or 617-483-8327
WebsiteOakmark.com
Twitter@HarrisOakmark
To obtain a prospectus, an application or periodic reports, access our website at Oakmark.com orcall 1-800-OAKMARK (625-6275) or 617-483-8327.
Each Fund files its complete schedule of portfolio holdings with the Securities and Exchange Commission (“SEC”) for the first and thirdquarters of each fiscal year on Form N-Q or Form N-PORT (for filings after March 31, 2019). The Funds’ Form N-Qs (Form N-PORTs) areavailable on the SEC’s website at www.sec.gov.
A description of the policies and procedures the Funds use to determine how to vote proxies relating to portfolio securities is avail-able without charge, upon request, by calling toll-free 1-800-625-6275; on the Funds’ website at Oakmark.com; and on the SEC’swebsite at www.sec.gov.
No later than August 31 of each year, information regarding how the Adviser, on behalf of the Funds, voted proxies relating to theFunds’ portfolio securities for the 12 months ended the preceding June 30 will be available through a link on the Funds’ website atOakmark.com and on the SEC’s website at www.sec.gov.
This report is submitted for the general information of the shareholders of the Funds. The report is not authorized for distribution toprospective investors in the Funds unless it is accompanied or preceded by a currently effective prospectus of the Funds.
No sales charge to the shareholder or to the new investor is made in offering the shares of the Funds.
Oakmark.com 47
Toppan Merrill - Harris-Oakmark Harris Associates Investment Trust N-30B-2 033-38953 06-30-2019 ED | thunt | 14-Aug-19 09:45 | 19-12672-1.ya | Sequence: 1CHKSUM Content: 7840 Layout: 22030 Graphics: 0 CLEAN
JOB: 19-12672-1 CYCLE#;BL#: 8 TRIM: 8.250 x 10.750 AS: Chicago: 877-427-2185COLORS: PANTONE 364 U, ~note-color 2, Black, ~note-color 3 GRAPHICS: none V1.5

Oakmark.com
Toppan Merrill - Harris-Oakmark Harris Associates Investment Trust N-30B-2 033-38953 06-30-2019 ED | thunt | 14-Aug-19 09:45 | 19-12672-1.za | Sequence: 1CHKSUM Content: 40460 Layout: 53005 Graphics: 1717 CLEAN
JOB: 19-12672-1 CYCLE#;BL#: 8 TRIM: 8.250 x 10.750 AS: Chicago: 877-427-2185COLORS: PANTONE 364 U, ~note-color 2, Black, ~note-color 3 GRAPHICS: harris_oakmark_364_k_ovrpnt.eps, Harris_BC artwork_364.eps V1.5


![CHKSUM No Graphics Statements ED [AUX] Merrill Corp ... · Hartford Corporate Bond ETF Hartford Quality Bond ETF LATTICE STRATEGIES TRUST on behalf of Hartford Multifactor Developed](https://img.pdfslide.net/doc/110x75/60e2c8be06d8283c191a9ade/chksum-no-graphics-statements-ed-aux-merrill-corp-hartford-corporate-bond.jpg)