Embed Size (px)
Citation preview
Chloramines 101
TCEQ October 2015
1
Outline of today’s talk
History – Chloramine use, pros and cons
Chemistry & what to measure – Breakpoint breakdown
– Controlling chloramines
– Site specific monitoring requirements
Take home message: – Chloramines help systems comply with disinfection byproducts (DBPs)
and hold a stable residual.
– You need to monitor total chlorine, monochloramine, free ammonia, and free chlorine. (Plus nitrite/nitrate)
2
HISTORY OF CHLORAMINES IN TEXAS
3
Texas has history of chloramine usage
Historically, public water systems (PWSs) used chloramines to keep a stable residual.
– Austin started chloraminating in 1950s
Later, systems started using chloramines for trihalomethane (THM) control.
• TTHM Rule in the late ’80s and thru the ‘90s – Most systems > 100,000 converted
• DBP1 – 2002 for large (over 10K), 2004 for small
• DBP2 – Now
4
About 1,200 of Texas’s 7,000 PWSs distribute chloramines
About 90% of 350 PWSs with surface water treatment plants (SWTPs) chloraminate
– About 850 PWSs purchase and redistribute chloraminated surface water
– A handful of PWSs with groundwater in northeast Texas use chloramines
Each PWS using chloramines must have site-specific approval letter from TCEQ.
– Systems blending chloraminated and chlorinated sources must receive an “exception” from the TCEQ
– Systems distributing purchased chloraminated water and not treating are not required to get approval
5
Chloramination clarification
• Chloramination facts:
– Chloramines smell fine unless they are dosed or maintained wrong.
– Some web sites say that chloramines smell bad. Monochloramine—the disinfectant species—smells like chlorine. Di- and tri-chloramine stink.
– Experience proves that chloramines do not cause health issues.
– Some web sites blame various symptoms on chloramines, but 25% of Americans are okay drinking chloraminated water
6
Pros and Cons
• PRO: Long-lasting residual
• PRO: Less trihalomethane (THM) and haloacetic acid (HAA) formation
• CON: Need to hold a higher residual
• CON: Potential risk of nitrification, which can cause loss of residual and nitrite formation
• CON: More chemistry
7
CHLORAMINE CHEMISTRY
8
The chemicals of interest
• Chlorine – Regardless of gas or other source, in water it is
hypochlorite ion and hypochlorous acid
• Ammonia – “Free Available” ammonia
• Inorganic (what is being dosed)
• Organic (what is in some source water)
• Chloramines: Mono-, Di-, Tri- – Monochloramine is what we want
9
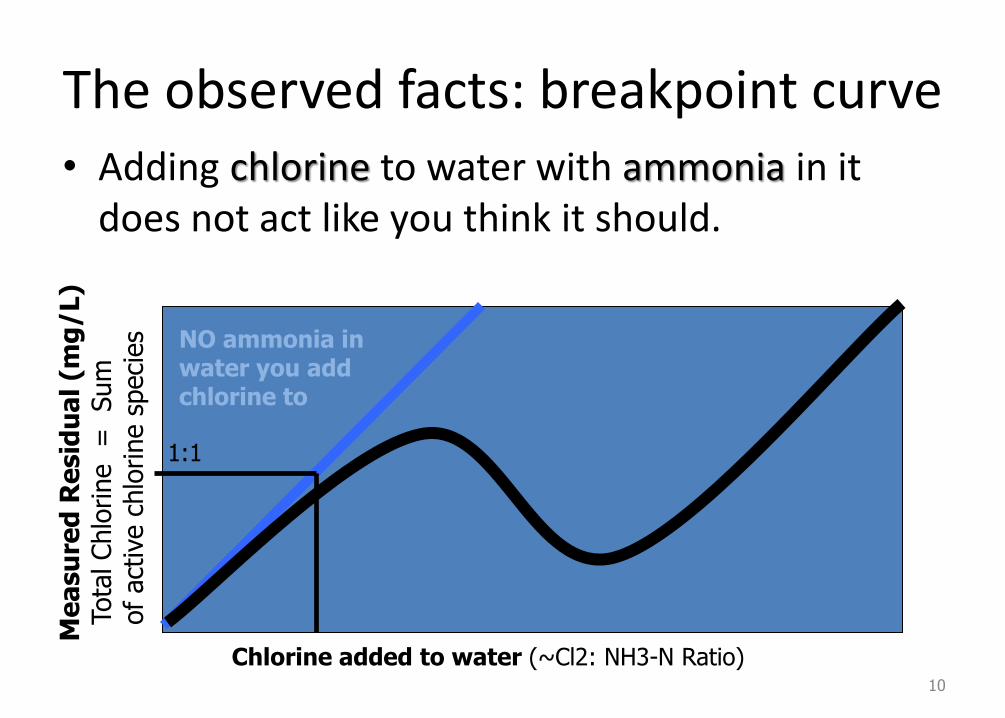
The observed facts: breakpoint curve • Adding chlorine to water with ammonia in it
does not act like you think it should.
10
Me
asu
red
Re
sid
ua
l (m
g/L)
To
tal Chlo
rine =
Sum
of
act
ive c
hlo
rine s
peci
es
Chlorine added to water (~Cl2: NH3-N Ratio)
NO ammonia in water you add chlorine to
1:1
Yuefeng Xie’s Bar Theory of chloramination
• This chlorine molecule walks into a bar… – At first, there are lots of free available
ammonia molecules….
• Later, a chlorine molecule walks into a bar… – And all the free available ammonia
molecules were used up…
Monochloramine formation
HOCl + NH3 NH2Cl + H2O • Free chlorine in contact with ammonia forms
monochloramine and water, in equilibrium
– Monochloramine is the desired species for chloramination in drinking water treatment
– It is the disinfectant
– Forms fastest at pH 8.3
– Dominates when Cl:N mass ratio is 0 to ~5:1
– The breakpoint curve rises at about 1:1 during monochloramine formation
12
Dichloramine formation
• Two reactions
– HOCl + NH2Cl NHCl2 + H2O
• Monochloramine reacts further with chlorine to give dichloramine and water, essentially 1-way
• Occurs at pH <8
– 2NH2Cl NHCl2 + NH3
• Autodecomposition of monochloramine into dichloramine – equilibrium
– When you are getting significant dichloramine, the breakpoint curve will start dropping
13
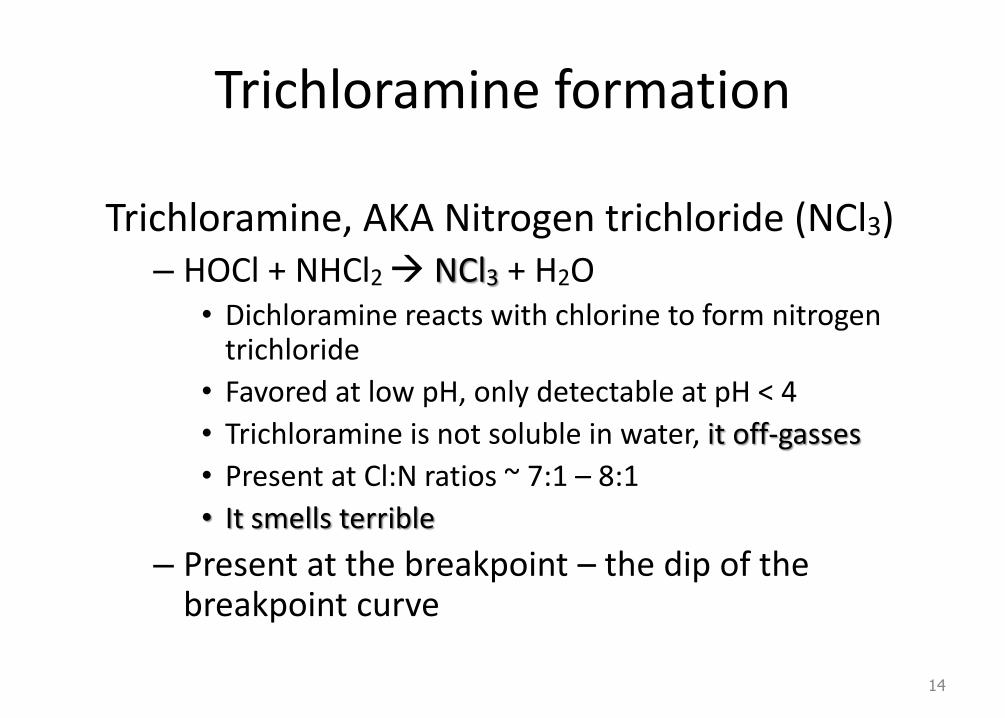
Trichloramine formation
Trichloramine, AKA Nitrogen trichloride (NCl3) – HOCl + NHCl2 NCl3 + H2O
• Dichloramine reacts with chlorine to form nitrogen trichloride
• Favored at low pH, only detectable at pH < 4
• Trichloramine is not soluble in water, it off-gasses
• Present at Cl:N ratios ~ 7:1 – 8:1
• It smells terrible
– Present at the breakpoint – the dip of the breakpoint curve
14
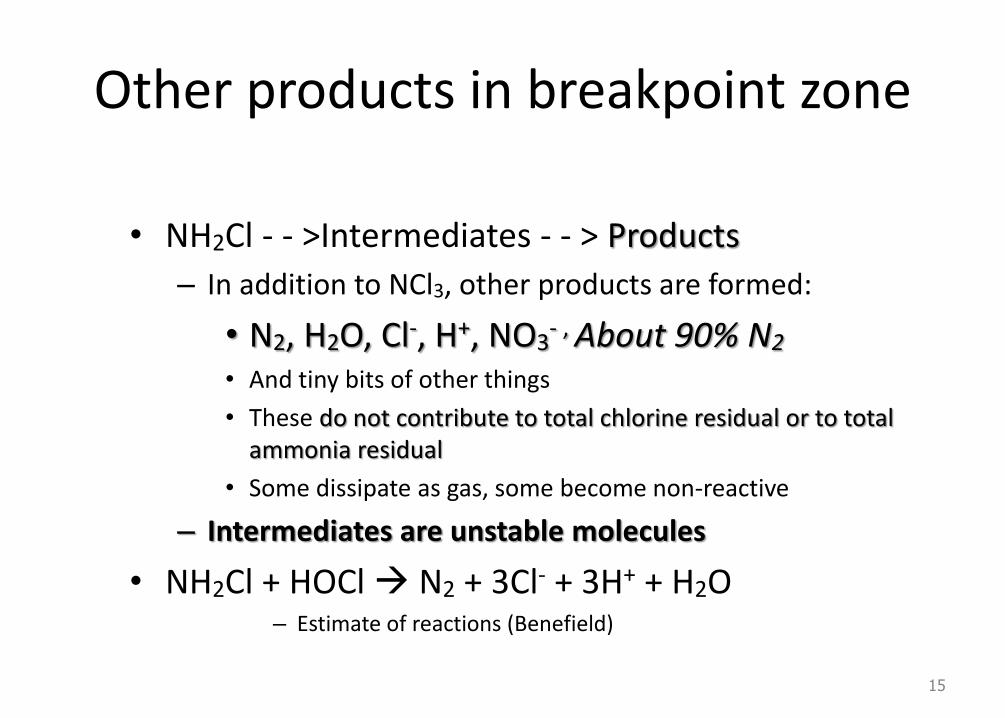
Other products in breakpoint zone
• NH2Cl - - >Intermediates - - > Products
– In addition to NCl3, other products are formed:
• N2, H2O, Cl-, H+, NO - , 3 About 90% N2
• And tiny bits of other things
• These do not contribute to total chlorine residual or to totalammonia residual
• Some dissipate as gas, some become non-reactive
– Intermediates are unstable molecules
• NH2Cl + HOCl N2 + 3Cl- + 3H+ + H2O– Estimate of reactions (Benefield)
15
Organic amines
• In drinking water treatment, chlorine and chloramines react with naturally occurring organic molecules
– This reaction can form stable organoamines
• Commonly expressed as R-NHx
–Normal field tests may detect organoamines as total ammonia
16
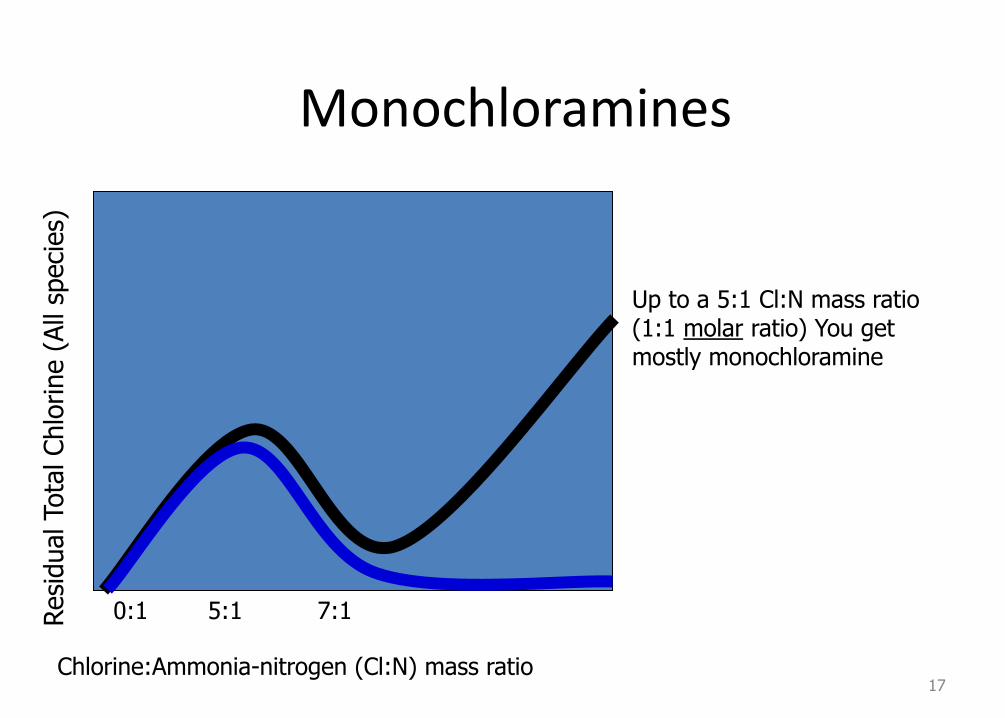
Monochloramines
17
0:1 5:1 7:1 Resi
dual To
tal Chlo
rine (
All
speci
es)
Chlorine:Ammonia-nitrogen (Cl:N) mass ratio
Up to a 5:1 Cl:N mass ratio 1:1 molar ratio) You get ostly monochloramine
(m
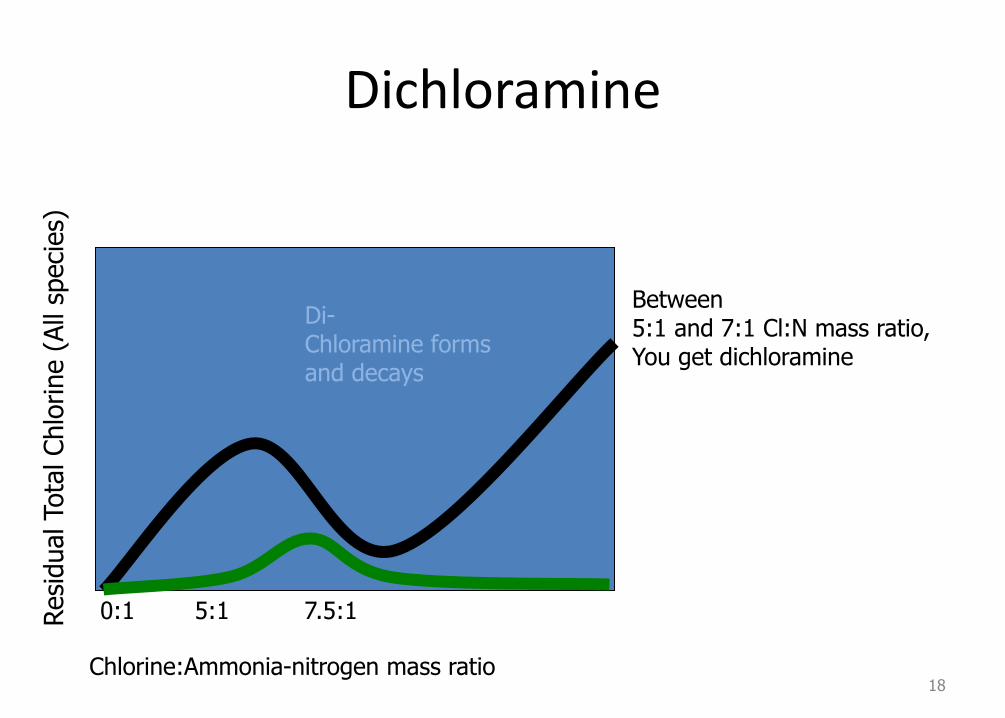
Dichloramine
peci
es)
s(A
ll lo
rine
Ch
al
ot
Tual
ides
R
Di- Chloramine forms and decays
0:1 5:1 7.5:1
Chlorine:Ammonia-nitrogen mass ratio
Between 5:1 and 7:1 Cl:N mass ratio, You get dichloramine
18
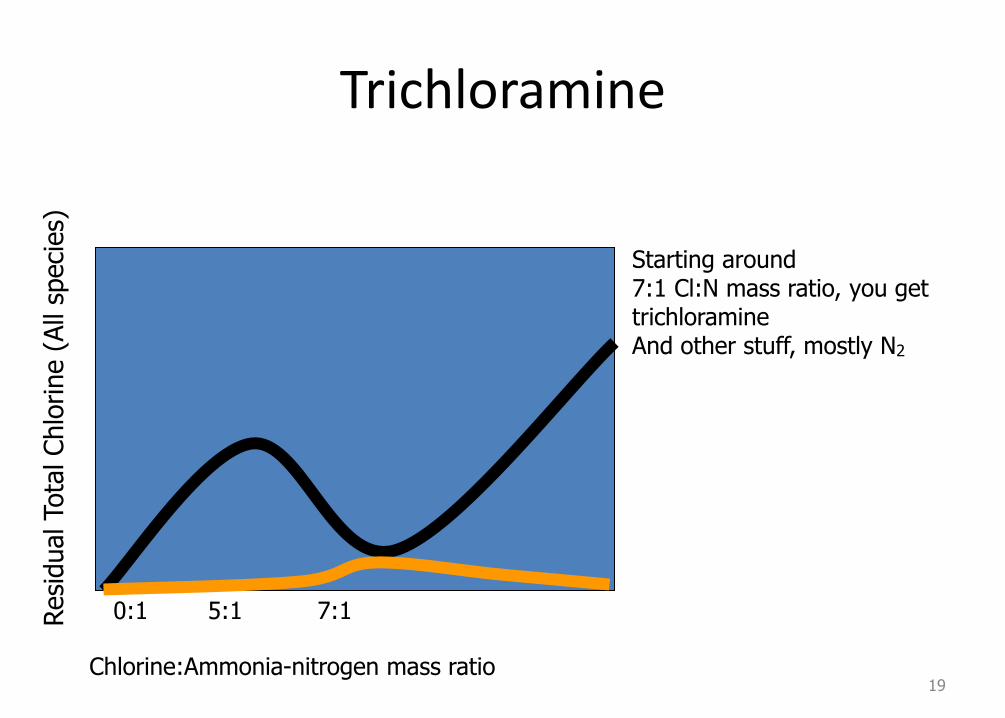
Trichloramine
Starting around 7:1 Cl:N mass ratio, you get trichloramine And other stuff, mostly N2
Resi
dual To
tal Chlo
rine (
All
speci
es)
Chlorine:Ammonia-nitrogen mass ratio
0:1 5:1 7:1
19
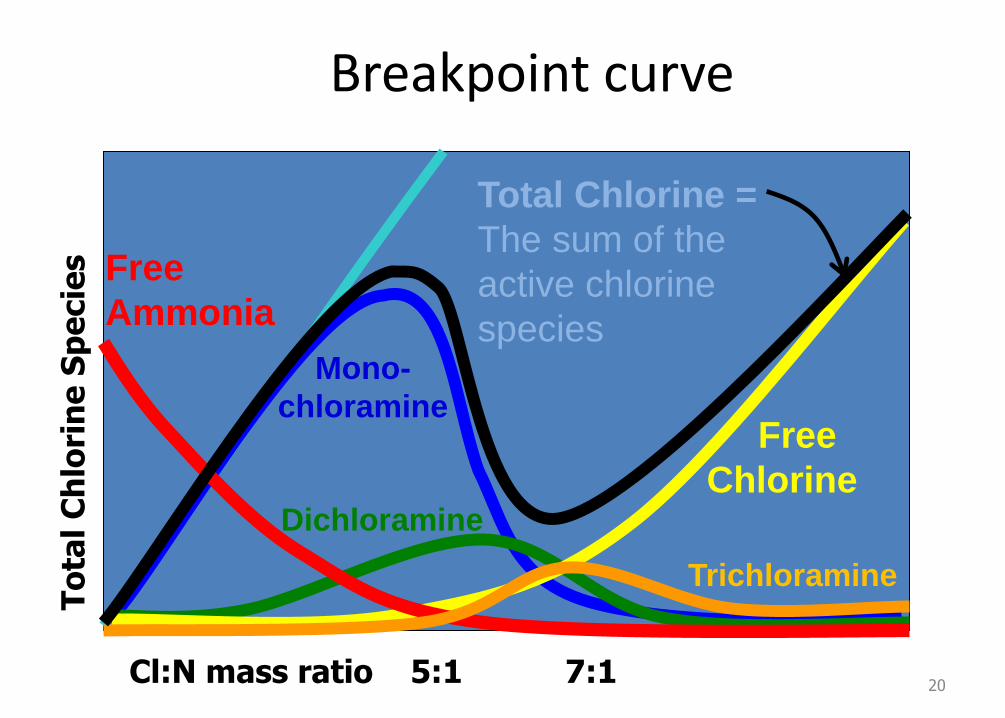
Breakpoint curve
20
Mono-
chloramine
Dichloramine
To
tal
Ch
lori
ne
Sp
ecie
s
Cl:N mass ratio 5:1 7:1
Free
Chlorine
Free
Ammonia
Trichloramine
Total Chlorine =
The sum of the
active chlorine
species
CHLORAMINES: WHAT TO MEASURE
21
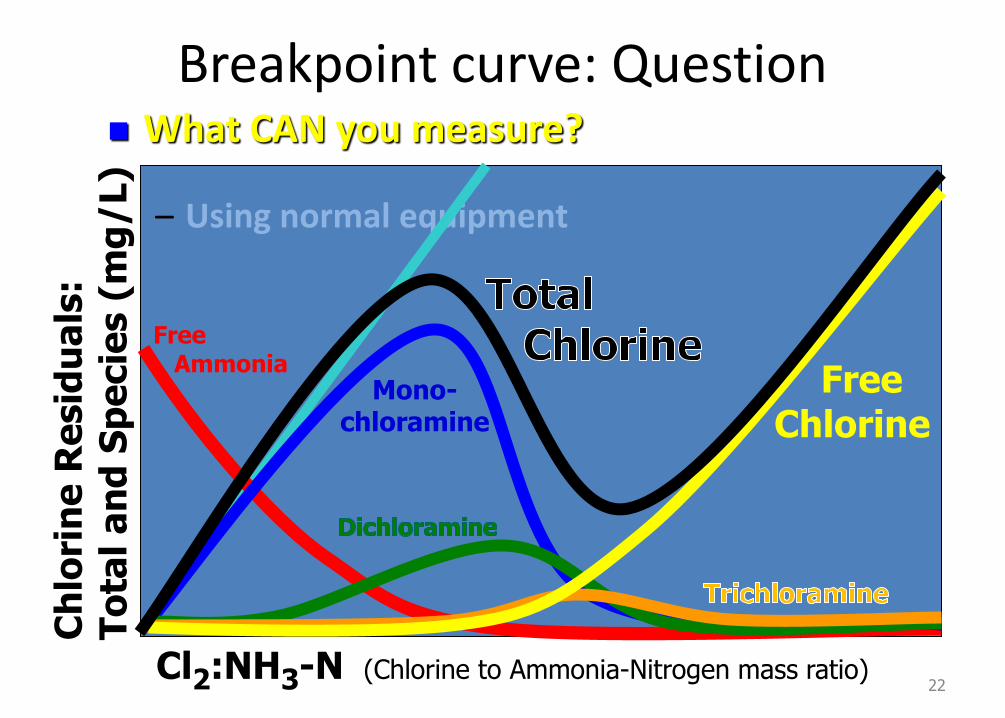
Breakpoint curve: Question
22
Ch
lori
ne
Re
sid
ua
ls:
T
ota
l a
nd
Sp
ecie
s (
mg
/L)
Cl2:NH3-N (Chlorine to Ammonia-Nitrogen mass ratio)
Free Ammonia
Mono-chloramine
Free Chlorine
– Using normal equipment
What CAN you measure?
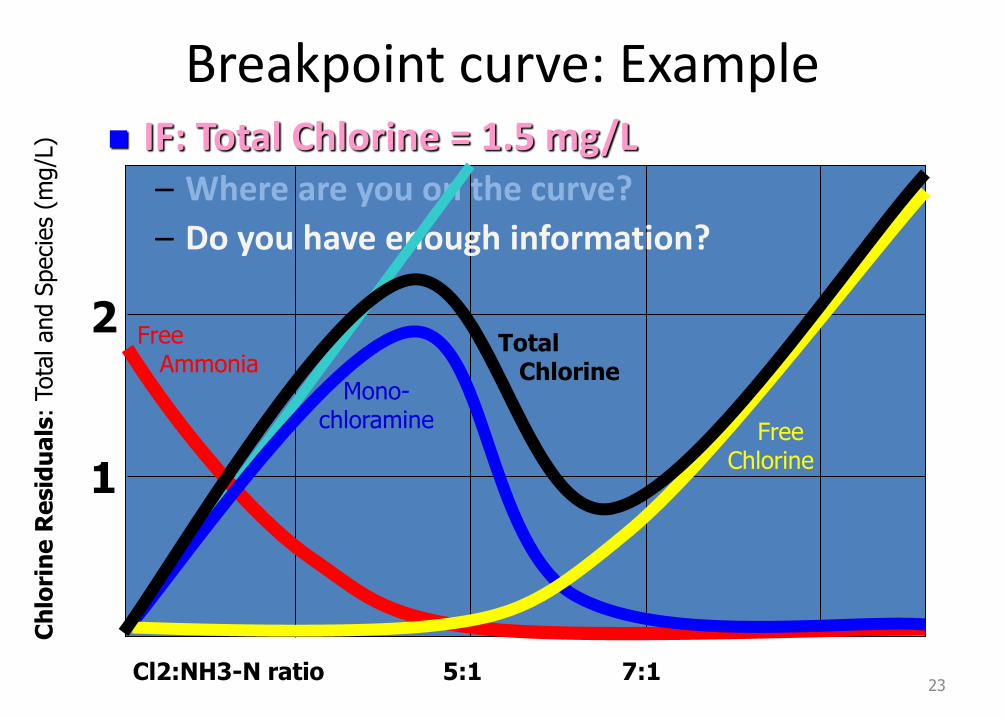
Breakpoint curve: Example
23
Ch
lori
ne R
esid
ua
ls:
Tota
l and S
peci
es
(mg/
Free Ammonia
Mono-chloramine
Free Chlorine
Total Chlorine
– Where are you on the curve?
– Do you have enough information?
1
2
Cl2:NH3-N ratio 5:1 7:1
L) IF: Total Chlorine = 1.5 mg/L
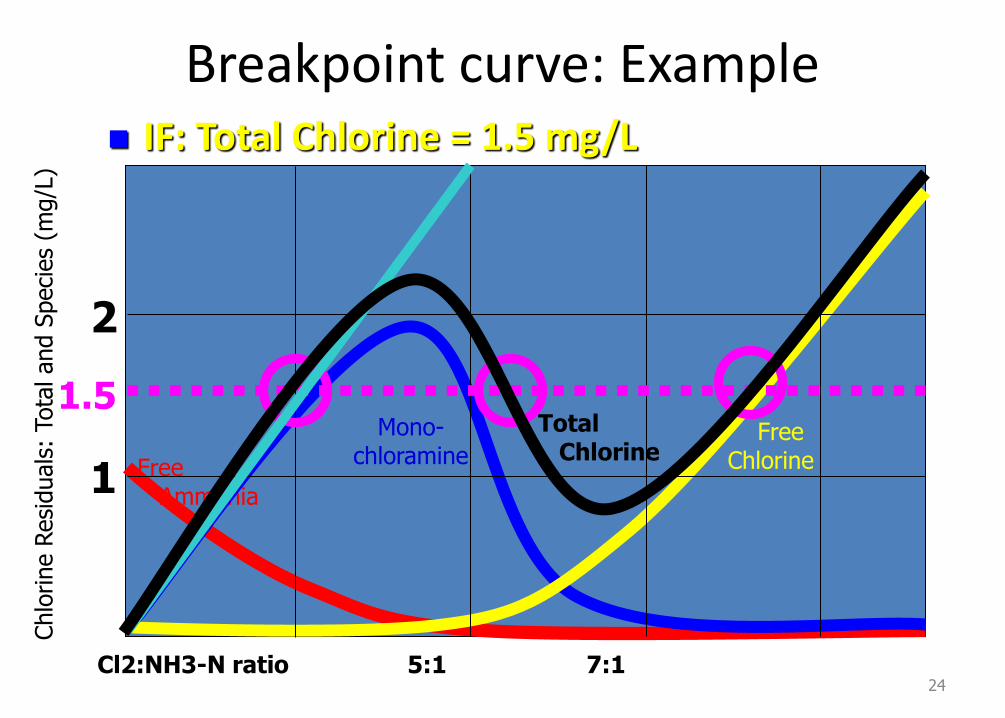
Breakpoint curve: Example
24
Chlo
rine R
esi
duals
: Tota
l and S
peci
es
(mg/L
)
Cl2:NH3-N ratio 5:1 7:1
Free Ammonia
Mono-chloramine
Free Chlorine
Total Chlorine
1
2
1.5
IF: Total Chlorine = 1.5 mg/L
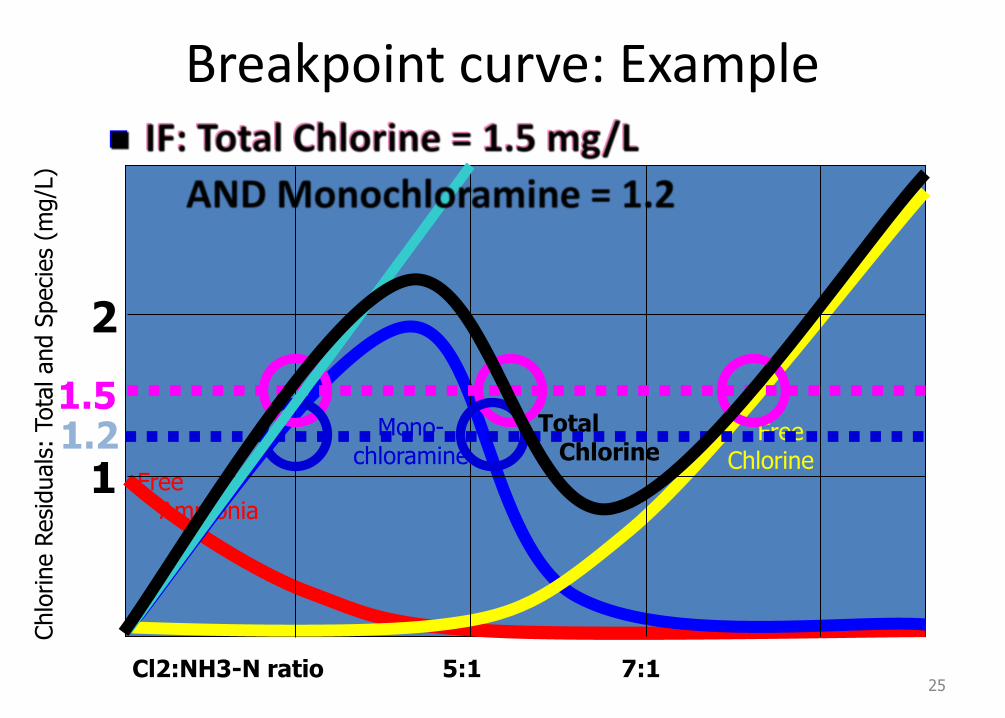
Breakpoint curve: Example IF: Total Chlorine = 1.5 mg/L
AND Monochloramine = 1.2
25
Chlo
rine R
esi
duals
: Tota
l and S
peci
es
(mg/L
)
Free Ammonia
Mono-chloramine
Free Chlorine
Total Chlorine
1
2
1.5
1.2
Cl2:NH3-N ratio 5:1 7:1
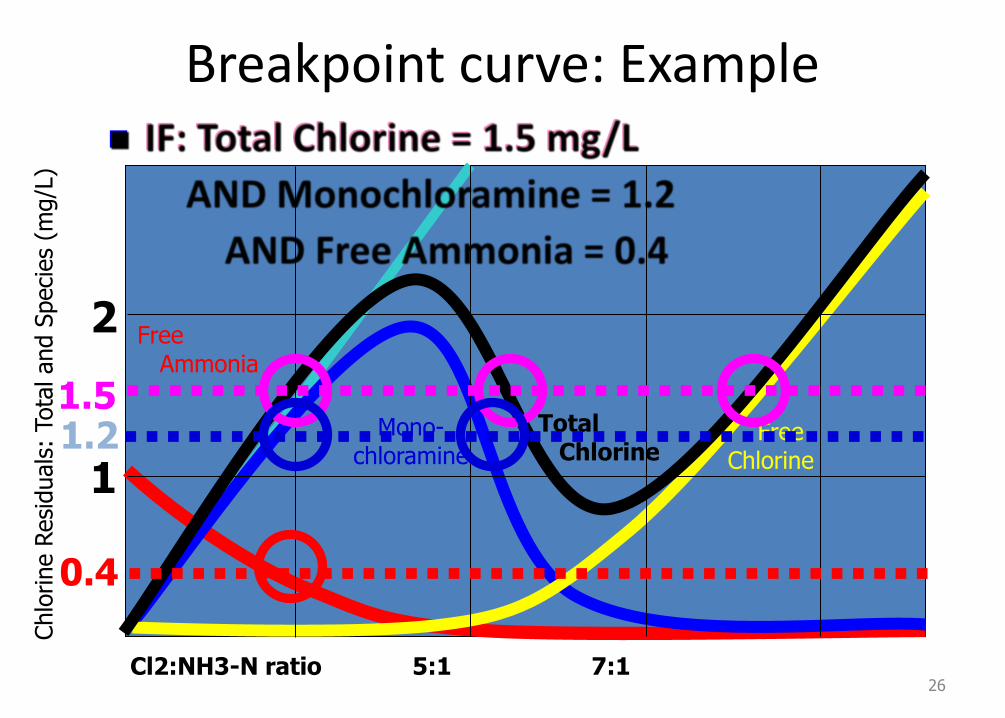
Breakpoint curve: Example
AND Monochloramine = 1.2
AND Free Ammonia = 0.4
IF: Total Chlorine = 1.5 mg/L
26
Chlo
rine R
esi
duals
: Tota
l and S
peci
es
(mg/L
)
Free Ammonia
Mono-chloramine
Free Chlorine
Total Chlorine
1
2
1.5
1.2
0.4
Cl2:NH3-N ratio 5:1 7:1
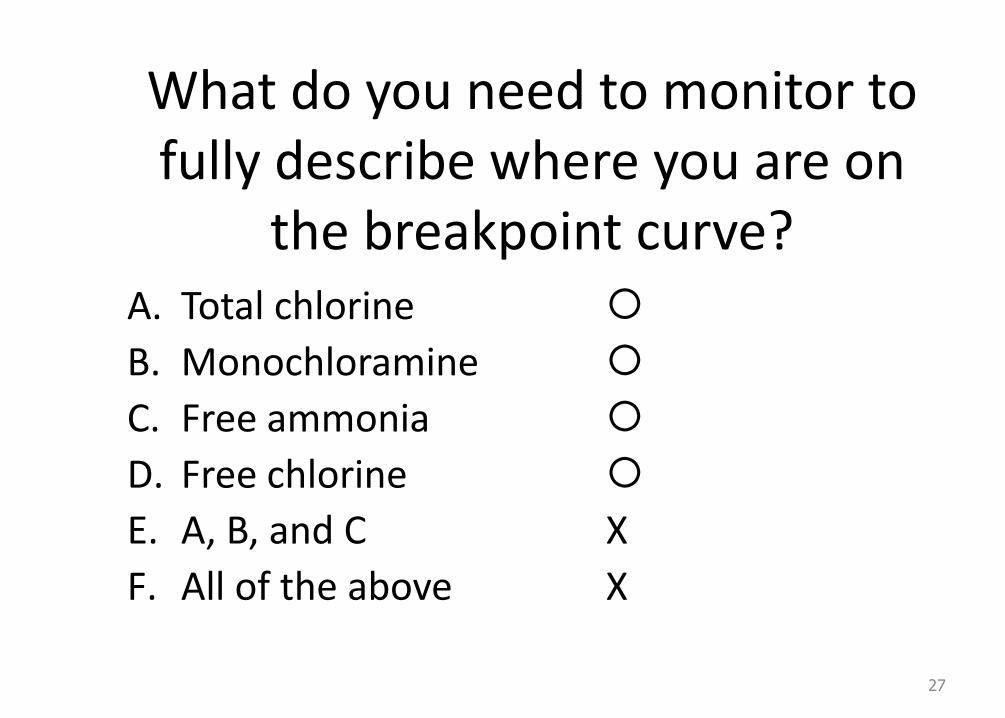
What do you need to monitor to fully describe where you are on
the breakpoint curve? A. Total chlorine
B. Monochloramine
C. Free ammonia
D. Free chlorine
E. A, B, and C X
F. All of the above X
27
CONTROLLING CHLORAMINES
28
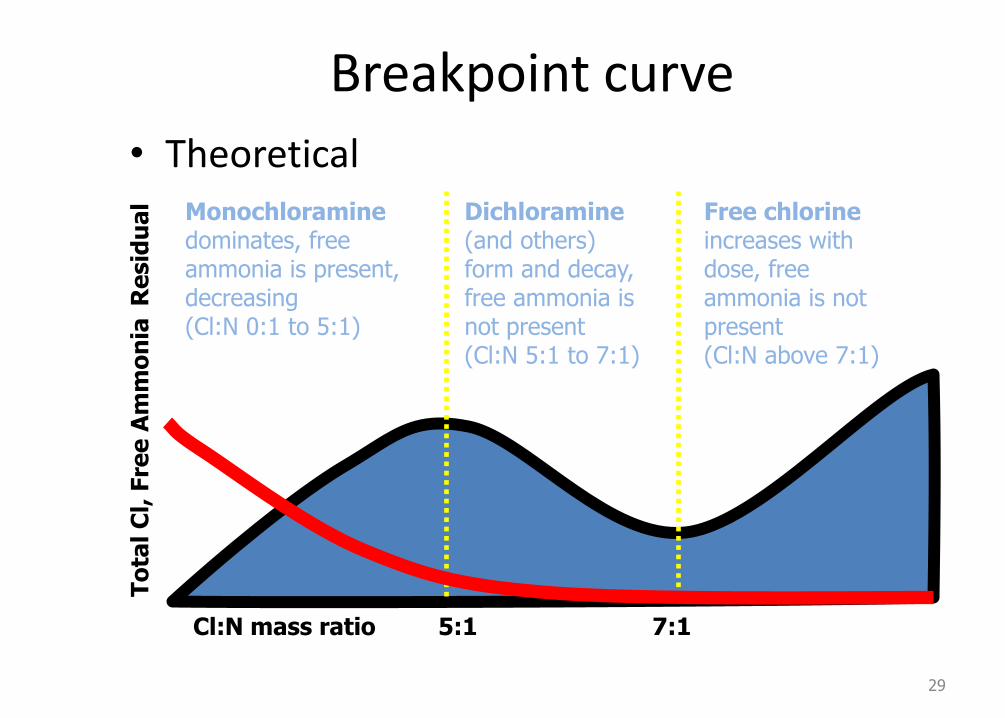
Breakpoint curve
• Theoretical
29
Cl:N mass ratio 5:1 7:1
To
tal C
l, F
ree
Am
mo
nia
R
esid
ua
l Monochloramine dominates, free ammonia is present, decreasing (Cl:N 0:1 to 5:1)
Dichloramine (and others) form and decay, free ammonia is not present (Cl:N 5:1 to 7:1)
Free chlorine increases with dose, free ammonia is not present (Cl:N above 7:1)
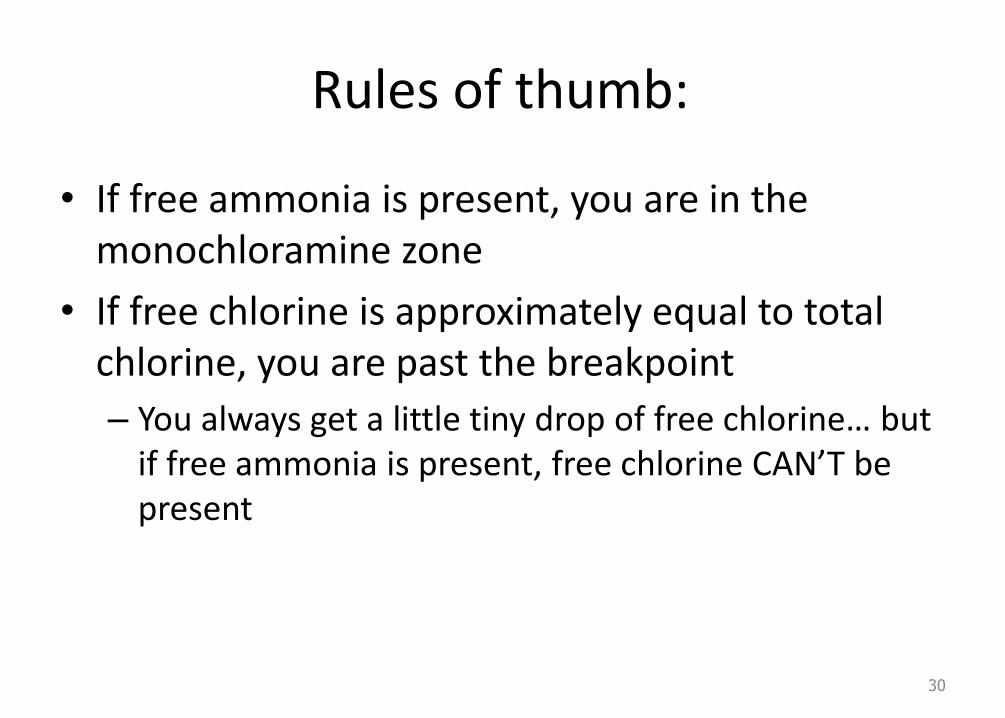
Rules of thumb:
• If free ammonia is present, you are in the monochloramine zone
• If free chlorine is approximately equal to total chlorine, you are past the breakpoint
– You always get a little tiny drop of free chlorine… but if free ammonia is present, free chlorine CAN’T be present
30
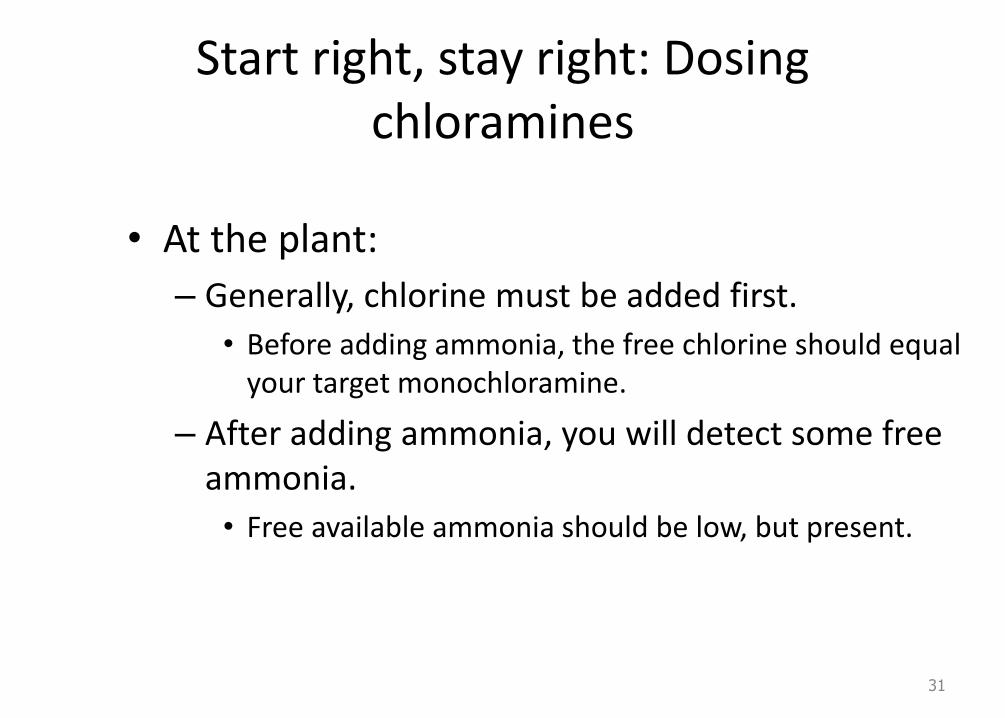
Start right, stay right: Dosing chloramines
• At the plant:
– Generally, chlorine must be added first.
• Before adding ammonia, the free chlorine should equal your target monochloramine.
– After adding ammonia, you will detect some free ammonia.
• Free available ammonia should be low, but present.
31
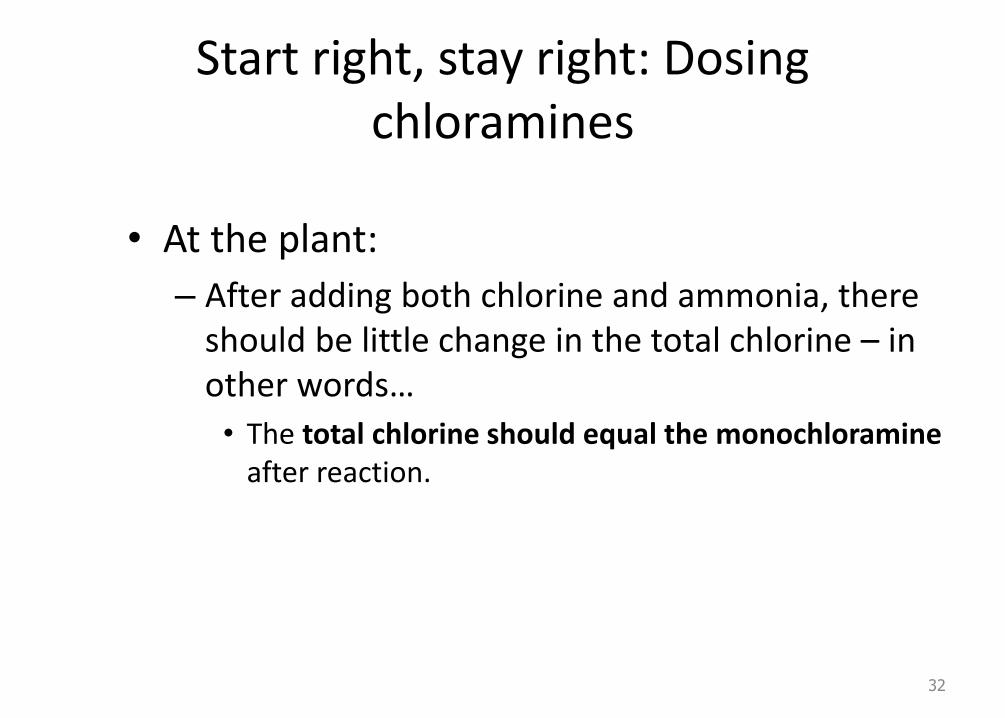
Start right, stay right: Dosing chloramines
• At the plant:
– After adding both chlorine and ammonia, there should be little change in the total chlorine – in other words…
• The total chlorine should equal the monochloramine after reaction.
32
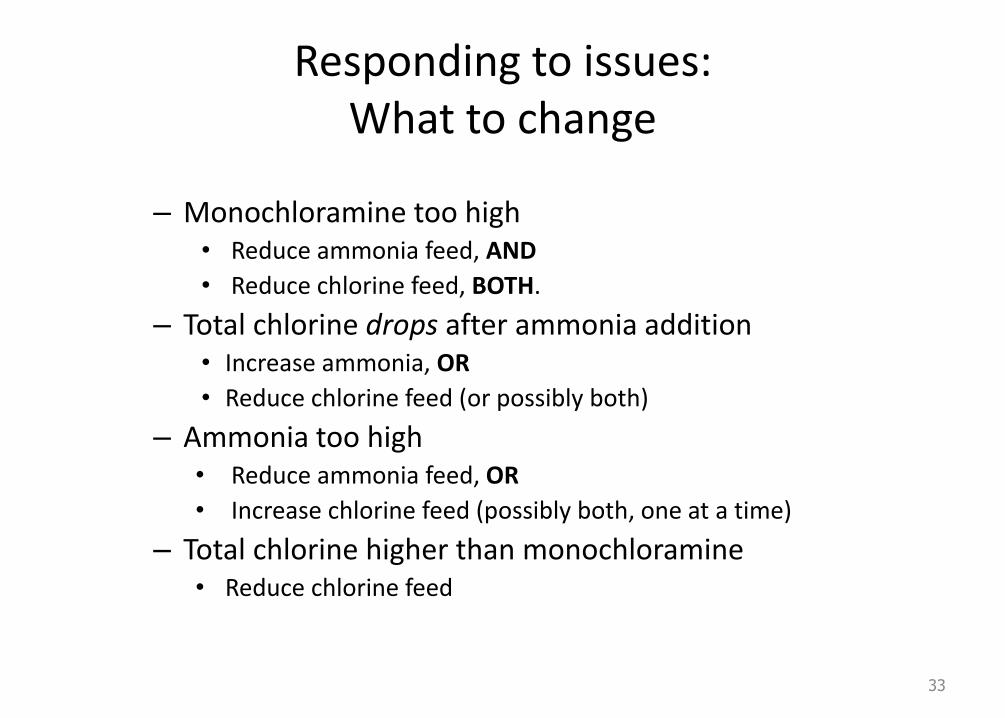
Responding to issues: What to change
– Monochloramine too high • Reduce ammonia feed, AND
• Reduce chlorine feed, BOTH.
– Total chlorine drops after ammonia addition • Increase ammonia, OR
• Reduce chlorine feed (or possibly both)
– Ammonia too high • Reduce ammonia feed, OR
• Increase chlorine feed (possibly both, one at a time)
– Total chlorine higher than monochloramine • Reduce chlorine feed
33
Boosting chloramines
• If you are purchasing and redistributing chloraminated water, you need to know what is in there.
– Especially if you add more disinfectant (“boosting”).
• And especially if you are blending chlorinated and chloraminated water,
• Which is generally a bad idea.
34
Boosting chloramines
• Measure the free ammonia, total chlorine, and monochloramine before boosting.
• Measure free chlorine, too, but don’t place too much importance on the result.
• Do some math:
– You are aiming for the ‘sweet spot.’
– Trying to stay out of the ‘dip.’
35
Special study: To learn more about your water
• You can do a breakpoint curve on your own water:
– Put some of your source water in jars
– Add a little ammonia (measured) – (not like in the plant where this is second)
– Add chlorine in increasing amounts – Calculate the Cl:N ratio to decide how much
– Draw a graph of Total Chlorine (Y axis) and Ammonia Added (X axis)
36
REGULATORY AND PROCESS MANAGEMENT MONITORING
37
Regulatory monitoring
The use of chloramines was approved through a case-by-case “exception” because the rules specified chlorination.
Now the monitoring requirements are in the rule—
– 30 TAC 290.110: Disinfectant Residuals
38
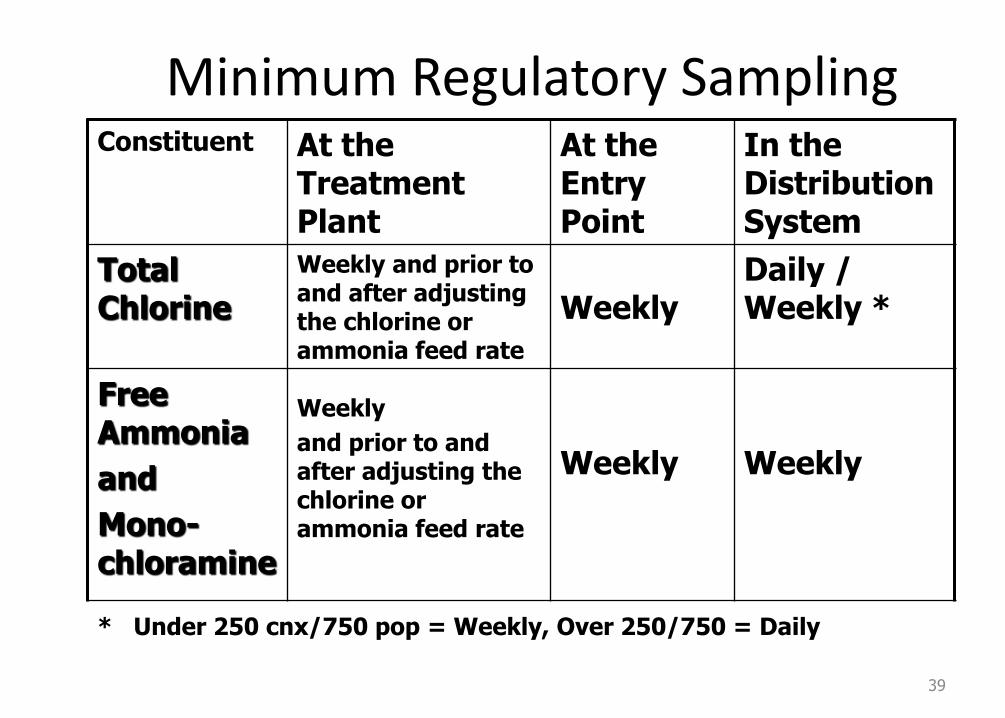
Minimum Regulatory Sampling Constituent At the At the In the
Treatment Entry Distribution Plant Point System
Total Chlorine
Weekly and prior to and after adjusting the chlorine or Weekly
Daily / Weekly *
ammonia feed rate
Free Ammonia
and
Mono-
Weekly
and prior to and after adjusting the chlorine or ammonia feed rate
Weekly
Weekly
chloramine
39
* Under 250 cnx/750 pop = Weekly, Over 250/750 = Daily
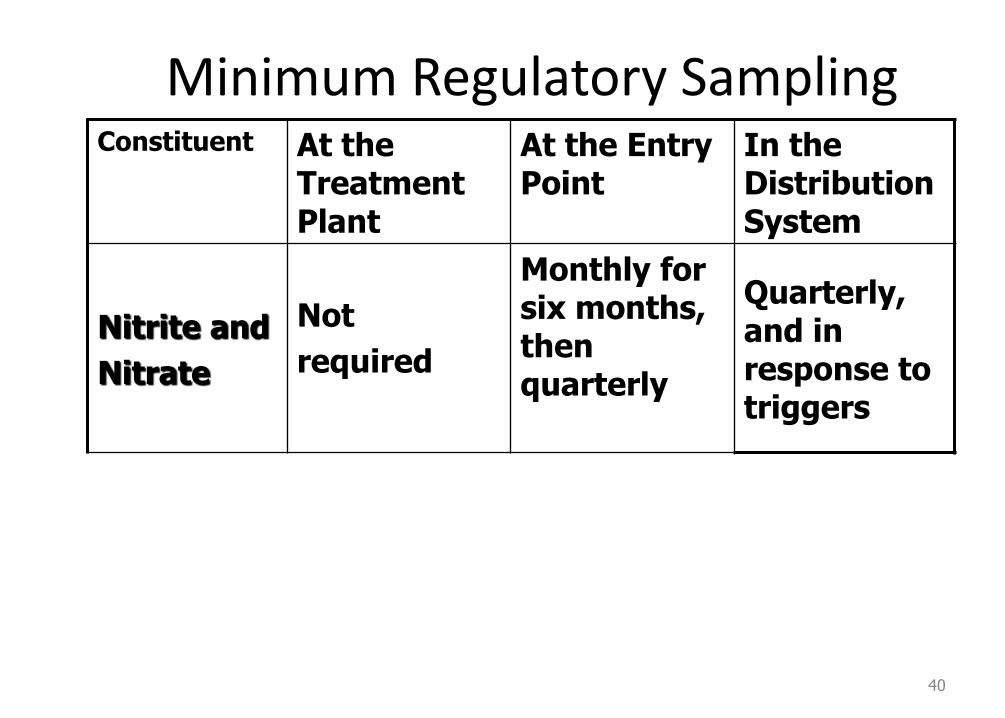
Minimum Regulatory Sampling Constituent At the At the Entry In the
Treatment Point Distribution Plant System
Nitrite and
Nitrate
Not
required
Monthly for six months, then quarterly
Quarterly, and in response to triggers
40
Process management monitoring
• Regulatory monitoring may not identify issues early enough to avoid problems.
• You are the expert on your system:
– You can identify additional sampling to avoid problems before they start.
– For example, a “Nitrification Action Plan”
– (A topic for another presentation).
41

TAKE-HOME MESSAGE
42
Take home message:
Chloramines are an important tool.
– It helps systems meet maximum contaminant levels for total trihalomethanes and haloacetic acids
– It helps maintain stable residuals.
Monitoring is key to successful chloramination
– Monitor Total Chlorine, Ammonia, and Monochloramine
43