Embed Size (px)
Citation preview
Chloride Threshold Values
State of the art
Title of report: Chloride Threshold Values – State of the art Reference: Danish Expert Centre for Infrastructure Constructions Version: 1.0 Date: December 13, 2012 Prepared by: Søren L. Poulsen Checked by: Henrik E. Sørensen
Report: Chloride Threshold Values – State of the art Date: December 13, 2012
1
Content 1 Introduction ............................................................................................................................................... 3
2 Chloride threshold value ........................................................................................................................... 4
2.1 Definition of chloride threshold value and general concepts ........................................................... 4
2.2 Influential parameters ....................................................................................................................... 6
2.2.1 pH of pore solution .................................................................................................................... 6
2.2.2 Carbonation ............................................................................................................................... 7
2.2.3 Water/binder ratio .................................................................................................................... 8
2.2.4 Type of binder ............................................................................................................................ 8
2.2.5 Oxygen availability and moisture content ............................................................................... 10
2.2.6 Temperature ............................................................................................................................ 11
2.2.7 Electrochemical potential of the embedded steel .................................................................. 11
2.2.8 Surface condition of the steel.................................................................................................. 12
2.2.9 Condition of the steel-concrete interface ............................................................................... 12
2.2.10 Method of chloride introduction ............................................................................................. 13
2.2.11 Cracks ....................................................................................................................................... 13
3 Test methods ........................................................................................................................................... 14
3.1 Methods for detecting or quantifying chloride in concrete ............................................................ 14
3.1.1 Colourimetric spray indicator (silver nitrate) .......................................................................... 15
3.1.2 Volhard titration [NT Build 208, 1984] .................................................................................... 15
3.1.3 Potentiometric titration .......................................................................................................... 15
3.1.4 Ion selective electrode ............................................................................................................ 15
3.1.5 X-Ray Fluorescence spectrometry ........................................................................................... 16
3.1.6 Quantab chloride titrators ....................................................................................................... 16
3.1.7 Scanning electron microscopy ................................................................................................. 16
3.1.8 Expression of pore solution ..................................................................................................... 16
3.1.9 Leaching techniques ................................................................................................................ 17
3.2 Methods for determination of corrosion initiation ......................................................................... 18
3.2.1 Potential shift (open circuit measurements) ........................................................................... 18
3.2.2 Linear polarization resistance (LPR) ........................................................................................ 18
3.2.3 Macrocell current .................................................................................................................... 19
3.2.4 Electrochemical impedance spectroscopy (EIS) ...................................................................... 19
3.2.5 Galvanostatic pulse method .................................................................................................... 20
3.2.6 Visual examination .................................................................................................................. 20

Report: Chloride Threshold Values – State of the art Date: December 13, 2012
2
4 Chloride threshold values from the literature......................................................................................... 20
5 RILEM project .......................................................................................................................................... 22
6 Summary .................................................................................................................................................. 23
7 References ............................................................................................................................................... 24
Appendix 1: Chloride threshold values from the literature………………………………………………………………………….30
Report: Chloride Threshold Values – State of the art Date: December 13, 2012
3
1 Introduction
It is widely recognized that the ingress of chlorides into concrete can initiate reinforcement
corrosion and ultimately result in deterioration of the concrete structure under chloride at-
tack. The importance of chloride induced corrosion is reflected by the extensive number of
scientific publications that has previously been dedicated to this phenomenon.
A crucial input parameter for the modelling of the service lifetime of reinforced concrete
structures is the so-called chloride threshold value, which may be defined as the minimum
concentration of chloride at the depth of the reinforcement that is able to initiate corrosion
of the steel. Without an experimentally determined chloride threshold value engineers are
generally forced to make rather conservative guesses about this value, thus potentially un-
derestimating the service lifetime dramatically.
Reported chloride threshold values in the literature display a wide scatter, which is due to
the fact that: (1) numerous different experimental approaches have been employed to ob-
tain the chloride threshold value, and (2) the chloride threshold value is influenced by nu-
merous different parameters . In order to make reasonable and scientifically sound compari-
son of experimentally determined chloride threshold values, a generally accepted test
method for determination of this parameter is greatly needed. Presently, such a method is
still lacking.
The present state of the art report is based on a literature study on the topic of ‘chloride
threshold values’, which has been carried out as part of a current project concerned with the
development of a useful and fast in-lab reference method for determination of chloride
threshold values. The project is associated with the Danish Expert Centre for Infrastructure
Constructions, Danish Technological Institute and the literature study was done in order not
to repeat research work and experiments that have already been performed by other re-
searchers. The study was also undertaken in order to obtain an overview of the challeng-
es/pitfalls within this research area, as well as to identify were future research might be
needed.
This report presents the most important parameters affecting the chloride threshold and
gives a review of available experimental methods for quantification/detection of chloride in
concrete and techniques for detection of reinforcement corrosion. A section is also devoted
to the presentation of chloride threshold values from the literature and finally the report
addresses the work of a RILEM committee (TC 235 CTC), which is concerned with the devel-
opment of a generally accepted test method for determination of chloride threshold values
in concrete.
It is noted, that the main reason for preparing this report, was an internal need within the
Expert Centre to obtain a general overview of the most important findings from essential re-
Report: Chloride Threshold Values – State of the art Date: December 13, 2012
4
search carried out in relation to the topic of ‘chloride threshold values’. The reader is re-
ferred to the report by Angst & Vennesland [2007] for a more detailed and comprehensive
review of the topic.
2 Chloride threshold value
2.1 Definition of chloride threshold value and general concepts
Chloride induced corrosion is a concern in relation to reinforced concrete structures exposed
to seawater or if the structure is exposed to de-icing salts (e.g. bridges during the winter). By
the action of wind and rain, the salt is moved to other parts of the structure where scaling
may occur through evaporation processes. This is mainly true for concrete of poor quality
with high water/cement ratios, and is generally not a concern for good quality concrete pre-
scribed for an aggressive environment.
Once the chloride ions have reached the surface of the concrete they can subsequently pen-
etrate the concrete cover and reach the reinforcement where they act as catalysts for the
corrosion process at the steel surface. Reinforcing steel is normally passivated (i.e. the cor-
rosion rate is insignificant) in concrete due to the alkaline nature of the pore solution, which
promotes the formation of a barrier “film” consisting of iron oxides on the surface of the
steel. However, the steel can become depassivated provided that a certain threshold con-
centration of chloride ions is reached at the steel surface. The chloride threshold value may
thus be defined as the minimum concentration of chloride at the depth of the reinforce-
ment, which results in active (pitting) corrosion of the steel. It has also been suggested that
the chloride threshold value may be defined as the chloride concentration at the steel sur-
face at the time when deterioration or damage of the concrete commences [Schiessl et al.,
1982]. However, the first definition is applied exclusively in this report. Sometimes chloride
threshold value is also referred to as chloride threshold level, critical chloride content or chlo-
ride threshold concentration.
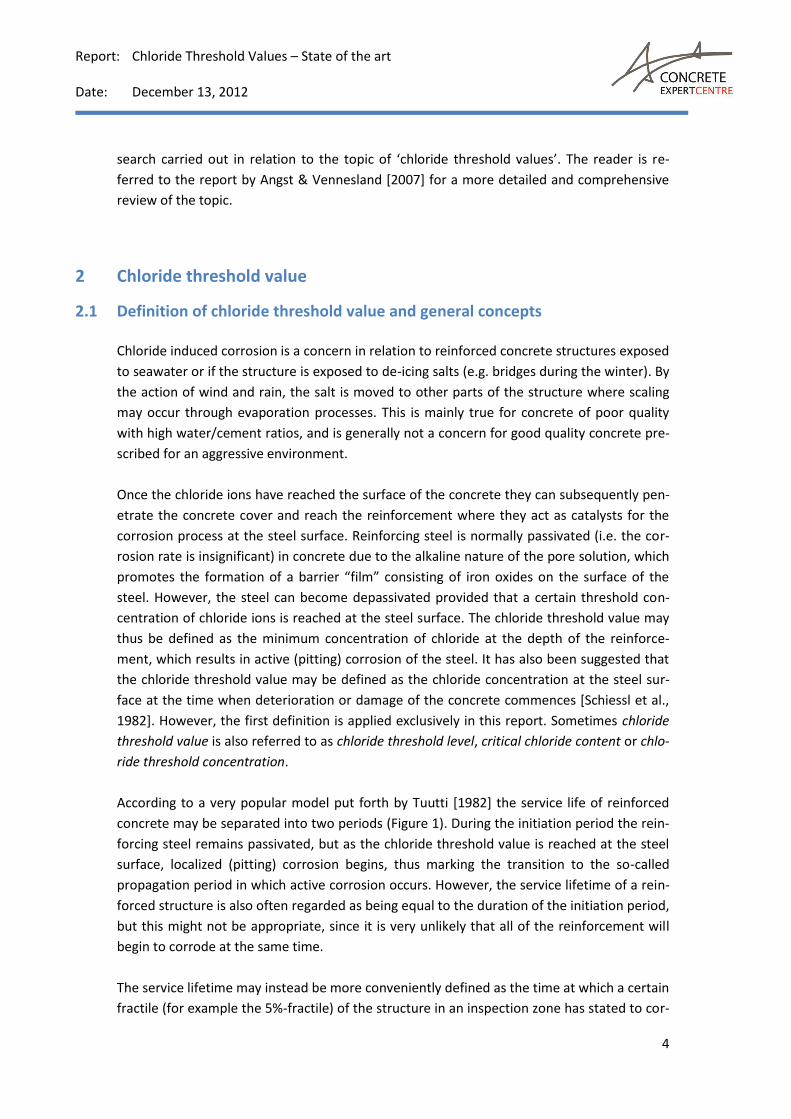
According to a very popular model put forth by Tuutti [1982] the service life of reinforced
concrete may be separated into two periods (Figure 1). During the initiation period the rein-
forcing steel remains passivated, but as the chloride threshold value is reached at the steel
surface, localized (pitting) corrosion begins, thus marking the transition to the so-called
propagation period in which active corrosion occurs. However, the service lifetime of a rein-
forced structure is also often regarded as being equal to the duration of the initiation period,
but this might not be appropriate, since it is very unlikely that all of the reinforcement will
begin to corrode at the same time.
The service lifetime may instead be more conveniently defined as the time at which a certain
fractile (for example the 5%-fractile) of the structure in an inspection zone has stated to cor-
Report: Chloride Threshold Values – State of the art Date: December 13, 2012
5
rode [Nilsson et al., 1996]. On the other hand, rather localized corrosion can also become
hazardous if the reinforcement of a particularly critical cross-section of the concrete struc-
ture is severely corroded.
When trying to estimate the service lifetime of a reinforced concrete structure two main pa-
rameters must generally be considered: (1) Chloride transport processes through the con-
crete and (2) the conditions required for corrosion initiation (chloride threshold value). Tra-
ditionally, the first of these two parameters has received the largest share of attention in the
literature, but without an appropriately chosen chloride threshold value the estimated dura-
tion of the service lifetime becomes rather meaningless. It is therefore very important to be
able to experimentally determine the chloride threshold value in a reliable manner. Unfor-
tunately, a generally accepted method for determination of the chloride threshold value in
reinforced concrete is still lacking.
Fig. 1 Schematic sketch of Tuutti’s model for the service lifetime of reinforced concrete. Modified af-ter Fig. 1 in Tuutti [1982].
Report: Chloride Threshold Values – State of the art Date: December 13, 2012
6
2.2 Influential parameters
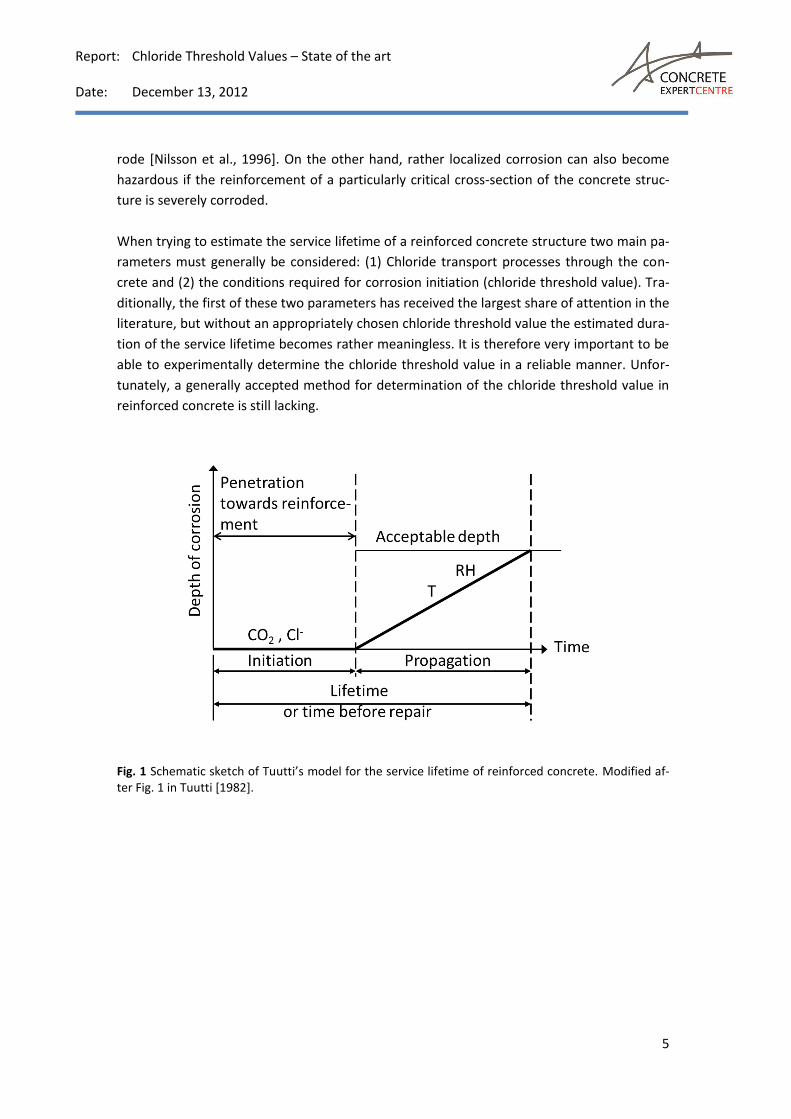
The passivity of reinforcing steel in concrete is influenced by a wide range of factors, as illus-
trated in Figure 2. Similarly, the chloride threshold value for corrosion initiation on reinforc-
ing steel in concrete is influenced by several different parameters, the most important of
which are presented in the following.
Fig. 2 Diagram showing the wide range of factors, which influence the passivity of reinforcing steel in
concrete. The figure is a modified version of Fig. 1 in [Arup, 1993].
2.2.1 pH of pore solution
Typically, the pore solution of concrete has a pH-value above 12.6 due to the presence of
portlandite (Ca(OH)2), and even higher values can be observed for concrete rich in NaOH and
KOH. The highly alkaline environment of the pore solution favors the formation of a passive
oxide film on the surface of the steel reinforcement and a high pH-value is therefore an im-
portant inhibiting factor with regard to corrosion initiation Angst and Vennesland, 2007. It
should be noted that the pH of the pore solution may change with time as a consequence of
phenomena such as carbonation (see section 2.2.2) or continued hydration reactions of the
binder components.
In addition to the inhibiting effect on corrosion initiation, the pH may also affect the binding
of chlorides. Studies have shown that a reduction of the pH to a value below 12.5 results in
the release of a considerable part of the bound chlorides, while yet another part is released

Report: Chloride Threshold Values – State of the art Date: December 13, 2012
7
if the pH value is reduced to a value around 12 Glass et al., 2000; Reddy et al., 2002. The
release of bound chlorides has been ascribed to the dissolution of Friedel’s salt and C-S-H
phases as a result of reduced alkalinity.
Based on experiments with steel bars in synthetic concrete pore solutions, Hausmann 1967
and Gouda 1970 have proposed that the chloride threshold value is most accurately ex-
pressed using the Cl-/OH- ratio. These early works suggested a chloride threshold value of
about 0.6, a result that was later supported by Tuutti 1982, and it seems well-established
that the pH of the pore solution has a major influence on the amount of chloride that leads
to initiation of pitting corrosion.
2.2.2 Carbonation
A significant drop in pH of the pore solution accompanies the carbonation of concrete, and
the chloride threshold value is virtually reduced to zero if the carbonation process reaches
the depth of reinforcement Nilsson et al., 1996. This is due to the fact that steel is not pas-
sive in the pH environment associated with carbonated concrete, and pitting corrosion is
thus easily initiated when chloride is present. The corrosion process is further promoted by
carbonation since the chloride binding capacity of the binder is reduced by the carbonation,
which subsequently leads to an increase in the concentration of free chlorides in the pore
solution. It should be noted, that the corrosion of steel reinforcement can also occur in car-
bonated concrete even if chloride ions are not present in the pore solution, because the pro-
tective oxide film on the steel surface is generally depassivated at the pH value associated
with carbonated concrete.
2.2.3 Water/binder ratio
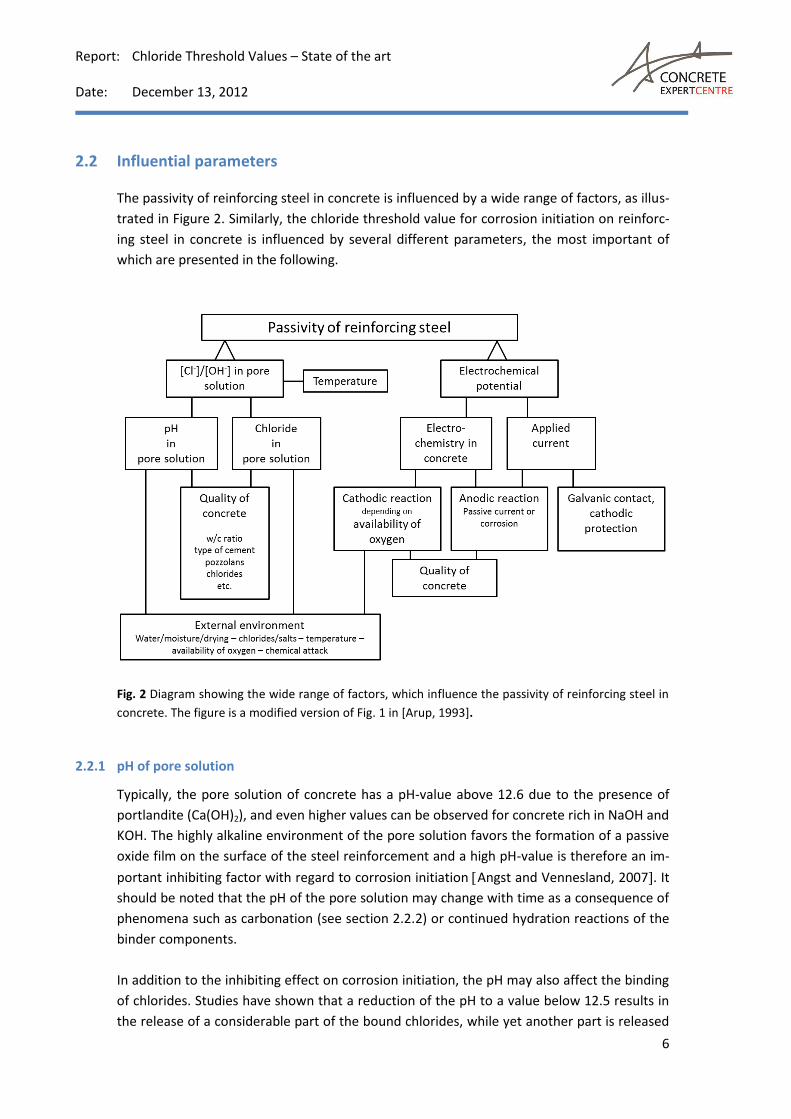
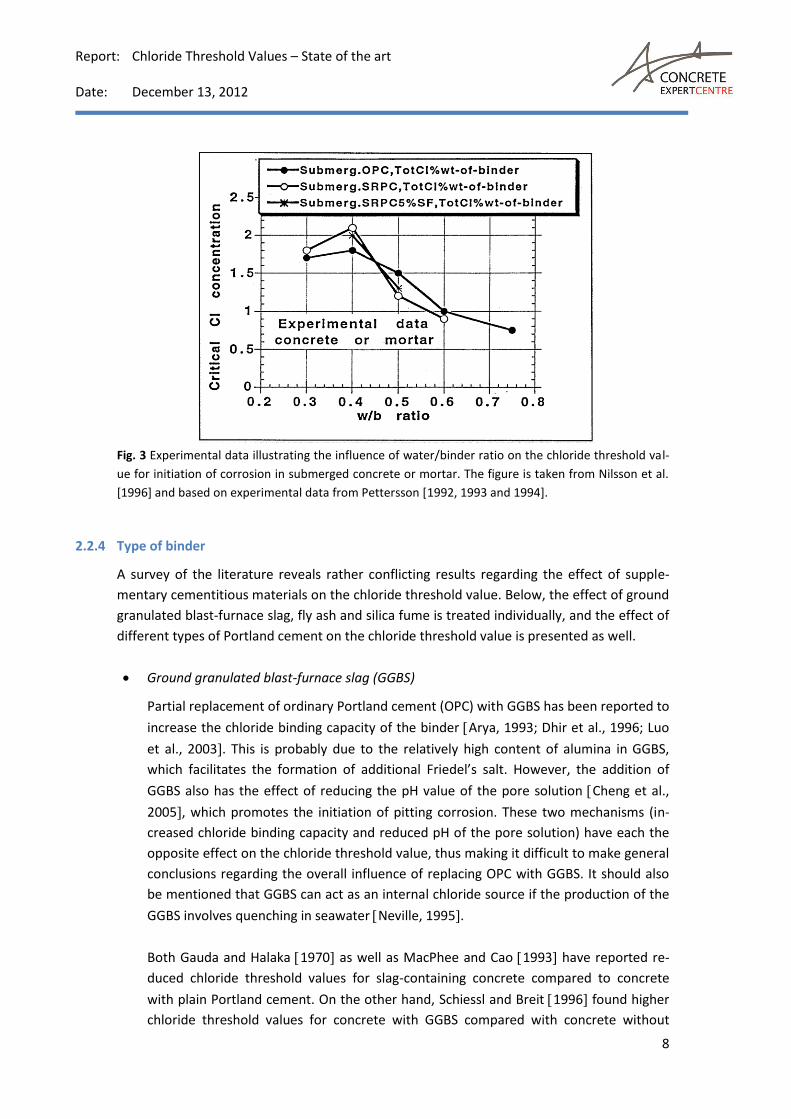
Experimental data have indicated that concretes with lower water/binder ratios exhibit
higher chloride threshold values as compared to concretes having higher water/binder ratios
Pettersson, 1992, 1994; Schiessel and Breit, 1995 (Figure 3). This is most likely due to the
following consequences of a low water/binder ratio Nilsson et al., 1996:
Reduced area available for development of pitting corrosion caused by a denser
steel-concrete interface.
Higher resistivity of the concrete.
Lower chloride mobility resulting in a reduction of the catalytic effect of the chloride
ions.
Improved ability to maintaining a high alkalinity of the pore solution due to a re-
duced leaching rate for alkalis and a buffer of unreacted cement particles.
Report: Chloride Threshold Values – State of the art Date: December 13, 2012
8
Fig. 3 Experimental data illustrating the influence of water/binder ratio on the chloride threshold val-
ue for initiation of corrosion in submerged concrete or mortar. The figure is taken from Nilsson et al.
[1996] and based on experimental data from Pettersson [1992, 1993 and 1994].
2.2.4 Type of binder
A survey of the literature reveals rather conflicting results regarding the effect of supple-
mentary cementitious materials on the chloride threshold value. Below, the effect of ground
granulated blast-furnace slag, fly ash and silica fume is treated individually, and the effect of
different types of Portland cement on the chloride threshold value is presented as well.
Ground granulated blast-furnace slag (GGBS)
Partial replacement of ordinary Portland cement (OPC) with GGBS has been reported to
increase the chloride binding capacity of the binder Arya, 1993; Dhir et al., 1996; Luo
et al., 2003. This is probably due to the relatively high content of alumina in GGBS,
which facilitates the formation of additional Friedel’s salt. However, the addition of
GGBS also has the effect of reducing the pH value of the pore solution Cheng et al.,
2005, which promotes the initiation of pitting corrosion. These two mechanisms (in-
creased chloride binding capacity and reduced pH of the pore solution) have each the
opposite effect on the chloride threshold value, thus making it difficult to make general
conclusions regarding the overall influence of replacing OPC with GGBS. It should also
be mentioned that GGBS can act as an internal chloride source if the production of the
GGBS involves quenching in seawater Neville, 1995.
Both Gauda and Halaka 1970 as well as MacPhee and Cao 1993 have reported re-
duced chloride threshold values for slag-containing concrete compared to concrete
with plain Portland cement. On the other hand, Schiessl and Breit 1996 found higher
chloride threshold values for concrete with GGBS compared with concrete without
Report: Chloride Threshold Values – State of the art Date: December 13, 2012
9
GGBS. Some studies have also concluded that that the addition of GGBS has no effect
on the threshold value Bamforth and Chapman-Andrews, 1994; Thomas et al., 1990.
Fly ash
The addition of fly ash to the binder of concrete has two main influences on the chlo-
ride threshold value: (1) The high content of alumina in fly ash increases the chloride
binding capacity of the binder Arya, 1990; Dhir and Jones, 1999, and (2) the pH value
of the pore solution is lowered Byfors, 1987; Diamond, 1981. As with the addition of
GGBS, it is difficult to make generalized conclusions about the effect of fly ash on the
chloride threshold value, since the two abovementioned effects inhibit and promote
the initiation of pitting corrosion, respectively. In a study on reinforced concrete sam-
ples that had been exposed to marine environment for up to four years Thomas 1995
found that the chloride threshold value became progressively lower as the amount of
fly ash in the concrete mix increased. Alternatively, Bamforth and Chapman-Andrews
1994 and Thomas et al. 1990 have reported that the addition of fly ash to concrete
has no effect on the chloride threshold value. It is also worth noting that a partial re-
placement of Portland cement by fly ash (or GGBS) results in a refinement of the pore
structure of the cement paste, which leads to a higher resistance of the concrete
against the ingress of chloride ions Angst and Vennesland, 2007. This has no direct in-
fluence on the chloride threshold value, but the increased electrochemical resistance
will decrease both chloride mobility and macrocell current and thereby probably result
in a higher chloride threshold value.
Silica fume
Lower chloride binding capacity have been reported for silica fume-containing cement
as compared to pure Portland cement Page and Vennesland, 1993; Arya et al., 1990.
This may partly be a consequence of the reduced amount of aluminate phases present
in a binder where the Portland cement has been partially replaced by silica fume (al-
most pure SiO2). Silica fume is a very fine-grained material and its presence as part of
the binder in a concrete will lead to a more refined pore structure, which may enhance
the physical adsorption of chloride to the surface of the C-S-H gel Angst and
Vennesland, 2007. However, Larsen 1998 has reported that the C-S-H formed by the
pozzolanic reaction of silica fume with portlandite (Ca(OH)2) may have lower chloride
binding properties than C-S-H formed by hydration of pure Portland cement.
The pH value of the pore solution is affected by the addition of silica fume, as the con-
sumption of Ca(OH)2 results in a decrease of the alkalinity Byfors, 1987. This ultimate-
ly lowers the chloride binding capacity, since the solubility of Friedel’s salt increases
with decreasing pH of the pore solution Page and Vennesland, 1993. The negative ef-
fect of silica fume on the chloride threshold value has been demonstrated experimen-

Report: Chloride Threshold Values – State of the art Date: December 13, 2012
10
tally in a number of studies Hansson and Sørensen, 1990; Pettersson, 1993; Manera,
2007.
Effect of Portland cement type
The choice of cement type indirectly affects the chloride threshold value since the chlo-
ride binding capacity of concrete is dependent on the type of cement used in the mix. It
seems well established that the chloride binding capacity of Portland cement is highly
dependent on the content of C3A Schiessl and Raupach, 1990. For example, the lower
binding capacity of sulphate resisting Portland cements (low in C3A) have been indicat-
ed by shorter corrosion initiation time and increased active corrosion rate for these
cements as compared to Portland cement high in C3A Rasheeduzzafar et al., 1992, but
Byfors 1990 found the opposite effect for a sulphate resisting Portland cement rich in
ferrite (C4AF). Furthermore, based on thermodynamic considerations as well as experi-
mental evidence, Nielsen 2004 concluded that amount of alumina in a Portland ce-
ment has a relatively minor effect on the chloride binding capacity. Instead, the chlo-
ride binding was found to be much more dependent on the content of alkalis, with
higher contents of alkalis resulting in lower amounts of bound chlorides.
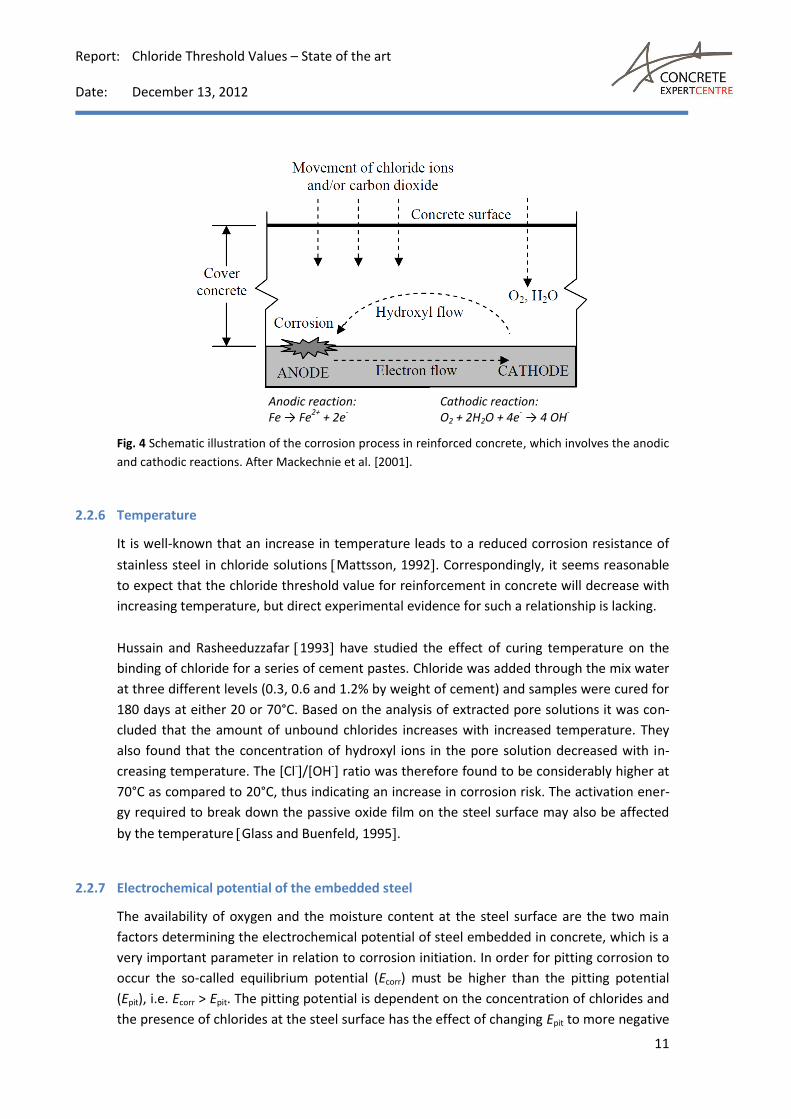
2.2.5 Oxygen availability and moisture content
Availability of both oxygen and water is required for active pitting corrosion to occur (Figure
4). The corrosion process involves the cathodic reduction of oxygen, and the amount of
available water is an important parameter for the distribution between free and bound chlo-
rides. The content of water also determines the chloride concentration and if the concrete is
rather dry the electrolytic corrosion process becomes restricted Angst and Vennesland,
2007.
The transport of oxygen through concrete is dependent on the relative humidity Tuutti,
1982 and a dramatic reduction in oxygen transport rate can be observed if the pores be-
come saturated. This due to the fact that oxygen diffusion through gas (air) is orders of mag-
nitude higher than diffusion through liquid (water-filled pores). Furthermore, the steel po-
tential in concrete, an important factor when considering the initiation of corrosion, is close-
ly linked to the availability of free oxygen: The steel potential is reduced when the availabil-
ity of oxygen is limited, which implies that the chloride threshold value is higher for rein-
forcement in submerged concrete structures as compared to reinforcement in concrete sub-
jected to repeating cycles of drying and wetting. This has been confirmed by experimental
result reported by Pettersson 1990.
Report: Chloride Threshold Values – State of the art Date: December 13, 2012
11
Fig. 4 Schematic illustration of the corrosion process in reinforced concrete, which involves the anodic
and cathodic reactions. After Mackechnie et al. [2001].
2.2.6 Temperature
It is well-known that an increase in temperature leads to a reduced corrosion resistance of
stainless steel in chloride solutions Mattsson, 1992. Correspondingly, it seems reasonable
to expect that the chloride threshold value for reinforcement in concrete will decrease with
increasing temperature, but direct experimental evidence for such a relationship is lacking.
Hussain and Rasheeduzzafar 1993 have studied the effect of curing temperature on the
binding of chloride for a series of cement pastes. Chloride was added through the mix water
at three different levels (0.3, 0.6 and 1.2% by weight of cement) and samples were cured for
180 days at either 20 or 70°C. Based on the analysis of extracted pore solutions it was con-
cluded that the amount of unbound chlorides increases with increased temperature. They
also found that the concentration of hydroxyl ions in the pore solution decreased with in-
creasing temperature. The [Cl-]/[OH-] ratio was therefore found to be considerably higher at
70°C as compared to 20°C, thus indicating an increase in corrosion risk. The activation ener-
gy required to break down the passive oxide film on the steel surface may also be affected
by the temperature Glass and Buenfeld, 1995.
2.2.7 Electrochemical potential of the embedded steel
The availability of oxygen and the moisture content at the steel surface are the two main
factors determining the electrochemical potential of steel embedded in concrete, which is a
very important parameter in relation to corrosion initiation. In order for pitting corrosion to
occur the so-called equilibrium potential (Ecorr) must be higher than the pitting potential
(Epit), i.e. Ecorr > Epit. The pitting potential is dependent on the concentration of chlorides and
the presence of chlorides at the steel surface has the effect of changing Epit to more negative
Anodic reaction: Fe → Fe
2+ + 2e
-
Cathodic reaction: O2 + 2H2O + 4e
- → 4 OH
-
Report: Chloride Threshold Values – State of the art Date: December 13, 2012
12
values. Consequently, higher contents of chlorides can be tolerated if the steel has a more
negative potential.
For reinforcement in structures exposed to an atmospheric environment electrochemical
potentials are typically found in the range between +100 mV and -200 mV vs. SCE Bertolini,
2004, whereas the potential for reinforcement in submerged concrete structure usually
have values around -400 to -500 mV vs. SCE. Higher chloride threshold values are thus ex-
pected for submerged concrete structures as compared to the ones under atmospheric ex-
posure.
2.2.8 Surface condition of the steel
Several studies have demonstrated that the surface condition of the reinforcement has a
significant influence on the chloride threshold value. In laboratory based investigations the
steel may be subjected to a variety of different treatments before the testing is done. For
example, the steel bars can be sandblasted, polished, chemically cleaned or pre-rusted, or
the steel may be used “as-received”. Moreover, the surface of the steel bar can be either
ribbed or smooth.
Mohammed and Hamada 2006 investigated the corrosion resistance of steel bars with var-
ious surface conditions (mill-scaled, polished, black- and brown-rusted, and bars that were
covered with cement paste before casting (i.e. pre-passivated)). They reported that the chlo-
ride threshold value was highest for pre-passivated steel followed by gradually decreasing
threshold values in the following order: black-rusted > polished > brown-rusted > mill-
scaled. In a study on the corrosion behavior of different types of stainless steel Kouřil et al.
2010 found that the presence of scales on the steel surface leads to a significant decrease
in corrosion resistance. Mammoliti et al. 1996 obtained higher chloride threshold values
for polished steel surfaces as compared to ground or “as-received” samples, while Manera
et al. 2007 found higher chloride threshold values for sandblasted steel bars as compared
to steel bars with “as-received” surface conditions. Unfortunately, details regarding the con-
ditions of the steel surface are often not reported in the literature, in spite of its strong in-
fluence on the chloride threshold value.
2.2.9 Condition of the steel-concrete interface
A dense layer of hydration products (containing a high proportion of Ca(OH)2) is usually
found at the interface between the reinforcing steel and the concrete Page, 1975. This lay-
er can be of great importance for the chloride threshold value, since it has the ability to
buffer the pH of the pore solution. At the same time, the dense layer of solid material may
act as a physical barrier, which inhibits the charge transfer in certain areas, thus affecting the
potential of the steel by limiting the area available for oxygen reduction Page, 1975; Glass
and Buenfeld, 1995.
Report: Chloride Threshold Values – State of the art Date: December 13, 2012
13
Due to incomplete compaction or low workability of the concrete, macroscopic voids may be
present at the steel-concrete interface, and Mohammed and Hamada 2001 have found
that the direction of casting with respect to the orientation of the reinforcement affects the
formation of voids. If the reinforcement is ribbed, it may also favor the formation of voids.
The abovementioned dense layer may be weakened or absent in such voids, and Yonesawa
et al. 1988 have reported that the chloride threshold value is significantly lower if the de-
velopment of the dense layer at the steel-concrete interface is restricted. It has also been
reported that the corrosion preferably occurs at the corners or indents of the profiling
Hansson and Sørensen, 1990. In a recent study, Ann and Song 2007 found that the physi-
cal condition of the steel-concrete interface is more important for the chloride threshold
value than the binding of chlorides or the buffering capacity of the cement paste matrix, es-
pecially the content of entrapped air voids was emphasized as being influential. Considering
the importance of the conditions at steel-concrete interface for the chloride threshold value,
it is unfortunate that these conditions are so difficult to quantify; it is very challenging to
measure the volume of air-filled voids and other defects at the interface Angst and
Vennesland, 2007.
2.2.10 Method of chloride introduction
Reinforced concrete with cast-in chloride may be expected to have a different chloride
threshold value in comparison with concrete exposed to chlorides from an external source
[Nilsson et al., 1996]. This is due to a greater proportion of the chlorides being chemically
bound to the hydration products, thus leading to a reduced concentration of free chlorides
in the pore solution [Cavalier and Vassie, 1981].
2.2.11 Cracks
The presence of macrocracks (0.1 – 0.8 mm wide at the surface) in concrete can affect the
chloride threshold value significantly [Pettersson et al., 1996], enhancing the transport rate
of chloride. The effect of such macrocracks on the chloride threshold value is dependent on
the size of the cracks, the exposure conditions and the cover thickness. Pettersson [1996]
reported that the chloride threshold value was only marginally reduced for a submerged
high performance concrete (30 mm cover thickness, water/binder ratio = 0.3, and 0.4 crack
width) as compared with submerged, but uncracked, concrete. However, the chloride
threshold value was reduced to almost zero when the same concrete (with cracks) was ex-
posed to air.
Report: Chloride Threshold Values – State of the art Date: December 13, 2012
14
3 Test methods
Generally, an experimental determination of the chloride threshold value for reinforced
concrete must include the following four steps:
A reinforcement bar (steel electrode) is embedded in a cement-based material, such as
mortar or concrete, or immersed in a solution that simulates the concrete (synthetic
pore solution/alkaline solution).
Chlorides are introduced to the system. The chlorides can be added to the mix initially
or introduced later by some kind of chloride exposure.
Detection of corrosion initiation, for instance by measurement of potential shift or by
visual inspection.
Quantification of the chloride concentration at the time of corrosion onset. The con-
centration is determined as either total or free amount of chlorides, or as the Cl-/OH-
ratio.
As pointed out by Angst and Vennesland 2009, these four experimental steps offer a wide
range of alternative routes, which can be chosen in order to reach a determination of the
chloride threshold value. For example, when deciding which type of steel electrode to use
for the experimental setup a variety of options exists: The steel bars can be smooth or
ripped and they can be prepared in different ways (as-received, pre-rusted, polished, sand-
blasted, etc.). Furthermore, a variety of steel types exist, such as normal carbon steel, galva-
nized steel and stainless steel.
The introduction of chlorides to the steel electrode also offers a number of alternative ap-
proaches. The type of chloride source must be select (typically NaCl or CaCl2), and the chlo-
rides can be introduced to hardened samples (cement paste, mortar or concrete) by either
capillary suction and/or diffusion, or by some type of accelerated migration method. Alter-
natively, the chloride can be added initially during mixing of the paste/mortar/concrete. As
for the detection of corrosion onset, numerous approaches exist (see Section 3.2). Lastly, the
chloride content at the steel electrode can be determined (and expressed) in a variety of
ways (see Section 3.1).
3.1 Methods for detecting or quantifying chloride in concrete
This section presents a selection of techniques that are commonly used for detecting or
quantifying the content chloride in cement-based materials. A quantification of the chloride
content at the depth of the reinforcement bar is the final step in an experimental determi-
nation of the chloride threshold value for the sample under investigation, and the chloride
threshold value is usually expressed as either:
Total chloride (by weight of cement/binder or by concrete).
Report: Chloride Threshold Values – State of the art Date: December 13, 2012
15
Free chloride (by weight of cement/binder or by concrete).
Free chloride ion concentration (expressed as either mole/l or by the [Cl-]/[OH-] ra-
tio).
3.1.1 Colourimetric spray indicator (silver nitrate)
The presence of chloride in hardened concrete can be detected qualitatively by spraying a
freshly broken concrete surface with a suitable indicator (typically 0.1N AgNO3). This simple
test method exists in different varieties, but generally the presence of chloride will be re-
vealed by a change in colour [Bamforth et al., 1997]. The spray indicator test offers a rapid
and practical method for visual examination of chloride penetration in hardened cement-
based materials. However, this technique cannot be used to accurately quantify the content
of chloride, but is merely applicable for obtaining a rough estimate of the chloride penetra-
tion depth.
3.1.2 Volhard titration [NT Build 208, 1984]
The NT Build 208 method [1984] can be used for determination of the total content of chlo-
ride in hardened concrete by dissolving a powdered concrete sample in a solution of nitric
acid. Subsequently, the chloride content is determined by Volhard titration. The precision of
the method is good provided that the sample contains about 2 g of cement and that the
measurement is carried out by an experienced laboratory.
The total content of chloride in concrete is often assumed to be equal to the content of acid
soluble chloride. However, Dhir et al. [1990] have demonstrated that it may represent only
90% of the total content of chloride due to incomplete dissolution.
3.1.3 Potentiometric titration
The total chloride content of hardened concrete can also be measured by potentiometric ti-
tration with silver nitrate by using a silver electrode, since the potential of an immersed sil-
ver electrode is a function of the concentration of silver ions in the solution. Initially, the
powdered concrete sample is immersed in nitric acid in order to extract the chloride ions.
This method offers a very good precision (if the operator is skilled and calibration is per-
formed carefully).
3.1.4 Ion selective electrode
A chloride selective electrode embedded in concrete can be used to determine the content
of free chloride in the pore solution. In essence, the activity of the chloride ions in solution is
measured using e.g. a silver/silver chloride electrode. Investigations by Atkins et al. [1996]
have demonstrated a good correlation between chloride concentrations obtained from ex-
Report: Chloride Threshold Values – State of the art Date: December 13, 2012
16
tracted pore solutions with measured values from silver/silver chloride electrodes. However,
the durability of the silver/silver chloride electrode has often been poor [magler reference].
3.1.5 X-Ray Fluorescence spectrometry
The total content of chloride in a concrete sample can be determined using X-Ray Fluores-
cence (XRF) spectrometry [Dhir et al., 1990]. Measurements are performed on pressed pow-
der samples and the method does not require any acid digestion or extraction prior to analy-
sis, but calibration standards with known content of chloride must be prepared [Building Re-
search Establishment, 1977]. A drawback is the requirement of expensive equipment and a
high level of expertise. Normally, the method is restricted to laboratories handling large
numbers of samples.
3.1.6 Quantab chloride titrators
The total chloride content in a powdered concrete sample can be quantified using a so-
called Quantab® chloride titrator, which consists of a thin, chemically inert plastic sheath.
Laminated within the sheath is a strip impregnated with a reagent. When the Quantab® test
strip is placed in a test solution, fluid rises up the strip by capillary action, and the reagent
reacts with the chloride ion in the solution and produces a white column in the strip. The
height of this column is proportional to the total chloride concentration. While this repre-
sents a convenient test method, Dhir et al. [1990] points out that the chloride content might
be underestimated due to incomplete chloride extraction caused by an insufficient concen-
tration of the nitric acid solution used in this test. Furthermore, the Quantab test method is
limited to chloride concentrations in the range from 0.03% to 1.2% by weight of concrete.
3.1.7 Scanning electron microscopy
The total chloride content of hardened concrete can be determined using a scanning elec-
tron microscope provided that the microscope is equipped with an energy dispersive X-Ray
(EDX) analyzer. The determination of the chloride concentration is based on the interaction
between some X-ray source and the sample (polished thin section). However, this technique
is expensive and requires extensive sample preparation as well as an operator with a high
level of expertise.
3.1.8 Expression of pore solution
The pore solution of a concrete sample can be expressed, and subsequently collected for
chemical analysis, by subjecting the sample of interest to a very high pressure. This method
is often used to determine the amount of free chlorides in concrete [Ayra and Newman,
1990]. However, according to Glass et al. [1996] the pore pressing may also release loosely
bound chlorides, thus overestimating the amount of free chlorides. Arya [1990] also pointed
out that this technique involves some practical difficulties, especially when working with
concrete samples having low water/cement ratios or containing coarse aggregate particles,
Report: Chloride Threshold Values – State of the art Date: December 13, 2012
17
or if the samples are rather dry. Moreover, it is also important to note that the method gives
an average value of the concrete volume under investigation, which may lead to inaccurate
results in the case of high concentration gradients in the pore solution.
3.1.9 Leaching techniques
As an alternative to the expression of pore solution by pressure, the content of free chlo-
rides may also be determined using a leaching technique. Several different varieties of the
method have been used in the past using different solvents or different procedures with re-
gard to leaching time and temperature. Generally, a crushed or powdered sample is mixed
with a solvent and the amount of chloride passing into solution is subsequently measured.
The most commonly used solvent is distilled water and the chloride concentration obtained
from leaching methods is often referred to as water soluble chloride and is sometimes con-
sidered to be equal to free chloride.
Methanol and ethyl alcohol have also been used as alternative solvents. However, these are
not very effective in leaching out the free chloride. The measured concentrations are up to
10 to 20 times lower when compared to the free chloride concentration found by pore solu-
tion expression [Tritthart, 1989; Arya et al., 1987]. The chloride concentrations obtained
from the leaching techniques has also been found to be dependent on such factors as tem-
perature and leaching time, and it has been demonstrated that the cement type and source
of chloride (mixed-in or external) have to be known in order to select an accurate leaching
procedure. Therefore, the technique is not very practical for determining the free chloride
content [Arya, 1990].
Castelotte [2001] has presented a leaching technique to determine the amount of free chlo-
rides of hardened cementitious materials. The principle is to extract the free chlorides by
leaving the sample material in an alkaline solvent for 24 h. At a chloride content of 0.5% (by
weight of sample) the method overestimated the free chloride content significantly, but at
higher chloride contents the method corresponded better to results obtained from pore so-
lution expression. It should be noted that rather high chloride concentrations have been
used in this study, and it is uncertain if the method is also sufficiently accurate at lower and
more “practical” chloride concentrations.
Leaching techniques are rarely used in Europe, whereas water soluble chloride analysis is
used as a standard method [AASHTO T260-97, 2005] in North America.
Report: Chloride Threshold Values – State of the art Date: December 13, 2012
18
3.2 Methods for determination of corrosion initiation
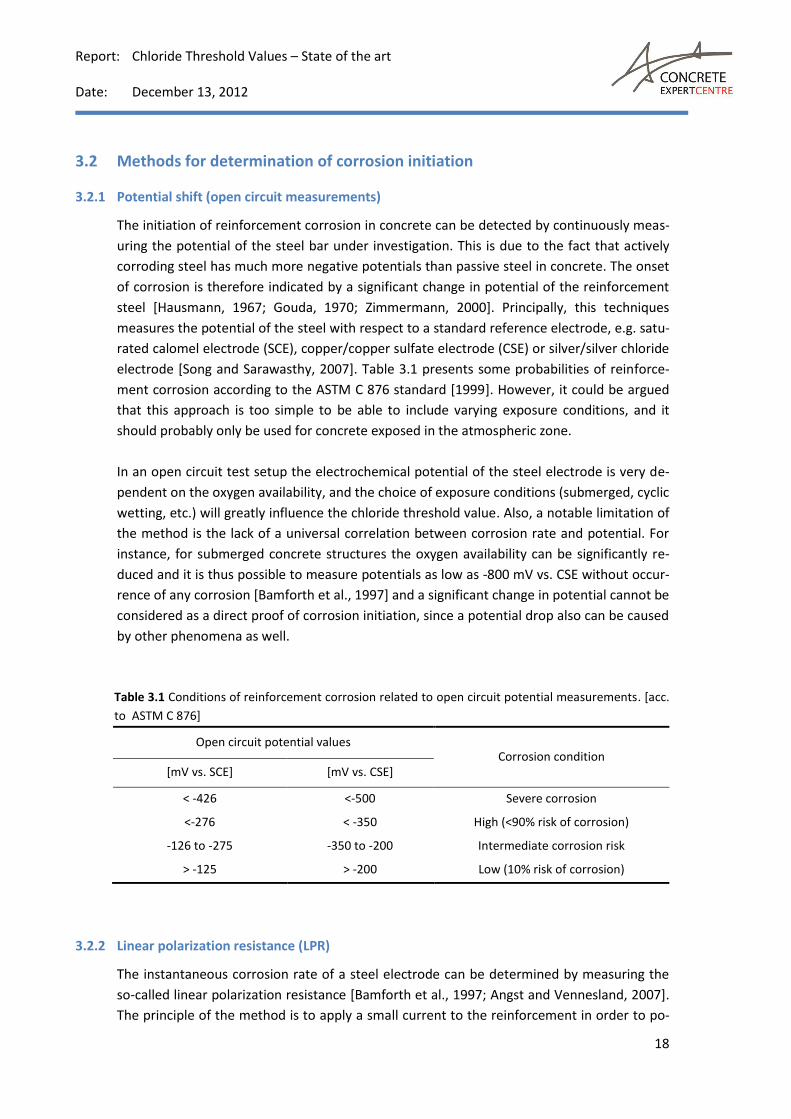
3.2.1 Potential shift (open circuit measurements)
The initiation of reinforcement corrosion in concrete can be detected by continuously meas-
uring the potential of the steel bar under investigation. This is due to the fact that actively
corroding steel has much more negative potentials than passive steel in concrete. The onset
of corrosion is therefore indicated by a significant change in potential of the reinforcement
steel [Hausmann, 1967; Gouda, 1970; Zimmermann, 2000]. Principally, this techniques
measures the potential of the steel with respect to a standard reference electrode, e.g. satu-
rated calomel electrode (SCE), copper/copper sulfate electrode (CSE) or silver/silver chloride
electrode [Song and Sarawasthy, 2007]. Table 3.1 presents some probabilities of reinforce-
ment corrosion according to the ASTM C 876 standard [1999]. However, it could be argued
that this approach is too simple to be able to include varying exposure conditions, and it
should probably only be used for concrete exposed in the atmospheric zone.
In an open circuit test setup the electrochemical potential of the steel electrode is very de-
pendent on the oxygen availability, and the choice of exposure conditions (submerged, cyclic
wetting, etc.) will greatly influence the chloride threshold value. Also, a notable limitation of
the method is the lack of a universal correlation between corrosion rate and potential. For
instance, for submerged concrete structures the oxygen availability can be significantly re-
duced and it is thus possible to measure potentials as low as -800 mV vs. CSE without occur-
rence of any corrosion [Bamforth et al., 1997] and a significant change in potential cannot be
considered as a direct proof of corrosion initiation, since a potential drop also can be caused
by other phenomena as well.
Table 3.1 Conditions of reinforcement corrosion related to open circuit potential measurements. [acc.
to ASTM C 876]
Open circuit potential values Corrosion condition
[mV vs. SCE] [mV vs. CSE]
< -426 <-500 Severe corrosion
<-276 < -350 High (<90% risk of corrosion)
-126 to -275 -350 to -200 Intermediate corrosion risk
> -125 > -200 Low (10% risk of corrosion)
3.2.2 Linear polarization resistance (LPR)
The instantaneous corrosion rate of a steel electrode can be determined by measuring the
so-called linear polarization resistance [Bamforth et al., 1997; Angst and Vennesland, 2007].
The principle of the method is to apply a small current to the reinforcement in order to po-
Report: Chloride Threshold Values – State of the art Date: December 13, 2012
19
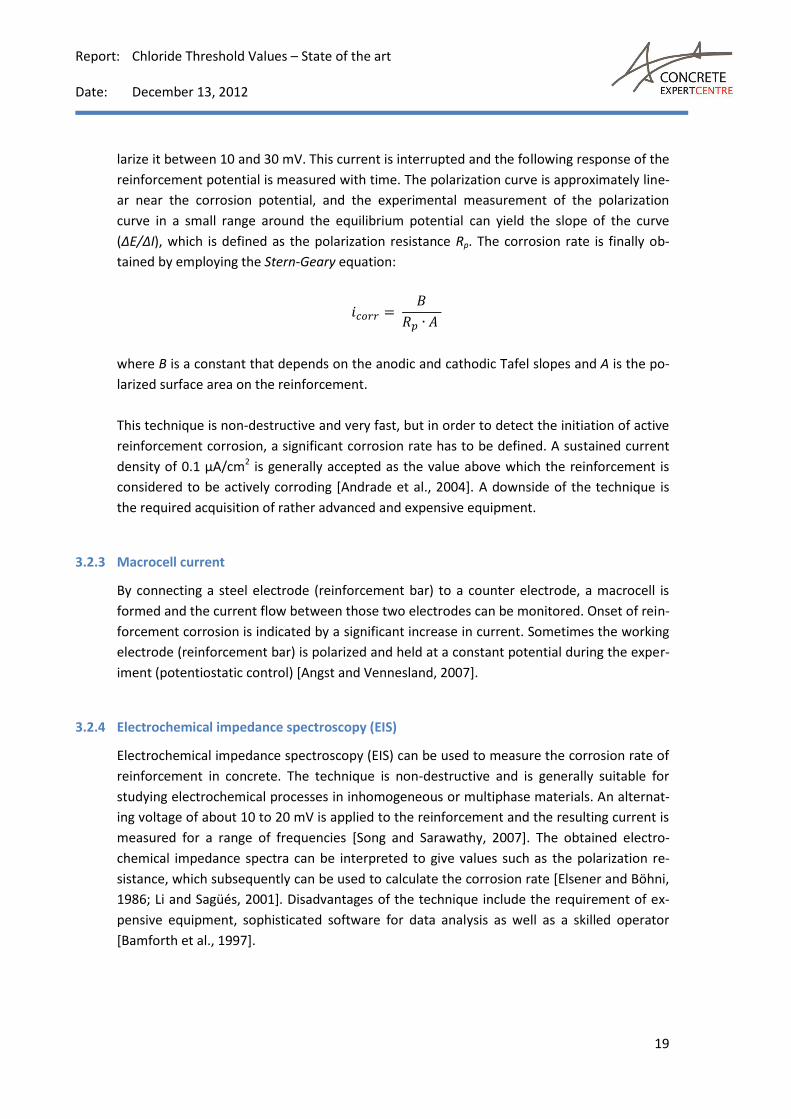
larize it between 10 and 30 mV. This current is interrupted and the following response of the
reinforcement potential is measured with time. The polarization curve is approximately line-
ar near the corrosion potential, and the experimental measurement of the polarization
curve in a small range around the equilibrium potential can yield the slope of the curve
(ΔE/ΔI), which is defined as the polarization resistance Rp. The corrosion rate is finally ob-
tained by employing the Stern-Geary equation:
where B is a constant that depends on the anodic and cathodic Tafel slopes and A is the po-
larized surface area on the reinforcement.
This technique is non-destructive and very fast, but in order to detect the initiation of active
reinforcement corrosion, a significant corrosion rate has to be defined. A sustained current
density of 0.1 µA/cm2 is generally accepted as the value above which the reinforcement is
considered to be actively corroding [Andrade et al., 2004]. A downside of the technique is
the required acquisition of rather advanced and expensive equipment.
3.2.3 Macrocell current
By connecting a steel electrode (reinforcement bar) to a counter electrode, a macrocell is
formed and the current flow between those two electrodes can be monitored. Onset of rein-
forcement corrosion is indicated by a significant increase in current. Sometimes the working
electrode (reinforcement bar) is polarized and held at a constant potential during the exper-
iment (potentiostatic control) [Angst and Vennesland, 2007].
3.2.4 Electrochemical impedance spectroscopy (EIS)
Electrochemical impedance spectroscopy (EIS) can be used to measure the corrosion rate of
reinforcement in concrete. The technique is non-destructive and is generally suitable for
studying electrochemical processes in inhomogeneous or multiphase materials. An alternat-
ing voltage of about 10 to 20 mV is applied to the reinforcement and the resulting current is
measured for a range of frequencies [Song and Sarawathy, 2007]. The obtained electro-
chemical impedance spectra can be interpreted to give values such as the polarization re-
sistance, which subsequently can be used to calculate the corrosion rate [Elsener and Böhni,
1986; Li and Sagüés, 2001]. Disadvantages of the technique include the requirement of ex-
pensive equipment, sophisticated software for data analysis as well as a skilled operator
[Bamforth et al., 1997].
Report: Chloride Threshold Values – State of the art Date: December 13, 2012
20
3.2.5 Galvanostatic pulse method
The galvanostatic pulse method [Elsener et al. 1994] is a rapid and non-destructive tech-
nique that can be used to measure the corrosion rate of reinforcement in concrete. The
method relies on polarization resistance (Rp) measurements which are carried out by induc-
ing a short anodic current pulse (50 µA) into the reinforcement galvanostatically (= constant
current) from a counter electrode placed on the concrete surface together with a reference
electrode. The counter electrode measures the resulting transient anodic change of the rein-
forcement potential, and the results may be presented as a contour map of corrosion rate
values. The galvanostatic pulse method can be performed using hand-held equipment.
3.2.6 Visual examination
Initiation of reinforcement corrosion can be identified by visual inspection of the steel sur-
face if the reinforcement is removed physically from the concrete. Since the method is de-
structive and only can be performed once, the accuracy is inherently low: The amount of
time that has passed between the actual corrosion onset and visual observation of rust on
the steel surface is unknown [Angst and Vennesland, 2007]. The method has mostly been
used in earlier works, but is also used today as a supplement to other techniques.
4 Chloride threshold values from the literature
A table of chloride threshold values from the literature is presented in Appendix 1. As men-
tioned earlier, the chloride threshold value for reinforcement in concrete can be expressed
as either total content of chloride (% by weight of cement or concrete), content of free chlo-
ride (e.g. mole/l or % by weight of cement) or as the [Cl-]/[OH-] ratio, and the reported
threshold values in the Appendix 1 exhibit a wide scatter. The following ranges of chloride
threshold values were found:
Total chloride (% by weight of cement): 0.02 to 3.08.
Free chloride: 0.045 to 3.22 (mole/l) or 0.07 to 1.16 % by weight of cement.
[Cl-]/[OH-] ratio: 0.01 to 20.
This pronounced variation of chloride threshold values originates not only from the influenc-
ing parameters presented in section 2.2, but also from the variety of different methods that
have been employed to detect the initiation of reinforcement corrosion and to measure the
content of chloride in the specimen of interest. It was generally not possible to narrow the
broad ranges of reported chloride threshold values by dividing them into groups according
to e.g. exposure environment, binder type, etc. An exception was the distinction between
[Cl-]/[OH-] ratios obtained using synthetic pore solutions versus values from experiments in-
volving specimens of paste, mortar or concrete. There is a clear tendency of [Cl-]/[OH-] ratios
being lower if the experiments were performed in synthetic pore solutions (overall range:
0.01 – 4.9) as opposed to ratios derived from hardened samples (overall range: 0.05 – 20).

Report: Chloride Threshold Values – State of the art Date: December 13, 2012
21
This difference is probably reflecting the notable effect that the condition of the steel-
concrete interface has on the chloride threshold value. Finally, the table in Appendix 1 con-
tains data from two studies [Castellote et al., 2002; Trejo and Pillai, 2003] in which chloride
was introduced to mortar samples using a migration technique. The reported chloride
threshold values from these studies stands out as being notably low with total chloride con-
tents (by weight of cement) ranging from 0.02 to 0.24 and [Cl-]/[OH-] ratios from 0.05 to 2.0.
A consensus seems to be lacking about which expression of the chloride threshold value is
considered the most appropriate. Some researchers argue that the threshold value is best
expressed as the content of free chloride, since only the free chloride ions are assumed to
participate in the initiation of pitting corrosion. However, it has been pointed out that bound
chlorides may be released due to, for example, a drop in pH of the pore solution [Glass et al.,
2000; Reddy et al., 2002], and that the corrosion risk represented by the amount of bound
chlorides is overlooked if only the free chlorides are taken into account [Glass and Buenfeld,
1997]. It should also be mentioned that contents of free chloride determined by expression
of pore solution may not reflect the "true" content of free chloride in concrete at atmos-
pheric pressure, since the expression method is carried out using a very high confining pres-
sure, i.e. the conditions of phase equilibrium is most likely very different at such elevated
pressures.
It is generally agreed that at the time of corrosion initiation it is the free chloride content
which is relevant (considering all other parameters to be equal). However, for practical rea-
sons measurements of free chloride content is very difficult to carry out, so it is often pre-
ferred to relate the chloride threshold value to the total chloride content. This introduces a
problem which has generally not been taken into consideration so far, because the ratio be-
tween free and bound chloride can change considerably in different exposure situations (e.g.
at. different temperatures). The question is how can this be taken into account, when we
measure the chloride threshold value in the lab?
The representation of the chloride threshold value by the [Cl-]/[OH-] ratio relates the con-
centration of free chloride ions to the pH value of the pore solution. Again, it may be argued
that this expression is associated with a problematic neglect of the bound chlorides. Fur-
thermore, it has been demonstrated that the [Cl-]/[OH-] threshold ratio depends on the pH
value of the pore solution [Li and Sagüés, 2001]. The threshold ratio increases at higher pH
values and consequently the actual pH value must also be taken into consideration when re-
porting the chloride threshold value by the [Cl-]/[OH-] ratio.
It is also worth noting that the way one chooses to express the chloride threshold value may
partly be a result of practical considerations. As noted above, it is far more difficult to meas-
ure the content of free chloride in a concrete specimen as compared to the total content of
chloride. In the literature the majority of chloride threshold values are expressed by total
content of chloride, which is possibly also a reflection of such practical concerns.
Report: Chloride Threshold Values – State of the art Date: December 13, 2012
22
When comparing chloride threshold values reported in the literature it is important to keep
in mind that the investigated specimens (concrete, mortar or cement paste) may not have
reached the same degree of maturity at the time when they are exposed to a chloride-rich
environment. The binder of a specimen in one study may have reacted almost completely,
whereas the binder in another experiment may have reacted to a much lesser extent. For
example, a number of studies have demonstrated that the fly ash component of a hydrating
binder may react very slowly. Lam et al. [2000] found, using a selective dissolution method,
that after 7 days of hydration only 6 % of the fly ash had reacted in pastes containing 45 – 55
wt% fly ash, and that more than 80 % of the fly ash still remained unreacted after 90 days of
hydration. Feldman et al. [1990] have also reported that considerable amounts of fly ash
remained as unreacted particles in the binder – fly ash pastes after 91 days of hydration.
This was based on electron microscopy. Similarly, based on a solid-state NMR study on ce-
ment pastes containing 30% fly ash, Poulsen [2009] found that clear indications of fly ash re-
action were only detected for hydration times beyond 28 days and that 75 – 80 % of the fly
ash had still not reacted after 180 days of hydration. With such a slowly reacting component
in the binder, the chemical composition (e.g. the pH value) of the pore solution will progres-
sively change for an extended period of time thus affecting the chloride threshold value con-
tinuously. Therefore, the comparison of chloride threshold values from the literature may
lead to ambiguous conclusions if the maturity of the specimen (at the time of chloride expo-
sure) is not taken into consideration.
5 RILEM project
In order to address the lack of a universally accepted method for determination of the chlo-
ride threshold value in reinforced concrete a technical committee (TC 235 CTC: Corrosion Ini-
tiating Chloride Threshold Concentrations in Concrete) has been established under the
RILEM organization. The committee comprises a group of experts that have been actively
working within research areas related to chloride threshold values. The work of the commit-
tee was initiated in 2009 and has an estimated duration of four years. The primary aim is to
develop a generally accepted test method for the determination of chloride threshold values
for reinforced concrete and main activities of the committee include the preparation of a
state-of-the-art report and the organization of round robin tests (RRTs).
After thorough discussions, the details of a preliminary test method have been agreed upon
and a RRT was initiated during the autumn of 2011. The RRT involves 12 different laborato-
ries and the main purpose is to evaluate the precision (repeatability and reproducibility) of
the suggested test method for measuring the chloride threshold value in concrete. The
method involves the exposure of concrete specimens (ten replicas) to a 3.3 mass% NaCl so-
lution after initial subjection to a drying regime, which is done to facilitate a quicker ingress
of chloride through the concrete. Each specimen contains an embedded steel bar (working
electrode) and the potential of this working electrode against a reference electrode is moni-

Report: Chloride Threshold Values – State of the art Date: December 13, 2012
23
tored by a data logger. The corrosion onset is detected by a significant drop in potential (at
least 150 mV) and the chloride concentration at the steel bar is finally measured by potenti-
ometric titration. In order to eliminate the possible influence of using different types of ce-
ment and steel, these materials have been distributed to all the participating laboratories,
thus ensuring that the same materials are used by all laboratories. The obtained results from
the RRT will be compared and discussed at RILEM workshops held in the period 2012-13.
6 Summary
Ingress of chloride ions into a concrete structure may lead to pitting corrosion on the rein-
forcement and ultimately result in deterioration of the structure. The corrosion process is in-
itiated when a certain critical concentration of chloride (the chloride threshold value) is
reached at the surface of the reinforcing steel. The chloride threshold value is a very im-
portant input parameter for the modeling of service lifetime of reinforced concrete struc-
tures and therefore, it is essential that the chloride threshold value can be experimentally
determined in a reliable manner. Unfortunately, a generally accepted method for determi-
nation of chloride threshold values is presently lacking. Without an experimental determina-
tion, engineers are forced to make qualified (and often very conservative) guesses about the
magnitude of the threshold value, thus potentially underestimating the service lifetime of
concrete structures considerably.
It seems well-established that a “universal” chloride threshold value does not exist. Instead,
the threshold value is dependent on a variety of factors, such as the type of binder used in
the concrete mix, the electrochemical potential of the reinforcing steel, temperature, the
surface condition of the steel, availability of oxygen, etc. As a consequence, the chloride
threshold value must generally be considered as unique for each type of concrete and the
associated environment to which the concrete is exposed.
The chloride threshold values reported in the literature display a wide scatter and have been
obtained using a variety of different experimental approaches, thus making comparison of
results questionable. Moreover, the chloride threshold value is generally reported using one
of three different expressions (total content of chloride, content of free chloride, or Cl-
/OH- ratio of the pore solution), which further complicates the comparison of results.
In 2009 a technical committee was established as part of the RILEM association with the
primary purpose of developing a new and generally accepted test method for determination
of chloride threshold values in concrete. After careful discussions the committee has agreed
upon a preliminary test method and the result from a Round Robin Test based on this new
method are expected in the period 2012-13.

Report: Chloride Threshold Values – State of the art Date: December 13, 2012
24
7 References
AASHTO T260-97. Standard method of test for sampling and testing for chloride ion in concrete and concrete raw materials. American Association of State Highway and Transportation Officials, 2005. C. Alonso, C. Andrade, M. Castellote and P. Castro. Chloride threshold values to depassivate reinforc-ing bars embedded in a standardized OPC mortar. Cement and Concrete Research 30 (2000) 1047-1055. C. Alonso, M. Castellote and C. Andrade. Chloride threshold dependence of pitting potential of rein-forcements. Electrochimica Acta 47 (2002) 3469-3481. C. Andrade, C. Alonso, J. Gulikers, R. Polder, R. Cigna, O. Vennesland, M. Salta, A. Raharinaivo and B. Elsener. Recommendation of RILEM TC 154-EMC: "Test methods for on-site corrosion rate measure-ment of steel reinforcement in concrete by means of the polarization resistance method". Materials and Structures 37 (2004) 623-643. U. Angst and Ø. Vennesland. Critical chloride content – State of the art. SINTEF report, COIN – Con-crete Innovation Centre, Trondheim, Norway, 2007, 1-54. U. Angst and Ø. Vennesland. Critical chloride content in reinforced concrete. In: Concrete repair, reha-bilitation and retrofitting II, Taylor & Francis Group, London, 2009, 311-317. K.Y. Ann and H.-W. Song. Chloride threshold level for corrosion of steel in concrete. Corrosion Science 49 (2007) 4113-4133. H. Arup. Bestemmelse af chloridtærskelværdi (Determination of chloride threshold level). In: Marina betongkonstruktioners livslängd. Cementa AB, Sweden, 124-131. C. Arya. An assessment of four methods of determining the free chloride content of concrete. Materials and Structures 23 (1990) 319-330. C. Arya, N.R. Buenfeld and J.B. Newman. Assessment of simple methods of determining the free chlo-ride ion content of cement paste. Cement and Concrete Research 17 (1987) 907-918. C. Arya, N.R. Buenfeld and J.B. Newman. Factors influencing chloride-binding in concrete. Cement and Concrete Research 20 (1990) 291-300. ASTM C876. Standard test method for half-cell potentials of reinforcing steel in concrete. ASTM Inter-national, 1997. ASTM C876-91. Standard test method for half-cell potentials of uncoated reinforcing steel in concrete. ASTM International, 1999. C. Atkins, J. Scantebury, P. Nedwell and S. Blatch. Monitoring chloride concentrations in hardened ce-ment pastes using ion sensitive electrodes. Cement and Concrete Research 26 (1996) 319-324. P.B. Bamforth and J.F. Chapman-Andrews. Long term performance of R.C. elements under U.K. coastal exposure conditions. In: Corrosion and Corrosion Protection of Steel in Concrete, Vol. 1, 1994, 139-156. P.B. Bamforth, W.F. Price and M. Emerson. An international review of chloride ingress into structural concrete, Taywood Engineering Limited, 1997, 1-162. L. Bertolini, B. Elsener, P. Pedeferri and R. Polder. Corrosion of steel in concrete. WILEY VCH, 2004.
Report: Chloride Threshold Values – State of the art Date: December 13, 2012
25
W. Breit. Critical chloride content – investigations of steel in alkaline chloride solutions. Materials and Corrosion 49 (1998) 539-550. W. Breit. Kritischer korrosionsauslösender Chloridgehalt - Neuere Untersuchungsergebnisse (Teil 2). Beton 8 (1998) 511. Building Research Establishment. Determination of chloride and cement content in Portland cement concrete. Information Sheet IS 13/77, Garston, 1977. K. Byfors. Influence of silica fume and flyash on chloride diffusion and pH value in cement paste. Ce-ment and Concrete Research 17 (1987) 115-130. K. Byfors. Chloride-initiated reinforcement corrosion, chloride binding. CBI Report 1:90, Swedish Ce-ment and Concrete Institute, 1990, 1-121. M. Castellote, C. Alonso, C. Andrade, P. Castro and M. Echeverría. Alkaline leaching method for the de-termination of the chloride content in the aqueous phase of hardened cementitious materials. Cement and Concrete Research 31 (2001) 233-238. M. Castellote, C. Andrade and C. Alonso. Accelerated simultaneous determination of the chloride de-passivation threshold and of the non-stationary diffusion coefficient values. Corrosion Science 44 (2002) 2409-2424. R.G. Cavalier and P.R. Vassie. Investigation and repair of reinforcement corrosion in a bridge deck. Proc. Inst. Civ. Engrs., Part 1, Vol. 70, 1981, 461-480. A. Cheng, R. Huang, J.-K. Wu and C.-H. Chen. Influence of GGBS on durability and corrosion behavior of reinforced concrete. Materials Chemistry and Physics 93 (2005) 404-411. R. Cigna, C. Andrade, U. Nürnberger, R. Polder, R. Weydert and E. Seitz, ed. COST 521: Final report “Corrosion of steel in reinforced concrete structures”. Luxembourg, 2002. S. Diamond. Effect of two danish fly ashes on alkali contents of pore solutions of cement-flyash pastes. Cement and Concrete Research 11 (1981) 383-394. R.K. Dhir, M.A.K. El-Mohr and T.D. Dyer. Chloride binding in GGBS concrete. Cement and concrete Re-search 26 (1996) 1767-1773. R.K. Dhir and M.R. Jones. Development of chloride-resisting concrete using fly ash. Fuel 78 (1999) 137-142. R.K. Dhir, M.R. Jones, H.E.H. Ahmed. Determination of total and soluble chlorides in concrete. Cement and Concrete Research 20 (1990) 579-590. B. Elsener and H. Böhni. Corrosion of steel in mortar studied by impedance measurements. Electro-chemical Methods in Corrosion Research (ed. M. Duprat), Materials Science Forum 8 (1986) 363-372. B. Elsener, H. Wojtas, H. Böhni. Galvnostatic Pulse Measurements - Rapid on Site Corrosion Monitor-ing. In: Proceedings of International Conference held at the University of Sheffield, Vol.1, 1994, 236-246.
Report: Chloride Threshold Values – State of the art Date: December 13, 2012
26
B. Elsener, L. Zimmermann, D. Flückiger, D. Bürchler and H. Böhni. Chloride penetration – non-destructive determination of the free chloride content in mortar and concrete. In: Proc. RILEM Interna-tional Workshop on chloride penetration into concrete, Paris, 1997. R.F. Feldman, G.G. Carette, V.M. Malhotra. Studies on mechanics of development of physical and me-chanical properties of high-volume fly ash-cement pastes. Cement and Concrete Composites 12 (1990) 245-251. P. Fidjestøl and K. Tuutti. The importance of chloride diffusion. In: Proceedings of the RILEM Workshop on “Chloride Pnetration in Concrete”, Saint-Rémy-lès-Chevreuse, France, 1995, 470-480. G.K. Glass and N.R. Buenfeld. Chloride threshold levels for corrosion induced deterioration of steel in concrete. In: Proceedings of the International RILEM Workshop on Chloride Penetration into Concrete, Saint-Rémy-lès-Chevreuse, France, October 15-18, 1995, 429-440.
G.K. Glass and N.R. Buenfeld. The presentation of the chloride threshold level for corrosion of steel in concrete. Corrosion Science 39 (1997) 1001-1013. G.K. Glass, B. Reddy and N.R.Buenfeld. The participation of bound chloride in passive film breakdown on steel in concrete. Corrosion Science 42 (2000) 2013-2021. G.K. Glass, Y. Wang and N.R. Buenfeld. An investigation of experimental methods used to determine free and total chloride contents. Cement and Concrete Research 26 (1996) 1443-1449. V.K. Gouda. Corrosion and corrosion inhibition of reinforcing steel. I. Immersed in alkaline solutions. British Corrosion Journal 5 (1970) 198-203. V.K. Gouda and W.Y. Halaka. Corrosion and corrosion inhibition of reinforcing steel. II. Embedded in concrete. British Corrosion Journal 5 (1970) 204-208. C.M. Hansson and B. Sørensen. The threshold concentration of chloride in concrete for the initiation of reinforcement corrosion. In: Corrosion rates of steel in concrete, ed. by N. S. Berke, V. Chaker and D. Whiting. ASTM STP 1065, 1990, 3-16. D.A. Hausmann. Steel corrosion in concrete. How does it occur? Materials Protection 6 (1967) 19-23. S.E. Herald S.E. Herald, M. Henry, I.L. Al-Qadi, R.E. Weyers, M.A. Feeney, S.F. Howlum, P.D. Cady. Con-dition evaluation of concrete bridges relative to reinforcement corrosion. Vol. 6, Method for field de-termination of total chloride content. SHRP Report SHRP-S/FR-92-108, 1992, p. 1-155. B.B. Hope and A.K.C. Ip. Chloride corrosion threshold in concrete. ACI Materials Journal, July-August (1987) 306-314. M. Kouřil, P. Novák and M. Bojko. Threshold chloride concentration for stainless steels actiation in concrete pore solutions. Cement and Concrete Research 40 (2010) 431-436. L. Lam, Y.L. Wong, C.S. Poon. Degree of hydration and gel/space ratio of highvolume fly ash/cement systems. Cement and Concrete Research 30 (2000) 747-756. P. Lambert, C.L. Page and P.R.W. Vassie. Investigations of reinforcement corrosion. 2. Electrochemical monitoring of steel in chloride-contaminated concrete. Materials and Structures 24 (1991) 351-358.
C.K. Larsen. Chloride binding in concrete. Dr. Ing. Thesis, Report No. 1998:101. Norwegian University of Science and Technology, NTNU, 1998.

Report: Chloride Threshold Values – State of the art Date: December 13, 2012
27
L. Li and A.A. Sagüés. Chloride corrosion threshold of reinforcing steel in alkaline solutions - Open-circuit immersion tests. Corrosion 57 (2001) 19-28. C.E. Locke and A. Siman. Electrochemistry of reinforcing steel in salt-contaminated concrete. In: Corro-sion of Reinforcing Steel in Concrete, ASTM STP 713, American Society for Testing and Materials, 1980, 3-16. R. Luo, Y.B. Cai, C.Y. Wang and X.M. Huang. Study of chloride binding and diffusion in GGBS concrete. Cement and Concrete Research 33 (2003) 1-7. J.R. Mackechnie and M.G. Alexander. Repair principles for corrosion-damaged reinforced concrete structures. Research Monograph No. 5, Department of Civil Engineering, University of Cape Town, 2001, 1-36. L.T. Mammoliti, L.C. Brown, C.M. Hansson and B.B. Hope. The influence of surface finish of reinforcing steel and pH of the test solution on the chloride threshold concentration for corrosion initiation in syn-thetic pore solutions. Cement and Concrete Research 26 (1996) 545-550. M. Manera, Ø. Vennesland and L. Bertolini. Effect of silica fume on the initiation of chloride induced corrosion in reinforced concrete. COST 534: New Materials and Systems for Prestressed Concrete Structures. Project reports 2005-2006, 2007. E. Mattsson. Elektrokemi och korrosionsläre. Swedish Corrosion Institute, Roos Production AB, Stock-holm, Sweden, 1992. T.U. Mohammed and H. Hamada. A discussion of the paper "Chloride threshold values to depassivate reinforcing bars embedded in a standardized OPC mortar" by C. Alonso, C. Andrade, M. Castellote and P. Castro. Cement and Concrete Research 31 (2001) 835-838. T.U. Mohammed and H. Hamada. Corrosion of steel bars in concrete with various steel surface condi-tions. ACI Materials Journal 103 (2006) 233-242. A.M. Neville. Properties of Concrete. Fourth Edition, Longman Group Ltd., London, 1995, 1-844. E.P. Nielsen. The durability of white Portland cement to chemical attack. PhD thesis, Department of Civil Engineering, Technical University of Denmark, Report no. R-084, ISSN 1601-2917, ISBN 87-7877-147-1, 1-102, 2004. L.-O. Nilsson, E. Poulsen, P. Sandberg, H.E. Sørensen, O. Klinghoffer. Chloride penetration into con-crete, State-of-the-Art, HETEK Report No. 53, 1996, 1-151. NT Build 208, Edition 2. Concrete, hardened: Chloride content. 1984. P.V. Nygaard and M.R. Geiker. A method for measuring the chloride threshold level required to initi-ate reinforcement corrosion in concrete. Materials and Structures 38 (2005) 489-494. B.H. Oh, S.Y. Jang and Y.S. Shin. Experimental investigation of the threshold chloride concentration for corrosion initiation in reinforced concrete structures. Magazine of Concrete Research 55 (2003), 117-124. C.L. Page. Mechanism of corrosion protection in reinforced concrete marine structures. Nature 258 (1975) 514-515.
Report: Chloride Threshold Values – State of the art Date: December 13, 2012
28
C.L. Page and Ø. Vennesland. Pore solution composition and chloride binding capacity of silica fume-cement pastes. Materials and Structures 19 (1993) 19-25. K. Pettersson. Corrosion threshold value and corrosion rate in reinforced concrete. CBI report 2:92., Swedish Cement and Concrete Research Institute, 1992, 1-43. K. Pettersson. Corrosion of steel in high performance concrete. Proceedings of 3
rd International Sym-
posium on Utilization of High Strength Concrete, Lillehammer, Norway, 1993. K. Pettersson. Chloride induced reinforcement corrosion, status report. Högpresterande Betongkon-struktioner, CBI, Report M1:5, 1994. K. Pettersson. Chloride threshold value and the corrosion rate in reinforced concrete. In: Proc. of the Nordic Seminar. Lund, 1995, 257-266. K. Pettersson. Criteria for cracks in connection with corrosion in high performance concrete. In: Pro-ceedings of CANMET/ACI International Symposium on Utilization of High Strength/High Performance Concrete, Paris, France, 1996. S.L. Poulsen. Methodologies for measuring the degree of reaction in Portland cement blends with sup-plementary cementitious materials by
29Si and
27Al MAS NMR spectroscopy. PhD thesis, Aarhus Uni-
versity, 2009, 1-147. B. Reddy, G.K. Glass, P.J. Lim and P. Buenfeld. On the corrosion risk presented by chloride bound in concrete. Cement and Concrete Composites 24 (2002) 1-5. S. Rasheeduzzafur, S.E. Hussain and S.S. Al-Saadoun. Effect of tricalcium aluminate content of cement on chloride binding and corrosion of reinforcing steel in concrete. ACI Materials Journal 89 (1992) 3-12. W. Richartz. Die Bindung von Chlorid bei der Zementerhärtung. Zement-Kalk-Gips 10 (1969) 447-456. P. Sandberg. Chloride initiated reinforcement corrosion in marine concrete. Dissertation (Report TVBM-1015), Lund Institute of Technology, Division of Building Materials, Lund University (1998). P. Schiessl and W. Breit. Time to depassivation depending on concrete composition and environmental conditions. In: Proceedings of the RILEM Workshop on “Chloride Pnetration in Concrete”, Saint-Rémy-lès-Chevreuse, France, 1995. P. Schiessl and W. Breit. Local repair measures at concrete structures damaged by reinforcement cor-rosion - aspects of durability. In: Proc. 4th Int. Symp. "Corrosion of Reinforcement in Concrete Con-struction". Cambridge, The Royal Society of Chemistry, 1996, 525-534. P. Schiessl and M. Raupach. Influence of concrete composition and microclimate on the critical chlo-ride content in concrete. In: Proc. 3rd Int. Symp. "Corrosion of Reinforcement in Concrete". Wishaw, UK. Elsevier Applied Science, 1990, 49-58. H.-W. Song and V. Sarawathy. Corrosion monitoring of reinforced concrete structures – A review. In-ternational Journal of Electrochemical Science 2 (2007) 1-28. R.F. Stratfull, W.J. Jurkovich and D.L. Spellman. Corrosion testing of bridge decks. Transportation Re-search Record 539 (1975) 50-59.
Report: Chloride Threshold Values – State of the art Date: December 13, 2012
29
N. Takagi, T. Miyagawa, S. Amasaki and T. Kojima. Chloride corrosion of reinforcing steel in silica fume concrete exposed to marine environment. ACI Sp-126, Ed Malhotra, Durability of Concrete, 2
nd Int.
Cong. Montreal, Canada, Vol. 1, Detroit, ACI, 1991, 479-497. M. Thomas. Chloride threshold in marine concrete. Cement and Concrete Research 26 (1996), 513-519. D. Trejo and R.G. Pillai. Accelerated chloride threshold testing: Part I – ASTM A 615 and A 706 rein-forcement. ACI Materials Journal 100 (2003) 519-527. J. Tritthart. Chloride binding in cement. I. Investigations to determine the composition of porewater in hardened cement. Cement and Concrete Research 19 (1989) 586-594. K. Tuutti. Corrosion of steel in concrete. Report Fo 4.82, Swedish Cement and Concrete Research Insti-tute, Stockholm, 1982, 1-469. D.A. Whiting, P.C. Taylor, M.A. Nagi. Chloride Limits in Reinforced Concrete. R&D Serial No. 2438, Port-land Cement Association, Skokie, Illinois, USA, 2002, 1-76. T. Yonezawa, V. Ashworth and R.P.M. Procter. Pore solution composition and chloride effects on the corrosion of steel in concrete. Corrosion 44 (1988) 489-499. L. Zimmermann. Korrosionsinitiierender Chloridgehalt von Stahl in Beton. Dissertation, ETH Nr. 13870. ETH Zürich, 2000. L. Zimmermann, B. Elsener and H. Böhni. Critical factors for the initiation of rebar corrosion. In: Proc. EUROCORR '99. Aachen. European Federation of Corrosion, 1999.
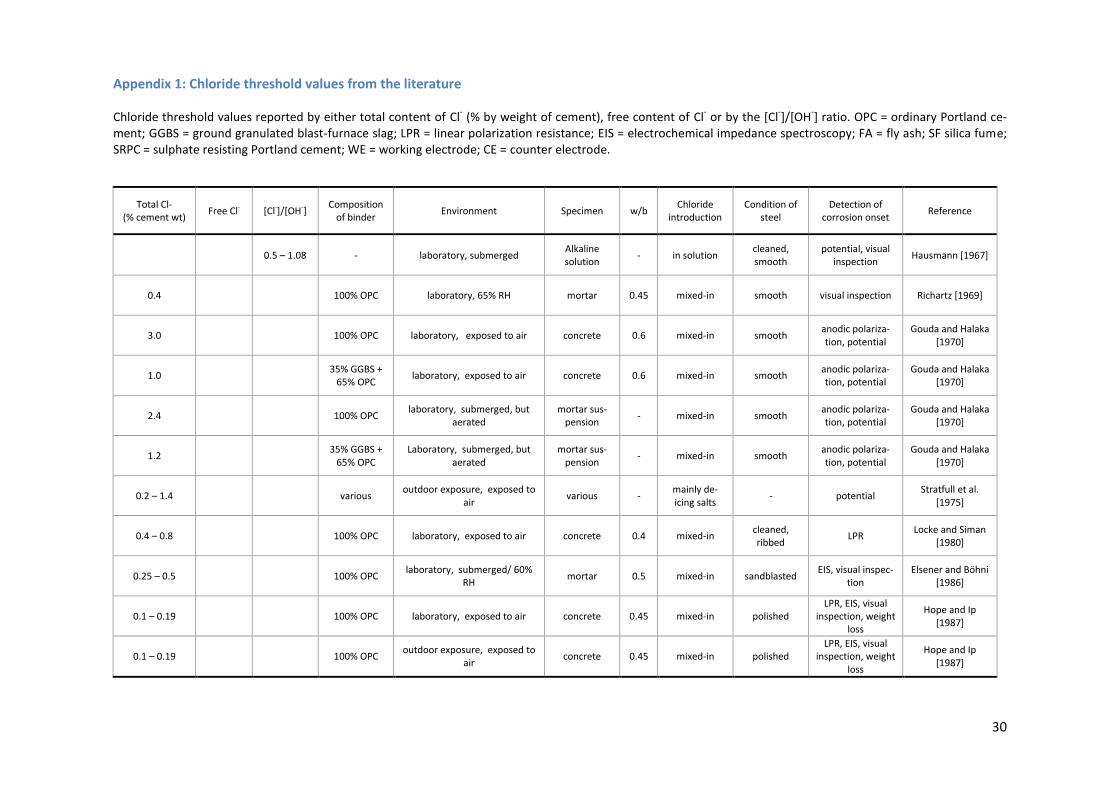
30
Appendix 1: Chloride threshold values from the literature
Chloride threshold values reported by either total content of Cl- (% by weight of cement), free content of Cl
- or by the [Cl
-]/[OH
-] ratio. OPC = ordinary Portland ce-
ment; GGBS = ground granulated blast-furnace slag; LPR = linear polarization resistance; EIS = electrochemical impedance spectroscopy; FA = fly ash; SF silica fume; SRPC = sulphate resisting Portland cement; WE = working electrode; CE = counter electrode.
Total Cl- (% cement wt)
Free Cl- [Cl-]/[OH-] Composition
of binder Environment Specimen w/b
Chloride introduction
Condition of steel
Detection of corrosion onset
Reference
0.5 – 1.08 - laboratory, submerged Alkaline solution
- in solution cleaned, smooth
potential, visual inspection
Hausmann [1967]
0.4 100% OPC laboratory, 65% RH mortar 0.45 mixed-in smooth visual inspection Richartz [1969]
3.0 100% OPC laboratory, exposed to air concrete 0.6 mixed-in smooth anodic polariza-tion, potential
Gouda and Halaka [1970]
1.0 35% GGBS +
65% OPC laboratory, exposed to air concrete 0.6 mixed-in smooth
anodic polariza-tion, potential
Gouda and Halaka [1970]
2.4 100% OPC laboratory, submerged, but
aerated mortar sus-
pension - mixed-in smooth
anodic polariza-tion, potential
Gouda and Halaka [1970]
1.2 35% GGBS +
65% OPC Laboratory, submerged, but
aerated mortar sus-
pension - mixed-in smooth
anodic polariza-tion, potential
Gouda and Halaka [1970]
0.2 – 1.4 various outdoor exposure, exposed to
air various -
mainly de-icing salts
- potential Stratfull et al.
[1975]
0.4 – 0.8 100% OPC laboratory, exposed to air concrete 0.4 mixed-in cleaned, ribbed
LPR Locke and Siman
[1980]
0.25 – 0.5 100% OPC laboratory, submerged/ 60%
RH mortar 0.5 mixed-in sandblasted
EIS, visual inspec-tion
Elsener and Böhni [1986]
0.1 – 0.19 100% OPC laboratory, exposed to air concrete 0.45 mixed-in polished LPR, EIS, visual
inspection, weight loss
Hope and Ip [1987]
0.1 – 0.19 100% OPC outdoor exposure, exposed to
air concrete 0.45 mixed-in polished
LPR, EIS, visual inspection, weight
loss
Hope and Ip [1987]

31
Total Cl- (% cement wt)
Free Cl- [Cl-]/[OH-] Composition
of binder Environment Specimen w/b
Chloride introduction
Condition of steel
Detection of corrosion onset
Reference
4.9 100% OPC laboratory, submerged, but
aerated synthetic
pore solution - in solution polished LPR, potential
Yonezawa et al. [1988]
0.25 – 0.8 - laboratory, submerged synthetic
pore solution - in solution cleaned LPR, potential
Goñi and Andrade [1990]
0.4 – 1.37 OPC, FA, SRPC, SF,
RHPC laboratory, submerged mortar
0.4 – 0.6
diffusion cleaned, smooth
current between WE and passive
external CE
Hansson and Sørensen [1990]
0.5 laboratory, exposed to air concrete 0.4 – 0.6
mixed-in - macrocell current Schiessel and
Raupach [1990]
0.5 – 2.0 laboratory, exposed to air concrete 0.4 – 0.6
mixed in/ diffu-
sion/capillary suction
- macrocell current Schiessel and
Raupach [1990]
1.5 – 2.5 3 – 20 OPC, SRPC laboratory, exposed to air Cement
paste/ con-crete
0.5
capillary suction and
diffu-sion/mixed-in
cleaned, smooth
LPR, potential Lambert et al.
[1991]
0.125 70% OPC +
30% SF laboratory, submerged concrete - diffusion - half-cell potential
Takagi et al. [1991]
0.5 – 1.8 0.36 – 3.22
mole/l OPC, SF, FA laboratory, exposed to air mortar
0.4 – 0.6
capillary suction and
diffu-sion/mixed-in
cleaned LPR Pettersson [1992]
0.14 –
1.8 mole/l
2.5 – 6 OPC, SF laboratory, exposed to air mortar and
concrete 0.3 – 0.75
diffu-sion/capillary
suction ribbed LPR Pettersson [1995]
0.14
mole/l - laboratory, submerged
alkaline solution
- in solution ground anodic polariza-
tion Mammoliti et al.
[1996]
0.28
mole/l - laboratory, submerged
alkaline solution
- in solution ribbed anodic polariza-
tion Mammoliti et al.
[1996]
0.42
mole/l - laboratory, submerged
alkaline solutions
- in solution polished anodic polariza-
tion Mammoliti et al.
[1996]
0.5 – 1.0 100% OPC laboratory, exposed to air concrete 0.5 – 0.7
mixed-in/diffusion
ribbed macrocell current Schiessl and Breit
[1996]

32
Total Cl- (% cement wt)
Free Cl- [Cl-]/[OH-] Composition
of binder Environment Specimen w/b
Chloride introduction
Condition of steel
Detection of corrosion onset
Reference
1.0 – 1.5 OPC with
GGBS or FA laboratory, exposed to air concrete
0.5 – 0.7
mixed-in/diffusion
ribbed macrocell current Schiessl and Breit
[1996]
0.2 – 0.65 OPC with 15%
to 50% FA outdoor exposure, tidal zone
(marine exposure) concrete
0.32 –
0.68
capillary suction and
diffusion ribbed weight loss
Thomas et al. [1996]
0.44 – 0.65
mole/l 100% OPC laboratory, submerged mortar 0.75
capillary suction and
diffusion not reported potential
Elsener et al. [1997]
0.056 mole/l
0.26 - laboratory, submerged synthetic
pore solution - in solution cleaned
potentiostatic control
Breit [1998]
0.25 – 0.75
100% OPC, 100% SRPC
and OPC with SF, FA or
GGBS.
laboratory, submerged mortar 0.5 – 0.6
diffusion smooth potentiosta ic control, visual
inspection Breit [1998]
0.4 – 1.5 100% SRPC or SRPC with FA, SF and GGBS
outdoor exposure (seawater) concrete 0.3 – 0.75
diffusion ribbed, as recieved
potential, LPR, galvanostatic
pulse Sandberg [1998]
1.24 – 3.08 0.39 – 1.16 % cem wt
1.17 – 3.98 100% OPC laboratory, 100% RH mortar 0.5 mixed-in ribbed and
smooth LPR, potential
Alonso et al. [2000]
0.7 – 1.7 - laboratory, oxygen supply Synthetic
pore solution - in solution
sandblasted, cleaned
potential, macro-cell current
Zimmermann et al. [2000]
0.25 – 1.25 0.045 –
0.55 mole/l
100% OPC laboratory, exposed to air mortar 0.6 capillary
suc-tion/diffusion
sandblasted, cleaned
potential, macro-cell current
Zimmermann et al. [2000]
0.2 – 0.4 100% OPC outdoor exposure concrete - diffusion - macrocell current Zimmermann
[2000]
0.01 – 2.5 - laboratory, submerged alkaline
solutions - in solution
as received, sandblasted, pre-rusted
Potential, EIS Li and Sagüés
[2001]
0.73 0.50 % cem wt
1.76±0.3 OPC, SRPC,
FA laboratory submerged mortar 0.5 diffusion
ribbed, millscaled
Potentiostatic control
Alonso et al. [2002]
0.23 0.36
mole/l 1.5 100% SRPC laboratory, exposed to air mortar 0.37 diffusion ribbed LPR, potenital
Castellote et al. [2002]
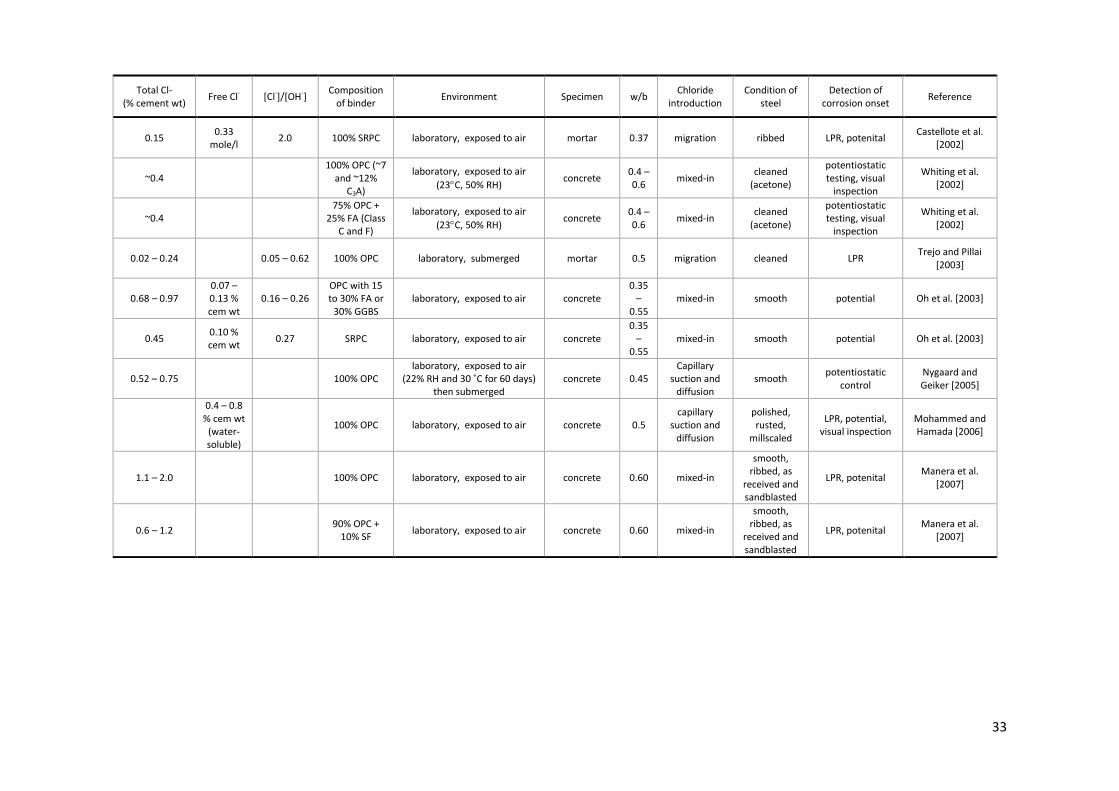
33
Total Cl- (% cement wt)
Free Cl- [Cl-]/[OH-] Composition
of binder Environment Specimen w/b
Chloride introduction
Condition of steel
Detection of corrosion onset
Reference
0.15 0.33
mole/l 2.0 100% SRPC laboratory, exposed to air mortar 0.37 migration ribbed LPR, potenital
Castellote et al. [2002]
~0.4 100% OPC (~7
and ~12% C3A)
laboratory, exposed to air
(23C, 50% RH) concrete
0.4 – 0.6
mixed-in cleaned
(acetone)
potentiostatic testing, visual
inspection
Whiting et al. [2002]
~0.4 75% OPC +
25% FA (Class C and F)
laboratory, exposed to air
(23C, 50% RH) concrete
0.4 – 0.6
mixed-in cleaned
(acetone)
potentiostatic testing, visual
inspection
Whiting et al. [2002]
0.02 – 0.24 0.05 – 0.62 100% OPC laboratory, submerged mortar 0.5 migration cleaned LPR Trejo and Pillai
[2003]
0.68 – 0.97 0.07 – 0.13 % cem wt
0.16 – 0.26 OPC with 15 to 30% FA or
30% GGBS laboratory, exposed to air concrete
0.35 –
0.55 mixed-in smooth potential Oh et al. [2003]
0.45 0.10 % cem wt
0.27 SRPC laboratory, exposed to air concrete 0.35
– 0.55
mixed-in smooth potential Oh et al. [2003]
0.52 – 0.75 100% OPC laboratory, exposed to air
(22% RH and 30 ˚C for 60 days) then submerged
concrete 0.45 Capillary
suction and diffusion
smooth potentiostatic
control Nygaard and Geiker [2005]
0.4 – 0.8 % cem wt
(water-soluble)
100% OPC laboratory, exposed to air concrete 0.5 capillary
suction and diffusion
polished, rusted,
millscaled
LPR, potential, visual inspection
Mohammed and Hamada [2006]
1.1 – 2.0 100% OPC laboratory, exposed to air concrete 0.60 mixed-in
smooth, ribbed, as
received and sandblasted
LPR, potenital Manera et al.
[2007]
0.6 – 1.2 90% OPC +
10% SF laboratory, exposed to air concrete 0.60 mixed-in
smooth, ribbed, as
received and sandblasted
LPR, potenital Manera et al.
[2007]