Embed Size (px)
Citation preview
1
CHOICE OF INCOME GENERATING ACTIVITIES BY NEPALESE
FARMERS
Vivek Gupta1
Tej Gautam
Basu D. Bhandari2
1 Gupta and Gautam are Graduate Student in the Department of Agricultural Economics and Agribusiness LSU, Baton Rouge, LA 2 Bhandari is Post Doc. Fellow in the department of Agricultural Economics and Agribusiness, LSU
Corresponding author: Tej Gautam ([email protected])
2
CHOICE OF INCOME GENERATING ACTIVITIES BY NEPALESE
FARMERS
Abstract: Income generating activities play a vital role to improve the livelihood of rural people in developing countries. International donor agencies and national policy makers would like to see subsistence farming transformed into commercial agriculture to enhance the well beings of people in developing countries. In Nepal for the last two decades or so, farmers are incorporating income generating activities in subsistent farming systems. Most popular income generating activities include mushroom cultivation, sericulture, apiculture, and fish culture. Our objective in this paper is to use a multinomial logit model to determine the factors affecting the choice of income generating activities by Nepalese farmers. Some of the important explanatory variables used in this model are availability of water, inputs (such as seeds and disinfectants), technology, and market accessibility. We use 2012 census data available from the Agricultural Census of Nepal to conduct this analysis. Preliminary results indicated that availability of inputs and accessibility to markets are the major determinants in selecting income generation activities. The outcome of this study may help to promote ideal income generating activities for the benefit of rural farmers in Nepal or other developing countries. Keywords: subsistence farming, commercial agriculture, cash crops
3
1. Introduction
Farming is more than just another avenue of employment for farmers in developing
countries. It is a way of life. In fact, for most of these subsistence farmers, agricultural
activity is enmeshed in their very ethos of life; which is why the structural transformation
of an economy from traditional agriculture to modern industrialization is a lot more
challenging than it seems at the outset. In the literature on peasants, explanations of peasant
behavior have often been sought in the specificity of their motives, postulating that
peasants are not utility maximizers, by difference with other households, but are motivated
instead by the satisfaction of their needs or by the desire to ensure ‘simple
production’(Vergopoulos 1978). While it may be true that subsistence farmers in
developing countries aspire towards income growth and material well-being, food self-
sufficiency and income security may be more compelling and immediately pertinent issues
for them.
Nepalese Agriculture is in a low development stage. The sector still has more than
two-thirds of the population engaged in agriculture, productivity and competitiveness of
the sector are low, adoption of improved technology is fettered and even though most
cultivated area is devoted to cereals, food trade deficit and malnutrition has been growing.
Some subsectors such as dairy processing, poultry, tea, vegetable seed and fisheries show
dynamism, but overall, these favorable indicators are not yet sufficient to ameliorate a large
number of people engaged in agriculture out of poverty and make a significant contribution
in reducing malnutrition and ensure food security of the Himalayan nation. When the long-
term agricultural strategic plan known as the Agriculture Perspective Plan (APP) was
launched in 1995-96, the Nepalese agricultural sector was performing much worse than
4
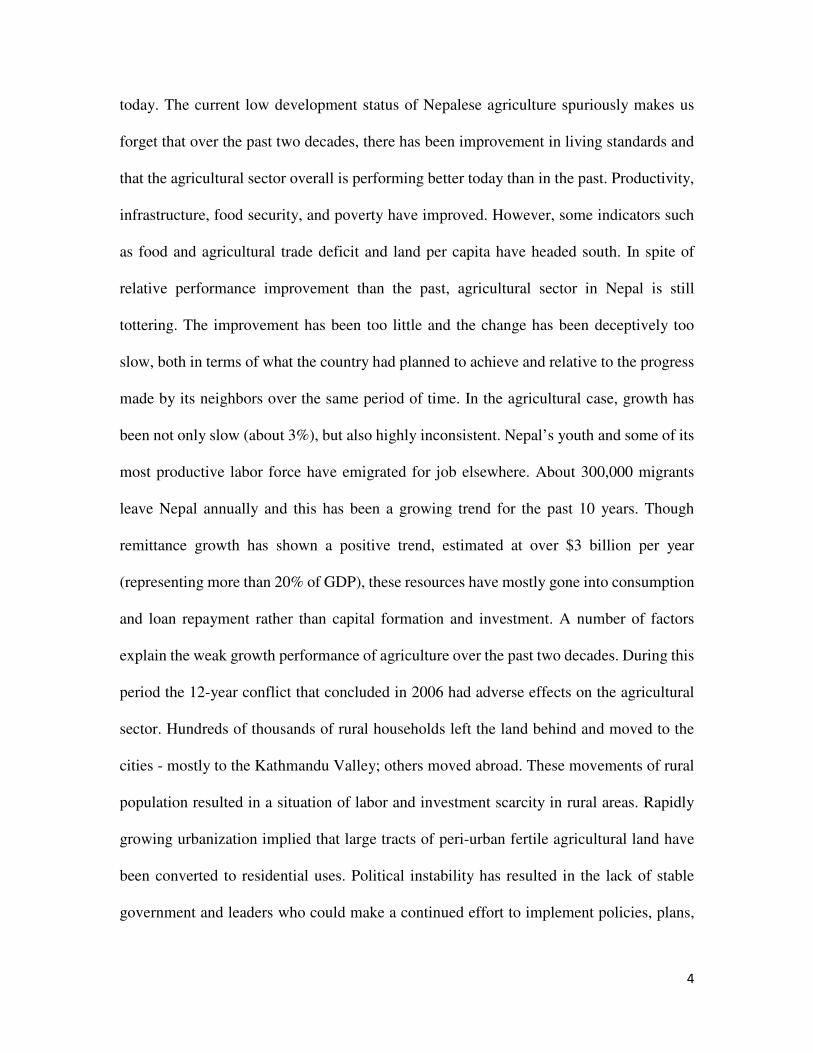
today. The current low development status of Nepalese agriculture spuriously makes us
forget that over the past two decades, there has been improvement in living standards and
that the agricultural sector overall is performing better today than in the past. Productivity,
infrastructure, food security, and poverty have improved. However, some indicators such
as food and agricultural trade deficit and land per capita have headed south. In spite of
relative performance improvement than the past, agricultural sector in Nepal is still
tottering. The improvement has been too little and the change has been deceptively too
slow, both in terms of what the country had planned to achieve and relative to the progress
made by its neighbors over the same period of time. In the agricultural case, growth has
been not only slow (about 3%), but also highly inconsistent. Nepal’s youth and some of its
most productive labor force have emigrated for job elsewhere. About 300,000 migrants
leave Nepal annually and this has been a growing trend for the past 10 years. Though
remittance growth has shown a positive trend, estimated at over $3 billion per year
(representing more than 20% of GDP), these resources have mostly gone into consumption
and loan repayment rather than capital formation and investment. A number of factors
explain the weak growth performance of agriculture over the past two decades. During this
period the 12-year conflict that concluded in 2006 had adverse effects on the agricultural
sector. Hundreds of thousands of rural households left the land behind and moved to the
cities - mostly to the Kathmandu Valley; others moved abroad. These movements of rural
population resulted in a situation of labor and investment scarcity in rural areas. Rapidly
growing urbanization implied that large tracts of peri-urban fertile agricultural land have
been converted to residential uses. Political instability has resulted in the lack of stable
government and leaders who could make a continued effort to implement policies, plans,
5
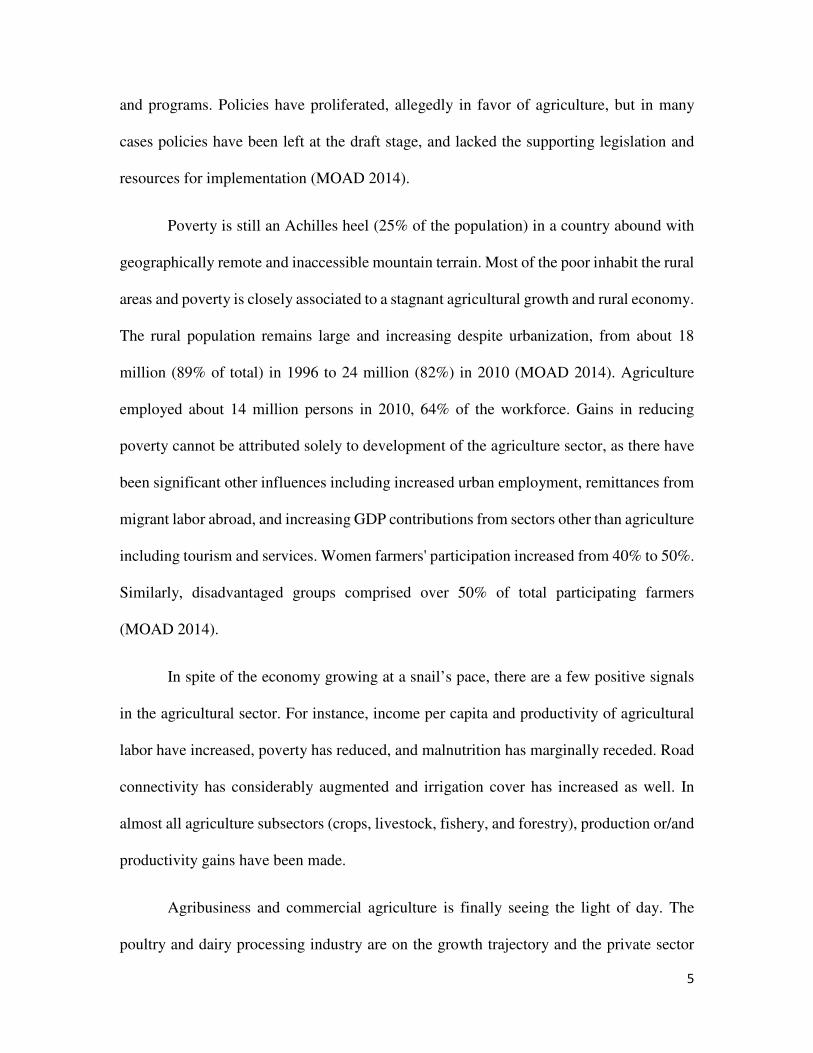
and programs. Policies have proliferated, allegedly in favor of agriculture, but in many
cases policies have been left at the draft stage, and lacked the supporting legislation and
resources for implementation (MOAD 2014).
Poverty is still an Achilles heel (25% of the population) in a country abound with
geographically remote and inaccessible mountain terrain. Most of the poor inhabit the rural
areas and poverty is closely associated to a stagnant agricultural growth and rural economy.
The rural population remains large and increasing despite urbanization, from about 18
million (89% of total) in 1996 to 24 million (82%) in 2010 (MOAD 2014). Agriculture
employed about 14 million persons in 2010, 64% of the workforce. Gains in reducing
poverty cannot be attributed solely to development of the agriculture sector, as there have
been significant other influences including increased urban employment, remittances from
migrant labor abroad, and increasing GDP contributions from sectors other than agriculture
including tourism and services. Women farmers' participation increased from 40% to 50%.
Similarly, disadvantaged groups comprised over 50% of total participating farmers
(MOAD 2014).
In spite of the economy growing at a snail’s pace, there are a few positive signals
in the agricultural sector. For instance, income per capita and productivity of agricultural
labor have increased, poverty has reduced, and malnutrition has marginally receded. Road
connectivity has considerably augmented and irrigation cover has increased as well. In
almost all agriculture subsectors (crops, livestock, fishery, and forestry), production or/and
productivity gains have been made.
Agribusiness and commercial agriculture is finally seeing the light of day. The
poultry and dairy processing industry are on the growth trajectory and the private sector
6
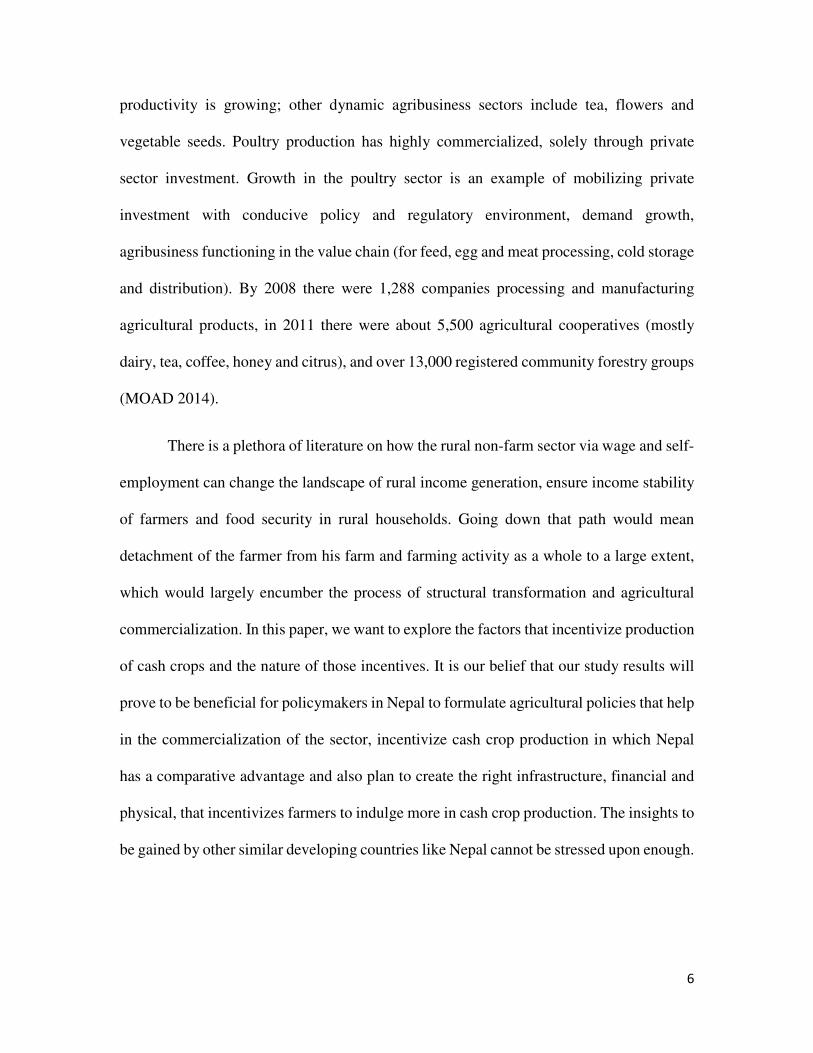
productivity is growing; other dynamic agribusiness sectors include tea, flowers and
vegetable seeds. Poultry production has highly commercialized, solely through private
sector investment. Growth in the poultry sector is an example of mobilizing private
investment with conducive policy and regulatory environment, demand growth,
agribusiness functioning in the value chain (for feed, egg and meat processing, cold storage
and distribution). By 2008 there were 1,288 companies processing and manufacturing
agricultural products, in 2011 there were about 5,500 agricultural cooperatives (mostly
dairy, tea, coffee, honey and citrus), and over 13,000 registered community forestry groups
(MOAD 2014).
There is a plethora of literature on how the rural non-farm sector via wage and self-
employment can change the landscape of rural income generation, ensure income stability
of farmers and food security in rural households. Going down that path would mean
detachment of the farmer from his farm and farming activity as a whole to a large extent,
which would largely encumber the process of structural transformation and agricultural
commercialization. In this paper, we want to explore the factors that incentivize production
of cash crops and the nature of those incentives. It is our belief that our study results will
prove to be beneficial for policymakers in Nepal to formulate agricultural policies that help
in the commercialization of the sector, incentivize cash crop production in which Nepal
has a comparative advantage and also plan to create the right infrastructure, financial and
physical, that incentivizes farmers to indulge more in cash crop production. The insights to
be gained by other similar developing countries like Nepal cannot be stressed upon enough.
7
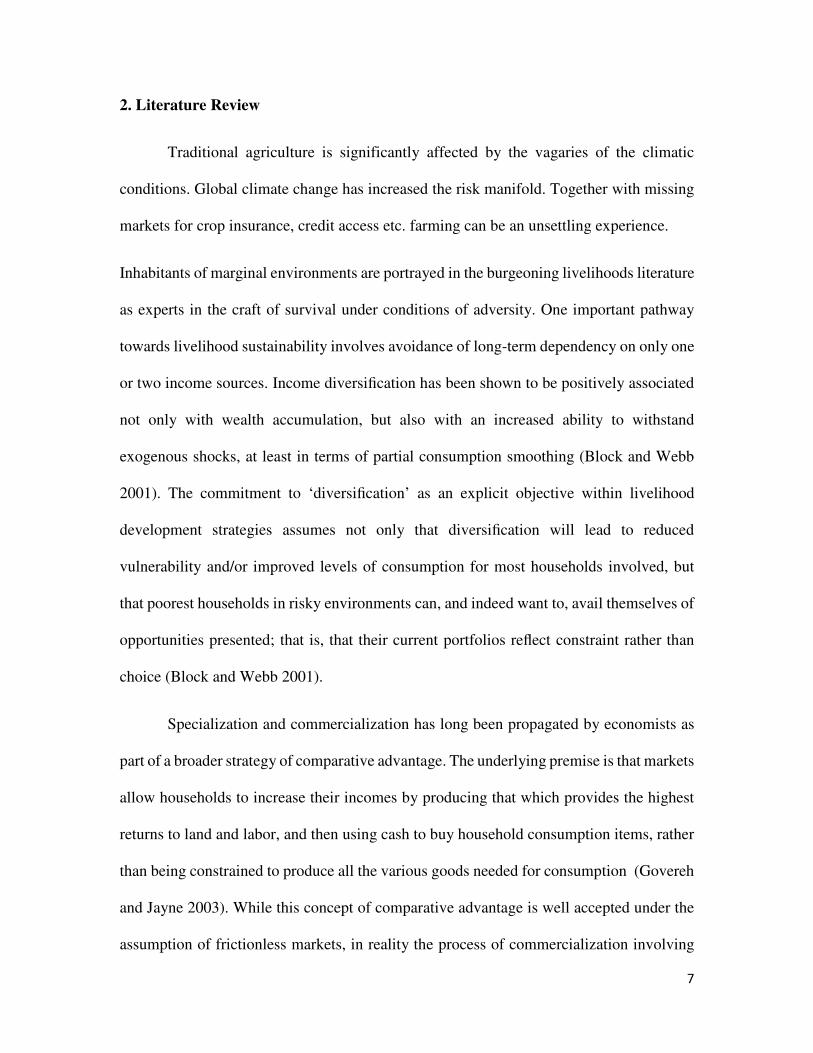
2. Literature Review
Traditional agriculture is significantly affected by the vagaries of the climatic
conditions. Global climate change has increased the risk manifold. Together with missing
markets for crop insurance, credit access etc. farming can be an unsettling experience.
Inhabitants of marginal environments are portrayed in the burgeoning livelihoods literature
as experts in the craft of survival under conditions of adversity. One important pathway
towards livelihood sustainability involves avoidance of long-term dependency on only one
or two income sources. Income diversification has been shown to be positively associated
not only with wealth accumulation, but also with an increased ability to withstand
exogenous shocks, at least in terms of partial consumption smoothing (Block and Webb
2001). The commitment to ‘diversification’ as an explicit objective within livelihood
development strategies assumes not only that diversification will lead to reduced
vulnerability and/or improved levels of consumption for most households involved, but
that poorest households in risky environments can, and indeed want to, avail themselves of
opportunities presented; that is, that their current portfolios reflect constraint rather than
choice (Block and Webb 2001).
Specialization and commercialization has long been propagated by economists as
part of a broader strategy of comparative advantage. The underlying premise is that markets
allow households to increase their incomes by producing that which provides the highest
returns to land and labor, and then using cash to buy household consumption items, rather
than being constrained to produce all the various goods needed for consumption (Govereh
and Jayne 2003). While this concept of comparative advantage is well accepted under the
assumption of frictionless markets, in reality the process of commercialization involving
8
non-food cash crops can be slowed down by risks and costs in the food marketing system.
Food market failures give rise to the well-understood non-separability of household
production and consumption decisions, which accounts for the potential breakdown of
agricultural commercialization strategies based on comparative advantage (Govereh and
Jayne 2003).
In many developing countries, cash crops have been observed to be highly involved
with international markets while the nature of food markets remain local. Food market
integration would reduce price variance and the correlation between individual and
aggregate output. It is also likely to increase the market price elasticity of food demand and
to decrease the correlation between crop revenues (Fafchamps 1992). Concurrently,
however, improving food productivity has limited potential for agricultural growth if food
markets are not better integrated.(Fafchamps 1992)
During incipient agricultural transformation, it is likely, therefore, that
diversification levels are similar between different aggregation levels because each region
has to grow crops its residents want to consume due to the absence of well-developed
agricultural produce markets. As rural markets develop, however, the discrepancy between
the market price of a commodity and its decision price at the farm level is reduced. To put
it differently, the development of rural markets is a process which allows farmers to adopt
production choices that reflect their comparative advantages more closely, contributing to
productivity improvement at the aggregate level evaluated at common, market prices. If
this development occurs, production at a less aggregate level could be less diverse than that
at a more aggregate level. Initially, when some produce markets are thin with volatile prices
and insurance markets are incomplete, farm households may participate in produce markets
9
only marginally. As their constraints on consumption smoothing are eliminated, however,
they may increase their production of lucrative crops (Kurosaki and Fafchamps 2002).
Similarly, development of rural labor markets enables farmers to grow more market-
oriented crops through the reduction of constraints on family labor endowments (De
Janvry, Fafchamps et al. 1991).
Quantitative results produced by (Kurosaki 2003) indicate that, first, cropping
patterns of a traditional and subsistence agriculture changed substantially over the period
with rising concentration of crop acreage in districts with higher and growing productivity,
which contributed to the improvement in land productivity at the aggregate level. This
change is therefore consistent with crop shifts reflecting static and dynamic comparative
advantage. Second, the crop diversification level also changed as the cropping patterns
changed.
Diversification is definitely being accepted in the literature as a norm. Very few
people collect all their income from any one source, hold all their wealth in the form of any
single asset, or use their assets in just one activity, which conforms to the notion on not
keeping all your eggs in the same basket. Multiple motives drive households and
individuals to diversify assets, incomes, and activities. The first set of motives comprise
what are traditionally termed “push factors”: risk reduction, response to diminishing factor
returns in any given use, such as family labor supply in the presence of land constraints
driven by population pressure and fragmented landholdings, reaction to crisis or liquidity
constraints, high transactions costs that induce households to self-provision in several
goods and services, etc. The second set of motives comprise “pull factors”: realization of
strategic complementarities between activities, such as crop-livestock integration or
10
milling and hog production, specialization according to comparative advantage accorded
by superior technologies, skills or endowments, etc. These micro level determinants of
diversification are mirrored at more aggregate levels. From the “push factor perspective”,
diversification is driven by limited risk bearing capacity in the presence of incomplete or
weak financial systems that create strong incentives to select a portfolio of activities in
order to stabilize income flows and consumption, by constraints in labor and land markets,
and by climatic uncertainty. From the “pull factor perspective”, local engines of growth
such as commercial agriculture or proximity to an urban area create opportunities for
income diversification in production- and expenditure-linkage activities.(Barrett, Reardon
et al. 2001)
Individuals own assets, some of which (non-productive assets, such as household
valuables) generate “unearned” income directly and others of which (productive assets,
such as human capital, land, livestock) generate “earned” income only indirectly through
their allocation to activities such as farming, weaving or commerce (Barrett, Reardon et al.
2001). Assets, activities, and income are thus complementary measures in the study of
diversification behaviors. Income as a metric is of particular interest because of it can be
interpreted in terms of a welfare outcome. But it can be difficult to distinguish (constrained)
choice from chance in income draws. Assets offer a store of wealth as well as sources of
income, and portfolio theory focuses on asset allocation (Barrett, Reardon et al. 2001).
11
3. Data Source and Description
This study uses data from the National Census of Agriculture Nepal 2011-12
conducted and prepared by the Central Bureau of Statistics (CBS). The first National
Sample Census of Agriculture was conducted in 1961/62 and since then, CBS has given
continuity to this operation. The sampling frame used for the agriculture census is
basically derived from the household schedule of the National Population and Housing
Census 2011 which contains information about the holdings of agricultural land,
household information, crop information and livestock as well. The sample census was
carried across all 75 districts of Nepal. The sample does not include
corporate/commercial farmers and the identification of an agricultural household was
done under desired criterion as per geographical location.
For this study we used the variables mentioned in table 1
12
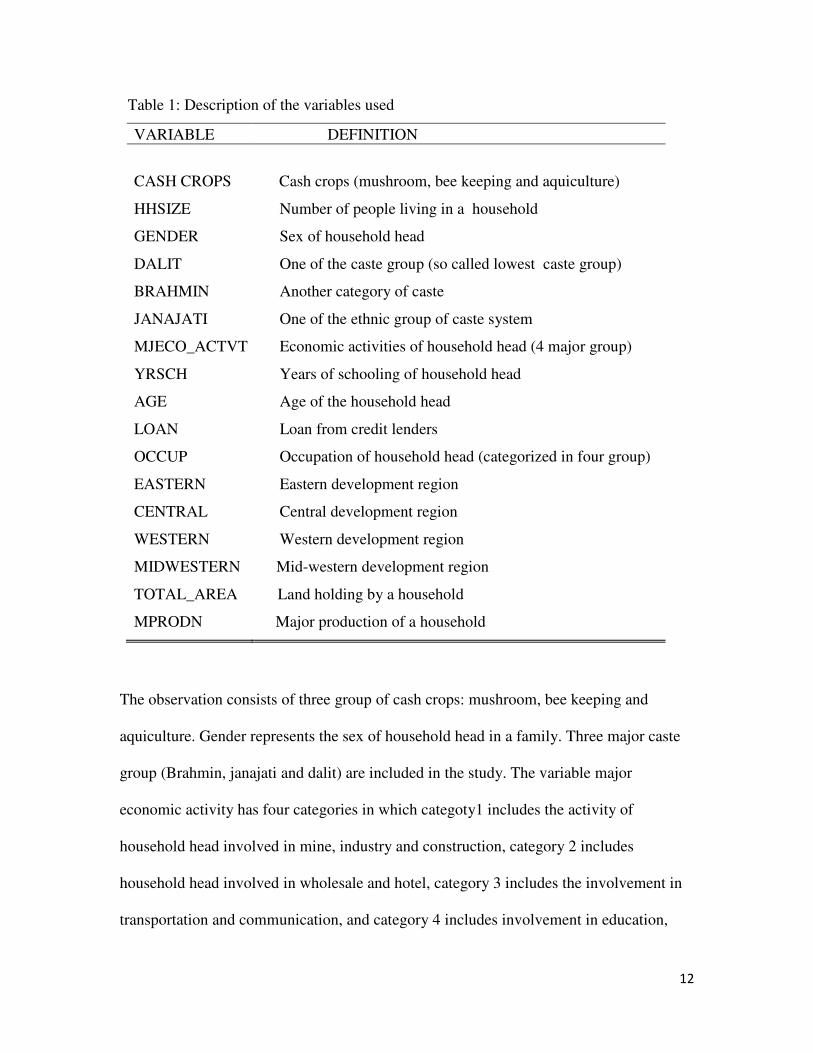
Table 1: Description of the variables used
VARIABLE DEFINITION
CASH CROPS Cash crops (mushroom, bee keeping and aquiculture)
HHSIZE Number of people living in a household
GENDER Sex of household head
DALIT One of the caste group (so called lowest caste group)
BRAHMIN Another category of caste
JANAJATI One of the ethnic group of caste system
MJECO_ACTVT Economic activities of household head (4 major group)
YRSCH Years of schooling of household head
AGE Age of the household head
LOAN Loan from credit lenders
OCCUP Occupation of household head (categorized in four group)
EASTERN Eastern development region
CENTRAL Central development region
WESTERN Western development region
MIDWESTERN Mid-western development region
TOTAL_AREA Land holding by a household
MPRODN Major production of a household
The observation consists of three group of cash crops: mushroom, bee keeping and
aquiculture. Gender represents the sex of household head in a family. Three major caste
group (Brahmin, janajati and dalit) are included in the study. The variable major
economic activity has four categories in which categoty1 includes the activity of
household head involved in mine, industry and construction, category 2 includes
household head involved in wholesale and hotel, category 3 includes the involvement in
transportation and communication, and category 4 includes involvement in education,
13
health and social work. Similarly, we categorized occupation into four major groups
(agricultural sector, government work, business and technician/ expert). Major production
sectors are cereal, livestock, fruit/vegetable and bird. Years of schooling represents the
highest level of education completed by household head.
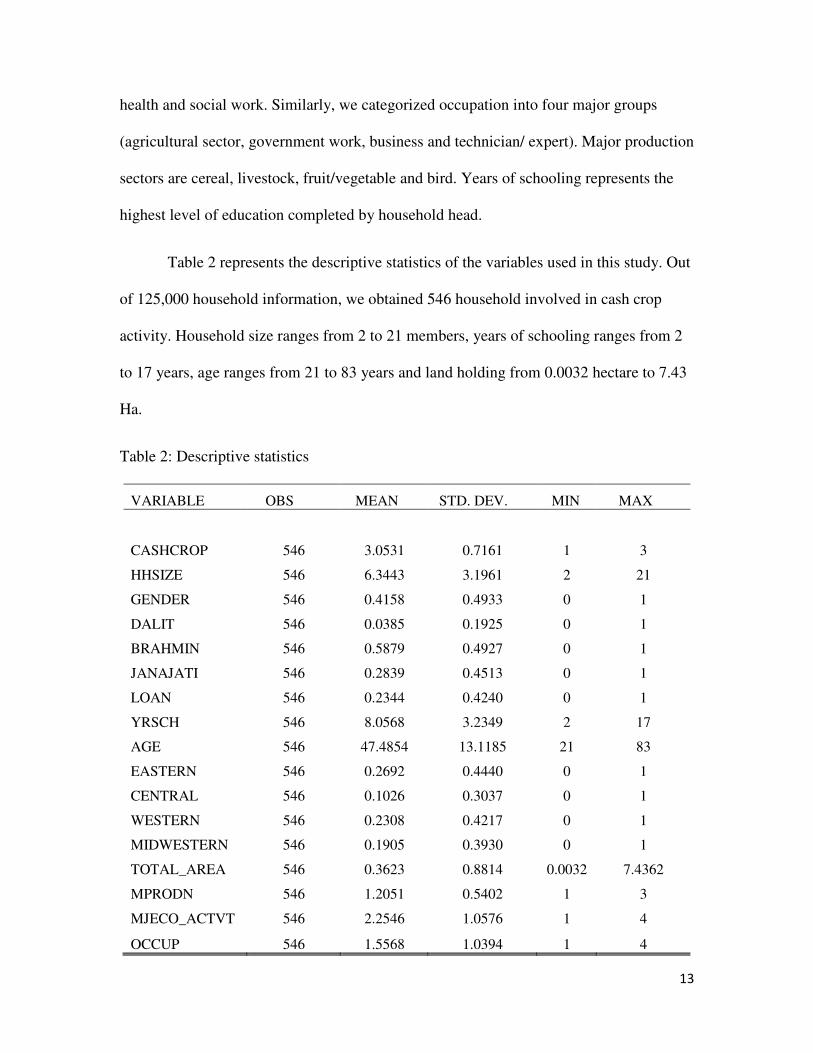
Table 2 represents the descriptive statistics of the variables used in this study. Out
of 125,000 household information, we obtained 546 household involved in cash crop
activity. Household size ranges from 2 to 21 members, years of schooling ranges from 2
to 17 years, age ranges from 21 to 83 years and land holding from 0.0032 hectare to 7.43
Ha.
Table 2: Descriptive statistics
VARIABLE OBS MEAN STD. DEV. MIN MAX
CASHCROP 546 3.0531 0.7161 1 3
HHSIZE 546 6.3443 3.1961 2 21
GENDER 546 0.4158 0.4933 0 1
DALIT 546 0.0385 0.1925 0 1
BRAHMIN 546 0.5879 0.4927 0 1
JANAJATI 546 0.2839 0.4513 0 1
LOAN 546 0.2344 0.4240 0 1
YRSCH 546 8.0568 3.2349 2 17
AGE 546 47.4854 13.1185 21 83
EASTERN 546 0.2692 0.4440 0 1
CENTRAL 546 0.1026 0.3037 0 1
WESTERN 546 0.2308 0.4217 0 1
MIDWESTERN 546 0.1905 0.3930 0 1
TOTAL_AREA 546 0.3623 0.8814 0.0032 7.4362
MPRODN 546 1.2051 0.5402 1 3
MJECO_ACTVT 546 2.2546 1.0576 1 4
OCCUP 546 1.5568 1.0394 1 4
14
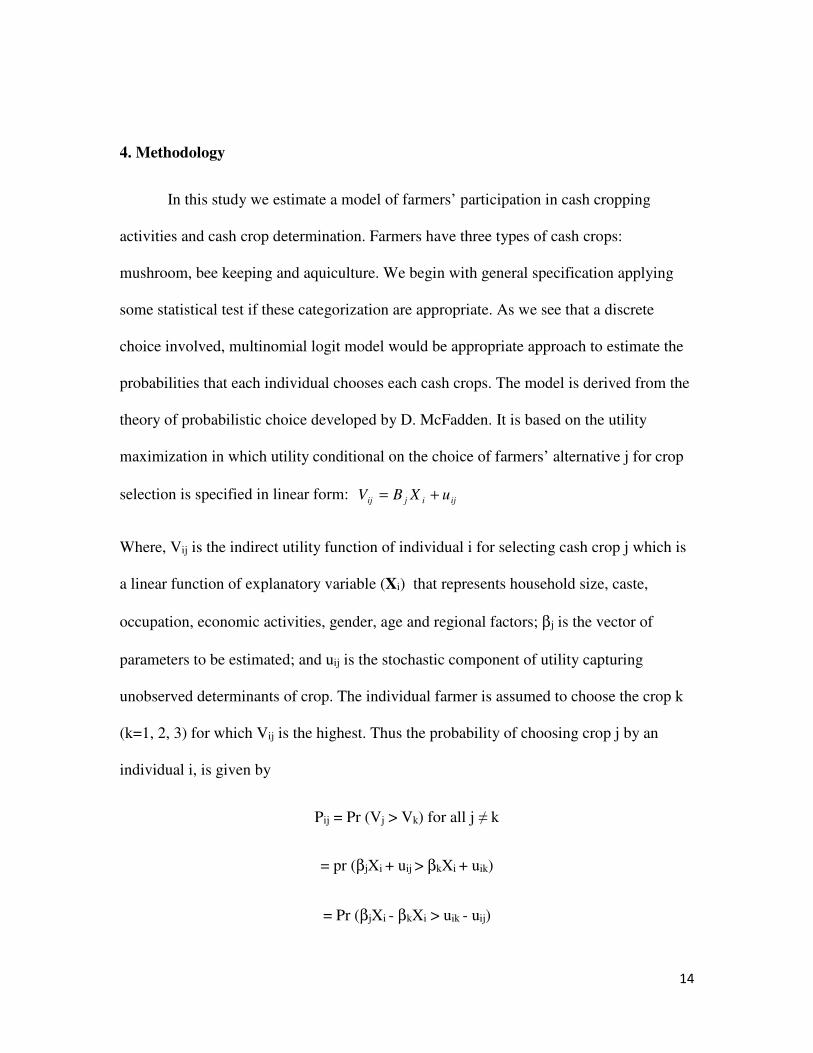
4. Methodology
In this study we estimate a model of farmers’ participation in cash cropping
activities and cash crop determination. Farmers have three types of cash crops:
mushroom, bee keeping and aquiculture. We begin with general specification applying
some statistical test if these categorization are appropriate. As we see that a discrete
choice involved, multinomial logit model would be appropriate approach to estimate the
probabilities that each individual chooses each cash crops. The model is derived from the
theory of probabilistic choice developed by D. McFadden. It is based on the utility
maximization in which utility conditional on the choice of farmers’ alternative j for crop
selection is specified in linear form: ijijij uXBV +=
Where, Vij is the indirect utility function of individual i for selecting cash crop j which is
a linear function of explanatory variable (Xi) that represents household size, caste,
occupation, economic activities, gender, age and regional factors; βj is the vector of
parameters to be estimated; and uij is the stochastic component of utility capturing
unobserved determinants of crop. The individual farmer is assumed to choose the crop k
(k=1, 2, 3) for which Vij is the highest. Thus the probability of choosing crop j by an
individual i, is given by
Pij = Pr (Vj > Vk) for all j ≠ k
= pr (βjXi + uij > βkXi + uik)
= Pr (βjXi - βkXi > uik - uij)
15
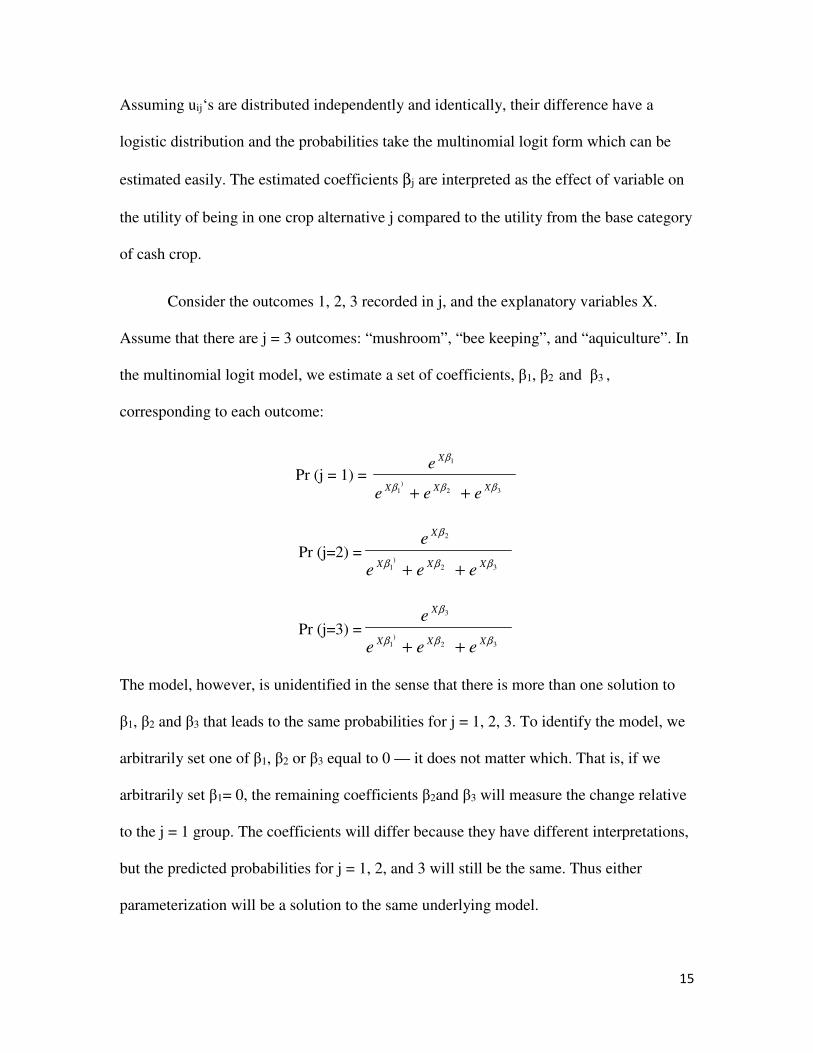
Assuming uij‘s are distributed independently and identically, their difference have a
logistic distribution and the probabilities take the multinomial logit form which can be
estimated easily. The estimated coefficients βj are interpreted as the effect of variable on
the utility of being in one crop alternative j compared to the utility from the base category
of cash crop.
Consider the outcomes 1, 2, 3 recorded in j, and the explanatory variables X.
Assume that there are j = 3 outcomes: “mushroom”, “bee keeping”, and “aquiculture”. In
the multinomial logit model, we estimate a set of coefficients, β1, β2 and β3 ,
corresponding to each outcome:
Pr (j = 1) = 32
)1
1
βββ
β
XXX
X
eee
e
++
Pr (j=2) =32
)1
2
βββ
β
XXX
X
eee
e
++
Pr (j=3) =32
)1
3
βββ
β
XXX
X
eee
e
++
The model, however, is unidentified in the sense that there is more than one solution to
β1, β2 and β3 that leads to the same probabilities for j = 1, 2, 3. To identify the model, we
arbitrarily set one of β1, β2 or β3 equal to 0 — it does not matter which. That is, if we
arbitrarily set β1= 0, the remaining coefficients β2and β3 will measure the change relative
to the j = 1 group. The coefficients will differ because they have different interpretations,
but the predicted probabilities for j = 1, 2, and 3 will still be the same. Thus either
parameterization will be a solution to the same underlying model.
16
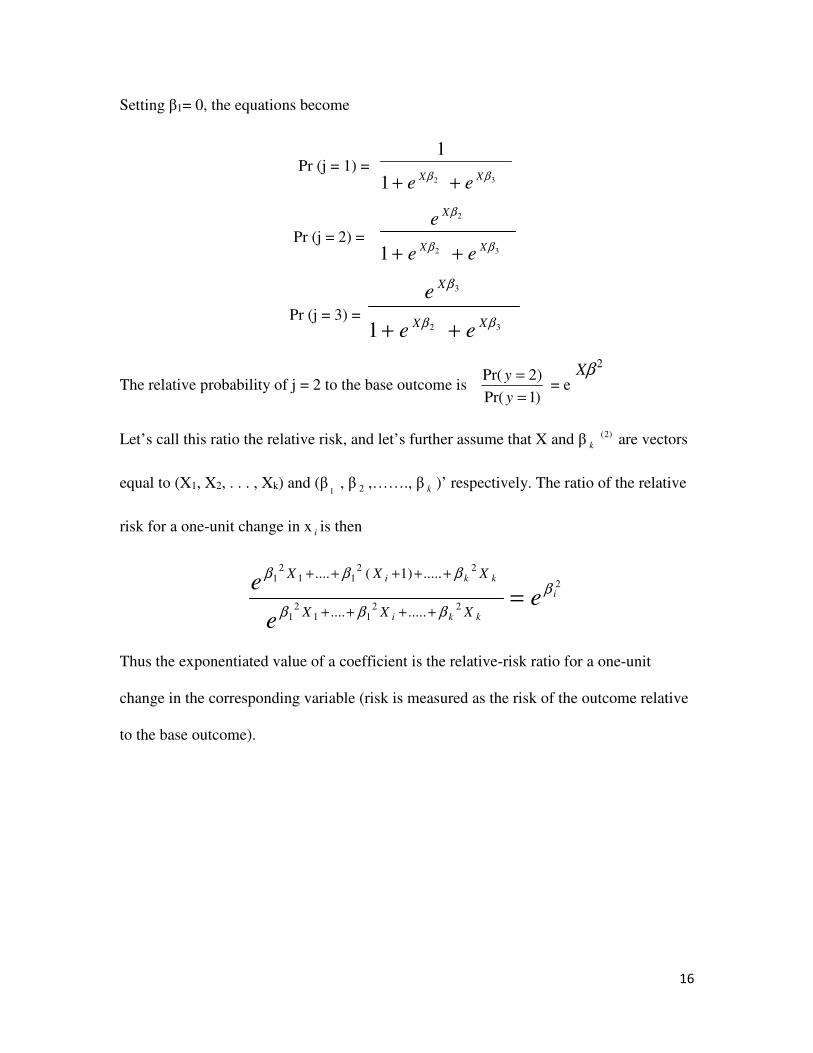
Setting β1= 0, the equations become
Pr (j = 1) = 321
1
ββ XXee ++
Pr (j = 2) = 32
2
1 ββ
β
XX
X
ee
e
++
Pr (j = 3) = 32
3
1 ββ
β
XX
X
ee
e
++
The relative probability of j = 2 to the base outcome is )1Pr(
)2Pr(
=
=
y
y = e
2βX
Let’s call this ratio the relative risk, and let’s further assume that X and β k
)2( are vectors
equal to (X1, X2, . . . , Xk) and (β1
, β 2 ,……., β k )’ respectively. The ratio of the relative
risk for a one-unit change in x i is then
2
2211
21
2211
21
.........
.....)1(....
i
kki
kki
ee
eXXX
XXXβ
βββ
βββ
=++++
+++++
Thus the exponentiated value of a coefficient is the relative-risk ratio for a one-unit
change in the corresponding variable (risk is measured as the risk of the outcome relative
to the base outcome).
17
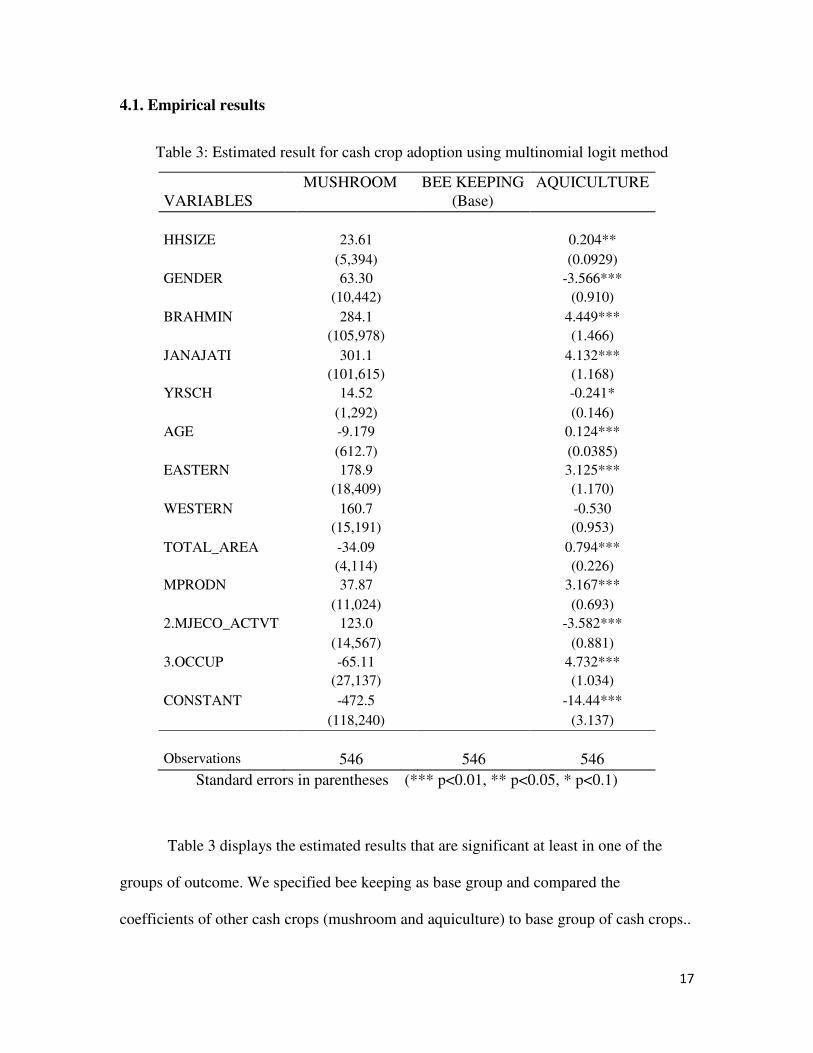
4.1. Empirical results
Table 3: Estimated result for cash crop adoption using multinomial logit method
MUSHROOM BEE KEEPING AQUICULTURE VARIABLES (Base)
HHSIZE 23.61 0.204**
(5,394) (0.0929)
GENDER 63.30 -3.566***
(10,442) (0.910)
BRAHMIN 284.1 4.449***
(105,978) (1.466)
JANAJATI 301.1 4.132***
(101,615) (1.168)
YRSCH 14.52 -0.241*
(1,292) (0.146)
AGE -9.179 0.124***
(612.7) (0.0385)
EASTERN 178.9 3.125***
(18,409) (1.170)
WESTERN 160.7 -0.530
(15,191) (0.953)
TOTAL_AREA -34.09 0.794***
(4,114) (0.226)
MPRODN 37.87 3.167***
(11,024) (0.693)
2.MJECO_ACTVT 123.0 -3.582***
(14,567) (0.881)
3.OCCUP -65.11 4.732***
(27,137) (1.034)
CONSTANT -472.5 -14.44***
(118,240) (3.137)
Observations 546 546 546
Standard errors in parentheses (*** p<0.01, ** p<0.05, * p<0.1)
Table 3 displays the estimated results that are significant at least in one of the
groups of outcome. We specified bee keeping as base group and compared the
coefficients of other cash crops (mushroom and aquiculture) to base group of cash crops..
18
For aquiculture outcomes, gender coefficient indicates that the multinomial logit for male
relative to female is 3.56 unit lower for being in aquiculture compared to bee- keeping
given all other predictor variables are held constant. One unit increase in household size,
the multinomial log- odds for choosing aquiculture compared to bee- keeping would
expected to increase by 0.204 unit. Similarly, one more year of age, the multinomial
logit- odds for choosing aquiculture compared to bee- keeping would expect to increase
by 0.124. In the case of caste, one unit increase in Brahmin and janajati, the multinomial
logit- odds for choosing aquiculture compared to bee- keeping would expect to increase
by 4.44 and 4.13 units respectively. Likewise, major economic activity2(whole sale and
hotel work) would expected to decrease for choosing aquiculture compared to bee-
keeping but the multinomial log- odds of choosing aquiculture for occupation category
3(business) would expected to increase by 4.73 units.
None of the coefficients in “mushroom” are statistically significant and hence
does not make any sense to compare to base group. Further evaluation in data file is
required. We plan to figure out the problem later on and report the result in reasonable
form.
19
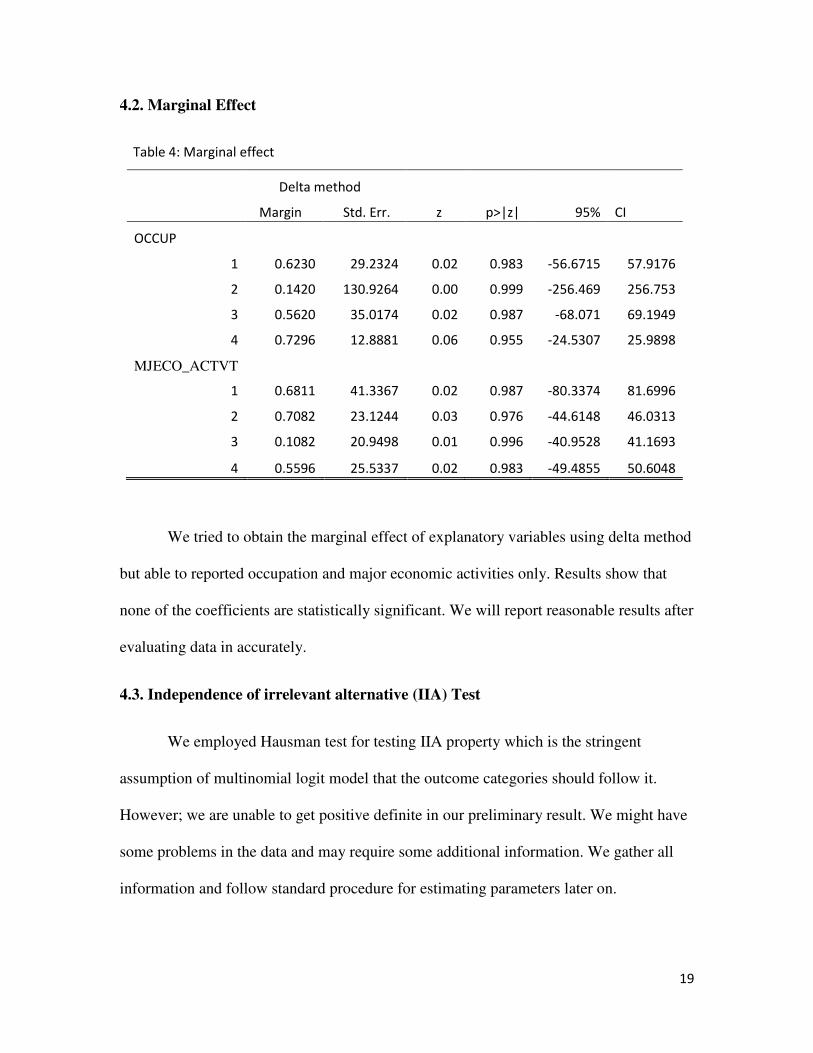
4.2. Marginal Effect
Table 4: Marginal effect
Delta method
Margin Std. Err. z p>|z| 95% CI
OCCUP
1 0.6230 29.2324 0.02 0.983 -56.6715 57.9176
2 0.1420 130.9264 0.00 0.999 -256.469 256.753
3 0.5620 35.0174 0.02 0.987 -68.071 69.1949
4 0.7296 12.8881 0.06 0.955 -24.5307 25.9898
MJECO_ACTVT
1 0.6811 41.3367 0.02 0.987 -80.3374 81.6996
2 0.7082 23.1244 0.03 0.976 -44.6148 46.0313
3 0.1082 20.9498 0.01 0.996 -40.9528 41.1693
4 0.5596 25.5337 0.02 0.983 -49.4855 50.6048
We tried to obtain the marginal effect of explanatory variables using delta method
but able to reported occupation and major economic activities only. Results show that
none of the coefficients are statistically significant. We will report reasonable results after
evaluating data in accurately.
4.3. Independence of irrelevant alternative (IIA) Test
We employed Hausman test for testing IIA property which is the stringent
assumption of multinomial logit model that the outcome categories should follow it.
However; we are unable to get positive definite in our preliminary result. We might have
some problems in the data and may require some additional information. We gather all
information and follow standard procedure for estimating parameters later on.

20
5. Future work
In our initial phase of this study, some of the information regarding household
characteristics such as income, technology adoption, access to market, and extension
service are missing. We will get enough information that affects cash crop selection.
Then we will go through an intensive empirical work that includes testing for IIA, getting
marginal effect of each variables, relative risk ratio and model fit. We will test the
hypothesis in each step wherever required to maintain the consistency regarding model
fit. After those steps, we will be able to report reliable results and be able to interpret the
parameters correctly and then will suggest policy implication regarding the cash crop
selection among the farmers. We will follow standard procedure of multinomial logit
model by testing all of its required assumptions. If some of the assumptions such as IIA
criteria is violated, we will adopt alternative methodology.
21
6. Bibliography
Barrett, C. B., et al. (2001). "Nonfarm income diversification and household livelihood strategies
in rural Africa: concepts, dynamics, and policy implications." Food policy 26(4): 315-331.
Block, S. and P. Webb (2001). "The dynamics of livelihood diversification in post-famine Ethiopia."
Food policy 26(4): 333-350.
De Janvry, A., et al. (1991). "Peasant household behaviour with missing markets: some paradoxes
explained." The Economic Journal: 1400-1417.
Fafchamps, M. (1992). "Cash crop production, food price volatility, and rural market integration
in the third world." American Journal of Agricultural Economics 74(1): 90-99.
Govereh, J. and T. S. Jayne (2003). "Cash cropping and food crop productivity: synergies or trade-
offs?" Agricultural Economics 28(1): 39-50.
Kurosaki, T. (2003). "Specialization and diversification in agricultural transformation: the case of
West Punjab, 1903–92." American Journal of Agricultural Economics 85(2): 372-386.
Kurosaki, T. and M. Fafchamps (2002). "Insurance market efficiency and crop choices in Pakistan."
Journal of Development Economics 67(2): 419-453.
Vergopoulos, K. (1978). "Capitalism and peasant productivity." The Journal of Peasant Studies
5(4): 446-465.
Government of Nepal (2014). “Agricultural Development Strategy.” Ministry of Agricultural
Development