Embed Size (px)
Citation preview

Choosing and Implementing a Quality Management System at Statistics Sweden
Masters thesis in Mathematical Statistics
Dan Lisai
LITH-MAT-EX--07/18--SE Masters thesis: 20 credits Level: D Examiner: Torkel Erhardsson Department of Mathematics The Institute of Technology at Linköping University Supervisor: Lars Lyberg Statistics Sweden Stockholm: December, 2007

Abstract
In today’s society we are surrounded by large amounts of information, quick decisions and high expectations to perform successfully in everything we do. As a statistical agency, Statistics Sweden is responsible for producing some of the information that is used for decision-making in society and is therefore under constant internal and external pressure to perform well. The responsibility to produce high-quality statistics to all customers and users is not simple. What is the quality of the statistics produced? How do we assure and control the quality of the statistics? Do we use our resources efficiently? These are important questions, which need to be addressed. One way of addressing these and other issues is to work with quality in a systematic fashion. Thus there is a need for a Quality Management System, i.e., a systematic way to handle quality issues of all kinds in all parts of the organization, and to continue the journey towards the vision of being a “world class statistical agency”. This Masters thesis is a description and discussion of the efforts to find a suitable Quality Management System. The thesis starts with a discussion about the vague quality concept, continues with a description of numerous frameworks, methods and systems related to quality management as well as their pros and cons and ends with a recommendation for Statistics Sweden. The recommendation is to use the EFQM Excellence Model as a quality framework, Six Sigma as a tool-box for improvement projects and modern internal auditing methods for evaluation and follow-up. Finally, issues related to the implementation of the system are discussed.
2

Acknowledgments
The support from many people at Statistics Sweden throughout the writing of my thesis has been very helpful. I would like to thank my colleagues at the R&D Department: Klas Blomqvist, Ing-Mari Boynton, Dan Hedlin, Sara Hoff, Ingegerd Jansson, Lilli Japec, Karl-Erik Kristiansson, Peter Lundquist and Claes Petri. They have all put up with my never-ending questions and provocative discussions. They have given me valuable input and all their thoughtful comments have constantly triggered me to search for new approaches. I have during these six months been introduced to the world of statistics in a way I never thought was possible. I also want to thank the members of the Statistics Sweden project that I have been a member of: Helena Fredin, Jack Hansson, Martin Lagerström, Anna Larsson, Marie Lidéus, Karin Lundström and Åke Pettersson. We have studied issues closely related to the subject of this thesis and intense meetings and conferences full of discussions have helped me to get input from different parts of the agency. The visit at Ericsson in Kumla was especially valuable, since I got to see quality management ideas practiced “in real life”. Special thanks go to Mick Couper for finding the time to read the chapter about process data, to Mats Bergdahl and Gunnar Arvidson for taking the time to talk to me, to Ingvar Johansson for giving a very interesting presentation of the EFQM Excellence Model, to Eva Enqvist and Mattias Elg for leading me into the Quality Management field and of course to my examiner Torkel Erhardsson. Family and friends have been a great support, listening to my endless accounts of the topic of this thesis. Finally, I want to thank Statistics Sweden for giving me a six-month internship and my supervisor Lars Lyberg for his guidance, feedback and encouragement during these six months. He helped me to develop the ideas and contents of my thesis and his assistance has in a professional way led me through the process of writing my first paper of this kind. Stockholm, December 2007 Dan Lisai
3

Contents
1 QUALITY AND STATISTICS ..................................................................................................7 1.1 QUALITY CONCEPTS IN DAILY LIFE .......................................................................................7
1.1.1 Quality definitions...........................................................................................................8 1.2 QUALITY CONCEPTS IN A STATISTICAL ORGANIZATION ......................................................10
1.2.1 Mean squared error ......................................................................................................11 1.2.2 Three levels of quality ...................................................................................................12 1.2.3 Quality dimensions........................................................................................................13
1.3 PARTICULAR QUALITY PROBLEMS IN A STATISTICAL ORGANIZATION .................................14 1.3.1 LEG on quality..............................................................................................................15
1.4 A STATISTICIAN’S TASK IN A QUALITY PERSPECTIVE ..........................................................15 1.5 IMPORTANCE OF THE CUSTOMER IN STATISTICAL PRODUCTION ..........................................16
2 PREVIOUS QUALITY WORK AT STATISTICS SWEDEN..............................................17 2.1 TOTAL QUALITY MANAGEMENT AT STATISTICS SWEDEN ..................................................17 2.2 THE INFLUENCE OF TQM AT STATISTICS SWEDEN .............................................................18 2.3 STATISTICS SWEDEN AFTER TQM ......................................................................................19
3 CURRENT STRUCTURAL CHANGES AT STATISTICS SWEDEN ...............................21 3.1 THE PROCESS CONCEPT.......................................................................................................21 3.2 DISCOVERY OF OLD ISSUES.................................................................................................22
3.2.1 Organizational problems at Statistics Sweden..............................................................22 3.2.2 Problems with core processes.......................................................................................23
3.3 THE STANDARDIZATION PROJECT LOTTA............................................................................24 3.3.1 The story of Lotta ..........................................................................................................25 3.3.2 Statistics Sweden after Lotta .........................................................................................27
4 ACCESSIBLE QUALITY MANAGEMENT SYSTEMS .....................................................28 4.1 MOTIVATE QUALITY WORK THROUGH QUALITY CONTESTS ................................................29 4.2 SELF-ASSESSMENT MODELS................................................................................................29
4.2.1 The SIQ Model ..............................................................................................................30 4.2.2 The EFQM Excellence Model .......................................................................................31 4.2.3 The Common Assessment Framework ..........................................................................33 4.2.4 The BNQP Excellence Framework ...............................................................................34 4.2.5 The European Statistics Code of Practice.....................................................................34 4.2.6 Development of a Self-Assessment Programme ............................................................35 4.2.7 Balanced scorecard ......................................................................................................36
4.3 ISO STANDARDS.................................................................................................................37 4.3.1 The ISO structure..........................................................................................................37 4.3.2 ISO 9000 series .............................................................................................................38 4.3.3 ISO 20252 .....................................................................................................................39
4.4 SYSTEMS FOR CONTINUOUS IMPROVEMENTS ......................................................................39 4.4.1 Total Quality Management ...........................................................................................40 4.4.2 Six Sigma.......................................................................................................................42 4.4.3 Lean Manufacturing......................................................................................................45 4.4.4 Process management ....................................................................................................46
4.5 SUMMARY OF QUALITY MANAGEMENT SYSTEMS ..............................................................47
4

4.5.1 Lean Six Sigma..............................................................................................................47 4.5.2 Growth Management System ........................................................................................47 4.5.3 Integration of models, standards and system................................................................47
5 QUALITY ASSURANCE AND QUALITY CONTROL.......................................................49 5.1 QUALITY ASSURANCE ........................................................................................................49 5.2 QUALITY CONTROL ............................................................................................................50
6 HANDLING PROCESS DATA ...............................................................................................51 6.1 STATISTICAL PROCESS CONTROL .......................................................................................51
6.1.1 Variation .......................................................................................................................51 6.1.2 Statistical control charts ...............................................................................................52 6.1.3 Difficulties of statistical control charts.........................................................................54 6.1.4 Analysing control charts ...............................................................................................56
6.2 PROCESS DATA ...................................................................................................................57 6.2.1 Different types of process data......................................................................................58 6.2.2 Importance and use of process data..............................................................................58 6.2.3 Problematic issues concerning process data ................................................................59
6.3 PROCESS DATA AT STATISTICS SWEDEN.............................................................................60 6.3.1 Selection of process variables.......................................................................................61 6.3.2 Analysis of process data................................................................................................62
7 PREREQUISITES FOR THE CHOICE OF A QUALITY MANAGEMENT SYSTEM ..63 7.1 WORLD CLASS STATISTICS..................................................................................................63 7.2 WHY DOES STATISTICS SWEDEN NEED A QMS?.................................................................64 7.3 ADVANTAGES AT STATISTICS SWEDEN ..............................................................................65 7.4 QMS AT OTHER STATISTICAL ORGANIZATIONS ..................................................................65 7.5 THE CHOICE AT STATISTICS SWEDEN .................................................................................67
8 IMPLEMENTING A QUALITY MANAGEMENT SYSTEM AT STATISTICS SWEDEN 68
8.1 IMPLEMENTATION ASPECTS AND DIFFICULTIES...................................................................68 8.2 TWO-YEAR IMPLEMENTATION PLAN ...................................................................................70 8.3 DISCUSSION........................................................................................................................71
9 REFERENCES..........................................................................................................................73
5

Figures and Tables
FIGURE 1 THE KANO MODEL OF CUSTOMER SATISFACTION (WITELL (2007)) .........................................9 FIGURE 2 DIRECTOR GENERALS AND QUALITY WORK AT STATISTICS SWEDEN.....................................17 FIGURE 3 THE STATISTICS PRODUCTION PROCESS (BERGDAHL (2006) AND UNECE (2007)) ................24 FIGURE 4 THE LOTTA PROJECT ORGANIZATION (ÖSTERGREN (2006)) ...................................................25 FIGURE 5 THE COMPONENTS OF A QUALITY MANAGEMENT SYSTEM ....................................................28 FIGURE 6 THE SEVEN CRITERIA FOR SELF-ASSESSMENT IN THE SIQ MODEL (SIQ (2007)) ....................31 FIGURE 7 THE NINE CRITERIA FOR SELF-ASSESSMENT IN THE EFQM MODEL (EFQM (2007))..............32 FIGURE 8 THE SEVEN CRITERIA FOR SELF-ASSESSMENT IN THE BNQP MODEL (BNQP (2007)) ............34 FIGURE 9 THE FOUR PERSPECTIVES OF A BALANCED SCORECARD (ARVESON (1998)) ...........................36 FIGURE 10 THE CORNERSTONE MODEL (BERGMAN AND KLEFSJÖ (2002)).............................................41 FIGURE 11 P-CHART OF RESPONSE RATES PER INTERVIEWER IN THE SWEDISH ESS (JAPEC (2005)) ......55 TABLE 1 THE CRITERIA OF DIFFERENT SELF-ASSESSMENT MODELS .......................................................30 TABLE 2 THE PRINCIPLES OF THE EUROPEAN STATISTICS CODE OF PRACTICE (EUROSTAT (2005)) ......35 TABLE 3 THE SIX SIGMA BELT SYSTEM (BRUE AND HOWES (2006)) .....................................................44 TABLE 4 A SUMMARY OF SOME FEATURES IN A QUALITY MANAGEMENT SYSTEM................................48 TABLE 5 DIFFERENT TYPES OF SCC (BERGMAN AND KLEFSJÖ (2002) AND MONTGOMERY (2005B)) ...53 TABLE 6 CONSTANTS FOR CALCULATING THE CONTROL LIMITS (BERGMAN AND KLEFSJÖ (2002)).......53 TABLE 7 PROCESS INDICATORS (BERGMAN AND KLEFSJÖ (2002) AND MONTGOMERY (2005B)) ..........57 TABLE 8 A SUMMARY OF DIFFERENT TYPES OF PROCESS DATA, FEATURES AND SOME ILLUSTRATIVE
EXAMPLES (COUPER AND LYBERG (2005), COUPER (2007B), SUNDGREN (2005) ETC.) ...............58 TABLE 9 TWO-YEAR IMPLEMENTATION PLAN........................................................................................70
6

1 Quality and statistics This Masters thesis describes issues related to the selection and implementation of a Quality Management System at Statistics Sweden. The objectives at the agency are to choose a system and to start an implementation in the beginning of 2008. Chapter 1 Quality and statistics gives an introduction and clarification of the quality concept and relates it to historical usage, statistics production, the statistician and the customer. Chapter 2 Previous quality work at Statistics Sweden describes in a chronological way the attempts and approaches concerning quality work at Statistics Sweden since the beginning of the 1990s while Chapter 3 Current structural changes at Statistics Sweden is a description of the current situation including a presentation of the extensive reengineering project that has dominated the development work at the agency during the last year. The most extensive part of the thesis is Chapter 4 Accessible Quality Management Systems, that in a structured way presents the models, standards and systems that are available on the Swedish and international markets. Chapter 5 Quality Assurance and Quality Control is included to clarify the meaning of these two concepts and simplifies the comprehension of the following chapter, Chapter 6 Handling process data. The intention here is to give an introduction to statistical process control (SPC) and a description of process data in different contexts. The two final chapters, Chapter 7 Prerequisites for the choice of a Quality Management System and Chapter 8 Implementing a Quality Management System at Statistics Sweden, stress the importance of a Quality Management System at Statistics Sweden, including the choice and an implementation plan for 2008-2009. Since the subject is broad and some concepts are not uniquely defined the presentations should not be seen as complete. Rather the purpose is to give a comprehensive overview of the thesis components supported by some details and illustrative examples. Apart from literature findings a lot of valuable input comes from the two projects at Statistics Sweden: Choosing a Quality Management System and Process data – 1st stage. For simplicity, some acronyms are used from now on and e.g., Quality Management System will be denoted as QMS.
1.1 Quality concepts in daily life
Quality is a concept of several meanings, subjective and individual to the interpreter. When mentioning that something is of a certain quality, it is assumed and associated to be good in some way. More generally, the definition of quality has changed over time. More dimensions have been added and its complexity has increased. Already in ancient times quality and the ability of managing for quality were important. As a short preview two examples are given: how the road constructions were made in ancient Rome and how the French gothic cathedrals were built.
7

One of the expert areas in ancient Rome was the ability to construct a systematic and efficient transportation system. The roads supported and simplified the expansion and maintenance of the Roman Empire. In many fields useful tools were developed but three skills were pointed out as key factors: the mastery of territory, i.e., the structural organization of Roman cities, the production and use of building materials and the administration of cities and living conditions. Further, extensive standardizations of working procedures and usage of construction materials played a central and important role in the Roman managing for quality. When discussing the French gothic cathedrals1 the word quality is used in its original meaning, i.e. the way of being. The cathedrals were characterized by excellence: excellence in beauty, excellence in virtue and foremost the quality of them in the way they elevate the soul. The builders were craftsmen, or artisans, and belonged to a guild in the guild system. It was a well organized structure where the quality of the work and the quality of the man were central ideals. One developed procedure was the rigorous training of juniors in order to pass on the skills and the know-how to coming generations. These examples show that in history, the social systems and the logistics had to be good in order to attain such achievements, i.e., they had to be of a certain quality. Further descriptions of these illustrations and more examples on historical managing for quality are discussed in Juran (1995).
1.1.1 Quality definitions Quality attributes, no matter how they are described, have to be seen as part of a delicate balance between expectations and experiences. They are a blend of fundamental parts and the discussion about the quality concept is complex and has over time become overused in some contexts. When there is no straightforward and unique definition as is requested in different contexts it can be difficult to get an overview and total understanding. The intention here is to provide a selection of six of the numerous definitions of quality, namely:
1. Quality is fitness for purpose 2. Quality is the number of defective units 3. Critical to quality characteristics 4. The Kano model of customer satisfaction 5. Quality development 6. Quality is equal to the attributes of things
Let us walk through these definitions. First, the two quality pioneers, Edwards Deming and Joseph Juran stamped the ground and started a discussion about the quality concept in the 1950s. Deming claimed e.g. already in 1944 that quality is fitness for purpose (Bergman and Klefsjö (2002)).
1 The oldest gothic cathedral is found in Noyon, built in 1190 (Juran (1995)).
8

Second, quality was for a long time seen as the number of defective units and an error ratio. Dahlgaard (2007) quotes the interpretation of Crosby in his Quality is Free (1979) that an error has two main reasons: the lack of knowledge and the lack of attention. Third is product quality according to so called Critical to quality characteristics (CTQs) emanating from the customers. This feature was included in the quality definition since the customer started to consider quality as something based on several factors. Quality was suddenly an area needed to be specified in every situation (Karlöf and Lövingsson (2007)). Fourth, there is a well known idea developed by the Japanese Noriaki Kano in the 1980s, namely the Kano model of customer satisfaction. The Kano Model displays his five dimensions of quality: attractive, one-dimensional, must be, indifferent and reverse quality. He presented these dimensions in a diagram as a result of two parameters: customer satisfaction and degree of fulfilment. See Figure 1 below.
Figure 1 The Kano Model of customer satisfaction (Witell (2007))
Further, Kano mentions the dynamic development of quality attributes over time. Witell (2007) considers e.g., the quality of the camera in a cell phone. When the cell phone had not been on the market for long, it did not matter whether it had a camera or not, which is indifferent quality. After some time, it became an attractive quality attribute. Later it was more or less a standard accessory, one-dimensional quality. Today, a cell phone without a camera is not considered acceptable, it is a must be quality. Fifth, Höglund and Olsson (2006) include quality development as a view of quality and state that there are two main objectives: to sustain a stable level of quality and to improve activities to a higher level of quality.
9

The sixth, and final quality aspect given here, is the translation of Japanese symbols by Dahlgaard (2007) meaning that quality is equal to the attributes of things, i.e. what people talk about.
1.2 Quality concepts in a statistical organization
Quality, in its broadest perspective, exists naturally in all statistical agencies. However in this thesis the focus is mainly on Statistics Sweden. Statistics Sweden is the Swedish National Statistical Institute (NSI) and is the largest among 25 authorities, forming a network responsible for Swedish Official Statistics (SOS) and the agency functions as the network coordinator. Further, its official website is the centre point for disseminating information and publications of statistics (Statistics Sweden (2007f)). In a statistical organization quality is often referred to as the quality of the statistics. Analogous to the quality concept in general, quality in the world of statistics is a multifaceted and at the same time vague concept (Lyberg (2004)). Over time there has been an interesting extension and development of the so called quality movement. Walter Shewhart and Frederick Taylor are two contrivers of the quality movement. Their work has had major effects on statistical organizations and they introduced important tools that are still used. Traditionally, the formal measure of quality at a statistical agency was the Mean Squared Error (MSE), and for a long time good quality has implicitly been equivalent with a small MSE. Then, other dimensions than the MSE were added and quality frameworks consisting of several dimensions were developed. Typically these frameworks were developed with minimal user influence. When these frameworks were not sufficient, the Quality Management (QM) appeared as a more comprehensive approach. Recently, three levels of quality have been identified, namely product, process and organizational quality. In Sweden in general, the Council for Official Statistics (COS) determines whether the statistics is of sufficient quality for the purpose of usage. COS has defined sufficient quality in relation to how it is supposed to be used by the customer. There is a setup of work supporting criteria to accomplish, clarifying the contents of sufficient quality statistics (Statistics Sweden (2006b)). At Statistics Sweden in particular, there are e.g. quality declarations, concepts and guidelines for official statistics2 and guidelines from the COS3 (Statistics Sweden (2007e)).
2 E.g. MIS 2001:1, Quality definition and recommendations for quality declarations of official statistics (Statistics Sweden (2001)). 3 E.g. ROS 2006:1, Tillräcklig kvalitet och kriterier för officiell statistik (Statistics Sweden (2006b)).
10

1.2.1 Mean squared error The Mean Squared Error (MSE) is the formal measure of quality of estimates or more precisely the survey4 accuracy, which is one of the quality dimensions described later in the chapter. Each estimate computed in a survey has a corresponding MSE, reflecting the effects on the estimate of all sources of error (Biemer and Lyberg (2003)). The amount of error in the data reflects quality and data quality is thus a function of total survey error consisting of sampling error components as well as nonsampling error components. In a statistical context the total survey error, the accuracy, is the difference between the estimate and the true parameter value (Lyberg (2004)). More formally, MSE of an estimator W of a parameter θ is the function of θ defined by , where E denotes the expected value. The MSE measures the average squared difference between the estimator W and the parameter
2)( θθ −WEθ . Var
denotes the variance and the bias is defined as the difference between the expected value of W and the true value of θ . An estimator whose bias is identically equal to 0 is called unbiased and implies θθ =WE for all θ . The interpretations of both the MSE and the Bias are as follows:
222 )()()()( WBiasWVarWEWVarWEWMSE θθθθθ θθ +=−+=−=
and
θθθ −= WEWBias (Casella and Berger (2002)) In words, the MSE can be seen as the sum of the variance and the squared bias. Further, in a survey context, there is an expanded version of the MSE of e.g. an average, where the variance has three components and the bias five components.
=+= 2BiasVarMSE +++ PROCESSINGDATATMEASUREMENSAMPLING VarVarVar
2)( PROCESSINGDATATMEASUREMENENENRESPONSFRAMEIONSPECIFICAT BiasBiasBiasBiasBias ++++ This means that each survey component contributes to either the bias or the variance or in some cases both (Japec (2005)). Moreover, as the MSE serves as a device for comparing alternative designs and methods in order to choose the best, the concept is fundamental in the study of data quality (Biemer and Lyberg (2003)). It is not sufficient to rely on estimates of the MSE as a solid quality measurement, not even for accuracy. The variance and bias components usually do not reflect contributions from all different error sources.
4 The survey definition according to Lyberg and Elvers (2003): a survey is a statistical study designed to measure population characteristics so that population parameters can be estimated.
11

MSE and its components are moreover difficult and expensive to estimate and often the results come too late to be helpful in improvement work (Lyberg and Elvers (2003)). Anyhow, a small MSE indicates that the total survey error is small and under control while a large MSE indicates that one or more sources of error are clearly affecting the accuracy of the estimate (Biemer and Lyberg (2003)). The U.S. Census Bureau has a survey model with an MSE of the estimator decomposed into four components: the sampling variance, the response variance, the covariance and the squared bias, all related to the true value of the estimator.
y
2
, BiasCovVarVarMSE RESPONSESAMPLINGRESPONSESAMPLING +++= The true, unknown value and the preferred process target parameter are denoted Z and X respectively. The difference between Z and X reflects in an interesting way the user influence as well as the degree of relevance. The MSE functions as a useful tool for determining how to allocate recourses in a survey to generate the best result. The issues of whether the resources should be allocated before, during or after statistical surveys are not at all straightforward. If resources are focused on e.g., interviewer training and development of robust systems and tools for the interviewers many problems can be prevented. There is a delicate limit where preventive work does not pay off in terms of a better result. Thorough studies can and should be conducted to determine where this fine line is located. Some point out that it would be ideal to use MSE in the entire European Statistical System (ESS) but that assumes the existence of a gold standard where the true value for each parameter can be obtained in some way. This vision is difficult to achieve and currently accuracy is for the most parts reflected by indicators (Öberg (2004)). Further, it is important to point out that quality dimensions other than accuracy, e.g., timeliness and accessibility, should be prioritized, while the MSE measuring the accuracy is kept on an acceptable level. In some contexts the variance is used as a proxy for MSE without adding the squared bias term (Lyberg and Elvers (2003)).
1.2.2 Three levels of quality Quality can be regarded as a three-level concept, namely product quality, process quality and organizational quality. The first two are presented in the CAF model (Statens kvalitets- och kompetensråd (2003)) while the addition of the third, the organizational quality, is included in a report by Lyberg (2004). The reasoning that follows draws on both sources. First, the product quality is simply seen as the result, the outgoing quality of the product that the customer gets. The quality is described by several quality characteristics, including error estimates, based on customer needs and expectations. Second, the product quality depends on the underlying process quality, the quality of how a product or service is produced. The process quality is continuously checked
12

and improved by focusing on those key process variables that have the most impact on the product. Third, the process quality depends on the organizational quality, a congenial environment with functioning communication between committed managers and employees. Organizational quality can be reviewed, controlled and improved by one or several of the quality frameworks presented in Chapter 4.
1.2.3 Quality dimensions Statistics Sweden has according to its 2005 quality policy five dimensions of quality related to its products. Those are:
1. Contents 2. Accuracy 3. Timeliness 4. Comparability and coherence5 5. Availability and clarity
Further, the statistics are impartial, relevant and of good quality in all dimensions6 (Statistics Sweden (2005a)). The quality dimensions are sometimes said to constitute a quality framework for the statistical agency. A problem with these frameworks is that virtually no customer input has been used in the process. They are more or less exclusively based on what the agency believes the customers want and therefore lack the important relation to CTQs from important internal and external customers. Basically statistical agencies know very little about how customers use information on quality and what information they need. Most other statistical agencies and other systems and organizations, e.g. Statistics Canada, the U.S. Federal Statistical System, Statistics New Zealand, the Australian Bureau of Statistics (ABS), Statistics Finland, OECD and the International Monetary Fund (IMF) have their own definitions or frameworks and they are all very similar to the one at Statistics Sweden. In particular, ABS has the dimension trust of institution, which they claim is adequate when providing estimates and analytical products (Yu (2007)). More specific descriptions of these frameworks and policies can be found in official documents at the agencies and a complementary summary is found in Lyberg (2004). All these frameworks and policies refer to the more general quality aspects encompassed by the ten UN Fundamental Principles of Official Statistics (UN (2006)). The principles form an essential basis for the development in economy,
5 The coherence dimension corresponds to the level of how well the statistics can be combined with other statistics. 6 The quality policy also states that our statistics are based on scientific principles, we adapt the quality of the statistics to the needs of users and customers and we describe the quality of the statistics so that users and customers understand (Statistics Sweden (2005a)).
13

demographics, social and environmental fields and are rather extensive. Lyberg (2004) highlights some of them. The European Statistical System (ESS) is a system comprising the Eurostat and the national statistical offices, ministries, agencies and central banks that collect and disseminate official statistics in European Union (EU) member states and other European countries (Aitken et al (2004)). The ESS has its own set of quality dimensions, all included in the European Statistics Code of Practice described in Chapter 4, and they are very similar to the quality dimensions of Statistics Sweden7.
1.3 Particular quality problems in a statistical organization
Several dimensions of quality imply a multidimensional concept but the question can be posed if any, and in that case what, dimensions should be most important. No matter what dimensions are parts of the quality concept, Lyberg (2004) reasons that without the accuracy dimension other dimensions are irrelevant. Meanwhile the contrary is also true. For instance, if data come too late it does not matter if they are extremely accurate so there is always a trade-off situation. The quality dimensions are in general in conflict, e.g. timeliness and accuracy. To be able to allocate resources according to the customer’s needs the customer should be consulted. This is unfortunately seldom the case, neither in the development of the quality dimensions, nor in the allocation of resources in statistical production. The customer and the statistics producer, i.e., the statistician, should in an ideal situation have a continuing dialogue throughout the production process in order to make the customer aware and a part of adjustments. If e.g. more resources are required to obtain a certain accuracy or the accuracy has to step down because of time pressure, the customer should be consulted. Of course, there is almost always a dialogue between users and at least one important customer in the production of statistics but often these discussions are limited to specific topics such as costs and general design options. An extensive mapping of customers and their needs, wishes and expectations from the statistics they receive is needed as a first step on the road to an integrated customer-producer dialogue. Another problem is the fact that most products from Statistics Sweden have more than one customer. Customers of products from Statistics Sweden include governmental and regional authorities, governmental departments, organizations and companies, representatives from academia, e.g., scientist and researchers, media and the society as well as private persons, tax payers etc. Who decides what dimensions should be prioritized and principally, who pays? An approach where the quality of the statistics is measured before, during and after surveys are conducted is desired but implies a large amount of variation regarding both the contents and intensity of the surveys and is mostly of interest for the
7 The ESS quality dimensions are relevance, accuracy and reliability, timeliness and punctuality, coherence and comparability and finally accessibility and clarity (Eurostat (2005)).
14

statistician in particular (Lyberg (2004)). A basic prerequisite to solve this and many other problems is to have proper methods and tools that measure e.g. the variation associated with various design steps and then the proper knowledge on how to react on those measurements. The difficulty is often how to choose a first design and then optimize it. The solution based on optimal allocation is frequently similar to the actual solution that is finally chosen, a phenomenon called flat optimum. An aspect discussed in some contexts is that it is not always worth the effort to standardize definitions and terms. They are either used differently at different places anyway, short-lived or not used at all, e.g. the work of developing the quality dimensions and the fact that Eurostat recently changed their definition from seven to six quality dimensions (Lyberg (2004)).
1.3.1 LEG on quality The ESS has, according to Öberg (2004), three main problem areas. First, there are difficulties with achieving comparable statistics across the system. Second, there is an issue of the timeliness of European official statistics in comparison with e.g. the U.S. Federal Statistical System. Third, the consideration of the quality dimensions. Timeliness, relevance, coherence and accessibility are not enough. The data has to be accurate as well. Focus should be set on e.g. nonsampling errors that can have a large impact on quality. Statistics Sweden initiated the launching of a Leadership Group (LEG) on quality, formed in 1999, with the main focus to produce an ESS quality framework including e.g. the aspects of Total Quality Management (TQM) and current best methods (CBM). The work resulted in a quality declaration, presented in 2001, and 22 recommendations for future quality work, e.g. the importance of process measurement for improvement work and the development of a handbook on working with process variables. The plan was for all ESS members to adopt and work with these recommendations towards the ESS vision to be a world leader in statistical information services and the most important provider for the EU and its member states. Based on scientific principles and methods, the ESS will offer and continuously improve a programme of harmonized European statistics that constitutes an essential basis for democratic processes and progress in society (Lyberg and Elvers (2003) and Öberg (2004)). An implementation group has assisted the NSIs in this work.
1.4 A statistician’s task in a quality perspective
The principal task for the survey statistician is simply to minimize the total error given a certain budget for the statistical product and hence to achieve the best quality possible. This is an ideal situation, since it is difficult to design surveys and processes in order to minimize the MSE according to the expanded model described in the beginning of the chapter. Many actors are involved, e.g. managers, interviewers, respondents and survey methodologists, all contributing to the total
15

MSE (Japec (2005)). In a more general perspective, quality work should be systematic in the sense that approaches should involve all major processes and all employees (Lyberg (2004)). The UN fundamental principles of official statistics describe the aspects of statistics production from a broad perspective. Here are excerpts from principles number three and five respectively: to facilitate a correct interpretation of the data, agencies are to present information according to scientific standards of the sources, methods and procedures and that data for statistical purposes may be drawn from statistical surveys or administrative records (UN (2006)). Further, the development of official statistics has been a joint effort from both agency employees and researchers from academia, the latter contributing with a lot of input (Lyberg and Elvers (2003)).
1.5 Importance of the customer in statistical production
The customer is the final user of the product or service (Karlöf and Lövingsson (2007)). In this context the customer is the receiver of a statistical product. Every organization that produces products or services has customers and if, for some reason, the customers and their needs and expectations are unknown, problems will occur and the production will be affected. For many large organizations, quality, or so called customer perceived quality, no matter how it is defined, has become a survival issue (Lyberg and Elvers (2003)). Further, an increased competitiveness is necessary in order to become the obvious choice for the customer. In the beginning of the chapter there was a review of the situational change at Statistics Sweden in the early 1990s. Suddenly the customer entered the scene of statistics. The centralized statistical system in Sweden changed drastically into a decentralized growing market with many actors. A natural competition situation emerged and the customer was in the centre. Statistics Sweden turned into both a statistical agency and a regular statistical firm, in terms of competing with other statistics producers about commissions from the government agencies. The agency was forced to review and adjust its work procedures since this new situation required decreased costs for the work procedures while the quality level was maintained. Moreover, the government set higher demands for more efficient production through commissions (Lyberg (2004)). Irrespective of the current situation the customer of the products produced at Statistics Sweden needs to be a part of the entirety. The customer should not put time and effort into identifying units, departments and product. Information should be clear and precise and communicated through natural channels. In particular the customer should have a natural role in the statistics production process. The shape of the final product, both content and other quality aspects, should be based on the customer’s needs, expectations and requirements (Statistics Sweden (2007c)). At Statistics Sweden there is a Swedish Customer Satisfaction Barometer (SCSB), which is one example of a measure of customer satisfaction.
16

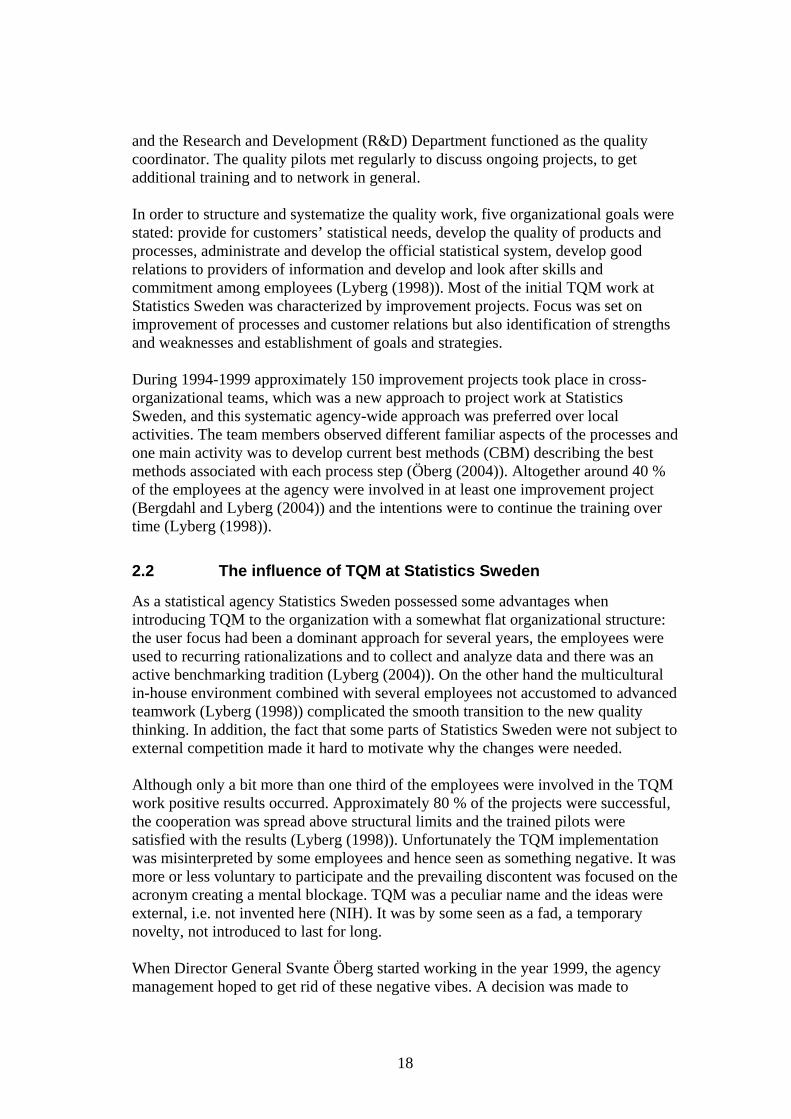
2 Previous quality work at Statistics Sweden This chapter gives a historical review of previous attempts to work with quality management at Statistics Sweden. Director General Jan Carling (1992-1999) introduced TQM in the early 1990s, a system that was gradually transformed into audit activities when Director General Svante Öberg (1999-2005) took over the agency. Since the entry of Director General Kjell Jansson in 2006, an extensive reengineering project called Lotta has been conducted and a new QMS system will be implemented. A summary of Director Generals and quality work at Statistics Sweden is presented in Figure 2.
Figure 2 Director Generals and quality work at Statistics Sweden
2.1 Total Quality Management at Statistics Sweden
In the beginning of 1993 the top management of Statistics Sweden was, as one of the first National Statistical Institutes (NSI), introduced to the fundamental theories of Total Quality Management. It was an inevitable decision since the agency was in a very bad financial situation, but had an aspiration to maintain its satisfactory customer-user relations, develop standard operating procedures as well as structuring organized quality work with intentions of becoming an important international player regarding quality. The U.S. employee-owned research corporation Westat, Inc. (Westat, Inc. (2007)) had worked with TQM for a long time with many clients world-wide and possessed great knowledge in the methods and tools. In addition Westat was, as a large statistical firm, familiar with both the tasks and problems present at Statistics Sweden as well as in the entire NSI network. Statistics Sweden decided to consult Westat, mainly because they were statistics producers. Through Westat many employees at Statistics Sweden were trained in the understanding and utilization of the TQM concept. Important aspects in this training were knowledge about project planning, goal setting, process data collection and usage of TQM tools (Lyberg (1998)). During the first eight month period the Management Board and other strategic employees were educated and within approximately four years Statistics Sweden had trained almost one hundred quality pilots (Lyberg (2004)) ready to work in quality improvement projects. The overall quality work was led by the Director General together with four others forming a working committee prioritizing different improvement projects. Every department had responsibility for the local quality work
17
and the Research and Development (R&D) Department functioned as the quality coordinator. The quality pilots met regularly to discuss ongoing projects, to get additional training and to network in general. In order to structure and systematize the quality work, five organizational goals were stated: provide for customers’ statistical needs, develop the quality of products and processes, administrate and develop the official statistical system, develop good relations to providers of information and develop and look after skills and commitment among employees (Lyberg (1998)). Most of the initial TQM work at Statistics Sweden was characterized by improvement projects. Focus was set on improvement of processes and customer relations but also identification of strengths and weaknesses and establishment of goals and strategies. During 1994-1999 approximately 150 improvement projects took place in cross-organizational teams, which was a new approach to project work at Statistics Sweden, and this systematic agency-wide approach was preferred over local activities. The team members observed different familiar aspects of the processes and one main activity was to develop current best methods (CBM) describing the best methods associated with each process step (Öberg (2004)). Altogether around 40 % of the employees at the agency were involved in at least one improvement project (Bergdahl and Lyberg (2004)) and the intentions were to continue the training over time (Lyberg (1998)).
2.2 The influence of TQM at Statistics Sweden
As a statistical agency Statistics Sweden possessed some advantages when introducing TQM to the organization with a somewhat flat organizational structure: the user focus had been a dominant approach for several years, the employees were used to recurring rationalizations and to collect and analyze data and there was an active benchmarking tradition (Lyberg (2004)). On the other hand the multicultural in-house environment combined with several employees not accustomed to advanced teamwork (Lyberg (1998)) complicated the smooth transition to the new quality thinking. In addition, the fact that some parts of Statistics Sweden were not subject to external competition made it hard to motivate why the changes were needed. Although only a bit more than one third of the employees were involved in the TQM work positive results occurred. Approximately 80 % of the projects were successful, the cooperation was spread above structural limits and the trained pilots were satisfied with the results (Lyberg (1998)). Unfortunately the TQM implementation was misinterpreted by some employees and hence seen as something negative. It was more or less voluntary to participate and the prevailing discontent was focused on the acronym creating a mental blockage. TQM was a peculiar name and the ideas were external, i.e. not invented here (NIH). It was by some seen as a fad, a temporary novelty, not introduced to last for long. When Director General Svante Öberg started working in the year 1999, the agency management hoped to get rid of these negative vibes. A decision was made to
18

abandon the three letter TQM acronym and to use the less charged term Systematic Quality Work (SQW) instead. The change was only a façade since the fundamental values were the same: decisions based on facts, continuous improvement, customer focus and employee’s involvement (Öberg (2004)). This was supposed to simplify the approach and generate quality work with values specific to the situation at Statistics Sweden but it led instead to a phase where another change had to be motivated to employees now familiar with TQM. What we thought to be a natural transition of our approach to quality to a new state was not so natural after all was written in an internal report by Bergdahl and Lyberg (2004).
2.3 Statistics Sweden after TQM
After almost a decade of a systematic approach with TQM followed by SQW there was a significant change of thinking at Statistics Sweden. In 2002 an extensive Statistical Quality Audit Activity (SQAA) replaced the SQW and the goal was set to audit and review within five years the majority of the 200 statistical products produced in six different departments8 at Statistics Sweden (Öberg (2004)). A group of 54 employees containing methodologists, statisticians and IT analysts was formed and trained as auditors (Eiderbrant-Nilsson (2006)). The SQAA organization was administrated at a small secretariat, responsible for auditor recruitment and training, team schedules, follow-up on the product improvements and presenting the results. Each audit was performed by three auditors and comprised three phases. To begin with, the employees on the product in question filled out a self-assessment form regarding e.g., management, planning, employee skills, customer-user relations, survey design, statistics dissemination, processes and data collection and processing. Next, the audit team observed the product during one week, observing the work, studying reports, documentation and publications and talking to the employees. This resulted in an audit report describing the different aspects of the production, pointing out good and bad examples and giving improvement proposals. The audit team had guidelines for the procedure consisting of a checklist concerning eleven focus areas, e.g. management, data collection and documentation, including specific questions and encouragement of giving constructive feedback (Eiderbrant-Nilsson (2006)), complemented with tips and ideas of what to think about when performing an audit. Finally, the responsibility for taking appropriate measures based on the audit report was given to the product employees (Öberg (2004)). Here is a short example of an audit, namely the audit from February 2002 for conjuncture statistics, salaries for the private sector. The statistics is extensive and produced monthly since 1996 and the previous overhaul was done the same year without updated documentation. The product was examined based on the standard checklist, e.g. the main customers, both internal and external, were identified and their evaluation considered. Each criterion included a description of how the work is
8The six departments are DIH, DFO, BV, MP, NA and RM (Statistics Sweden (2007i)).
19

done and relevant comments and improvement were given. In the end of the audit report a summary of recommendations was presented. For this specific product the audit team got a good overall impression but some things could be improved, e.g., the development and follow-up of process indicators and the consideration to look over the time series analysis and seasonal adjustments. Further, the team supported the suggestion to introduce electronic data collection, i.e., mixed mode (Statistics Sweden (2004b)). Parallel to the audit activities annual quality reports were compiled where survey managers helped to give feedback on product quality (Bergdahl and Lyberg (2004)) and providing key process variables and other quality indicators. Steady quality improvements were shown for all dimensions at Statistics Sweden and the reports consisted of good and bad features and explanations of the reasons for the changes (Öberg (2004)). Other types of documentation were the CBMs, checklists and management information and surveys on customer satisfaction, customer satisfaction index, delivery, local initiatives and the extensive employee survey based on a large number of questions giving a better insight into the employee situation. Further, there was a realization for a long-term development. A strategic plan for 2003-2007 was worked out including the mission, the vision and the core values of Statistics Sweden combined with goals and strategies in four focus areas: operations, customers and user, employees and finance. This model plan consisting of four focus areas was a balanced scorecard and the idea came from Statistics Finland who had used a similar approach. It was made clear to all employees that the organization strived towards changes and improvement. Elegant documents were of little importance and that actual implementation, communication and feedback between the top management and the employees were of greater importance (Bergdahl and Lyberg (2004)). The SQAA was initiated in order to develop Statistics Sweden as a learning organization. As a result of years of decentralization the organization had a stove-pipe structure with isolations in the line. Now, the organization strived towards continuous improvements and the audits served the purpose of optimizing each product to be as good as possible. This opened up for quality thinking among the employees and created an awareness of what factors played a part in the result of the product produced at the department. The stove-pipe structure unfortunately became an obstacle since each part of the organization functioned individually of others. By mid 2006 audits had been performed on 86 products but considerable organizational changes in the last years had enforced thorough analyses and standardizations of the production process at Statistics Sweden. Director General Kjell Jansson took over the agency in March 2006 and put the processes and their standardization in the centre. Naturally, the audits were cancelled as a result of the new reengineering project, called Lotta, since the audits were product rather than process oriented.
20

3 Current structural changes at Statistics Sweden Large scale organizational changes are currently on the agenda at Statistics Sweden, involving the majority of the employees in various types of work. To simplify the understanding, this chapter opens with a brief discussion about processes. Then there is a presentation of some old issues at Statistics Sweden followed by a more extensive discussion of the current reengineering project.
3.1 The process concept
The literature often refers to activities in terms of processes: process management, process orientation, process improvement and process control etc. Naturally, it is necessary to define a process to avoid future confusion. A process can be described as a chain of activities, repetitive over time, with the goal to create value for an internal or external customer (Bergman and Klefsjö (2002)). Sometimes additional conditions, like a well defined beginning and ending and specification if the value represents a product or a service, are added. The importance is to have a clear view of what the process means at the organization in question. At Statistics Sweden, Elvers and Eiderbrant (2007) defined a process as a chain of activities refining a product or service for an internal or external customer, repeated similarly over time, with a defined beginning and ending. To get to know and understand the processes in an organization, they are often mapped in so called flowcharts at various detailed levels, depending on the size of the process, distinguishing activities and decisions in chronological order (Forsberg (2007)). Flowcharts should be designed from a customer perspective, but can appear to be different depending on what approach is chosen. In organizations handling public administration, processes can vary a lot depending on the fact that the activities are either abstract, e.g., support development of political programs or economical regulation, or concrete, e.g., providing a service (Statens kvalitets- och kompetensråd (2003)). Further, flowcharts can be based on a so called SIPOC diagram: supplier, input, process, output and customer (Brue and Howes (2006)). Processes are usually classified as core processes, management processes or supporting processes (Bergman and Klefsjö (2002)). At Statistics Sweden there are numerous types of processes but only one major core process, the statistics production process (SPP). An important aspect when talking in terms of processes is the approach towards process goals suggested as being SMART: specific, measurable, accepted, reasonable and time limited (Höglund and Olsson (2006) and Poksinska (2007)). Finally, some short comments on the terms listed above:
21

• Process management can be seen from two perspectives, both as management and improvement of single processes and as the entire organization as a system of processes. It is defined as the measures taken to affect an organization and the actions of its employees.
• Process orientation is based on the customer focus and how to make the organization more efficient with cooperation, greater understanding and less individual dependency and suboptimization (Forsberg (2007)). An organization with a process view instead of a traditional line view views the systems horizontally and outside-in, i.e., in a customer perspective (Statens kvalitets- och kompetensråd (2004)).
• Process control is characterized by a successful transformation work, based on the three principles simplicity, participation and leadership (Statistics Sweden (2007c)).
• Process improvement can be seen as a process in itself, based on the Shewhart PDCA cycle: plan, do, check and act.
3.2 Discovery of old issues
When Statistics Sweden in the beginning of the 1990s became both a statistical agency and a statistical firm, issues and organizational problems became apparent. The contents of many subprocesses, methods and work approaches were not acceptable. In the first step general organizational problems will be identified and in the second step the focus is on the core process, mainly the SPP.
3.2.1 Organizational problems at Statistics Sweden At Statistics Sweden, most organizational problems have their origin in negative cycles where the problems have gradually occurred. Bergdahl and Lyberg (2004) said in an internal report that most areas can be considered problematic: quality issues, methods and tools, economical issues, customer focus, employee focus and foremost the discussion of centralization versus decentralization. The observations presented here are just observations, not covering all problem areas and should be considered as a set of numerous illustrative examples. One issue at Statistics Sweden has been a lack of knowledge on process capability (Bergdahl and Lyberg (2004)), closely linked to the absence of process data, i.e., data about the process, that is used for testing performance before, during and after process steps. Further, there are no quality effects of performing different types of data collection operations in different ways (Sundgren (2007)). Fewer, and above all, standardized methods and tools for statistics production is a requirement for an efficient organization with easier administration systems (Statistics Sweden (2007d)). There has been a tradition of so called trial and error methods with work assignments developed individually, becoming dependent on specific employees, creating a vacuum when employees leave Statistics Sweden. Many unnecessary work steps are costly, and there is a fine balance between cost reduction and sustained or increased quality. Examples are survey managers that have worked in individual and different
22

ways, resulting in quality problems, inefficiency and resource waste (Statistics Sweden (2004a)). A realization of the need for process standardization can make the organization more cost-efficient, free up resources and save a lot of money for Statistics Sweden and its customers. The customer focus should be one of the main priorities and an important part of the overall picture when discussing statistics production, process work and development (Statistics Sweden (2007c)). Currently the customer focus is simply not sufficient (Sundgren (2007)). There has for long time been a peculiar situation that the customers cannot be sure that the products and services that they are buying are of a certain quality. The quality level is not simply communicated throughout the organization and affects the decision-making at the output for internal and external customers. Additional to the customer, the employee, and the communication between management and employees are tremendously important. At Statistics Sweden there have been basic communication problems, employees have been trained differently and there has been a lack of effectiveness when selecting employees for projects. Another example is the fact that some employees have asserted that projects are too dragged out in time, prominent employees are busy and do not have time although they are important for the project. Generally, decentralized decision-making has been a major problem, resulting in initiatives taken locally (Bergdahl and Lyberg (2004)). A lack of infrastructure, with subprocess interactions, has created a decentralized structure (Statistics Sweden (2007c)).
3.2.2 Problems with core processes The statistics production process (SPP) is at the main at Statistics Sweden. It is a comprehensive network of systems and activities with many opportunities for development as well as risks. It consists of many subprocesses, controlled by supporting processes, e.g., financial, personnel and IT-processes, with mainly internal customers. The SPP has seven major steps, chronologically organized in Figure 3 below: need, develop and design, build, collect, process, analyze and disseminate. Throughout the whole process are the overarching processes: evaluate and feedback, management and support and infrastructure (Bergdahl (2006) and UNECE (2007)). During the 1990s almost one hundred quality pilots were trained in TQM-related projects, with the focus to bring statistical production and dissemination from Statistics Sweden to a world leading level. Today, only one tenth of the pilots are available and active at the agency, lacking skills in modern tools and applications (Bergdahl and Lyberg (2004)). Things have to be done in order to keep up with other statistical agencies. Some steps in the SPP have major cost and quality deficiencies since they are not controlled by a QMS (Sundgren (2007)).
23

Figure 3 The statistics production process (Bergdahl (2006) and UNECE (2007))
Standardization and a smaller number of subprocess variants are necessary in every part of the SPP (Statistics Sweden (2004a)). The most important and often used process steps use different methods, with an insufficient coordination between the processes and this makes the need for standardization even more obvious (Lyberg (1998)). In an internal report, suggestions of processes to standardize included questionnaire design, interviewer training, nonresponse follow-up and call scheduling. One important roadblock over time has been the definition of the SPP. Inspiration was collected from Statistics New Zealand and this resulted in an SPP mapping specific to Statistics Sweden. The work with improving subprocesses and specific process steps can now be done from a holistic point of view (Bergdahl and Lyberg (2004)). One interesting aspect is the fact that with a standardized and well documented SPP surveys can be handed over to others efficiently without the need to start all over again every time there is a change of survey manager or some other vital position (Statistics Sweden (2004a)).
3.3 The standardization project Lotta
One of the first actions from the new Director General in early 2006 was to conduct a survey of all methods and tools used by the approximately 200 statistical products at Statistics Sweden. The result was striking and showed that a major collection of home-made solutions was present. All problems described above were not just fears and the situation was as bad as it seemed (Sundgren (2007)). The vision of being a world leading agency stated in the strategic plan for 2003-2007, would be unrealistic and documentation had to be adopted into terms that the agency could work with (Bergdahl and Lyberg (2004)). In August 2006, Lotta with the full length name more efficient production process, an extensive reengineering project, started. The overall idea of this reengineering project was to decrease the number of methods and tools used, to standardize them and thereby create a base of future continuous improvement. To reach this base level a number of projects had to be conducted covering various steps of the SPP.
24

3.3.1 The story of Lotta The organization of Lotta, shown in Figure 4 below, contains three overarching projects: P1, P2 and P3, each with a project group responsible for an abundance of subprojects. Projects in P1 concern the development of standardized processes and common tools while P2 projects handle the development of systems for quality assurance, quality control and evaluation. In particular, there is a P2 project with the mission to choose and suggest an implementation plan for a QMS. The third main project, P3, is responsible for management issues and skills development necessary to implement this new thinking.
Figure 4 The Lotta project organization (Östergren (2006))
The project leaders in each main project are responsible that a working plan and project descriptions are produced, according to the chosen project model. Projects are in general three months long, intensive and producing a report that is followed up in the main projects. The intention is to do more, in shorter time and to get a more useful result compared to previous development work procedures (Bergdahl (2007)). As mentioned, Lotta started in August 2006 and continues until the end of 2007 when a decision about the future is taken (Statistics Sweden (2006a)). According to Bergdahl (2007), key aspects and a prerequisite to achieve the goals of Lotta are the entirety and the linkage between management issues and standardization issues. They go hand in hand since development of one part will not solve the problems. At the same time, it is important to point out that the goal of Lotta is the focus on similarities. Processes should be viewed and concretely designed and constructed as systematic variations of one standard solution using a common set of methods and tools. This does not mean that there should be one system that takes care of all data, but limited numbers of methods, tools and components that flexibly may be combined to meet the requests (Sundgren (2007)).
25

Further, every step of the SPP should be performed in a cost-effective way with an assurance of the quality and the work done in Lotta projects should include and profit from the total knowledge and experiences of Statistics Sweden (Statistics Sweden (2006a)). Within many P2 projects benchmarking has been a standard element, setting off the work for the project group. In the beginning of Lotta a number of specific benchmarking projects were run and fortunately Statistics New Zealand visited the agency to share experiences and documents since that agency went through a project similar to Lotta a few years ago. Further, an external consultant has been invited a few times to share his experiences as an expert within some areas (Statistics Sweden (2007a)). One of the first projects performed was the project benchmarking of systems for quality assurance, quality control and evaluations. The project group studied a large mass of external information sources including e.g., standards developed in the U.S. Federal Statistical System, ISO 20252 on marketing, opinion and social surveys, quality guidelines and quality frameworks, audits and so called standard operating procedures, Six Sigma and the Committee of Sponsoring Organizations of the Treadway Commission (COSO) (Statistics Sweden (2007e)). An extensive project has been the editing of survey data, a project that studied nine major products at Statistics Sweden. Editing is in some products a large part of the product budget and there is a need and opportunity for streamlining. The project goal was to find a toolbox, containing statistical methods as well as IT modules, for the editing parts in the SPP that can fit as many products as possible. The nine case studies were intended to generate the most relevant parameters in comparison to each other and from a customer perspective. Further, process data of the current editing methods and descriptions of weaknesses in this process step were desired. Difficulties arose during the project since some of the cases could not be completed because of the lack of basic trace data. The project resulted in recommendations for editing tools containing two modules. The first module comprises selective ways to prioritize editing, e.g. by a global scoring function. The second is to find a practical user interface. These two modules will be developed in separated but integrated projects during the coming year and can hopefully be implemented into the process steps relatively soon (Arvidson (2007) and Statistics Sweden (2007h)). Another example is the extensive P3 project giving a structural proposal of the new process oriented organization. Key words have been the entirety of the organization, customer focus, efficiency and interaction (Statistics Sweden (2007c)) and these changes are necessary in order to achieve standardization, increased process efficiency and more satisfied customers (Sundgren (2007)).
26

3.3.2 Statistics Sweden after Lotta In September 2007, the Director General presented the structure of the new organization at Statistics Sweden, first for all Directors and Heads at the Director’s meeting and then for all employees at the annual employee’s day. The intention is to have an implementation plan ready by the end of the year and the new process oriented organization in place. Simultaneously, a QMS will be implemented step by step (Statistics Sweden (2007d)). The last months of 2007 will be very demanding on all parts of the organization with an integration of both statistics production and the separate and synchronized work of structural changes and ongoing and new Lotta projects (Statistics Sweden (2007d)). It requires an important commitment to and understanding of the changes and the new roles from both Directors and key employees and eventually by all employees, in order to make the transitions as smooth and easy as possible (Statistics Sweden (2007a)). An internal report shed some light on what basis the changes could be made: the current status, the future status and the change of status (Statistics Sweden (2007d)). Sundgren (2007) is of the opinion that in order to achieve full beneficial results of the work with the standardization of methods and tools, it is important that maintenance and improvements of the processes are managed in a disciplined way. The results from Lotta will generate nonoptimal processes. The standards introduced first will have flaws but should be considered a good base of common tools and processes to work with in the future. Meanwhile, the results will show gradually and Statistics Sweden needs to find a way to protect the employee’s skills and to develop them concurrently with the changes to make these benefits optimal (Statistics Sweden (2007e)). It should be pointed out that even after Lotta and the structural changes it will still be possible to recognize different statistical products and corresponding production systems. Each product will have a product owner responsible for design and production from customer order to output delivery, but the product owner will not be free to choose methods and tools for the production of the product. They will be prescribed by those responsible for the standardized processes, the process owners (Sundgren (2007)).
27

4 Accessible Quality Management Systems A QMS can be seen as a comprehensive strategy, based on guidelines and routines from norms established by management, of how to work with quality issues in the everyday activities. Karlöf and Lövingsson (2007) claim that every organization has a management system in general, no matter how rudimentary it is, otherwise the organization cannot function. In particular, a QMS, as well as systems controlling other areas, e.g. environment, is required for structure and a general view of the quality. There is no unique composition of how a QMS is structured but it is essential that the approach is based on the vision and mission of the organization. Some components are necessary in order to make the work successful. There has to be a descriptive framework of the organizational structure and based on that structure a system for continuous improvements can be formed. As a verification that both the structure and improvement strategy are functioning correctly and efficiently, an approach for internal auditing is also needed. See an illustrative presentation of the components in Figure 5 below.
Figure 5 The components of a Quality Management System
This chapter discusses the framework and the system and is divided into five parts. First, there is a short discussion about how quality work can be motivated through quality contests and awards. Second, an abundance of self-assessment models are discussed in conjunction with the framework discussion. Third, an introduction to the ISO standards is given. Fourth, there is an account for different systems for continuous improvements, including TQM that was mentioned in Chapter 3 as a previous quality approach at Statistics Sweden. Finally, a summary discussion of integrations between the approaches is given, showing that they are permeated by the same basic concepts.
28

4.1 Motivate quality work through quality contests
In every part of our society we want to compare ourselves with others. The situation is not different in the world of statistics. Wherever you turn there are natural comparisons trying to figure out what agency or company is best at a certain method, survey or product. Sometimes best can mean the best quality and that is the definition that brings meaning to this discussion. During the 1990s two statistic production contests organized by Time Magazine took place, with Statistics Canada and The Australian Bureau of Statistics as winners respectively. One may simply ask the question if it is justified to compete in quality and there is no straightforward answer to give. Through prestigious international awards, like the EFQM Excellence Award in Europe and the Malcolm Baldrige National Quality Award in the U.S., companies in general and statistical agencies in particular can get the most objective ranking among themselves. Nation-wide there are e.g., awards in Canada and Japan: the Canada Awards for Business Excellence and Japan’s Deming Award respectively (Colledge and March (1993)). All these awards are mostly based on the scores received in so called self-assessments, self-evaluations, and even though the quality frameworks that are used are meant to be general there is always a subjective factor to consider. In addition to the global contest mentioned above, that is not done anymore, and international awards, most statistical agencies have internal quality awards, annually celebrating the best employee or team working with quality issues (Marker and Morganstein (2004)). Such awards can naturally motivate individuals, groups, units or even departments to strive and inspire for development, adopt ideas from others and implement already working systems seen as role models regarding the quality.
4.2 Self-assessment models
In order to fully take advantage of the effects from a system for continuous improvements, there has to be a base in terms of a structured quality framework within the organization. Most systems theoretically assume that a framework is in place and that improvement areas can easily be identified. The focus here lies on the quality frameworks. First, there are so called excellence models: one Swedish model, two European models and one U.S. model will be discussed to illustrate slightly different approaches. Second, two other types of self-assessments specific for statistics organizations are presented. Finally, there is a shorter description of a simple management system, the balanced scorecard. Altogether, these give a broad selection of self-assessment models. A summary of the criteria in the self-assessment models described in this thesis is presented in Table 1.
29

Criteria SIQ EFQM CAF BNQP BSLeadership X X X X Information and analysis X Partnership and resources X X Measurement, analysis, and knowledge management
X
Policy and strategies X X X X Employees development X X X X X Process management X X X X X Business results X X X X Customer focus X X X X X People results X X Society results X X Financial X
Table 1 The criteria of different self-assessment models
4.2.1 The SIQ Model Since 1990 the Swedish Institute for Quality (SIQ) has acted as an independent, guiding institution striving to improve and spread quality thinking in all parts of the Swedish society: regions, communes, universities, companies and organizations. Four years earlier the National Committee for Swedish Quality was founded as a result of the need for a systematic, effective quality work and to enhance the competition and level of competence. Today SIQ functions as a development centre supplying organizations with a well defined program, the SIQ Model for Customer Oriented Organization Development, instructing how to work with quality issues. It is a comprehensive model and gives structure, a common language and important values stimulating a systematic improvement work. The model is based on three cornerstones: systematic, structure and culture, which create the broad, necessary base needed to introduce and eventually work with these questions in an organization. First, it is systematic in the sense of getting to know your organization and identifying what you do, how you do it and where it leads you. Second, the organized structure with the customer, the employee and the work processes in the centre is characterized by the four step principle: prepare, map, evaluate and continuously improve. Finally, the culture leans on the thirteen fundamental concepts: customer orientation, committed leadership, everyone’s participation, skills development, long-term development, society responsibility, process orientation, preventive actions, continuous improvements, learning from others, faster reactions, decisions based on facts and cooperation. Altogether, this base is used to implement the quality framework and to perform a self-assessment of the organization, using the seven criteria listed in Figure 6. The criteria are leadership, information and analysis, strategies, employee’s development,
30

processes, results and customer satisfaction. Both the aspects of how the criteria are approached and the result are considered and each criterion contributes with a certain weight, depending on the importance and extent of the area, to an overall score calculated in an assessment matrix. Scores, ranging from 0-1000, help to compare the organization with others on the seven graded scale from beginning quality awareness to excellence and also function as the measure if the organization apply for the Swedish Quality Award (SIQ (2007a) and SIQ (2007b)).
Figure 6 The seven criteria for self-assessment in the SIQ Model (SIQ (2007))
4.2.2 The EFQM Excellence Model The self-assessment model adopted in line with the quality work within the European Statistical System and Eurostat is the EFQM Excellence Model (Eurostat (2007) and Lyberg and Elvers (2003)). It was in the late 1980s when chief executive officers in a group of prominent European organizations developed the quality framework that today is one of the most used, comprising more than 700 organizations and 20000 employees across Europe, and signifying the essence of the European Foundation for Quality Management (EFQM®). Excellence is, by EFQM, defined as the outstanding practice in managing the organization and achieving results and this thinking permeates the entire network. EFQM is a provider of events and training in their model, as well as the manager of the annual EFQM Excellence Award event (EFQM (2007)). Applicable to all types of organizations irrespective of sector, industry or size, are the eight fundamental concepts: results orientation, customer focus, leadership and constancy of purpose, management by processes and facts, people development and involvement, continuous learning, innovation and improvement, partnership development and corporate social responsibility. They are composed to cover all areas of an organization where a self-assessment can be applied and the aim is to find the focus areas with possible weaknesses where improvements can be accomplished (Wong and Dahlgaard (2003)).
31

Some of the major advantages with the EFQM model are the common language and the general definitions, enhancing international collaboration and communication. Along with the united strive towards excellence this gives members the access to a massive programme and professional material on how to adopt and implement the quality framework in the organization (EFQM (2007)). Highlight is the self-assessment based on the nine criteria systematically linked to the fundamental concepts. The criteria are presented in Figure 7, accompanied by a percentage, representing the weight when calculating the total assessment score. An organization can receive a total of 1000 points according to the so called RADAR logic: Results, Approach, Deployment, Assessment and Review.
Figure 7 The nine criteria for self-assessment in the EFQM Model (EFQM (2007))
The scoring is calculated in a specially designed matrix with cells linked to both the fundamental concepts and the model criteria (EFQM (2003)). Half the sum comes from the five so called enablers: leadership, policy and strategy, people, partnership and resources and processes, and half the sum from the four result areas: customer, people, society and key performance. Each criterion has several subcriteria, e.g., leaders reinforce a culture of excellence with the organization’s people under the leadership criterion, policy and strategy are based on the present and future needs and expectations of stakeholders, under the policy and strategy criterion and processes are improved, using innovation in order to fully satisfy and generate value for customers and other stakeholders under the processes criterion (EFQM (2003)). Since 1992 the EFQM Excellence Award has been given to European organizations, representing the achievement of a journey towards excellence. The award winner is determined based on the scoring from the RADAR logic. To give an example of the usefulness of the model, EFQM and the British Quality Foundation (BQF) sponsored a research, based on publicly available resources, to identify correlation between adoption of the EFQM Excellence Model and improved business performance in European organizations. The study indicated that when the model was implemented efficiently, and especially among award winning organizations, performance was improved on both long and short time periods (Boulter et al (2005)).
32

4.2.3 The Common Assessment Framework On the demand from member countries of the Innovative Public Service Group (IPSG) a first version of the Common Assessment Framework (CAF) was developed in the year 2000. Two years later a revision was presented, the same version as is used today. The CAF is a self-assessment program, with a structure for analysis and methods for assessments of official organizations, emphasizing three main purposes: a support for authorities in public administration and its improvement work, a link between different models and systems for organizational development and a simplification for authorities to do benchmarking projects within and between EU members. It is designed for members of the EU, on national, regional and local levels, and highly inspired by the EFQM Excellence Model (Statens kvalitets- och kompetensråd (2003)). It is interesting to notice that the CAF model is in the public domain, hence free of charge, and organizations are encouraged to use and to be inspired by the model. The nine criteria for the self-assessment are: leadership, strategy and planning, human resource management, partnership and resources, process and change management (five enablers criteria), customer/citizen-oriented results, people results, society results and key performance results (four results criteria). One major difference between the EFQM and the CAF models is the extent of work needed. The CAF model is considered a simplified version of the EFQM model, suitable to get an initial impression of the resource and performance of an organization. It can be used as a first step of quality management and a continuation with e.g., the EFQM model is recommended (CAF (2002)). Apart from the nine criteria, some of the important aspects when evaluating an organization according to the CAF model are a committed leadership, the outgoing level of the provided services, i.e. the customer focus, the innovation and management of improvement work and the extent of goal achievement (Statens kvalitets- och kompetensråd (2003)). The CAF model offers a performance plan how to utilize the model in the most efficient way. First of all, the commitment from top management is immensely important and a prerequisite for success since it adjusts the self-assessment to fit the organizational structure and how to implement it. Next, a project leader is chosen, guaranteeing to spread knowledge, information and documentation of the ongoing work. Further, a self-assessment group is created, members recruited and among them a leader selected. Each self-assessment group is small and presumably efficient, consisting of 6-8 employees with a good understanding of the CAF model and the principles for an assessment. Then, under strict time limits, each member evaluates a chosen part of the organization based on the nine criteria. Together the group is assumed to reach a consensus of results and to develop a consequence plan. Finally, the self-assessment group recommends how to continue the quality work, either with another framework or applying for a quality award (Statens kvalitets- och kompetensråd (2003)).
33

4.2.4 The BNQP Excellence Framework
The single most influential document in the modern history of American business (MBNQA (1998)) are words aimed towards the criteria document of the Malcolm Baldrige National Quality Award (MBNQA). Experts claimed that the document meant so much more than a single quality contest and that it was above TQM, signifying a major breakthrough in the quality work area. It was at the end of the 1980s, more precisely in 1987, when the businessman Malcolm Baldrige founded the Baldrige National Quality Program (BNQP), an organization playing an important role in describing best work methods in almost all categories of both local and world-wide organizations: government, manufacturing, service, education, health care and nonprofit businesses, small as well as large (Raisinghani (2005)). The following year the first Quality Award was given to Motorola, which was the first organization structuring their quality work according to Six Sigma. Motorola drew the attention to Six Sigma and to the BNQP as well, spreading the information and made these popular.
Figure 8 The seven criteria for self-assessment in the BNQP Model (BNQP (2007))
The BNQP Performance Excellence Framework is designed as a self-assessment tool based on seven criteria: leadership, strategic planning, customer and market focus, measurement, analysis, and knowledge management, human resource focus, process management and business results, see Figure 8. The criteria are used to educate the organization and, apart from the self-assessment, apply for the Quality Award. One of the arguments that the BNQP is preferable over other similar self-assessment models is the fact that it is based on common sense, basic requirements and not focusing on procedures. Further, it is applicable with systematic Six Sigma or Lean Manufacturing tools and techniques and the ISO standards (BNQP (2004)).
4.2.5 The European Statistics Code of Practice In order to assure a high quality in the production and dissemination of European official statistics, the European Statistics Code of Practice was adopted in February 2005, implying that Eurostat and member states of the EU commit themselves to
34

have an approach for this mission. The practice is based upon the ESS quality dimensions and has two main purposes: one with external and one with internal focus. The external focus involves the wish to improve trust and confidence in the independence, integrity and accountability of NSIs and Eurostat as well as the credibility and quality of the statistics produced and disseminated. The internal focus involves the wish to promote and enhance the quality of statistical principles and methods, used by all European statistics producers. The practice is addressed for information to both data providers and users of statistics. Governance authorities and statistical authorities, as well as their employees, can implement the fifteen principles included in the practice. The principles are grouped into three main areas: institutional environment, statistical processes and statistical output. Each principle has a set of indicators to facilitate the comprehension of the contents, giving a reference for reviewing the implementation. Since an account of all fifteen principles will be too extensive to present here, they are all listed in Table 2, only some of them, the most relevant to the topic of this thesis, are highlighted.
Principle 1 Professional Independence Principle 2 Mandate for Data Collection Principle 3 Adequacy of Resources Principle 4 Quality Commitment Principle 5 Statistical Confidentiality Principle 6 Impartiality and Objectivity Principle 7 Sound Methodology Principle 8 Appropriate Statistical Procedures Principle 9 Non-Excessive Burden on Respondents Principle 10 Cost Effectiveness Principle 11 Relevance Principle 12 Accuracy and Reliability Principle 13 Timeliness and Punctuality Principle 14 Coherence and Comparability Principle 15 Accessibility and Clarity
Table 2 The principles of the European Statistics Code of Practice (Eurostat (2005))
4.2.6 Development of a Self-Assessment Programme
In 2002 the Eurostat project Development of a Self-Assessment Programme, led by the LEG Implementation Group, resulted in an easy-to-use, generic self-assessment tool with the same name, DESAP. It is designed in a process-oriented way and the self-assessment is based on a questionnaire, a checklist, covering all phases of a statistical survey: decision to undertake a survey, survey design, data collection, data capture and data processing, data analysis and output quality, documentation and
35

dissemination and improvement cycle. DESAP is available on the Eurostat quality website and the initial intention was that DESAP should be used together with other quality frameworks or self-assessment models. The design has several open-ended questions giving constructive results, displayed in a so called cobweb diagram. The cobweb diagram is circle shaped, with all six ESS quality dimensions mentioned in the previous section spread around the edges, and where higher scores are indicated by being further from the centre. As the results are presented in this manner, all criteria of statistical quality are considered and presumably achieved in the observed survey, fulfilling the main purpose of DESAP to assure the overall survey quality. Further, the DESAP also provides guidance on potential quality risks and what improvement measures can be taken, hopefully used in a process that ends by prioritising the ideas identified (Broene (2005), Colledge et al (2006) and Eurostat (2003)).
4.2.7 Balanced scorecard In their book, Karlöf and Lövingsson (2007) describe a balanced scorecard as a simple and pedagogical structured tool to handle important management aspects like customer satisfaction, employee satisfaction, process lead time etc. The balanced scorecard methodology goes back to fundamental key concepts in e.g., TQM: customer defined quality, continuous improvement, employee empowerment and measurement based management and feedback and it was first introduced in an article by Kaplan and Norton in 1994. It is not only a measurement system, but a management system, an approach to strategic management based on four perspectives: financial, learning and growth, customer, and business process. The balanced scorecard suggests an organization to, relative to each of the four perspectives, develop metrics, collect data and analyze it (Arveson (1998)). See Figure 9.
Figure 9 The four perspectives of a balanced scorecard (Arveson (1998))
36

The analysis should describe the long-term achievements in the organization, what has to be done to get there and what indicators need to be measured to control the development (Karlöf and Lövingsson (2007)). Methods connected to a balanced scorecard can be used to steer e.g. an authority regarding different strategic view points, focusing on the balance between long- and short-term goals, stability and changes and internal and external processes (Statens kvalitets- och kompetensråd (2003)). To more closely describe the four perspectives in a balanced scorecard it is important to have in mind one critical consideration in performance improvement. It is the creation and use of performance measures and indicators: e.g. characteristics of products, services and processes, selected to represent what leads to improved customer, organizational and financial performance. The learning and growth perspective includes employee training and awareness of cultural attitudes related to both individual and group constellations. The business processes focus on the internal processes and as mentioned above, the balance between internal and external processes. To succeed financially does not only include financial data but also assessment and cost-benefit data. Finally, the customer is possibly the most important aspect in the balanced scorecard as in all self-assessment models described throughout the chapter. Arveson (1998) said that recent management philosophy has shown an increasing realization of the importance of customer focus and customer satisfaction in any business. These are leading indicators: if customers are not satisfied, they will eventually find other suppliers that will meet their needs.
4.3 ISO standards
The ISO standards are descriptions of activities in different focus areas in organizations of varying kind. Here, the ISO 9000 series and the ISO 20252 will be presented, since those are the standards related to Statistics Sweden and the current selection of a QMS. It should be mentioned that e.g., quality work with a structure according to an ISO standard does not replaces the quality frameworks and the systems for continuous improvements. Instead it is rather a complement that encourages further developments and can be used as a platform for quality work and functions as a catalyst to get a few steps ahead on the market as adaptation to suitable standards becomes more common.
4.3.1 The ISO structure The International Organization for Standardization (ISO) 9 is the world’s largest developer and publisher of international standards. 157 countries are members of this nongovernmental organizational network with the central secretariat in Switzerland. 1946 was the starting point for the organization with an objective to facilitate the international coordination and unification of industrial standards and today there are over 12000 standards (ISO (2007)). There is both the European Committee for Standardisation (CEN) as well as the Swedish Institute for Standards (SIS), 9 ISO, derived from the Greek isos, meaning equal, is always the short form of the organizations name no matter the language (ISO (2007)).
37

responsible for the standards on a global and national level, respectively. CEN comprises the national institutes of the EU countries plus some other associations and countries (CEN (2007)). SIS is a member of both CEN and ISO and has 1400 members from both private and public sectors (SIS (2007)).
4.3.2 ISO 9000 series Two of the most prominent standards, implemented by almost 900000 organizations, are the ISO 9000 and ISO 1400010 family series regarding quality management and environmental management. The ISO 9000 series comprises four standards that were first developed in 1987, with an update in 1994 and the current standards11 are from the year 2000 with expected revisions in 2009 (CEN (2000) and ISO (2007)). The four standards are:
• ISO 9000 Quality management systems – principles and terminology • ISO 9001 Quality management systems – requirements • ISO 9004 Quality management systems – guidelines for performance
improvements • ISO 19011 Guidelines for revision of quality management systems.
Raisinghani (2005) summarizes in an easy way that the ISO 9000 series is not a QMS in itself, but it is a set of quality standards that are defined as being necessary for manufacturers and service organizations to be effective competitors. The ISO 9000:2000 standard is based on eight principles: customer focus, leadership, involvement of people, process approach, system approach to management, continuous improvement, factual approach to decision-making and mutually beneficial supplier relationships. It includes more formal definitions of widely used concepts, such as quality, QMS and process, with the intention to give a common language for all users (CEN (2000)). The ISO 9001:2000 standard is the only standard in the series available for certification and provides a set of standardized requirements for a QMS, irrespective of sector, industry or size of the organization. The central part of these two standards, as well as the ISO 9004:2000, is divided into four areas: management responsibility, resource management, product realization and measurement, analysis and improvement (ISO (2007)). Generally, there are two ways to implement a standard, either to standardize the practice or to practice the standard. Once the standard is implemented it requires a self-audit of the QMS, i.e., proper verification and control of the processes and activities. In addition, customers can be invited with the purpose to give them the confidence that products or services will meet their requirements. A certification can
10 The ISO 14000 family series describes among other things how organizations can minimize the harmful effects on the environment caused by its activities, and to achieve continual improvement of its environmental performance (ISO (2007)). 11 ISO 9000:2000, ISO 9001:2000, ISO 9004:2000 and ISO 19011:2000 (ISO (2007))
38

be done, but it is not mandatory, though considered to give future advantages when competitors are certified as well. The system can be used as a platform for continuous improvements and functions as a catalyst to get a few steps ahead on the market. In case of certification, it is done by an external third part and there is an eight step guidance: map and standardize the processes, evaluate the current quality work based on the demands in the ISO standard, identify what changes needs to be done, develop and document the new procedures, collocate a quality manual, do a first evaluation by analyzing the manual, invite externals for evaluation visits and finally, certification according to the ISO 9001 standard (Bergman and Klefsjö (2002) and ISO (2007)).
4.3.3 ISO 20252 During the last years representatives from Statistics Sweden have taken part in the development of a new standard, the ISO 20252 standard on Marketing, Opinion and Social Research (MOS). The standard comprises the following parts: terms and definitions, management systems requirements, managing the executive elements of research, data collection, data management and processing, report on research projects and a bibliography. The requirements of a QMS includes e.g., a quality policy, the possibility to do follow-ups of processes and methods, control of suppliers, a system for documentation and handling customer complaints, internal revisions and a strategy for skills development. There are other specific demands, more or less detailed, with the intention to assure the quality of the products and services. The development of MOS was a three-year process and future revisions are possible. The standard is out on the market and statistical agencies, including some departments at Statistics Sweden, will be heavily affected by it. Statistics Sweden has to decide how to handle the new standard: with either a formal certification, self-declarations including internal revision or no measures taken (Lyberg (2007b)). Whatever approach is taken, the standard will be available with the intensions to increase the quality for the customer by, e.g., reduced errors and shorter cycle times. For the moment there is no formal decision on how Statistics Sweden will act.
4.4 Systems for continuous improvements
In the beginning of the chapter the quality frameworks were presented while the focus here is set on the systems for continuous improvements. These systems represent a way of thinking. An organization should never settle with the way things are and constantly strive for improvements. Marker and Morgenstein (2004) describe the six key factors in the model for continuous quality improvement (CQI): top management commitment, structure of the organization, self-supporting operations, excellent communications, teamwork and continuous improvement. These are, in theory, simple factors representing common sense in achieving positive results and satisfactory improvements. In practice they have to be turned into realistic
39

strategies that can be understood by any employee. Early systems and models are e.g. zero defects at Ford Motors and Quality Circles at companies like Honeywell and Fairchild Electronics (Raisinghani (2005)). They are, as well as TQM, all part of the Japanese Kaizen philosophy12 that has set the mark and inspired and contributed ideas, thoughts and methods (Karlöf and Lövingsson (2007)). In this chapter four approaches are presented: TQM, Six Sigma, Lean Manufacturing and process management.
4.4.1 Total Quality Management Total Quality Management (TQM) is a top-down, customer-focused management methodology with the main purpose to empower organizations for self-improvement. One of the main goals of TQM is increased customer satisfaction with decreased resource consumptions (Bergman and Klefsjö (2002)). If an organization has not worked according to the TQM philosophy before, the introduction requires extensive cultural changes. Otherwise the implementation cannot be comprehensive enough to allow all the changes that follow (Raisinghani (2005)). A central idea within TQM is the Shewhart PDCA cycle: plan, do, check and act, signifying the order of activities in all TQM work (Bergman and Klefsjö (2002)). The origin of TQM comes from Japan when the Kaizen philosophy was formed. In the 1960s and 1970s quality inspections and the 5S13 were developed into Total Quality Control (TQC) and the trademark made in Japan went from being associated with poor quality and cheap products to standard level quality with low prices. In the 1980s TQC became TQM, signifying high quality with standard prices (Yamada (2007)). The precursor of TQM, Quality Management (QM) comprises the same thinking but except for the totality in terms of permeating the whole organization. QM was a proven success for business organizations selling their products in the marketplace, but there has always been an uncertainty of the impact in statistical agencies, since they are operating in a different environment from businesses (Colledge and March (1993)). In their article, Colledge and March (1993) present arguments and discuss whether QM, or TQM as it would be named today, fit an organization working with statistics production. They make a distinction between governmental agencies and those working naturally with statistical data collection and dissemination. Mostly they see advantages but one interesting observation is the error perspective. TQM considers errors as defects and since statistical products will always contain errors it is clear that the high goals of e.g. zero defects cannot be achieved. The heart of TQM is the so called cornerstone model, see Figure 10: decisions based on facts, focus on processes, continuous improvements and everybody’s commitment. These are all values focusing on the customer with a committed leadership as a prerequisite for the entire model. Juran once said that he had never experienced a company achieving world class without devoted commitment from top 12 Kai = good, Zen = change (Karlöf and Lövingsson (2007)). 13 The 5S are sort, straighten, shine, standardize and sustain (iSixSigma (2007)).
40

management, thereby stressing the importance of that feature (Bergman and Klefsjö (2002)). TQM is about learning to manage, interpret, analyze and improve the processes within an organization using e.g. the seven Quality Control (QC) tools or the seven Management tools14.
Figure 10 The cornerstone model (Bergman and Klefsjö (2002))
The QC-tools are check sheets, histograms, stratification, cause-and-effect diagrams, Pareto diagrams, relationship diagrams and control charts. They are all described below except for the control charts which are presented in Chapter 6 (Bergman and Klefsjö (2002) and Ishikawa (1982)). Simple check sheets are the basic tool for data collection. The data is then used for different purposes: to assist in understanding the actual situation, for analysis, for process control, for regulating data and for acceptance or rejection of data. Histograms can assist when handling large amounts of data and are one useful tool to predict if the normality assumption is adequate. Specific adjustments can be made to fit the situation in question and these basic applications give valuable information to the user. Stratification can be helpful when there is a need for separating the data in time, units or origin. The so called 7Ms: management, man, method, measure, machine, material and milieu, are frequently used when conducting cause-and-effect diagrams15 to help identify reasons and relations between causes of occurred problems. A Pareto diagram is a practical tool to sort out the significant causes of any kind of occurrence and especially effective when there are numerous reasons for defects and the most vital need to be identified. It is designed so that the number of defects, the percentage
14 Problem decision chart, affinity diagram, relation diagram, tree diagram, matrix diagram, matrix data analysis and arrow diagram (Magnusson, Kroslid and Bergman (2003)). 15 Cause-and-effect diagrams are also known as fishbone diagrams because of their characteristic look or Ishikawa diagrams after their inventor (Bergman and Klefsjö (2002)).
41

of defects and the accumulated percentage of defects are all shown in a two-dimensional diagram. Together with the 80-20 rule16, stating that 80 percent of the defects are caused by 20 percent of the reasons, the Pareto diagram is commonly used in the world of industry, economy etc. Finally, relationship diagrams, or scatter diagrams, can show important relationships between either two factors or the result and one of its factors. Conclusions should always be based on facts and common sense since some relationships can seem inadequate for the situation (Bergman and Klefsjö (2002) and Ishikawa (1982)).
4.4.2 Six Sigma The literature considers Six Sigma to be a modern Quality Management System. Since this thesis includes other components in a QMS, Six Sigma will here simply be one example of a system for continuous improvements. This Six Sigma discussion contains seven parts: a brief historical account, the essence of the concept, a description of Six Sigma measurements and metrics, the DMAIC process, the Six Sigma toolbox, the belt system and finally a short summary. First, Six Sigma was developed in the late 1980s by Motorola CEO Robert Galvin. He wanted an improvement program with focus on the reduction of unexpected variation in order to be able to compete with the Japanese car industry and started working according to ideas that became significant to Six Sigma. Another pioneer is Jack Welsh, the CEO at General Electrics (GE). GE became one of the most successful users of Six Sigma, when it was introduced to the company board in the middle of the 1990s. Second, the systematic philosophy of Six Sigma is a top-down approach and one of the most emphasized features is top management involvement. It is important that the entire group of managers and employees is committed and work together and actively towards the same goals, which have to be related to the organization’s vision. Six Sigma is basically about reducing process variation and in a systematic approach improve the processes by using efficient methods and tools. Additionally the product and process quality is constantly related to the costs and improvements are based on critical to quality characteristics (CTQs)17. Brue and Howes (2006) summarize the concept in four focus areas:
1. Financials 2. Benefits for customers 3. Benefits for employees 4. Effects on quality
16 The 80-20 rule is also known as the vital few and the trivial many by Juran (Bergman and Klefsjö (2002)). 17 Magnusson, Kroslid and Bergman (2003) mention the three most common CTQs: critical to customer, critical to process and critical to compliance.
42

Third, since the measure of errors and the quality level are central notions and common to all organizations working with Six Sigma, there is a need to compare improvements and developments. Defects per million opportunities (DPMO) is the recognized error measurement and give a concrete label of the total product, process or organizational quality. 3.4 DPMO is the ultimate Six Sigma goal, corresponding to the value at 4.5 standard deviations )(σ for a standard normal distribution.18
This value is associated with a centred process. If the process is allowed to shift
σ5.1± 19 while maintaining the goal of 4.5 DPMO, a sigma value of six is obtained, hence the name Six Sigma. The DPMO is a measurement of the total quality and within Six Sigma there is a drive to do things right the first time, i.e., to avoid the cost of poor quality (COPQ), which is considered a key metric. In addition to the DPMO, other measures are the two sigma values : the short-term sigma value
and the long-term sigma value . The relation between these values considers long-term shifts and is
)(Z)( stZ )( ltZ
5.1+= ltst ZZ since the shift of σ5.1± is allowed. The 3.4 DPMO is a very ambitious goal but Six Sigma organizations have adopted these guidelines. Raisinghani (2005) illustrates in his article why it is important to set the goals high and why a 99 percent quality level is not enough. Consider the following:
• At major airports, a 99 percent quality level means two unsafe plane landings per day
• In mail processing, a 99 percent quality level means 16000 pieces of lost mail every hour
• In power generation, a 99 percent quality level will result in 7 hours of no electricity each month
• In water processing, a 99 percent quality level means one hour of unsafe drinking water per month
• In credit cards, a 99 percent quality level will result in 80 million incorrect transactions in the UK each year
Fourth, one central Six Sigma idea is the DMAIC process, an approach of how improvement projects are followed through. Very briefly DMAIC (Define, Measure, Analyze, Improve and Control) can be described like this. Start by defining the problems in the process in question from a customer perspective. Measure the adequate metrics and identify the underlying causes. Analyze the data and find the true root causes of the problems. Improve the process, i.e., move it up to a higher quality level and finally control that the process is behaving in the desired way and reaches a stable state.
18 The normal distribution has two parameters, μ and , which are its mean and variance. The
probability density function is usually denoted . A standard normal distribution has mean 0 and variance 1 and is denoted (Casella and Berger (2002)).
2σ),( 2σμn
)1,0(n19 A shift of σ5.1± is considered a natural behaviour of a process (Brue and Howes (2006)).
43

Fifth, there is an abundance of methods and tools that can be used in the project improvement process. Magnusson, Kroslid and Bergman (2003) have coined the 7x7-Six Sigma toolbox (containing the seven quality control (QC) tools, the seven management tools, the seven project tools etc.). The QC tools are all described above when TQM was presented and others appear throughout the thesis. As an example, the project prioritization matrix is now described in more detail. The project prioritization matrix (PPM) is a very powerful tool to decide what improvement project should be prioritized. Brue and Howes (2006) claim that project selection needs a problem, a process, a financial benefit, a metric, a goal and a customer metric. In the PPM, the feasible projects are listed and evaluated according to a number of weighted criteria, based on the organization’s goals. The evaluated score is multiplied with the criterion weight and then summarized to a total project score. Based on this result the improvement projects are objectively prioritized. Sixth, the well known Six Sigma belt system is introduced. It is a systematic structure of different key players that are important for the Six Sigma concept to function. The different roles and their responsibilities are presented in Table 3. Key player Role Responsibility LocationExecutive Leaders
CEO Commit to and promote Six Sigma in the organization
Centrally
Champion Hired expert Monitor and manage Six Sigma projects, select Black Belts
Centrally
Master Black Belt
Hand picked managers
Expert in Six Sigma tools and tactics, focus on process improvement
Locally
Black Belt Selected employees
Full time quality project leader Locally
Green Belt Selected specialists
Part time quality project member Locally
White Belt All employees Quality thinking in everyday work Locally Table 3 The Six Sigma belt system (Brue and Howes (2006))
Finally, since the Six Sigma concept is based on fundamental statistical methods and tools it is suitable for all types of organizations (service, industry etc.). It is adopted to result in long-term customer satisfactions. Mitra (2004) summarizes the three themes that Six Sigma represents:
• A metric (DPMO, sigma values, COPQ etc.) • A philosophy, i.e., quality improvement in all aspects of the organization • A methodology, i.e., quality improvement through reduction of defects
It should be mentioned that the account above, including the methods and tools, is only a selection. Six Sigma contains numerous other useful techniques and lately the
44

literature has expanded immensely. Brue and Howes (2006), Magnusson, Kroslid and Bergman (2003) and Park (2003) give interesting and more extensive presentations on the subject.
4.4.3 Lean Manufacturing
Lean Manufacturing (LM) is a production improvement concept developed in the 1990s, first described by Womack, Jones and Roos (1990) in their book The Machine that Changed the World. Ramaswamy (2006) summarizes the methodology in ten simple rules of lean: eliminate waste, minimise inventory, maximise flow, pull production from customer demand, meet customer requirements, do it right the first time, empower workers, design for rapid changeover, partner with suppliers and create a culture of continuous improvement. There is a set of lean tools, abstracted from LM and the Toyota Production System (TPS) and they are standardization, waste analysis, bottleneck analysis, flowchart, red-tag analysis, supply chain matrix, setup-time analysis and conjoint analysis (Magnusson, Kroslid and Bergman (2003)). Just-in-time (JIT) comes from the Japanese management philosophy that describes working ways that include resources to optimize time cycles, e.g. reduce waiting times and increase the effectiveness. JIT, with the simple device of the right thing, in the right place, in the right time, is strongly connected to LM and the notations are in some contexts unfortunately mixed (Karlöf and Lövingsson (2007)). Holmes and Balance (1994) describe a specific approach closely connected to LM. The approach is to ask why five times, or more, to get to the real core of the problem, and is extensively used by Toyota. The problem is described in specific terms and time is taken to give everyone that is involved a chance to contribute their opinions and suggestions. To discover the root causes of a problem and any correlations between causes it is important to be focused. A good Swedish example is Ericsson, whose corporate supply management decided to apply the LM principles in the mid-nineties. Every business area was to reduce lead times, capital employed and off-time by 50 % each year (Magnusson, Kroslid and Bergman (2003)). Further, Statens kvalitets- och kompetensråd (2004) listed in their report some activities that are considered as waste in the everyday work in Swedish government agencies. These activities do not add any value to the customer, e.g., unnecessary double work, answering questions as a result of poor communication and emergency measures. They wish that waste should be eliminated by preventive activities in order to avoid the frustrating problems from returning in the future. Finally, one brilliant example of an organization that has succeeded with inspiration in the LM methodology is Toyota, the Japanese car manufacturer. The Toyota Way is based on over 20 years of studies of Toyota and it describes the fourteen management principles behind their own production system and the Toyota Production System (TPS), including e.g. the five whys, JIT etc. The TPS should not be seen as a set of tools, it is a fully developed system, contributing to the overall picture: efficient organization, improvement of processes, production as well as
45

business, with a constant customer focus striving towards a lean production in terms of recourses and waste. One key aspect is the focus on the flow and waste and not on the costs which has sometimes been a trap for other companies in the same branch that have a lot to learn from Toyota (Liker (2004)). Further, Liker and Meier (2007) describe very thoroughly in their book The Toyota Talent, among other things, the responsibility of the company to develop people to their highest potential. The central idea is the way new employees are trained when they start working within the organization, the training within industry including immensely detailed job breakdowns and programs for both trainers and learners. The authors claim that work tasks can be associated with one of four types of work: craft, routine, nonroutine and technician work. Depending on the type of work the tasks can be more or less standardized and rationalized. More about the Toyota Production System and related issues can be found in Liker (2004), Liker and Meier (2007) and Dahlbom (2007).
4.4.4 Process management Process management involves a strategic discipline of documenting and measuring processes to identify opportunities for improvement. A set of tools is needed to systematically document and measure as well as monitor and control the processes (Ramaswamy (2007)). One objective is to arrive in a state where the overall thinking is in the centre and understand how all activities connect and relate to one another (Elvers and Eiderbrant (2007)). The approach is qualitative and allows early identification of problems that occur during e.g. a statistical operation (Aitken et al (2004)). It is an appropriate way of thinking when systems like Six Sigma and/or Lean Manufacturing are already implemented in the organization. With clear goals and a culture based on confidence and respect the results show gradually. Ramaswamy (2007) uses a six step process management model: identify the core processes, map the core processes, identify key customer and business measures, identify other measures, build the organization and manage processes. Further, he mentions a shift of focus during the process management introduction: project focus, organization focus and the ideal phase of transformation focus. Holmes and Balance (1994) emphasize the importance of benchmarking, i.e. the process of comparing the organization to other interesting organizations, finding and adapting best practices to improve the internal performance. A way of thinking, similar, but not identical to process management is Business Process Reengineering (BPR). In the early 1990s it was a popular trend introduced by Michael Hammer with the main objective to dramatically change the process structure from slow and inefficient to well defined, quick and profitable. Simplicity, standardization and rationalization are leading words and the processes are observed from the eyes of the customers. Continuous improvements and the Kaizen philosophy were not considered adaptable enough in the dynamic environment of modern society. The BPR top-down methodology with a committed management, clear limitations of employees and specialists for redesigning the processes started off with a blank sheet and built up
46

the organization from scratch. When BPR is applied, the organization has to make sure that enough resources in terms of time and money are available and to start the changes in areas where the needs are urgent. Today, BPR is not a commonly used system according to several reasons, e.g. its association with savings and downsizings (Dahlbom (2007), Forsberg (2007), Karlöf and Lövingsson (2007) and Statens kvalitets- och kompetensråd (2003)).
4.5 Summary of Quality Management Systems
Since quality management is such an abstract subject there is no unique or ultimate solution for an organization on how to work with quality improvements. First, two examples of combinations of the systems described above are presented: Lean Six Sigma (LSS) and Growth Management System (GMS). Further, a short discussion and summary is given on how models, standards, and systems can be integrated and maximally utilized.
4.5.1 Lean Six Sigma
LSS has no standard definition but is an integrated way of thinking that some organizations achieve operational excellence by combining the rigorous analytical aspects of Six Sigma with the cultural aspects of LM (Ramaswamy (2006)). Some LM and Six Sigma experts argue over which system is better so LSS contains a selection of the methods and tools that are best suited for the organization in question. LM contributes mainly with process flow optimality and waste reduction while Six Sigma focuses on reduction of variation by the DMAIC process and Design for Six Sigma (DFSS) (Magnusson, Kroslid and Bergman (2003)).
4.5.2 Growth Management System
GMS® is a registered trademark of Six Sigma Consultants, Inc. and is a fusion of the proven successful components Six Sigma, DFSS, LM, Knowledge Management (KM) and Supply Chain Management (SCM). The ideas are radical and users mean that it leads to sustained growth and huge profits in half the time of e.g. Six Sigma. This issue is discussed further in Brue and Howes (2006).
4.5.3 Integration of models, standards and system
In general, systems for continuous improvement assume that the organization is well described in a structured way thereby making it possible to identify problem areas where quality in the processes and improvement give the most visible and profitable results according to a predefined pattern. The different systems are all similar. They are all part of a development chain starting with the original ideas of quality management from ancient times via organized quality movements during the first part of the 20th century to today’s great collection of models, standards and systems. Some themes and ideas are still present in all of them. For instance, the idea of customer focus and decisions based on facts are always present.
47

TQM and Six Sigma are considered top-down philosophies while e.g. Lean Manufacturing is considered a bottom-up philosophy. The well described organizational structure can be based on the quality frameworks or on the standards in the ISO 9000 series. The quality frameworks, or excellence models, are also similar. Similar ideas are wrapped up in different packages. Table 4 gives an overview of some of the features of the standards and systems presented in this chapter. There are other aspects that are very important as well and this presentation only has illustrative purposes. When it comes to the decision of how to work with quality improvements a combination of the different models, standards and systems is common in many organizations. Management initiates a development of its own framework comprising a selection of suitable tools, ideas and methods taken from various established models and systems. Others adopt a recognized framework or the ISO 9000 standards and base their continuous improvement work on a “package deal”. Feature ISO
9000 ISO
20252 TQM Six
Sigma LM Process
Management Top-down X X X Bottom-up X Continuous X X X X Certification X X Process-based X X X X X Measurements X X X X Systematic approach
X X X X X X
Customer focus X X X X X X Table 4 A summary of some features in a Quality Management System
48

5 Quality Assurance and Quality Control Concepts such as quality assurance, quality control, process data and process control are important tools in all methods, standards and systems described in the previous chapter. This chapter discusses the two quality activities referred to as quality assurance (QA) and quality control (QC) while Chapter 6 is a presentation of process data, process control and a discussion about those two concepts. There is a significant though not obvious difference between QA and QC and the following quotation, taken from Poksinska (2007), refers mainly to measurements but summarizes the essence of both QA and QC: if you do not measure, you cannot understand. If you do not understand, you cannot control. If you do not control, you cannot improve. QA is simply the assurance that processes are capable of delivering the desired good products and services. QC makes sure the product or service is good enough by using e.g. SPC or acceptance sampling and some verification methods. QA means that approaches are in place but if they are not used or used incorrectly the QA is not enough. It has to be complemented by a QC system.
5.1 Quality Assurance
Montgomery (2005b) defines Quality Assurance (QA) as a set of activities that ensures that the quality levels of products and services are properly maintained. Further, he stresses the importance that quality issues between suppliers and customers are properly resolved. One important component for a functioning QA system is the formal documentation of quality activities. Development and maintenance of the documentation is an important QA aspect and according to Montgomery (2005b) there are four types of documentation, namely:
• Policy that explains what has to be done and why • Procedures focus on useful methods and the personnel that will implement
policy • Work instructions and specifications are supposed to give direction to
product-, department-, tool- or machine-oriented activities • Records are present to detect specific units or parts of products or services, so
that their producing process can be determined Documentation is also a basic prerequisite in all quality frameworks. Unfortunately documentation, which is a helpful tool, has been a roadblock for development and adaptation since many organizations have to make extensive efforts to get their internal documentation in line with e.g. ISO standards. During the last few years several QA activities have been in place at Statistics Sweden. Detailed checklists, CBMs describing the best method associated with each major process step, internal quality surveys, internal auditing, yearly plans for the organizational units, and a two-year rolling plan for quality initiatives are all part of the QA system. Lyberg (2004) gives a more extensive account on the issue.
49

5.2 Quality Control
The Japanese word for Quality Control (QC) is seigyo, but in the 1980s there was a mistranslation and the word kanri was used instead. This mistake helped to remove roadblocks for companies in their work toward achieving higher quality. Seigyo only implied reduction of variance while kanri also included improvement of the process target (Yamada (2007)). In general, organizations should strive to develop and manage error-free processes where processes are controlled from time to time by key process variables to see if they are stable. If a process is unstable, i.e. includes undesired variation, it cannot be accepted and an appropriate adjustment is needed (Lyberg and Elvers (2003)). Sundgren (2007) emphasizes the difference between the control flow that consists of a planning-monitoring-evaluation loop (compare with the PDCA cycle) which goes on as long as there is a production system, and normal execution flow. QC, i.e. the application of statistical methods to manufacturing and industrial problems, can be divided into three branches: process control, acceptance sampling and research and development (R&D) (Howell (1952)). The first two branches are included in this thesis while R&D is beyond this subject. One branch, according to Howell (1952), is process control, an approach much about determining what to do with parts of products or services that have been made, i.e. acceptance, rework or rejection, and whether the process in itself has to be changed or not. The main tools of process control, control charts, are usually used to monitor and observe the processes. Another branch is acceptance sampling, a method based on observing a specific sample and deciding whether the sample can be accepted or not (Ishikawa (1982)). The method was first developed in the 1940s by Dodge and Romig (1944) for individual purposes. Applications in the survey field are usually referred to as administrative applications of quality control methods (Biemer and Lyberg (2003)). Acceptance sampling can be used in coding and other survey operations that resemble an assembly-line to ensure that prespecified quality levels are achieved. The method has been criticized since there is no feedback loop included in the approach and error causes are usually not identified and eliminated (Biemer and Lyberg (2003)). An acceptance sampling plan is characterized by a prespecified lot average outgoing limit (AOQL), the lot sample size and the acceptance number. Here is a short illustrative example. Consider a lot of size N, a sample of size n and a number of defectives d. The acceptance percentage, or probability of acceptance, will be the total sum of the percentages up to an acceptable number of defectives c. Let e.g. N = 1000, n = 100, d = 20 and c = 2. Since the lot is relatively large and the defect fraction small, the can be determined from a Poisson distribution and
)(ap
)(ap)2()1()0()( pppap ++= . In this specific example the probability of
acceptance, 68.0)( =ap (Ishikawa (1982)).
50

6 Handling process data This chapter is a somewhat extensive presentation of how process data can be handled. First, there will be a presentation of the theory of statistical process control (SPC) including among other things a clarification of different causes of variation and statistical control charts and how they are interpreted. Second, the process data concept is studied. One way to see process data is as the raw material used for the SPC. Here, the meaning of it, namely different types of process data, how it can be used as well as some issues associated to the usage are presented. Third, the process data is related to how it is and can be used at Statistics Sweden. A lot of valuable input is received from the Lotta project Process data – 1st stage and from external consultants.
6.1 Statistical Process Control
Historically, statistical process control has it roots in the beginning of the 20th century. Already in 1924, Shewhart introduced statistical control charts (SCC) in the American industry (Montgomery (2005b)). The charts functioned as early warning systems, signalling that something was not correct in the production process. Still, the main purpose is to detect changes in processes, indicated by any abnormal observations of the data that has been collected and displayed in the chart. These observations and analysis of flow, lead times, capability etc. can help management to steer the activities in the right direction based on the process goals and the expectations and demands from the customers (Statens kvalitets- och kompetensråd (2004)). As a helpful management tool, upper and lower tolerance limits (UTL and LTL)20 for the process are set by the organization management based on the demands and factors that lie outside the frames of the product or service production.
6.1.1 Variation
Causes of variation are distinguished as one of two categories: common causes or special causes of variation21. A common cause is any source of variation that is natural in the process as a result of unknown factors and the process system is considered stable and in statistical control. A stable process is predictable and the outcome can be expected from time to time. Common causes are, in other word, inherent parts of any process while special causes are operating and affecting process systems that are said to be out of control (Brue and Howes (2006) and Montgomery (2005b)). In a statistical survey context, special cause variation can arise as a result of e.g. individual errors while the common causes are due to the process itself (Biemer and 20 UTL and LTL are in some literature also denoted as upper specification limit (USL) and lower specification limit (LSL). 21 The terminology for variation causes differs in the literature. Common cause is sometimes referred to as random cause and Shewhart used the notations chance cause and assignable cause respectively (Montgomery (2005b)).
51

Lyberg (2003)). Efforts and resources should be put in reducing or even eliminating the special causes since the errors they imply normally play a significant part when assessing the accuracy of the statistical product. Also, statisticians are interested in the bias as much as the variance since reducing variance may not always increase overall quality (Couper (2007b)) Further, to reduce variation and improve the quality in a statistical product in a broader context does not only imply that the statistical variance should be minimized but also to reduce the variation in management and supporting process systems (Snee (1990)). Snee mentions the importance of the statistical thinking in the work of variation reduction and the integration of general process improvements and specific variance improvements. At Statistics Sweden the standardization work that started during the Lotta project is one step on the road of reducing common causes of variation (Statistics Sweden (2004a).
6.1.2 Statistical control charts A statistical control chart (SCC) is a two-dimensional diagram where the x-axis represents, e.g., observations in time (days, hours etc.) or observation units (sample number, interviewers etc.) and the y-axis represents a relevant quality parameter (number, weight, ratio etc.). There are two main types of SCC based on either continuous or discrete data, and there are several variants of the two different types. In Table 5 below, there is a list of different types of SCC that are used for SPC, with both continuous and discrete data. The x -charts can be constructed using either the s- or the R-method. The difference appears when the control limits are constructed. In the table the R-method is used. If the accessible data is continuous the different types can be combined in x -s, x -R and xmR-charts, i.e., two graphs are plotted in the same chart. This gives a better opportunity to analyze the data since in, e.g., an x -R-chart both the mean value and the range can be considered simultaneously. Given a data sample, for each time unit an observation is plotted at the corresponding location in the chart. The observation can be a single measurement or an average value from observations. The latter is common when the data material is extensive and is historically set to five. When
nn 5=n , the mean is easily calculated without a
calculator by summing up the observations, multiplying by two and finally moving the decimal point one step to the left (Bergman and Klefsjö (2002)). The charts are analyzed in order to identify special causes for variation and they are constructed so that suspicious observations are found because they lie outside the control limits. The central line (CL) is placed at the total mean of the sample and functions as the quality indicator for the sample. At three sigma units, on both sides of the CL, upper and lower control limits are placed (UCL and LCL). The UCL and LCL are set at a certain distance from the CL to prevent so called false alarms and they are calculated from specific coefficients for each type of chart, see Table 6. The constants and depend all on the sample size. 3432 ,,, DBBA 4D
52

Type of chart
Type of data
Sample size
Feature CL LCL UCL
x -chart
continuous n > 1 mean value x RAx ×− 2 RAx ×+ 2
s-chart
continuous n > 1 variation s sB ×3 sB ×4
R-chart
continuous n > 1 range22R RD ×3 RD ×4
x-chart
continuous n = 1 individual observations
x mRAx ×− 2 mRAx ×+ 2
mR-chart
continuous n = 1 moving range23 mR mRD ×3 mRD ×4
np-chart
discrete constant defectives24pn )1(3 ppnpn −×− )1(3 ppnpn −×+
p-chart
discrete non constant
defectives p n
ppp )1(3 −×−
nppp )1(3 −
×+
c-chart
discrete constant defects25c cc ×− 3 cc ×+3
u-chart
discrete non constant
defects u nuu ×− 3
nuu ×+ 3
Table 5 Different types of SCC (Bergman and Klefsjö (2002) and Montgomery (2005b))
n 2A 3B 4B 3D 4D 2 1.880 0 3.267 0 3.2673 1.023 0 2.568 0 2.5744 0.729 0 2.266 0 2.2825 0.577 0 2.089 0 2.1146 0.483 0.030 1.970 0 2.0048 0.373 0.185 1.815 0.136 1.86410 0.308 0.284 1.716 0.223 1.77715 0.223 0.428 1.572 0.348 1.65220 0.180 0.510 1.490 0.414 1.586
Table 6 Constants for calculating the control limits (Bergman and Klefsjö (2002))
22 The range is the variability within each sample, i.e., the difference between the largest and smallest measured value. It is a measure of the variation of the quality indicator (Bergman and Klefsjö (2002)).
minmax xxR −=
23 The moving range is computed by taking the difference between two successive observations (Bergman and Klefsjö (2002)). 24 Defective is a unit that fails to meet acceptance criteria due to one or more defects (Holmes and Ballance (1994)). 25 Defect is a failure to meet one part of an acceptance criterion (Holmes and Ballance (1994)).
53

Generally the control limits are placed at three sigma units from the CL. How the sigma unit is determined depends on the type of chart, type of data and whether the sample mean and variance are known or unknown. Three sigma units are standard since a total of six sigma units are considered to be the natural variation of a process. The sigma unit is considered an approximation of the standard deviation. Six standard deviations include 99.7 % of the observations from a normal distribution, which is a good prevention of false alarms. No matter the type of chart or data, Raisinghani (2005) summarizes the usage of statistical control charts in a rather good way: the control chart functions as a tool that seeks for deviation from the optimum process output in a production process. Further, it uses proactive means to look for any process shift before the product quality is compromised. A further discussion of the SPC theory presented above and more illustrative examples are given in Bergman and Klefsjö (2002), Brue and Howes (2006), Holmes and Ballance (1994), Ishikawa (1982) and Montgomery (2005b).
6.1.3 Difficulties of statistical control charts Many problems can appear when SCC are constructed and analyzed. Continuous data is generally better for actually controlling a process while discrete data is easier and often cheaper to collect (Holmes and Balance (1994)). Further, continuous charts are frequently used in, e.g., the production industry and there are numerous application areas for them. Here, a few difficulties and thoughtful comments will be provided, focusing on discrete charts since those are the ones of interest in statistical production. Bergman and Klefsjö (2002) present some rules of thumb for deciding the sample size for a discrete p-chart. They assume, for simplicity in this case, that the sample size is constant:
n
• Choose n > 50 or np > 4 • Choose n so that the probability for at least one defective unit in the sample
is at least 0.90 • Chose n so that the probability to get an outcome in the first plotted
observation according to a specific change in p is at least 0.50 In the world of statistics, the discrete charts can be suitable in a number of situations and in particular the p- and u-charts are useful since they represent sample sizes that are varying. It might be worth mentioning that whereas in manufacturing the analyst is interested in both the UTL and the LTL, in many survey processes, statisticians are only interested in one control limit, e.g., for response rates (Couper (2007b)). In Japec (2005) there are some examples of the use of these control charts when studying interview surveys. One major issue in interview surveys is the fact that the interviewers are given varying numbers of assignments. Figure 11 below shows in an illustrative way how this results in broken control limits. The control lines are following a staircase line and are not constant as in continuous, np- or c-charts.
54

Figure 11 P-chart of response rates per interviewer in the Swedish ESS (Japec (2005))
In Figure 11 the observations on interviewers 3, 4 and 21 are outside the control limits. This means that these interviewers have a significantly lower response rate than can be expected from common causes of variation. Depending on several factors, the number of interviews can differ extensively, which creates a problem when theses results are analyzed. When observing an interviewer with a small assignment, the analyst should bear in mind that there is a possibility that the assignment might have a large part of difficult objects. Further, when these types of charts are studied, the work of finding the true root causes of the observations that lie outside the control limits is even more important since the differing and sometimes small sample sizes can themselves be error causes (Statistics Sweden (2004a)). In particular in the example above, the interviewers affected should get feedback and further analysis has to be done to determine the actual reasons for the negative results. To assure that the charts are properly analyzed there are some assumptions that have to be fulfilled. In their study of the Statistics Canada CATI26 system, Mudryk et al (2000) considered each interviewer to be an individual process, implying him or her to be a potential source of error and feedback is important in order to prevent the error. Statistics Canada has chosen to use yet another chart, the d-chart27, since it is
26 Computer Assisted Telephone Interviewing (Mudryk et al (2000)). 27 The d-chart is easy to implement and is applicable when the quality measure is an attribute count of flaws with a constant and independent sample size. In the CATI system the observations come from a mixed Poisson distribution (Mudryk et al (2000)).
55

appropriate for situations when observations that are out of control are automatically flagged and responded to under current feedback procedures.
6.1.4 Analysing control charts Statistical control charts can be analyzed within many fields and in many different ways. It is somewhat difficult to distinguish common information from useful information. Here are two areas on how the charts and the information they contribute can be used. First, a presentation of what is denoted as alarm theory, i.e., what are the signs that one plotted observation is an outlier or what are the signs that a series of observations are behaving strangely. Second, we provide a brief comment on process capability and different ways to measure it. The alarm theory contains several opinions of what is considered to be an alarm. The control limits in an SCC are calculated to prevent false alarms, but since there are unstable processes as well as individual observational errors, alarms for outliers will occur. The desired situation is the one where all the observations during a certain time period are randomly located within the control limits, i.e., the process is stable. When alarming situations arise, the observer wants a fast and effective way to discover them. The following is a summary from Brue and Howes (2006), Holmes and Ballance (1994) and Ishikawa (1982) of different situations when the process should be examined in order to prevent future problems. There are probably other similar situations when the observer should react but this is sufficient to describe some scenarios when an SCC is interpreted:
• At least one observation is outside or on one of the three sigma unit limits, i.e. we have an outlier
• Two out of three consecutive observations are more than two sigma units away from of the CL, on the same side of the CL
• Four out of five consecutive observations are more than one sigma unit away from the CL, on the same side of the CL
• Six or more consecutive observations are increasing or decreasing, i.e. we have a trend
• Seven or more consecutive observations are on the same side of the CL • Eight or more consecutive observations are on both sides of the CL with none
in the centre third of the control region • Fourteen or more consecutive observations are alternating up and down • Fifteen or more consecutive observations are within one sigma unit from the
CL, so called hugging of the CL • A series of observations are showing repetitive patterns, i.e. we have a
periodicity Process capability within tolerance limits of the process can be calculated and analyzed based on the information found in an SCC. There are four types of capability measures, all displayed in Table 7 below. To calculate the first two
56

indicators, the process standard deviation is either estimated by the sample standard deviation s or 2dR × 28, depending on what type of control chart is analyzed. The estimation in the last two indicators is the mean value of the sample standard deviation s . The literature provides different opinions of the usefulness of these indicators, but in general these indicators can give useful information when the process performance is measured and they can be used in numerous situations. Within Six Sigma, a lot of capability analyses are recommended and there are predefined tables with relations and transformations between these indicators, the long- and short-term sigma levels and the DPMO. For further reading on this and similar subjects see, e.g., Bergman and Klefsjö (2002), Magnusson, Kroslid and Bergman (2003) and Montgomery (2005b). Type of indicator
Notation Formula Feature Location
Process capability index
pC σ6
LTLUTL − Stable process
No account to location
Adjusted process capability index
pkC )3
,3
min(σ
μσ
μ LTLUTL −− Stable process
Account to location
Process performance index
pP σ6
LTLUTL − Unstable process
Long-term process location
Adjusted process performance index
pkP )3
,3
min(σ
μσ
μ LTLUTL −− Unstable process
Long-term process location
Table 7 Process indicators (Bergman and Klefsjö (2002) and Montgomery (2005b))
6.2 Process data
It is indeed complicated to grasp the meaning of process data as well as the usage of it. Hopefully, this presentation will help the reader to understand this relatively new term related to a concept that has always existed. The examples that are given throughout the reasoning are from statistical contexts. Process data29 is basically data, or information, about a process. Many, if not all, activities, in production as well as in services, are considered to be processes. This would imply that process data is data about all activities. To use that statement as a definition is not practical since data about all activities is a too broad definition. Instead, it is essential to see the process data from the perspective where it can be used. A vital aspect is to avoid the confusion when the process data in itself becomes more important than what the data is used for (Couper (2007b)). 28 R is the moving range and a constant that depends on the sample size (Montgomery (2005b)). 2d29 In this thesis the notion of process data is used but it should be mentioned that the literature sometimes uses the term paradata instead of process data (Couper and Lyberg (2005)).
57

6.2.1 Different types of process data In the literature, there is a distinction between micro and macro process data. In Table 8 below, there is a summary of different types of process data including these two distinctions, the level and the continuity of process data. In, e.g., the statistics production process (SPP) at Statistics Sweden process data exists at all levels. The process data are different in nature depending on where in the SPP you make the observation. The table should be considered as a three-dimensional matrix where several types can be appropriate for each specific situation. Type of process data Feature Examples Macro process data Global process
measures Response and nonresponse rates, coverage rates and refusal rates
Micro process data Measures on individual records
Flagged records, keystroke data
High level process data Information flow in e.g. the SPP
Quality declarations, product descriptions
Low level process data Within every subprocess of, e.g., the SPP
Adjustments in specific surveys
Ad hoc process data Irregular and only collected now and then
Development projects and process investigations
Systematically generated process data30
Regular and continuously collected
Discovery of performance problems in ongoing processes
Table 8 A summary of different types of process data, features and some illustrative examples (Couper and Lyberg (2005), Couper (2007b), Sundgren (2005) etc.)
6.2.2 Importance and use of process data
Process data can be used in various situations. One of the areas most connected to process data is statistical process control (SPC) where process data functions as the raw material to create statistical control charts. Process data thus fits as a basis for the SPC part of a framework for quality. This application is important since it constitutes the linkage between the information about processes in shape of process data, and gives the possibility for managers to make the decision to act or not to act in a specific situation, e.g. process evaluation or early warning systems. Apart from SPC, process data can be helpful in a broader perspective as input to, e.g.,
30 Systematically generated process data is sometimes denoted continuous routine process data (Statistics Sweden (2007g)).
58

methodological changes31, long run process improvements and organizational changes (Couper (2007b) and Couper and Lyberg (2005)). Further, there are many sources of input for process data, e.g., call reports, subprocess parts in the SPP (editing, coding, data collection etc.), metrics from questionnaires, specific systems (CATI, CAPI32, Web surveys, PIS33 etc.). These are frequent contributors of data, used to analyse interesting features. An example is Web surveys that record a wide array of process data that describe the process of answering a web questionnaire. There are two types of process data in this context: server side and client side process data (Heerwegh (2003)). Here are some other specific fields where process data is valuable:
• As an overview for monitoring and alarm system e.g., interviewer observations, digital recording and operations
• As an input to the design and evaluation of responsive designs, e.g., to guide changes in features to achieve higher quality statistics per unit cost (Groves and Heeringa (2006))
• As an input to research, i.e., the researcher can get greater insight into the process (Couper (2007b))
• As a reuse of process data from the same or other processes or process parts to compare development over time
• As indicators to see how different kinds of actors behave on websites, e.g., who the users are and their degree of satisfaction
• As process variables, i.e., defining and measuring process variables for future improvement projects. These situations allow statistical output managers to evaluate changes in statistical processes and to make decisions about cost-efficiency and improvement resources according to where they are most required (Aitken et al (2004))
6.2.3 Problematic issues concerning process data Even though there are many statistical fields and specific surveys where process data is useful, a number of problematic situations should be avoided. The intention here is to identify some of the problematic issues that can arise, and, when appropriate, contribute with a remark or a comment. First, as mentioned above, there is a delicate situation separating the process data in itself and the actual use of it. If too much data is stored the work to sort out the interesting parts for analysis becomes a complicated procedure. Some process data are easy and thus cheap to collect, e.g., process data that is generated as a by product of computerized data. This is advantageous but does not imply that the analysis result 31 This type of activity is simply the discovery and elimination of root causes of problems (Couper and Lyberg (2005)). 32 Computer Assisted Personal Interviewing (Couper and Lyberg (2005). 33 PIS = Public information systems, i.e., information systems that are available for public use. Examples of PIS are official statistics, maps, directories, dictionaries, encyclopedias, catalogues of goods and services, events, standards, patents etc. (Sundgren (2005)).
59

is satisfactory. There are apparent risks for data loss and measurement errors, in particular when a large mass of process data is handled. Further, the data may perhaps not be suitable for analysis, e.g. they might have the wrong format, be event driven, nonrectangular or hierarchal (Couper (2007a)). Second, there is an interesting discussion about process data measurement. It is rather straightforward that process data can be measured differently, depending on its type and other features. Further, it can be risky to turn all information into quantitative data, as opposed to qualitative data. There are no given answers on how much of the process data that actually is measurable versus how much of the process data that should be measurable. Process data should be seen as the very useful tool for analysis it truly is. Overall, the majority of process data are of the macro type. Third, a prevailing issue at Statistics Sweden for the moment is what approach is the most appropriate when handling process data. One approach is the bottom-up approach, i.e., to only regard the repetitive processes that can be measured in a statistically reliable sense (editing, coding, data collection etc.) and to focus on finding good and descriptive methods and tools to handle the data (Couper (2007b)). Another is to look at the organization from a top-down perspective and from there identify what parts are most important to be developed. This is where a QMS enters the picture, since if an organization is well structured the entirety can be considered and the resources focused where they are needed the most.
6.3 Process data at Statistics Sweden
Since the concept of process data became accepted at Statistics Sweden there has been a development and an insight that the usage of this valuable tool has a great potential. Unfortunately confusions have sometimes arisen when talking about process data. Some look at it from a broad perspective, others from a more detailed one. A Lotta project series about process data has investigated what was done in the past, what is done today and what needs to be done in the future. Handling process data in general, and at Statistics Sweden in particular, can be seen as a three-step process: choosing key process variables, analyzing and interpreting data based on these variables and finally replacing variables that are not efficient. The first step is discussed in the following passage while steps two and three are treated in the last passage. Listed below is an identification of four tentative areas where process data presumably will play a prominent role in the future work at Statistics Sweden. These areas are a summary of what has been done so far and they are closely related to the stratification of three types of quality: product quality (area 3a), process quality (areas 2 and 3b) and organizational quality (areas 1 and 4):
1. As a basis for needs in later parts of the SPP, i.e., process data for the delivery to subsequent steps in the production process
60

2. As a basis for evaluation, i.e., when a process is repeated, process data gives information about the effects of changes and improvements
3. As a steering tool for operative needs, i.e., process data as a. key indicators for the quality features of the final product or b. key indicators for change of the direction of an ongoing process
4. As a steering tool for strategic needs, i.e., process data for planning and follow-up in the new process organization (Statistics Sweden (2007g))
6.3.1 Selection of process variables The first step is the selection of the key process variables. Several Lotta projects have realized that they are dependent on process data to continue the standardization work that has started within many areas of the statistics production. The process variables are crucial for future process management, i.e., to keep the process stable and in control. During coming years all subprocesses and process parts in the SPP are supposed to be mapped on more detailed levels. This process must include an identification of key process variables, or key indicators as they are called sometimes. If these indicators are identified parallel to the process mapping a lot of time is saved when the standardized methods and tools are developed, tested and then implemented. In the list below suggestions of key process variables are provided for different contexts:
• Process variables that can be controlled in SCC34 o Total error rate o Total cost o Total (sub) process time o Numbers not reached o Specific response rates o Refusal rates o Total interview time o Partial error loss o Average number of work tasks per day
• Process variables as quality indicators in interview surveys35 o Response rates o Refusal rates o Noncontact rates
• Process variables in call back attempts36 o Achieved contact o Conducted interview o Interrupted interview o Answering machine o Busy line
34 Bergdahl and Lyberg (2004) and Statistics Sweden (2004a) 35 Japec (2005) 36 Statistics Sweden (2004a)
61

o Refusal o Not available
The question on how to identify potential key process variables does not have a simple and unique answer. One approach is to use cause-and-effect diagrams to find relations, dependencies and other interesting features of the factors that can have the greatest impact on the expected result (Bergdahl and Lyberg (2004)). Another approach is to study the process flow in e.g. interview surveys. WinDati37 is a process data source that gives great possibilities to get information of every activity that is registered in the system (Statistics Sweden (2004a)).
6.3.2 Analysis of process data The second step is to thoroughly analyze the process data that is extracted from units where process data is stored. The selected process variables function as the necessary guideline to what features are important to analysis with e.g. SCC. The analysis is intended to be a basis for responsible persons (managers, product owners, process owners etc.) to draw conclusions and decide for future actions. Aitken et al (2004) present a summary approach based on seven steps which covers the identification part as well as measurement and analysis of the process variables. The approach is: identify the critical product characteristics, create a process flow chart, determine the key process variables, evaluate their measurement capability, determine the stability of critical processes, determine the system capability and finally establish a system for continuous monitoring of the processes. The first three steps belong to the identification part and the fourth is pure measurement. Steps five and six cover the analysis and the final seventh step includes wider issues from continuous quality improvement (CQI). Knowledge about the processes involves several features. Among these is the ability to decrease error loss, reduce measurement error and to increase productivity (Statistics Sweden (2004a)). As mentioned in Japec (2005), most survey organizations have some type of quality assurance system in place, i.e., a QMS, which gives objective and fast directives on what decisions to make. The third and last step is to replace those variables that in the analysis step show no relevance to the process or turn out to be not so good. This is a very hazardous step since it is difficult to predict what will happen in the future. Couper and Lyberg (2005) describe the ideal situation when the chosen variables truly are key process variables so that measurements and analysis help to check and adjust the process. The reality is different. The variables are not always key process variables and the aim should be to develop a system that is designed to strategically replace one (or many) variable(s) with others in order to improve the possibility to analyze the variables the next time the process is carried out. In the long run the quality is improved since processes can be controlled and developed.
37 WinDati is a CATI-tool used by the interviewers at Statistics Sweden.
62

7 Prerequisites for the choice of a Quality Management System
There is a huge number of aspects, opportunities, risks and opinions to consider when choosing a QMS. This chapter will discuss some of those that are important to Statistics Sweden and its choice of a QMS.
7.1 World class statistics
Statistics Sweden’s vision is to become world class when it comes to producing and disseminating statistics based on customer needs. There are several aspects of the meaning of world class statistics. Different national agencies world-wide have individual strengths and weaknesses and the standards of their processes and subprocesses are on different levels, from insufficient to world leading. Here are some examples. The Australian Bureau of Statistics (ABS) is very good at customer relations and risk management, Statistics New Zealand is a forerunner when it comes to analyzing the statistics production process and Statistics Canada and U.S. agencies are on the forefront regarding developing the skills of their employees. The ideal statistical agency would collect the grains of gold at all process steps from all national agencies together with functioning quality work, but this is not realistic. Instead it is necessary with an international cooperation and a mutual development. Agencies world-wide must realize that they are not rivals but partners (Yu (2007)). The important thing is to identify good and bad points from customer’s perspective and from that base start a journey towards world class statistics. According to Marker and Morganstein (2004) there are six levels of quality improvement in an organization that is heading for world class statistics. The first and lowest level is the group of the uncommitted, moving on to the drifters, the tool pushers, the improvers, the award winners, and finally the sixth and highest level of world class organizations where quality and strategies are integrated in order to satisfy the customer. Marker and Morganstein also state that total quality is a way of life. Changes in the behaviour of the employees and new priorities within the organization are necessary to move through the levels and it takes at least ten years to reach the highest level of quality. One way of defining world class is the level where other agencies as well as customers consider the agency to be among the best. Statistics Sweden has not yet decided on a final, precise definition of what constitutes a world class statistical agency, but here are some possible features: all important parts of the statistics production process use the best processes available, the processes are continuously improved in cooperation with other statistical agencies, Statistics Sweden is represented in many forums around the world, consulted in strategic development and the agency is the obvious choice for Swedish customers. A very objective
63

measure of world class statistics is a high score in self-assessments based on quality frameworks.
7.2 Why does Statistics Sweden need a QMS?
To become a world class statistical agency extensive efforts are needed. When Statistics Sweden worked according to the TQM philosophy in the 1990s and performed an SIQ self-assessment management realized that the agency had a long way to go to be considered among the best. One way to develop into a world class organization or perhaps more accurately, an excellent organization is to implement one of the QMS, i.e., adopt a systematic quality strategy in the organization. The Director General at Statistics Sweden has given clear directives that an already established QMS should be chosen and implemented along with the new organization (Statistics Sweden (2007e)). The more specific reasons for a QMS at Statistics Sweden are: First, the products and processes are in urgent need of standardization and improvement, fully in line with the Lotta project. They need to be thoroughly mapped so that weaknesses can be identified. Fewer errors and a reduction of the unnecessary variation in the processes are required for all parts of the statistics production process but also for supporting processes. The minimization of waste sets resources free, resources that can be used for more extensive statistical analysis, improvement of existing products and processes and development of new ones and, of course, offering cheaper products for the customers. Second, the customer, or perhaps customer satisfaction, must be the number one priority in everything that is done at the agency. Many customers demand a QMS in general, and relevant documentation of how Statistics Sweden describes, executes and evaluates its quality work in particular. Lyberg (2007a) said that a QMS and a customer oriented organization would make customer contacts easier, both in the sense of keeping already existing customers and to attract new ones by offering better products and services than the competitors. One interesting observation mentioned at a project meeting was the following: do not just wait for the customer to place an order, go out and find the customer yourself. Third, the employees at Statistics Sweden are also an important part of a well functioning agency. The work has to be stimulating and challenging, with adequate salaries and open communication at all levels. Fourth, the organization must be well functioning as a whole. A QMS is designed to identify strengths and weaknesses, spreading good work and preventing bad work. Höglund and Olsson (2007) argue that a QMS enables that right decisions are taken throughout the entire organization and that the consequences of the decisions are followed up. This calls for a new way of thinking and a reduction of the risks to go back to the inefficient trial and error work that has been a standard for many years (Lyberg (2007a)) and the search for a spin wheel effect, steering the agency in the right direction. At the same time, a QMS can assure not only that all work is
64

efficient, but that the right things are done. One of the most important aspects is the improvement work. It has to be done correctly and a QMS provides a large set of tools, such as the prioritizing matrix, which simplifies the approach. A conclusion is that if Statistics Sweden wants to achieve its vision to be a world class statistical agency a well functioning QMS is necessary since no gaps are permitted (Lyberg (2007a)).
7.3 Advantages at Statistics Sweden
Despite all the issues at Statistics Sweden, many of them discovered during the Lotta project, it is important to make use of the competence within the agency. A significant part of the tools, provided in any QMS, are statistical tools and the application of these should be rather straightforward. It cannot be pointed out strongly enough that in comparison with other organizations, Statistics Sweden is in a pole position with employees used to think analytically, to analyze quality data and with extensive access to statistical software. Even though the agency is heterogeneous, which in fact can be another advantage, there are a lot of highly educated employees with special competence in many areas. Further, with experiences from the TQM period and the Lotta project, the employees have gotten used to working in short projects, which is a common work form in most QMS. There exists very successful quality work in some parts of the organization, e.g., the consortium SMED38 where a quality framework has been developed and functions as a regulation for the statistical products produced mainly at the Regions and Environment Department at Statistics Sweden (Collin (2007)).
7.4 QMS at other statistical organizations
In the late 1980s many statistical organizations started working according to the TQM model, looking for an approach to work with quality improvement. The Washington Statistical Society organized a series of conferences on Quality Assurance in Government, focusing on TQM, SPC, causes of variation, management tools and teamwork etc. and these ideas were then transferred to European statistical agencies (Lyberg and Elvers (2003)). Today, statistical agencies world-wide have varying approaches to systematic quality work, either with a self-designed system or with an established framework or system, e.g. the EFQM Excellence Model or Six Sigma (Statistics Sweden (2007e)). Documents in shape such as quality policy, CBMs, business and strategic plans and protocols have been developed at Statistics Denmark, Statistics Finland, Statistics Netherlands and the UK Office for National Statistics (ONS) (Lyberg (2004) and Lyberg and Elvers (2003)). U.S. agencies and organizations such as the U.S. Census Bureau, the U.S. Bureau of Labor Statistics and RTI International put great efforts in internal and external reviews that function as an efficient quality assurance (Statistics Sweden (2007e)).
38 SMED, Svenska MiljöEmissionsData, a consortium between Statistics Sweden, IVL, SLU and SMHI (Collin (2007))
65

The U.S. Census Bureau has in the past years developed a quality program with activities like e.g. quality audits and benchmarking (Bushery and McGovern (2005)). The National Statistical Institute of Portugal (INE-PT) has a QMS built upon four components: a quality framework based on the EFQM Excellence Model and ISO standards, internal staff sessions and a quality award to promote staff involvement, a quality documentation system and internal quality audits based on handbooks and checklists. As a result of their successful quality work, INE-PT received an award in 1998 and their ongoing work includes internal and external audits, and self-assessments using DESAP (Broene (2005)). Statistics Canada, Statistics New Zealand and the Australian Bureau of Statistics (ABS) are three agencies that have contributed new ideas and provided good examples in quality work. Some of them are presented here. Statistics Canada released their introductory quality guidelines in the mid 1980s and the advantage of having such documentation early was that information could be accumulated over time and therefore suited to continuing surveys (Lyberg and Elvers (2003)). In 2002 the Statistics Canada’s Quality Assurance Framework was ready, prescribing in an extensive way, how to handle all the quality dimensions of statistics production. The approach towards quality issues, including the quality framework and other handbooks in quality control should be seen as inspiration and good examples for Statistics Sweden in the work of choosing and implementing a QMS (Statistics Sweden (2007e)). Statistics New Zealand publishes an Introduction to the Census every five years. Both in the censuses of 2001 and 2006 it was stated that the agency should have a Quality Management Strategy. In the 2006 document there was an outline of how Statistics New Zealand ensures that data produced from the 2006 Census is fit for use (Statistics New Zealand (2006)), simply a code of practice for the production and release of official statistics (Lyberg and Elvers (2003)). Further, they have as mentioned earlier, an exemplary model for the statistics production process and the level of process standardization at the agency is progressed. ABS is an example of how quality work can be spread throughout the organization. They do not have a name for their approach to quality management. Instead they say that we have this and we have that but we do not call it anything in particular. The fundamental ideas of the approach are to reinforce a high credibility for ABS and its outputs, to maintain the relevance of the outputs, to develop more efficient relationships with respondents, to create processes that produce high quality output, to regularly review and evaluate the statistical activities, to keep the employees skilled and motivated and finally and perhaps the most essential, to assure the quality of the ABS output. The agency went through a transformation some years ago, similar to the present one at Statistics Sweden. ABS went from a vertical stove-pipe organization to a horizontal process-based organization and present documentation include a quality framework and a tips and traps manual (Yu (2007)).
66

7.5 The choice at Statistics Sweden
The Lotta project whose task is to choose a Quality Management System has come to the conclusion to recommend the following three components of a future Quality Management System at Statistics Sweden:
• The EFQM Excellence Model as the quality framework • Six Sigma as the system for continuous improvements • Modern internal auditing methods for evaluation and follow-up
The EFQM Excellence Model is the quality framework that is by far the most common in European organizations. It is also recommended by Eurostat as the quality framework to be used at European statistical agencies. This choice means that Statistics Sweden has an international approach at the same time as it is possible to apply for the Swedish Quality Award. Specific details on how adaptations and adjustments to the EFQM criteria will take place are given in a tentative implementation plan presented in the following chapter. The recommendation to work according to the EFQM criteria does not exclude an ISO 9001 certification. On the contrary it can simplify the work towards a certification. As a matter of fact the project proposes that it is essential to prepare Statistics Sweden for a future ISO 9001 certification. Further, the project suggests an ISO 20252 certification as soon as possible based on the external pressure and the presumption that many customers will require such a certification in future bidding activities. Six Sigma is chosen as the system for continuous improvements based on three reasons. First, the Director General wishes to adopt an existing system instead of building an internal one. Second, Six Sigma is a concept that is suitable for any type of organization, especially a statistical agency. Third, continuous improvement work is a long-term commitment and Six Sigma has the advantage of offering useful methods and tools that can be used while the system is integrated into the organization. Details on how Statistics Sweden will work according to the Six Sigma concept, including the abundance of methods and tools for different activities are yet to be clarified. The project group has given recommendations for this in its implementation plan. As a complement to Six Sigma, inspiring ideas and useful tools are collected from the literature and other systems and these will also be recommended to be incorporated into the Quality Management System in new organization. The last component is a selection of recognized activities for internal auditing. This part of the Quality Management System is excluded from this thesis and further reading on this issue is found in Moeller (2005).
67

8 Implementing a Quality Management System at Statistics Sweden
Statistics Sweden is on its way to implementing the QMS suggested in the last part of the previous chapter. The implementation that eventually will develop into a continuous improvement work has long-term intentions. This chapter has three parts. First, some aspects and difficulties from the literature are discussed in order to help the reader understand the extent of this topic. Second, a preliminary two-year implementation plan is presented. The proposed ideas should be considered as tentative. Third, there is a discussion of some interesting observations made by the author throughout the work on this thesis.
8.1 Implementation aspects and difficulties
There are, of course, no right answers on how to implement a QMS in an organization. They depend strongly on several factors such as the vision, attitude and commitment among top managers and employees, and the introduction of continuous education for enhancing fundamental skills and knowledge on quality improvement within the organization (Yamada (2007)). Further, Yamada emphasizes that desired and performed changes are sensitive and dependent on, more than other things, the organizational culture. In four areas he points out that certain differences can have great importance: regular organization or separated organization, education based or standardization based, human communication or commanding system and experience based promotion or competition based promotion. To sum up it is important if society in general and the organization in particular are heterogeneous or homogeneous. A clear cultural factor is that the process of making everyone know and understand the goals associated with the changes and the process of change in itself are considered slow at Statistics Sweden. The process mapping step is a critical phase. The key is to find and then implement the new concept as well as the effects of it in terms of both productivity and physical and mental burden on the employees. Changes involving increased pressure to reduce the cost while retaining quality are likely to increase the pressure on workers (Van Rhijn et al (2005)). The results in each part of the organization are relevant to other departments and units where changes are not introduced as fast. In order to find out how changes are affecting the organization, gap analysis can be conducted before and after the change. A gap analysis is a common tool for identification, specification and actions taken to reduce the gap between a current and a desired situation. A gap analysis is usually performed with the help of a so called gap matrix (Karlöf and Lövingsson (2007)). No matter what system is implemented, there are many options when it comes to following-up the changes (Statistics Sweden (2007e)). In his study Good to Great and the book with the same name, Collins (2001) emphasizes the importance of “whom” before “what”, when starting the journey
68

towards improved quality. Leaders of good to great companies do not start with where, but with whom, they get the right people, get rid of the wrong people and get the right people on the right positions. The leaders stick with discipline, choose first the people and set then direction, no matter the circumstances (Collins (2001)). Further, Collins states that companies that make the change from good to great have no name for their transformation and absolutely no specific program. Karlöf and Lövingsson (2007) suggest a slightly different approach in their view on successful cultural changes in an organisation. Consensus is needed in five areas: the organization’s mission and vision, the goals associated with the changes, the methods to achieve the changes, how the changes are measured and finally, the strategies for support and repair actions. At the Australian Bureau of Statistics (ABS), a system with so called quality gates was introduced, i.e., validation points in the processes at the transfer between various strategic phases, where reviews are done and the results reported. The advantage of this kind of system is that the gates are an assurance and managers and process owners do not have to wait until the end if some measures have to be taken (Statistics Sweden (2007e) and Yu (2007)). The idea of gates has been a standard element in the Lotta projects at Statistics Sweden, e.g., assuring that decisions are approved before implementations are carried out. Further, ABS went from a stove-pipe organization to a process-based one a few years ago. There are champions at almost twenty different focus areas who are responsible for the quality work in their expert areas (Yu (2007)). It is commonly viewed that an effective leadership is central to organizational success, in everyday work and in implementation of changes (Hernez-Broome and Hughes (2004)). Bergdahl and Lyberg (2004) mention that a quality approach requires top management in key positions. They are requested to attend extended quality training and must set leading examples. Since the implementation process is unique with respect to the organization in question, there is no correct order of how to do things. One viewpoint could be to start implementing changes in processes that are simple, processes with the best prerequisites to achieve good results and not start with the important parts of the core process, since failures can be devastating (Höglund and Olsson (2007)). A head start is important, loaded with positive thinking among all employees and a preparedness that the change process will take time. Yu (2007) claims that organizational changes including the structure, management and employees come before the system changes and Collins (2001) states one common feature to all companies that went from good to great: there was no miracle moment. Good to great executives cannot pinpoint one single key event that defined their successful transition. The new thinking has to be consistent. Managers and employees have to stick with the plan and not look for quick solutions. One way to do this is to establish a so called stop-doing-list (compare with the more natural to-do-list), focusing on the right tasks as well as refraining from wrong ones (Collins (2001)). To comment on the CQI model mentioned earlier in the thesis, Marker and Morganstein (2004) claim that in order to be truly continuous and contribute the desired results, the culture
69

must become self-supporting and permeate everything that is changed in the organization. Further, Collins (2001) introduces the concept of the so called doom loop, i.e., organizations genuinely strive to make changes, but they lack the quiet discipline that produces the well known flywheel effect. These organizations launch change programs with huge fanfare, hoping to achieve fast results. When only disappointing results show, it leads to reactions without understanding, which lead to a new direction, a new leader, a new program, which in turn lead to no momentum and more disappointing results. This is a steady, downward spiral, the doom loop. Instead, Collins emphasizes the importance of self-motivated people, among managers as well as employees. Finally, something to keep in mind is a free translation of a statement by Machiavelli (1469): there is nothing as difficult to deal with, as dreadful to manage, as insecure for success, as introducing a new order of things (Karlöf and Lövingsson (2007)).
8.2 Two-year implementation plan
The choice of the Quality Management System presented in the previous chapter is the basic recommendation of how Statistics Sweden should handle quality issues in the future. The intention is to have an organizational quality function with a quality manager ready to start working at the beginning of 2008. The quality function will be responsible for the quality work, how to implement the Quality Management System in the organization and how the work should be structured in the future. Table 9 below shows the two-year implementation plan. It is important to stress that the contents of the implementation plan is tentative.
Two-year implementation plan • Gradually organize the quality function • Achieve an ISO 20252 certification • EFQM Excellence Model training for top management and some other key
players • Six Sigma training for selected managers and employees • Adjustment of the current Statistics Sweden project model to fit the three
components in the Quality Management System • Define the concept of world class for different processes and EFQM criteria
and perform a first EFQM self-assessment • Define the first set of goals based on the self-assessment • Start (and finish) a number of Six Sigma improvement projects • Training in methods for internal auditing • Conduct the first internal audits
Table 9 Two-year implementation plan
70

8.3 Discussion
I have chosen to structure this final discussion based on seven themes: the implementation plan, the organizational culture, management commitment, the quality function, the project-based quality work, the importance of process data and the constant journey towards the vision of being a “world class statistical agency”. It is a personal summary of features mentioned throughout the thesis together with ideas and recommendations that can be integrated in future quality work at Statistics Sweden. First, the implementation plan for the Quality Management System has to be accepted and recognized by all managers and employees. The clarification of roles and responsibilities at all levels at Statistics Sweden is necessary to avoid confusion and misunderstandings. The implementation of the Quality Management System has to be introduced gradually and it will be important to have a strategic way to prioritize the activities. To achieve this, an agency-wide initiative to motivate managers and employees has to be developed. Second, the organizational culture at Statistics Sweden is a very strong factor that must not be underestimated. Changes have to be introduced and communicated in ways so that managers and employees can understand them easily and accept the new situation. It is truly a difficult process to reach out and make adults realize that changes are necessary. Third, management commitment is perhaps the single most important factor mentioned in all models, standards and systems. At Statistics Sweden the Director General is the initiator of the current search and implementation of a Quality Management System. His total dedication and belief have to continue and spread to other managers and all other employees. The Statistics Sweden culture and the fundamental quality thinking have to become natural to survive future changes and difficulties. Fourth, the quality function needs to develop and grow into a central position at Statistics Sweden. The quality manager will be a key player who needs professional assistance from others, both external consultants and internal managers and employees, to make the quality function become the well-functioning promoter of the quality work it is intended to be. To make this happen, managers and employees at Statistic Sweden will need an extensive development of skills in the quality field to be able to make strategic decisions. Fifth, the project-based quality work is a proven effective way to continuously improve products and processes. Three crucial parts of the project work should be pointed out: project identification, project prioritization and recruitment of project members. There are recognized tools for all three but the third one is especially important and features such as competence, commitment, social ability, strategic thinking and future interest in Statistics Sweden are important. When working in projects, it is also important to appreciate that problems exist and to find measures to reduce or remove them.
71

Sixth, the importance of process data and the ability to measure processes and activities is an aspect that has to be taken into account. The identification of key process variables and quality indicators has to be a natural part in the mapping of processes. Quality thinking has to be integrated into the statistics production process as well as in management and supporting processes. The discussion and definition of world class statistics has to be integrated in every part of Statistics Sweden parallel to comparisons with other statistical agencies that are considered “best” in a specific field. Finally, the constant journey towards the vision of being a “world class statistical agency” is a tough one. Many “competing” statistical agencies have an abundance of resources, both funds and know-how. Most of them, however, do not work with quality issues in a standardized way. With the proposed three-component Quality Management System Statistics Sweden will therefore have a good chance to become world class.
72

9 References Aitken, A. et al, (2004), Handbook on improving quality by analysis of process variables, Eurostat. Arveson, P., (1998), What is the Balanced Scorecard?, Balanced Scorecard Institute. Arvidson, G., (2007), Personal Communication. Australian Bureau of Statistics (ABS), (2007). Bergdahl, M. and Lyberg, L., (2004), Quality Management at Statistics Sweden: History, Current Work and the Future. Bergdahl, M., (2006), Bilaga 2 Processdefinition, Rapporter och dokumentation, Director General's Office. Bergdahl, M., (2007), Personal Communication. Bergman, B. and Klefsjö, B., (2002), Kvalitet i alla led, Studentlitteratur, Lund. Biemer, P. and Caspar, R., (1994), Continuous Quality Improvement for Survey Operations: Some General Principles and Applications, Journal of Official Statistics 10, 307-326. Biemer, P. P. and Lyberg L. E., (2003), Introduction to Survey Quality, John Wiley & Sons, Inc., Hoboken, Jew Jersey. BNQP, (1998), Ten Years of Business Excellence for America. BNQP, (2004), Why Baldrige? BNQP, (2007), Criteria for Performance Excellence. Boulter, L., Bendell, T., Abas, H., Dahlgaard, J. and Singhal, V., (2005), Report on EFQM and BQF, Funded study into the impact of the effective implementation of organizational excellence strategies on key performance results. Broene, T., (2005), Survey Self-Assessments. Brue, G. and Howes, R., (2006), Six Sigma, McGraw-Hill, USA. Bushery, J. M. and McGovern, P. D., (2005), Implementing and Improving Quality Standards at the U.S. Census Bureau. Casella, G. and Berger, R. L., (2002), Statistical Inference, Duxbury, Pacific Grove. CEN, (2000), Quality management systems – Guidelines for performance improvements (ISO 9004:2000). CEN, (2000), Quality management systems – Requirements (ISO 9001:2000). CEN, (2007). Colledge, M. and March, M., (1993), Quality Management: Development of a Framework for a Statistical Agency, Journal of Business & Economic Statistics 11, 157-165. Colledge, M., Dalén, J., Georges, J. and Lindén, H., (2006), Improving Statistical Quality Assessment in Ten Countries, Proceedings of Q2006 European Conference on Quality in Survey Statistics. Collin, M., (2007), SMED:s kvalitetssystem och kvalitetsarbete, Statistics Sweden, RM/MIT. Collins, J., (2001a), From Good to Great, Fast Company. Collins, J., (2001b), Good to Great, HarpersCollins Publishers Inc., New York.
73

Couper, M. P., (2007a), An Introduction to Paradata or Process Data. Couper, M. P., (2007b), Personal Communication. Couper, M. P., and Lyberg, L. E., (2005), The Use of Paradata in Survey Research, Proceedings of the 54th Session of the International Statistical Institute, Sydney, Australia. Couper, M. P., Hansen, S.E., and Sadosky, S.A., (1997), Evaluating Interviewer Performance in a CAPI Survey. In L. Lyberg et al. (eds.), Survey Measurement and Process Quality. New York: John Wiley, 267-285. Dahlbom, B., (2007), Sveriges framtid, Liber AB, Malmö. Dahlgaard, J. J., (2007), Introduktion till offensiv kvalitetsutveckling. Deming, E. W., (1986), Out of the crisis, Massachusetts Institute of Technology, Cambridge, Massachusetts. Dodge, H. F. and Romig, H. G., (1944), Sampling Inspection Tables, Wiley, New York. EFQM, (2003), EFQM Excellence Model. Large Company, Operational and Business Unit Version. EFQM, (2007). Eiderbrant-Nilsson, G., (2006), Översynsverksamheten vid SCB, R&D Department. Elvers, E. and Eiderbrant, G., (2007), Lottaprojektets begreppslista för processorientering på SCB. Eurostat, (2003), DESAP The European Self Assessment Checklist for Survey Managers. Eurostat, (2004), 2004 LEG implementation status report – The third report of the LEG on Quality Implementation Group. Eurostat, (2005), European Code of Practice for the National and Community Statistical Authorities, Quality framework for European Statistics. Eurostat, (2007). Ficalora, J., Costello, J. and Renaud, J., (undated), Combining Lean and Six Sigma Methodologies. Forsberg, K. and Olsson, P-O., (2004), Målbaserat ledarskap – Bli effektiv som ledare och chef, Liber-Ekonomi, Malmö. Forsberg, T., (2007), Processutveckling på LKF. Groves, R. M., and Heeringa, S. G., (2006), Responsive Design for Household Surveys: Tools for Actively Controlling Survey Nonresponse and Costs, Journal of the Royal Statistical Society: Series A 169, 439-457. Heerwegh, D., (2003), Explaining Response Latencies and Changing Answers Using Client-Side Paradata from a Web Survey, Social Science Computer Review 21, 360-373. Hernez-Broome, G. and Hughes, R. L., (2004), Leadership Development: Past, Present, and Future, Human Resource Planning 27, 24-32. Höglund, F. and Olsson, T., (2006), Mot högre höjder – Inspiration till kvalitet i världsklass, Tryckeri Elanders, Mölnlycke. Holmes, S. and Ballance, J., (1994), Process Improvement Guide, Air University, Alabama. Howell, J. M., (1952), Statistical Quality Control, Mathematics Magazine 25, 155-157.
74

International Monetary Fund, (2003), Data Quality Assessment Framework and Data Quality Program. Ishikawa, K., (1982), Guide to Quality Control, Nordica International Limited, Hong Kong. iSixSigma, (2007), Quality Dictionary and Glossary. ISO, (2007). Japec, L., (2005), Quality Issues in Interview Surveys Some Contributions, Jannes Snabbtryck Kuvertproffset HB, Stockholm. Japec, L., (2007), Personal Communication. Juran, J. M., (1995), A History of Managing for Quality: The Evolution, Trends, and Future Directions of Managing for Quality, Juran Foundation, Inc., Milwaukee, Wisconsin. Karlöf, B. and Lövingsson, F. H., (2007), Management från A till Ö – Förklaringar till 150 begrepp och modeller, Tryckeri Elanders, Stockholm. Liker, J. K. and Meier, D. P., (2007), Toyota Talent Developing your People the Toyota Way, McGraw-Hill, New York. Liker, J. K., (2004), The Toyota Way 14 Management Principles from the World’s Greatest Manufacturer. Lyberg, L. and Elvers, E., (2003), Survey Quality Issues During the Last 50 Years Some Observations. Lyberg, L., (1998), Total Quality Management (TQM) vid Statistiska centralbyrån. Lyberg, L., (2004), Quality Assurance at Statistics Sweden. Lyberg, L., (2007a), Projektbeställning Lotta P2: Val av kvalitetsledningssystem. Lyberg, L., (2007b), ISO-standard om ”Marketing, Opinion and Social Research” (MOS). Magnusson, K., Kroslid, D. and Bergman, B., (2003), Six Sigma The Pragmatic Approach, Studentlitteratur, Lund. Marker, D. A. and Morganstein, D. R., (2004), Keys to Successful Implementation of Continuous Quality Improvement in a Statistical Agency, Journal of Official Statistics 20, 125-136. Mitra, A., (2004), Six sigma education: a critical role for academia, The TQM Magazine 16, 293-302. Moeller, R., (2005), Brink’s Modern Internal Auditing, John Wiley & Sons, Inc., Hoboken, Jew Jersey. Montgomery, D. C., (2005a), Design and Analysis of Experiments, Sixth Edition, John Wiley & Sons, Inc., Hoboken, Jew Jersey. Montgomery, D. C., (2005b), Introduction to Statistical Quality Control, Fifth Edition, John Wiley & Sons, Inc., Hoboken, Jew Jersey. Mudryk, W., Burgess, M. J. and Xiao, P., (1996), Quality control of CATI operations in Statistics Canada, Proceedings of the Section on Survey Research Methods, American Statistical Association, 150-159. Organization for Economic Co-operation and Development (OECD), (2003), Quality framework and guidelines for OECD statistical activities. Park, S. H., (2003), Six Sigma for Quality and Productivity Promotion. Poksinska, B., (2007), Processledning.
75

Raisinghani, M. S., (2005), Six Sigma: concepts, tools and applications, Industrial Management & Data Systems 105, 491-505. Ramaswamy, R., (2006), Lean Six Sigma Integration for Business Excellence, Oriel Incorporated. Ramaswamy, R., (2007), Perfecting Six Sigma Through Process Management, Oriel Incorporated. SIQ, (2007a), SIQs Modell för Kundorienterad Verksamhetsutveckling. SIQ, (2007b). SIS, (2007). Snee, R. D., (1990), Statistical Thinking and Its Contributions to Total Quality, The American Statistician 44, 116-121. Statens kvalitets- och kompetensråd, (2003), CAF-modellen The Common Assessment Framework. Statens kvalitets- och kompetensråd, (2004), Processbaserad verksamhetsstyrning i staten – från ärende till medborgare. Statistics Canada, (2002), Statistics Canada’s Quality Assurance Framework. Statistics Finland, (2002), Quality Guidelines for Official Statistics. Statistics New Zealand, (2001), Introduction to the Census. Statistics New Zealand, (2006), Introduction to the Census. Statistics Sweden, (2001), MIS 2001:1, Quality definition and recommendations for quality declarations of official statistics. Statistics Sweden, (2004a), Kvalitetssäkring av intervjuarbetet vid SCB, SÄK, Projektrapport. Statistics Sweden, (2004b), Genomlysningsrapport 2004:01, Översynskansliet. Statistics Sweden, (2005a), Quality policy, Director General’s Office. Statistics Sweden, (2005b), Självvärdering av produkt, Översynskansliet. Statistics Sweden, (2006a), Direktiv till projektet Effektivare produktionsprocess. Statistics Sweden, (2006b), Tillräcklig kvalitet och kriterier för officiell statistik. Statistics Sweden, (2007a), Lägesrapport Lottaprojektet, Beredningsgruppen. Statistics Sweden, (2007b), Projektsammanställning Lottaprojektet, Beredningsgruppen. Statistics Sweden, (2007c), Slutrapport delprojekt P3S3a Processledning del 1. Statistics Sweden, (2007d), Slutrapport delprojekt P3S3b Processledning del 2. Statistics Sweden, (2007e), Slutrapport: Benchmarking av system för kvalitetssäkring, kvalitetskontroll och utvärdering. Statistics Sweden, (2007f), Sveriges officiella statistik. Statistics Sweden, (2007g), Förstudie om processdata. Statistics Sweden, (2007h), Slutrapport Lotta P2 Granskning Fallstudier. Sundgren, B., (2005), What is a Public Information System? International Journal of Public Information Systems 1, 81-99. Statistics Sweden, (2007i), Statistics Sweden’s organisation. Sundgren, B., (2007), Process Reengineering at Statistics Sweden. The Common Assessment Framework, (2002), Improving an organization through self-assessment. United Nations Economic Commission for Europe (UNECE), (2007), Workshop on Statistical Metadata, Vienna, Statistics New Zealand Case Study
76

United Nations, (2006), Fundamental Principles of Official Statistics, United Nations Statistics Division. Van Rhijn, J. W. et al, (2005), Changing from batch to flow assembly in the production of emergency lighting devices, International Journal of Production Research 43, 3687-3701. Westat, Inc., (2007). Wilson, M. P., (1997), Six Sigma Strategies: Creating Excellence in the Workplace, Quality Digest 17. Witell, L., (2007), Kundens roll i kvalitetsutvecklingsarbetet. Womack, J. P., Jones, D. T. and Roos, D., (1990), The Machine that Changed the World, Rawson Associates (MacMillan), New York. Wong, C. Y. and Dahlgaard, J. J., (2003), Towards Continuous Improvement: A Case of Self-Assessment Using the EFQM Excellence Model. Yamada, S., (2007), Six Sigma Quality – Experiences from Japan. Yu, F., (2007), Quality management: some ABS experiences. Öberg, S., (2004), Quality Issues in the European Statistical System. Östergren, A., (2006), Projektorganisation och deltagare, Information and Publishing Department.
77

Copyright The publishers will keep this document online on the Internet - or its possible replacement - for a period of 25 years from the date of publication barring exceptional circumstances.
The online availability of the document implies a permanent permission for anyone to read, to download, to print out single copies for your own use and to use it unchanged for any non-commercial research and educational purpose. Subsequent transfers of copyright cannot revoke this permission. All other uses of the document are conditional on the consent of the copyright owner. The publisher has taken technical and administrative measures to assure authenticity, security and accessibility.
According to intellectual property law the author has the right to be mentioned when his/her work is accessed as described above and to be protected against infringement.
For additional information about the Linköping University Electronic Press and its procedures for publication and for assurance of document integrity, please refer to its WWW home page: http://www.ep.liu.se/
Upphovsrätt Detta dokument hålls tillgängligt på Internet – eller dess framtida ersättare – under 25 år från publiceringsdatum under förutsättning att inga extraordinära omständigheter uppstår.
Tillgång till dokumentet innebär tillstånd för var och en att läsa, ladda ner, skriva ut enstaka kopior för enskilt bruk och att använda det oförändrat för ickekommersiell forskning och för undervisning. Överföring av upphovsrätten vid en senare tidpunkt kan inte upphäva detta tillstånd. All annan användning av dokumentet kräver upphovsmannens medgivande. För att garantera äktheten, säkerheten och tillgängligheten finns det lösningar av teknisk och administrativ art.
Upphovsmannens ideella rätt innefattar rätt att bli nämnd som upphovsman i den omfattning som god sed kräver vid användning av dokumentet på ovan beskrivna sätt samt skydd mot att dokumentet ändras eller presenteras i sådan form eller i sådant sammanhang som är kränkande för upphovsmannens litterära eller konstnärliga anseende eller egenart.
För ytterligare information om Linköping University Electronic Press se förlagets hemsida http://www.ep.liu.se/ © 2007, Dan Lisai
78