Embed Size (px)
Citation preview

Choosing the Optimal Data Center
Power Density
Revision 0
by Kevin Brown Wendy Torell Victor Avelar
White Paper 156
The choice of IT rack power densities has a direct impact on the capital cost of the data center. There are significant savings in developing a data center with an average rack power density of at least 5 kW per rack, however, densities higher than ~15 kW per rack show no further relevant savings. This white paper analyzes these costs and presents a flexible architecture to accommodate a well-specified density, and discusses the importance of operational policies in enforcing the specification.
Executive summary
by Schneider Electric White Papers are now part of the Schneider Electric white paper library produced by Schneider Electric’s Data Center Science Center [email protected]
Choosing the Optimal Data Center Power Density
Schneider Electric – Data Center Science Center Rev 0 2
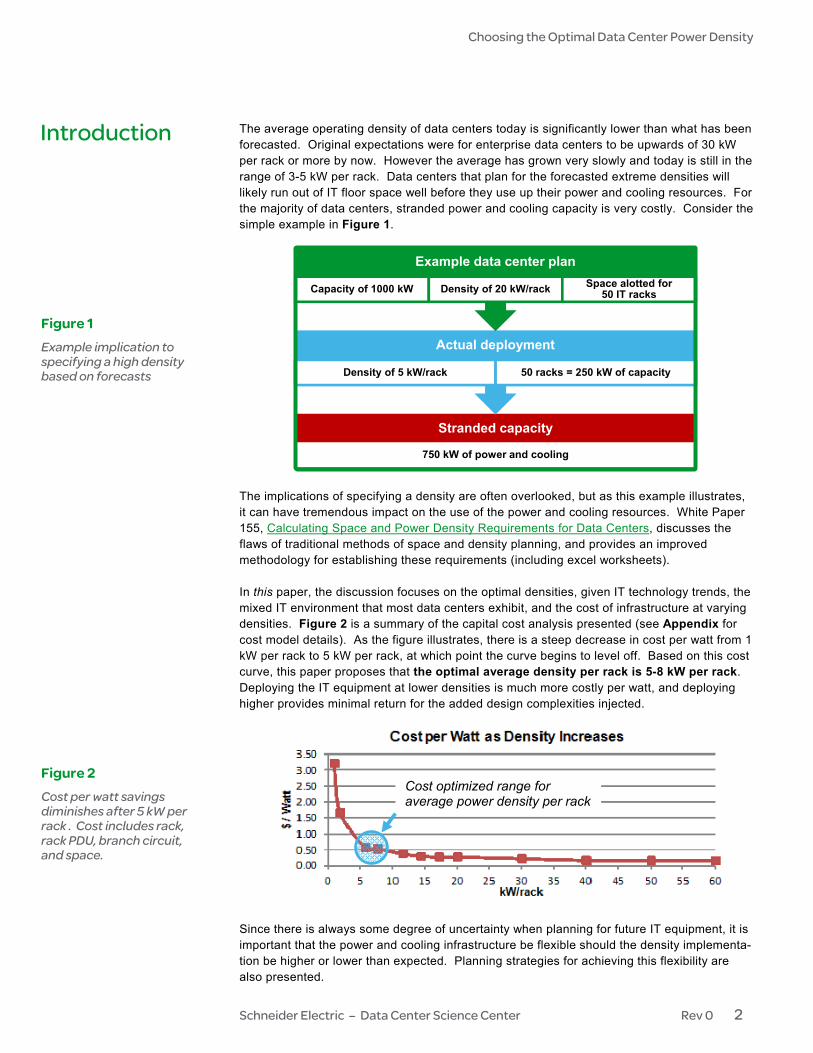
The average operating density of data centers today is significantly lower than what has been forecasted. Original expectations were for enterprise data centers to be upwards of 30 kW per rack or more by now. However the average has grown very slowly and today is still in the range of 3-5 kW per rack. Data centers that plan for the forecasted extreme densities will likely run out of IT floor space well before they use up their power and cooling resources. For the majority of data centers, stranded power and cooling capacity is very costly. Consider the simple example in Figure 1.
The implications of specifying a density are often overlooked, but as this example illustrates, it can have tremendous impact on the use of the power and cooling resources. White Paper 155, Calculating Space and Power Density Requirements for Data Centers, discusses the flaws of traditional methods of space and density planning, and provides an improved methodology for establishing these requirements (including excel worksheets). In this paper, the discussion focuses on the optimal densities, given IT technology trends, the mixed IT environment that most data centers exhibit, and the cost of infrastructure at varying densities. Figure 2 is a summary of the capital cost analysis presented (see Appendix for cost model details). As the figure illustrates, there is a steep decrease in cost per watt from 1 kW per rack to 5 kW per rack, at which point the curve begins to level off. Based on this cost curve, this paper proposes that the optimal average density per rack is 5-8 kW per rack. Deploying the IT equipment at lower densities is much more costly per watt, and deploying higher provides minimal return for the added design complexities injected.
Since there is always some degree of uncertainty when planning for future IT equipment, it is important that the power and cooling infrastructure be flexible should the density implementa-tion be higher or lower than expected. Planning strategies for achieving this flexibility are also presented.
Stranded capacity
750 kW of power and cooling
Actual deployment
Density of 5 kW/rack 50 racks = 250 kW of capacity
Example data center plan
Capacity of 1000 kW Density of 20 kW/rack Space alotted for 50 IT racks
Introduction
Figure 1 Example implication to specifying a high density based on forecasts
Cost optimized range for average power density per rack
Figure 2 Cost per watt savings diminishes after 5 kW per rack . Cost includes rack, rack PDU, branch circuit, and space.

Choosing the Optimal Data Center Power Density
Schneider Electric – Data Center Science Center Rev 0 3
There are two main reasons why data centers generally deploy equipment at lower average densities than forecasted: (1) mixed IT loads, and (2) IT technology improvements. Mixed IT loads While it is possible to fill a rack with blade servers and achieve a rack density of 20 kW or more, it is very rare that these racks represent the majority within an IT space.1 The average is generally much lower when server racks, storage racks, and networking racks are consid-ered. In conversations about density, it is, therefore, very important to be clear if the values discussed represent average or maximum densities. Figure 3 illustrates how this mixed load environment impacts the average density. These values represent a typical enterprise data center. IT technology improvements Density planning (and capacity planning in general) is a challenge for IT managers because IT technology is constantly evolving. With a typical refresh cycle of 2-4 years, the tendency is to overstate the future need and have a safety margin because of the uncertainty of what IT equipment will be needed and how much it will draw. It is important to consider the following attributes of IT devices: • Nameplate does not reflect actual power draw
• Power draw of IT devices is not constant over time
• Performance (compute) per watt is improving
It is unlikely that devices will draw their nameplate power ratings. Typically, IT devices draw under 50% of the nameplate power supply rating, with the actual draw dependent on the device configuration. There are tools available to assist in estimating the actual power draw, such as HP’s Power Advisor2. Both with HP’s 1U servers and their Moonshot (as of 2014), it is difficult to configure a full rack that draws more than 10 kW.
1 Note – high performance computing or HPC is the exception to this rule. 2 http://www8.hp.com/us/en/products/servers/solutions.html?compURI=1439951
Why hasn’t high density been widely adopted?
Figure 3 Mixed loads in data centers bring average down
Weighted average density = 5 kW/rack

Choosing the Optimal Data Center Power Density
Schneider Electric – Data Center Science Center Rev 0 4
Power draw of IT equipment varies over time, as the work load(s) on the device changes. The power management systems in modern servers can result in power variance by a factor of 2 or more during typical operation (peak vs. idle). Dynamic power capping in many servers also limits the maximum power draw of a device. Server chips are improving in performance per watt. Table 1 provides an example of how it has changed from 2010 to 2013. In addition, power draw per rack-U is trending down over time, as Figure 4 illustrates.
Xeon E5520 Xeon E5-2670v2 Year 2010 2013
Cores 4 Cores 10 Cores
Power 80 Watts 115 Watts
Average CPU Mark 45881 205162
Performance / Watt 4588/80 = 57 20516/115 = 178
1 - http://www.cpubenchmark.net/cpu.php?cpu=Intel+Xeon+E5520+%40+2.27GHz&id=1243
2 - http://www.cpubenchmark.net/cpu.php?cpu=Intel+Xeon+E52670+v2+%40+2.50GHz&id=2152&cpuCount=2
Source: http://datacenterpulse.org/blogs/jan.wiersma/where_rack_density_trend_going
Given the current trend of lower or steady chip power consumption, the lack of significant cost savings by going to higher densities, and the industry’s historical habit of over estimating future densities, it seems likely that data centers will not achieve densities higher than 10-15 kW per rack for the foreseeable future. There will obviously be exceptions where the IT requirements drive higher density, such as high performance computing, but even in those environments the benefits of these higher densities may and should be challenged.
Figure 4 Trend of power per U of common servers, including pizza box servers, blade servers, and power optimized servers
Table 1 Example of server chip performance improve-ment from 2010 to 2013

Choosing the Optimal Data Center Power Density
Schneider Electric – Data Center Science Center Rev 0 5
We developed a capital cost model to quantify the cost of racks, space, and power and cooling distribution as the density in a data center varies. A 1 MW data center (no redundan-cy) was analyzed at average densities ranging from 1 kW/rack to 60 kW/rack, factoring in changes in space requirements, rack type and count, distribution breakers, and distribution cables. We fixed the power consumption at 1 MW for all rack densities which means that every rack draws exactly the same amount of power for a given rack density. This hypothet-ical power distribution allowed us to exclude the cost impact of rack power variations which we quantify separately in the next section. The Appendix provides details on the methodol-ogy and assumptions of the model. Our sensitivity analysis revealed that three key variables drive the cost per watt density curve from Figure 2: • The width and depth of the racks
• The type of rack power distribution units
• The number of racks and space consumed
There is a steep decline in cost per watt from 1 to 5 kW/rack because the reduction in rack count and space drives the savings; but as the density continues to increase, the rack count and space savings is countered with higher costs of racks (wider and deeper) and rack power distribution (greater amperage breakers and connectors). There are still savings beyond 5 kW/rack, but it becomes much less significant, and must be weighed against design complex-ities at those greater densities. Figure 5 illustrates the relationship of the three drivers.
Effect on power Our model did not include the capital cost of bulk power (i.e. UPS, generator) because it is not impacted by changes to the IT rack density. Whether the load is 10 kW/rack x 10 racks or 5 kW/rack x 20 racks, the UPS and generator capacity are unchanged. Since the pod size (# of racks fed from a PDU or RPP) may change as density changes, the cost of PDUs or RPPs may change slightly. But this is not a significant cost driver in identifying the optimal density. Rack power distribution cost is a key driver because as density goes up, greater capacity, more expensive (greater wire gauge, larger circuit breaker) rack PDUs must be used to support the equipment. There are natural break points for how much power the rack PDUs can support, given the operating voltage, single or three phase, and the amperage of the input breaker in the rack PDU. Table 2 illustrates these natural break points. White Paper 28, Rack Powering Options for High Density in 230VAC Countries, and White Paper 29, Rack Powering Options for High Density, provide greater detail.
Capex cost drivers
Figure 5 3 key variables drive density capex equation
Watts per rack: the more useful density metric When discussions of density occur, many data center professionals still refer to units of watts / sq m or watts / sq ft. This leads to confusion as it is often unclear what space is being used in the metric (is it rack space only, rack and clearance space, or IT and physical infrastructure space?) For this reason, the better metric is watts / rack, as it is unambiguous in definition. See WP120, Guidelines for Specification of Data Center Power Density, for more information.

Choosing the Optimal Data Center Power Density
Schneider Electric – Data Center Science Center Rev 0 6
When 25A (30A in North America) or greater amperage rack distribution units are used, the branch circuits that supply power to the receptacles must be protected by branch-rated breakers located within the racks by code. From a reliability standpoint, many data center operators want to avoid these additional breakers (more failure points), and therefore limit the rack PDU sizing to 16A / 20A. This produces a natural peak density limit of 11 – 11.5 kW per rack.
North America Voltage
Single phase Three phase
20 A 30 A 40 A 20 A 30 A 40 A
120 V 1.9 kW 2.9 kW 3.8 kW 5.8 kW 8.6 kW 11.5 kW
208 V 3.3 kW 5.0 kW 6.7 kW 5.8 kW 8.6 kW 11.5 kW
240 V 3.8 kW 5.8 kW 7.7 kW 11.5 kW 17.3 kW 23.0 kW
Europe Voltage
16 A 25 A 32 A 16 A 25 A 32 A
230 V 3.7 kW 5.8 kW 7.4 kW 11.0 kW 17.3 kW 22.1 kW Effect on cooling Our model did not include the capital cost of bulk cooling (i.e. chiller, cooling tower) because it is not impacted by changes to the IT rack density, for the same reason as bulk power. A best practice in data centers is to separate hot and cold air streams through containment which our capital cost model assumes. Since the same number of cooling units can be used to cool all racks at all reasonable densities, cooling distribution (room and row cooling) was also excluded from the capital cost curve (Figure 2). Note, at 30kW/rack and above there is a noticeable row-cooler cost penalty. This effect was not analyzed for room cooling. When hot and cold air streams are not separated through containment, there is a significant impact on the air distribution (CRAH/CRAC) capital cost due to varying degrees of air mixing (dependent on layout and density). When perimeter cooling is used with no containment, the capital cost increases uniformly across all densities up to about 7 kW/rack, above which it becomes more difficult to consistently cool all racks in the space. When row cooling is used without containment, the cost curve shape would change its slope. At low densities, there is a greater cost penalty for being uncontained since the coolers are located further from the IT equipment they are supporting. As the density increases, the close-coupling effect improves and joins the “contained” cost curve. Airflow and density – Air-cooled IT equipment is designed to take in a certain amount of airflow and reject it at a higher temperature. Some equipment requires more or less airflow for a given power consumption (kW). We investigated this relationship between airflow and power consumption because it has an impact on the number of cooling units required to cool the data center. Using data readily available on Energy Star spec sheets, we found a decrease in the CFM/kW as the density increased (see Figure 6). Based on the heat energy formula3, the lower airflow requirement means a higher delta T; and a higher delta T means each cooling unit has a greater capacity, so fewer units are necessary to cool the same total load (kW).
3 Q (W) = 0.176 * ∆T in C * CFM OR Q(W) = 0.316 * ∆T in F * CFM
Table 2 Natural breakpoints for density based on circuit breaker sizing

Choosing the Optimal Data Center Power Density
Schneider Electric – Data Center Science Center Rev 0 7
Sensitivity analysis of the cost model showed that the CFM downward trend was not a driver to the capex and was therefore excluded from the analysis. The analysis assumes 3.54 m3/minute/kW (125 CFM/kW). Effect on racks and space As the average density per rack increases, the number of racks decreases (assuming a fixed IT load). Going from 3 to 6 kW/rack, for instance, means half of the rack cost can be avoided. There is a point, however, where bigger racks become necessary because of the cable congestion. Wider and/or deeper racks are more expensive than standard racks, which counters some of the rack quantity savings. This is, in part, why the curve of Figure 2 flattens out above 5 kW/rack. Along with the rack count savings are space savings within the IT room. Space cost (per sq m or sq ft) varies from location to location, but, in general, is less expensive than the bulk power and cooling infrastructure. It is for this reason that it is better to under-estimate density and strand space than over-estimate density and strand power and cooling. Guidance for specifying an average rack density Our analysis suggests the following guidelines for specifying an average rack power density for new data center builds or retrofits: • An average density of 5-8 kW/rack provides the optimal cost / watt.
• Designing for an average density below 5 kW/rack comes at a cost penalty.
• Designing for an average density above 8 kW/rack provides diminishing cost benefit.
• Above an average density of 15 kW/rack, design complexities outweigh the cost sav-ings.
As densities per rack increase from 15 kW and beyond, there are design complexities injected into the data center project that often outweigh the potential savings. Some of these design challenges are: • Network cable management
• Power cable management
• Air flow challenges
• Thermal ride-through during an outage
• Rack weight and floor loading
• Additional breakers for greater capacity (amperage) rack PDUs
Based on the cost analysis findings, the natural break points of rack PDUs, current IT technology trends, and the design complexities that exist for extreme densities, the majority of data centers should design around an average of 5-8 kW/rack with a peak of 11–11.5 kW/rack.
Figure 6 Correlation of server density and airflow/kW
Choosing the Optimal Data Center Power Density
Schneider Electric – Data Center Science Center Rev 0 8
In addition to the capital cost, density has an impact on the operation of a data center. As density increases for a given capacity, and the associated space decreases in size, the cooling efficiency is improved because the pipes and ducts now run a shorter distance. And when this distance is shorter, the pump and fan losses are reduced. Cooling efficiency is also improved when the airflow/kW of IT load decreases (an IT trend mentioned earlier), because lower airflow per kW means a higher delta T which increases the heat transfer efficiency of the coolers. As the density increases, another important consideration is the thermal runtime, or amount of time before the IT inlet temperature exceeds the allowable threshold when a power outage occurs. In general, • for a fixed capacity (kW), as density increases and the associated space decreases, the
thermal runtime trends downward.
• for a fixed room size, as density increases and the capacity increases, the thermal runtime trends downward.
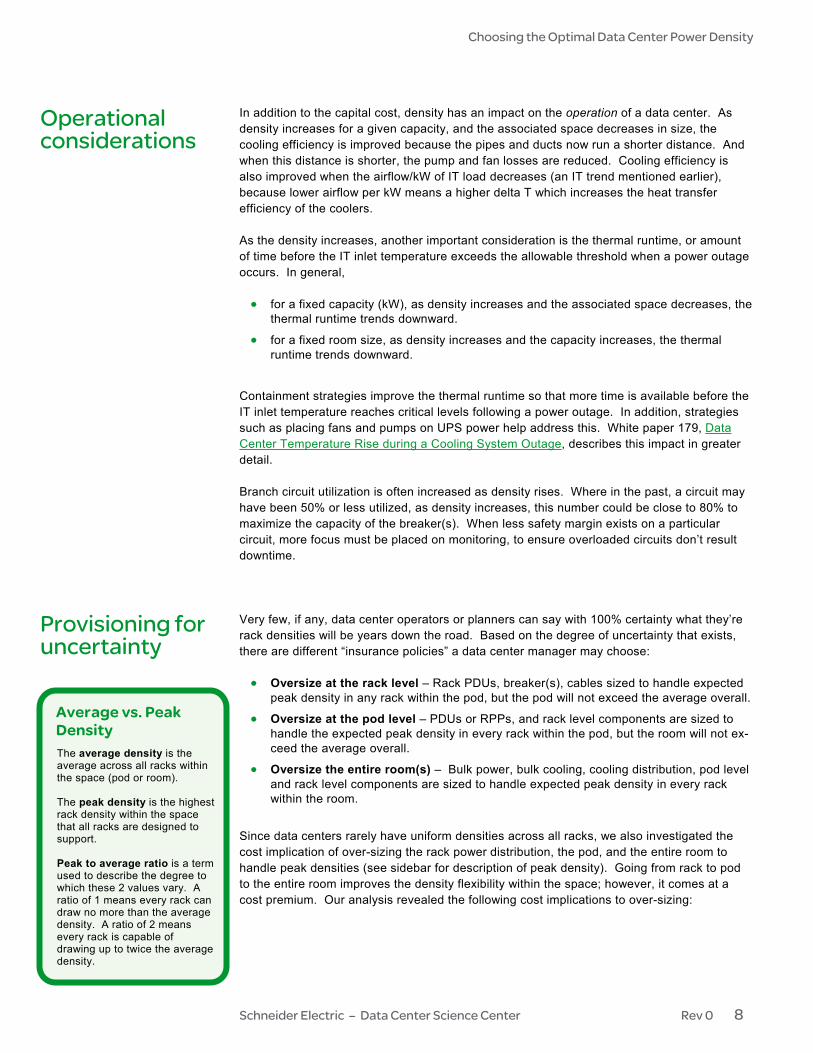
Containment strategies improve the thermal runtime so that more time is available before the IT inlet temperature reaches critical levels following a power outage. In addition, strategies such as placing fans and pumps on UPS power help address this. White paper 179, Data Center Temperature Rise during a Cooling System Outage, describes this impact in greater detail. Branch circuit utilization is often increased as density rises. Where in the past, a circuit may have been 50% or less utilized, as density increases, this number could be close to 80% to maximize the capacity of the breaker(s). When less safety margin exists on a particular circuit, more focus must be placed on monitoring, to ensure overloaded circuits don’t result downtime. Very few, if any, data center operators or planners can say with 100% certainty what they’re rack densities will be years down the road. Based on the degree of uncertainty that exists, there are different “insurance policies” a data center manager may choose: • Oversize at the rack level – Rack PDUs, breaker(s), cables sized to handle expected
peak density in any rack within the pod, but the pod will not exceed the average overall.
• Oversize at the pod level – PDUs or RPPs, and rack level components are sized to handle the expected peak density in every rack within the pod, but the room will not ex-ceed the average overall.
• Oversize the entire room(s) – Bulk power, bulk cooling, cooling distribution, pod level and rack level components are sized to handle expected peak density in every rack within the room.
Since data centers rarely have uniform densities across all racks, we also investigated the cost implication of over-sizing the rack power distribution, the pod, and the entire room to handle peak densities (see sidebar for description of peak density). Going from rack to pod to the entire room improves the density flexibility within the space; however, it comes at a cost premium. Our analysis revealed the following cost implications to over-sizing:
Provisioning for uncertainty
Operational considerations
Average vs. Peak Density The average density is the average across all racks within the space (pod or room). The peak density is the highest rack density within the space that all racks are designed to support. Peak to average ratio is a term used to describe the degree to which these 2 values vary. A ratio of 1 means every rack can draw no more than the average density. A ratio of 2 means every rack is capable of drawing up to twice the average density.

Choosing the Optimal Data Center Power Density
Schneider Electric – Data Center Science Center Rev 0 9
• Rack level – over-sizing rack power distribution components to handle a peak to aver-age ratio of 2 comes at a cost premium of < 1% of the total data center project (see Figure 7).
• Pod level – over-sizing PDUs and rack power distribution to handle a peak to average ratio of 2 comes at a cost premium of 4% of the total data center project.
• Room level – over-sizing the room to handle a peak to average ratio of 2 comes at a cost premium of 20% or more, depending on the degree of over-sizing.
In general, you should over-size at the rack level when there is a high degree of certainty of densities being deployed, and when policies can be implemented to limit the rack configura-tions. Stranding capacity As the cost analysis showed, the optimal average density is in the range of 5-8 kW/rack. Most data centers naturally fall in this range with the IT equipment readily available, but what happens if the actual density deployed is higher or lower than the designed density? Consider the following two scenarios: Scenario 1: Data center is designed for higher density than actually deployed When a data center is deployed at a density lower than planned, the IT room footprint is filled up before the power and cooling infrastructure has been fully utilized. The example in Figure 1 demonstrated this. This is a common density challenge, as the logic is often to build higher just-in-case. But the reality is, this comes at a cost. Scenario 2: Data center is designed for lower density than actually deployed When a data center is deployed at a density higher than planned, the power and cooling capacity is fully utilized, but racks and/or space is stranded. For the majority of data centers, it is better (less costly) to strand space over power and cooling infrastructure. Therefore, a data center should be designed on the low side of a forecast. In either case, the stranded capacity can be re-claimed if provisions are put in place on day 1. Best practices to minimize stranded capacity include: • Design a junction box off the main switchgear so extra capacity can be added down the
road without doing hot work or shutting down a portion of a live data center.
• Include spare breaker positions on output of bulk power (UPS capacity) to avoid strand-ing bulk power capacity, without invasive work or downtime.
• Include spare piping valves to avoid stranding bulk cooling capacity, without invasive work or downtime.
Figure 7 Cost premium to design rack distribution to peak density of 11.5 kW is $0.08/watt or <1% of data center
* Assuming bulk power and cooling, and cooling distribution
sized to 5 kW/rack

Choosing the Optimal Data Center Power Density
Schneider Electric – Data Center Science Center Rev 0 10
• Deploy IT racks pod-by-pod to minimize stranded racks if actual density is deployed higher than planned.
• If a range of densities is expected, design some pods at higher average densities and the remaining at the average, to more efficiently utilize resources.
• Contain pods for most efficient use of cooling resources.
• Create and enforce density deployment policies, which serve as the rules for how to deploy the IT equipment effectively in the racks.
Prefabricated data center modules provide a level of flexibility that makes them well suited when density is forecasted too high or too low. White Paper 165, Types of Prefabricated Modular Data Centers, provides descriptions and applications for power modules, cooling modules, IT modules, and all-in-one modules. When a data center strands power and/or cooling capacity because the IT space is filled, IT module(s) can be added in a parking lot and tap into the existing power and cooling, using the strategies above to avoid downtime. Likewise, when a data center strands space, prefabricated power and/or cooling modules can be added so that the IT room can be fully populated.

Choosing the Optimal Data Center Power Density
Schneider Electric – Data Center Science Center Rev 0 11
Although numerous industry reports have forecasted rapidly rising IT rack densities, the majority of data centers are still being deployed at average densities of 3-5 kW/rack. The choice of IT rack power densities has direct impact on the capital cost of the data center. This white paper analyzes costs at varying densities, and concludes that the optimal average density specification is 5-8 kW/rack. Deploying lower average densities results in unneces-sary expense; deploying higher often results in unforeseen complexities with little to no return. Since uniform densities are unlikely in a typical data center, designing racks for a peak of 11-11.5 kW/rack, which has a very small (<1%) cost premium, is advised. The density specification is a key attribute to discuss in the early planning of a data center project. An effective density strategy includes (1) a pod-based architecture that is flexible to allow for peak densities and (2) having provisions in place to deal with the uncertainty of the deployed density.
Conclusion
Kevin Brown is the Vice President of Data Center Global Solution Offer & Strategy at Schneider Electric. Kevin holds a BS in mechanical engineering from Cornell University. Prior to this position at Schneider Electric, Kevin served as Director of Market Development at Airxchange, a manufacturer of energy recovery ventilation products and components in the HVAC industry. Before joining Airxchange, Kevin held numerous senior management roles at Schneider Electric, including Director, Software Development Group. Wendy Torell is a Senior Research Analyst at Schneider Electric’s Data Center Science Center. In this role, she researches best practices in data center design and operation, publishes white papers & articles, and develops TradeOff Tools to help clients optimize the availability, efficiency, and cost of their data center environments. She also consults with clients on availability science approaches and design practices to help them meet their data center performance objectives. She received her Bachelors of Mechanical Engineering degree from Union College in Schenectady, NY and her MBA from University of Rhode Island. Wendy is an ASQ Certified Reliability Engineer. Victor Avelar is the Director of Schneider Electric’s Data Center Science Center. He is responsible for data center design and operations research, and consults with clients on risk assessment and design practices to optimize the availability and efficiency of their data center environments. Victor holds a bachelor’s degree in mechanical engineering from Rensselaer Polytechnic Institute and an MBA from Babson College. He is a member of AFCOM and the American Society for Quality.
About the authors

Choosing the Optimal Data Center Power Density
Schneider Electric – Data Center Science Center Rev 0 12
Calculating Space and Power Density Requirements for Data Centers White Paper 155
Rack Powering Options for High Density in 230VAC Countries White Paper 28
Rack Powering Options for High Density White Paper 29
Data Center Temperature Rise During a Cooling System Outage White Paper 179
Types of Prefabricated Modular Data Centers White Paper 165
Data Center Capital Cost Calculator TradeOff Tool 4
Data Center Efficiency Calculator TradeOff Tool 6
Prefabricated vs Traditional Data Center Cost Calculator TradeOff Tool 17
Resources
Browse all white papers whitepapers.apc.com
tools.apc.com
Browse all TradeOff Tools™
© 20
14 S
chne
ider E
lectri
c. Al
l righ
ts re
serv
ed.
For feedback and comments about the content of this white paper: Data Center Science Center [email protected] If you are a customer and have questions specific to your data center project: Contact your Schneider Electric representative at www.apc.com/support/contact/index.cfm
Contact us

Choosing the Optimal Data Center Power Density
Schneider Electric – Data Center Science Center Rev 0 13
Methodology for cost/watt at varying average densities A 1 MW data center was analyzed at 12 different average densities (ranging from 1 kW/rack to 60 kW/rack) to illustrate the capital cost implications. The analysis used the following approach:
1. Layout: For each density, an optimal layout of IT racks, PDUs, and coolers was determined.
2. Space cost: Total room space (m2 or ft2) was determined based on layout. An as-sumed space unit cost was used to then compute the total space cost.
3. Cooling cost: InRow coolers were configured using cooling configuration tools, with typical street price. Hot aisle containment was assumed when determining the num-ber of coolers needed per pod.
4. Distribution cost: PDUs, rack PDUs, and cable lengths were identified based on pod sizes and rack density, and quoted using typical street price. Installation and design costs were also estimated.
5. Rack cost: The number of racks was determined from the layout. Rack types (wider, deeper) varied as the density changed. Typical street price was quoted for the racks.
Sensitivity analysis confirmed that the coolers and PDUs were not significant drivers to the cost variation. A simplified analysis was then conducted, factoring in ONLY rack cost, rack PDU cost, and space cost. Figure 2 of this paper represents the results of the simplified analysis. Methodology for cost/watt premium for varying peak densities The chart in Figure 7 illustrates the cost premium as the peak density varies, given a typical layout of a 1 MW data center designed with an average density of 5.76 kW/rack. Peak-to-average ratios of 1.5, 2.3, 3.5, 4.6, and 6.9 were analyzed. These numbers were based off of maximum capacities of rack PDUs available in the market. The approach used to analyze this was as follows:
1. Distribution cost: In order to handle a peak density within any rack within the pod (without violating the average density overall), each rack was configured with a PDU output breaker, cable, and rack PDU that could support the higher density.
2. Total data center project cost: The Data Center Capital Cost Calculator was used to estimate the overall project cost. The premium for upgrading the distribution was then compared to the total.
Data and assumptions Pricing for PDUs, coolers, rack PDUs, and racks came from existing Schneider Electric products, using typical street price. Table A1 provides a list of further modeling assumptions that were used in this analysis.
Appendix: Cost model

Choosing the Optimal Data Center Power Density
Schneider Electric – Data Center Science Center Rev 0 14
Assumption Value
IT airflow requirement 3.54 m3/minute/kW (125 CFM/kW) at all densities)
Distribution voltage 120V for cost/watt at uniform densities; 240V for peak-to-average analysis
Space cost $1614 / sq m ($150 / sq ft)
Standard width / depth racks For densities < 8 kW
Wide racks (standard depth) For densities between 8 kW and 20 kW
Wide and deep racks For densities > 20 kW
PDU to rack PDU cable length Varies by layout for cost / watt analysis; assumed an average of 10 m (33 ft) for
peak-to-average analysis
Cooling Close coupled cooling with containment; all servers are air-cooled
Redundancy No redundancy (1N architecture)
Table A1 Assumptions used in cost analysis