Embed Size (px)
Citation preview
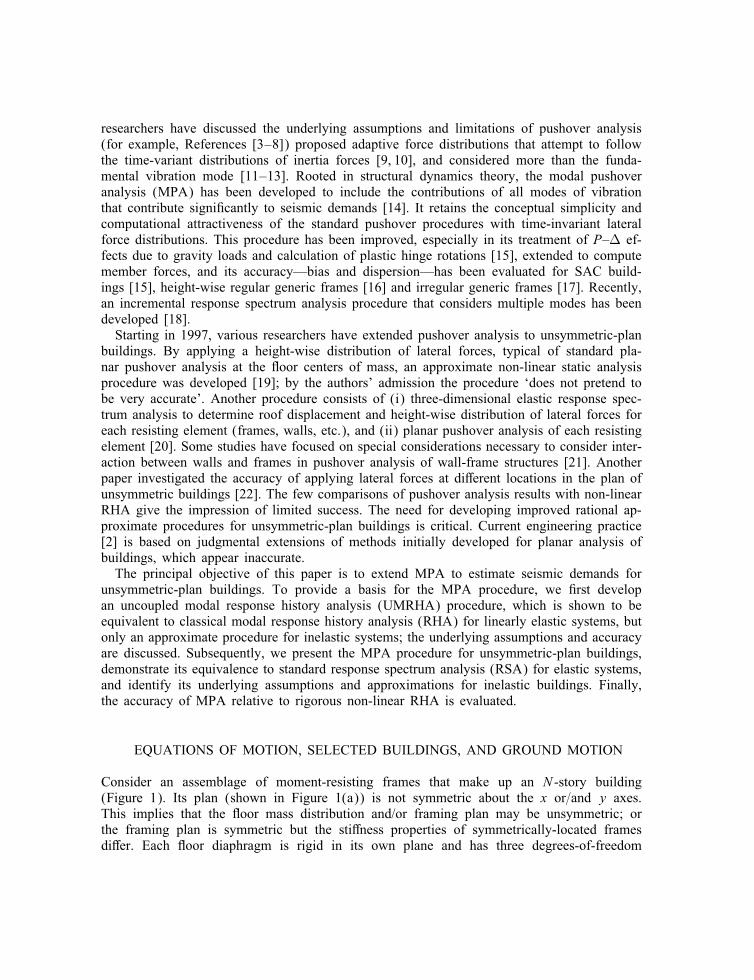
Chopra, Goel. 2004. Published in Earthquake Engineering and Structural Dynamics, 33(8):903-927.
A modal pushover analysis procedure to estimate seismic demands for unsymmetric-plan buildings
Anil K. Chopra1; ∗; † and Rakesh K. Goel2
1Department of Civil and Environmental Engineering; 707 Davis Hall; University of California; Berkeley; CA 94720-1710; U.S.A.
2Department of Civil and Environmental Engineering; Cal Poly State University; Room 263; Building 13; San Luis Obispo; CA 93407; U.S.A.
SUMMARY
Based on structural dynamics theory, the modal pushover analysis (MPA) procedure retains the concep-tual simplicity of current procedures with invariant force distribution, now common in structural engi-neering practice. The MPA procedure for estimating seismic demands is extended to unsymmetric-plan buildings. In the MPA procedure, the seismic demand due to individual terms in the modal expansion of the e�ective earthquake forces is determined by non-linear static analysis using the inertia force dis-tribution for each mode, which for unsymmetric buildings includes two lateral forces and torque at each �oor level. These ‘modal’ demands due to the �rst few terms of the modal expansion are then combined by the CQC rule to obtain an estimate of the total seismic demand for inelastic systems. When applied to elastic systems, the MPA procedure is equivalent to standard response spectrum analysis (RSA). The MPA estimates of seismic demand for torsionally-sti� and torsionally-�exible unsymmetric systems are shown to be similarly accurate as they are for the symmetric building; however, the results deteriorate for a torsionally-similarly-sti� unsymmetric-plan system and the ground motion considered because (a) elastic modes are strongly coupled, and (b) roof displacement is underestimated by the CQC modal combination rule (which would also limit accuracy of RSA for linearly elastic systems). Copyright ? 2004 John Wiley & Sons, Ltd.
KEY WORDS: modal pushover analysis; unsymmetric-plan building; seismic demands
INTRODUCTION
The non-linear static procedure (NSP) or pushover analysis, as described in FEMA-273 [1] and its successor FEMA-356 [2] is now used by the structural engineering profession as a standard tool for estimating seismic demands for buildings. In the past few years, several
∗Correspondence to: Anil K. Chopra, Department of Civil and Environmental Engineering, 707 Davis Hall, University of California, Berkeley, CA 94720-1710, U.S.A.
†E-mail: [email protected]
Contract=grant sponsor: National Science Foundation; contract=grant number: CMS-0336085
researchers have discussed the underlying assumptions and limitations of pushover analysis (for example, References [3–8]) proposed adaptive force distributions that attempt to follow the time-variant distributions of inertia forces [9, 10], and considered more than the funda-mental vibration mode [11–13]. Rooted in structural dynamics theory, the modal pushover analysis (MPA) has been developed to include the contributions of all modes of vibration that contribute signi�cantly to seismic demands [14]. It retains the conceptual simplicity and computational attractiveness of the standard pushover procedures with time-invariant lateral force distributions. This procedure has been improved, especially in its treatment of P–� ef-fects due to gravity loads and calculation of plastic hinge rotations [15], extended to compute member forces, and its accuracy—bias and dispersion—has been evaluated for SAC build-ings [15], height-wise regular generic frames [16] and irregular generic frames [17]. Recently, an incremental response spectrum analysis procedure that considers multiple modes has been developed [18]. Starting in 1997, various researchers have extended pushover analysis to unsymmetric-plan
buildings. By applying a height-wise distribution of lateral forces, typical of standard pla-nar pushover analysis at the �oor centers of mass, an approximate non-linear static analysis procedure was developed [19]; by the authors’ admission the procedure ‘does not pretend to be very accurate’. Another procedure consists of (i) three-dimensional elastic response spec-trum analysis to determine roof displacement and height-wise distribution of lateral forces for each resisting element (frames, walls, etc.), and (ii) planar pushover analysis of each resisting element [20]. Some studies have focused on special considerations necessary to consider inter-action between walls and frames in pushover analysis of wall-frame structures [21]. Another paper investigated the accuracy of applying lateral forces at di�erent locations in the plan of unsymmetric buildings [22]. The few comparisons of pushover analysis results with non-linear RHA give the impression of limited success. The need for developing improved rational ap-proximate procedures for unsymmetric-plan buildings is critical. Current engineering practice [2] is based on judgmental extensions of methods initially developed for planar analysis of buildings, which appear inaccurate. The principal objective of this paper is to extend MPA to estimate seismic demands for
unsymmetric-plan buildings. To provide a basis for the MPA procedure, we �rst develop an uncoupled modal response history analysis (UMRHA) procedure, which is shown to be equivalent to classical modal response history analysis (RHA) for linearly elastic systems, but only an approximate procedure for inelastic systems; the underlying assumptions and accuracy are discussed. Subsequently, we present the MPA procedure for unsymmetric-plan buildings, demonstrate its equivalence to standard response spectrum analysis (RSA) for elastic systems, and identify its underlying assumptions and approximations for inelastic buildings. Finally, the accuracy of MPA relative to rigorous non-linear RHA is evaluated.
EQUATIONS OF MOTION, SELECTED BUILDINGS, AND GROUND MOTION
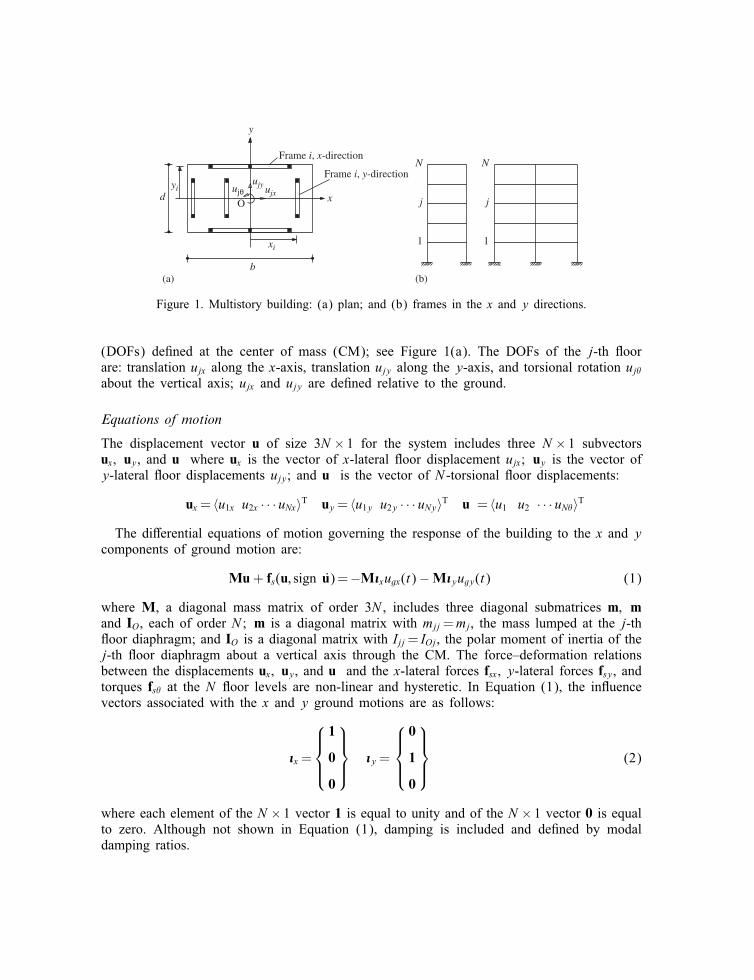
Consider an assemblage of moment-resisting frames that make up an N -story building (Figure 1). Its plan (shown in Figure 1(a)) is not symmetric about the x or=and y axes. This implies that the �oor mass distribution and/or framing plan may be unsymmetric; or the framing plan is symmetric but the sti�ness properties of symmetrically-located frames di�er. Each �oor diaphragm is rigid in its own plane and has three degrees-of-freedom
�
�
� � �
� � �
�
y
O x
b
d
Frame i, x-direction
yi
Frame i, y-direction
xi
ujx ujy ujθ
N N
j j
1 1
(a) (b)
Figure 1. Multistory building: (a) plan; and (b) frames in the x and y directions.
(DOFs) de�ned at the center of mass (CM); see Figure 1(a). The DOFs of the j-th �oor are: translation ujx along the x-axis, translation ujy along the y-axis, and torsional rotation uj�
about the vertical axis; ujx and ujy are de�ned relative to the ground.
Equations of motion
The displacement vector u of size 3N × 1 for the system includes three N × 1 subvectors ux; uy, and u where ux is the vector of x-lateral �oor displacement ujx; uy is the vector of y-lateral �oor displacements ujy; and u is the vector of N -torsional �oor displacements:
T T T ux = ·u1x u2x · · · uNx× uy = ·u1y u2y · · · uNy× u = ·u1 u2 · · · uN� ×
The di�erential equations of motion governing the response of the building to the x and y components of ground motion are:
Mu + fs(u; sign u)= −M�xugx(t) −M�yugy(t) (1)
where M, a diagonal mass matrix of order 3N , includes three diagonal submatrices m; m and IO, each of order N ; m is a diagonal matrix with mjj = mj, the mass lumped at the j-th �oor diaphragm; and IO is a diagonal matrix with Ijj = IOj, the polar moment of inertia of the j-th �oor diaphragm about a vertical axis through the CM. The force–deformation relations between the displacements ux; uy, and u and the x-lateral forces fsx, y-lateral forces fsy, and torques fs� at the N �oor levels are non-linear and hysteretic. In Equation (1), the in�uence vectors associated with the x and y ground motions are as follows:
1
0
�x = 0 �y = 1 (2) 0
0
where each element of the N × 1 vector 1 is equal to unity and of the N × 1 vector 0 is equal to zero. Although not shown in Equation (1), damping is included and de�ned by modal damping ratios.

� � �
5 bays @ 9.14 = 45.7 m
5 ba
ys @
9.1
4 =
45.
7 m
CS CM
4.57 m Rig
ht F
ram
e
Left
Fra
me
Ground Motion
Figure 2. Plan of selected unsymmetric-plan buildings.
The right side of Equation (1) can be interpreted as e�ective earthquake forces
m1
0
pe� (t)= −sug(t)= − 0 ugx(t) and − m1 ugy(t) (3) 0
0
associated with the x and y components of ground motion, respectively.
Selected structural systems
The structural systems considered in this paper are variations of the 9-story steel frame build-ing designed for the SAC Steel Project. Although not actually constructed, this structure meets seismic code and represents typical medium-rise buildings for Los Angeles, California. This building is described in several publications (for example, References [14, 23]). It is one of six symmetric-plan buildings used as examples to determine the bias and dispersion in the MPA procedure [15]. This symmetric-plan building was modi�ed to create three systems that are unsymmetric
about the y-axis but symmetric about the x-axis. While the sti�ness properties were preserved, the center of mass (CM) was de�ned eccentric relative to the center of sti�ness (CS), which is also the geometric center. The eccentricity between the CM and CS was chosen to be along the x-axis, equal to 10% of the plan dimension (Figure 2). The ratio between the �oor mass, mj, and its moment of inertia, IOj (about a vertical axis through the CM), was varied to create three di�erent unsymmetric-plan systems with di�erent degrees of coupling between lateral
Translational Component Rotational Component
Flo
or
G
3
6
9
Mode 1
2
3
4
T1 = 2.27 s
T2 = 1.32 s
T3 = 0.853 s
T4 = 0.497 s
Mode 1
3 4
2
(a) -2 -1 0 1 2 -10 -5 0 5 10
Flo
or
G
3
6
9
Mode 1
2
3
4
T1 = 2.41 s
T2 = 2.09 s
T3 = 0.908 s
T4 = 0.787 s
2 Mode 1
4 3
-2 -1 0 1 2 -2 -1 0 1 2 (b)
9
-2 -1 0 1 2
Flo
or
Mode 1
2
3
4
T1 = 3.23 s
T2 = 2.22 s
T3 = 1.22 s
T4 = 0.832 s
6
3
G
Mode 1
2
3 4
-4 -2 0 2 4 (b/2)×φθj (c) φyj
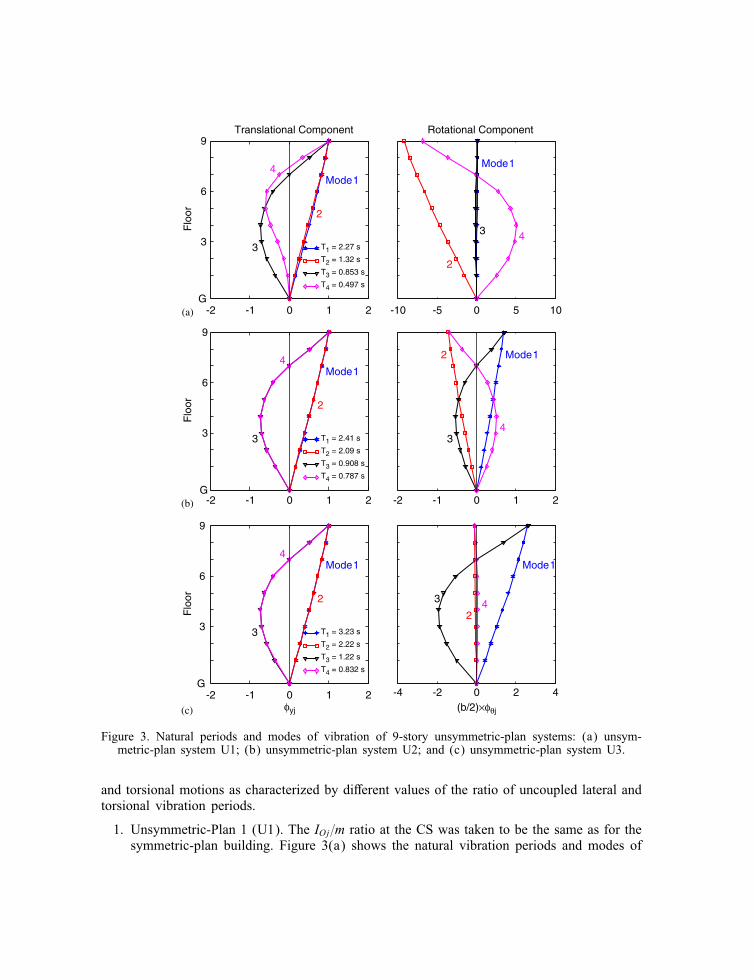
Figure 3. Natural periods and modes of vibration of 9-story unsymmetric-plan systems: (a) unsym-metric-plan system U1; (b) unsymmetric-plan system U2; and (c) unsymmetric-plan system U3.
and torsional motions as characterized by di�erent values of the ratio of uncoupled lateral and torsional vibration periods.
1. Unsymmetric-Plan 1 (U1). The IOj=m ratio at the CS was taken to be the same as for the symmetric-plan building. Figure 3(a) shows the natural vibration periods and modes of
system U1. Lateral displacements dominate motion in the �rst mode, whereas torsional rotations dominate motion in the second mode, indicating weak coupling between lateral and torsional motions. Because the period of the dominantly-torsional mode is much shorter than that of the dominantly-lateral mode, which is representative of buildings with moment-resisting frames located along the perimeter of the plan, this system will be referred to as a ‘torsionally-sti�’ system.
2. Unsymmetric-Plan 2 (U2). The IOj value for every �oor was increased by a factor of 2.95 relative to Case U1 and was chosen to achieve very close modal periods. Figure 3(b) demonstrates that the periods of the �rst two modes are indeed close and that the lateral and torsional motions, which are similar in magnitude, are strongly cou-pled in the �rst two modes. This system with similar periods in these two modes will be referred to as a ‘torsionally-similarly-sti�’ system.
3. Unsymmetric-Plan 3 (U3). The IOj value for every �oor was increased by a factor of 6.0 relative to Case U1. Figure 3(c) shows the natural vibration periods and modes of system U3. Torsional rotations dominate motion in the �rst mode, whereas lat-eral displacements dominate motion in the second mode, indicating weak coupling be-tween lateral and torsional motions. Because the period of the dominantly-torsional mode is much longer than that of the dominantly-lateral mode, this system is said to be ‘torsionally-�exible’.
These three unsymmetric-plan systems will undergo coupled y-lateral and torsional motions due to the y-component of ground motion, which is the focus of this paper. The purely lateral response along the x-axis due to the x-component of excitation is not considered as it has been the subject of previous investigations [14, 15].
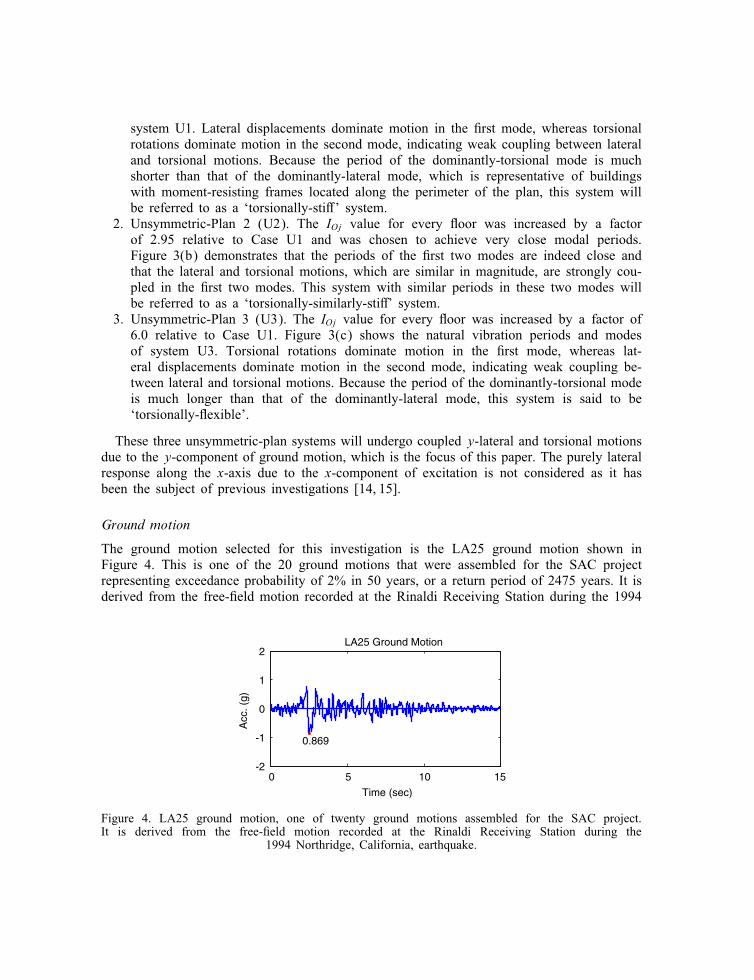
Ground motion
The ground motion selected for this investigation is the LA25 ground motion shown in Figure 4. This is one of the 20 ground motions that were assembled for the SAC project representing exceedance probability of 2% in 50 years, or a return period of 2475 years. It is derived from the free-�eld motion recorded at the Rinaldi Receiving Station during the 1994
LA25 Ground Motion 2
1
0
-1 0.869
-2 0 5 10 15
Time (sec)
Figure 4. LA25 ground motion, one of twenty ground motions assembled for the SAC project. It is derived from the free-�eld motion recorded at the Rinaldi Receiving Station during the
1994 Northridge, California, earthquake.
Acc
. (g)
� � �
� ��
��
�
� ��
�
�
Northridge earthquake. Recorded at a distance of 7:5 km from the causative fault, it contains a forward directivity pulse (Figure 4), which is common in many near-fault motions. This intense ground motion enables testing of the approximate procedures developed herein under severe conditions.
APPROXIMATE ANALYSIS PROCEDURES
Modal expansion of e�ective forces
The spatial distribution of the e�ective forces [Equation (3)] over the building is de�ned by the vector s and the time variation by ug(t)= ugx(t) or ugy(t). This force distribution can be expanded as a summation of modal inertia force distributions sn (Reference [24], section 13.3)
3N 3N s = sn = nM�n (4)
n=1 n=1
where �n is the n-th natural vibration mode of the structure consisting of three subvectors, � ; � , and � , and xn yn �n �xn
T m1 for ugx(t) Ln n = Mn = �T
n M�n Ln = (5) Mn �T
ynm1 for ugy(t)
The e�ective earthquake forces can then be expressed as
3N 3N pe� (t)= pe� ; n(t)= − snug(t) (6)
n=1 n=1
The contribution of the n-th mode to pe� (t) and s are
pe� ; n(t)= −snug(t) sn =� nM�n (7)
The sn vectors associated with the x and y components of ground motions are given by the same equation: sxn
m�xn
sn = syn =� n m�yn (8)
s �n
IO� �n
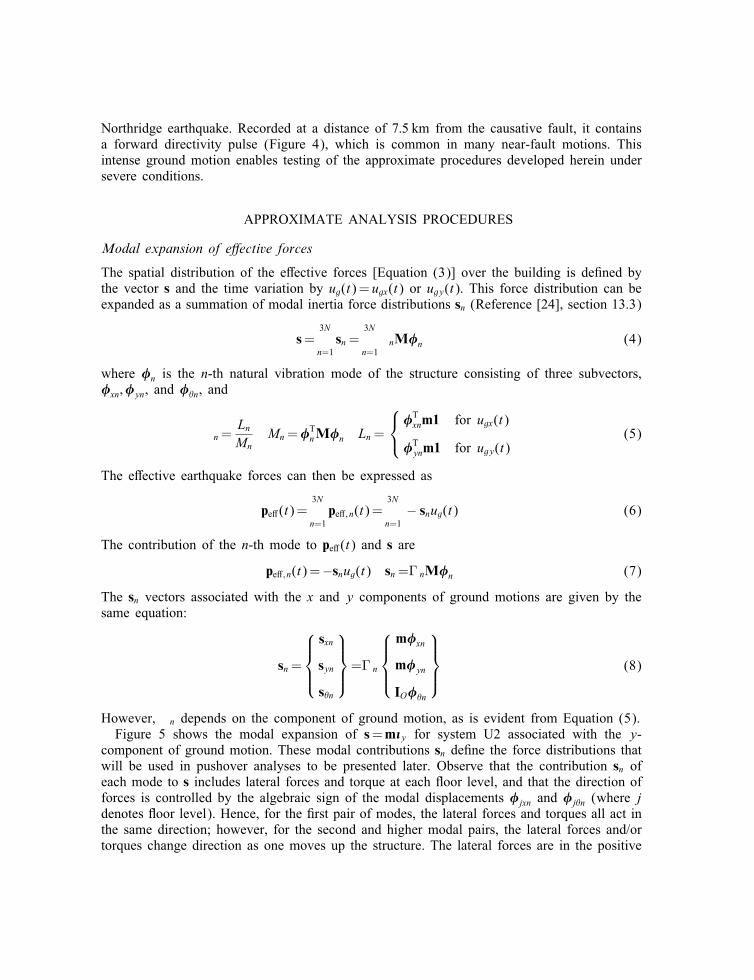
However, n depends on the component of ground motion, as is evident from Equation (5). Figure 5 shows the modal expansion of s = m�y for system U2 associated with the y-
component of ground motion. These modal contributions sn de�ne the force distributions that will be used in pushover analyses to be presented later. Observe that the contribution sn of each mode to s includes lateral forces and torque at each �oor level, and that the direction of forces is controlled by the algebraic sign of the modal displacements �jxn and �j�n (where j denotes �oor level). Hence, for the �rst pair of modes, the lateral forces and torques all act in the same direction; however, for the second and higher modal pairs, the lateral forces and/or torques change direction as one moves up the structure. The lateral forces are in the positive
�
m
m
m
m
m
m
m
m
m
0.112m
0.192m
0.273m
0.353m
0.431m
0.501m
0.576m
0.647m
0.703m
0.090I p
0.151I p
0.212I p
0.272I p
0.332I p
0.384I p
0.440I p
0.494I p
0.535I p
0.105m
0.181m
0.258m
0.335m
0.410m
0.477m
0.549m
0.617m
0.671m
0.090I p
0.151I p
0.212I p
0.272I p
0.332I p
0.384I p
0.440I p
0.493I p
0.534I p
0.096m
0.153m
0.188m
0.197m
0.171m
0.111m
0.002m
0.137m
0.266m
0.080I p
0.123I p
0.150I p
0.155I p
0.134I p
0.086I p
0.001I p
0.112I p
0.213I p
0.097m
0.156m
0.193m
0.202m
0.176m
0.115m
0.002m
0.141m
0.275m
0.080I p
0.123I p
0.150I p
0.155I p
0.133I p
0.086I p
0.001I p
0.111I p
0.211I p
= + + + + • • •
S S* S* S* S* 2 3 4 1
Figure 5. Modal expansion of s = m�y for unsymmetric-plan system U2 subjected to the y-component of ground motion.
y-direction in the �rst pair of modes, whereas the torques are in the positive (counter clockwise) direction in the �rst mode, but in the clockwise direction in the second mode. The contribution of the �rst modal pair to the force distribution s = m�y of the e�ective earthquake forces is largest, and these modal contributions decrease progressively for higher modal pairs.
Basic concept
Two procedures for approximate analysis of inelastic buildings will be described next: un-coupled modal response history analysis (UMRHA) and modal pushover analysis (MPA). Not intended for practical application, the UMRHA procedure is developed only to provide a rationale and motivation for the MPA procedure. In the UMRHA procedure, the response history of the building to pe� ; n(t), the n-th mode component of the excitation, is determined by non-linear RHA of an inelastic SDF system, and superposition of these ‘modal’ responses gives the total response. In the MPA procedure, the peak response to pe� ; n(t) is determined by a non-linear static or pushover analysis, and the peak ‘modal’ responses are combined by modal combination rules to estimate the total response.
UNCOUPLED MODAL RESPONSE HISTORY ANALYSIS
Elastic systems
The classical modal analysis procedure for linearly elastic systems may be interpreted as �nding the response of the structure to pe� ; n(t) for each n and superimposing the responses for all n. The response of the system to pe� ; n(t) is entirely in the n-th mode, with no contribution

� � � �
�
� �
� � �
�
�
from other modes, which implies that the modes are uncoupled. Then the �oor displacements are given by
un(t)= �nqn(t) (9)
where the modal coordinate is governed by
q + 2 n!nq + !2 qn = − nug(t) (10) n n n
in which !n is the natural frequency and n is the damping ratio for the n-th mode. The solution qn(t) of Equation (10) is given by
qn(t)=� nDn(t) (11)
where Dn(t) is the deformation response of the n-th mode linear SDF system, an SDF system with vibration properties—natural frequency !n (natural period Tn =2 �=!n) and damping ratio n—of the n-th mode of the MDF system, subjected to ug(t). It is governed by:
Dn + 2 n!nDn + !2 nDn = −ug(t) (12)
Substituting Equation (11) into Equation (9) gives the lateral displacements in the x and y directions and torsional rotations of the �oors:
uxn(t)=� n�xnDn(t) uyn(t)=� n�ynDn(t) u �n(t)=� n� �nDn(t) (13)
The story drifts in the x and y directions de�ned at the CM are given by
jxn(t)=� n(�jxn − �j−1; xn)Dn(t)� jyn(t)=� n(�jyn − �j−1; yn)Dn(t) (14)
These equations can be generalized to de�ne the story drifts for any frame, e.g., a frame at the edge of the building plan. Equations (13) and (14) represent the response of the MDF system to pe� ; n(t). Therefore, the response of the system due to total excitation pe� (t) is
3N r(t)= rn(t) (15)
n=1
This is the UMRHA procedure for exact analysis of elastic systems, which is identical to the classical modal RHA. Equation (10) is the standard equation governing the modal coordinate qn(t), Equations (13) and (14) de�ne the contribution of the n-th mode to the response, and Equation (15) combines the response contribution of all modes. However, these standard equations have been derived in an unconventional way. In contrast to the classical derivation found in textbooks (e.g., Reference [24]), we have used the modal expansion of the spatial distribution of the e�ective forces. This concept will provide a rational basis for the modal pushover analysis procedure to be developed later.
Inelastic systems
Although modal analysis is not valid for an inelastic system, its response can be usefully discussed in terms of the modal coordinates of the corresponding linearly elastic system. Each structural element of this linear system is de�ned to have the same sti�ness as the initial sti�ness of the same structural element of the inelastic system. Both systems have the same
�
mass and damping. Therefore, the natural vibration periods and modes of the corresponding linear system are the same as the vibration properties—referred to as natural ‘periods’ and ‘modes’—of the inelastic system undergoing small oscillation. The response of an inelastic system to excitation pe� ; n(t) will no longer be described by
Equation (9) because ‘modes’ other than the n-th ‘mode’ will also contribute to the response, implying that the vibration modes of the corresponding linear system are now coupled; thus the �oor displacements are given by the �rst part of Equation (16):
3N un(t)= �rqr(t) ≈ �nqn(t) (16)
r=1
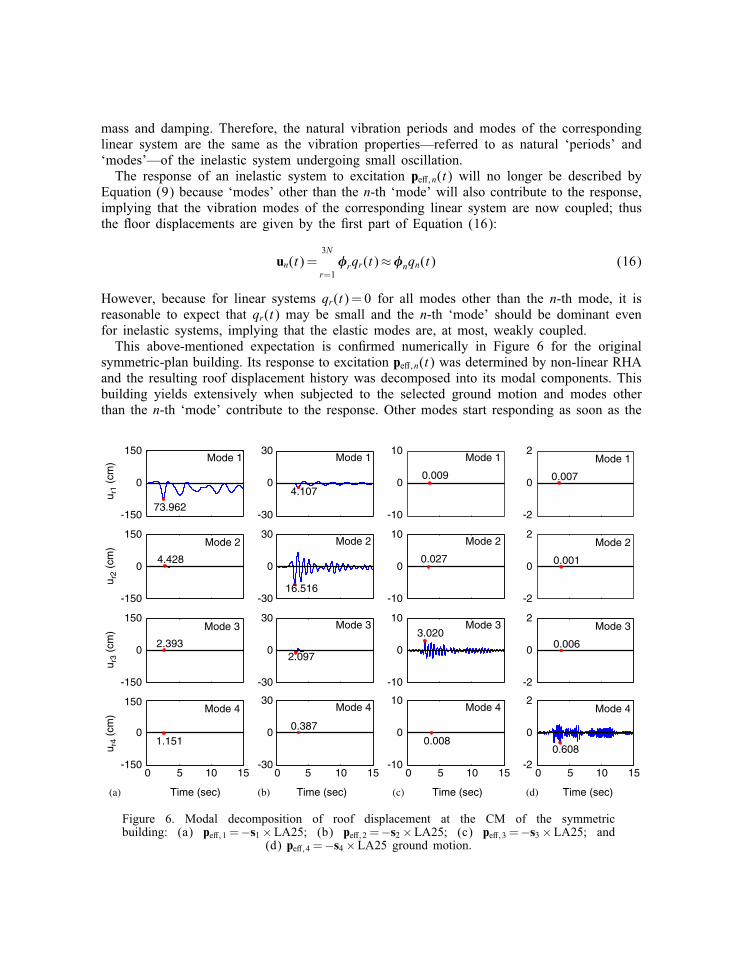
However, because for linear systems qr(t) = 0 for all modes other than the n-th mode, it is reasonable to expect that qr(t) may be small and the n-th ‘mode’ should be dominant even for inelastic systems, implying that the elastic modes are, at most, weakly coupled. This above-mentioned expectation is con�rmed numerically in Figure 6 for the original
symmetric-plan building. Its response to excitation pe� ; n(t) was determined by non-linear RHA and the resulting roof displacement history was decomposed into its modal components. This building yields extensively when subjected to the selected ground motion and modes other than the n-th ‘mode’ contribute to the response. Other modes start responding as soon as the
u r4
(cm
) u r
3 (c
m)
u r2
(cm
) u r
1 (c
m)
150
0
-150
150
0
-150
30 Mode 1
73.962
Mode 1
4.107
Mode 2
16.516
10 2 Mode 1 Mode 1
0.009 0.007 0 0 0
-30 -10 -2
30 10 2 Mode 2 Mode 2
0.027 0.001 0 0 0
-30 -10 -2
Mode 2
4.428
150
0
-150
Mode 3
2.393
30 Mode 3
2.097
10
0 0
-30 -10
Mode 3 3.020
2
0
-2
Mode 3
0.006
Mode 4
1.151
30 10 Mode 4
0.008
2 150 Mode 4
0.387 0 0 0 0
-150 -30 -10 -2
Mode 4
0.608
0 5 10 15 0 5 10 15 0 5 10 15 0 5 10 15
(a) Time (sec) (b) Time (sec) (c) Time (sec) (d) Time (sec)
Figure 6. Modal decomposition of roof displacement at the CM of the symmetric building: (a) pe� ; 1 = −s1 × LA25; (b) pe� ; 2 = −s2 × LA25; (c) pe� ; 3 = −s3 × LA25; and
(d) pe� ; 4 = −s4 × LA25 ground motion.
150 Mode 1
84.024
20
0 0
-150 -20
30 Mode 1
4.789
2
0 0
-30 -2
Mode 1
0.001
Mode 1
0.106
u r4
(cm
) u r
3 (c
m)
u r2
(cm
) u r
1 (c
m)
150
0
-150
20
0
-20
30
0
-30
Mode 2
0.952
2
0
-2
Mode 2 7.748
Mode 2
0.002
Mode 2
2.647
150
0
-150
20 Mode 3
0.021
30 Mode 3
19.406
2
0 0 0
-20 -30 -2
Mode 3 6.065
Mode 3
0.010
150 Mode 4
0.787
20 Mode 4
0.008
30 2 Mode 4 Mode 4
0.443 0.307
0 0 0 0
-150 -20 -30 -2 0 5 10 15 0 5 10 15 0 5 10 15 0 5 10 15
(a) Time (sec) (b) Time (sec) (c) Time (sec) (d) Time (sec)
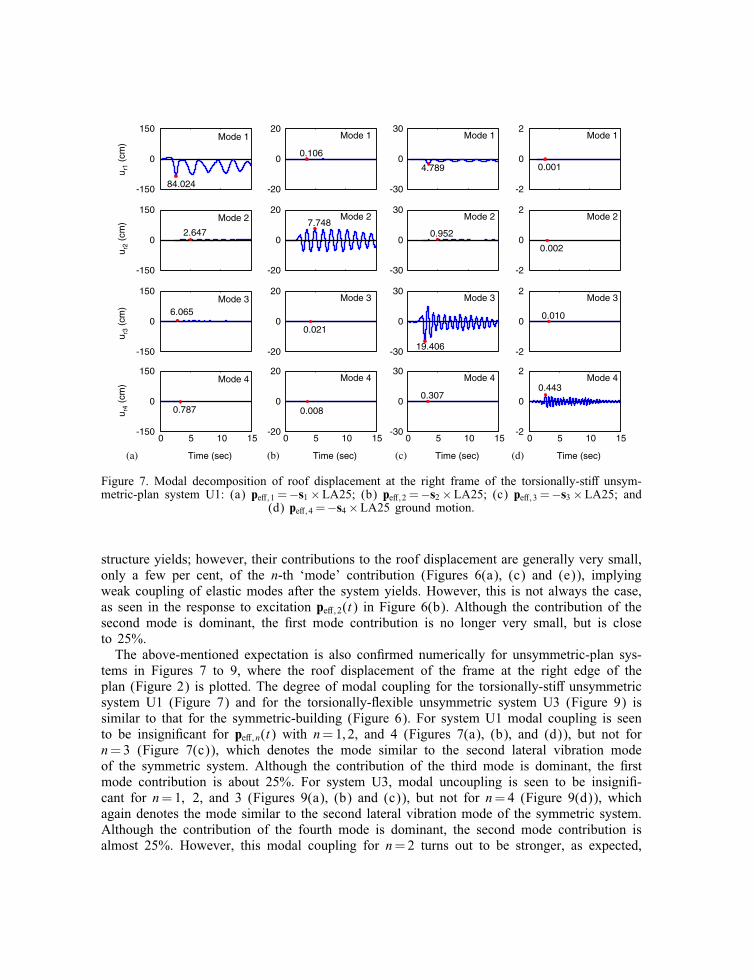
Figure 7. Modal decomposition of roof displacement at the right frame of the torsionally-sti� unsym-metric-plan system U1: (a) pe� ; 1 = −s1 × LA25; (b) pe� ; 2 = −s2 × LA25; (c) pe� ; 3 = −s3 × LA25; and
(d) pe� ; 4 = −s4 × LA25 ground motion.
structure yields; however, their contributions to the roof displacement are generally very small, only a few per cent, of the n-th ‘mode’ contribution (Figures 6(a), (c) and (e)), implying weak coupling of elastic modes after the system yields. However, this is not always the case, as seen in the response to excitation pe� ;2(t) in Figure 6(b). Although the contribution of the second mode is dominant, the �rst mode contribution is no longer very small, but is close to 25%. The above-mentioned expectation is also con�rmed numerically for unsymmetric-plan sys-
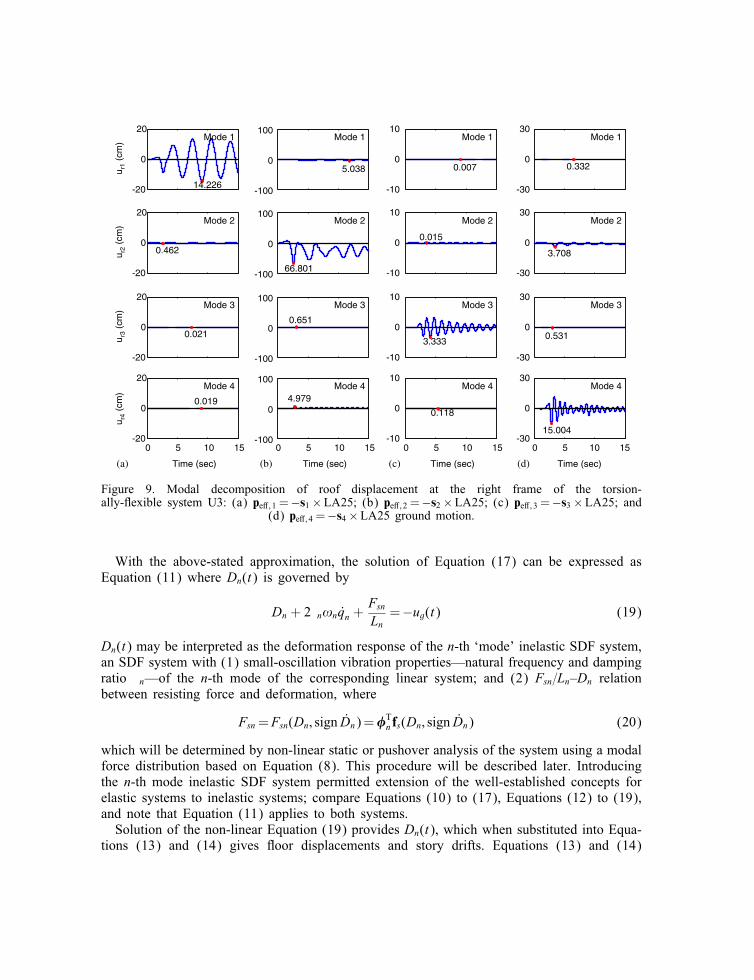
tems in Figures 7 to 9, where the roof displacement of the frame at the right edge of the plan (Figure 2) is plotted. The degree of modal coupling for the torsionally-sti� unsymmetric system U1 (Figure 7) and for the torsionally-�exible unsymmetric system U3 (Figure 9) is similar to that for the symmetric-building (Figure 6). For system U1 modal coupling is seen to be insigni�cant for pe� ; n(t) with n=1; 2, and 4 (Figures 7(a), (b), and (d)), but not for n= 3 (Figure 7(c)), which denotes the mode similar to the second lateral vibration mode of the symmetric system. Although the contribution of the third mode is dominant, the �rst mode contribution is about 25%. For system U3, modal uncoupling is seen to be insigni�-cant for n=1; 2, and 3 (Figures 9(a), (b) and (c)), but not for n= 4 (Figure 9(d)), which again denotes the mode similar to the second lateral vibration mode of the symmetric system. Although the contribution of the fourth mode is dominant, the second mode contribution is almost 25%. However, this modal coupling for n= 2 turns out to be stronger, as expected,

� � � �
100 Mode 1
60.311
30
0 0
-100 -30
30 Mode 1
1.467
10
0 0
-30 -10
Mode 1 6.502
Mode 1
0.281
u r4
(cm
) u r
3 (c
m)
u r2
(cm
) u r
1 (c
m)
Mode 2
0.097
100 Mode 2
2.608
30 Mode 2
14.36
30 10
0 0 0 0
-100 -30 -30 -10
Mode 2
0.412
100
0
-100
Mode 3
2.613
30 Mode 3
0.676
30 Mode 3
14.500
10
0 0 0
-30 -30 -10
Mode 3
1.917
100 30 Mode 4
0.804
30 Mode 4
0.830
10 Mode 4 Mode 4
3.515 0.218
0 0 0 0
-100 -30 -30 -10 0 5 10 15 0 5 10 15 0 5 10 15 0 5 10 15
(a) Time (sec) (b) Time (sec) (c) Time (sec) (d) Time (sec)
Figure 8. Modal decomposition of roof displacement at the right frame of the torsionally-similarly-sti� unsymmetric-plan system U2: (a) pe� ; 1 = −s1 × LA25; (b) pe� ; 2 = −s2 × LA25; (c) pe� ; 3 = −s3 × LA25;
and (d) pe� ; 4 = −s4 × LA25 ground motion.
for the unsymmetric system U2 (Figure 8(b)), because it has very similar periods in pairs of torsionally-coupled modes; but, the modal coupling remains negligible for n =1; 3, and 4 (Figures 8(a), (c) and (e)). These observations suggest that approximate analysis procedures based on the modal uncou-
pling approximation are expected to be as accurate for torsionally-sti� and torsionally-�exible buildings as they were for symmetric-plan buildings [15], but they may be less accurate for unsymmetric-plan buildings with very closely-spaced natural vibration periods. For many cases then, it is justi�ed to approximate the structural response due to excitation pe� ; n(t) by the second half of Equation (16) where qn(t) is governed by
Fsn q + 2 q + = − (t) (17) n n!n n nugMn
and Fsn is a non-linear hysteretic function of qn:
Fsn = Fsn(qn; sign qn)= �T n fs(qn; sign qn) (18)
If the smaller contributions of other modes had not been neglected, Fsn would depend on all modal coordinates, implying coupling of modal coordinates because of yielding of the structure.
� � �
�
u r4
(cm
) u r
3 (c
m)
u r2
(cm
) u r
1 (c
m)
20 Mode 1
14.226
10 Mode 1
5.038
30 100
0 0
Mode 1
0.007 0 0
-20 -10 -30 -100
Mode 1
0.332
20 Mode 2
0.462
10 100
0
Mode 2
66.801
0 0
-20 -10 -100
Mode 2
0.015
30
0
-30
Mode 2
3.708
20 Mode 3
0.021
100
0 0
-20 -100
Mode 3
0.651
10 Mode 3
3.333
30
0 0
-10 -30
Mode 3
0.531
20 10 Mode 4
0.118
30 Mode 4
100 Mode 4
4.979 0
0.019 0 0 0
-20 -10 -30 0 5 10 15 0 5 10 15 0 5 10 15 0 5 10 15
-100
Mode 4
15.004
(a) Time (sec) (b) Time (sec) (c) Time (sec) (d) Time (sec)
Figure 9. Modal decomposition of roof displacement at the right frame of the torsion-ally-�exible system U3: (a) pe� ; 1 = −s1 × LA25; (b) pe� ; 2 = −s2 × LA25; (c) pe� ; 3 = −s3 × LA25; and
(d) pe� ; 4 = −s4 × LA25 ground motion.
With the above-stated approximation, the solution of Equation (17) can be expressed as Equation (11) where Dn(t) is governed by
Fsn Dn + 2 n!nq + = −ug(t) (19) n Ln
Dn(t) may be interpreted as the deformation response of the n-th ‘mode’ inelastic SDF system, an SDF system with (1) small-oscillation vibration properties—natural frequency and damping ratio n—of the n-th mode of the corresponding linear system; and (2) Fsn=Ln –Dn relation between resisting force and deformation, where
Fsn = Fsn(Dn; sign Dn)= �n T fs(Dn; sign Dn) (20)
which will be determined by non-linear static or pushover analysis of the system using a modal force distribution based on Equation (8). This procedure will be described later. Introducing the n-th mode inelastic SDF system permitted extension of the well-established concepts for elastic systems to inelastic systems; compare Equations (10) to (17), Equations (12) to (19), and note that Equation (11) applies to both systems. Solution of the non-linear Equation (19) provides Dn(t), which when substituted into Equa-
tions (13) and (14) gives �oor displacements and story drifts. Equations (13) and (14)
� �
approximate the response of the inelastic MDF system to pe� ; n(t), the n-th mode contri-bution to pe� (t). The superposition of responses to pe� ; n(t), according to Equation (15) to obtain the total response to pe� (t), is strictly valid only for linearly elastic systems; however, it has been shown to be approximately valid for symmetric-plan inelastic systems [14]. This is the UMRHA procedure for approximate analysis of inelastic systems. When specialized for linearly elastic systems, it becomes identical to the rigorous classical modal RHA described earlier. However, UMRHA is only an approximate analysis procedure for inelastic systems. To
identify the underlying assumptions and approximations in UMRHA of inelastic systems, the key equations in UMRHA for both classes of structural systems are compared. The striking similarity between the equations for the elastic and inelastic systems is apparent. Equations (11), (13), and (14) apply to both systems; Equations (10) and (12) di�er from Equations (17) and (19) only in the resisting force; Equations (9) and (15) are exact for elastic systems but only approximate for inelastic systems. As is evident from Equation (16), a principal ap-proximation comes from neglecting the coupling of elastic modal coordinates [recall Equation (18)] in computing the response of the inelastic system to pe� ; n(t). Supported by the numerical results of Figures 7 to 9, this approximation is reasonable only because the excitation is the n-th mode contribution to the total excitation pe� (t) [see Equation (6)]. It would not be valid for an excitation with lateral force distribution di�erent than sn, e.g., the total excitation pe� (t). To test this approximation, the response of the unsymmetric-system U2—with strong lateral-
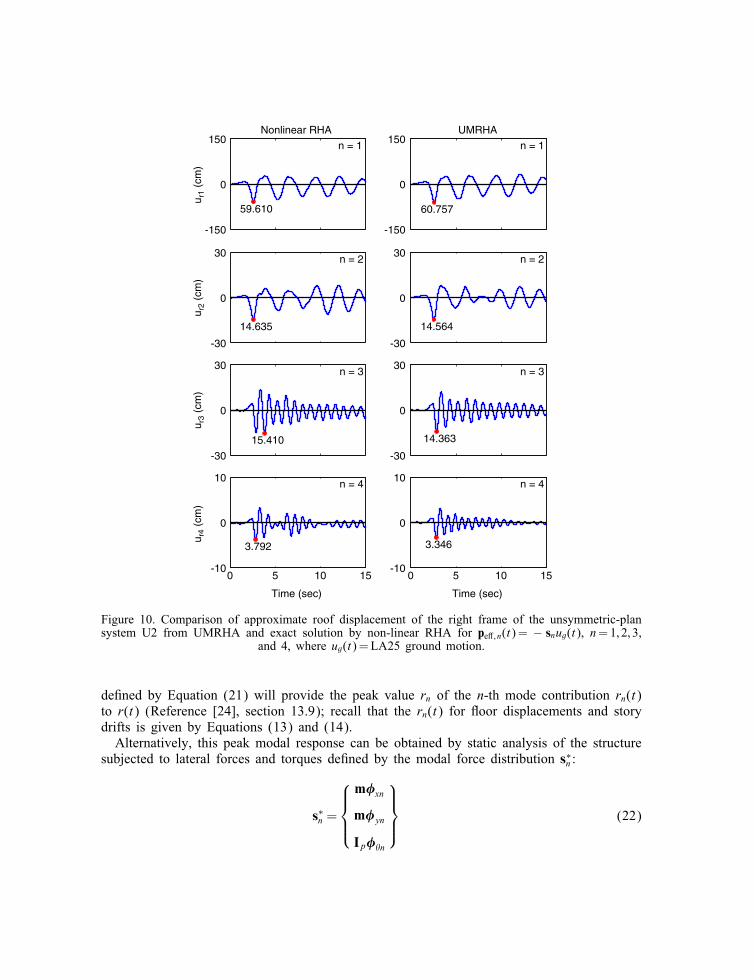
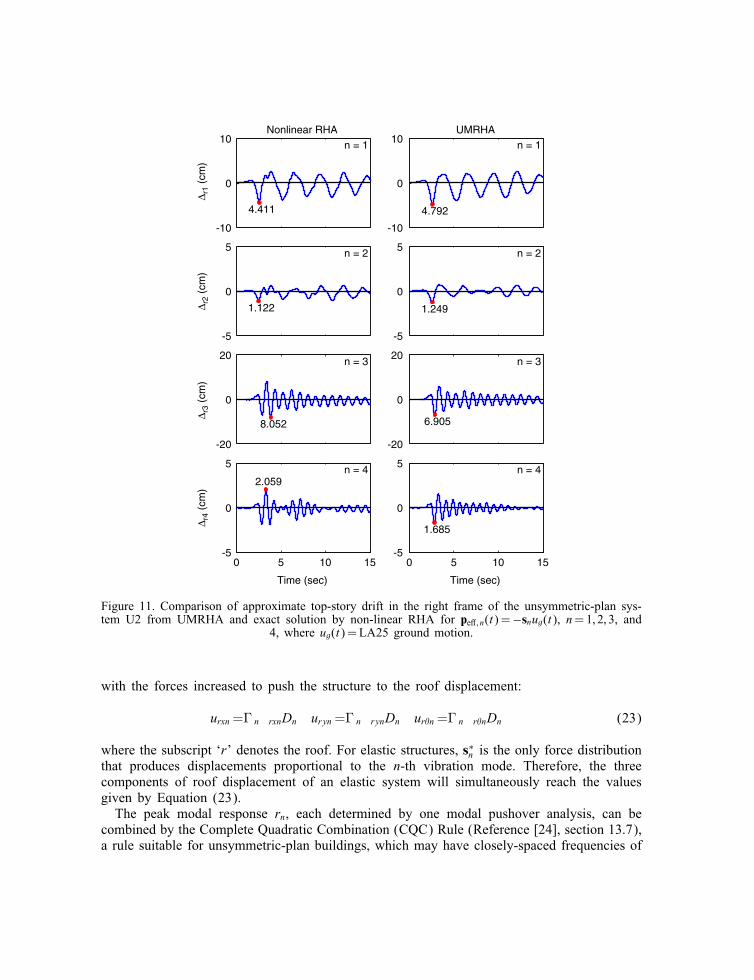
torsional coupling of vibration modes and closely-spaced vibration periods—to pe� ; n(t)= −snug(t), where ug(t) is the same ground motion as the one selected earlier, was deter-mined by two methods and compared: (1) rigorous non-linear RHA by solving the governing coupled equations [similar to Equation (1) except that the right side is pe� ; n(t)]; and (2) approximate UMRHA procedure. Such comparison for roof-displacement and top-story drift is presented in Figures 10 and 11, respectively. The errors in UMRHA results are slightly larger in drift than in displacement, but the errors in either response quantity seem acceptable for approximate methods to estimate seismic demands for unsymmetric-plan buildings. The UMRHA procedure is based on Equation (16), which restricts the deformations due
to pe� ; n(t) to be proportional to the n-th mode. This is exactly valid for linear elastic systems but is an approximation for inelastic systems. This approximation is avoided in the MPA procedure, which is presented next, but a modal combination approximation must be introduced as will be seen later. To provide a proper context, MPA is �rst presented for linear systems.
MODAL PUSHOVER ANALYSIS
Elastic systems
Consider the lateral forces fxn and fyn in the x and y directions and torques f �n de�ned as:
fxn = sxnAn fyn = synAn f �n = s �nAn (21)
where sxn, syn, and s �n are given by Equation (8), An = !n2 Dn and Dn is the peak deformation
of the n-th mode linear SDF system, determined by solving Equation (12) for Dn(t). Note that An is also the ordinate A(Tn;� n) of the earthquake pseudo-acceleration response (or design) spectrum for the n-th mode SDF system. Static analysis of the structure subjected to forces
��
Nonlinear RHA UMRHA
n = 2
14.635
n = 3
15.410
n = 4
3.792
n = 1
60.757
n = 2
14.564
n = 3
14.363
n = 4
3.346
150 n = 1
59.610
150
0 0
-150 -150
30 30
0 0
-30 -30
30 30
0 0
-30 -30
10 10
0 0
-10 -10 0 5 10 15 0 5 10 15
Time (sec) Time (sec)
Figure 10. Comparison of approximate roof displacement of the right frame of the unsymmetric-plan system U2 from UMRHA and exact solution by non-linear RHA for pe� ; n(t)= − snug(t), n =1; 2; 3,
and 4, where ug(t) = LA25 ground motion.
u r4
(cm
) u r
3 (c
m)
u r2
(cm
) u r
1 (c
m)
de�ned by Equation (21) will provide the peak value rn of the n-th mode contribution rn(t) to r(t) (Reference [24], section 13.9); recall that the rn(t) for �oor displacements and story drifts is given by Equations (13) and (14). Alternatively, this peak modal response can be obtained by static analysis of the structure
subjected to lateral forces and torques de�ned by the modal force distribution s n ∗ :
m� xn s n ∗ = m�yn (22)
Ip� �n
��
� � �
Nonlinear RHA UMRHA
n = 2
1.122
n = 3
8.052
n = 1
4.792
n = 2
1.249
n = 3
6.905
n = 4
1.685
10 n = 1
4.411
10
0 0
-10 -10
5 5
0 0
-5 -5
20 20
0 0
-20 -20
5 5 n = 4 2.059
0 0
-5 -5 0 5 10 15 0 5 10 15
Time (sec) Time (sec)
Figure 11. Comparison of approximate top-story drift in the right frame of the unsymmetric-plan sys-tem U2 from UMRHA and exact solution by non-linear RHA for pe� ; n(t)= −snug(t), n =1; 2; 3, and
4, where ug(t) = LA25 ground motion.
with the forces increased to push the structure to the roof displacement:
urxn =� n rxnDn uryn =� n rynDn ur�n =� n r�nDn (23)
where the subscript ‘r’ denotes the roof. For elastic structures, s n ∗ is the only force distribution
that produces displacements proportional to the n-th vibration mode. Therefore, the three components of roof displacement of an elastic system will simultaneously reach the values given by Equation (23). The peak modal response rn, each determined by one modal pushover analysis, can be
combined by the Complete Quadratic Combination (CQC) Rule (Reference [24], section 13.7), a rule suitable for unsymmetric-plan buildings, which may have closely-spaced frequencies of
∆ r4
(cm
) ∆ r
3 (c
m)
∆ r2
(cm
) ∆ r
1 (c
m)

� �
�
vibration. This MPA procedure for linear elastic systems is identical to the standard response spectrum analysis (RSA) procedure.
Inelastic systems
In the MPA procedure, the peak response rn of the inelastic building to e�ective earthquake forces pe� ; n(t) is estimated by a non-linear static analysis of the structure subjected to lateral forces and torques distributed over the building height according to s n
∗ [Equation (22)] with the forces increased to push the structure up to roof displacements urxn; uryn; ur�n. These values of the roof displacement components are determined from Equation (23), as for elastic systems, but Dn is now the peak deformation of the n-th ‘mode’ inelastic SDF system, determined by solving Equation (19) for Dn(t). Alternatively, Dn can be determined from the inelastic response (or design) spectrum (Reference [24], sections 7.6 and 7.12) or the elastic response (or design) spectrum in conjunction with empirical equations for the inelastic deformation ratio [25]. At this roof displacement, non-linear static analysis provides an estimate of the peak value rn of response quantity rn(t): �oor displacements and story drifts. For an inelastic system, no invariant distribution of forces will produce displacements pro-
portional to the n-th elastic mode. Therefore, the three components of roof displacement of an inelastic system will not simultaneously reach the values given by Equation (23). One of the two lateral components will be selected as the controlling displacement; the choice of the component would be the same as the dominant motion in the mode being considered. Non-linear static analysis using force distribution s n
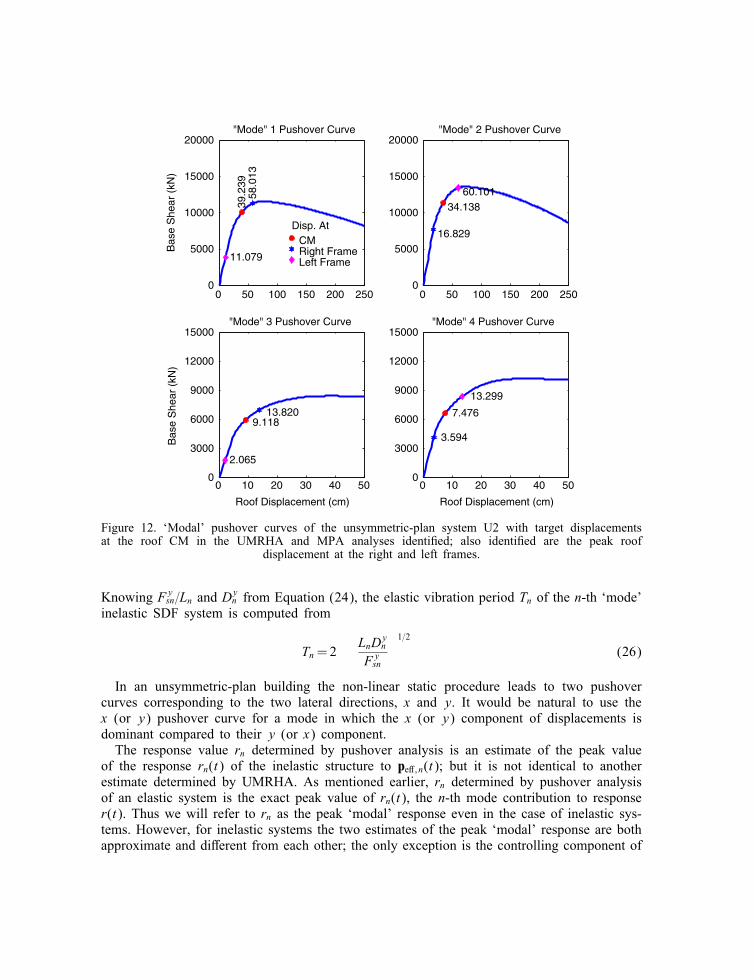
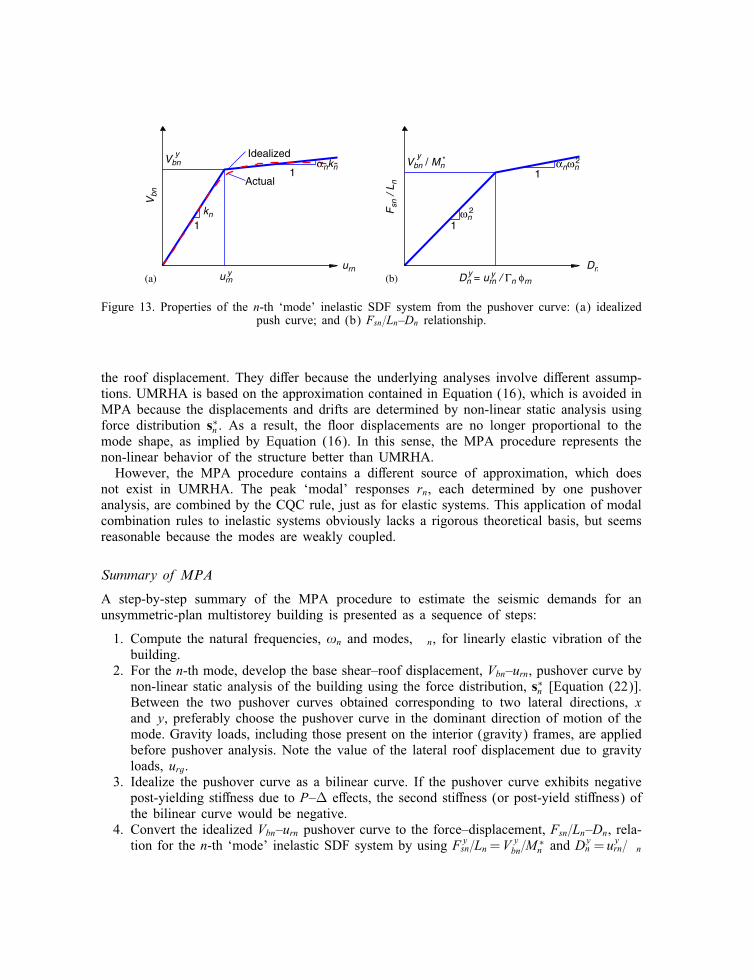
∗ leads to the n-th ‘mode’ pushover curve, a plot of base shear Vbn versus roof displacement urn in the appropriate (x or y) direction. Such pushover curves for the �rst four modes of the unsymmetric-plan system U2 are shown in Figure 12, wherein the roof displacements at the right and left frames are identi�ed, indicating signi�cant inelastic action in the right or the left frame. The n-th ‘mode’ pushover curve and its bilinear idealization are shown in Figure 13; at the yield point the base shear is Vy and the roof displacement is urn
y . bn The force–deformation (Fsn=Ln –Dn) relation for the n-th ‘mode’ inelastic SDF system is
required to determine Dn, whether it is determined by solving Equation (19) for Dn(t) or alternatively by the response spectrum methods mentioned above. Based on the theory pre-sented earlier [14] for symmetric-plan buildings, the Vbn–urn pushover curve is converted to the desired Fsn=Ln –Dn relation, as shown in Figure 13(b), where the yield values of Fsn=Ln
and Dn are
Vy y Fy usn rn = bn ∗
Dny = (24)
Ln Mn n rn
in which Mn ∗ = Ln n is the e�ective modal mass. The two are related through
Fy sn
Ln = !n
2 Dny (25)
�� �
"Mode" 1 Pushover Curve "Mode" 2 Pushover Curve 20000 20000
0
5000
10000
15000 B
ase
She
ar (
kN)
Disp. At CM Right Frame Left Frame
39.2
3958
.013
11.079
0
5000
10000
15000
34.138
16.829
60.101
0 50 100 150 200 250 0 50 100 150 200 250
"Mode" 3 Pushover Curve "Mode" 4 Pushover Curve 15000 15000
12000 12000
Bas
e S
hear
(kN
)
9000 9000
7.476
3.594
13.299
0 10 20 30 40 50
9.118 13.820
2.065
0 10 20 30 40 50
6000 6000
3000 3000
0 0
Roof Displacement (cm) Roof Displacement (cm)
Figure 12. ‘Modal’ pushover curves of the unsymmetric-plan system U2 with target displacements at the roof CM in the UMRHA and MPA analyses identi�ed; also identi�ed are the peak roof
displacement at the right and left frames.
Knowing Fsny =Ln and Dn
y from Equation (24), the elastic vibration period Tn of the n-th ‘mode’ inelastic SDF system is computed from
LnDny 1=2
Tn =2 (26) Fy sn
In an unsymmetric-plan building the non-linear static procedure leads to two pushover curves corresponding to the two lateral directions, x and y. It would be natural to use the x (or y) pushover curve for a mode in which the x (or y) component of displacements is dominant compared to their y (or x) component. The response value rn determined by pushover analysis is an estimate of the peak value
of the response rn(t) of the inelastic structure to pe� ; n(t); but it is not identical to another estimate determined by UMRHA. As mentioned earlier, rn determined by pushover analysis of an elastic system is the exact peak value of rn(t), the n-th mode contribution to response r(t). Thus we will refer to rn as the peak ‘modal’ response even in the case of inelastic sys-tems. However, for inelastic systems the two estimates of the peak ‘modal’ response are both approximate and di�erent from each other; the only exception is the controlling component of
�
�
urn
V bn
urn y
Vbn y
Actual
Idealized
1 kn
1 αnkn
Dn
F sn
/ L n
Dn = urn / Γn φrn
Vbn / Mn y *
1 ωn
2
1 αnωn
2
y y (a) (b)
Figure 13. Properties of the n-th ‘mode’ inelastic SDF system from the pushover curve: (a) idealized push curve; and (b) Fsn=Ln –Dn relationship.
the roof displacement. They di�er because the underlying analyses involve di�erent assump-tions. UMRHA is based on the approximation contained in Equation (16), which is avoided in MPA because the displacements and drifts are determined by non-linear static analysis using force distribution s n ∗ . As a result, the �oor displacements are no longer proportional to the mode shape, as implied by Equation (16). In this sense, the MPA procedure represents the non-linear behavior of the structure better than UMRHA. However, the MPA procedure contains a di�erent source of approximation, which does
not exist in UMRHA. The peak ‘modal’ responses rn, each determined by one pushover analysis, are combined by the CQC rule, just as for elastic systems. This application of modal combination rules to inelastic systems obviously lacks a rigorous theoretical basis, but seems reasonable because the modes are weakly coupled.
Summary of MPA
A step-by-step summary of the MPA procedure to estimate the seismic demands for an unsymmetric-plan multistorey building is presented as a sequence of steps:
1. Compute the natural frequencies, !n and modes, n, for linearly elastic vibration of the building.
2. For the n-th mode, develop the base shear–roof displacement, Vbn–urn, pushover curve by non-linear static analysis of the building using the force distribution, s n
∗ [Equation (22)]. Between the two pushover curves obtained corresponding to two lateral directions, x and y, preferably choose the pushover curve in the dominant direction of motion of the mode. Gravity loads, including those present on the interior (gravity) frames, are applied before pushover analysis. Note the value of the lateral roof displacement due to gravity loads, urg.
3. Idealize the pushover curve as a bilinear curve. If the pushover curve exhibits negative post-yielding sti�ness due to P–� e�ects, the second sti�ness (or post-yield sti�ness) of the bilinear curve would be negative.
4. Convert the idealized Vbn–urn pushover curve to the force–displacement, Fsn=Ln –Dn, rela-tion for the n-th ‘mode’ inelastic SDF system by using Fsn
y =Ln = Vbny =Mn
∗ and Dny = urn
y = n
� ��
� ��
�
� ����
� �
�
�
�� � � � � �
� � � � � � � �
� � �
rn [Equation (24)] in which rn is the value of �n at the roof in the direction of the selected pushover curve; and Mn
∗ and n correspond to the direction of ground motion under consideration (x or y).
5. Compute the peak deformation Dn of the n-th ‘mode’ inelastic single-degree-of-freedom (SDF) system de�ned by the force–deformation relation developed in Step 4 and damping ratio n. The elastic vibration period of the system is Tn =2 (LnD
y sn)1=2. For an SDF n =Fy
system with known Tn and n; Dn can be computed from non-linear RHA, inelastic design spectrum, or elastic design spectrum in conjunction with empirical equations for the ratio of deformations of inelastic and elastic systems.
6. Calculate peak roof displacement urn in the direction of the selected pushover curve associated with the n-th ‘mode’ inelastic SDF system from urn =� n rnDn.
7. From the pushover database (Step 2), extract values of desired responses rn+g due to the combined e�ects of gravity and lateral loads at roof displacement equal to urn + urg.
8. Repeat Steps 3–7 for as many modes as required for su cient accuracy. 9. Compute the dynamic response due to the n-th ‘mode’: rn = rn+g − rg, where rg is the contribution of gravity loads alone.
10. Determine the total response (demand) by combining gravity response and the peak ‘modal’ responses using the CQC rule:
1=2 J J r ≈ max rg ± inrirn (27)
i=1 n=1
in which the correlation coe cient in is given by:
8 ( ) 3=2 i n in i + n in
in = (28) 2 2 2 2 (1 − in)2 + 4 i n in(1 + in) + 4( i 2 + n) in
where in = !i=!n is the ratio of the i-th and n-th modal frequencies, and i and n are the damping ratios for these modes.
The MPA procedure summarized in this paper is an extension to unsymmetric-plan buildings of the procedure originally developed for symmetric buildings [14] with three improvements [15]. First, gravity loads and their P–� e�ects are now included in pushover analysis for all ‘modes’; these factors were considered only for the �rst ‘mode’ in the original version. Second, although the total �oor displacements and story drifts (at any location in plan) are computed by combining the values obtained from gravity load and ‘modal’ pushover analyses (Step 10), the beam plastic rotations and element forces (not presented in this paper) will no longer be computed by this procedure. They will be computed from the total story drifts; such a procedure to determine beam plastic rotations has been published [15], but the one for element forces remains to be reported.
EVALUATION OF THE MPA PROCEDURE
The MPA procedure was implemented for the original symmetric building and the three unsymmetric systems for the selected ground motion. To estimate the seismic demands, the contribution of the �rst three ‘modes’ was included in analysis of the symmetric building
and the �rst three ‘modal’ pairs for the unsymmetric systems. The combined values of �oor displacements and story drifts were computed including one, two, or three ‘modal’ pairs (or modes for symmetric building). Figure 14(a) shows the �oor displacements and story drift demands at the CM for the symmetric building together with the exact value determined by non-linear RHA of the system. Figures 14(b), (c), and (d) show similar results for the three unsymmetric systems, but the demands are now for the frame at the right edge of the plan. These results lead to the following observations for unsymmetric systems, which also apply to symmetric buildings provided that all reference to ‘modal’ pair(s) is replaced by mode(s). As may be expected, the �rst ‘modal’ pair alone is inadequate in estimating the story drifts,
especially in the upper stories of the building (Figure 14). Including the response contributions of higher ‘modal’ pairs signi�cantly improves the story drifts, but the �oor displacements are una�ected, implying that contributions of the higher modal pairs to �oor displacements are negligible. Two ‘modal’ pairs su ce, implying that the contribution of the third ‘modal’ pair is negligible. Figure 14 shows that higher ‘modal’ pairs contribute signi�cantly to the seismic demands
for the selected systems and MPA is able to capture these e�ects. With su cient number of ‘modal’ pairs included, the height-wise distribution of story drifts estimated by MPA is generally similar to the ‘exact’ results from non-linear RHA, and much superior to the �rst ‘modal’ pair result. However, because MPA is an approximate method, it does not match the ‘exact’ demands determined by non-linear RHA. Instead MPA has the goal of estimating seismic demands to a useful degree of accuracy for practical application with the advantage of much less e�ort than that required for non-linear RHA. For the excitation considered, the MPA results are accurate for two unsymmetric systems,
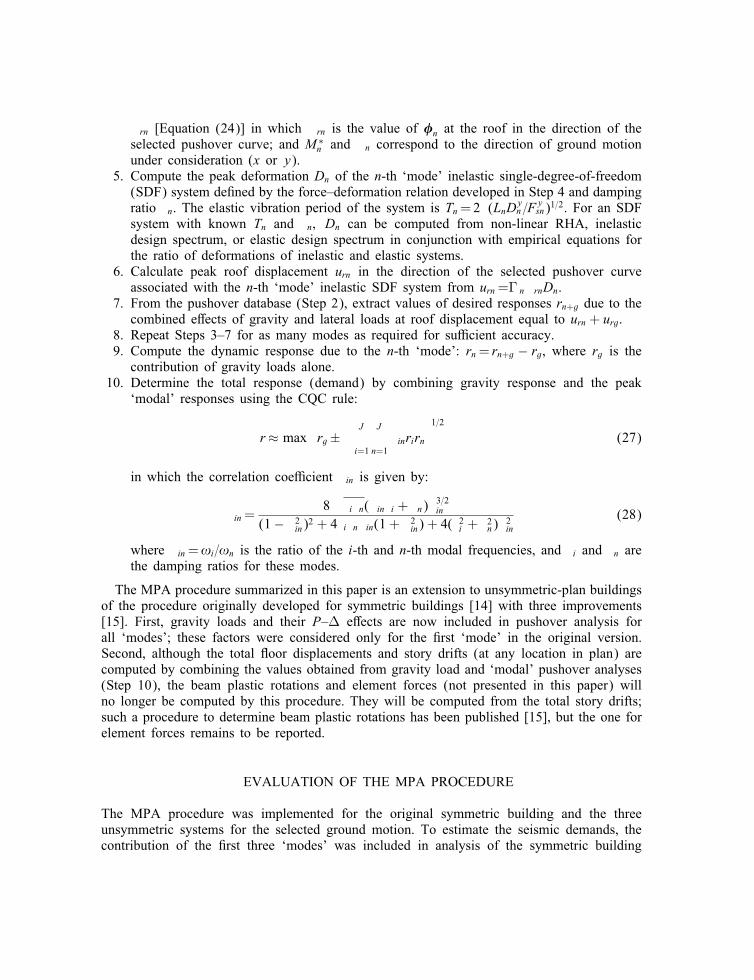
U1 and U3, to a similar degree as they were for the symmetric building, which is apparent by comparing Figures 14(b) and (d) with Figure 14(a); however, the results are less accurate for system U2. This loss of accuracy could be due to two reasons: The �rst plausible reason could be that the system has very close modal periods and strong coupling of the lateral and torsional motions in each mode of vibration. However, in spite of the resulting stronger modal coupling (Figure 8), the approximate UMRHA procedure was shown to be valid for this system (Figure 10). Thus, strong lateral–torsional coupling does not seem to be the source of the entire discrepancy. Another plausible reason is that the roof displacement of system U2 due to the selected ground motion is considerably under-estimated in the MPA procedure (Figure 14(c)). This discrepancy occurs because the individual ‘modal’ responses attain their peaks almost simultaneously (Figure 10(b)), a situation for which the CQC modal combination rule is not valid. For such a case, the absolute sum (ABSSUM) rule (see Reference [24], section 13.7.2) may be more appropriate. To explore this possibility, Figure 15 shows the �oor displacements and story drifts determined by the MPA procedure using two di�erent modal combination rules, CQC and ABSSUM, and compares these two estimates of seismic demand with its ‘exact’ value determined by non-linear RHA. The ‘exact’ demand is generally bounded by the two estimates. The ABSSUM rule provides a conservative estimate of the roof displacement, as it should, and over-estimates displacements at most �oors and drifts in most stories. In contrast, for elastic systems, the ABSSUM rule would be conservative for all response quantities. The preceding scenario points to the need for evaluating the MPA procedure considering
an ensemble of ground motions and documenting the bias and dispersion in this procedure applied to unsymmetric buildings, as has been accomplished for symmetric buildings [15].

Floor Displacements Story Drifts
Flo
or
9
6
3
G
NL-RHA
MPA 1 "Mode" 2 "Modes" 3 "Modes"
(a)
Flo
or
0 1 2 3 4 5 0 1 2 3 4 5
9
6
NL-RHA
MPA 3 1 "Pair" 2 "Pairs" 3 "Pairs"
G (b)
Flo
or
0 1 2 3 4 5 0 1 2 3 4 5 9
6
NL-RHA
MPA 3 1 "Pair" 2 "Pairs" 3 "Pairs"
G 0 1 2 3 4 5 0 1 2 3 4 5 (c)
9
6
Flo
or
NL-RHA
MPA 3 1 "Pair" 2 "Pairs" 3 "Pairs"
G 0 1 2 3 4 5 0 1 2 3 4 5
(d) Displacement/Height (%) Story Drift Ratio (%)
Figure 14. Floor displacements and story drifts determined by MPA with variable number of ‘modal’ pairs (or modes) and non-linear RHA: (a) symmetric building; (b) unsymmetric-plan system U1;
(c) unsymmetric-plan system U2; and (d) unsymmetric-plan system U3.
9 Floor Displacements Story Drifts
6
3
G 0
Displacement/Height (%)
1 2 3 4 5 0 1 2 3 4 5
Story Drift Ratio (%)
Figure 15. Floor displacements and story drifts at the right frame of unsymmetric-plan system U2 determined by MPA using CQC and ABSSUM combination rules and non-linear RHA.
Such a statistical investigation is necessary for two reasons. First, the SRSS and CQC modal combination rules are based on random vibration theory and the combined peak response should be interpreted as the mean of the peak values of response to an ensemble of earthquake excitations. Thus, the modal combination rules are intended for use when the excitation is characterized by a smooth response (or design) spectrum. Although modal combination rules can also approximate the peak response to a single ground motion characterized by a jagged response spectrum, the errors are known to be much larger. Second, accurate estimation of roof displacement is necessary for the success of any pushover procedure and this usually is not assured for individual ground motions, as has been observed for the six SAC buildings [26]. For the Los Angeles 9-story building, the ratio of roof displacement values determined by MPA and non-linear RHA varied from 0.66 to 1.70, with a median value of 1.21, over the 20 ground motions mentioned earlier.
CONCLUSIONS
The modal pushover analysis (MPA) procedure for estimating seismic demands has been extended to unsymmetric-plan buildings. Based on structural dynamics theory, the MPA pro-cedure retains the conceptual simplicity of current procedures with invariant force distribution, now common in structural engineering practice. The MPA estimate of seismic demand due to an intense ground motion (including a for-
ward directivity pulse) has been shown to be generally accurate for unsymmetric systems to a similar degree as it was for a symmetric building. This conclusion is based on a comparison of the MPA estimate of demand and its exact value determined by non-linear RHA for four structural systems: Los Angeles 9-story steel frame building designed for the SAC project and variations of this symmetric-plan building to create three unsymmetric-plan systems with di�erent degrees of coupling between lateral and torsional motions, as characterized by dif-ferent values of the ratio of uncoupled lateral and torsional vibration periods: torsionally-sti�
Flo
or
NL-RHA
MPA CQC ABSSUM

system U1, torsionally-�exible system U3, and torsionally-similarly-sti� system U2. For the excitation considered, the MPA estimates for two unsymmetric systems, U1 and U3, are sim-ilarly accurate as they were for the symmetric-plan building; however, the results deteriorated for system U2 because of (a) stronger coupling of elastic modes and (b) under-estimation of roof displacement by the CQC modal combination rule, which occurs because the individual modal responses attain their peaks almost simultaneously. This implies that for system U2 and the selected ground motion the CQC modal combination rule would not give an accurate estimate of the peak response even if the system were linearly elastic. This points to the need for evaluating the MPA procedure considering an ensemble of
ground motions and documenting the bias and dispersion in the procedure applied to un-symmetric buildings, as has been accomplished for symmetric buildings [15]. Such future work will also evaluate the MPA procedure when earthquake hazard is de�ned by a design spectrum—typical of building codes and building evaluation guidelines—a situation for which modal combination rules were intended. Simultaneous action of two horizontal components of ground motion and structural plans unsymmetric about both axes also remain to be inves-tigated.
ACKNOWLEDGEMENT
This research investigation is funded by the National Science Foundation under Grant CMS-0336085. This �nancial support is gratefully acknowledged. This paper was proposed during the �rst author’s appointment in the Miller Institute for Basic Research in Science.
REFERENCES
1. Building Seismic Safety Council. NEHRP Guidelines for the Seismic Rehabilitation of Buildings, FEMA-273, Federal Emergency Management Agency, Washington, DC, 1997.
2. American Society of Civil Engineers. Prestandard and Commentary for the Seismic Rehabilitation of Buildings, FEMA-356, Federal Emergency Management Agency, Washington, DC, 2000.
3. Fajfar P, Fischinger M. N2—a method for nonlinear seismic analysis of regular structures. Proceedings of the 9th World Conference on Earthquake Engineering, vol. 5, pp. 111–116, Tokyo–Kyoto, Japan, 1988.
4. Miranda E. Seismic evaluation and upgrading of existing buildings. Ph.D. Dissertation, Department of Civil Engineering, University of California, Berkeley, CA, 1991.
5. Krawinkler H, Seneviratna GDPK. Pros and cons of a pushover analysis of seismic performance evaluation. Engineering Structures 1998; 20:452– 464.
6. Naeim F, Lobo RM. Common pitfalls in pushover analysis. Proceedings of the SEAOC Annual Convention, Reno, Nevada, 1998.
7. Kim B, D’Amore E. Pushover analysis procedure in earthquake engineering. Earthquake Spectra 1999; 13: 417–434.
8. Elnashai AS. Advanced inelastic static (pushover) analysis for earthquake applications. Structural Engineering and Mechanics 2001; 12(1):51–69.
9. Bracci JM, Kunnath SK, Reinhorn AM. Seismic performance and retro�t evaluation for reinforced concrete structures. Journal of Structural Engineering (ASCE) 1997; 123:3–10.
10. Gupta B, Kunnath SK. Adaptive spectra-based pushover procedure for seismic evaluation of structures. Earthquake Spectra 2000; 16:367–392.
11. Sasaki KK, Freeman SA, Paret TF. Multimode pushover procedure (MMP)—a method to identify the e�ects of higher modes in a pushover analysis. Proceedings of the 6th U.S. National Conference on Earthquake Engineering, Seattle, Washington, 1998.
12. Kunnath SK, Gupta B. Validity of deformation demand estimates using nonlinear static procedures. Proceedings of the U.S.–Japan Workshop on Performance-based Engineering for R/C Building Structures, Sapporo, Hokkaido, Japan, 2000.
13. Matsumori T, Otani S, Shiohara H, Kabeyasawa T. Earthquake member deformation demands in reinforced concrete frame structures. Proceedings of the U.S.–Japan Workshop on Performance-based Earthquake Engineering Methodology for R/C Building Structures, pp. 79–94, Maui, Hawaii, 1999.
14. Chopra AK, Goel RK. A modal pushover analysis procedure for estimating seismic demands for buildings. Earthquake Engineering and Structural Dynamics 2002; 31:561–582.
15. Goel RK, Chopra AK. Evaluation of modal and FEMA pushover analyses: SAC buildings. Earthquake Spectra 2004; 20:225–254.
16. Chintanapakdee C, Chopra AK. Evaluation of modal pushover analysis using generic frames. Earthquake Engineering and Structural Dynamics 2003; 32:417–442.
17. Chintanapakdee C, Chopra AK. Seismic response of vertically irregular frames: response history and modal pushover analyses. Journal of Structural Engineering (ASCE) 2004; in press.
18. Aydinoglu MN. An incremental response spectrum analysis procedure based on inelastic spectral displacements for multi-mode seismic performance evaluation. Bulletin of Earthquake Engineering 2003; 1:3–36.
19. Kilar V, Fajfar P. Simple push-over analysis of asymmetric buildings. Earthquake Engineering and Structural Dynamics 1997; 26:233–249.
20. Moghadam AS, Tso W-K. Pushover analysis for asymmetrical multistorey buildings. Proceedings of the 6th U.S. National Conference on Earthquake Engineering, EERI, Oakland, CA, 1998.
21. De Stefano M, Rutenberg A. Predicting the dynamic response of asymmetric multistorey wall-frame structures by pushover analysis: two case studies. Proceedings of the 11th European Conference on Earthquake Engineering, Balkema, Rotterdam, 1998.
22. Faella G, Kilar V. Asymmetric multistorey R/C frame structures: push-over versus nonlinear dynamic analysis. Proceedings of the 11th European Conference on Earthquake Engineering, Balkema, Rotterdam, 1998.
23. Gupta A, Krawinkler H. Seismic demands for performance evaluation of steel moment resisting frame structures (SAC Task 5.4.3). Report No. 132, John A. Blume Earthquake Engineering Center, Stanford University, CA, 1999.
24. Chopra AK. Dynamics of Structures: Theory and Applications to Earthquake Engineering, 2nd Edition. Prentice Hall: New Jersey, 2001.
25. Chopra AK, Chintanapakdee C. Inelastic deformation ratios for design and evaluation of structures: single-degree-of-freedom bilinear systems. Journal of Structural Engineering (ASCE) 2004; in press.
26. Chopra AK, Goel RK, Chintanapakdee C. Statistics of single-degree-of-freedom estimate of displacements for pushover analysis of buildings. Journal of Structural Engineering (ASCE) 2003; 129:459– 469.