Embed Size (px)
Citation preview
Report Title
Report for Argyll and Bute Council December 2010 Registered Name: EKOS Ltd Registered Office: St. George’s Studios, 93-97 St. George’s Road, Glasgow, G3 6JA Telephone: 0141 353 1994 Web: www.ekos-consultants.co.uk
CHORD Programme
Socio – Economic Baseline, Oban Locality

As part of our green office policy all EKOS reports are printed double sided.

Contents
Executive Summary i
1. Socio-Economic Baseline 1
1.1 Introduction 1
1.2 Population 3
1.3 Employment Base 4
1.4 Business Base 7
1.5 Claimant Count 9
1.6 Retail and Leisure Gross Value Added 10
1.7 Property 11
1.8 Tourism Visitor Day Market 14
Appendix A: Data Sources 17

Oban Locality Socio-Economic Baseline: Argyll and Bute Council i
Executive Summary
This executive summary provides a summary of the socio-economic baseline position within Oban and sets the context within which the longer term impact of the proposed CHORD projects will be measured.
The baseline provides a current and retrospective overview of the Oban area, which will allow identification of key changes that occur in the future. These changes will be used to measure the impact of the CHORD Programme both quantitatively and qualitatively through the perception surveys.
Population
The total resident based population in Oban is approximately 20,000, representing 22% of the entire Argyll and Bute population. Within the locality there is a higher proportion of working age people when compared with Scotland.
Over the period 2001 – 2008, Oban experienced an overall resident population increase of 4%, and most notably, the number of retired residents has increased more sharply when compared with Argyll and Bute. This demographic shift is likely to have implications for the Oban locality in the future.
Employment Base
The key points emerging from analysis of the employment base are:
the key employment sectors are ‘public administration, education and health’ and ‘distribution, hotels and restaurants’, which account for two thirds of total employment in the Oban locality; and
a key objective of the proposed projects is to assess the viability of a marina to attract visitors through creating short-stay berths. It is, therefore important that the Oban locality has a viable retail, accommodation and amenities offering to support the proposed short-stay berths. ‘Distribution, hotels and restaurants’ comprise a significant proportion of the employment base (31%).
The key changes to arise within the employment base 2005 – 2008 are:
overall, the Oban locality’s employment base increased by 11%, representing an increase of more than twice the Argyll and Bute level;
Oban Locality Socio-Economic Baseline: Argyll and Bute Council ii
between 2005 - 2008 the largest absolute and proportionate increases within the Oban locality employment base occurred in ‘public administration, education and health’ (30%, 766 people) and ‘banking, finance & insurance, etc’ (30%, 205 people); and
the Oban locality accounts for over 75% of ‘energy and water’ employment within Argyll and Bute so the reductions at the locality level will impact on the sector within the wider region.
Business Base
In 2008 there were approximately 1,280 businesses in the Oban locality, representing 30% of the total Argyll & Bute business base – this is larger than the employment base, indicating a number of smaller businesses:
the key sector in terms of number of businesses in the Oban locality is ‘distribution, hotels & restaurants’, broadly similar to the Argyll and Bute average; and
there are a number industries that represent between 10% and 14% of the business base - indicating that the Oban locality is not over reliant on any one industrial sector.
The key changes to arise within the business base 2005 – 2008 are:
the overall increase in the business base of 3% is, generally speaking, in line with Argyll and Bute and Scotland levels, as is the broad picture of change against the whole business base;
a number of industries experienced growth in the Oban locality over the period, however the greatest proportionate and absolute increases occurred in the ‘construction’ (15%, 19 businesses) ‘banking, finance and insurance’ (12%, 19 businesses)‘ and ‘agriculture and fishing’ (13%, 15 businesses) sectors;
the energy and water sector experienced a loss of one business and 151 employees, this points to the closure or relocation of a large local employer; and
if we compare the changes in the employment base, we can see that they both have experienced growth. However, it should be noted that these figures reflect 2008 data and will not fully capture the impacts of the economic recession.
The CHORD Programme has the potential to help support the regional business base, and act as a catalyst for large investors as well as small start-up businesses – particularly within the accommodation and service sectors.

Oban Locality Socio-Economic Baseline: Argyll and Bute Council iii
Claimant Count
The proportion of residents claiming JSA in the Oban locality is consistently lower than in Argyll & Bute and Scotland and currently (December 2009) stands at 2.5% - one of the lowest rates within the region.
However, the number of claimants has increased marginally over a number of years, which is symptomatic of the economic recession. By moving forward with the CHORD Programme, the estimated long term economic benefits that this has the potential to generate should help to create employment opportunities that will further reduce the number of claimants.
Retail and Leisure Gross Value Added
A key objective of the wider CHORD programme is to raise the competitiveness of the local economy and in particular the service sector.
The current industrial output of the service sector in terms of GVA per annum is estimated at £44.2m – which reflects the considerable tourism and service sector base of the town.
The development of a marina has the potential to provide a further boost to the service sector through attracting more people into the town.
Property
A key objective for the projects is to improve the perception of Oban as a place to invest and live/work.
According to Health Check data provided by Argyll & Bute Council, there are 239 units in Oban town centre, of which 19 are vacant. Retail businesses account for 130 units and leisure 46 units. Of the vacant units in the town centre, 13 were previously occupied by retail operators and three by leisure operators.
The planning data identifies that there has been modest amounts of commercial development within the wider Lorn area since 2005. The CHORD Programme hopes to boost activity in this area.
The number of households in Lorn is forecast to experience a significant increase up to 2010 of 220 households; this is set alongside population projections which indicate an increase in the resident population up to 2020.

Oban Locality Socio-Economic Baseline: Argyll and Bute Council iv
It is, however, appropriate to note that these projections were made pre-recession, and may therefore be subject to variation once the full effects of the downturn are understood.
Since 2005, there has been a considerable number of residential planning applications submitted and approved across Lorn, with 126 residential units completed – a possible indication that the residential housing market in the area has not been adversely affected by the recession.
Oban Locality Socio-Economic Baseline: Argyll and Bute Council 1
1. Socio-Economic Baseline
1.1 Introduction
This report identifies the socio-economic baseline position within the Oban locality and sets the context within which the longer term impact of the two proposed CHORD projects will be measured.
The baseline provides a current and retrospective overview of the area, which will allow identification of key changes in activity that occur in the future.
Establishing a baseline position is essential in measuring the impact that projects have on the socio-economic environment, and their contribution to wider CHORD/Argyll and Bute Council targets.
The two projects proposed to be delivered within Oban through the CHORD Programme are:
assessing the viability of creating a marina facility in Oban for short stay berths; and
designing and procuring the construction of the Oban Development Road to relieve road congestion within the town centre, which could act as a catalyst for development.
The baseline position is considered against the Oban and ‘hinterland’ spatial area. The definition is based on an assessment of the catchment area for each town and where direct project impacts are likely to be generated.
For presentational purposes, the area will be referred to as the Oban locality within the report. Where appropriate, we have drawn comparisons with Argyll & Bute and Scotland.
For the analysis, the Oban locality has been defined using the following Census Area Statistics (CAS) 2003 wards:
Ardconnel – Kilmore;
Awe;
Mull;
North Lorn;
Oban Central;
Oban North;
Oban Locality Socio-Economic Baseline: Argyll and Bute Council 2
Oban South; and
Tiree and Coll.
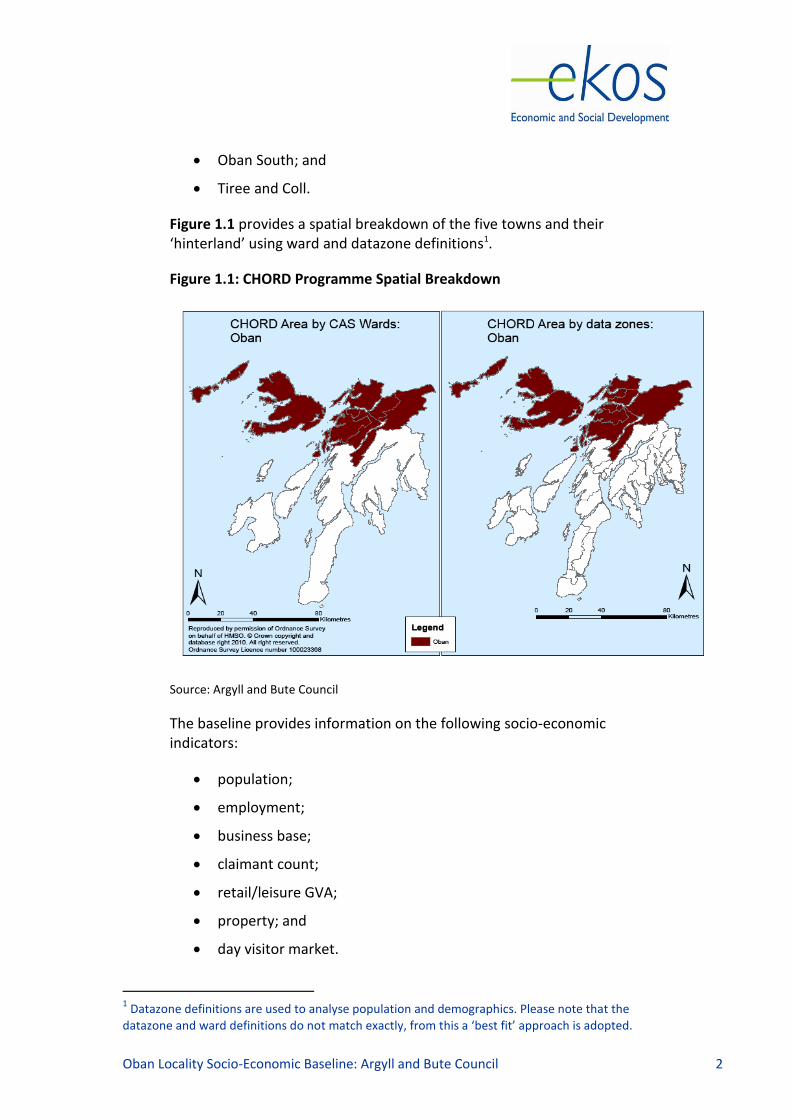
Figure 1.1 provides a spatial breakdown of the five towns and their ‘hinterland’ using ward and datazone definitions1.
Figure 1.1: CHORD Programme Spatial Breakdown
Source: Argyll and Bute Council
The baseline provides information on the following socio-economic indicators:
population;
employment;
business base;
claimant count;
retail/leisure GVA;
property; and
day visitor market.
1 Datazone definitions are used to analyse population and demographics. Please note that the
datazone and ward definitions do not match exactly, from this a ‘best fit’ approach is adopted.
Oban Locality Socio-Economic Baseline: Argyll and Bute Council 3
1.2 Population
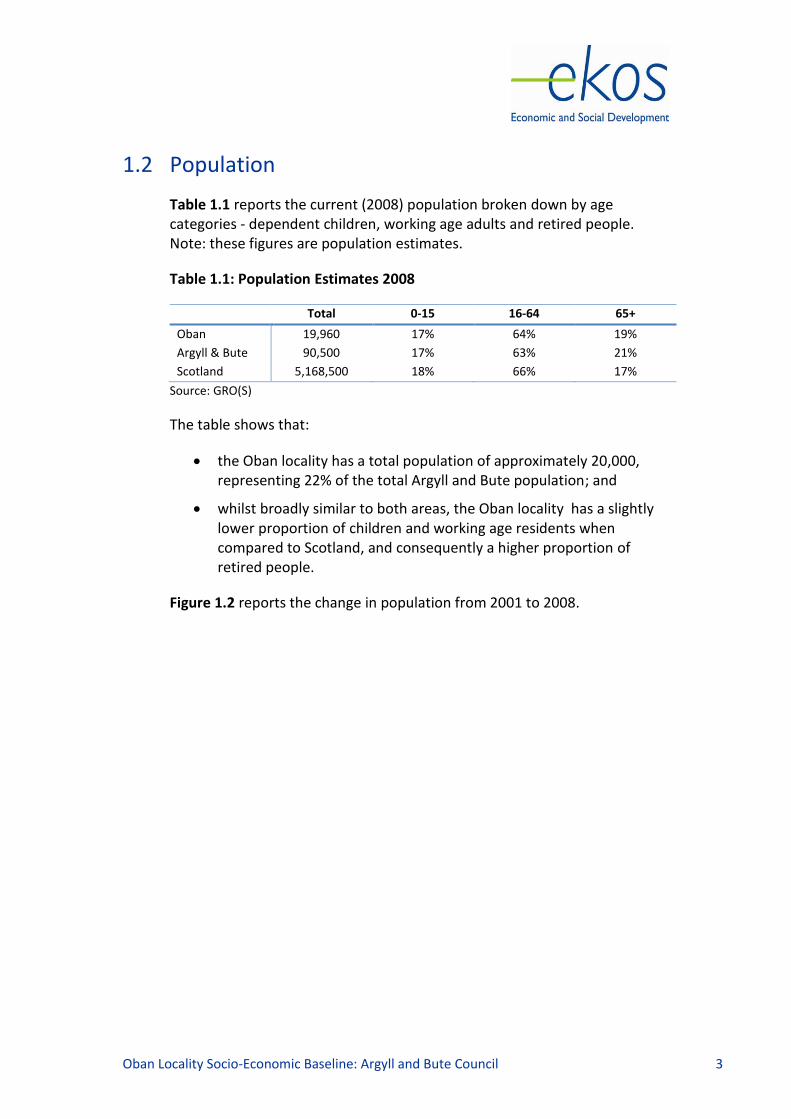
Table 1.1 reports the current (2008) population broken down by age categories - dependent children, working age adults and retired people. Note: these figures are population estimates.
Table 1.1: Population Estimates 2008
Total 0-15 16-64 65+
Oban 19,960 17% 64% 19%
Argyll & Bute 90,500 17% 63% 21%
Scotland 5,168,500 18% 66% 17%
Source: GRO(S)
The table shows that:
the Oban locality has a total population of approximately 20,000, representing 22% of the total Argyll and Bute population; and
whilst broadly similar to both areas, the Oban locality has a slightly lower proportion of children and working age residents when compared to Scotland, and consequently a higher proportion of retired people.
Figure 1.2 reports the change in population from 2001 to 2008.

Oban Locality Socio-Economic Baseline: Argyll and Bute Council 4
Figure 1.2: % Point Change in Population 2001 - 2008
-15%
-10%
-5%
0%
5%
10%
15%
20%
0-15 16-64 65+ Total% P
oin
t C
han
ge
Oban Argyll and Bute Scotland
Source: GRO(S)
Overall, the Oban locality experienced a 4% increase in population. Most notably, the number of retired residents has increased more sharply (15%) when compared with Argyll and Bute (12%) and Scotland (6%).
1.3 Employment Base
The Annual Business Inquiry (ABI) provides data on workplace-based employment covering companies registered head offices2.
Table 1.2 reports the employment base broken down by broad industrial sector. In 2008 Oban had a workplace based employment of approximately 9,800 people, representing 26% of the total employment in Argyll & Bute.
2 The ABI is survey based and as such records the number of employees registered within an area
and does not account for employees that work off-site.
Oban Locality Socio-Economic Baseline: Argyll and Bute Council 5
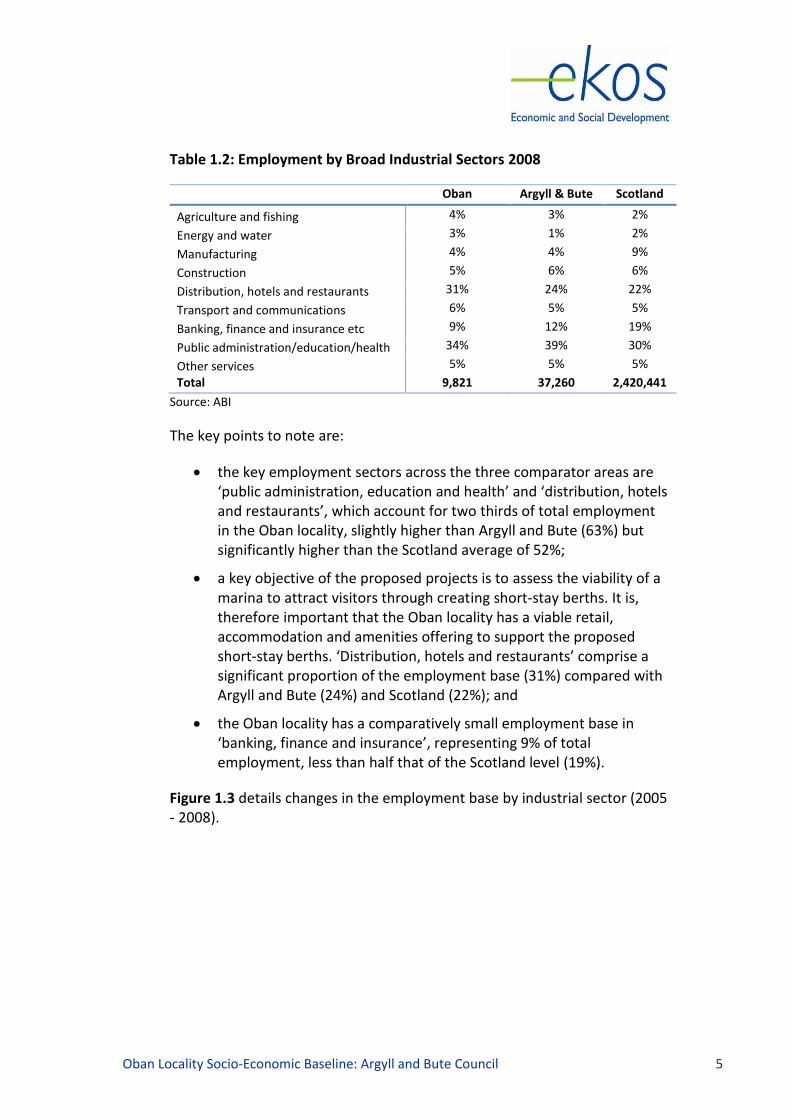
Table 1.2: Employment by Broad Industrial Sectors 2008
Oban Argyll & Bute Scotland
Agriculture and fishing 4% 3% 2%
Energy and water 3% 1% 2%
Manufacturing 4% 4% 9%
Construction 5% 6% 6%
Distribution, hotels and restaurants 31% 24% 22%
Transport and communications 6% 5% 5%
Banking, finance and insurance etc 9% 12% 19%
Public administration/education/health 34% 39% 30%
Other services 5% 5% 5%
Total 9,821 37,260 2,420,441
Source: ABI
The key points to note are:
the key employment sectors across the three comparator areas are ‘public administration, education and health’ and ‘distribution, hotels and restaurants’, which account for two thirds of total employment in the Oban locality, slightly higher than Argyll and Bute (63%) but significantly higher than the Scotland average of 52%;
a key objective of the proposed projects is to assess the viability of a marina to attract visitors through creating short-stay berths. It is, therefore important that the Oban locality has a viable retail, accommodation and amenities offering to support the proposed short-stay berths. ‘Distribution, hotels and restaurants’ comprise a significant proportion of the employment base (31%) compared with Argyll and Bute (24%) and Scotland (22%); and
the Oban locality has a comparatively small employment base in ‘banking, finance and insurance’, representing 9% of total employment, less than half that of the Scotland level (19%).
Figure 1.3 details changes in the employment base by industrial sector (2005 - 2008).

Oban Locality Socio-Economic Baseline: Argyll and Bute Council 6
Figure 1.3: Change in Employment 2005-2008
-40%
-20%
0%
20%
40%
Oban Argyll & Bute Scotland
Source: ABI
The key points to note are:
overall, the Oban locality’s employment base increased by 11%, representing an increase of more than twice the Argyll and Bute level (5%) and considerably more than the Scottish employment base (1%);
between 2005 - 2008 the largest absolute and proportionate increases within the Oban locality employment base occurred in ‘public administration, education and health’ (30%, 766 people) and ‘banking, finance & insurance, etc’ (30%, 205 people);
similar to Argyll and Bute, the Oban locality experienced decreases in the ‘agriculture and fishing’ and ‘energy and water’ sectors. ‘Energy and water’ experienced the largest absolute decrease in value (150 people, 32%). The Oban locality accounts for over 75% of ‘energy and water’ employment within Argyll and Bute so any reductions at the locality level will impact on the sector within the wider region; and

Oban Locality Socio-Economic Baseline: Argyll and Bute Council 7
although only small changes have occurred in value terms, the manufacturing sector increased across both the Oban locality (16%) and Argyll and Bute (25%).
1.4 Business Base
The business base measures the number of registered businesses within an area. Table 1.3 details the number of businesses broken down by broad industrial sector.
In 2008 there were 1,280 businesses in the Oban locality, representing 30% of the total Argyll & Bute business base. The Oban locality has a noticeably larger share of the business base (30%) in comparison with the resident population base (22%). This indicates that a number of people travel to the Oban locality from outwith the area for work.
Further, if we compare this with the employment base we can see that Oban has a number of smaller employers (proportionately larger business base set against a proportionately smaller employment base).
Table 1.3: Businesses by Broad Industrial Sector 2008
Oban Argyll & Bute Scotland
Agriculture and fishing 10% 8% 3%
Energy and water 2% 1% 0%
Manufacturing 5% 5% 6%
Construction 12% 10% 10%
Distribution, hotels and restaurants 32% 32% 29%
Transport and communications 7% 6% 4%
Banking, finance and insurance etc 14% 17% 28%
Public administration/education/health 11% 13% 11%
Other services 7% 8% 8%
Total 1,280 4,203 181,470
Source: ABI
The table shows that:
the key sector in terms of number of businesses in the Oban locality is ‘distribution, hotels & restaurants’, broadly similar to the Argyll and Bute and Scotland averages;
there are a number of other industries that represent between 10% and 14% of the business base – ‘agriculture and fishing’, ‘construction’, ‘public administration/education/health’ and ‘banking, finance and insurance’. This indicates that the Oban locality is not over reliant on any one industrial sector; and

Oban Locality Socio-Economic Baseline: Argyll and Bute Council 8
similar to the employment base, the Oban locality has a proportionately smaller ‘banking, finance and insurance’ business base (14%) compared to 17% and 28% at the Argyll and Bute and Scotland levels respectively. This is offset by a cumulatively larger business base in other industrial sectors.
Figure 1.4 shows the change in the number of businesses between 2005 and 2008.
Figure 1.4: Change in Businesses 2005-2008
-20%
0%
20%
40%
Oban Argyll & Bute Scotland Source: ABI
The figure shows that:
the overall increase in the business base of 3% is, generally speaking, in line with increases of 3% and 5% at the Argyll and Bute and Scotland levels respectively, as is the broad picture of change against the whole business base;
Oban Locality Socio-Economic Baseline: Argyll and Bute Council 9
a number of industries experienced growth in the Oban locality over the period, however the greatest proportionate and absolute increases occurred in the ‘construction’ (15%, 19 businesses) ‘manufacturing’ (15%, 11 businesses) ‘banking, finance and insurance’ (12%, 19 businesses)‘ and ‘agriculture and fishing’ (13%, 15 businesses) sectors;
the energy and water sector experienced a loss of one business and 151 employees, this points to the closure or relocation of a large local employer;
the ‘distribution, hotels & restaurants’ sector experienced a marginal decrease over the period. The proposed CHORD projects could potentially impact upon the local service sector through attracting more short stay visitors to the area and increasing local spend; and
if we compare the changes in the employment base, we can see that they both have experienced growth. However, it should be noted that these figures reflect 2008 data and will not fully capture the impacts of the economic recession.
1.5 Claimant Count
This section reviews residence-based unemployment benefit claimants, drawing from claimant count data. The claimant count records people that have registered for Job Seekers Allowance (JSA). Of all the various socio-economic indicators, this provides the most up-to-date data and is therefore a good reflection of current economic conditions.
Figure 1.5 details the claimant count rate for the period 2005 to 2009 for the Oban locality and draws comparison with Argyll & Bute and Scotland.
Oban Locality Socio-Economic Baseline: Argyll and Bute Council 10
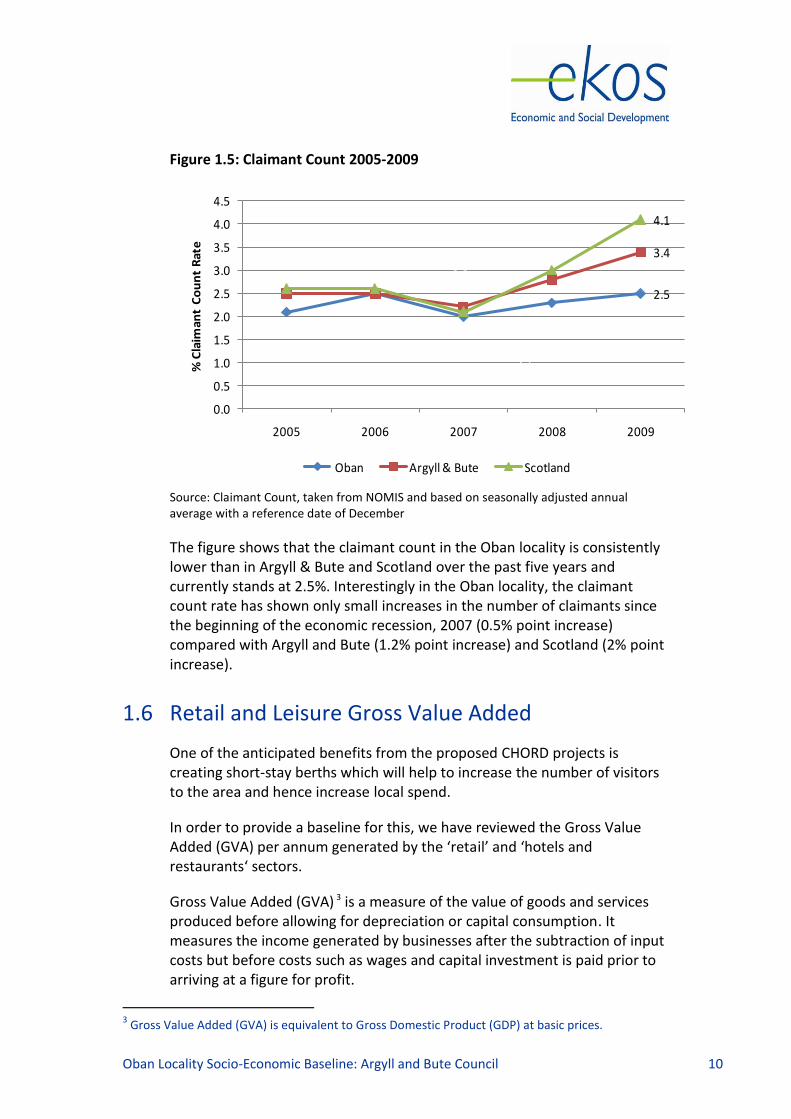
Figure 1.5: Claimant Count 2005-2009
2.1 2.5 2.0 2.3
2.5
2.5 2.52.2
2.8
3.42.6 2.6
2.1
3.04.1
0.0
0.5
1.0
1.5
2.0
2.5
3.0
3.5
4.0
4.5
2005 2006 2007 2008 2009
% C
laim
ant
Co
un
t R
ate
Oban Argyll & Bute Scotland
Source: Claimant Count, taken from NOMIS and based on seasonally adjusted annual average with a reference date of December
The figure shows that the claimant count in the Oban locality is consistently lower than in Argyll & Bute and Scotland over the past five years and currently stands at 2.5%. Interestingly in the Oban locality, the claimant count rate has shown only small increases in the number of claimants since the beginning of the economic recession, 2007 (0.5% point increase) compared with Argyll and Bute (1.2% point increase) and Scotland (2% point increase).
1.6 Retail and Leisure Gross Value Added
One of the anticipated benefits from the proposed CHORD projects is creating short-stay berths which will help to increase the number of visitors to the area and hence increase local spend.
In order to provide a baseline for this, we have reviewed the Gross Value Added (GVA) per annum generated by the ‘retail’ and ‘hotels and restaurants‘ sectors.
Gross Value Added (GVA) 3 is a measure of the value of goods and services produced before allowing for depreciation or capital consumption. It measures the income generated by businesses after the subtraction of input costs but before costs such as wages and capital investment is paid prior to arriving at a figure for profit.
3 Gross Value Added (GVA) is equivalent to Gross Domestic Product (GDP) at basic prices.
Oban Locality Socio-Economic Baseline: Argyll and Bute Council 11
There is no data available on GVA per employee for 2008 and we have therefore estimated this based on the most recent data (2007) for the ‘retail’ and ‘hotel and restaurants’ sector4 for the Argyll and Bute local authority. Over the period (2005-07) the average GVA per employee decreased and we have therefore assumed that in 2008 the average GVA per employee in Argyll and Bute for the ‘retail’ and ‘hotel and restaurants’ sector is £16,7185 (representing a marginal decrease from 2005).
Taking account of the change in employment across these sectors within Oban from 2005-2008, the total GVA output from the retail and ‘hotel and restaurants’ (service) sectors decreased by £1.2m, based on an overall decrease in employment (-3%) and the average GVA per employee. The current industrial output of the sectors in terms of GVA per annum is estimated at £44.2m for the Oban locality.
It should be noted that the ‘tourism’ sector6 is broader than just the ‘retail’ and ‘hotels and restaurants’ sector. Across Argyll and Bute ‘tourism’ employment accounts for 15% of the total employment base and generates GVA of £74.1m per annum, representing 2% of the total annual Scottish ‘tourism’ GVA.
1.7 Property
This section reports the total number of retail and leisure operators in Oban town centre based on the 2009 Health Check data provided by Argyll & Bute Council. A key objective for the CHORD Programme is to improve the perception of Oban as a place to invest and live/work. A positive change in the number of retail and leisure operators will help to identify any impact that the two proposed projects have in attracting commercial operators to the area.
In addition it reviews the number of residential and commercial planning applications submitted for planning consent and building notifications completed.
4 Data taken from Scottish Annual Business Statistics
http://www.scotland.gov.uk/Topics/Statistics/16170/ServBroad 5 Please note, the estimated average GVA per employee value for 2008 is based on the most recent
figure (2007) and inflated using RPI to reflect 2008 prices. 6 Tourism-related figures are constructed from the following Standard Industrial Classification (SIC)
codings: SIC55.1-55.4 / SIC63.3 / SIC92.5-92.7. Data taken from http://www.scotland.gov.uk/Topics/Statistics/16170/Tourism-related
Oban Locality Socio-Economic Baseline: Argyll and Bute Council 12
Town Centre Operators
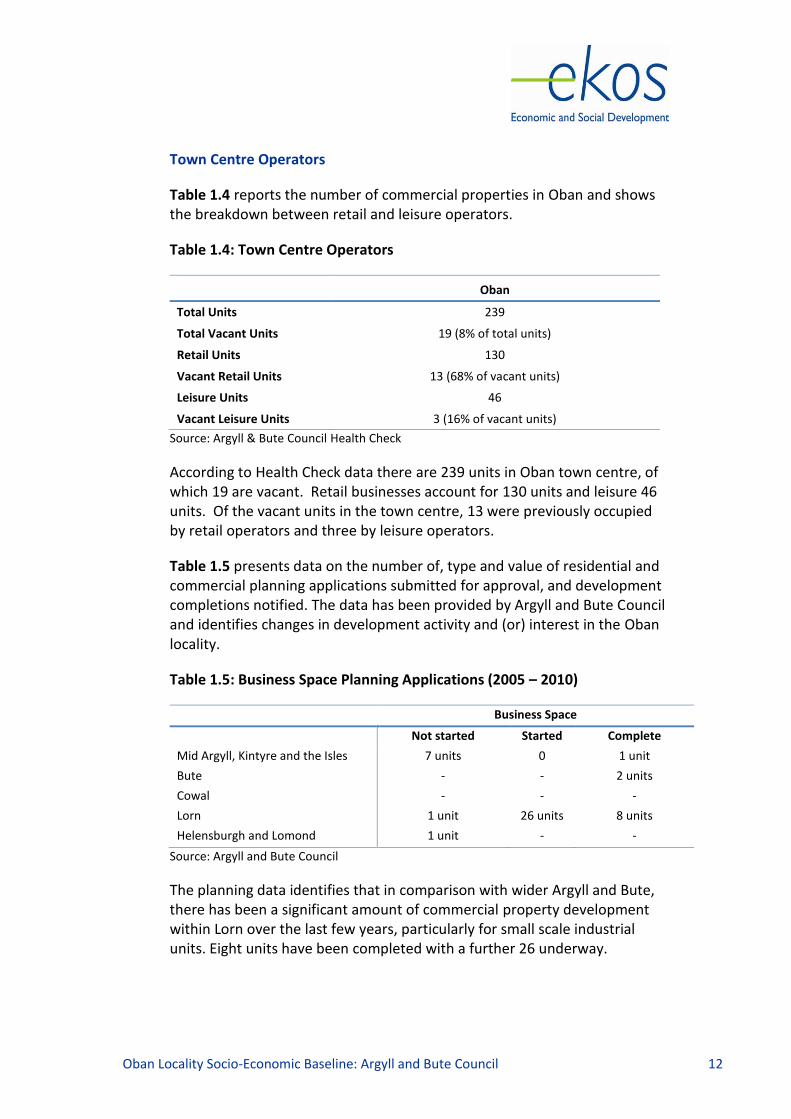
Table 1.4 reports the number of commercial properties in Oban and shows the breakdown between retail and leisure operators.
Table 1.4: Town Centre Operators
Oban
Total Units 239
Total Vacant Units 19 (8% of total units)
Retail Units 130
Vacant Retail Units 13 (68% of vacant units)
Leisure Units 46
Vacant Leisure Units 3 (16% of vacant units)
Source: Argyll & Bute Council Health Check
According to Health Check data there are 239 units in Oban town centre, of which 19 are vacant. Retail businesses account for 130 units and leisure 46 units. Of the vacant units in the town centre, 13 were previously occupied by retail operators and three by leisure operators.
Table 1.5 presents data on the number of, type and value of residential and commercial planning applications submitted for approval, and development completions notified. The data has been provided by Argyll and Bute Council and identifies changes in development activity and (or) interest in the Oban locality.
Table 1.5: Business Space Planning Applications (2005 – 2010)
Business Space
Not started Started Complete
Mid Argyll, Kintyre and the Isles 7 units 0 1 unit
Bute - - 2 units
Cowal - - -
Lorn 1 unit 26 units 8 units
Helensburgh and Lomond 1 unit - -
Source: Argyll and Bute Council
The planning data identifies that in comparison with wider Argyll and Bute, there has been a significant amount of commercial property development within Lorn over the last few years, particularly for small scale industrial units. Eight units have been completed with a further 26 underway.
Oban Locality Socio-Economic Baseline: Argyll and Bute Council 13
Residential Accommodation
Information for the residential housing market is based on household projections and planning data.
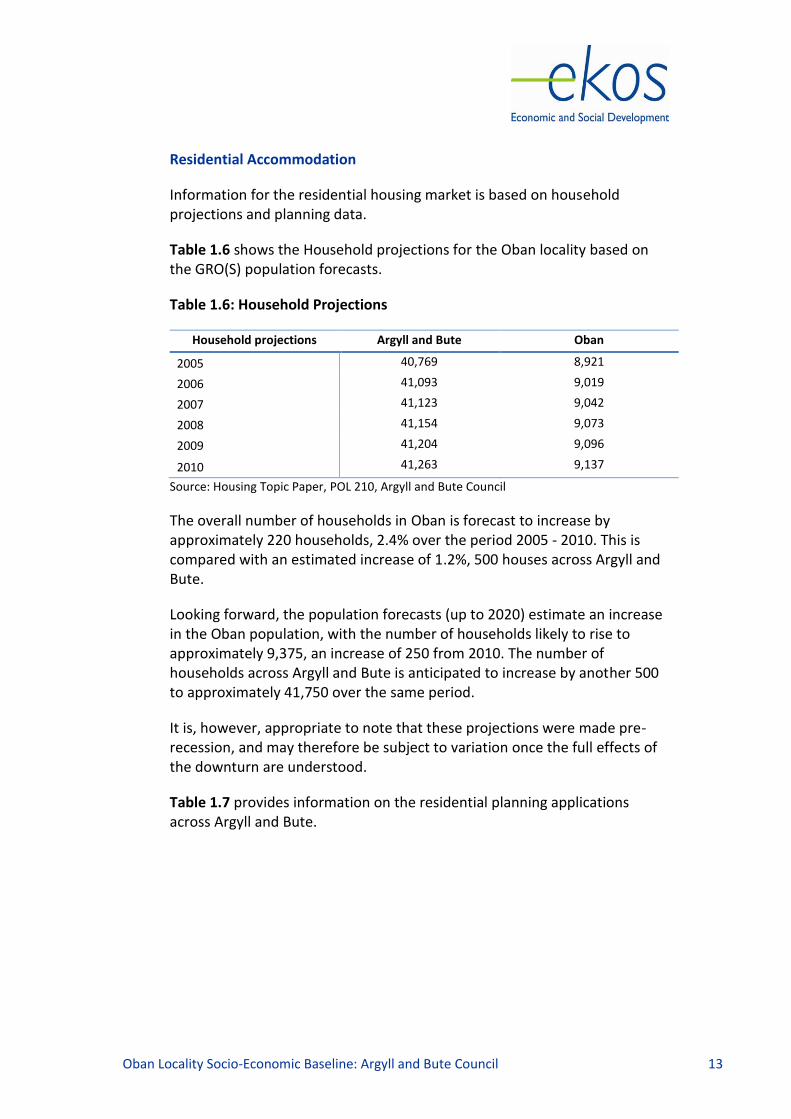
Table 1.6 shows the Household projections for the Oban locality based on the GRO(S) population forecasts.
Table 1.6: Household Projections
Household projections Argyll and Bute Oban
2005 40,769 8,921
2006 41,093 9,019
2007 41,123 9,042
2008 41,154 9,073
2009 41,204 9,096
2010 41,263 9,137
Source: Housing Topic Paper, POL 210, Argyll and Bute Council
The overall number of households in Oban is forecast to increase by approximately 220 households, 2.4% over the period 2005 - 2010. This is compared with an estimated increase of 1.2%, 500 houses across Argyll and Bute.
Looking forward, the population forecasts (up to 2020) estimate an increase in the Oban population, with the number of households likely to rise to approximately 9,375, an increase of 250 from 2010. The number of households across Argyll and Bute is anticipated to increase by another 500 to approximately 41,750 over the same period.
It is, however, appropriate to note that these projections were made pre-recession, and may therefore be subject to variation once the full effects of the downturn are understood.
Table 1.7 provides information on the residential planning applications across Argyll and Bute.

Oban Locality Socio-Economic Baseline: Argyll and Bute Council 14
Table 1.7: Residential Accommodation Planning Applications (2005 – 2010)
Housing
Not started Started Complete
Mid Argyll, Kintyre and the Isles 304 units 6 units 10 units
Bute 41 units - 12 units
Cowal 76 units - 47 units
Lorn 64 units 43 units 126 units
Helensburgh and Lomond 211 units - 54 units
Source: Argyll and Bute Council
The table shows that in comparison to the other localities, Lorn has seen the most housing development activity in terms of completions with 126 new units completed since 2005 and a further 107 with planning permission for the area.
1.8 Tourism Visitor Day Market
The day visitor market i.e. potential day visitor catchment area is considered within our assessment. Attracting visitors to the town and improving the external perception of the town is a key over-arching objective. Below we provide a brief overview of the socio-economic composition of this potential market.
Please note, the day visitor market catchment area is defined roughly as locations within a 1.5 hour drive time and includes the following local authorities:
Argyll and Bute;
East Dunbartonshire;
Glasgow;
Inverclyde;
North Ayrshire;
Renfrewshire; and
West Dunbartonshire.
Oban Locality Socio-Economic Baseline: Argyll and Bute Council 15
We have provided a brief snapshot of the likely catchment area for the Oban/Argyll and Bute day visitor market. The key indicators for the catchment area are:
the average gross weekly wage ranges from £426 - £553, the Scottish average is £472 (NOMIS);
total catchment population of 1.26 million, broken down (GROS):
o 0-15 years (17%); o 16-64 years (67%); o 65+ years (16%); and
45% have no access to private transport compared with 34% at the Scotland level (Census 2001).
Further, we have provided a list of other key attractions within the West of Scotland day visitor market. Please note this is not an exhaustive assessment and is used to set the context of the type of attractions/facilities within the West of Scotland that are likely to attract day visitors7:
o Argyll and Bute area: The National Park Gateway – Loch Lomond Isle of Bute Discovery Centre Inveraray Jail Inveraray Castle Loch Fyne Oyster Bar Luss/Arrochar Mount Stuart Queens Hall Iona Abbey & St Columba Centre (Mull), Isle of Iona Benmore Botanic Gardens, Dunoon Oban War and Peace Museum, Corran Esplanade,
Oban o North Ayrshire area:
West Kilbride Craft Town Vikingar – Largs Eglinton Country Park Visitor Centre – Irvine Scottish Maritime Museum - Irvine
o West Dunbartonshire area: Loch Lomond Shores Auchentoshan Distillery
7 Information on the most popular tourist destinations is provided through the Visitor Attraction
Monitor, VisitScotland 2008. We have not included the top tourist attractions in Glasgow within our assessment as they are considered to have a geographic reach outwith the West of Scotland day visitor market and represent an inappropriate comparator.

Oban Locality Socio-Economic Baseline: Argyll and Bute Council 16
o Inverclyde area: Gourock outdoor swimming pool Quarriers Village Mclean Museum and art gallery Newark Castle
o Renfrewshire: Paisley museum and art gallery Paisley Abbey.
Oban Locality Socio-Economic Baseline: Argyll and Bute Council 17
Appendix A: Data Sources
This appendix provides a list of all the data sources used within the baseline assessment:
Population:
Scottish Census 2001 (SCROL); and
General Register Office Scotland (GROS), 2008 small area statistics based on datazone definitions for Oban (S01000806, S01000808, S01000809, S01000810, S01000811, S01000812, S01000813, S01000814, S01000815, S01000816, S01000817, S01000818, S01000819, S01000820, S01000821, S01000822, S01000823, S01000824, S01000825, S01000826, S01000827, S01000828, S01000829, S01000830, S01000831, S01000832).
Employment
ABI broad industrial sector data sourced from NOMIS. Data is survey based (with September being the reference date) and collected annually and reported in December for the previous year i.e. the 2008 ABI statistics used within the assessment were published in December 2009. The data source does not cover self employment.
It should be noted that a number of Standard Industrial Classification codes (SIC) were discontinued after 2005 due to three key changes to how the data is collected and presented:
o change in reference date (when the data is collected) from December to September
o use of Business Register Survey data within the ABI/1 results o change to the minimum domain methodology
This resulted in Argyll and Bute reporting approximately 1,300 less employees on a like for like basis between 2005 and 2006.
For future reporting, discontinuities with the data source should be monitored. For more detail, a link to the 2006 explanatory document is provided
https://www.nomisweb.co.uk/articles/news/files/ABI2006discontinuities.doc
Business Base
ABI broad industrial sector data is sourced from NOMIS. Data is survey based and collected annually and updated in December for the previous year i.e. the 2008 ABI statistics used within the assessment were published in December 2009.

Oban Locality Socio-Economic Baseline: Argyll and Bute Council 18
Claimant Count
Claimant Count data is taken from NOMIS based on JSA claimants reported through the DWP. Data is taken as the seasonally adjusted average with December used as the reference date;
Gross Value Added
data taken from Scottish Government Scottish Annual Business Statistics http://www.scotland.gov.uk/Topics/Statistics/16170/ServBroad
GVA per employee at the Argyll and Bute level for 2008 is estimated using the most up to date (2007) figure and inflated to reflect current prices using the Retail Price Index http://www.statistics.gov.uk/statbase/tsdataset.asp?vlnk=7172&More=Y
tourism GVA is provided through the Scottish Government Scottish Annual Business Statistics http://www.scotland.gov.uk/Topics/Statistics/16170/Tourism-related
Property
property data on take-up and availability provided through the Scottish Property Network based on information supplied through the land use register; and
planning applications, completion notifications and household projections provided by Argyll and Bute Council.
Tourism Visitor Day Market
average wages provided through Annual Survey of Hours and Earnings (ASHE) through the NOMIS website. Data is based on median gross weekly earnings of the local authority areas;
population data based on local authority boundaries from the GROS population estimates;
access to private transport provided through Scottish Census 2001 (SCROL); and
visitor attraction data based on EKOS research and input from project managers.