Embed Size (px)
Citation preview
Comments on Improving Consumption Measurement
Chris CarrollJohns Hopkins University
Remarks At CRIW-NBER Conference On Improving Consumption MeasurementCambridge, MA
July 13, 2009

It’s A Global ProblemNew Technologies
Checks and BalancesOpenness, Transparency, Accountability
Conclusion
Why Are Some Surveys/Countries Better Than Others?My Best Guess
We Have A Serious Problem
1980 1985 1990 1995 2000 20057.5
7.6
7.7
7.8
7.9
8
8.1
8.2
8.3
Food Consumption Per−capita
Year
Log
− 2
003
$
1980 1985 1990 1995 2000 2005
8.8
8.9
9
9.1
9.2
9.3
9.4
9.5
9.6
Nondurable Consumption Per−capita
Year
Log
− 2
003
$
1980 1985 1990 1995 2000 20057.1
7.2
7.3
7.4
7.5
7.6
7.7
7.8
7.9
Durable Consumption Per−capita
Year
Log
− 2
003
$
1980 1985 1990 1995 2000 2005
7.4
7.5
7.6
7.7
7.8
7.9
8
8.1
8.2Housing Services Per−capita
Year
Log
− 2
003
$
NIPACEXPSID
NIPACEX
NIPACEX
NIPACEX
Figure 3: Comparison between per-capita averages in CEX and NIPA: various definitions ofconsumption
Carroll Improving the CEX

It’s A Global ProblemNew Technologies
Checks and BalancesOpenness, Transparency, Accountability
Conclusion
Why Are Some Surveys/Countries Better Than Others?My Best Guess
CE vs NIPA for CanadaFigure 2: Mean Nominal Non-Durable Consumption
050
0010
000
1500
0C
onsu
mpt
ion
1975 1980 1985 1990 1995 2000 2005Year
SNA FAMEX/SHS
the SCF had unusually small samples in 1977, 1979, 1981 and 1984, which explains
the anomalies prior to 1990.11 The post 1990 discrepancies can be explained by the
2003 historical revision of the weights discussed in the previous section. As a result
of this revision, which was applied retroactively to 1990, higher weights were assigned
to low/no earnings individuals as well as high earnings individuals and had the effect
of increasing substantially the fraction of the population not in the labor force. This
is reflected in Figure 3 as a low employment to population ratio.12
11Survey years 1977 and 1979, which contain data pertaining to 1976 and 1978, have otherproblems—in particular hours worked is missing—so we dropped these years for the rest of theanalysis.
12This is confirmed by a similar figure (not shown) constructed using weights available prior tothe revision, which shows essentially no discrepancy between the SCF and LFS numbers over the1990’s.
12
Carroll Improving the CEX

It’s A Global ProblemNew Technologies
Checks and BalancesOpenness, Transparency, Accountability
Conclusion
Why Are Some Surveys/Countries Better Than Others?My Best Guess
CE vs NIPA for Germany
1985 1990 1995 2000 20051
1.1
1.2
1.3
1.4
1.5
1.6
1.7
1.8 x 10⁴ Per Capita Disposable Income from NIPA, EVS & GSOEP
Year
Per
Cap
ita In
com
e in
Eur
os, P
rice
s of
200
0
EVSGSOEPNIPA
Carroll Improving the CEX
It’s A Global ProblemNew Technologies
Checks and BalancesOpenness, Transparency, Accountability
Conclusion
Why Are Some Surveys/Countries Better Than Others?My Best Guess
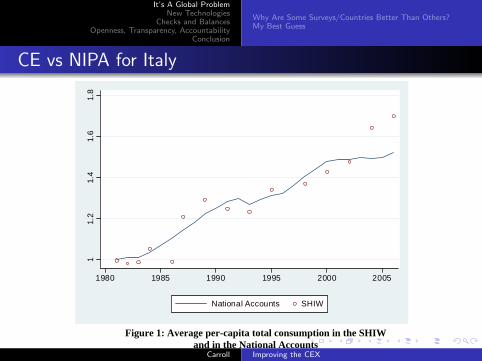
CE vs NIPA for Italy
11.
21.
41.
61.
8
1980 1985 1990 1995 2000 2005
National Accounts SHIW
Figure 1: Average per-capita total consumption in the SHIW
and in the National Accounts
.91
1.1
1.2
1.3
1.4
1980 1985 1990 1995 2000 2005
National Accounts SHIW
Figure 2: Average per-capita non-durable consumption in the SHIW
and in the National Accounts
23
Carroll Improving the CEX

It’s A Global ProblemNew Technologies
Checks and BalancesOpenness, Transparency, Accountability
Conclusion
Why Are Some Surveys/Countries Better Than Others?My Best Guess
CE vs NIPA for Russia
40
Figure 2: Comparison of RLMS with Official Statistics
1000
2000
3000
4000
5000
1994 1996 1998 2000 2002 2004
RLMS NIPA
A.Income per capita
1000
2000
3000
4000
5000
1994 1996 1998 2000 2002 2004
RLMS NIPA
B.Consumption per capita
500
1000
1500
2000
1994 1996 1998 2000 2002 2004
RLMS HBS
C.Food consumption per household member
500
1000
1500
2000
1994 1996 1998 2000 2002 2004
RLMS HBS
D.Non-food consumption per household member
Notes: For comparability purposes, the following RLMS measures are selected: yD in panel A, cD in panel B, cF + consumption of home-grown food in panel C, cD - cF in panel D. The RLMS sample is unrestricted. All RLMS measures are deflated using monthly CPI and the date of interview. All NIPA and HBS measures are deflated using annual average CPI. RLMS income and consumption for 1997 are imputed using the lagged RLMS value multiplied by the 1997 growth rate from NIPA.
Carroll Improving the CEX

It’s A Global ProblemNew Technologies
Checks and BalancesOpenness, Transparency, Accountability
Conclusion
Why Are Some Surveys/Countries Better Than Others?My Best Guess
CE vs NIPA for Sweden
1984 1986 1988 1990 1992 1994 1996 1998 200090
95
100
105
110
115
120
125
130
NIPA
HUT
SEK
1000
Carroll Improving the CEX

It’s A Global ProblemNew Technologies
Checks and BalancesOpenness, Transparency, Accountability
Conclusion
Why Are Some Surveys/Countries Better Than Others?My Best Guess
CE vs NIPA for UK
15
Figure 2.6: Income and Consumption Coverage
0.6
0.65
0.7
0.75
0.8
0.85
0.9
0.95
119
78
1980
1982
1984
1986
1988
1990
1992
1994
1996
1998
2000
2002
2004
Year
Cov
erag
Income CoverageConsumption Coverage
In order to try to understand what may be behind the declining performance of
the expenditure data, it is worth looking at some of the components behind the
total. Figure 2.7 shows the percentage coverage of certain items included in our
consumption basket. Expenditure on food, clothing and catering matched the
national accounts extremely well, both in levels and in dynamics until the late
1980s (and before the beginning of our sample period). Coverage for these items
rarely fell below 90%. On the other hand, alcohol and tobacco have always had
low coverage, but this is common for items that carry a social stigma. 1988 saw a
sudden collapse in the coverage of catering, which suggests that there was a
sudden change in measurement for this category in one of the datasets.
However, for all other categories there has been no sudden shift, but a gradual
decline in coverage, approximately since 1993. Therefore the decline in coverage
of the aggregate since 1993 is not confined to certain items but seems to be a
broad trend across many expenditure categories. The case of food expenditure is
puzzling since the national accounts data for this item are formed mainly from
the FES data. It may therefore be sensible to use the FES food coverage as a basis
for comparison.
Carroll Improving the CEX

It’s A Global ProblemNew Technologies
Checks and BalancesOpenness, Transparency, Accountability
Conclusion
Why Are Some Surveys/Countries Better Than Others?My Best Guess
Commonalities
In Many Countries, Coverage Has Declined Seriously
In Some, Deterioration Is Accelerating
Carroll Improving the CEX

It’s A Global ProblemNew Technologies
Checks and BalancesOpenness, Transparency, Accountability
Conclusion
Why Are Some Surveys/Countries Better Than Others?My Best Guess
Differences:
In Person Vs Phone Interviews
Diary Vs Recall
Incentives To Participate
Quality of Interviewers
Quality of Survey (Focus Groups!)
Use Of Budget Constraint
Carroll Improving the CEX

It’s A Global ProblemNew Technologies
Checks and BalancesOpenness, Transparency, Accountability
Conclusion
Why Are Some Surveys/Countries Better Than Others?My Best Guess
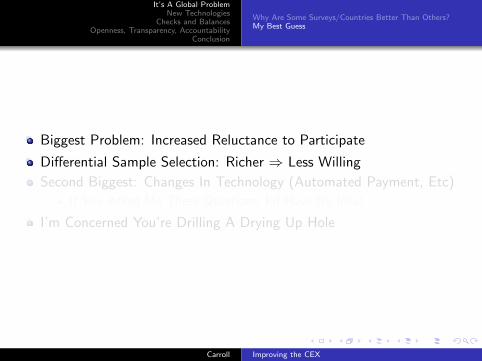
Biggest Problem: Increased Reluctance to Participate
Differential Sample Selection: Richer ⇒ Less Willing
Second Biggest: Changes In Technology (Automated Payment, Etc)
If You Asked Me These Questions, I’d Have No Idea!
I’m Concerned You’re Drilling A Drying Up Hole
Carroll Improving the CEX
It’s A Global ProblemNew Technologies
Checks and BalancesOpenness, Transparency, Accountability
Conclusion
Why Are Some Surveys/Countries Better Than Others?My Best Guess
Biggest Problem: Increased Reluctance to Participate
Differential Sample Selection: Richer ⇒ Less Willing
Second Biggest: Changes In Technology (Automated Payment, Etc)
If You Asked Me These Questions, I’d Have No Idea!
I’m Concerned You’re Drilling A Drying Up Hole
Carroll Improving the CEX

It’s A Global ProblemNew Technologies
Checks and BalancesOpenness, Transparency, Accountability
Conclusion
Nielsen Data
Credit Card Data
Personal Finance Online
QuickenOnlineiBankhttp://www.mint.com/product/videos/mint-demo/Big Advantage: People Get Something Valuable At the End
50 percent chance that current structure should be ditched altogether
Carroll Improving the CEX

It’s A Global ProblemNew Technologies
Checks and BalancesOpenness, Transparency, Accountability
Conclusion
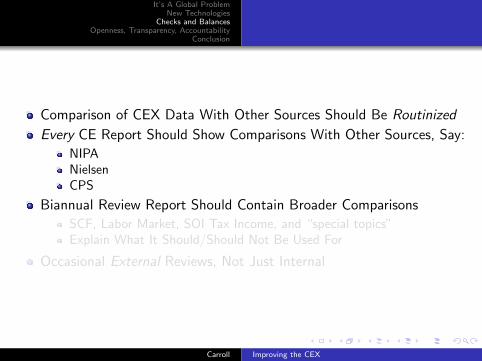
Comparison of CEX Data With Other Sources Should Be Routinized
Every CE Report Should Show Comparisons With Other Sources, Say:
NIPANielsenCPS
Biannual Review Report Should Contain Broader Comparisons
SCF, Labor Market, SOI Tax Income, and “special topics”Explain What It Should/Should Not Be Used For
Occasional External Reviews, Not Just Internal
Carroll Improving the CEX
It’s A Global ProblemNew Technologies
Checks and BalancesOpenness, Transparency, Accountability
Conclusion
Comparison of CEX Data With Other Sources Should Be Routinized
Every CE Report Should Show Comparisons With Other Sources, Say:
NIPANielsenCPS
Biannual Review Report Should Contain Broader Comparisons
SCF, Labor Market, SOI Tax Income, and “special topics”Explain What It Should/Should Not Be Used For
Occasional External Reviews, Not Just Internal
Carroll Improving the CEX
It’s A Global ProblemNew Technologies
Checks and BalancesOpenness, Transparency, Accountability
Conclusion
And Collaboration
Openness, Transparency, Accountability
How Do These Buzzwords Apply?
Unfolding Brackets of Complexity Of Data Use
Very Easy To Get Top Level Data
Clear Path to “Drill Down” to Deeper and Deeper Levels
A Lot Of Researchers Have Been Defeated By Complexity
Experiment, e.g., With HRS or PSID Instrument On CE Sample
Carroll Improving the CEX

It’s A Global ProblemNew Technologies
Checks and BalancesOpenness, Transparency, Accountability
Conclusion
And Collaboration
Encourage Researchers With Setup Like Census Data Centers
Carroll Improving the CEX

It’s A Global ProblemNew Technologies
Checks and BalancesOpenness, Transparency, Accountability
Conclusion
A Golden Age!
CE Should Be A Part Of It, Not A Drowning Polar Bear
Carroll Improving the CEX


![THE The JOHNS HOPKINS CLUB Events JOHNS HOPKINS … [4].pdf · Club Herald July / August 2015 Events THE The JOHNS HOPKINS CLUB JOHNS HOPKINS UNIVERSITY 3400 North Charles Street,](https://img.pdfslide.net/doc/110x75/5fae1ad08ad8816d2e1aaabe/the-the-johns-hopkins-club-events-johns-hopkins-4pdf-club-herald-july-august.jpg)