Embed Size (px)
Citation preview
Chromosome painting and
arrangement of interphase chromosome territories
in Arabidopsis thaliana
Dissertation
zur Erlangung des akademischen Grades
doctor rerum naturalium (Dr.rer.nat.)
vorgelegt der
Mathematisch-Naturwissenschaftlich-Technischen Fakultät
(matematisch-naturwissenschaftlicher Bereich)
der Martin-Luther-Universität Halle-Wittenberg
von Herrn Ales Pecinka
geb. am: 28.01.1978 in: Opava, Tschechische Republik
Gutachter:
1. Prof. Reuter
2. Prof. Schubert (Gatersleben)
Verteidigung: Halle (Saale), den 30.06.2005
urn:nbn:de:gbv:3-000008813[http://nbn-resolving.de/urn/resolver.pl?urn=nbn%3Ade%3Agbv%3A3-000008813]

2
ACKNOWLEDGEMENTS
I would like to express my grateful thanks to my supervisor Prof. Dr. Ingo Schubert, the
head of Cytogenetics Department, for giving me the opportunity to work in his group,
for constant guidance, continuous support and encouragement.
I am very thankful to Dr. Armin Meister, Dr. Gregor Kreth, Prof. Dr. Eric Lam, Dr.
Naohiro Kato, Dr. Koichi Watanabe, Dr. Martin A. Lysak, Dr. Célia Baroux, Dr.
Andreas Houben, Dr. Jörg Fuchs, Dr. Veit Schubert, Dr. Aline V. Probst, Dr. Wim
Soppe, Alexandre Berr, Dr. Sabina Klatte, Marco Klatte, Dr. Bernd Reiss and Dr. Jean
Molinier, for their support and helpful discussions. Moreover, I would like to thank
Martina Kühne, Achim Bruder, Rita Schubert, Ines Walde, Andrea Kuntze and Barbara
Hildebrandt for their technical assistance.
Finally, I wish to express my gratitude to Conny, my parents, brother and friends, who
have been a great support for me.
3
Content
1. INTRODUCTION .................................................................................................. 7
1.1. FLUORESCENCE IN SITU HYBRIDIZATION (FISH) FOR CHROMOSOME PAINTING... 7
1.1.1. Principles and applications of FISH for chromosome painting ............... 7
1.1.2. Feasibility of chromosome painting in plants........................................... 8
1.1.3. Aims of the work on chromosome painting in A. thaliana ........................ 9
1.2. INTERPHASE CHROMOSOMES: STRUCTURAL AND FUNCTIONAL ORGANIZATION 10
1.2.1. Arrangement of interphase chromosomes in various organisms............ 10
1.2.2. Aims of the work on interphase CT arrangement of A. thaliana ............ 12
1.3. INFLUENCE OF TANDEM REPETITIVE TRANSGENES AND OF FLUORESCENT
CHROMATIN TAGS ON THE INTERPHASE CHROMOSOME ARRANGEMENT ............... 14
1.3.1. Lac operator/GFP-lac repressor chromatin tagging system.................. 14
1.3.2. Aims of the work on inducible local alteration of interphase chromosome
arrangement ............................................................................................ 15
2. MATERIALS AND METHODS ......................................................................... 16
2.1. PLANT MATERIAL , PREPARATION OF CHROMOSOMES AND ISOLATION OF NUCLEI16
2.2. DOT BLOT HYBRIDIZATION .................................................................................. 17
2.3. PROBES................................................................................................................ 18
2.4. PROBE LABELING AND FISH ................................................................................ 19
2.5. MICROSCOPIC ANALYSES..................................................................................... 20
2.6. COMPUTER SIMULATIONS OF RANDOM CHROMOSOME ARRANGEMENT ................ 21
2.6.1. Determination of dimensions and volumes of Arabidopsis nuclei .......... 21
2.6.2. The 1 Mb Spherical chromatin domain model........................................ 22
4
2.6.3. Random spatial distribution model ......................................................... 23
3. RESULTS AND DISCUSSION ........................................................................... 24
3.1. ESTABLISHING OF CHROMOSOME PAINTING IN ARABIDOPSIS THALIANA.............. 24
3.1.1. Development of painting probes for individual chromosomes ............... 24
3.1.2. Identification of misaligned BAC clones by FISH .................................. 25
3.1.3. Identification of chromosome rearrangements by means of chromosome
painting ................................................................................................... 27
3.1.4. Conclusions as to the chromosome painting in Arabidopsis thaliana.... 29
3.2. ARRANGEMENT OF INTERPHASE CTS AND SOMATIC HOMOLOGOUS PAIRING IN
NUCLEI OF A. THALIANA ...................................................................................... 31
3.2.1. The relative positioning of entire CTs is random.................................... 31
3.2.2. The association frequency of homologous chromosome arm territories is
random for chromosomes 1, 3, 5 and higher for chromosomes 2 and 4. 33
3.2.3. The relative position of a gene (FWA) within its CT does not necessarily
reflect the transcriptional state ............................................................... 36
3.2.4. Somatic pairing of homologous chromosome segments occurs at random
................................................................................................................. 38
3.2.5. The frequency of somatic homologous pairing is not altered in
Arabidopsis mutants with an increased frequency of somatic homologous
recombination .........................................................................................42
3.2.6. Conclusions as to the arrangement of interphase CTs and somatic
homologous pairing ................................................................................ 44
3.3. ALTERATION OF THE LOCAL INTERPHASE CHROMOSOME ARRANGEMENT BY
TANDEM REPETITIVE TRANGENES AND FLUORESCENT CHROMATIN TAGS............. 46
5
3.3.1. GFP spot numbers vary in 2C live nuclei of homozygous transgenic
plants (EL702C) harboring two tagged loci on the top arm of
chromosome 3..........................................................................................46
3.3.2. GFP spots always co-localize with FISH signals of lac operator arrays,
but not vice versa ..................................................................................... 48
3.3.3. Lac operator arrays pair more often than random in nuclei of transgenic
plants and thus enhance pairing frequency of adjacent endogenous
regions..................................................................................................... 49
3.3.4. The transgenic tandem repeats co-localize more often than the flanking
regions with heterochromatic chromocenters......................................... 54
3.3.5. Conclusions as to the local alterations of interphase chromosome
arrangement caused by repetititve transgenes and fluorescent chromatin
tags .......................................................................................................... 57
4. OUTLOOK............................................................................................................ 58
5. SUMMARY ........................................................................................................... 60
6. ZUSAMMENFASSUNG...................................................................................... 63
7. LITERATURE...................................................................................................... 66
PUBLICATIONS IN CONNECTION WITH THE SUBMITTED DISSERTATION ......................... 75
DECLARATION ABOUT THE PERSONAL CONTRIBUTION TO THE MANUSCRIPTS FORMING
THE BASIS OF THE DISSERTATION......................................................................... 76
EIDESSTATTLICHE ERKLÄRUNG ................................................................................... 77
CURRICULUM VITAE............................................................................................. 78
APPENDIX.................................................................................................................... 79
6
List of abbreviations
3D 3-dimensional
BAC bacterial artificial chromosome
C 1C corresponds to the DNA content
of unreplicated reduced chromosome
complement
Col Columbia
CP chromosome painting
CT chromosome territory
DAPI 4’,6-Diamidino-2-phenylindole
dATP 2'-deoxyadenosine 5'-triphosphate
dCTP 2'-deoxycytidine 5'-triphosphate
DEAC diethyl aminomethyl coumarin
Dex Dexamethasone
dGTP 2'-deoxyguanosine 5'-triphosphate
DNP 2,4-dinithophenyl
dTTP 2'-deoxythymidine 5'-triphosphate
dUTP 2'-deoxyuridine 5'-triphosphate
FISH fluorescence in situ hybridization
GFP green fluorescence protein
GISH genomic in situ hybridization
Ler Landsberg erecta
NLS nuclear localization signal
NOR nucleolar organizer region
rDNA ribosomal DNA
RSD random spatial distribution
SCD spherical chromatin domain
SDS sodium dodecyl sulphate
Tris Tris-(hydroxymethyl)-
aminomethan
UV ultraviolet
WS Wassilewskija
WT wild-type
7
1. Introduction
The thesis is divided into three main parts. The first one has predominantly
methodological character and describes the development of chromosome specific
probes for chromosome painting in the model plant Arabidopsis thaliana. In the second
part, arrangement of chromosome territories (CTs) in Arabidopsis nuclei of different
ploidy and from various organs is characterized and compared to the predictions derived
from computer model simulations of a presumed random arrangement. In the third part,
the influence of a transgenic tandem repeat with a fluorescent tag (lac operator/GFP-lac
repressor-NLS) on the local interphase chromosome arrangement is elucidated.
1.1. Fluorescence in situ hybridization (FISH) for chromosome painting
1.1.1. Principles and applications of FISH for chromosome painting
Fluorescence in situ hybridization (FISH) is a method for microscopic detection of
specific sequences in a genome, utilizing nucleic acid probes with complementarity to
the target sequences. The term chromosome painting (CP) was introduced by Pinkel et
al. (1988) for in situ visualization of specific chromosomes or large chromosome
segments within chromosome complements by FISH. For vertebrates, specific painting
probes have been amplified by degenerate oligonucleotide primed-polymerase chain
reaction from either flow-sorted or microdissected chromosomes (reviewed in Langer et
al. 2004). To achieve chromosome specific signals, labeled repeats of the painting probe
with a dispersion extending to other than the target regions have to be prevented from

8
hybridization by excess of unlabelled genomic DNA. Therefore, this technique was
denominated also ‘chromosomal in situ suppression‘ hybridization (Lichter et al. 1988).
Recently, a broad spectrum of CP techniques suited for different applications in
research and clinical diagnostics has been developed (reviewed in Ferguson-Smith
1997; Ried et al. 1998; Langer et al. 2004). CP became a powerful tool for identification
of chromosomes and chromosome rearrangements (e.g. Lichter et al. 1988; Blenow
2004), for mutagenicity testing (e.g. Cremer et al. 1990; Marshall and Obe 1998;
Natarajan et al. 1992) and for studies of chromosome organization and dynamics during
interphase (reviewed in Cremer and Cremer 2001; Parada and Misteli 2002; Bickmore
and Chubb 2003) as well as for studies of chromosome/karyotype evolution (e.g.
Wienberg and Stanyon 1995; Svartman et al. 2004).
1.1.2. Feasibility of chromosome painting in plants
Although CP underwent dramatic progress in animal and human cytogenetics during the
last decade, attempts to establish CP in euploid plants have failed. This is probably due
to the large amounts of complex dispersed repeats that are more or less homogeneously
distributed over all chromosomes (reviewed in Schubert et al. 2001). Specific painting
of plant chromosomes could be achieved only by genomic in situ hybridization (GISH),
within genomes of interspecific hybrids or their progenies, using genomic DNA of one
parental species as a probe (Schwarzacher et al. 1989). On the basis of chromosome-
specific repeats, B (Houben et al. 1996) and sex chromosomes (Shibata et al. 1999;
Hobza et al. 2004) could be painted with chromosome derived probes.
The situation has changed since Arabidopsis with its small genome
(~157Mb/1C), low amount of repetitive DNA sequences, clustered mainly in the
9
(peri)centromeric regions and nucleolus organizer regions (NORs) (The Arabidopsis
Genome Initiative 2000; Bennett et al. 2003) became suitable for CP due to the public
availability of bacterial artificial chromosome (BAC) contigs covering the entire
chromosome complement (Scholl et al. 2000). The breakthrough was accomplished by
taking advantage of high-resolution FISH on pachytene chromosomes (Fransz et al.
1998, 2000) and the application of BAC contig pools as probes according to a method
previously applied to paint yeast chromosomes (Scherthan et al. 1992). Arabidopsis
chromosome 4 became the first entirely painted chromosome of a euploid plant
karyotype (Lysak et al. 2001). A FISH approach based on the use of large insert clones
(BACs/YACs) was at least partially successful to label a specific target region also for
other plants with small genomes and relatively low content of repetitive sequences, e.g.
sorghum, rice, cotton, tomato, potato and Medicago (reviewed in Lysak et al. 2001).
1.1.3. Aims of the work on chromosome painting in A. thaliana
After development of painting probes for the arms of Arabidopsis chromosome 4
(Lysak et al. 2001) it was aimed to develop chromosome-specific probes for all
chromosomes of A. thaliana for a spectrum of possible applications, such as:
• discrimination of individual chromosomes and their rearrangements during
all developmental and cell cycle stages.
• investigation of potential dynamics of CT arrangement during
developmental and cell cycle stages.
• investigation of interphase chromosome arrangement and karyotype
evolution in related Brassicaceae species.
10
1.2. Interphase chromosomes: structural and functional organization
1.2.1. Arrangement of interphase chromosomes in various organisms
Conventional microscopic studies on interphase nuclei reveal chromatin regions of
different density/staining intensity, representing (positively heteropycnotic)
heterochromatin fractions of high density (Heitz 1928), euchromatin of lower density
and nucleoli of lowest density. A territorial organization of interphase chromosomes
was first proposed by Rabl (1885). Complete interphase CTs could be traced only one
century later when CP by FISH became established and allowed to determine the
arrangement of CTs within nuclei by 3-dimensional (3D) microscopy (Cremer and
Cremer 2001).
Two models considering different aspects of nuclear CT distribution have been
proposed (Parada and Misteli 2002). One model, based on the radial arrangement of
CTs between the center and the envelope of the nucleus, suggests that gene-dense
chromosomes are located more internally than gene-poor ones. Such an arrangement
was found in various types of mammalian and chicken cells (Cremer et al. 2001;
Habermann et al. 2001; Kozubek et al. 2002) and appeared to be evolutionarily
conserved when the positions of homeologous chromosomes were compared between
human and higher primates (Tanabe et al. 2002) or human and mouse (Mahy et al.
2002a). However, no such arrangement was found in non-cycling cells by Bridger et al.
(2000). The other model reflects specific neighborhood relationships between two or
more CTs or distinct chromosome domains. Non-random side-by-side arrangement of
interphase CTs is of special interest because spatial vicinity of homologues is required,
at least transiently and/or position-specific, for DNA repair via homologous
11
recombination between homologues, often yielding reciprocal translocations (Rieger et
al. 1973; Parada and Misteli 2002), and transvection; i.e. homologous pairing
influencing the gene activity (most of the cases are described in Drosophila, however,
examples from plants, fungi and mammals are also known; reviewed in Duncan 2002).
At least transient pairing is believed to play a role in establishment of paramutation; i.e.
trans interactions between homologous sequences which set up distinct epigenetic states
that are heritable (Chandler and Stam 2004; Stam and Mittelsten Scheid in press). In
human cells non-random association of homologues is apparently restricted to certain
chromosomes of distinct cell types, e.g. Sertoli cells (Chandley et al. 1996; Nagele et al.
1999). The relative positioning of all human heterologue combinations was proposed to
be predominantly random (Cornforth et al. 2002). At least transient somatic association
of homologous chromosomes has been claimed for yeast (Burgess et al. 1999),
however, no clear evidence for such an association was found by others (Fuchs et al.
2002; Lorenz et al. 2003). A development- and cell cycle-specific close spatial
alignment of homologous chromosome segments in nuclei of most somatic tissues was
hitherto observed only in Drosophila (Hiraoka et al. 1993; Csink and Henikoff 1998;
Fung et al. 1998). For review of somatic homologous pairing see McKee (2004). Recent
studies have shown by photobleaching of fluorescently labeled chromatin in vivo that
the positioning of interphase chromosomes is largely inherited from mother to daughter
nuclei in mammals (Gerlich et al. 2003; Walter et al. 2003; see also Bickmore and
Chubb 2003; Parada et al. 2003; Williams and Fisher 2003).
In plants with large genomes (>5,000 Mb/1C) interphase chromosomes
frequently show Rabl orientation with centromeres and telomeres clustered at opposite
poles of a nucleus (Dong and Jiang 1998) thus maintaining telophase arrangement. In
Arabidopsis nuclei, instead of Rabl orientation, centromeres are randomly distributed in
peripheral positions, while telomeres are clustered around the nucleolus (Fransz et al.
12
2002). Until recently, individual CTs could be traced in plant interphase nuclei only for
single alien chromosomes within the chromosome complements of backcross progenies
from interspecific hybrids by GISH (Schwarzacher et al. 1989). In case of disomic
additions, close spatial association of the added homologues barely occurs in somatic
nuclei (Schwarzacher et al. 1992; Abranches et al. 1998; Schubert et al. 1998; Martinez-
Perez et al. 2001) except for tapetum cells of wheat (Aragon-Alcaide et al. 1997).
However, it remains unclear whether the alien chromosomes behave in the same way as
in their native background or as the host chromosomes. FISH experiments in diploid
rice indicated homologous association of centromeres and telomeres but not of
interstitial regions in root xylem and undifferentiated anther cells (Prieto et al. 2004). A
significant and chromosome-specific degree of association of homologous centromeres
was found in Arabidopsis nuclei (Fransz et al. 2002), but it remained open to what
degree entire chromosome arms are involved. To answer these questions, our group has
established recently chromosome specific painting of entire chromosomes of
Arabidopsis and its close relatives using A. thaliana painting probes (Lysak et al. 2001,
2003; Pecinka et al. 2004).
1.2.2. Aims of the work on interphase CT arrangement of A. thaliana
Great progress has been achieved from studies of CT arrangement in vertebrate nuclei
during the last decade. An increasing evidence for non-random radial and (at least
sometimes also) side-by-side arrangement of CTs has been provided. In contrast to that,
the organization of plant interphase chromosomes remained largely unknown. Using
chromosome specific painting probes for Arabidopsis chromosomes, it was aimed to
unravel CT arrangement in this plant and to answer the following quenstions:

13
• do Arabidopsis interphase CTs show a specific side-by-side or radial
arrangement?
• does the CT arrangement differ between nuclei of different ploidy and from
various organs?
• does the gene activity determine its position within a CT?
• to what extent does somatic homologous pairing occur in Arabidopsis?
• do Arabidopsis lines with an altered homologous recombination frequency
in somatic tissues reveal a deviating frequency of somatic homologous
pairing?
14
1.3. Influence of tandem repetitive transgenes and of fluorescent
chromatin tags on the interphase chromosome arrangement
1.3.1. Lac operator/GFP-lac repressor chromatin tagging system
In situ localization and direct in vivo visualization of distinct chromosome regions
recently became feasible by chromatin tagging systems. The lac operator/lac repressor
system (Robinett et al. 1996; Straight et al. 1996) for instance uses a bacterial DNA
binding protein (lac repressor) that, when fused with a green fluorescent protein (GFP)
and a nuclear localization signal (NLS) peptide, binds to the 256 copies of directly
repeated lac operators (~10 kb) integrated at a specific chromosome locus. Binding at the
target locus yields a fluorescent spot of higher intensity than the overall fluorescence of
dispersed unbound GFP molecules in the nucleoplasm. The GFP-lac repressor protein
is either transiently or stably expressed. The system was applied to various eukaryotes
such as yeasts (Aragon-Alcaide and Strunnikov 2000; Fuchs et al. 2002; Nabeshima et
al. 1998; Straight et al. 1996), flies (Gunawardena and Rakowski 2000, Vazquez et al.
2002), cultured mammalian cells (Robinett et al. 1996; Tsukamoto et al. 2000), and
plants (Kato and Lam 2001; Esch et al. 2003; Matzke et al. 2003). It revealed structural
dynamics of chromosomes in interphase as well as mitotic nuclei by tracing the tagged
loci in living cells (reviewed in Belmont et al. 1999; Gasser 2002; Lam et al. 2004).
However, such tagging systems generate artificial chromosome loci and unusual
nuclear protein localization. For instance, in baby hamster kidney cells in which a lac
operator array is amplified about 10 times, a nuclear protein complex, the so-called
promyelocytic leukaemia body, is formed at the integration locus (Tsukamoto et al.
2000). Promyelocytic leukaemia bodies are thought to play a role in regulating
15
transcription. Because these bodies are not formed at the transgene locus without
accumulation of the lac operator binding fusion protein, they are thought to recognize
high concentrations of foreign proteins (Tsukamoto et al. 2000).
1.3.2. Aims of the work on inducible local alteration of interphase chromosome
arrangement
Previously, the lac operator/lac repressor system was used to compare chromosome
dynamics in Arabidopsis nuclei of different ploidy (Kato and Lam 2003), e.g. in 2C
nuclei of guard cells (stomata) and in nuclei of pavement cells (8C on average).
Frequently, a lower-than-expected number of GFP spots (two for hemizygous and
four for homozygous EL702C plants) was observed (Kato and Lam 2003).
Interestingly, Esch et al. (2003) also reported reduced number of GFP spots (only one
spot per homozygous lac operator locus) in almost all nuclei of another lac operator/lac
repressor tagged Arabidopsis line. These data suggested frequent alignment of allelic
sequences, which was, however, not found for endogenous loci in Arabidopsis nuclei by
Pecinka et al. (2004). Therefore it was aimed to test, whether the reduced number of GFP
spots are indeed due to associations of operator arrays in Arabidopsis nuclei. In
particular, it should be clarified what is the impact of the lac operator arrays and/or
of the expression of the GFP-lac repressor protein on allelic/ectopic homologous
pairing of lac operator arrays in comparison to average euchromatic regions.
16
2. Materials and methods
2.1. Plant material, preparation of chromosomes and isolation of nuclei
The following A. thaliana genotypes were used for preparation of pachytene
chromosomes: Columbia (Col), Wassilewskia (WS), C24 (see Lysak et al. 2003;
Pecinka et al. 2004), homozygous EL702C (Kato and Lam 2003; Pecinka et al. J. Cell
Sci, submitted) and T665-IST (Aufsatz et al. 2002). Interphase chromosome
arrangement and somatic homologous pairing were studied using the genotypes Col,
Landsberg erecta (Ler) and the mutant fwa-1 in Ler background (Soppe et al. 2000;
Pecinka et al. 2004), C24 and the mutant Atp150caf-1 in C24 background (Kyryk et al.
manuscript in prep.), the mutants B71, P24I8, W92 and the control line IC9 (Molinier et
al. 2004; J. Molinier and B. Hohn unpublished data). The influence of tandem repetitive
transgenes on the arrangement of interphase chromosomes was studied in hemizygous
and homozygous EL702C genotypes in Col background (Kato and Lam 2003; Pecinka
et al. J. Cell Sci, submitted). Plants were cultivated as described in the referred papers.
Pachytene chromosomes were prepared according to Lysak et al. (2001).
Inflorescences were fixed in ethanol/acetic acid (3 : 1) at least for 48 hours, rinsed in
distilled water (2 x 5 min) and in citric buffer (10 mM sodium citrate, pH 4.8; 2 x 5
min) and incubated in 0.3% (w/v) pectolyase, cellulase and cytohelicase (Sigma,
Germany) in citric buffer at 37°C for 2-3 h. Then the material was transferred into citric
buffer and kept at 4°C. Individual flower buds were detached and macerated in 30 µl of
50% acetic acid on microscopic slides. The slides were placed on a hot plate (45°C) and
the drop was gently stirred by a needle for 30-60 seconds. Subsequently, 200 ml of
ethanol/acetic acid (3 : 1) were added and then the slide was dried by a hair drier. The
17
preparations were post-fixed in 4% formaldehyde in distilled water (v/v) for 10 min, air-
dried and stored at 4°C until use.
For isolation of interphase nuclei, young root tips and rosette leaves were fixed for
20 min in 4% formaldehyde in Tris buffer (100 mM Tris-HCl pH 7, 5 mM MgCl2, 85
mM NaCl, 0.1% Triton X 100) and homogenized in Tris buffer. Suspended nuclei were
stained with DAPI (1 µg/ml) and flow-sorted according to their ploidy level using a
FACStarPlus flow cytometer (Becton Dickinson) equipped with an Argon-ion laser
(INNOVA 90C-5) emitting UV light. Per ploidy level ~1000 nuclei were sorted onto
microscopic slides in a drop of buffer containing 100 mM Tris, 50 mM KCl, 2 mM
MgCl2, 0.05% Tween and 5% of sucrose, air-dried and used for FISH or stored at –
20°C until use. The nuclei of Arabidopsis lines carrying lac operator/lac repressor
transgenes were prepared with the following modifications. To induce expression of the
GFP-lac repressor-NLS protein, young rosette leaves were detached from the plants
and floated in 10 ml of 0.3 µM (homozygous EL702C) or 3 µM (wild-type)
Dexamethasone (Dex) solution in water in Petri dishes for 6-12 h. To avoid loss of GFP
signals, leaves were fixed in 4% formaldehyde freshly prepared from paraformaldehyde
and the 2C nuclei were sorted as described above.
2.2. Dot Blot hybridization
BAC clones purchased from the Arabidopsis Biological Resource Center (ABRC,
Columbus, OH) were tested for the presence of high copy sequences by radioactive
DNA-DNA dot blot hybridization. Approximately 0.4 µg of DNA per BAC clone was
applied to the Minifold 1 Dot Blot system (Schleicher and Schnell) and fixed on
moisted (2 x SSC) nitrocelulase N+ membrane (Hybond) under vacuum. The DNA was
18
denatured by adding 200 µl of 0.4 M NaOH per slot. Membranes were rinsed in 2 x
SSC for 1 min and directly used for hybridization or stored at 4°C until use.
Genomic DNA from A. thaliana Col was isolated using a DNeasy Plant Mini Kit
(Quiagen). Isolated DNA was sonicated to a fragment size of 100-500 bp and
radioactively labelled with [α-32P]-dCTP using a HexaLabel DNA Labeling Kit
(Fermentas).
For Dot Blot hybridization, membranes were placed into a hybridization bottle
with 5 ml of pre-hybridization solution [5 x SSPE (0.9 M NaCl, 0.05 M Sodium
phosphate, 0.005 EDTA pH 7.7), 5 x Denhard’s solution, 0.5% SDS] and 500 µl (10
µg/µl) of denatured (at 100°C for 5 min) salmon sperm DNA and incubated at 65°C for
5 h. Then, the radioactively labelled genomic DNA was added for at least 12 h at 65°C.
The membranes were washed (in 0.5% SDS/2 x SSC; in 0.5% SDS/0.5 x SSC and in
0.5% SDS/0.1 x SSC; 20 min each at 65°C), wrapped in a plastic foil and screened with
a Phosphoimager STORM860 using the ImageQuant software (Molecular Dynamics).
2.3. Probes
All BACs were obtained from the Arabidopsis Biological Resource Center (Columbus,
OH). DNA of individual clones was isolated by standard alkaline extraction (Sambrook
and Russell 2001). Clones that according to sequence annotation of The Institute for
Genomic Research (Rockville, MD; http://www.tigr.org/) database harbour >5% of
mobile elements and/or yielded strong signals (see Figure 3A) in Dot Blot hybridization
(Lysak et al. 2003) were omitted from probes designed for CP (the list of BACs selected
for CP of all Arabidopsis chromosomes is provided as Appendix).
Somatic homologous pairing was tested using the following BACs (Figure 7C):
F6F3, F22L4, T2P11, T7N9, F11P17, T1F9, T11I11, F3F9 (all from chromosome 1,
19
GenBank accession Nos. AC023628, AC061957, AC005508, AC000348, AC002294,
AC004255, AC012680, AC013430, respectively), F18C1, MGL6 (both from
chromosome 3, accession Nos. AC011620 and AB022217), F4C21, F9H3, F13C5,
T18B16, F6I7, F24A6, M7J2, F17I5 and F10M10 (all from chromosome 4, accession
Nos. AC005275, AF071527, AL021711, AL021687, AL049657, AL035396,
AL022197, AL031032, AL035521, respectively).
For the experiments with lac operator/lac repressor-NLS tagged lines, the
following DNA clones were used in addition to BACs MGL6 and F18C1 (GenBank
accession Nos. AB022217 and AC011620, respectively): BAC T15P10 containing 45S
rDNA (accession No. AF167571), the plasmid 128x lacO-SK (Kato and Lam 2001), the
plasmid pAL1 containing the 180 bp centromeric tandem repeat of A. thaliana
(Martinez-Zapater et al. 1986) and a BAC contig spanning 4.2 Mb of chromosome 3 top
arm from F2O10 to MSL1 (accession Nos. AC013454 and AB012247, respectively).
2.4. Probe labeling and FISH
BAC DNA was labeled by nick translation, either individually or, for CP, in pools of 4-
5 BACs (19-38 such pools per chromosome). Labeled nucleotides (either biotin-dUTP,
digoxigenin-dUTP, DNP-dUTP, Cy3-dUTP or DEAC-dUTP) were prepared as
described by Henegariu et al. (2000). The quality of each labeled probe was tested
individually on pachytene chromosomes.
Prior to FISH, slides were rinsed in 2×SSC (2 x 5 min), treated with pepsin (100
µg/ml in 0.01 M HCl) for 3-10 min at 38°C, rinsed in 2×SSC (2 x 5 min), post-fixed in
4% formaldehyde/2×SSC (10 min), rinsed in 2×SSC (2 × 5 min), dehydrated in 70, 90,
96% ethanol (2 min each) and air-dried.
20
For CP, the entire labeled probe (~110 ng of DNA of each BAC) was
precipitated and resuspended in 20-40 µl of hybridization mix (50% formamide, 10%
dextran sulphate, 2xSSC, 50 mM sodium phosphate pH 7.0) per slide. After mounting
the probe, the slides were placed on a heat block at 80°C for 2 min and then incubated in
a moist chamber at 37°C for ~12-36 h.
Post hybridization washes and detection steps were as described (Schubert et al.
2001). Biotin-dUTP was detected by avidin conjugated with Texas Red (1:1000; Vector
Laboratories), goat-anti-avidin conjugated with biotin (1:200; Vector Laboratories) and
again with avidin conjugated with Texas Red, digoxigenin-dUTP by mouse-anti-
digoxigenin (1:250; Roche) and goat-anti-mouse conjugated with Alexa-488 (1:200;
Molecular Probes), DNP-dUTP by rabbit-anti-DNP (1:400; Sigma) and goat anti-rabbit
conjugated with Cy5 (1:100; Jackson Laboratories). Cy3-dUTP and DEAC-dUTP were
observed directly. Nuclei and chromosomes were counterstained with 1-2 µg/ml of DAPI
in Vectashield mounting medium (Vector Laboratories).
2.5. Microscopic analyses
Analysis of fluorescence signals was performed with an epifluorescence microscope
(Axioplan 2; Carl Zeiss) using a 100x/1.4 Zeiss plan-apochromat objective and a cooled
CCD camera Spot 2e (Diagnostic Instruments). Images were captured separately for
each fluorochrome using appropriate excitation and emission filters. Single plane
images and stacks of optical sections through nuclei were acquired with MetaVue
software (Universal Imaging). The deconvolution of image stacks was performed with
the ‘point spread function’ algorithm. Monochromatic images were pseudocoloured and
merged using MetaMorph (Universal Imaging) and/or Adobe Photoshop 6.0 (Adobe
Systems) software.
21
2.6. Computer simulations of random chromosome arrangement
2.6.1. Determination of dimensions and volumes of Arabidopsis nuclei
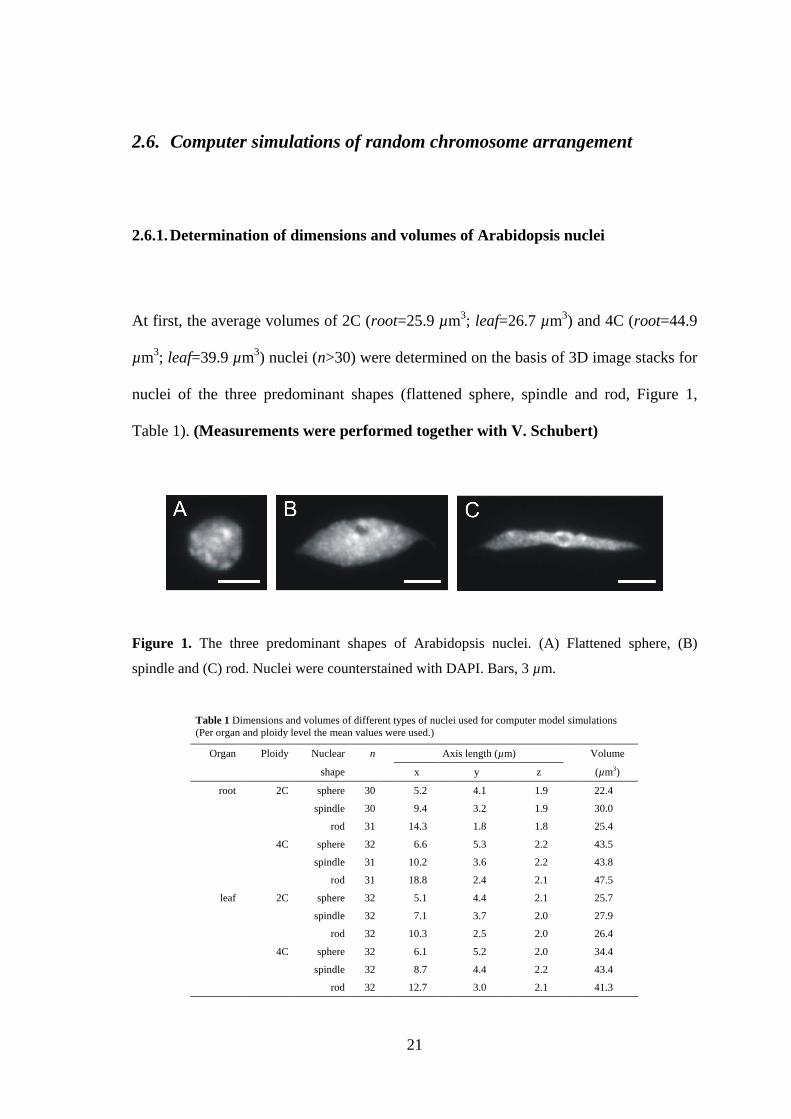
At first, the average volumes of 2C (root=25.9 µm3; leaf=26.7 µm3) and 4C (root=44.9
µm3; leaf=39.9 µm3) nuclei (n>30) were determined on the basis of 3D image stacks for
nuclei of the three predominant shapes (flattened sphere, spindle and rod, Figure 1,
Table 1). (Measurements were performed together with V. Schubert)
Figure 1. The three predominant shapes of Arabidopsis nuclei. (A) Flattened sphere, (B)
spindle and (C) rod. Nuclei were counterstained with DAPI. Bars, 3 µm.
Table 1 Dimensions and volumes of different types of nuclei used for computer model simulations (Per organ and ploidy level the mean values were used.)
Organ Ploidy Nuclear n Axis length (µm) Volume
shape x y z (µm3)
root 2C sphere 30 5.2 4.1 1.9 22.4
spindle 30 9.4 3.2 1.9 30.0
rod 31 14.3 1.8 1.8 25.4
4C sphere 32 6.6 5.3 2.2 43.5
spindle 31 10.2 3.6 2.2 43.8
rod 31 18.8 2.4 2.1 47.5
leaf 2C sphere 32 5.1 4.4 2.1 25.7
spindle 32 7.1 3.7 2.0 27.9
rod 32 10.3 2.5 2.0 26.4
4C sphere 32 6.1 5.2 2.0 34.4
spindle 32 8.7 4.4 2.2 43.4
rod 32 12.7 3.0 2.1 41.3
22
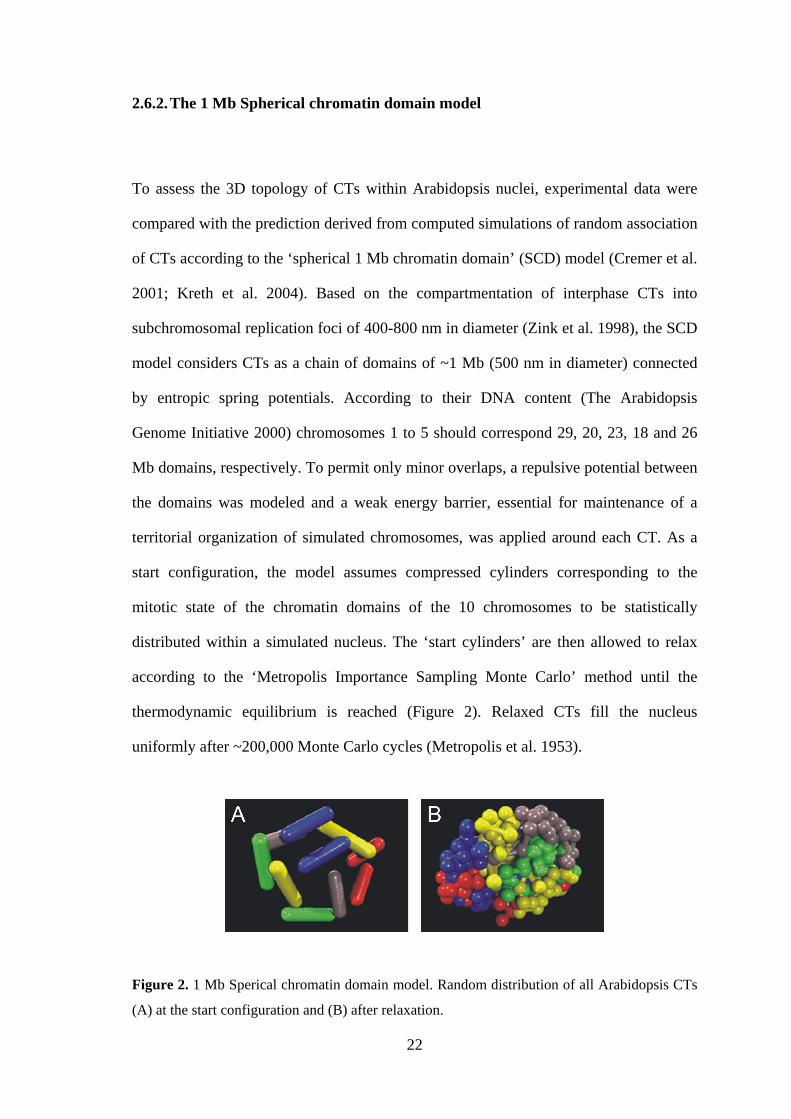
2.6.2. The 1 Mb Spherical chromatin domain model
To assess the 3D topology of CTs within Arabidopsis nuclei, experimental data were
compared with the prediction derived from computed simulations of random association
of CTs according to the ‘spherical 1 Mb chromatin domain’ (SCD) model (Cremer et al.
2001; Kreth et al. 2004). Based on the compartmentation of interphase CTs into
subchromosomal replication foci of 400-800 nm in diameter (Zink et al. 1998), the SCD
model considers CTs as a chain of domains of ~1 Mb (500 nm in diameter) connected
by entropic spring potentials. According to their DNA content (The Arabidopsis
Genome Initiative 2000) chromosomes 1 to 5 should correspond 29, 20, 23, 18 and 26
Mb domains, respectively. To permit only minor overlaps, a repulsive potential between
the domains was modeled and a weak energy barrier, essential for maintenance of a
territorial organization of simulated chromosomes, was applied around each CT. As a
start configuration, the model assumes compressed cylinders corresponding to the
mitotic state of the chromatin domains of the 10 chromosomes to be statistically
distributed within a simulated nucleus. The ‘start cylinders’ are then allowed to relax
according to the ‘Metropolis Importance Sampling Monte Carlo’ method until the
thermodynamic equilibrium is reached (Figure 2). Relaxed CTs fill the nucleus
uniformly after ~200,000 Monte Carlo cycles (Metropolis et al. 1953).
Figure 2. 1 Mb Sperical chromatin domain model. Random distribution of all Arabidopsis CTs
(A) at the start configuration and (B) after relaxation.
23
Subsequently, the minimal distances between domains of interest were
measured. CTs were considered as associated if boundaries were less than 500 nm apart
from each other. At this distance, CTs appear as separated at the microscopic level of
resolution. Assuming a distance of 400 nm decreased the expected association
frequency of heterologous CTs by no more than 1% and did not alter the significance
level for comparison of experimental and simulated data for heterologue association. To
test the influence of nuclear shape (flattened sphere, spindle and rod) on random
arrangement of CTs, 103 nuclei of each shape were modeled. (Done by G. Kreth and
A. Meister)
2.6.3. Random spatial distribution model
Since the ‘SCD’ model does not simulate domains <1 Mb, the geometrical ‘random
spatial distribution’ (RSD) model was established by A. Meister to simulate spheric
chromosome segments of ~100 kb (corresponding to the average BAC insert size)
within 106 spheric, spindle- or rod-shaped nuclei according to the volumes determined
for 2C and 4C nuclei and for the BAC FISH signals (0.15 µm3 and 0.22 µm3,
respectively) therein. The coordinates of segments were calculated from random
numbers. Signals that overlapped or were closer to each other than 100 nm were
considered to indicate homologous pairing. The random occurrence of homologous
pairing was calculated using the VisualBasic 5.0 (Microsoft) software. The differences
between the experimentally obtained values and the simulated ones were compared by
the chi-square or Fisher’s exact test and considered as significant at the P<0.001 level.
24
3. Results and discussion
3.1. Establishing of chromosome painting in Arabidopsis thaliana
3.1.1. Development of painting probes for individual chromosomes
Although the Arabidopsis genome consists of only ~15% repetitive DNA arrays (The
Arabidopsis Genome Initiative 2000), the presence of BACs containing dispersed DNA
repeats has to be avoided carefully when painting probes are arranged since such
sequences impair the painting of individual chromosomes by cross-hybridization to
other than targer chromosomes. In Arabidopsis, repeats are particularly abundant within
the (peri)centromeric heterochromatin and the NORs. Therefore, BACs containing
(peri-)centromeric or 45S rDNA sequences were omitted from painting probes.
Although chromosome arms of most Arabidopsis accessions lack larger blocks of
repetitive DNA, visible microscopically as interstitial heterochromatin, complete and
truncated mobile elements are scattered along chromosome arms. Painting experiments
with chromosome 4 have shown that the use of the complete set of all BACs from the
tiling path results in cross-hybridization signals on other chromosomes in addition to
painting of chromosome 4 (Lysak et al. 2001). Therefore, a search for repetitive DNA
sequences was performed for individual BACs in the TIGR database. BACs containing
>5% mobile elements within annotated sequences were omitted from the painting
probes, even when sequence in question was found to be restricted to the chromosomal
position of the BAC insert. Conversely, some apparently suitable BACs may yield
additional FISH signals at other regions. Thus, annotation analysis does not

25
unambiguously indicate the suitability of BACs for CP. Therefore, individual BACs
were additionally spotted on filters and hybridized with radioactively labeled genomic
DNA (Figure 3A). BACs yielding strong hybridization signals (Figure 3A) were
excluded from painting probes. From the total of 1,585 BACs, 1215 clones (77%) were
considered as suitable for CP. Finally the specificity of chromosome specific BAC
pools was tested on pachytene chromosomes. At first by two-color CP for the arms of
individual chromosomes and than by multi-color CP for entire chromosome
complement (Figure 3B,C). For multi-color CP of all five A. thaliana chromosomes, in
total 73 µg of labeled DNA per slide were applied (~110 ng of DNA of each of 669
BACs). [BACs used for painting of chromosomes 1, 2, 3 and 5 were selected by A.
Pecinka; clones used for painting of chromosome 4 were selected previously by
Lysak et al. (2001)]
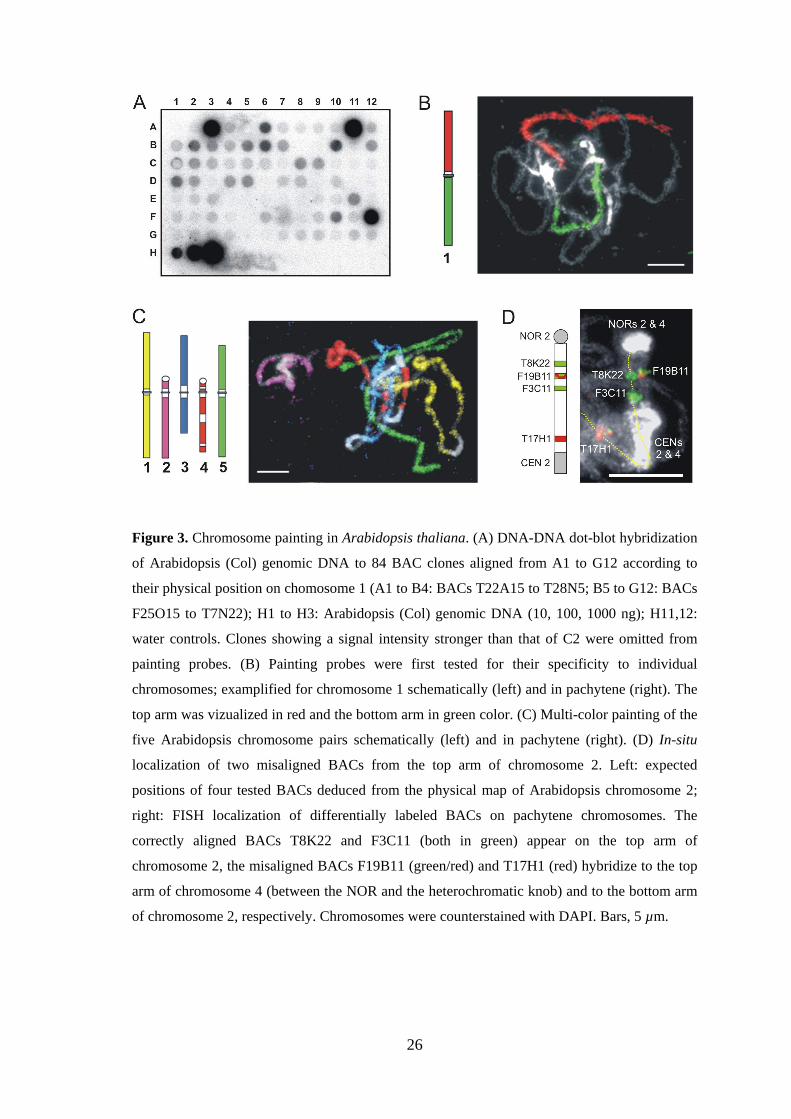
3.1.2. Identification of misaligned BAC clones by FISH
FISH with BACs mapped to the top arm of chromosome 2 yielded signals at other
positions than expected. On the basis of signals present elsewhere in the complement, it
was found, that at least 14 BACs anchored to the map of the top arm of chromosome 2
were misaligned. For determination of their correct position, individual BACs were
hybridized together with a tested correct BAC from the top arm of chromosome 2 to
pachytene chromosomes. Two major groups of misaligned BACs were identified: (1)
BACs giving a signal on the bottom arm of chromosome 2, and (2) BACs located on
another chromosome (Figure 3D). Thus, FISH provides a tool to confirm chromosomal
location of individual BACs (see also Schubert et al. 2001).
26
Figure 3. Chromosome painting in Arabidopsis thaliana. (A) DNA-DNA dot-blot hybridization
of Arabidopsis (Col) genomic DNA to 84 BAC clones aligned from A1 to G12 according to
their physical position on chomosome 1 (A1 to B4: BACs T22A15 to T28N5; B5 to G12: BACs
F25O15 to T7N22); H1 to H3: Arabidopsis (Col) genomic DNA (10, 100, 1000 ng); H11,12:
water controls. Clones showing a signal intensity stronger than that of C2 were omitted from
painting probes. (B) Painting probes were first tested for their specificity to individual
chromosomes; examplified for chromosome 1 schematically (left) and in pachytene (right). The
top arm was vizualized in red and the bottom arm in green color. (C) Multi-color painting of the
five Arabidopsis chromosome pairs schematically (left) and in pachytene (right). (D) In-situ
localization of two misaligned BACs from the top arm of chromosome 2. Left: expected
positions of four tested BACs deduced from the physical map of Arabidopsis chromosome 2;
right: FISH localization of differentially labeled BACs on pachytene chromosomes. The
correctly aligned BACs T8K22 and F3C11 (both in green) appear on the top arm of
chromosome 2, the misaligned BACs F19B11 (green/red) and T17H1 (red) hybridize to the top
arm of chromosome 4 (between the NOR and the heterochromatic knob) and to the bottom arm
of chromosome 2, respectively. Chromosomes were counterstained with DAPI. Bars, 5 µm.
27
3.1.3. Identification of chromosome rearrangements by means of chromosome
painting
The availability of confirmed painting probes allows to detect and visualize induced as
well as spontaneous chromosome rearrangements even in species with small and
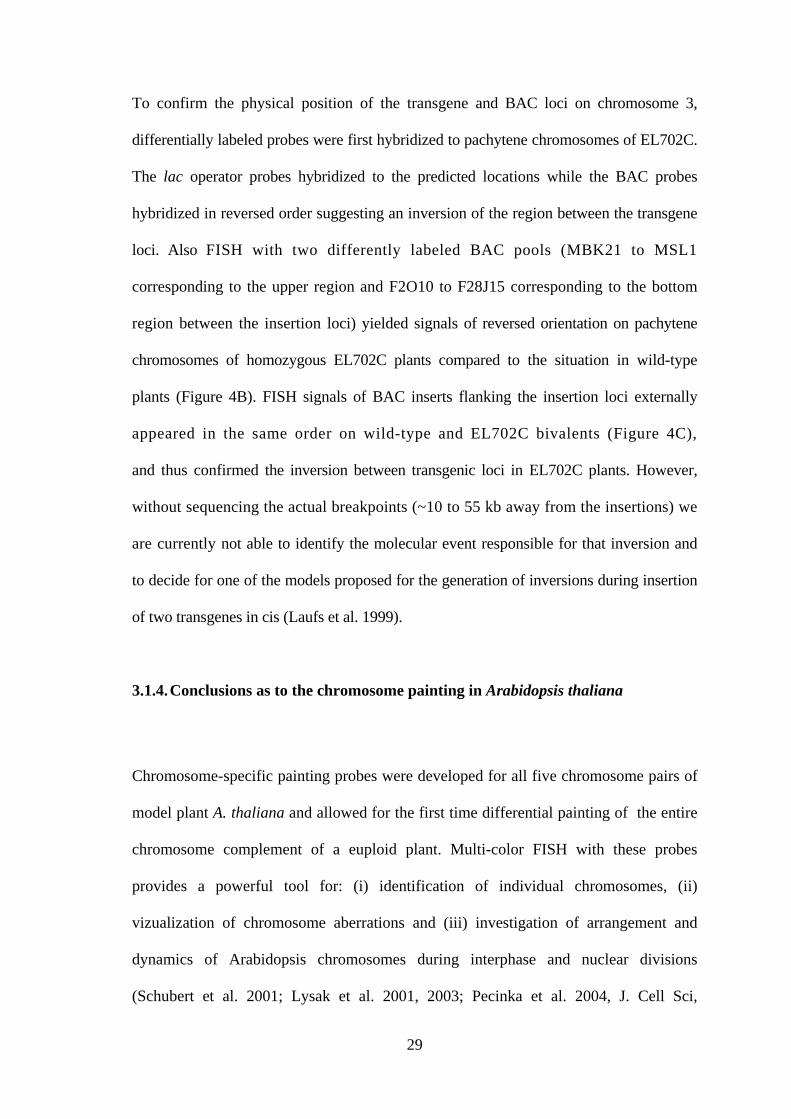
morphologically similar chromosomes such as those of A. thaliana. For the transgenic
Arabidopsis line T665-IST (Aufsatz et al. 2002), sequencing of the T-DNA insertion site
has shown that T-DNA was integrated at the distal end of chromosome 5 bottom arm,
upstream of nucleotide 4316 of BAC K9I9. However, the opposite end of the transgene
was linked upstream of nucleotide 66153 of BAC F21O3 from the top arm of
chromosome 3, suggesting that a reciprocal translocation has occurred during
transformation. The position of the chromosome 5 bottom arm terminus (from nucleotide
4317 of BAC K9I9 to the end of the chromosome, in total ~0.2 Mb) was not specified
(Aufsatz et al. 2002). To confirm the translocation and to reveal the position of
chromosome 5 terminus of the T665-IST genotype, CP was applied. Four differentially
labeled contigs arranged according to predicted rearrangement were hybridized to
chromosomes of wild-type (Col) and of T-DNA line (Figure 4A). Indeed, contig A
(BACs T14P13–T1B9) from the top-arm of chromosome 3 was found to be translocated
to the predicted position on chromosome 5. Contig D (K9I9-LA522) from the bottom arm
of wild-type chromosome 5 was found at the distal end of the top-arm of chromosome 3,
confirming a reciprocal translocation between both chromosomes (Figure 4A).
Furthermore, during experiments with the transgenic Arabidopsis line EL702C
(Kato and Lam 2003), a previously not suspectedchromosome rearrangement was
detected by CP. The line EL702C carries three T-DNAs (~17 kb each) inserted at two loci
on the top arm of chromosome 3, ~4.2 Mb apart from each other; the proximal locus
harbors two transgenes in inverse orientation (Figure 8A; Kato and Lam 2003). By
28
FISH with lac operator probe (10 kb of transgene) and BACs containing insert
sequences internally flanking the transgene loci it was aimed to analyze pairing
frequency of the lac operator arrays in 2C nuclei (see part 3.3.).
Figure 4. Vizualization of chromosome rearrangements by CP. (A) Left: scheme of the reciprocal
translocation between chromosomes 3 and 5 in line T665-IST in comparison to wild-type (Col).
Right: Chromosome painting of the complex probe to diplotene chromosomes of wild-type and
pachytene chromosomes of T665-IST. (B and C) The double transgene insertion in EL702C is
accompanied by a paracentric inversion between the integration points. Arrows indicate the top
arm end of chromosome 3 bivalent. (B) Painted regions between BACs F2O10 and F28J15
(yellow) and MBK21 and MSL1 (red) schematically positioned on the top arm of chromosome 3
of the wild-type accession Col and, together with the transgene (green), on chromosome 3 of the
EL702C genotype. Images show FISH of the complex probe to pachytene chromosomes of wild-
type and homozygous EL702C. (C) Regions flanking transgene loci from outwards hybridize in
the same order on pachytene chromosomes of wild-type (not shown) and line EL702C.
Chromosomes were counterstained with DAPI. Bars, 5 µm.
29
To confirm the physical position of the transgene and BAC loci on chromosome 3,
differentially labeled probes were first hybridized to pachytene chromosomes of EL702C.
The lac operator probes hybridized to the predicted locations while the BAC probes
hybridized in reversed order suggesting an inversion of the region between the transgene
loci. Also FISH with two differently labeled BAC pools (MBK21 to MSL1
corresponding to the upper region and F2O10 to F28J15 corresponding to the bottom
region between the insertion loci) yielded signals of reversed orientation on pachytene
chromosomes of homozygous EL702C plants compared to the situation in wild-type
plants (Figure 4B). FISH signals of BAC inserts flanking the insertion loci externally
appeared in the same order on wild-type and EL702C bivalents (Figure 4C),
and thus confirmed the inversion between transgenic loci in EL702C plants. However,
without sequencing the actual breakpoints (~10 to 55 kb away from the insertions) we
are currently not able to identify the molecular event responsible for that inversion and
to decide for one of the models proposed for the generation of inversions during insertion
of two transgenes in cis (Laufs et al. 1999).
3.1.4. Conclusions as to the chromosome painting in Arabidopsis thaliana
Chromosome-specific painting probes were developed for all five chromosome pairs of
model plant A. thaliana and allowed for the first time differential painting of the entire
chromosome complement of a euploid plant. Multi-color FISH with these probes
provides a powerful tool for: (i) identification of individual chromosomes, (ii)
vizualization of chromosome aberrations and (iii) investigation of arrangement and
dynamics of Arabidopsis chromosomes during interphase and nuclear divisions
(Schubert et al. 2001; Lysak et al. 2001, 2003; Pecinka et al. 2004, J. Cell Sci,

30
submitted). Moreover, A. thaliana painting probes can be used for comparative studies
of interphase chromosome arrangement (A. Berr, A. Pecinka and I. Schubert
unpublished data) and of karyotype evolution in closely related Brassicaceae species
(Lysak et al. 2003, 2005).
31
3.2. Arrangement of interphase CTs and somatic homologous pairing in
nuclei of A. thaliana
3.2.1. The relative positioning of entire CTs is random
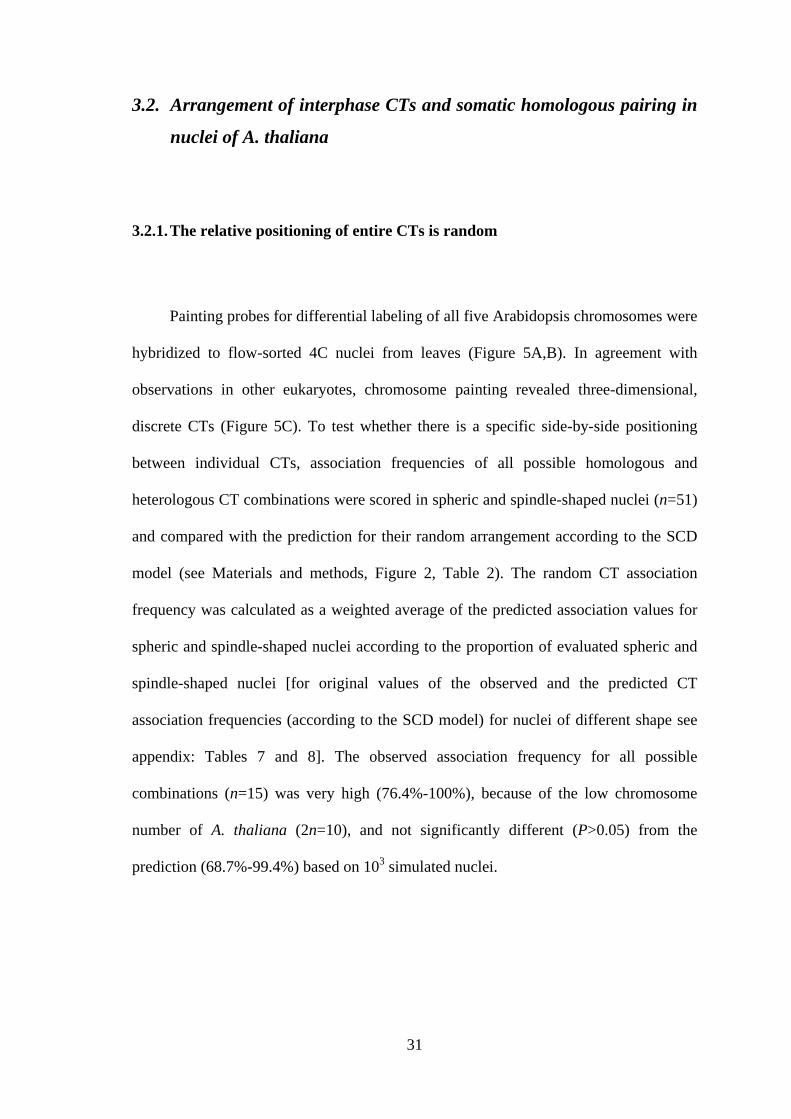
Painting probes for differential labeling of all five Arabidopsis chromosomes were
hybridized to flow-sorted 4C nuclei from leaves (Figure 5A,B). In agreement with
observations in other eukaryotes, chromosome painting revealed three-dimensional,
discrete CTs (Figure 5C). To test whether there is a specific side-by-side positioning
between individual CTs, association frequencies of all possible homologous and
heterologous CT combinations were scored in spheric and spindle-shaped nuclei (n=51)
and compared with the prediction for their random arrangement according to the SCD
model (see Materials and methods, Figure 2, Table 2). The random CT association
frequency was calculated as a weighted average of the predicted association values for
spheric and spindle-shaped nuclei according to the proportion of evaluated spheric and
spindle-shaped nuclei [for original values of the observed and the predicted CT
association frequencies (according to the SCD model) for nuclei of different shape see
appendix: Tables 7 and 8]. The observed association frequency for all possible
combinations (n=15) was very high (76.4%-100%), because of the low chromosome
number of A. thaliana (2n=10), and not significantly different (P>0.05) from the
prediction (68.7%-99.4%) based on 103 simulated nuclei.
32
Figure 5. Association of homologous and heterologous chromosome territories. (A) Scheme of
differential labeling of individual Arabidopsis chromosomes for multi-color chromosome
painting. (B) Central focal plane of a 4C leaf nucleus (left) and of CTs therein painted as in (A)
(right); DAPI-stained areas (left) without painting signal correspond to nucleoli (nu) and to the
pericentromeric chromocenters containing repetitive DNA sequences that were excluded from
painting probes. (C) Maximum intensity projections of a 4C leaf nucleus in three planes, left:
DAPI-stained, right: painted chromosome territories as in (A). Bars, 5 µm.
Table 2 Observed and expected frequency of pair-wise association of all Arabidopsis chromosome territories in 4C leaf nuclei
Chromosome Association frequency (%)a)
combination A. thaliana Col (n=51) SCD model (n=103)
1-1 88.2 85.3
1-2 96.1 99.1
1-3 100.0 99.4
1-4 98.0 98.8
1-5 100.0 99.4
2-2 76.5 74.8
2-3 96.1 98.6
2-4 96.1 98.3
2-5 98.0 98.8
3-3 80.4 77.5
3-4 96.1 98.4
3-5 98.0 98.5
4-4 78.4 68.8
4-5 96.1 97.5
5-5 88.2 78.8 a) all differences between observed and simulated values were not significant (P>0.05) in Fisher's exact test.
33
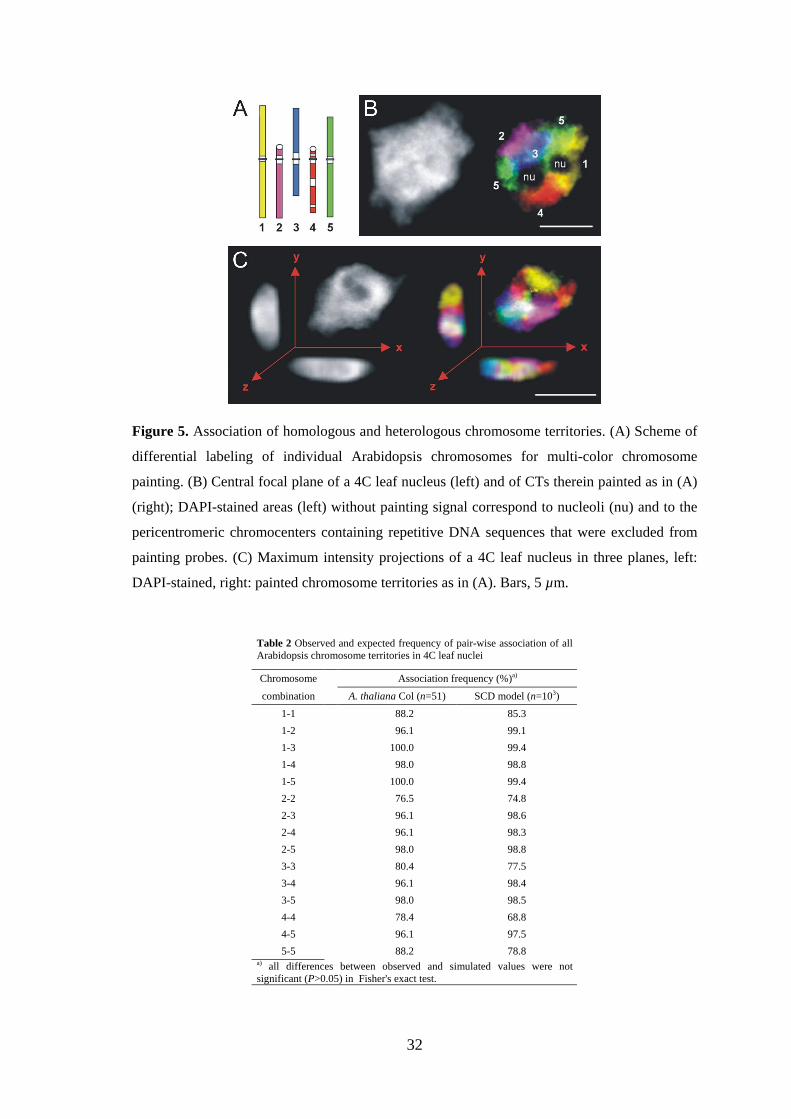
No obvious preference as to the radial arrangement of specific CTs was observed.
A large proportion of all CTs (preferentially the heterochromatic chromocenters)
touched the nuclear envelope. The lack of a specific radial arrangment of entire CTs is
most likely due to the low number and similar size of Arabidopsis chromosomes (The
Arabidopsis Genome Initiative 2000). However, to a certain extent radial positioning
might be present at subchromosomal level, since the heterochromatic pericentrometic
chromocenters are often located at the nuclear periphery, while telomeres cluster around
the nucleolus (Fransz et al. 2002).
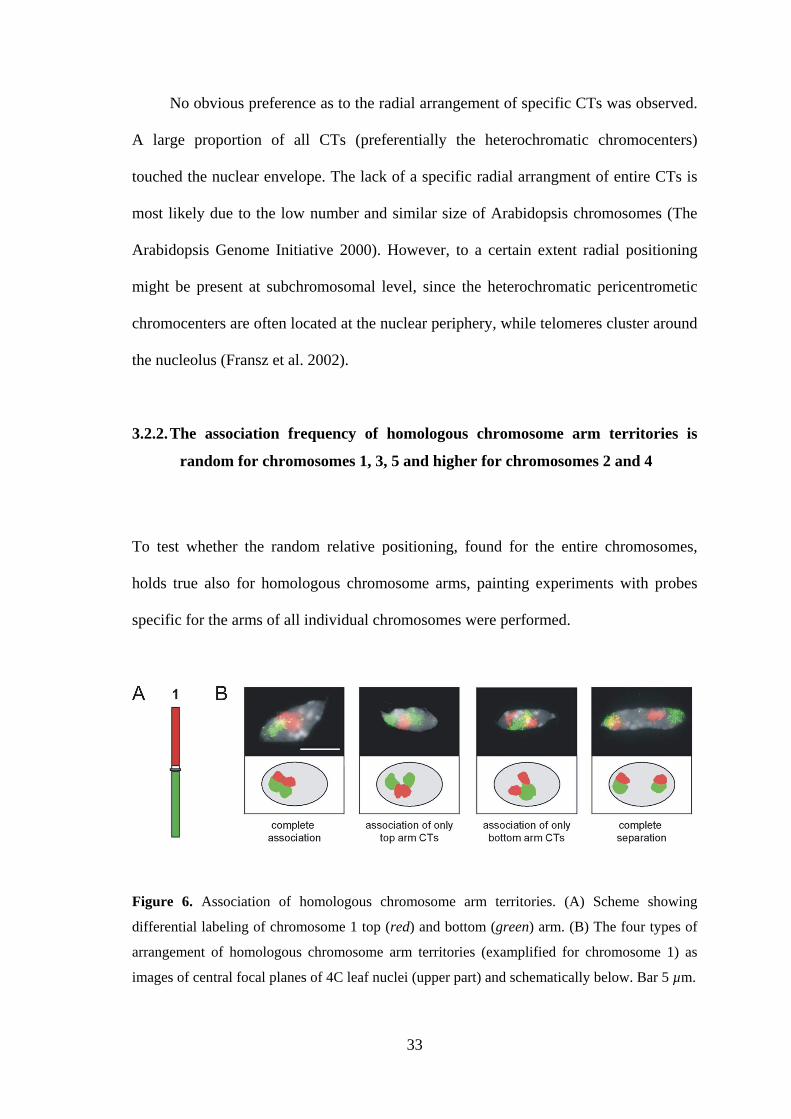
3.2.2. The association frequency of homologous chromosome arm territories is
random for chromosomes 1, 3, 5 and higher for chromosomes 2 and 4
To test whether the random relative positioning, found for the entire chromosomes,
holds true also for homologous chromosome arms, painting experiments with probes
specific for the arms of all individual chromosomes were performed.
Figure 6. Association of homologous chromosome arm territories. (A) Scheme showing
differential labeling of chromosome 1 top (red) and bottom (green) arm. (B) The four types of
arrangement of homologous chromosome arm territories (examplified for chromosome 1) as
images of central focal planes of 4C leaf nuclei (upper part) and schematically below. Bar 5 µm.
34
Either spatial association of both arms, of only the top arms, of only the bottom arms or
complete separation of homologous territories was distinguished and recorded (Figure
6). Simulations of random arrangement of homologous CTs were performed according
to the SCD model (Figure 2). Because in Arabidopsis roots and leaves three nuclear
shapes (flattened sphere, spindle, rod; Figure 1) occur frequently, independent
simulations were done (103 nuclei per shape) to test whether an influence of the nuclear
shape on CT arrangement is to be expected. Indeed, the simulations revealed an impact
of nuclear shape on the random association frequency of CTs. For the symmetric
chromosomes 1, 3, and 5 the computer model predicted association of entire
homologues in 48.3-59.9% of spheric nuclei, in contrast to only 20.6-23.6% of rod-
shaped nuclei. For the asymmetric chromosomes 2 and 4 the predicted values were
25.2-31.9% and 14.8-18.7%, respectively. Because of the predicted differences, we
merged the values simulated for different nuclear shapes by calculation of the weighted
average according to the proportion of evaluated spheric, spindle and rod-shaped nuclei
per experimental point [for original values of the observed and the predicted CT
association frequencies (according to the SCD model) for nuclei of different shape see
appendix: Tables 9 and 10]. These values were compared with the sum of values for all
shapes per experimental point (Table 3). The observed association frequency (Figure 6,
Table 3) did not significantly deviate from the SCD model prediction for random
arrangement in the case of chromosome 1. This was valid for the differently shaped
nuclei of 2C, 4C, and 8C DNA content from roots as well as from leaves.
Corresponding data were obtained for chromosomes 3 and 5 as studied in 4C leaf nuclei
(Table 3). Different observations were made for the smaller asymmetric chromosomes 2
and 4 with NORs at their top arm ends. For both these chromosomes the association of
entire homologues occurred significantly more often (P<0.001) and complete separation
less often than expected at random in all tested types of nuclei. This increase of
35
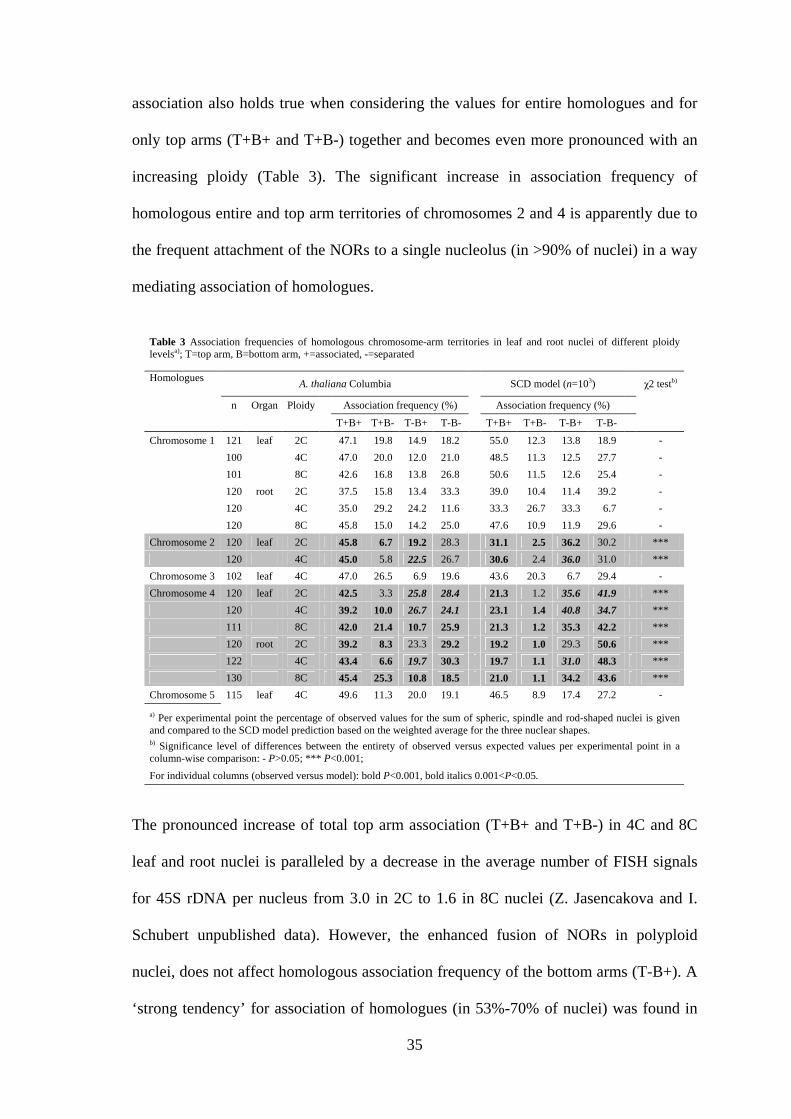
association also holds true when considering the values for entire homologues and for
only top arms (T+B+ and T+B-) together and becomes even more pronounced with an
increasing ploidy (Table 3). The significant increase in association frequency of
homologous entire and top arm territories of chromosomes 2 and 4 is apparently due to
the frequent attachment of the NORs to a single nucleolus (in >90% of nuclei) in a way
mediating association of homologues.
The pronounced increase of total top arm association (T+B+ and T+B-) in 4C and 8C
leaf and root nuclei is paralleled by a decrease in the average number of FISH signals
for 45S rDNA per nucleus from 3.0 in 2C to 1.6 in 8C nuclei (Z. Jasencakova and I.
Schubert unpublished data). However, the enhanced fusion of NORs in polyploid
nuclei, does not affect homologous association frequency of the bottom arms (T-B+). A
‘strong tendency’ for association of homologues (in 53%-70% of nuclei) was found in
Table 3 Association frequencies of homologous chromosome-arm territories in leaf and root nuclei of different ploidy levelsa); T=top arm, B=bottom arm, +=associated, -=separated
Homologues A. thaliana Columbia SCD model (n=103) χ2 testb)
n Organ Ploidy Association frequency (%) Association frequency (%)
T+B+ T+B- T-B+ T-B- T+B+ T+B- T-B+ T-B-
Chromosome 1 121 leaf 2C 47.1 19.8 14.9 18.2 55.0 12.3 13.8 18.9 -
100 4C 47.0 20.0 12.0 21.0 48.5 11.3 12.5 27.7 -
101 8C 42.6 16.8 13.8 26.8 50.6 11.5 12.6 25.4 -
120 root 2C 37.5 15.8 13.4 33.3 39.0 10.4 11.4 39.2 -
120 4C 35.0 29.2 24.2 11.6 33.3 26.7 33.3 6.7 -
120 8C 45.8 15.0 14.2 25.0 47.6 10.9 11.9 29.6 -
Chromosome 2 120 leaf 2C 45.8 6.7 19.2 28.3 31.1 2.5 36.2 30.2 ***
120 4C 45.0 5.8 22.5 26.7 30.6 2.4 36.0 31.0 ***
Chromosome 3 102 leaf 4C 47.0 26.5 6.9 19.6 43.6 20.3 6.7 29.4 -
Chromosome 4 120 leaf 2C 42.5 3.3 25.8 28.4 21.3 1.2 35.6 41.9 ***
120 4C 39.2 10.0 26.7 24.1 23.1 1.4 40.8 34.7 ***
111 8C 42.0 21.4 10.7 25.9 21.3 1.2 35.3 42.2 ***
120 root 2C 39.2 8.3 23.3 29.2 19.2 1.0 29.3 50.6 ***
122 4C 43.4 6.6 19.7 30.3 19.7 1.1 31.0 48.3 ***
130 8C 45.4 25.3 10.8 18.5 21.0 1.1 34.2 43.6 ***
Chromosome 5 115 leaf 4C 49.6 11.3 20.0 19.1 46.5 8.9 17.4 27.2 -
a) Per experimental point the percentage of observed values for the sum of spheric, spindle and rod-shaped nuclei is given and compared to the SCD model prediction based on the weighted average for the three nuclear shapes. b) Significance level of differences between the entirety of observed versus expected values per experimental point in a column-wise comparison: - P>0.05; *** P<0.001;
For individual columns (observed versus model): bold P<0.001, bold italics 0.001<P<0.05.
36
human Sertoli cells (Chandley et al. 1996). However, among the tested chromomsomes
only the acrocentric NOR-bearing chromosomes 13 and 21 showed a high frequency of
homologous association (50%) also in dividing lymphocytes, apparently due to
attachment of NORs at one nucleolus (Chandley et al. 1996).
In 8C nuclei, in general no more than two CTs were found per homologue. Also
the number of chromocenters (at maximum 14, i.e. 10 pericentromeres and 4 NORs, but
usually not more than 10, Fransz et al. 2002) did not significantly increase in >4C
nuclei. Both observations suggest that CTs of endoreduplicated chromatids are usually
not separated but remain associated, at least within the pericentromeric regions.
3.2.3. The relative position of a gene (FWA) within its CT does not necessarily
reflect the transcriptional state
After FISH with differently labeled probes for the chromosome 1 top arm territory and
for BAC T2P11 therein (probe contained BACs flanking BAC T2P11 directly from the
both sides) to 4C leaf nuclei (n=359), 12.8% of FISH signals for the BAC were
localized clearly outside the labeled CT. This surprising observation provoked the
question, whether the FISH signal for the corresponding BAC apart from the remaining
CT is due to an outlooping correlated with the transcriptional activity of genes in the
labelled region.
To test whether the transcriptional activity might have an impact on CT
organization, i.e. whether a transcribed gene occupies more often positions outside
compact CT than under silent condition, the flowering gene FWA residing in BAC
M7J2 and mapped to the bottom arm of chromosome 4 was chosen. In wild-type plants
(Ler) this gene is not expressed and strongly methylated, while it is constitutively
expressed and hypomethylated in leaf nuclei of the fwa-1 mutant (Soppe et al. 2000). In
37
2C leaf nuclei (n=337) of fwa-1 only 4.2% of FISH signals for BAC M7J2 were found
distal of the CT periphery (Figure 7A). A similar frequency (3.8%) of signals out-
looped from the CT was observed also for wild-type 2C leaf nuclei (n=368). In 4C
nuclei, out-looping of M7J2 signals occurred in 10.7% of fwa-1 nuclei (n=121) and in
6.5% of 230 wild-type nuclei (n=230). Although there is a tendency of more out-
looping in FWA-expressing 4C nuclei, the difference is not significant.
Thus, the position of a sequence relative to its CT (inside, at the edge or outside)
does not obviously depend on the transcriptional state of that sequence. This agrees with
the observations made on mammalian cells where active genes were found to be located
on the surface as well as in the interior of a CT and were not relocated when switching
the expression status (Mahy et al. 2002a). Therefore, transcriptional activity of a gene is
not necessarily a reasonable explanation for the relatively high frequency (12.8%) at
which the FISH signal for BAC T2P11 was found ‘outside’ the chromosome 1 top arm
territory. However, regions of ‘high gene density and transcription’ may frequently
extend from their territory (Mahy et al. 2002b) as already described for the major
histocompatibility complex region that may locate outside its CT depending on cell type
and gene activity (Volpi et al. 2000). The gene density along Arabidopsis chromosome
arms is rather uniform, but we cannot exclude that most of the 21 presumed genes of
BAC T2P11 are simultaneously expressed in nuclei showing this region apart from its
CT. The results obtained with BACs T2P11 and M7J2 imply that CTs do not always
have a smooth surface, i.e. outlooping of chromatin into interchromosomal space
(mimicking intermingling of CTs) might occur to some extent. (Preparation of
chromosome painting probes and approximately one half of FISH experiments
were done by A. Pecinka; the remaining part and microscopic evaluations were
done by V. Schubert).
38
3.2.4. Somatic pairing of homologous chromosome segments occurs at random
To analyze whether association of homologous CTs reflects strict allelic alignment
along chromosome pairs, the nuclear positions of ~100 kb chromosome segments
(average BAC insert size) were assessed by FISH. Simultaneous detection with
differentially labeled probes of the chromosome 1 top arm territory and of BAC T2P11
therein has shown that of 94 4C leaf nuclei with associated top arm territories only 7
also showed homologous pairing at the position of the T2P11 insert (one FISH signal
for T2P11, Figure 7B1). This indicates that association of homologues is not a
consequence of homologous alignment. (CP probes were prepared by A. Pecinka;
FISH and microscopic evaluation were done by V. Schubert).
Pairing was further analysed for different regions on chromosomes 1, 3 and 4
using either single BACs or two differently labeled adjacent BACs for FISH (Figure
7C). A single compact signal site per nucleus was regarded as single-point pairing in
contrast to clearly separated signals indicating the absence of pairing (Figure 7D1,2). In
addition, in some experiments (Table 4) nuclei that contained dispersed signals of
spheric shape or separated compact signals with a distance less than the signal diameter
(Figure 7D3) were scored. Such nuclei were considered to represent a loose signal
association indicating spatial vicinity but not necessarily allelic alignment of
homologous segments. The RSD model simulations of 106 2C and 4C root and leaf
nuclei, respectively, predicted a random frequency of 5.9-7.8% of nuclei with
homologous pairing (Table 4). In contrast to the situation described for association of
CTs, computer simulations revealed no significant differences as to the random
expectation of single-point pairing for the three predominant nuclear shapes (sphere,
spindle, rod). The reason is presumably that FISH signals for ~100 kb segments occupy
a much smaller proportion of the nuclear volume and therefore cause less spatial
39
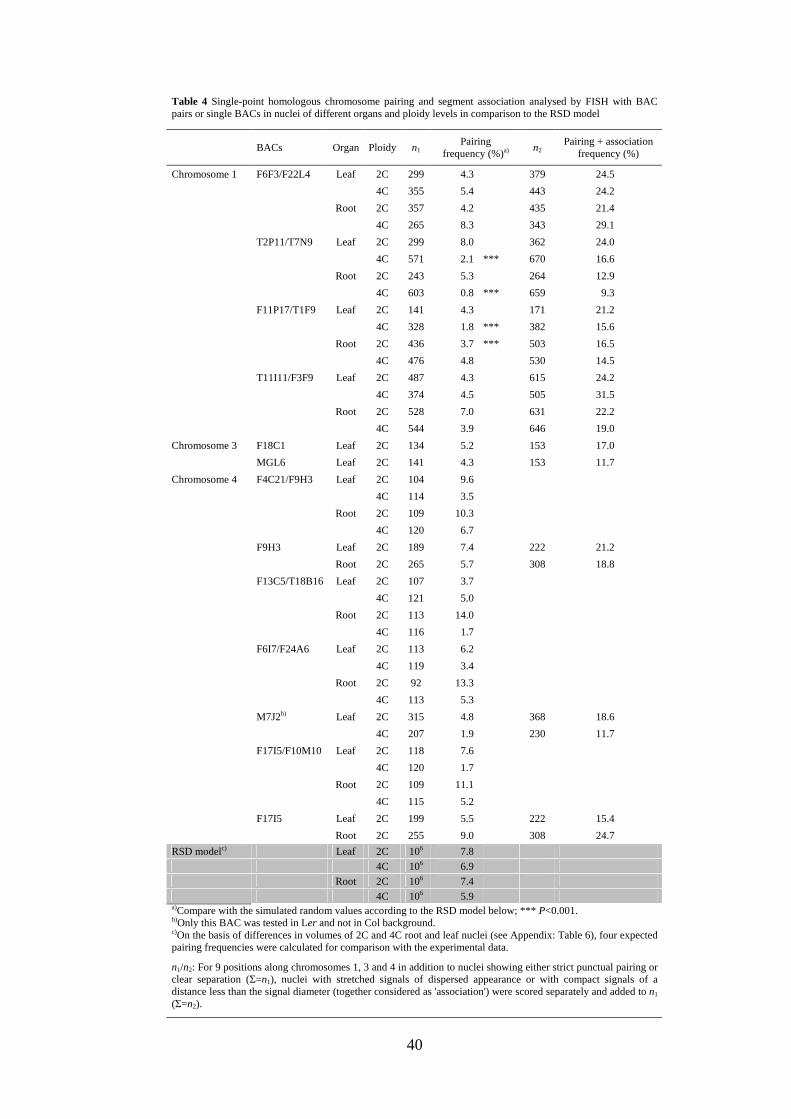
constraints than do CTs. The observed frequency of nuclei showing single-point pairing
at the tested positions (0.8-14.0%; on average 4.9%; Table 4) was 7-10 times lower than
that for association of both arms of the corresponding homologous pair (35.0-49.6%;
Table 4).
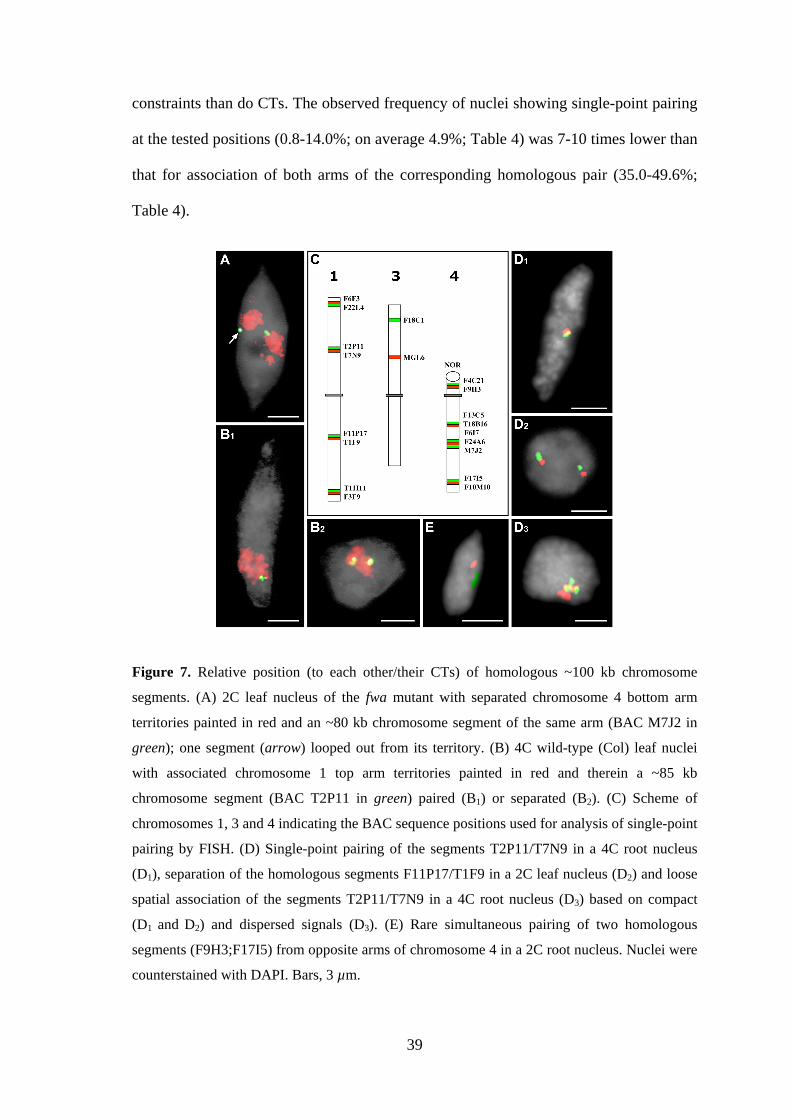
Figure 7. Relative position (to each other/their CTs) of homologous ~100 kb chromosome
segments. (A) 2C leaf nucleus of the fwa mutant with separated chromosome 4 bottom arm
territories painted in red and an ~80 kb chromosome segment of the same arm (BAC M7J2 in
green); one segment (arrow) looped out from its territory. (B) 4C wild-type (Col) leaf nuclei
with associated chromosome 1 top arm territories painted in red and therein a ~85 kb
chromosome segment (BAC T2P11 in green) paired (B1) or separated (B2). (C) Scheme of
chromosomes 1, 3 and 4 indicating the BAC sequence positions used for analysis of single-point
pairing by FISH. (D) Single-point pairing of the segments T2P11/T7N9 in a 4C root nucleus
(D1), separation of the homologous segments F11P17/T1F9 in a 2C leaf nucleus (D2) and loose
spatial association of the segments T2P11/T7N9 in a 4C root nucleus (D3) based on compact
(D1 and D2) and dispersed signals (D3). (E) Rare simultaneous pairing of two homologous
segments (F9H3;F17I5) from opposite arms of chromosome 4 in a 2C root nucleus. Nuclei were
counterstained with DAPI. Bars, 3 µm.
40
Table 4 Single-point homologous chromosome pairing and segment association analysed by FISH with BAC pairs or single BACs in nuclei of different organs and ploidy levels in comparison to the RSD model
BACs Organ Ploidy n1 Pairing
frequency (%)a) n2
Pairing + association frequency (%)
Chromosome 1 F6F3/F22L4 Leaf 2C 299 4.3 379 24.5
4C 355 5.4 443 24.2
Root 2C 357 4.2 435 21.4
4C 265 8.3 343 29.1
T2P11/T7N9 Leaf 2C 299 8.0 362 24.0
4C 571 2.1 *** 670 16.6
Root 2C 243 5.3 264 12.9
4C 603 0.8 *** 659 9.3
F11P17/T1F9 Leaf 2C 141 4.3 171 21.2
4C 328 1.8 *** 382 15.6
Root 2C 436 3.7 *** 503 16.5
4C 476 4.8 530 14.5
T11I11/F3F9 Leaf 2C 487 4.3 615 24.2
4C 374 4.5 505 31.5
Root 2C 528 7.0 631 22.2
4C 544 3.9 646 19.0
Chromosome 3 F18C1 Leaf 2C 134 5.2 153 17.0
MGL6 Leaf 2C 141 4.3 153 11.7
Chromosome 4 F4C21/F9H3 Leaf 2C 104 9.6
4C 114 3.5
Root 2C 109 10.3
4C 120 6.7
F9H3 Leaf 2C 189 7.4 222 21.2
Root 2C 265 5.7 308 18.8
F13C5/T18B16 Leaf 2C 107 3.7
4C 121 5.0
Root 2C 113 14.0
4C 116 1.7
F6I7/F24A6 Leaf 2C 113 6.2
4C 119 3.4
Root 2C 92 13.3
4C 113 5.3
M7J2b) Leaf 2C 315 4.8 368 18.6
4C 207 1.9 230 11.7
F17I5/F10M10 Leaf 2C 118 7.6
4C 120 1.7
Root 2C 109 11.1
4C 115 5.2
F17I5 Leaf 2C 199 5.5 222 15.4
Root 2C 255 9.0 308 24.7
RSD modelc) Leaf 2C 106 7.8
4C 106 6.9
Root 2C 106 7.4
4C 106 5.9 a)Compare with the simulated random values according to the RSD model below; *** P<0.001. b)Only this BAC was tested in Ler and not in Col background. c)On the basis of differences in volumes of 2C and 4C root and leaf nuclei (see Appendix: Table 6), four expected pairing frequencies were calculated for comparison with the experimental data.
n1/n2: For 9 positions along chromosomes 1, 3 and 4 in addition to nuclei showing either strict punctual pairing or clear separation (Σ=n1), nuclei with stretched signals of dispersed appearance or with compact signals of a distance less than the signal diameter (together considered as 'association') were scored separately and added to n1 (Σ=n2).
41
Compared to pairing, a signal association is up to 10 times more frequent. Adding
the number of nuclei showing single-point pairing to that showing loose association
revealed that, depending on the chromosomal position, within 9.3 to 31.5% of nuclei
allelic sequences occur in a close spatial proximity (Table 4). Regardless of the
chromosomal position, pairing was not observed significantly more often than expected
at random according to the RSD model. No significant differences were found between
leaf and root nuclei irrespective of the ploidy level (tested for chromosomes 1 and 4).
Thus, in A. thaliana nuclei somatic pairing is the exception rather than the rule. The
opposite has been shown for Drosophila melanogaster with homologous pairing in
60%-90% of somatic nuclei from the 13th embryonic cell cycle on (Csink and Henikoff
1998; Fung et al. 1998). The comparison of Arabidopsis and Drosophila shows that
similarity in genome size, sequence organization and chromosome number does not
necessarily cause an identical CT arrangement. of the constraints as to the chromatin
dynamics within interphase nuclei of all tested organisms, a certain flexibility of
chromatin positions has been found (for review see Lam et al. 2004). The average
movement of GFP-tagged chromatin loci is ~0.085µm/min (Kato and Lam 2003).
Therefore, at least in nuclei that show either single-point pairing or close association of
allelic sequences, these allelic sequences might occupy nuclear positions sufficiently
close for homologous recombination (for instance in the course of double strand break
repair), in spite of the lack of a regular and contiguous alignment of homologues.
For chromosome 1 the positional proximity of allelic sequences (single-point
pairing and segment association together) was less pronounced at interstitial loci (15.0%
on top arm; 16.1% on bottom arm) than at distal loci (24.6% on top arm; 23.8% on
bottom arm) when all data from 2C and 4C, leaf and root nuclei were pooled (P<0.001).
This agrees with the clustering of telomeric regions around the nucleolus (Fransz et al.
2002).
42
Simultaneous FISH of two BACs located distantly on a chromosome showed
that homologous pairing has indeed only single point character and does not involve
entire chromosomes (tested for four independent combinations: F6F3 and T11I11;
T7N9 and F11P17; F18C1 and MGL6; F9H3 and F17I5; Figure 7C). Only three (0.2%)
out of 1240 tested nuclei showed simultaneous pairing at two distant loci (Figure 7E).
(Experiments with BACs from chromosome 1 and approximately one-third of
experiment with BACs from chromosome 4 were done by V. Schubert;
experiments assessing pairing of BACs from chromosome 4 were performed by M.
Klatte; experiments with BACs from chromosome 3 were done by A. Pecinka.)
3.2.5. The frequency of somatic homologous pairing is not altered in Arabidopsis
mutants with an increased frequency of somatic homologous recombination
Intermolecular recombination plays an important role in DNA repair of somatic cells
and is essential for the elimination of damaged DNA. To study the frequency of
intermolecular recombination events between homologous chromosomes and sister
chromatids, transgenic Arabidopsis lines carrying a specially designed recombination
trap consisting of disrupted a β-glucuronidase reporter gene in a direct repeat orientation
were generated (Molinier et al. 2004). In case of a recombination event between the
direct repeats of a marker gene, a functional reporter gene is restored. Three mutant
lines B71, W92 and P8I24 displayed a significantly (>40-fold) increased frequency of
somatic homologous recombination in comparison to the control line IC9 (J. Molinier
and B. Hohn, unpublished data). Similar results were obtained for the Atp150caf-1
mutant with a T-DNA insertion in the middle of the AtCAF-1 encoding region. This
mutant showed a >100-fold increased frequency of somatic homologous recombination
43
compared to the control line C24 (Kyryk, Pecinka, Wendeler, Kemper and Reiss,
manuscript in prep.).
These results together led to the question, whether the higher frequency of
somatic homologous recombination found in B71, W92, P8I24 and Atp150caf-1 might
be due to a generally increased pairing frequency between homologues, or rather to an
intensified search for homology to repair induced or spontaneous DNA damage. To
elucidate this issue, the single-point pairing frequency was addressed by FISH in 2C
leaf nuclei of hyperrecombination mutants and their control lines. The attempt to assess
pairing frequency directly at the transgenic locus was not possibel because of: (i) the
relatively small size of T-DNA construct (only 5.6 kb), which did not allow a reliable
microscopic detection of FISH signals and (ii) the unknown position of the transgene in
the genome which excluded the use of a neighboring BAC insert as a probe. Therefore,
the analyses were performed with two BACs, F18C1 and MGL6 (see parts 3.2.4. and
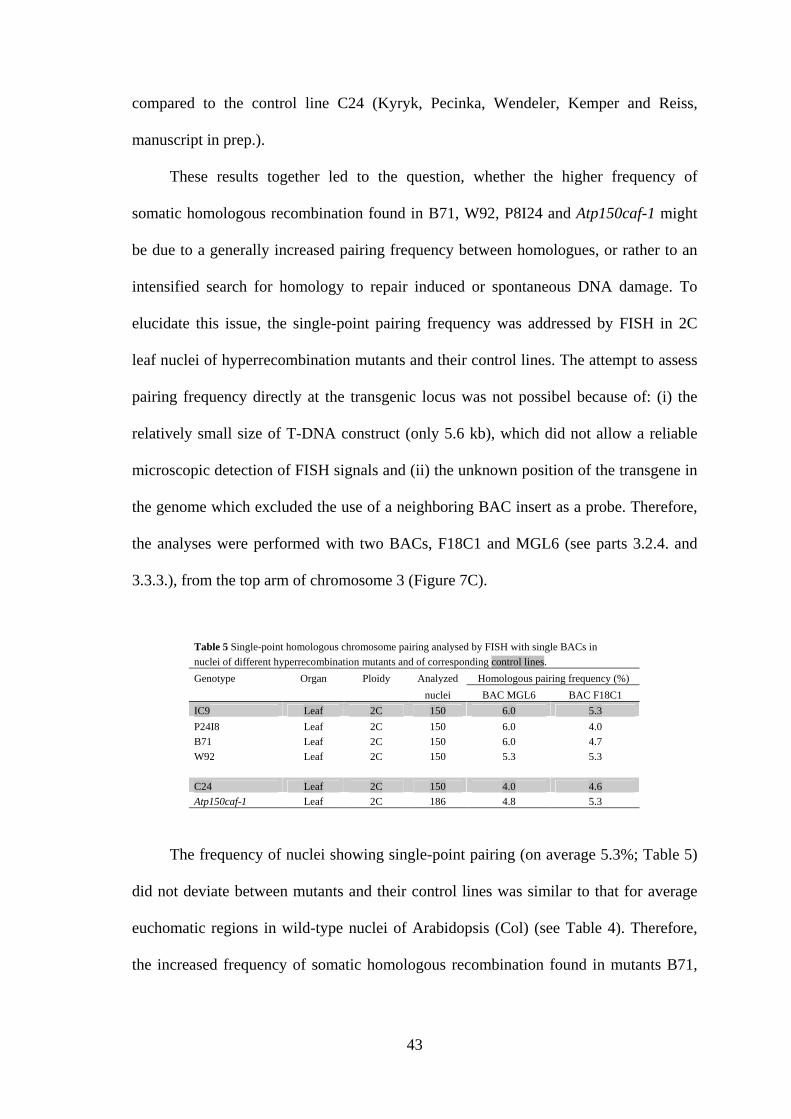
3.3.3.), from the top arm of chromosome 3 (Figure 7C).
Table 5 Single-point homologous chromosome pairing analysed by FISH with single BACs in nuclei of different hyperrecombination mutants and of corresponding control lines.
Genotype Organ Ploidy Analyzed Homologous pairing frequency (%)
nuclei BAC MGL6 BAC F18C1
IC9 Leaf 2C 150 6.0 5.3
P24I8 Leaf 2C 150 6.0 4.0
B71 Leaf 2C 150 6.0 4.7
W92 Leaf 2C 150 5.3 5.3
C24 Leaf 2C 150 4.0 4.6
Atp150caf-1 Leaf 2C 186 4.8 5.3
The frequency of nuclei showing single-point pairing (on average 5.3%; Table 5)
did not deviate between mutants and their control lines was similar to that for average
euchomatic regions in wild-type nuclei of Arabidopsis (Col) (see Table 4). Therefore,
the increased frequency of somatic homologous recombination found in mutants B71,
44
W92, P8I24 and Atp150caf-1 is not associated with an elevated frequency of somatic
homologous pairing.
The data from b-glucuronidase assay suggest that homologous chromosomes as
well as sister chromatids, can be used as a substrate for somatic homologous
recombination in Arabidopsis nuclei (Molinier et al. 2004). Interestingly, sister
chromatids are used 2-3 times more often for somatic recombinational repair than
homologous chromosomes (Molinier et al. 2004). The frequent use of homologues in
somatic recombination is in contrast to the low frequency of somatic homologous
pairing in Arabidopsis nuclei and suggests a mechanism leading to an intensified search
for homology after induced or spontaneous DNA damage. Such a search could be
catalyzed in Arabidopsis by some protein(s) from the RAD52 epistasis group [i.e.
RAD51, RAD52, RAD54, RAD55, RAD57 and the MRN (MRE11-RAD50-NBS1
complex)] (West et al. 2004).
3.2.6. Conclusions as to the arrangement of interphase CTs and somatic
homologous pairing
Using chromosome specific painting probes, arrangement and dynamics of all
Arabidopsis interphase CTs was studied in 2C, 4C and 8C nuclei isolated from roots
and leaves. Individual CTs were found to be frequently associated with any other CTs.
However, this arrangement corresponds to the computer model prediction for random
CT arrangement and is most likely due to the low number of Arabidopsis chromosomes
(2n=10). The only exceptions are the NOR-bearing top arms of chromosomes 2 and 4,
which associate more frequently than expected at random. This is probably caused by
frequent attachment of NORs to a single nucleolus (in >90% of Arabidopsis nuclei),
which mediates association of homologous NOR-bearing chromosome arms and of
45
entire homologoues. In general, this arrangement was consistent in all investigated types
of nuclei. Furthermore, the relative position of a gene (FWA) within its CT (inside or at
the periphery) does not obviously correlate with its transcriptional state. Somatic
homologous pairing occurred on an average in 4.9% of Arabidopis nuclei. This is in
agreement with the computer model prediction for random positional pairing frequency
(5.9-7.8%). Only in 0.2% of nuclei, simultaneous homologous pairing of two segments
at distant chromosomal positions was found. Thus, homologous pairing has only single-
point character and long range homologous alignment seems to be the exception rather
than the rule in Arabidopsis nuclei. No significant differences as to the frequency of
homologous pairing were found in Arabidopsis mutants with an increased frequency of
somatic homologous recombination. This suggests that the observed increase in
recombination frequency is rather due to more intensified search for homology after
DNA damage than to gross alterations of nuclear organization.
The comparison of Arabidopsis and Drosophila (the latter species is characterized
by frequent somatic homologous pairing) shows that similarity in genome size,
sequence organization and chromosome number does not necessarily cause an identical
arrangement of interphase chromosomes. Therefore, the arrangement of Arabidopsis
CTs seems to be more similar to that found in nuclei of non-cycling mammalian cells
that are characterized by predominantly random relative positioning of CTs (Cornforth
et al. 2002). However, in contrast to nuclei of vertebrates, no pronounced radial
arrangement of CTs could be found in Arabidopsis. This is apparently due to the small
number of Arabidopsis chromosomes and their similar gene density.
46
3.3. Alteration of the local interphase chromosome arrangement by
tandem repetitive trangenes and fluorescent chromatin tags
3.3.1. GFP spot numbers vary in 2C live nuclei of homozygous transgenic plants
(EL702C) harboring two tagged loci on the top arm of chromosome 3
The transgenic Arabidopsis line EL702C carries three lac operator/GFP-lacI-NLS
transgenes (~17 kb each) inserted at two independent loci on the top arm of chromosome
3, ~4.2 Mb apart from each other (Figure 8A). The proximal locus harbors two
transgenes in inverse orientation.
In live 2C guard cell nuclei of homozygous EL702C plants, Kato and Lam (2003)
only rarely observed four GFP spots. For statistical evaluation, they counted GFP spot
numbers in live guard cell nuclei of cotyledons of hemizygous and homozygous EL702C
plants and of homozygous EL700S plants (Figure 8B,C). Since EL700S plants contain
the same construct as EL702C plants except for the lac operator array, homogeneously
distributed GFP signals but no GFP spots were expected in the nucleoplasm. In
hemizygous EL702C plants Kato and Lam (published in Pecinka et al. 2005) found
5% of 92 nuclei without spots, 66% with one spot, 27% with two and 2% with three
spots. In homozygous EL702C plants 12% of 197 nuclei were without spot, 34% showed
one spot, 37% two, 11% three and 6% four spots. In homozygous EL700S plants, 55 out
of 56 nuclei showed no, and one nucleus (<2%) showed one spot. The single spot
observed in an EL700S nucleus and a third spot in two hemizygous EL702C nuclei were
most likely caused by spontaneous aggregation of GFP-lac repressor-NLS molecules. The
absence of GFP spots in some EL702C nuclei might be due to a high level of unbound
GFP-lac repressor-NLS protein yielding a strong overall fluorescence intensity that
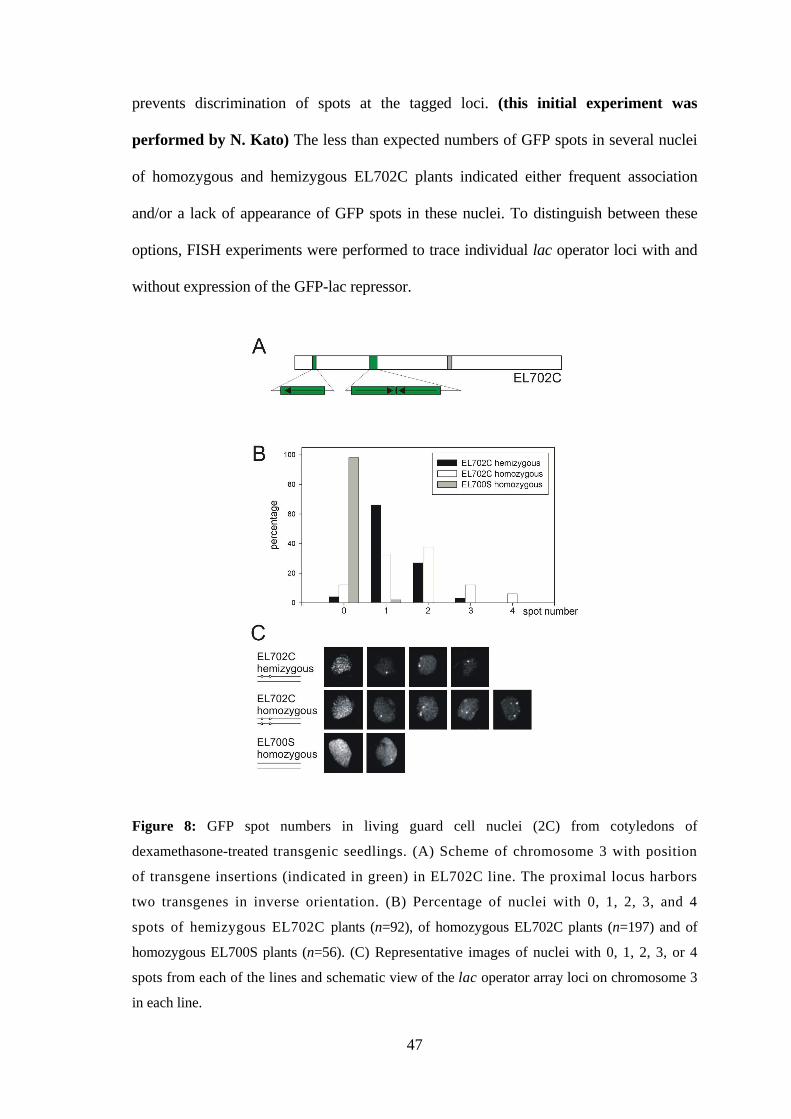
47
prevents discrimination of spots at the tagged loci. (this initial experiment was
performed by N. Kato) The less than expected numbers of GFP spots in several nuclei
of homozygous and hemizygous EL702C plants indicated either frequent association
and/or a lack of appearance of GFP spots in these nuclei. To distinguish between these
options, FISH experiments were performed to trace individual lac operator loci with and
without expression of the GFP-lac repressor.
Figure 8: GFP spot numbers in living guard cell nuclei (2C) from cotyledons of
dexamethasone-treated transgenic seedlings. (A) Scheme of chromosome 3 with position
of transgene insertions (indicated in green) in EL702C line. The proximal locus harbors
two transgenes in inverse orientation. (B) Percentage of nuclei with 0, 1, 2, 3, and 4
spots of hemizygous EL702C plants (n=92), of homozygous EL702C plants (n=197) and of
homozygous EL700S plants (n=56). (C) Representative images of nuclei with 0, 1, 2, 3, or 4
spots from each of the lines and schematic view of the lac operator array loci on chromosome 3
in each line.
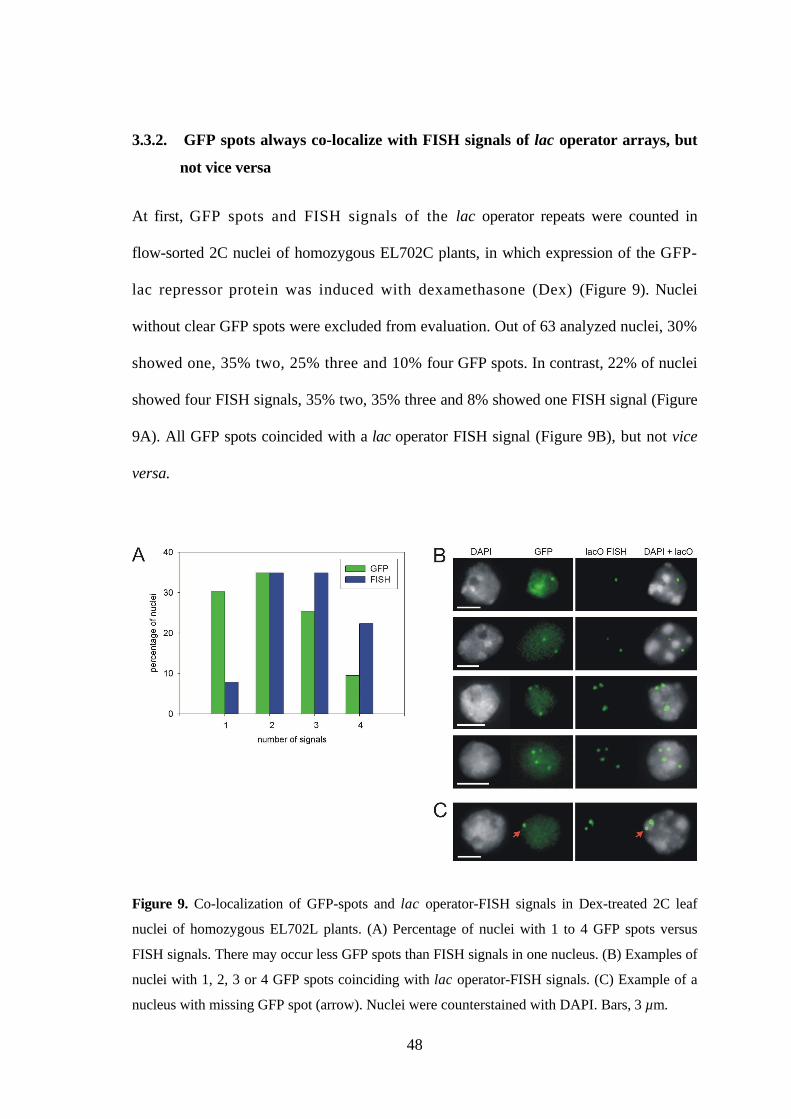
48
3.3.2. GFP spots always co-localize with FISH signals of lac operator arrays, but
not vice versa
At first, GFP spots and FISH signals of the lac operator repeats were counted in
flow-sorted 2C nuclei of homozygous EL702C plants, in which expression of the GFP-
lac repressor protein was induced with dexamethasone (Dex) (Figure 9). Nuclei
without clear GFP spots were excluded from evaluation. Out of 63 analyzed nuclei, 30%
showed one, 35% two, 25% three and 10% four GFP spots. In contrast, 22% of nuclei
showed four FISH signals, 35% two, 35% three and 8% showed one FISH signal (Figure
9A). All GFP spots coincided with a lac operator FISH signal (Figure 9B), but not vice
versa.
Figure 9. Co-localization of GFP-spots and lac operator-FISH signals in Dex-treated 2C leaf
nuclei of homozygous EL702L plants. (A) Percentage of nuclei with 1 to 4 GFP spots versus
FISH signals. There may occur less GFP spots than FISH signals in one nucleus. (B) Examples of
nuclei with 1, 2, 3 or 4 GFP spots coinciding with lac operator-FISH signals. (C) Example of a
nucleus with missing GFP spot (arrow). Nuclei were counterstained with DAPI. Bars, 3 µm.
49
In total 83% out of 252 FISH signals coincided with a GFP signal. Thus, 17% of the
transgene loci cannot be detected by a GFP spot in Dex-treated homozygous EL702C
nuclei under the applied conditions (Figure 9C). Apparently, some GFP spots could
not be discriminated because of high overall fluorescence intensity and/or rapid
bleaching of signals within a minute of exposure. Less than 4 FISH signals per nucleus
may be most likely due to ectopic or allelic alignment of the lac operator arrays.
3.3.3. Lac operator arrays pair more often than random in nuclei of transgenic
plants and thus enhance pairing frequency of adjacent endogenous regions
To test whether the lower than expected number of signals for lac operator arrays is
indeed due to homologous pairing, FISH experiments with the lac operator array and
BACs flanking the transgenic loci were conducted. The pairing frequency of the lac
operator arrays was assessed by tri-color FISH with BAC MGL6 (79.5 kb, ~54 kb
downstream of the insertion, red) flanking the distal locus, BAC F18C1 (100.8 kb, ~55
kb upstream of the insertion, yellow) flanking the proximal locus and lac operator probe
(green) (Figure10B-D), in 60 hemizygous untreated, 62 homozygous untreated and 59
homozygous Dex-treated EL702C nuclei. The lac operator array alignments were
classified as two different types of homologous pairing. If two signals (MGL6, red and
F18C1, yellow) co-localized with a lac operator signal (green), the alignment was
identified as ectopic pairing. If all signals of either MGL6 or F18C were co-localized with a
lac operator signal, the alignment was identified as allelic pairing. In hemizygous nuclei,
ectopic pairing was detected for 13% of the lac operator loci without Dex-treatment. In
homozygous EL702C nuclei without Dex-treatment, ectopic pairing was observed for
27% of the lac operator array loci and allelic pairing for 34% of the loci. After Dex-
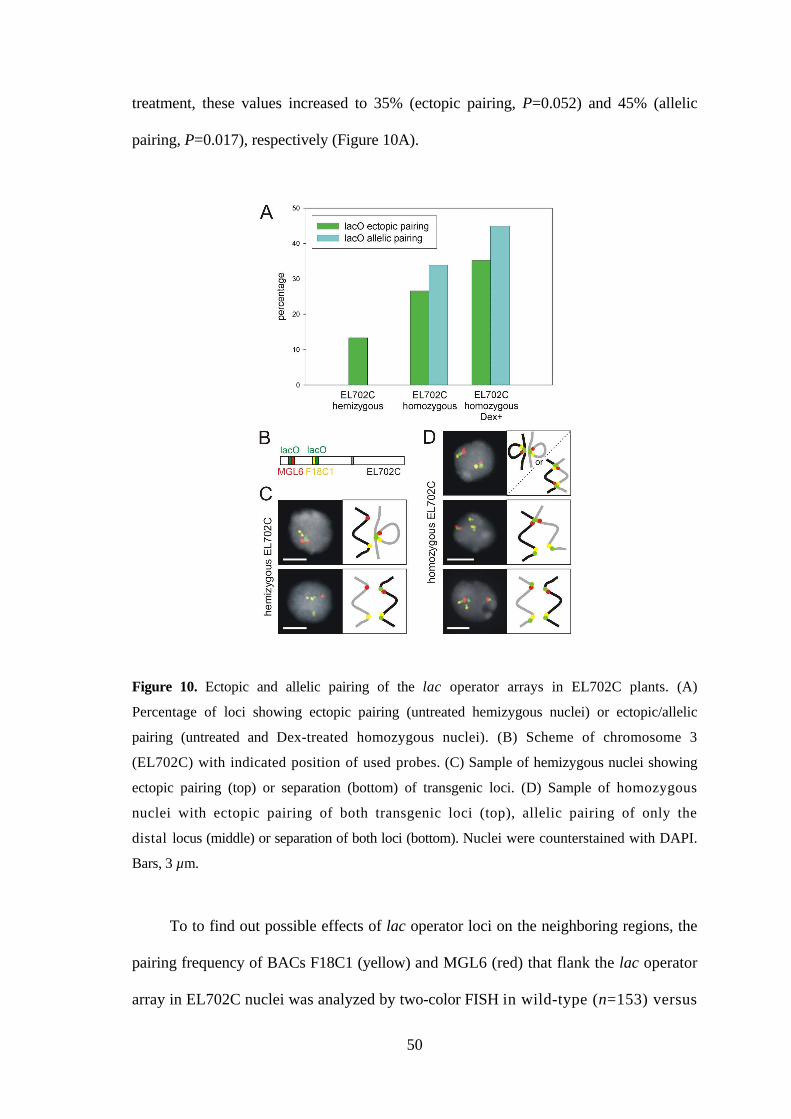
50
treatment, these values increased to 35% (ectopic pairing, P=0.052) and 45% (allelic
pairing, P=0.017), respectively (Figure 10A).
Figure 10. Ectopic and allelic pairing of the lac operator arrays in EL702C plants. (A)
Percentage of loci showing ectopic pairing (untreated hemizygous nuclei) or ectopic/allelic
pairing (untreated and Dex-treated homozygous nuclei). (B) Scheme of chromosome 3
(EL702C) with indicated position of used probes. (C) Sample of hemizygous nuclei showing
ectopic pairing (top) or separation (bottom) of transgenic loci. (D) Sample of homozygous
nuclei with ectopic pairing of both transgenic loci (top), allelic pairing of only the
distal locus (middle) or separation of both loci (bottom). Nuclei were counterstained with DAPI.
Bars, 3 µm.
To to find out possible effects of lac operator loci on the neighboring regions, the
pairing frequency of BACs F18C1 (yellow) and MGL6 (red) that flank the lac operator
array in EL702C nuclei was analyzed by two-color FISH in wild-type (n=153) versus
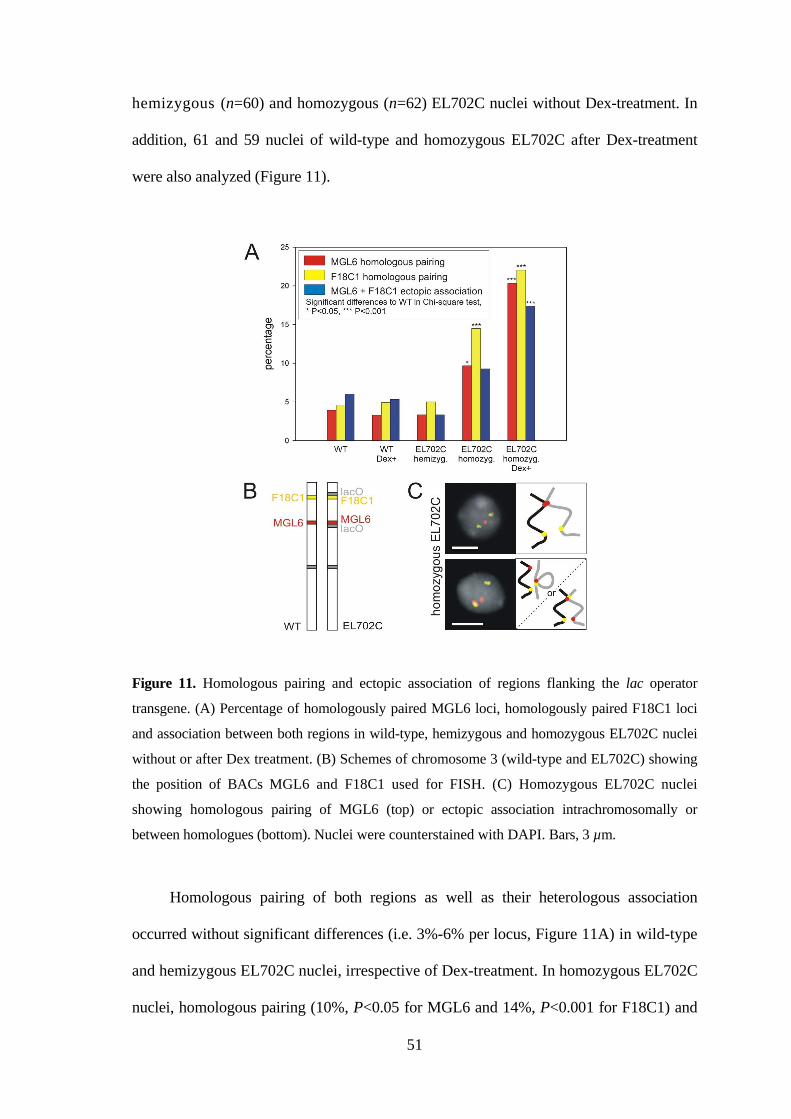
51
hemizygous (n=60) and homozygous (n=62) EL702C nuclei without Dex-treatment. In
addition, 61 and 59 nuclei of wild-type and homozygous EL702C after Dex-treatment
were also analyzed (Figure 11).
Figure 11. Homologous pairing and ectopic association of regions flanking the lac operator
transgene. (A) Percentage of homologously paired MGL6 loci, homologously paired F18C1 loci
and association between both regions in wild-type, hemizygous and homozygous EL702C nuclei
without or after Dex treatment. (B) Schemes of chromosome 3 (wild-type and EL702C) showing
the position of BACs MGL6 and F18C1 used for FISH. (C) Homozygous EL702C nuclei
showing homologous pairing of MGL6 (top) or ectopic association intrachromosomally or
between homologues (bottom). Nuclei were counterstained with DAPI. Bars, 3 µm.
Homologous pairing of both regions as well as their heterologous association
occurred without significant differences (i.e. 3%-6% per locus, Figure 11A) in wild-type
and hemizygous EL702C nuclei, irrespective of Dex-treatment. In homozygous EL702C
nuclei, homologous pairing (10%, P<0.05 for MGL6 and 14%, P<0.001 for F18C1) and
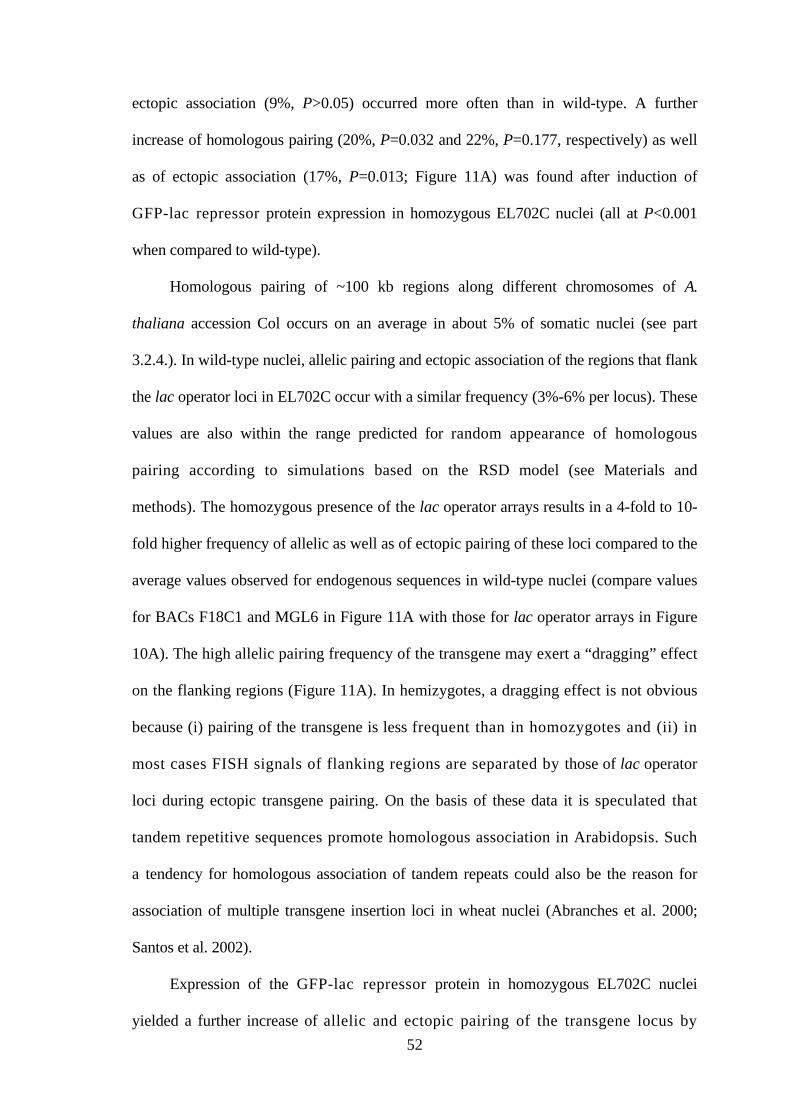
52
ectopic association (9%, P>0.05) occurred more often than in wild-type. A further
increase of homologous pairing (20%, P=0.032 and 22%, P=0.177, respectively) as well
as of ectopic association (17%, P=0.013; Figure 11A) was found after induction of
GFP-lac repressor protein expression in homozygous EL702C nuclei (all at P<0.001
when compared to wild-type).
Homologous pairing of ~100 kb regions along different chromosomes of A.
thaliana accession Col occurs on an average in about 5% of somatic nuclei (see part
3.2.4.). In wild-type nuclei, allelic pairing and ectopic association of the regions that flank
the lac operator loci in EL702C occur with a similar frequency (3%-6% per locus). These
values are also within the range predicted for random appearance of homologous
pairing according to simulations based on the RSD model (see Materials and
methods). The homozygous presence of the lac operator arrays results in a 4-fold to 10-
fold higher frequency of allelic as well as of ectopic pairing of these loci compared to the
average values observed for endogenous sequences in wild-type nuclei (compare values
for BACs F18C1 and MGL6 in Figure 11A with those for lac operator arrays in Figure
10A). The high allelic pairing frequency of the transgene may exert a “dragging” effect
on the flanking regions (Figure 11A). In hemizygotes, a dragging effect is not obvious
because (i) pairing of the transgene is less frequent than in homozygotes and (ii) in
most cases FISH signals of flanking regions are separated by those of lac operator
loci during ectopic transgene pairing. On the basis of these data it is speculated that
tandem repetitive sequences promote homologous association in Arabidopsis. Such
a tendency for homologous association of tandem repeats could also be the reason for
association of multiple transgene insertion loci in wheat nuclei (Abranches et al. 2000;
Santos et al. 2002).
Expression of the GFP-lac repressor protein in homozygous EL702C nuclei
yielded a further increase of allelic and ectopic pairing of the transgene locus by
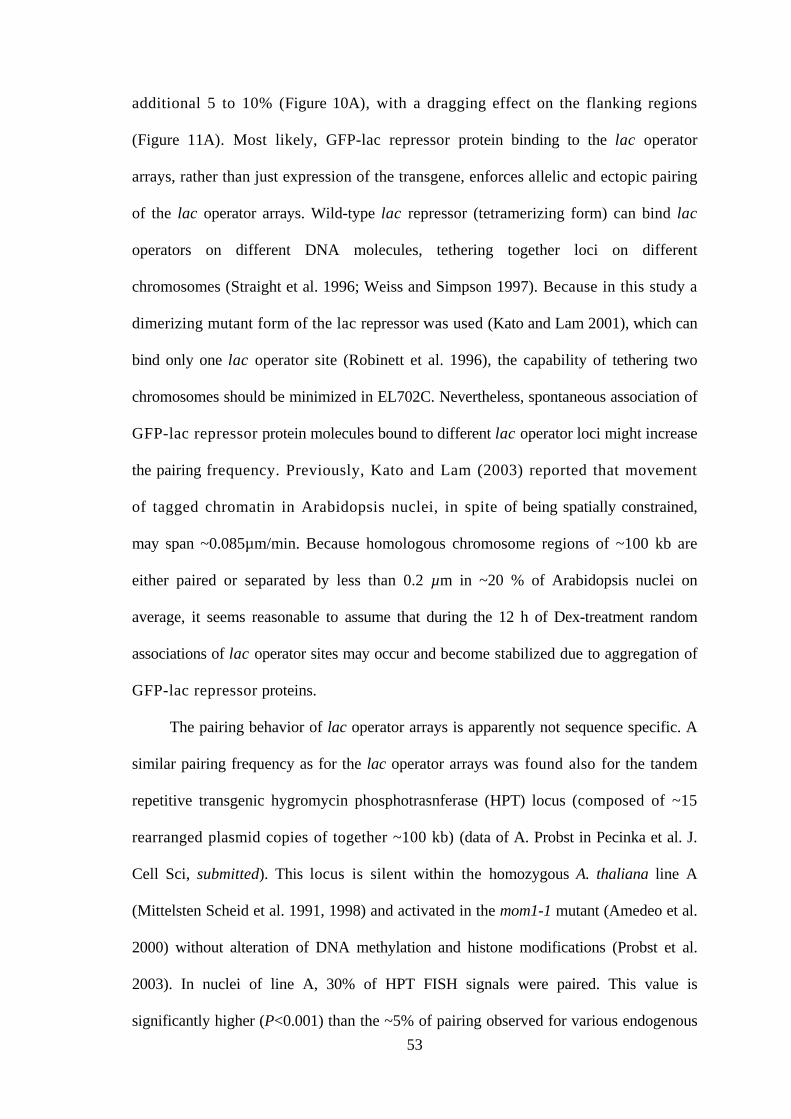
53
additional 5 to 10% (Figure 10A), with a dragging effect on the flanking regions
(Figure 11A). Most likely, GFP-lac repressor protein binding to the lac operator
arrays, rather than just expression of the transgene, enforces allelic and ectopic pairing
of the lac operator arrays. Wild-type lac repressor (tetramerizing form) can bind lac
operators on different DNA molecules, tethering together loci on different
chromosomes (Straight et al. 1996; Weiss and Simpson 1997). Because in this study a
dimerizing mutant form of the lac repressor was used (Kato and Lam 2001), which can
bind only one lac operator site (Robinett et al. 1996), the capability of tethering two
chromosomes should be minimized in EL702C. Nevertheless, spontaneous association of
GFP-lac repressor protein molecules bound to different lac operator loci might increase
the pairing frequency. Previously, Kato and Lam (2003) reported that movement
of tagged chromatin in Arabidopsis nuclei, in spite of being spatially constrained,
may span ~0.085µm/min. Because homologous chromosome regions of ~100 kb are
either paired or separated by less than 0.2 µm in ~20 % of Arabidopsis nuclei on
average, it seems reasonable to assume that during the 12 h of Dex-treatment random
associations of lac operator sites may occur and become stabilized due to aggregation of
GFP-lac repressor proteins.
The pairing behavior of lac operator arrays is apparently not sequence specific. A
similar pairing frequency as for the lac operator arrays was found also for the tandem
repetitive transgenic hygromycin phosphotrasnferase (HPT) locus (composed of ~15
rearranged plasmid copies of together ~100 kb) (data of A. Probst in Pecinka et al. J.
Cell Sci, submitted). This locus is silent within the homozygous A. thaliana line A
(Mittelsten Scheid et al. 1991, 1998) and activated in the mom1-1 mutant (Amedeo et al.
2000) without alteration of DNA methylation and histone modifications (Probst et al.
2003). In nuclei of line A, 30% of HPT FISH signals were paired. This value is
significantly higher (P<0.001) than the ~5% of pairing observed for various endogenous
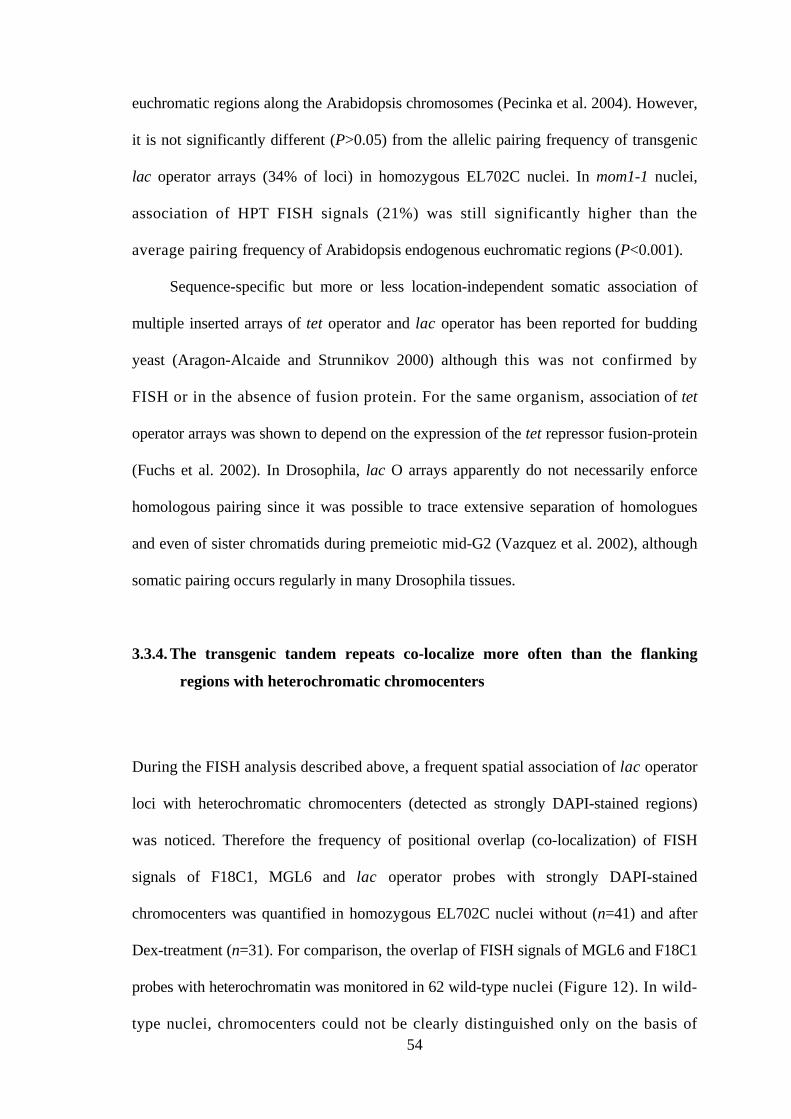
54
euchromatic regions along the Arabidopsis chromosomes (Pecinka et al. 2004). However,
it is not significantly different (P>0.05) from the allelic pairing frequency of transgenic
lac operator arrays (34% of loci) in homozygous EL702C nuclei. In mom1-1 nuclei,
association of HPT FISH signals (21%) was still significantly higher than the
average pairing frequency of Arabidopsis endogenous euchromatic regions (P<0.001).
Sequence-specific but more or less location-independent somatic association of
multiple inserted arrays of tet operator and lac operator has been reported for budding
yeast (Aragon-Alcaide and Strunnikov 2000) although this was not confirmed by
FISH or in the absence of fusion protein. For the same organism, association of tet
operator arrays was shown to depend on the expression of the tet repressor fusion-protein
(Fuchs et al. 2002). In Drosophila, lac O arrays apparently do not necessarily enforce
homologous pairing since it was possible to trace extensive separation of homologues
and even of sister chromatids during premeiotic mid-G2 (Vazquez et al. 2002), although
somatic pairing occurs regularly in many Drosophila tissues.
3.3.4. The transgenic tandem repeats co-localize more often than the flanking
regions with heterochromatic chromocenters
During the FISH analysis described above, a frequent spatial association of lac operator
loci with heterochromatic chromocenters (detected as strongly DAPI-stained regions)
was noticed. Therefore the frequency of positional overlap (co-localization) of FISH
signals of F18C1, MGL6 and lac operator probes with strongly DAPI-stained
chromocenters was quantified in homozygous EL702C nuclei without (n=41) and after
Dex-treatment (n=31). For comparison, the overlap of FISH signals of MGL6 and F18C1
probes with heterochromatin was monitored in 62 wild-type nuclei (Figure 12). In wild-
type nuclei, chromocenters could not be clearly distinguished only on the basis of
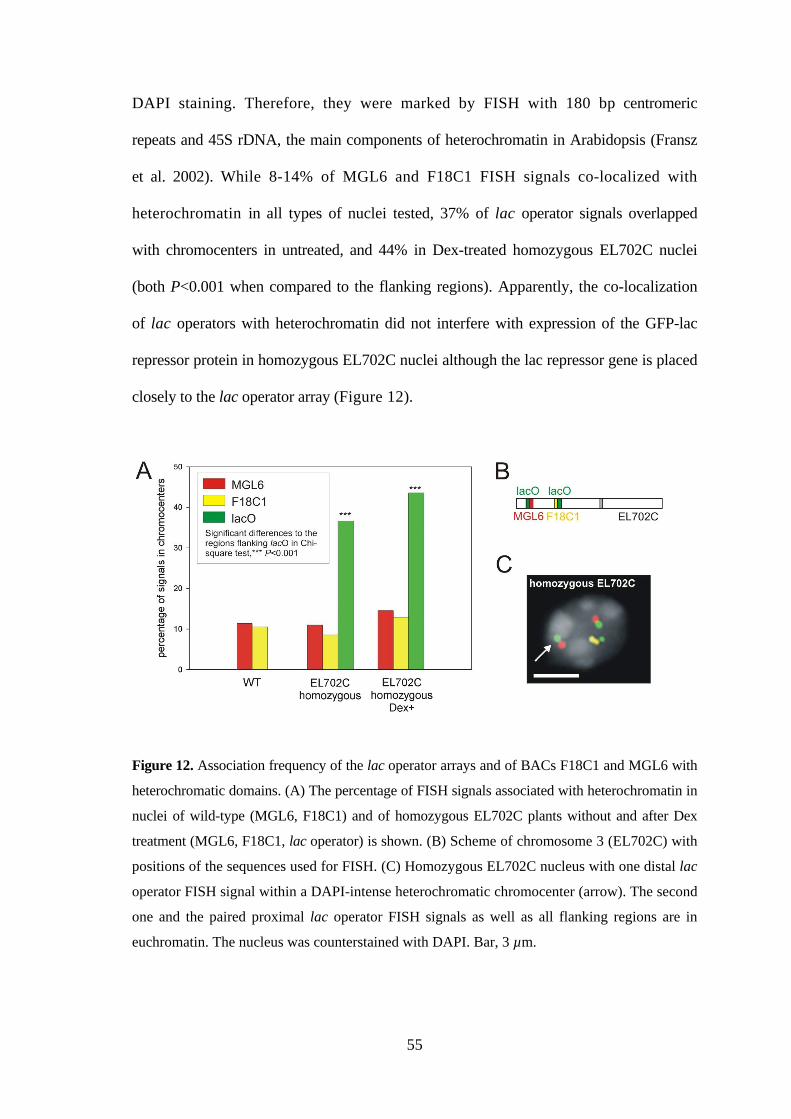
55
DAPI staining. Therefore, they were marked by FISH with 180 bp centromeric
repeats and 45S rDNA, the main components of heterochromatin in Arabidopsis (Fransz
et al. 2002). While 8-14% of MGL6 and F18C1 FISH signals co-localized with
heterochromatin in all types of nuclei tested, 37% of lac operator signals overlapped
with chromocenters in untreated, and 44% in Dex-treated homozygous EL702C nuclei
(both P<0.001 when compared to the flanking regions). Apparently, the co-localization
of lac operators with heterochromatin did not interfere with expression of the GFP-lac
repressor protein in homozygous EL702C nuclei although the lac repressor gene is placed
closely to the lac operator array (Figure 12).
Figure 12. Association frequency of the lac operator arrays and of BACs F18C1 and MGL6 with
heterochromatic domains. (A) The percentage of FISH signals associated with heterochromatin in
nuclei of wild-type (MGL6, F18C1) and of homozygous EL702C plants without and after Dex
treatment (MGL6, F18C1, lac operator) is shown. (B) Scheme of chromosome 3 (EL702C) with
positions of the sequences used for FISH. (C) Homozygous EL702C nucleus with one distal lac
operator FISH signal within a DAPI-intense heterochromatic chromocenter (arrow). The second
one and the paired proximal lac operator FISH signals as well as all flanking regions are in
euchromatin. The nucleus was counterstained with DAPI. Bar, 3 µm.
56
In order to test whether pairing of lac operator loci precedes association with
heterochromatin, the number of lac operator loci per overlap with a chromocenter was
counted. Within 31 Dex-treated homozygous EL702C nuclei (harboring 124 loci), 54
loci were associated with a chromocenter, of which 14 were detected as a single locus,
24 as two, 12 as three and 4 as four paired loci suggesting that transgene pairing is not
a prerequisite for association with heterochromatin.
Similar observations as to the association with heterochromatic chromocenters
were made also for the transgenic HPT locus (A. Probst in Pecinka et al. 2005). Co-
localization with heterochromatic chromocenters was found for 50% of HPT signals in
line A and for 49% in mom1-1 nuclei. This is significantly more (P<0.001) than found for
BACs MGL6 and F18C1 in wild-type. Because 60-65% of heterochromatin-associated
HPT loci were not paired, homologous pairing seems not to be a prerequisite for spatial
association of HPT loci with chromocenters. Hence, the association frequency of the
HPT locus with heterochromatin is even higher than that observed for the lac operator
arrays, independent of its transcriptional status and of a preceeding homologous pairing.
The HPT locus is clearly larger than the lac operator locus and becomes often visible
as an intensely DAPI-stained chromocenter (Probst et al. 2003). Because the HPT locus
co-localized more often than the lac operator locus with heterochromatin, the tendency
of tandem repeats to associate with heterochromatin in Arabidopsis interphase nuclei
might correlate with the size of the entire repeat containing locus.
The mechanism by which repeat sequences are targeted to chromocenters remains
to be elucidated. Probably, tandem repeat loci tend to associate with each other on the
basis of sequence homology but also with heterochromatic chromocenters containing
other repeat sequences. This would render tandem repeats better candidates for
anchoring euchromatin loops to heterochromatin according to the
‘chromocenter-loop-model’ (Fransz et al. 2002) than dispersed repeats such as
57
Emi12 elements that colocalize with chromocenters only in 1-7% of nuclei (S.
Klatte and I. Schubert unpublished results).
3.3.5. Conclusions as to the local alterations of interphase chromosome
arrangement caused by repetititve transgenes and fluorescent chromatin
tags
Fluorescent protein mediated chromatin tagging as achieved by the lac operator/lac
repressor system is useful to trace distinct chromatin domains in living eukaryotic
nuclei. To interpret the data correctly, it is important to recognize influences of the
tagging system on nuclear architectures of the host cells. Within an Arabidopsis line
that carries lac operator/lac repressor/GFP transgenes, the transgene loci frequently
associate with each other and with heterochromatic chromocenters. Accumulation
of tagging fusion protein further enhances the association frequency. Experiments
with a transgenic plant carrying another multi-copy transgene also revealed,
independent of its transcriptional state, unusually high frequencies of association
with each other and with heterochromatin. From these results it is conclued: (i) the
lac operator/lac repressor chromatin tagging system may alter the spatial chromatin
organization in the host nuclei (in particular when more than one insertion locus is
present) and (ii) loci of homologous transgenic repeats associate more often with
each other and with endogenous heterochromatin than average euchromatic regions.
58
4. Outlook
i) In previous studies, I could show that transgenic tandem repetitive lac operator
arrays frequently associate with each other and with heterochromatic
chromocenters in Arabidopsis nuclei. The original tagged line was crossed with
Arabidopsis mutants (ddm1 and met1) showing reduced levels of DNA and
histone methylation and altered chromatin organization in interphase nuclei
(Soppe et al. 2002) within the group of E. Lam. Future studies using these tagged
mutant lines will show whether the global changes in DNA methylation and
histone modifications have an impact on homologous pairing and heterologous
association of interstitial tandem repeats.
ii) Whole-mount FISH experiments on Arabidopsis root meristematic tissues will
show whether the CT arrangement in mitotically active cells differs from that
observed in differentiated tissues. Nuclei of meristematic cells have a prominent
phenotype (spheric shape; large nucleolus comprising at least 50-60% of nuclear
volume and chromatin occupying only relatively thin layer adjacent to the nuclear
periphery) and thus differ significantly from previously analyzed Arabidopsis
nuclei. Therefore, new SCD model simulations of random CT arrangement in
nuclei of meristematic cells will be performed.
iii) The seeds of flowering plants contain two fertilization products: the diploid
embryo and triploid endosperm. The embryo results from a fusion between the
maternal genome of the egg and the paternal genome of the sperm. The endosperm
is a product of fusion between one paternal genome of the sperm and the two
maternal genomes of the (homo-diploid) central cell. The ploidy ratio of two
maternal to one paternal genome in the endosperm is critical for normal seed
development. So far, the role of higher-order chromatin structure in endosperm
59
nuclei, and in particular, the arrangement of the parental genomes, have not been
investigated. Using CP, it is aimed to determine whether the parental genomes in
Arabidopsis endosperm nuclei possess a non-random arrangement and/or a
specific topology that could underlie the parent-of-origin effects observed during
seed development.
iv) (Peri)centromeric and telomeric regions associate more frequently than interstitial
euchromatic chromosome regions in Arabidopsis nuclei. Based on this
observation, it is assumed that interstitial regions should be involved less
frequently than chromocenters and chromosome termini in spontaneous and
induced homologous exchange aberrations. During the first post-treatment mitosis
after mutagen exposure, multicolor CP should allow to identify the chromosomes
involved in exchange aberrations. If Arabidopsis chromosome regions containing
tandemly repeated sequences are preferentially involved in mutagen-induced
structural chromosome aberrations as observed for other organisms (Schubert et
al. 1994, 2004), the breakpoints of exchange aberrations in the first post-treatment
mitoses should predominantly occur within pericentromeric or NOR regions
detectable by size and composition of anaphase bridges and/or acentric fragments
after multicolor CP.
v) Comparative CP to other species of the Brassicaceae family is now feasible
(Lysak et al. 2003). This method is utilizing A. thaliana chromosome specific
painting probes arranged according to comparative genetic maps of Arabidopsis
lyrata and Capsella rubella (Schmidt et al. 2004; Kuittinen et al. 2004). Studies on
interphase nuclei of related Brassicaceae species, will show whether a
chromosomal constitution different from that of A. thaliana results in a different
CT arrangement. The experimental results will be compared to corresponding
SCD model predictions for random CT arrangement.
60
5. Summary
I. Establishing of chromosome painting in Arabidopsis thaliana and detection of
chromosome rearrangements
Painting experiments with the complete set of BACs from the chromosome 4 tiling path
resulted in cross-hybridization signals on other chromosomes (Lysak et al. 2001).
Therefore, individual BACs were analyzed for the presence of repetitive DNA
sequences in TIGR database and by Dot Blot hybridization. Clones containing >5% of
mobile elements in TIGR database or yielding strong hybridization signals on Dot Blot
were omitted from the painting probes. From 1,585 tested BACs, 77% were considered
as suitable for CP.
Confirmed CP probes allow visualization of chromosome rearrangements. For the
transgenic Arabidopsis line T665-IST, sequencing of the T-DNA insertion site suggested
a translocation between the top arm of chromosome 3 and the bottom arm of chromosome
5 (Aufsatz et al. 2002). Using CP, the predicted rearrangement could be verified and the
position of the chromosome 5 bottom arm terminus that was unknown for T665-IST was
found on the top-arm of chromosome 3, providing evidence for a reciprocal translocation
between both chromosomes. Furthermore, a previously not suspected inversion between
two T-DNA insertion sites (4.2 Mbp apart from each other) on the top arm of
chromosome 3 was detected by CP in the Arabidopsis line EL702C (Kato and Lam
2003).
61
II. Arrangement of interphase CTs and homologous pairing in somatic nuclei of A.
thaliana
Using chromosome specific painting probes, arrangement and potential dynamics of
Arabidopsis CTs were studied in 2C, 4C and 8C nuclei from roots and leaves.
Individual CTs were found to be frequently associated. However, this arrangement
corresponds to the computer model prediction for random CT arrangement and is due to
the low number of Arabidopsis chromosomes (2n=10). Only the homologues of the
NOR-bearing chromosomes 2 and 4, associate more frequently than expected at
random. This is apparently because of frequent attachment of NORs to a single
nucleolus (in >90% of Arabidopsis nuclei), which mediates association of NOR-bearing
arms and of entire homologoues. This arrangement was consistently found in all
investigated types of nuclei. Furthermore, the relative position of a gene (FWA) within
its chromosome territory does not obviously depend on its transcriptional state.
Single-point homologous pairing occurs on average in 4.9% of somatic nuclei, i.e.
not significantly more than expected at random (5.9-7.8%). Only in 0.2% of nuclei, two
segments at distant chromosomal positions were found to pair simultaneously. No
significant differences as to the frequency of positional homologous pairing were
observed in Arabidopsis mutants with an increased frequency of somatic homologous
recombination. This suggests that the increase in recombination frequency is rather due
to more intensified search for homology after spontaneous as well as induced DNA
damage than to a generally increased level of homologous associations.
Thus Arabidopsis differs from Drosophila (characterized by regular somatic
pairing of homologues) and shows that similarity in genome size, sequence organization
and chromosome number does not necessarily cause an identical arrangement of
interphase chromosomes.
62
III. Alteration of the local interphase chromosome arrangement by tandem
repetitive trangenes and fluorescent chromatin tags
The lac operator/GFP-lac repressor tagging system is a powerful tool to study chromatin
dynamics in vivo. However, the results as to the arrangement of interphase chromosomes
achieved with this system have to be considered cautiously. In many Arabidopsis nuclei
lac operator arrays do not reflect the spatial organization at the integration loci under
wild-type condition and may lead to invalid conclusions as to positional homologous
pairing frequencies (Esch et al. 2003). This problem could become significant especially
when homozygous or multiple insertions of repetitive arrays are present. The main reason
for the increase in allelic and ectopic association frequency of the lac operator arrays
(compared to the flanking sequences under wild-type condition) is most likely the
repetitive nature of the transgene construct. The similar behavior of the HPT locus
further supports the idea that in A. thaliana the tandem repetitive nature of a
transgene locus might be responsible for an increased allelic and ectopic pairing
frequency of transgenic sequences as well as for an increased co-localization frequency
with endogenous heterochromatin. GFP-lac repressor protein molecules that tag the
lac operator arrays may further enhance the frequency of homologous pairing of the
operator repeats, most likely via aggregation of lac repressor molecules bound to the
different lac operator arrays in close vicinity.
63
6. Zusammenfassung
I. Etablierung des Chromosomenpaintings für Arabidopsis thaliana und Nachweis
von Chromosomenumbauten
Painting-Experimente mit einem Satz künstlicher Bakterienchromosomen (BACs), die
das gesamte Chromosom 4 abdecken, ergaben Hybridisierungssignale auch auf den
anderen Chromosomen (Lysak et al. 2001). Deshalb wurden alle verfügbaren BACs für
die übrigen 4 Chromosomen anhand von Datenbank-Annotationen (TIGR) und mittels
Dot-Blot-Hybridisierung mit genomischer DNA auf Anwesenheit von repetitiven
Sequenzen überprüft. Klone, die mehr als 5% mobile Elemente oder starke
Hybridisierungssignale mit genomischer DNA aufwiesen, wurden nicht in die Painting-
Proben einbezogen. Von 1585 BACs wurden 77% als für das Painting geeignet
gefunden.
Selektierte Painting-Proben ermöglichten den Nachweis von strukturellen
Chromosomenaberrationen. Die Sequenzierung eines T-DNA-Insertionsortes in der
transgenen Arabidopsis-Linie T655-IST liess eine Translokation zwischen dem kurzen
Arm von Chromosom 3 und dem langen Arm von Chromosom 5 vermuten (Aufsatz et
al. 2002). Durch Chromosomenpainting konnte diese Annahme verifiziert werden.
Weiterhin konnte eine vordem nicht vermutete Inversion zwischen zwei 4,2 Mb
voneinander entfernten T-DNA-Insertionsorten im kurzen Arm von Chromosom 3 der
Linie EL702C (Kato & Lam 2003) mittels geeigneter Painting-Proben in situ
nachgewiesen werden.
II. Anordnung von Interphase-Chromosomenterritorien und homologe Paarung in
somatischen Zellkernen von A. thaliana
Mittels chromosomenspezifischer Painting-Proben wurden die Anordnung und die
potentielle Dynamik von Chromosomenterritorien in 2C-, 4C- und 8C-Kernen
64
unterschiedlicher Form (kugelig, spindelförmig, stabförmig) aus Wurzeln und Blättern
von A. thaliania untersucht. Individuelle Chromosomenterritorien waren
größenabhängig in beliebigen homo- und heterologen Kombinationen (x – y% der
Kerne) miteinander positionell assoziiert. Diese Anordnung entsprach der Vorhersage
durch Computersimulationen gemäß einer zufälligen Chromosomenanordnung und
beruht auf der geringen Chromosomenzahl von A. thaliana (2n = 10). Lediglich die
Homologen der NOR-tragenden Chromosomen 2 und 4 waren häufiger assoziiert als
zufallsgemäß erwartet. Dieser Befund beruht wahrscheinlich darauf, dass in >90% der
untersuchten Kerne alle Nukleolusorganisatoren mit nur einem Nukleolus in einer
Weise vergesellschaftet waren, die die Assoziation von NOR-tragenden Armen sowie
vollständiger homologer NOR-Chromosomen bedingte. Diese Anordnung wurde in
allen untersuchten Kerntypen gefunden.
Am Beispiel des Blütengens FWA konnte gezeigt werden, dass die relative
Position eines Genes innerhalb oder außerhalb des entsprechenden durch Painting
markierten Territoriums nicht zwingend von der Transkriptionsaktivität abhängt.
Punktuelle Homologenpaarung tritt an unterschiedlichen chromosomalen Positionen
durchschnittlich in 4,9% der Zellkerne auf, d.h. nicht häufiger als zufallsgemäß (in 5,9 –
7,8 % der Kerne) erwartet.
Auch in Mutanten mit signifikant erhöhter Frequenz an somatischen homologen
Rekombinationsereignissen bleibt die punktuelle Paarungsfrequenz unverändert.
Wahrscheinlich basiert die erhöhte Rekombinationsfrequenz eher auf einer intensiveren
"Homologie-Suche" als auf häufigerer Homologenpaarung.
Der Unterschied zu den an Drosophila erhobenen Befunden (reguläre somatische
Homologenpaarung) zeigt, dass Ähnlichkeiten hinsichtlich Genomgröße,
Sequenzorganisation und Chromosomenzahl nicht notwendigerweise eine gleiche
Anordnung der Interphasechromosomen bedingen.
65
III. Lokale Veränderungen der Chromosomenanordnung durch tandem-repetitive
Transgene und fluoreszierende 'Chromatin-tags'
Das Lac-Operator/GFP-Lac-Repressor-System ist ein geeignetes Werkzeug zum
Studium der Chromatindynamik in vivo. Jedoch sind die entsprechenden Ergebnisse mit
Vorsicht zu betrachten, da es sich um künstlich geschaffene Loci mit z.T. unnatürlichen
Proteinkonzentrationen handelt. In vielen Arabidopsiskernen spiegelt die Anordnung
der Lac-Operator-Repeats daher auch nicht die räumliche Organisation der
entsprechenden Loci unter Wildtypbedingungen wider und kann zu falschen
Schlußfolgerungen hinsichtlich der punktuellen Homologenpaarung führen (Esch et al.
2003). Dies ist vor allem dann der Fall, wenn homozygote oder multiple Insertionen von
Tandem Repeats vorliegen. Die wesentliche Ursache für die erhöhte Frequenz alleler
und ektopischer Paarung der Lac-Operator-Repeats im Vergleich zu flankierenden
Sequenzen unter Wildtypbedingungen liegt höchstwahrscheinlich in der repetitiven
Struktur des transgenen Konstruktes. Ein ähnliches Verhalten des HPT-Locus
unterstützt die Annahme, dass in Arabidopsis die tandemrepetitive Natur von Transgen-
Loci für eine erhöhte Frequenz der homologen Paarung solcher Loci untereinander
sowie für eine häufigere Assoziation mit endogenem Heterochromatin verantwortlich
ist.
GFP-Lac-Repressormoleküle bewirken wahrscheinlich eine zusätzliche Erhöhung
der Homologen-Paarungsfrequenz von Lac-Operator-Repeats durch Aggregation von an
unterschiedliche aber benachbarte Repeats gebundenen Repressormolekülen.
66
7. Literature
Abranches R., Beven A.F., Aragón-Alcaide L., and Shaw P.J. (1998). Transcriptional sites are
not correlated with chromosome territories in wheat nuclei. J Cell Biol. 143, 5-12.
Abranches R., Santos A.P., Wegel E., Williams S., Castilho A., Christou P., Shaw P., and
Stoger E. (2000). Widely separated multiple transgene integration sites in wheat chromosomes
are brought together at interphase. Plant J 24, 713-723.
Amedeo P., Habu Y., Afsar K., Mittelsten Scheid O., and Paszkowski J. (2000). Disruption of
the plant gene MOM releases transcriptional silencing of methylated genes. Nature 405, 203-
206.
Aragon-Alcaide L. and Strunnikov A.V. (2000). Functional dissection of in vivo
interchromosome association in Saccharomyces cerevisiae. Nat. Cell Biol. 2, 812-818.
Aragón-Alcaide L., Reader S., Beven A., Shaw P., Miller T., and Moore G. (1997). Association
of homologous chromosomes during floral development. Curr. Biol. 7, 905-908.
Aufsatz W., Mette M.F., van der Winden J., Matzke A.J.M., and Matzke M. (2002). RNA-
directed DNA methylation in Arabidopsis. Proc. Natl. Acad. Sci. USA 99, 16499-16506.
Belmont A.S., Li G., Sudlow G., and Robinett C. (1999). Visualization of large-scale chromatin
structure and dynamics using the lac operator/lac repressor reporter system. Methods Cell Biol.
58, 203-222.
Bennett M.D., Leitch I., Price J.H., and Johnston S.J. (2003). Comparisons with Caenorhabditis
(100 Mb) and Drosophila (175 Mb) using flow cytometry show genome size in Arabidopsis to
be 157 Mb and thus 25 % larger than the Arabidopsis Genome Initiative estimate of 125 Mb.
Ann. Bot. 91, 1-11.
Blennow E. (2004). Reverse painting highlights the origin of chromosome aberrations.
Chromosome Res. 12, 25-33.
Bickmore W.A. and Chubb J.R. (2003). Chromosome position: Now, where was I? Curr. Biol.
13, R357-R359.
67
Boivin K., Acarcan A., Mbulu R.-S., Clarenz O., and Schmidt R. (2004). The Arabidopsis
genome sequence as a tool for genome analysis in Brassicaceae. A comparison of the
Arabidopsis and Capsella rubella genomes. Plant Physiol. 135, 735-744.
Bridger J.M., Boyle S., Kill I.R., and Bickmore W.A. (2000). Re-modelling of nuclear
architecture in quiescent and senescent human fibroblasts. Curr. Biol. 10, 149-152.
Burgess S.M., Kleckner N., and Weiner B.M. (1999). Somatic pairing of homologs in budding
yeast: existence and modulation. Genes & Dev. 13, 1627-1641.
Chandler V.L. and Stam M. (2004). Chromatin conversations: mechanisms and implications of
paramutation. Nat. Rev. Genet. 5, 532-544.
Chandley A.C., Speed R.M., and Leitch A.R. (1996). Different distributions of homologous
chromosomes in adult human Sertoli cells and in lymphocytes signify nuclear differentiation. J
Cell Sci. 109, 773-776.
Cornforth M.N., Greulich-Bode K.M., Loucas B.D., Arsuaga J., Vásquez M., Sachs R.K.,
Brückner M., Molls M., Hahnfeldt P., Hlatky L., and Brenner D.J. (2002). Chromosomes are
predominantly located randomly with respect to each other in interphase human cells. J. Cell
Biol. 159, 237-244.
Cremer M., von Hase J., Volm T., Brero A., Kreth G., Walter J., Fischer C., Solovei I., Cremer
C., and Cremer T. (2001). Non-random radial higher-order chromatin arrangements in nuclei of
diploid human cells. Chromosome Res. 9, 514-567.
Cremer T., Popp S., Emmerich P., Lichter P., and Cremer C. (1990). Rapid metaphase and
interphase detection of radiationinduced chromosome aberrations in human lymphocytes by
chromosomal suppression in situ hybridization. Cytometry 11, 110-118.
Cremer T. and Cremer C. (2001). Chromosome territories, Nuclear architecture and Gene
regulation in Mammalian cells. Nat. Rev. Genet. 2, 292-301.
Csink A.K. and Henikoff S. (1998). Large-scale chromosomal movements during interphase
progression in Drosophila. J. Cell Biol. 143, 13-22.
Dong F. and Jiang J. (1998). Non-Rabl patterns of centromere and telomere distribution in the
interphase nuclei of plant cells. Chromosome Res. 6, 551-558.
Duncan I.W. (2002). Transvection effects in Drosophila. Annu. Rev. Genet. 36, 521-556.

68
Esch J.J., Chen M., Sanders M., Hillestad M., Ndkium S., Idelkope B., Neizer J., and Marks
M.D. (2003). A contradictory GLABRA3 allele helps define gene interactions controlling
trichome development in Arabidopsis. Development 130, 5885-5894.
Ferguson-Smith M.A. (1997). Genetic analysis by chromosome sorting and painting:
phylogenetic and diagnostic applications. Eur. J Hum. Genet. 5, 253-265.
Fransz P., Armstrong S., Alonso-Blanco C., Fischer T.C., Torres-Ruiz R.A., and Jones G.
(1998). Cytogenetics for the model system Arabidopsis thaliana. Plant J 13, 867-876.
Fransz P.F., Armstrong S., de Jong J.H., Parnell D., van Drunen C., Dean C., Zabel P., Bisseling
T., and Jones G.H. (2000). Integrated cytogenetic map of chromosome arm 4S of A. thaliana:
Structural organization of heterochromatic knob and centromere region. Cell 100, 367-376.
Fransz P., de Jong J.H., Lysak M.A., Ruffini Castiglione M., and Schubert I. (2002). Interphase
chromosomes in Arabidopsis are organized as well defined chromosonters from which
euchromatin loops emanate. Proc. Natl. Acad. Sci. USA 99, 14584-14589.
Fuchs J., Lorenz A., and Loidl J. (2002). Chromosome associations in budding yeast caused by
integrated tandemly repeated transgenes. J Cell Sci. 115, 1213-1220.
Fung J.C., Marshall W.F., Dernburg A., Agard D.A., and Sedat J.W. (1998). Homologous
chromosome pairing in Drosophila melanogaster proceeds through multiple independent
initiations. J. Cell Biol. 141, 5-20.
Gasser S.M. (2002). Visualizing chromatin dynamics in interphase nuclei. Science 296, 1412-
1416.
Gerlich D., Beaudouin J., Kalbfuss B., Daigle N., Eils R., and Ellenberg J. (2003). Chromosome
positioning in live mammalian cells. Cell 112, 751-764.
Gunawardena S. and Rykowski, M.C. (2000). Direct evidence for interphase chromosome
movement during the mid-blastula transition in Drosophila. Curr.Biol. 10, 285-288.
Habermann F.A., Cremer M., Walter J., Kreth G., von Hase J., Bauer K., Wienberg J., Cremer
C., Cremer T., and Solovei I. (2001). Arrangements of macro- and microchromosomes in
chicken cells. Chromosome Res. 9, 569-584.
Heitz E. (1928). Heterochromatin der Moose I. Jahrb. Wiss. Bot. 69, 762-818.
Henegariu O., Bray-Ward P., and Ward D.C. (2000). Custom fluorescent-nucleotide synthesis
as an alternative method for nucleic acid labeling. Nat. Biotech. 18, 345-348.
69
Hiraoka Y., Dernburg A.F., Parmelee S.J., Rykowski M.C., and Agard D.A. (1993). The Onset
of homologous chromosome pairing during Drosophila melanogaster embryogenesis. J. Cell
Biol. 120, 591-600.
Hobza R., Lengerova M., Cernohorska H., Rubes J., and Vyskot B. (2004). FAST-FISH with
laser beam microdissected DOP-PCR probe distinguishes the sex chromosomes of Silene
latifolia. Chromosome Res. 12, 245-250.
Houben A., Kynast R.G., Heim U., Hermann H., Jones R.N., and Forster J.W. (1996).
Molecular cytogenetic characterization of the terminal heterochromatic segment of the B-
chromosome of rye (Secale cereale). Chromosoma 105, 97-103.
Kato N. and Lam E. (2001). detection of chromosomes tagged with green fluorescent protein in
live Arabidopsis thaliana plants. Genome Biol. 2, 0045.1-0045.10.
Kato N. and Lam E. (2003). Chromatin of endoreduplicated pavement cells has greater range of
movement than that of diploid guard cells in Arabidopsis thaliana. J Cell Sci. 116, 2195-2201.
Kato A., Lamb J.C., and Birchler J.A. (2004). Chromosome painting using repetitive DNA
sequences as probes for somatic chromosome identification in maize. Proc. Natl. Acad. Sci.
USA 101, 13554-13559.
Kozubek S., Lukasova E., Jirsova P., Koutna I., Kozubek M., Ganova A., Bartova E., Falk M.,
and Pasekova R. (2002). 3D Structure of the human genome: order in randomness.
Chromosoma 111, 321-331.
Kreth G., Finsterle J., von Hase J., Cremer M., and Cremer C. (2004). Radial Arrangement of
Chromosome Territories in Human Cell Nuclei: A Computer Model Approach Based on Gene
Density Indicates a Probabilistic Global Positioning Code. Biophys. J 86, 2803-2812.
Kuittinen H., de Haan A.A., Vogl C., Oikarinen S., Leppälä J., Koch M., Mitchell-Olds T.,
Langley C.H., and Savolainen O. (2004). Comparing the linkage maps of the close relatives
Arabidopsis lyrata and A. thaliana. Genetics 168, 1575-1584.
Lam E., Kato N., and Watanabe K. (2004). Visualizing chromosome structure/organization.
Ann Rev Plant Biol. 55, 537-554.
Langer S., Kraus J., Jentsch I., and Speicher M.R. (2004). Multicolor chromosome painting in
diagnostic and research applications. Chromosome Res. 12, 15-23.
70
Laufs P., Autran D., and Traas J. (1999). A chromosomal paracentric inversion associated with
T-DNA integration in Arabidopsis. Plant J 18, 131-139.
Lichter P., Cremer T., Borden J., Manuelidis L., and Ward D.C. (1988). Delineation of
individual human chromosomes in metaphase and interphase cells by in situ suppression
hybridization using recombinant DNA libraries. Hum. Genet. 80, 224-234.
Lorenz A., Fuchs J., Bürger R., and Loidl J. (2003). Chromosome pairing does not contribute to
nuclear architecture in vegetative yeast cells. Eucaryotic Cell 2, 856-866.
Lysak M.A., Fransz P.F., Ali H.B.M., and Schubert I. (2001). Chromosome painting in
Arabidopsis thaliana. Plant J 28, 689-697.
Lysak M.A., Pecinka A., and Schubert I. (2003). Recent progress in chromosome painting of
Arabidopsis and related species. Chromosome Res. 11, 195-204.
Lysak M.A., Koch M., Pecinka A., and Schubert I. (2005). Chromosome triplication found
across the tribe Brassiceae. Genome Res. in revision.
Mahy N.L., Perry P.E., Gilchrist S., Baldock R., and Bickmore W.A. (2002). Spatial
organisation of active and inactive genes and noncoding DNA with chromosome territories. J.
Cell Biol. 157, 579-589.
Mahy N.L., Perry P.E., and Bickmore W.A. (2002). Gene density and transcription influence
the localization of chromatin outside of chromosome territories detectable by FISH. J. Cell Biol.
159, 753-763.
Marshall R. and Obe G. (1998). Application of chromosome painting to clastogenicity testing in
vitro. Environ. Mol. Mutagen. 32, 212-222.
Martínez-Pérez E., Shaw P., and Moore G. (2001). Polyploidy induces centromere association.
J. Cell Biol. 148, 233-238.
Martínez-Zapater J.M., Estelle M.A., and Somerville C.R. (1986). A highly repeated DNA
sequence in Arabidopsis thaliana. Mol. Gen. Genet. 204, 417-423.
Matzke A.J.M., van der Winden J., and Matzke M. (2003). Tetracycline operator/repressor
system to visualize fluorescence-tagged T-DNAs in interphase nuclei of Arabidopsis. Plant Mol.
Biol. Rep. 21, 9-19.
McKee B.D. (2004). Homologous pairing and chromosome dynamics in meiosis and mitosis.
Biochim. Biophys. Acta 1677, 165-180.
71
Metropolis N., Rosenbluth A.W., Rosenbluth M.N., Teller A.H., and Teller E. (1953) Equation
of state calculations by fast computing machines. J Chem. Phys. 21, 1087-1092.
Mittelsten Scheid O., Paszkowski J., and Potrykus I. (1991). Reversible inactivation of a
transgene in Arabidopsis thaliana. Mol. Gen. Genet. 228, 104-112.
Mittelsten Scheid O., Afsar K., and Paszkowski J. (1998). Release of epigenetic gene silencing
by trans-acting mutations in Arabidopsis. Proc. Natl. Acad. Sci. USA 95, 632-637.
Molinier J., Ries G., Bonhoeffer S., and Hohn B. (2004). Interchromatid and interhomolog
recombination in Arabidopsis thaliana. Plant Cell 16, 342-352.
Nabeshima K., Nakagawa T., Straight A.F., Murray A., Chikashige Y., Yamashita Y.M.,
Hiraoka Y., and Yanagida M. (1998). Dynamics of centromeres during metaphase-anaphase
transition in fission yeast: Dis1 is implicated in force balance in metaphase bipolar spindle. Mol.
Biol. Cell 9, 3211-3225.
Nagele R.G., Freeman T., McMorrow L., Thomson Z., Kitson-Wind K., and Lee H.-Y. (1999).
Chromosomes exhibit preferential positioning in nuclei of quiescent human cells. J Cell Sci.
112, 525-535.
Natarajan A.T., Vyas R.C., Darroudi F., and Vermeulen S. (1992). Frequencies of X-ray-
induced chromosome translocations in human peripheral lymphocytes as detected by in situ
hybridization using chromosome specific libraries. Int. J. Radiat. Biol. 61, 199-203.
Parada L.A. and Misteli T. (2002). Chromosome positioning in the interphase nucleus. Trends
in Cell Biol. 12, 425-432.
Parada L.A., Roix J.J., and Misteli T. (2003). An uncertainty principle in chromosome
positioning. Trends in Cell Biol. 13, 393-396.
Pecinka A., Schubert V., Meister A., Kreth G., Klatte M., Lysak M.A., Fuchs J., and Schubert I.
(2004). Chromosome territory arrangement and homologous pairing in nuclei of Arabidopsis
thaliana are predominantly random except for NOR-bearing chromosomes. Chromosoma 113,
258-269.
Pecinka A., Kato N., Meister A., Probst A.V., Schubert I., and Lam E. (2005). Tandem repetitive
transgenes and fluorescent chromatin tags alter the local interphase chromosome arrangement in
Arabidopsis thaliana. J Cell Sci. submitted.

72
Pinkel D., Landegent J., Collins C., Fuscoe J., Segraves R., Lucas J., and Gray J. (1988).
Fluorescence in situ hybridization with human chromosome-specific libraries: Detection of
trisomy 21 and translocations of chromosome 4. Proc. Natl. Acad. Sci. USA 85, 9138-9142.
Prieto P., Santos A.P., Moore G., and Shaw P. (2004). Chromosomes associate premeiotically
and in xylem vessel cells via their telomeres and centromeres in diploid rice (Oryza sativa).
Chromosoma 112, 300-307.
Probst A.V., Fransz P., Paszkowski J., and Mittelsten Scheid O. (2003). Two means of
transcriptional reactivation within heterochromatin. Plant J 33, 743-749.
Rabl C. (1885). Über Zelltheilung. Morphol Jahrbuch 10, 214-330.
Ried T., Schrock E., Ning Y., and Wienberg J. (1998). Chromosome painting: a useful art.
Hum. Mol. Genet. 7, 1619-1626.
Rieger R., Michaelis A., Schubert I., and Meister A. (1973). Somatic interphase pairing of Vicia
chromosomes as inferred from the hom/het ration of induced chromatid interchanges. Mutation
Res. 20, 295-298.
Robinett C.C., Straight A., Li G., Willhelm C., Sudlow G., Murray A., and Belmont A.S.
(1996). In vivo localization of DNA sequences and visualization of large-scale chromatin
organization using lac operator/repressor recognition. J. Cell Biol. 135, 1685-1700.
Sambrook J. and Russell D.W. (2001). Molecular cloning: a laboratory manual 3rd edition Vol
1. Cold Spring Harbor Laboratory Press, Cold Spring Harbor.
Santos A.P., Abranches R., Stoger E., Beven A., Viegas W., and Shaw P.J. (2002). The
architecture of interphase chromosomes and gene positioning are altered by changes in DNA
methylation and histone acetylation. J Cell Sci. 115, 4597-4605.
Scherthan H., Loidl J., Schuster T., and Schweizer D. (1992). Meiotic chromosome
condensation and pairing in Saccharomyces-cerevisiae studied by chromosome painting.
Chromosoma 101, 590-595.
Scholl R.L., May S.T., and Ware D.H. (2000). Seed and molecular resources for Arabidopsis.
Plant Physiol. 124, 1477-1480.
Schubert I., Rieger R., Fuchs J., and Pich U. (1994). Sequence organization and the mechanism
of interstitial deletion clustering in a plant genome (Vicia faba). Mutat. Res. 325:1-5.
73
Schubert I., Shi F., Fuchs J., and Endo T.R. (1998). An efficient screening for terminal deletions
and translocations of barley chromosomes added to common wheat. Plant J 14, 489-495.
Schubert I., Fransz P.F., Fuchs J., and de Jong J.H. (2001). Chromosome painting in plants.
Methods Cell Sci. 23, 57-69.
Schubert I., Pecinka A., Meister A., Schubert V., Klatte M., and Jovtchev G. (2004). DNA
damage processing and aberration formation in plants. Cytogenet Genome Res 104, 104-108.
Schwarzacher T., Leitch A.R., Bennett M.D., and Heslop-Harrison J.S. (1989). In situ
localization of parental genomes in a wide hybrid. Ann. Bot. 64, 315-324.
Schwarzacher T., Anamthawat-Jonsson K., Harrison G.E., Islam A.K.M.R., Jia J.Z., King I.P.,
Leitch A.R., Miller T.E., Reader S.M., Rogers W.J., Shi M., and Heslop-Harrison J.S. (1992).
Genomic in situ hybridization to identify alien chromosomes and chromosome segments in
wheat. Theor. Appl. Genet. 84, 778-786.
Shibata F., Hizume M., and Kuroki Y. (1999). Chromosome painting of Y chromosomes and
isolation of a Y chromosomespecific repetitive sequence in the dioecious plant Rumex acetosa.
Chromosoma 108, 266-270.
Stam M. and Mittelsten Scheid O. (2005). Paramutation: leaving a lasting impression. Trends in
Genetics, submitted.
Soppe W., Jacobsen S.E., Alonso-Blanco C., Jackson J.P., Kakutani T., Koornneef M., and
Peeters A.J.M. (2000). The late flowering phenotype of fwa mutants is caused by gain-of-
function epigenetic alleles of a homeodomain gene. Molecular Cell 6, 791-802.
Straight A.F., Belmont A.S., Robinett C.C., and Murray A.W. (1996). GFP tagging of budding
yeast chromosomes reveals that protein-protein interactions can mediate sister chromatid
cohesion. Curr. Biol. 6, 1599-1608.
Svartman M., Stone G., Page J.E., and Stanyon R. (2004). A chromosome painting test of the
basal eutherian karyotype. Chromosome Res. 12, 45-53.
Tanabe H., Müller S., Neusser M., von Hase J., Calcagno E., Cremer M., Solovei I., Cremer C.,
and Cremer T. (2002). Evolutionary conservation of chromosome territory arrangements in cell
nuclei from higher primates. Proc. Natl. Acad. Sci. USA 99, 4424-4429.
The Arabidopsis Genome Initive (2000). Analysis of the genome sequence of the flowering
plant Arabidopsis thaliana. Nature 408, 796-815.
74
Tsukamoto T., Hashiguchi N., Janicki S.M., Tumbar T., Belmont A.S., and Spector, D.L.
(2000). Visualization of gene activity in living cells. Nat. Cell Biol. 2, 871-878.
Vazquez J., Belmont A.S., and Sedat J.W. (2002). The dynamics of homologous chromosome
pairing during male Drosophila meiosis. Curr. Biol. 12, 1473-1483.
Volpi E.V., Chevret E., Jones T., Vatcheva R., Williamson J., Beck S., Campbell R.D.,
Goldsworthy M., Powis S.H., Ragoussis J., Trowsdale J., and Sheer D. (2000). Large-scale
chromatin organization of the major histocompatibility complex and other regions of human
chromosome 6 and its response to interferon in interphase nuclei. J. Cell Sci. 113, 1565-1576.
Vongs A., Kakutani T., Martienssen R.A., and Richards E.J. (1993). Arabidopsis-thaliana DNA
methylation mutants. Science 260, 1926-1928.
Walter J., Schmelleh L., Cremer M., Tashiro S., and Cremer T. (2003). Chromosome order in
HeLa cells changes during mitosis and early G1, but is stably maintained during subsequent
interphase stages. J. Cell Biol. 160, 685-697.
Weiss K. and Simpson R.T. (1997). Cell type-specific chromatin organization of the region that
governs directionality of yeast mating type switching. Embo J. 16, 4352-60.
Williams R.R.E. and Fisher A.G. (2003). Chromosomes, positions please! Nat. Cell Biol. 5,
338-390.
West C.E., Waterworth W.M., Sunderland P.A., and Bray C.M. (2004). Arabidopsis DNA
double-strand break repair pathways. Biochem. Soc. Transactions 32, 964-966.
Zink D., Cremer T., Saffrich R., Fischer R., Trendelenburg M.F., Ansorge W., and Stelzer
E.H.K. (1998). Structure and dynamics of human interphase chromosome territories in vivo.
Hum. Genet. 102, 241-251.
75
Publications in connection with the submitted dissertation
Lysak M.A., Pecinka A., and Schubert I. (2003). Recent progress in chromosome
painting of Arabidopsis and related species. Chromosome Res. 11, 195-20.
Pecinka A., Schubert V., Meister A., Kreth G., Klatte M., Lysak M. A., Fuchs J., and
Schubert I. (2004). Chromosome territory arrangement and homologous pairing in
nuclei of Arabidopsis thaliana are predominantly random except for NOR-bearing
chromosomes. Chromosoma 113, 258-269.
Pecinka A., Kato N., Meister A., Probst A.V., Schubert I., and Lam E. (2005). Tandem
repetitive transgenes and fluorescent chromatin tags alter the local interphase
chromosome arrangement in Arabidopsis thaliana. J Cell Sci. submitted.
76
Declaration about the personal contribution to the manuscripts forming
the basis of the dissertation
The part ‘Fluorescence in situ hybridization (FISH) for chromosome painting‘ is based on
the work published in articles Lysak et al. (2003) Chromosome Res. 11, 195-20; Pecinka et al.
(2004) Chromosoma 113, 258-269; and Pecinka et al. J. Cell Sci., submitted. From the work
published in the first paper, I have performed dot blot and CP experiments for development of
painting probes for chromosomes 1 and 2 and identified misaligned BACs from the top-arm of
chromosome 2. Later on, I have selected by Dot Blot hybridization BACs for painting of
chromosomes 3 and 5 and in collaboration with Dr. M. Lysak and Dr. J. Fuchs developed multi-
color CP technique for simultaneous visualization of all individual Arabidopsis chromosomes
(published in the second paper). Analysis of chromosome rearrangements in T665-IST line by
CP was performed by Young Min Kim (student from University of Kassel visiting IPK in
March - April 2004) under my supervision (the results are unpublished). Experiments assessing
chromosome rearrangement in EL702C line were performed by myself and are described in the
third referred paper.
The part ‚Interphase chromosomes: structural and functional organization‘ is based on the
paper Pecinka et al. (2004) Chromosoma 113, 258-269. All experiments assessing association
frequencies of homologous and heterologous CTs were performed by myself. Relative position
of FWA gene to its CT was investigated by Dr. Veit Schubert in collaboration with myself (I
have prepared painting probes and performed approximately half of FISH experiments). The
frequency of somatic homologous pairing was analyzed by Dr. Veit Schubert (chromosome 1),
Marco Klatte (chromosome 4) and myself (chromosome 3).
The part ‚Influence of the repetitive trangenes and fluorescent chromatin tags on the
interphase chromosome arrangement‘ is based on the manuscript Pecinka et al., J. Cell Sci.,
submitted. Initial experiments assessing the number of GFP spots in living nuclei of
homozygous and hemizygous transgenic lines were performed by Dr. Naohiro Kato. All FISH
experiments estimating pairing frequency of lac operator arrays and of flanking BACs F18C1
and MGL6 and their co-localization with heterochromatic chromocenters were performed by
myself.
77
Eidesstattliche Erklärung
Hiermit erkläre ich, dass diese Arbeit von mir bisher weder der Mathematisch-
Naturwissenschaftlich-Technischen Fakultät der Martin-Luther-Universität Halle-
Wittenberg noch einer anderen wissenschaftlichen Einrichtung zum Zweck der
Promotion eingereicht wurde.
Ich erkläre ferner, dass ich diese Arbeit selbständig und nur unter Zuhilfenahme der
angegebenen Hilfsmittel und Literatur angefertig habe.
Gatersleben, den ......................... _____________________________
A. Pecinka
78
CURRICULUM VITAE
Name Ales Pecinka
Address Nova 9, Vresina, 747 20, Czech Republic
Birth 28. 01. 1978 in Opava, Czech Republic
Nationality Czech
Citizenship Czech Republic
Marital Status single
Education
1992 – 1996 Grammar school, Hlucin, Czech Republic
1996 – 2001 Palacky University in Olomouc, Czech Republic,
Faculty of Natural Sciences, Systematic Botany,
M.Sc. Thesis: “Taxonomy and distribution of the genus
Koeleria Pers. (Poaceae) in Czech Republic and Slovakia“
June 2001 Graduation as Master of Science, Mgr. (= M.Sc.)
Since September 2001 Ph.D. study at the Institute of Plant Genetics and Crop Plant
Research (IPK), Gatersleben, Germany

79
Appendix

80
Appendix: The tiling path of BAC clones used for chromosome painting of all five Arabidopsis thaliana chromosomes
Appendix: Table 1. The tiling path of BAC clones from Arabidopsis chromosome 1 according to the MATDB (http://mips.gsf.de/
proj/thal/db/). All BACs that were excluded from painting probes either because of a strong signal on Dot Blot and/or presence of
mobile elements within annotated sequences in TIGR database are shown in grey.
part 1 part 2 part 3 part 4
Clones Genbank no. Clones Genbank no. Clones Genbank no. Clones Genbank no.
TEL1N AC074298 T28K15 AC022522 F16L1 AC073942 F5D14 AC007767
T25K16 AC007323 F5O11 AC025416 T16E15 AC068562 T9G5 AC055769
F6F3 AC023628 T12C24 AC025417 F12K8 AC006551 F6N18 AC017118
F22L4 AC061957 F13K23 AC012187 T22J18 AC003979 F9L11 AC006424
T1N6 AC009273 F3F19 AC007357 F19G10 AF000657 T9L6 AC021045
F22M8 AC020622 T6J4 AC011810 T26J12 AC002311 T16O9 AC027035
T7I23 U89959 F13B4 AC027134 F26F24 AC005292 F10C21 AC051630
T6A9 AC064879 F21F23 AC027656 F28C11 AC007945 T1E4 AC069299
T14P4 AC022521 F16A14 AC068197 F5O8 AC005990 F14M2 AC010164
F22D16 AC009525 F7A19 AC007576 T23E23 AC002423 T3M13 AC022288
F10O3 AC006550 F14L17 AC012188 F3I6 AC002396 F12G12 AC015446
F15K9 AC005278 T5E21 AC010657 F21J9 AC000103 F23M19 AC007454
F21B7 AC002560 F10B6 AC006917 F5A9 AC004133 F7P12 AC023913
F21M11 AC003027 T15D22 AC012189 F4F7 AC079374 F12K21 AC023279
F20D22 AC002411 F9L1 AC007591 F2J7 AC079281 F21H2 AC007894
F19P19 AC000104 T16N11 AC013453 F14G11 AC084221 F11O6 AC018460
T1G11 AC002376 F7H2 AC034256 F28B23 AC079829 T32G9 AC079605
F13M7 AC004809 T24D18 AC010924 T1K7 AC013427 T9I1 AC069160
T7A14 AC005322 F3O9 AC006341 T24P13 AC006535 F12A4 AC023064
T25N20 AC005106 F19K19 AC011808 T2P11 AC005508 F15O4 AC007887
F3F20 AC007153 F17F16 AC026237 T7N9 AC000348 F14D7 AC021198
T20M3 AC009999 F6I1 AC051629 F17L21 AC004557 F10O5 AC027032
T21E18 AC024174 F20D23 AC007651 T17H3 AC005916 T22A15 AC021666
F9P14 AC025290 T13M22 AC026479 T22C5 AC012375 F5J5 AC006228
T2D23 AC068143 F28G4 AC007843 F28L5 AC079280 F15C21 AC025781
F12K11 AC007592 F1L3 AC022492 F13K9 AC069471 F16I10 AC079278
F4H5 AC011001 F11A6 AC034257 F3H9 AC021044 F7F23 AC021199
F10K1 AC067971 F2H15 AC034106 F3M18 AC010155 F28J9 AC007918
F22G5 AC022464 T10F20 AC034107 F1K23 AC007508 T15P17 AC025782
F24B9 AC007583 T10O22 AC069551 F28N24 AC021043 T32O22 AC079028
T6D22 AC026875 F15H18 AC013354 F15D2 AC068667 F1O3 AC068901
T23G18 AC011438 F25I16 AC026238 T3M22 AC079288 T32E20 AC020646
T27G7 AC006932 F6A14 AC011809 F1N18 AC008030 F28L22 AC007505
F22O13 AC003981 F14D16 AC068602 T1P2 AC022455 T18N24 AC074111
F7G19 AC000106 T29M8 AC069143 T2H7 AC074176 F8L2 AC087569
T12M4 AC003114 F18O14 AC025808 F12P21 AC073506 F2C1 AC074109
T31J12 AC006416 F14P1 AC024609 T4K22 AC025295 F12G6 AC007781
F14J9 AC003970 F6F9 AC007797 F26G16 AC009917 T28N5 AC067965
F21M12 AC000132 T20H2 AC022472 T5I8 AC007060 CEN1
T27I1 AC004122 F14O10 AC026234 T17H7 AC004135 F25O15 AC074108
F14N23 AC005489 F5M15 AC027665 F17F8 AC000107 F9D18 AC007183
T10O24 AC007067 F2D10 AC069251 F28K20 AC004793 F9M8 AC083859
F20B24 AC009398 F9H16 AC007369 T19E23 AC007654 T4I21 AC022456
T16B5 AC007354 T22I11 AC012190 T8E3 AC027135 F5A13 AC008046
T19D16 U95973 F16F4 AC036104 F27M3 AC074360 F16M11 AC084241
T28P6 AC007259 F24J8 AC015447 F5M6 AC079041 F19C17 AC073433
T23J18 AC011661 F8K7 AC007727 T12O21 AC074309 F7F22 AC007534
F25C20 AC007296 T26F17 AC013482 F3C3 AC084165 T8D8 AC025815
F12F1 AC002131 F2E2 AC069252 F27G20 AC084110 F8D11 AC035249
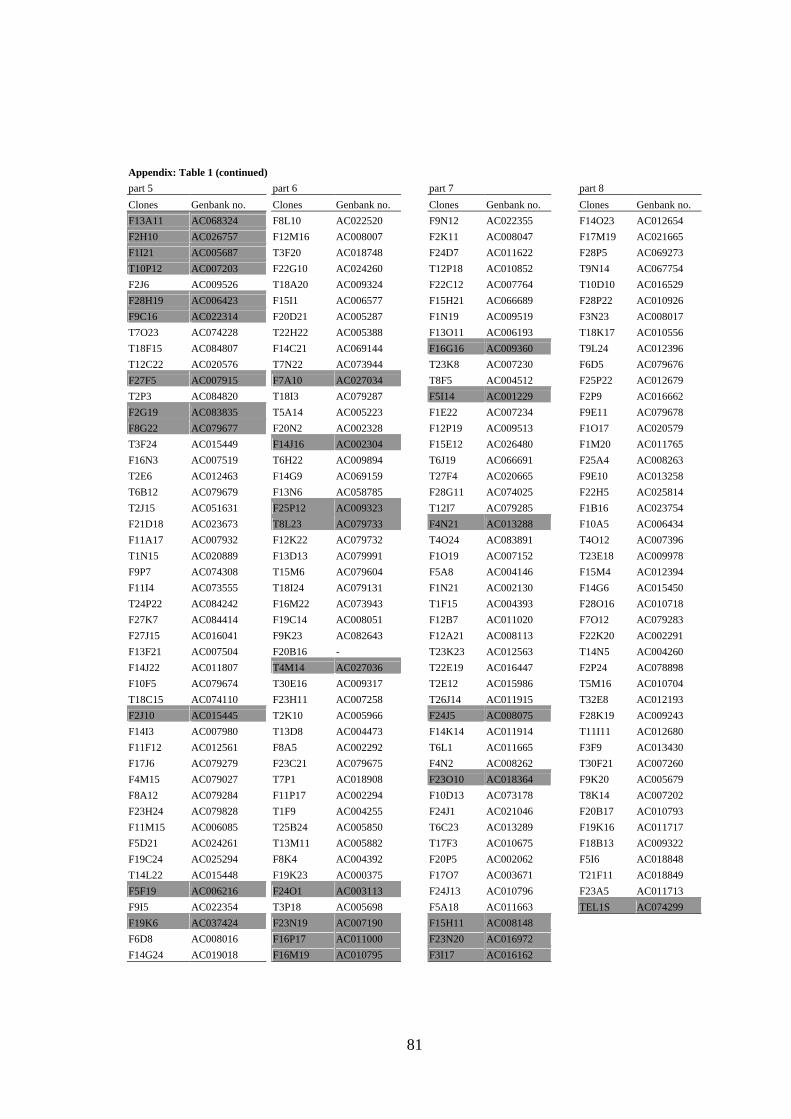
81
Appendix: Table 1 (continued)
part 5 part 6 part 7 part 8
Clones Genbank no. Clones Genbank no. Clones Genbank no. Clones Genbank no.
F13A11 AC068324 F8L10 AC022520 F9N12 AC022355 F14O23 AC012654
F2H10 AC026757 F12M16 AC008007 F2K11 AC008047 F17M19 AC021665
F1I21 AC005687 T3F20 AC018748 F24D7 AC011622 F28P5 AC069273
T10P12 AC007203 F22G10 AC024260 T12P18 AC010852 T9N14 AC067754
F2J6 AC009526 T18A20 AC009324 F22C12 AC007764 T10D10 AC016529
F28H19 AC006423 F15I1 AC006577 F15H21 AC066689 F28P22 AC010926
F9C16 AC022314 F20D21 AC005287 F1N19 AC009519 F3N23 AC008017
T7O23 AC074228 T22H22 AC005388 F13O11 AC006193 T18K17 AC010556
T18F15 AC084807 F14C21 AC069144 F16G16 AC009360 T9L24 AC012396
T12C22 AC020576 T7N22 AC073944 T23K8 AC007230 F6D5 AC079676
F27F5 AC007915 F7A10 AC027034 T8F5 AC004512 F25P22 AC012679
T2P3 AC084820 T18I3 AC079287 F5I14 AC001229 F2P9 AC016662
F2G19 AC083835 T5A14 AC005223 F1E22 AC007234 F9E11 AC079678
F8G22 AC079677 F20N2 AC002328 F12P19 AC009513 F1O17 AC020579
T3F24 AC015449 F14J16 AC002304 F15E12 AC026480 F1M20 AC011765
F16N3 AC007519 T6H22 AC009894 T6J19 AC066691 F25A4 AC008263
T2E6 AC012463 F14G9 AC069159 T27F4 AC020665 F9E10 AC013258
T6B12 AC079679 F13N6 AC058785 F28G11 AC074025 F22H5 AC025814
T2J15 AC051631 F25P12 AC009323 T12I7 AC079285 F1B16 AC023754
F21D18 AC023673 T8L23 AC079733 F4N21 AC013288 F10A5 AC006434
F11A17 AC007932 F12K22 AC079732 T4O24 AC083891 T4O12 AC007396
T1N15 AC020889 F13D13 AC079991 F1O19 AC007152 T23E18 AC009978
F9P7 AC074308 T15M6 AC079604 F5A8 AC004146 F15M4 AC012394
F11I4 AC073555 T18I24 AC079131 F1N21 AC002130 F14G6 AC015450
T24P22 AC084242 F16M22 AC073943 T1F15 AC004393 F28O16 AC010718
F27K7 AC084414 F19C14 AC008051 F12B7 AC011020 F7O12 AC079283
F27J15 AC016041 F9K23 AC082643 F12A21 AC008113 F22K20 AC002291
F13F21 AC007504 F20B16 - T23K23 AC012563 T14N5 AC004260
F14J22 AC011807 T4M14 AC027036 T22E19 AC016447 F2P24 AC078898
F10F5 AC079674 T30E16 AC009317 T2E12 AC015986 T5M16 AC010704
T18C15 AC074110 F23H11 AC007258 T26J14 AC011915 T32E8 AC012193
F2J10 AC015445 T2K10 AC005966 F24J5 AC008075 F28K19 AC009243
F14I3 AC007980 T13D8 AC004473 F14K14 AC011914 T11I11 AC012680
F11F12 AC012561 F8A5 AC002292 T6L1 AC011665 F3F9 AC013430
F17J6 AC079279 F23C21 AC079675 F4N2 AC008262 T30F21 AC007260
F4M15 AC079027 T7P1 AC018908 F23O10 AC018364 F9K20 AC005679
F8A12 AC079284 F11P17 AC002294 F10D13 AC073178 T8K14 AC007202
F23H24 AC079828 T1F9 AC004255 F24J1 AC021046 F20B17 AC010793
F11M15 AC006085 T25B24 AC005850 T6C23 AC013289 F19K16 AC011717
F5D21 AC024261 T13M11 AC005882 T17F3 AC010675 F18B13 AC009322
F19C24 AC025294 F8K4 AC004392 F20P5 AC002062 F5I6 AC018848
T14L22 AC015448 F19K23 AC000375 F17O7 AC003671 T21F11 AC018849
F5F19 AC006216 F24O1 AC003113 F24J13 AC010796 F23A5 AC011713
F9I5 AC022354 T3P18 AC005698 F5A18 AC011663 TEL1S AC074299
F19K6 AC037424 F23N19 AC007190 F15H11 AC008148
F6D8 AC008016 F16P17 AC011000 F23N20 AC016972
F14G24 AC019018 F16M19 AC010795 F3I17 AC016162
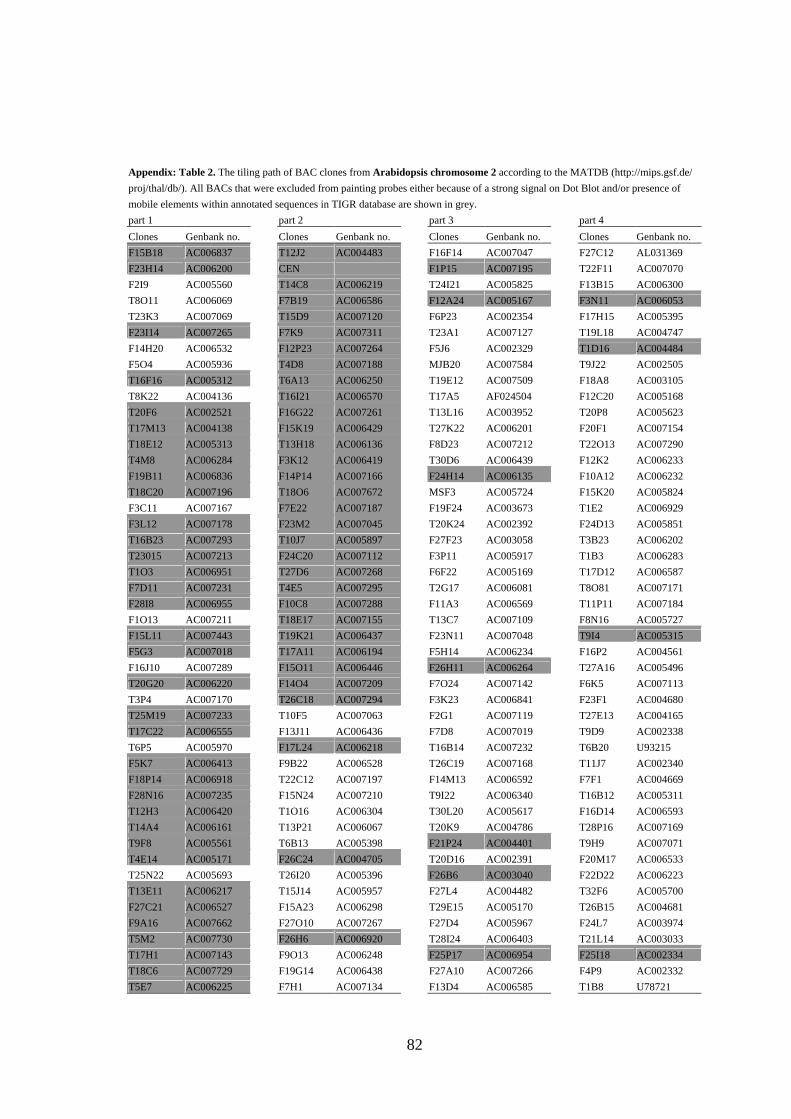
82
Appendix: Table 2. The tiling path of BAC clones from Arabidopsis chromosome 2 according to the MATDB (http://mips.gsf.de/
proj/thal/db/). All BACs that were excluded from painting probes either because of a strong signal on Dot Blot and/or presence of
mobile elements within annotated sequences in TIGR database are shown in grey.
part 1 part 2 part 3 part 4
Clones Genbank no. Clones Genbank no. Clones Genbank no. Clones Genbank no.
F15B18 AC006837 T12J2 AC004483 F16F14 AC007047 F27C12 AL031369
F23H14 AC006200 CEN F1P15 AC007195 T22F11 AC007070
F2I9 AC005560 T14C8 AC006219 T24I21 AC005825 F13B15 AC006300
T8O11 AC006069 F7B19 AC006586 F12A24 AC005167 F3N11 AC006053
T23K3 AC007069 T15D9 AC007120 F6P23 AC002354 F17H15 AC005395
F23I14 AC007265 F7K9 AC007311 T23A1 AC007127 T19L18 AC004747
F14H20 AC006532 F12P23 AC007264 F5J6 AC002329 T1D16 AC004484
F5O4 AC005936 T4D8 AC007188 MJB20 AC007584 T9J22 AC002505
T16F16 AC005312 T6A13 AC006250 T19E12 AC007509 F18A8 AC003105
T8K22 AC004136 T16I21 AC006570 T17A5 AF024504 F12C20 AC005168
T20F6 AC002521 F16G22 AC007261 T13L16 AC003952 T20P8 AC005623
T17M13 AC004138 F15K19 AC006429 T27K22 AC006201 F20F1 AC007154
T18E12 AC005313 T13H18 AC006136 F8D23 AC007212 T22O13 AC007290
T4M8 AC006284 F3K12 AC006419 T30D6 AC006439 F12K2 AC006233
F19B11 AC006836 F14P14 AC007166 F24H14 AC006135 F10A12 AC006232
T18C20 AC007196 T18O6 AC007672 MSF3 AC005724 F15K20 AC005824
F3C11 AC007167 F7E22 AC007187 F19F24 AC003673 T1E2 AC006929
F3L12 AC007178 F23M2 AC007045 T20K24 AC002392 F24D13 AC005851
T16B23 AC007293 T10J7 AC005897 F27F23 AC003058 T3B23 AC006202
T23015 AC007213 F24C20 AC007112 F3P11 AC005917 T1B3 AC006283
T1O3 AC006951 T27D6 AC007268 F6F22 AC005169 T17D12 AC006587
F7D11 AC007231 T4E5 AC007295 T2G17 AC006081 T8O81 AC007171
F28I8 AC006955 F10C8 AC007288 F11A3 AC006569 T11P11 AC007184
F1O13 AC007211 T18E17 AC007155 T13C7 AC007109 F8N16 AC005727
F15L11 AC007443 T19K21 AC006437 F23N11 AC007048 T9I4 AC005315
F5G3 AC007018 T17A11 AC006194 F5H14 AC006234 F16P2 AC004561
F16J10 AC007289 F15O11 AC006446 F26H11 AC006264 T27A16 AC005496
T20G20 AC006220 F14O4 AC007209 F7O24 AC007142 F6K5 AC007113
T3P4 AC007170 T26C18 AC007294 F3K23 AC006841 F23F1 AC004680
T25M19 AC007233 T10F5 AC007063 F2G1 AC007119 T27E13 AC004165
T17C22 AC006555 F13J11 AC006436 F7D8 AC007019 T9D9 AC002338
T6P5 AC005970 F17L24 AC006218 T16B14 AC007232 T6B20 U93215
F5K7 AC006413 F9B22 AC006528 T26C19 AC007168 T11J7 AC002340
F18P14 AC006918 T22C12 AC007197 F14M13 AC006592 F7F1 AC004669
F28N16 AC007235 F15N24 AC007210 T9I22 AC006340 T16B12 AC005311
T12H3 AC006420 T1O16 AC006304 T30L20 AC005617 F16D14 AC006593
T14A4 AC006161 T13P21 AC006067 T20K9 AC004786 T28P16 AC007169
T9F8 AC005561 T6B13 AC005398 F21P24 AC004401 T9H9 AC007071
T4E14 AC005171 F26C24 AC004705 T20D16 AC002391 F20M17 AC006533
T25N22 AC005693 T26I20 AC005396 F26B6 AC003040 F22D22 AC006223
T13E11 AC006217 T15J14 AC005957 F27L4 AC004482 T32F6 AC005700
F27C21 AC006527 F15A23 AC006298 T29E15 AC005170 T26B15 AC004681
F9A16 AC007662 F27O10 AC007267 F27D4 AC005967 F24L7 AC003974
T5M2 AC007730 F26H6 AC006920 T28I24 AC006403 T21L14 AC003033
T17H1 AC007143 F9O13 AC006248 F25P17 AC006954 F25I18 AC002334
T18C6 AC007729 F19G14 AC006438 F27A10 AC007266 F4P9 AC002332
T5E7 AC006225 F7H1 AC007134 F13D4 AC006585 T1B8 U78721
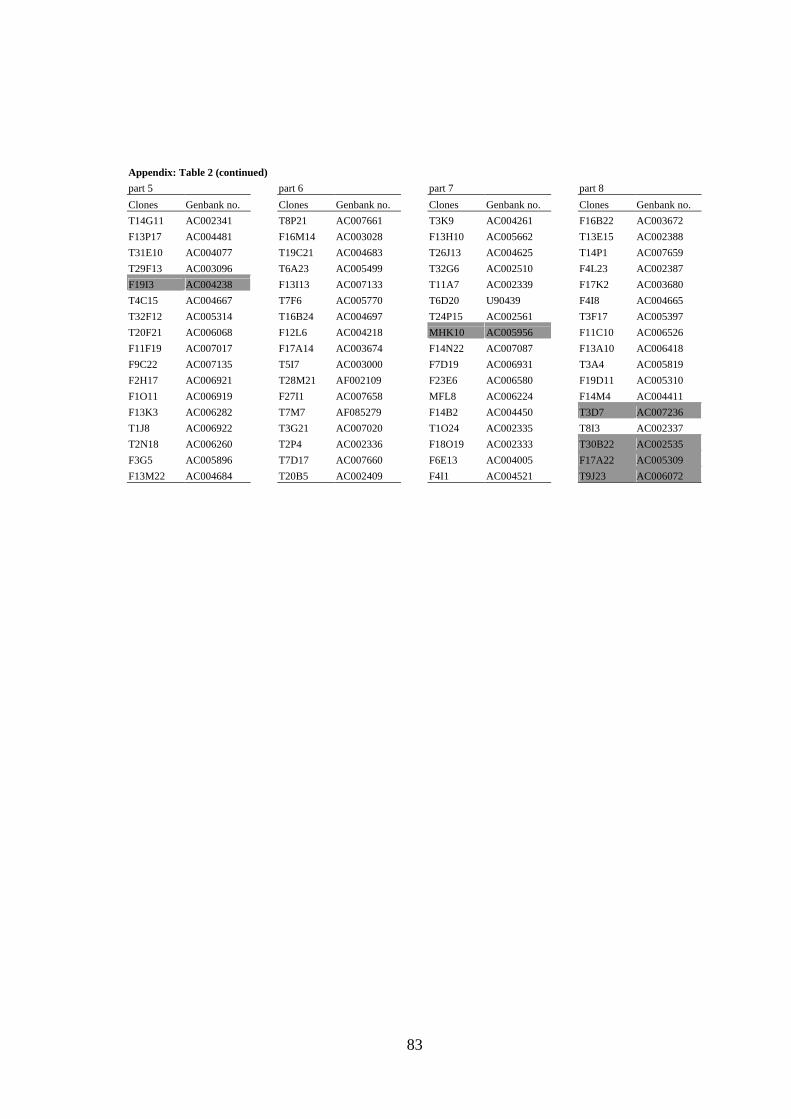
83
Appendix: Table 2 (continued)
part 5 part 6 part 7 part 8
Clones Genbank no. Clones Genbank no. Clones Genbank no. Clones Genbank no.
T14G11 AC002341 T8P21 AC007661 T3K9 AC004261 F16B22 AC003672
F13P17 AC004481 F16M14 AC003028 F13H10 AC005662 T13E15 AC002388
T31E10 AC004077 T19C21 AC004683 T26J13 AC004625 T14P1 AC007659
T29F13 AC003096 T6A23 AC005499 T32G6 AC002510 F4L23 AC002387
F19I3 AC004238 F13I13 AC007133 T11A7 AC002339 F17K2 AC003680
T4C15 AC004667 T7F6 AC005770 T6D20 U90439 F4I8 AC004665
T32F12 AC005314 T16B24 AC004697 T24P15 AC002561 T3F17 AC005397
T20F21 AC006068 F12L6 AC004218 MHK10 AC005956 F11C10 AC006526
F11F19 AC007017 F17A14 AC003674 F14N22 AC007087 F13A10 AC006418
F9C22 AC007135 T5I7 AC003000 F7D19 AC006931 T3A4 AC005819
F2H17 AC006921 T28M21 AF002109 F23E6 AC006580 F19D11 AC005310
F1O11 AC006919 F27I1 AC007658 MFL8 AC006224 F14M4 AC004411
F13K3 AC006282 T7M7 AF085279 F14B2 AC004450 T3D7 AC007236
T1J8 AC006922 T3G21 AC007020 T1O24 AC002335 T8I3 AC002337
T2N18 AC006260 T2P4 AC002336 F18O19 AC002333 T30B22 AC002535
F3G5 AC005896 T7D17 AC007660 F6E13 AC004005 F17A22 AC005309
F13M22 AC004684 T20B5 AC002409 F4I1 AC004521 T9J23 AC006072
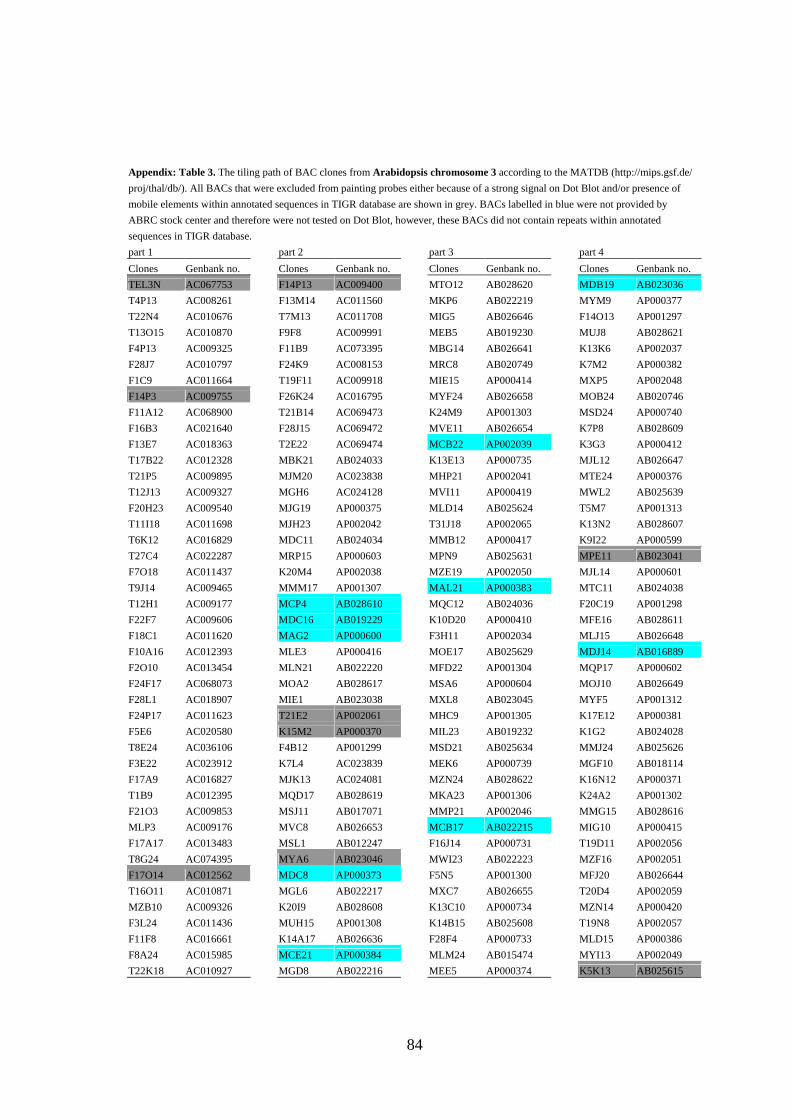
84
Appendix: Table 3. The tiling path of BAC clones from Arabidopsis chromosome 3 according to the MATDB (http://mips.gsf.de/
proj/thal/db/). All BACs that were excluded from painting probes either because of a strong signal on Dot Blot and/or presence of
mobile elements within annotated sequences in TIGR database are shown in grey. BACs labelled in blue were not provided by
ABRC stock center and therefore were not tested on Dot Blot, however, these BACs did not contain repeats within annotated
sequences in TIGR database.
part 1 part 2 part 3 part 4
Clones Genbank no. Clones Genbank no. Clones Genbank no. Clones Genbank no.
TEL3N AC067753 F14P13 AC009400 MTO12 AB028620 MDB19 AB023036
T4P13 AC008261 F13M14 AC011560 MKP6 AB022219 MYM9 AP000377
T22N4 AC010676 T7M13 AC011708 MIG5 AB026646 F14O13 AP001297
T13O15 AC010870 F9F8 AC009991 MEB5 AB019230 MUJ8 AB028621
F4P13 AC009325 F11B9 AC073395 MBG14 AB026641 K13K6 AP002037
F28J7 AC010797 F24K9 AC008153 MRC8 AB020749 K7M2 AP000382
F1C9 AC011664 T19F11 AC009918 MIE15 AP000414 MXP5 AP002048
F14P3 AC009755 F26K24 AC016795 MYF24 AB026658 MOB24 AB020746
F11A12 AC068900 T21B14 AC069473 K24M9 AP001303 MSD24 AP000740
F16B3 AC021640 F28J15 AC069472 MVE11 AB026654 K7P8 AB028609
F13E7 AC018363 T2E22 AC069474 MCB22 AP002039 K3G3 AP000412
T17B22 AC012328 MBK21 AB024033 K13E13 AP000735 MJL12 AB026647
T21P5 AC009895 MJM20 AC023838 MHP21 AP002041 MTE24 AP000376
T12J13 AC009327 MGH6 AC024128 MVI11 AP000419 MWL2 AB025639
F20H23 AC009540 MJG19 AP000375 MLD14 AB025624 T5M7 AP001313
T11I18 AC011698 MJH23 AP002042 T31J18 AP002065 K13N2 AB028607
T6K12 AC016829 MDC11 AB024034 MMB12 AP000417 K9I22 AP000599
T27C4 AC022287 MRP15 AP000603 MPN9 AB025631 MPE11 AB023041
F7O18 AC011437 K20M4 AP002038 MZE19 AP002050 MJL14 AP000601
T9J14 AC009465 MMM17 AP001307 MAL21 AP000383 MTC11 AB024038
T12H1 AC009177 MCP4 AB028610 MQC12 AB024036 F20C19 AP001298
F22F7 AC009606 MDC16 AB019229 K10D20 AP000410 MFE16 AB028611
F18C1 AC011620 MAG2 AP000600 F3H11 AP002034 MLJ15 AB026648
F10A16 AC012393 MLE3 AP000416 MOE17 AB025629 MDJ14 AB016889
F2O10 AC013454 MLN21 AB022220 MFD22 AP001304 MQP17 AP000602
F24F17 AC068073 MOA2 AB028617 MSA6 AP000604 MOJ10 AB026649
F28L1 AC018907 MIE1 AB023038 MXL8 AB023045 MYF5 AP001312
F24P17 AC011623 T21E2 AP002061 MHC9 AP001305 K17E12 AP000381
F5E6 AC020580 K15M2 AP000370 MIL23 AB019232 K1G2 AB024028
T8E24 AC036106 F4B12 AP001299 MSD21 AB025634 MMJ24 AB025626
F3E22 AC023912 K7L4 AC023839 MEK6 AP000739 MGF10 AB018114
F17A9 AC016827 MJK13 AC024081 MZN24 AB028622 K16N12 AP000371
T1B9 AC012395 MQD17 AB028619 MKA23 AP001306 K24A2 AP001302
F21O3 AC009853 MSJ11 AB017071 MMP21 AP002046 MMG15 AB028616
MLP3 AC009176 MVC8 AB026653 MCB17 AB022215 MIG10 AP000415
F17A17 AC013483 MSL1 AB012247 F16J14 AP000731 T19D11 AP002056
T8G24 AC074395 MYA6 AB023046 MWI23 AB022223 MZF16 AP002051
F17O14 AC012562 MDC8 AP000373 F5N5 AP001300 MFJ20 AB026644
T16O11 AC010871 MGL6 AB022217 MXC7 AB026655 T20D4 AP002059
MZB10 AC009326 K20I9 AB028608 K13C10 AP000734 MZN14 AP000420
F3L24 AC011436 MUH15 AP001308 K14B15 AB025608 T19N8 AP002057
F11F8 AC016661 K14A17 AB026636 F28F4 AP000733 MLD15 AP000386
F8A24 AC015985 MCE21 AP000384 MLM24 AB015474 MYI13 AP002049
T22K18 AC010927 MGD8 AB022216 MEE5 AP000374 K5K13 AB025615
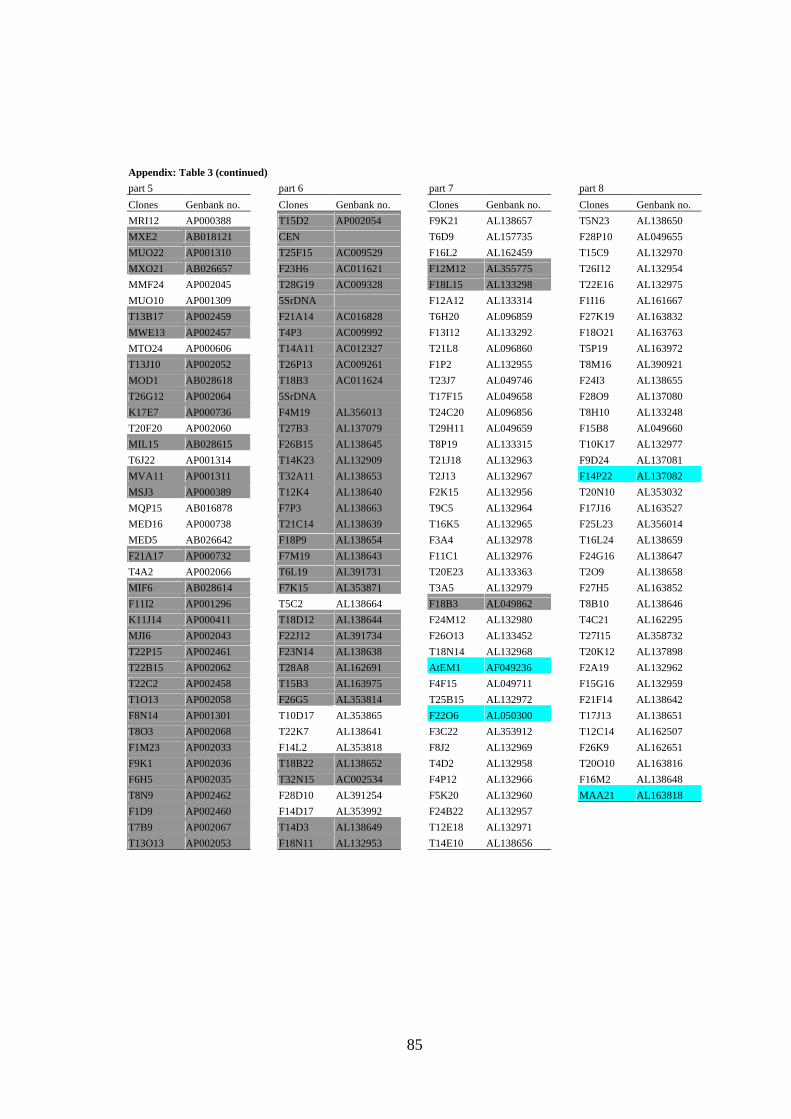
85
Appendix: Table 3 (continued)
part 5 part 6 part 7 part 8
Clones Genbank no. Clones Genbank no. Clones Genbank no. Clones Genbank no.
MRI12 AP000388 T15D2 AP002054 F9K21 AL138657 T5N23 AL138650
MXE2 AB018121 CEN T6D9 AL157735 F28P10 AL049655
MUO22 AP001310 T25F15 AC009529 F16L2 AL162459 T15C9 AL132970
MXO21 AB026657 F23H6 AC011621 F12M12 AL355775 T26I12 AL132954
MMF24 AP002045 T28G19 AC009328 F18L15 AL133298 T22E16 AL132975
MUO10 AP001309 5SrDNA F12A12 AL133314 F1I16 AL161667
T13B17 AP002459 F21A14 AC016828 T6H20 AL096859 F27K19 AL163832
MWE13 AP002457 T4P3 AC009992 F13I12 AL133292 F18O21 AL163763
MTO24 AP000606 T14A11 AC012327 T21L8 AL096860 T5P19 AL163972
T13J10 AP002052 T26P13 AC009261 F1P2 AL132955 T8M16 AL390921
MOD1 AB028618 T18B3 AC011624 T23J7 AL049746 F24I3 AL138655
T26G12 AP002064 5SrDNA T17F15 AL049658 F28O9 AL137080
K17E7 AP000736 F4M19 AL356013 T24C20 AL096856 T8H10 AL133248
T20F20 AP002060 T27B3 AL137079 T29H11 AL049659 F15B8 AL049660
MIL15 AB028615 F26B15 AL138645 T8P19 AL133315 T10K17 AL132977
T6J22 AP001314 T14K23 AL132909 T21J18 AL132963 F9D24 AL137081
MVA11 AP001311 T32A11 AL138653 T2J13 AL132967 F14P22 AL137082
MSJ3 AP000389 T12K4 AL138640 F2K15 AL132956 T20N10 AL353032
MQP15 AB016878 F7P3 AL138663 T9C5 AL132964 F17J16 AL163527
MED16 AP000738 T21C14 AL138639 T16K5 AL132965 F25L23 AL356014
MED5 AB026642 F18P9 AL138654 F3A4 AL132978 T16L24 AL138659
F21A17 AP000732 F7M19 AL138643 F11C1 AL132976 F24G16 AL138647
T4A2 AP002066 T6L19 AL391731 T20E23 AL133363 T2O9 AL138658
MIF6 AB028614 F7K15 AL353871 T3A5 AL132979 F27H5 AL163852
F11I2 AP001296 T5C2 AL138664 F18B3 AL049862 T8B10 AL138646
K11J14 AP000411 T18D12 AL138644 F24M12 AL132980 T4C21 AL162295
MJI6 AP002043 F22J12 AL391734 F26O13 AL133452 T27I15 AL358732
T22P15 AP002461 F23N14 AL138638 T18N14 AL132968 T20K12 AL137898
T22B15 AP002062 T28A8 AL162691 AtEM1 AF049236 F2A19 AL132962
T22C2 AP002458 T15B3 AL163975 F4F15 AL049711 F15G16 AL132959
T1O13 AP002058 F26G5 AL353814 T25B15 AL132972 F21F14 AL138642
F8N14 AP001301 T10D17 AL353865 F22O6 AL050300 T17J13 AL138651
T8O3 AP002068 T22K7 AL138641 F3C22 AL353912 T12C14 AL162507
F1M23 AP002033 F14L2 AL353818 F8J2 AL132969 F26K9 AL162651
F9K1 AP002036 T18B22 AL138652 T4D2 AL132958 T20O10 AL163816
F6H5 AP002035 T32N15 AC002534 F4P12 AL132966 F16M2 AL138648
T8N9 AP002462 F28D10 AL391254 F5K20 AL132960 MAA21 AL163818
F1D9 AP002460 F14D17 AL353992 F24B22 AL132957
T7B9 AP002067 T14D3 AL138649 T12E18 AL132971
T13O13 AP002053 F18N11 AL132953 T14E10 AL138656

86
Appendix: Table 4. The tiling path of BAC clones from Arabidopsis chromosome 4 according to the MATDB (http://mips.gsf.de/
proj/thal/db/). Clones used for chromosome painting (according to Lysak et al., Plant J 28:689-697, 2001) are unlabeled. All BACs
that were either excluded from painting probes or not provided by ABRC stock center are shown in grey..
part 1 part 2 part 3 part 4
Clones Genbank no. Clones Genbank no. Clones Genbank no. Clones Genbank no.
T15P10 AF167571 F9M13 AC006267 T18B16 AL021687 T16L4 AL079344
F6N15 AF069299 T12G13 AL080252 T5K18 AL022580 F27B13 AL050352
F5I10 AF013293 T28D5 AL109819 F24J7 AL021768 F6G3 AL078464
F6N23 AF058919 C18G5 AL110116 T16H5 AL024486 F9N11 AL109796
F15P23 AF128392 T15F16 AF076275 F18F4 AL021637 F17I23 AF160182
T18A10 AF013294 T3F12 AC002983 F1C12 AL022224 T10C21 AL109787
F3I3 AL080237 T32A17 AL161813 F9F13 AL080253 F6I18 AL022198
F2N1 AF007269 T3H13 AF128396 F21C20 AL080254 F6E21 AL049914
F3D13 AF069300 F23J3 AC005359 T13K14 AL080282 F8F16 AL021633
F11O4 AF096370 T8A17 AF072897 F7J7 AL021960 F3L17 AL080283
T15B16 AF104919 T30A10 AL117386 T6K22 AL031187 F28M20 AL031004
T7B11 AC007138 T15G18 AC006567 F18E5 AL022603 F11C18 AL049607
T10M13 AF001308 T25P22 AL161831 F17L22 AL035527 F10N7 AL021636
T2H3 AF075597 F17A8 AL049482 T8O5 AL021890 F10M6 AL021811
T14P8 AF069298 T5L19 AL049481 F1N20 AL022140 F8B4 AL034567
T10P11 AC002330 F28M11 AL049487 T10I14 AL021712 L23H3 AL050398
T5J8 AC004044 F24G24 AL049488 F7K2 AL033545 F4D11 AL022537
T4I9 AF069442 F7L13 AL049524 T12H17 AL021635 T16I18 AL049915
F4C21 AC005275 T4F9 AL049523 F7H19 AL031018 F26P21 AL031804
F9H3 AF071527 T12H20 AF080119 F21P8 AL022347 F4I10 AL035525
T5L23 AC005142 F25I24 AL049525 F16G20 AL031326 F17M5 AL035678
T5H22 AF096372 T22B4 AL049876 F9D16 AL035394 T16L1 AL031394
T7M24 AF077408 F8L21 AL096882 T32A16 AL078468 F17I5 AL031032
T25H8 AF128394 F25E4 AL050399 T19F6 AL109619 F28A23 AL021961
T24M8 AF077409 T5C23 AL049500 T22A6 AL078637 F10M10 AL035521
T24H24 AF075598 T26M18 AL078606 F22K18 AL035356 T4L20 AL023094
T27D20 AF076274 F16J13 AL049638 F6I7 AL049657 F11I11 AL079347
T19B17 AF069441 T4C9 AL080318 F13M23 AL035523 M4E13 AL022023
T26N6 AF076243 T1P17 AL049730 F24A6 AL035396 T12J5 AL035522
F4H6 AF074021 T20K18 AL049640 T30C3 AL079350 F23E12 AL022604
T19J18 AF149414 F25G13 AL079349 M7J2 AL022197 F15J1 AL117188
T4B21 AF118223 F17N18 AL049751 L73G19 AL050400 F8D20 AL031135
T1J1 AF128393 T9E8 AL049608 F14M19 AL049480 F4B14 AL031986
T32N4 AF162444 T6G15 AL049656 F20B18 AL049483 T19K4 AL022373
C17L7 AC012392 F18A5 AL035528 T25K17 AL049171 F23E13 AL022141
C6L9 AC012477 ATFCA0 Z97335 M3E9 AL022223 ATAP22 Z99708
T1J24 AF147263 ATFCA1 Z97336 T15N24 AL078465 ATAP21 Z99707
F6H8 AF178045 ATFCA2 Z97337 F10M23 AL035440 F6G17 AL035601
F21I2 AF147261 ATFCA3 Z97338 T24A18 AL035680 F19F18 AL035605
CEN ATFCA4 Z97339 M4I22 AL030978 T28I19 AL035709
F14G16 AF147260 ATFCA5 Z97340 F27G19 AL078467 F20D10 AL035538
F28D6 AF147262 ATFCA6 Z97341 T29A15 AL035602 F22I13 AL035539
T3E15 AF147264 ATFCA7 Z97342 T27E11 AL049770 F20M13 AL035540
T14A16 AF160181 ATFCA8 Z97343 T13J8 AL035524 T9A14 AL035656
F10A2 AF147259 ATFCA9 Z97344 F26K10 AL049803 F19H22 AL035679
T6L9 AF147265 T6K21 AL021889 F20O9 AL021749 T22F8 AL050351
F5K24 AF128395 F15J5 AL110123 T5F17 AL049917 F23K16 AL078620
T24G23 AC006268 T9A21 AL021713 F16A16 AL035353 T19P19 AL022605
F1K3 AC006266 F28J12 AL021710 F25O24 AL078469 T5J17 AL035708
T17A2 AF160183 F28A21 AL035526 F19B15 AL078470
T13D4 AC007125 F13C5 AL021711 F17A13 AL096692
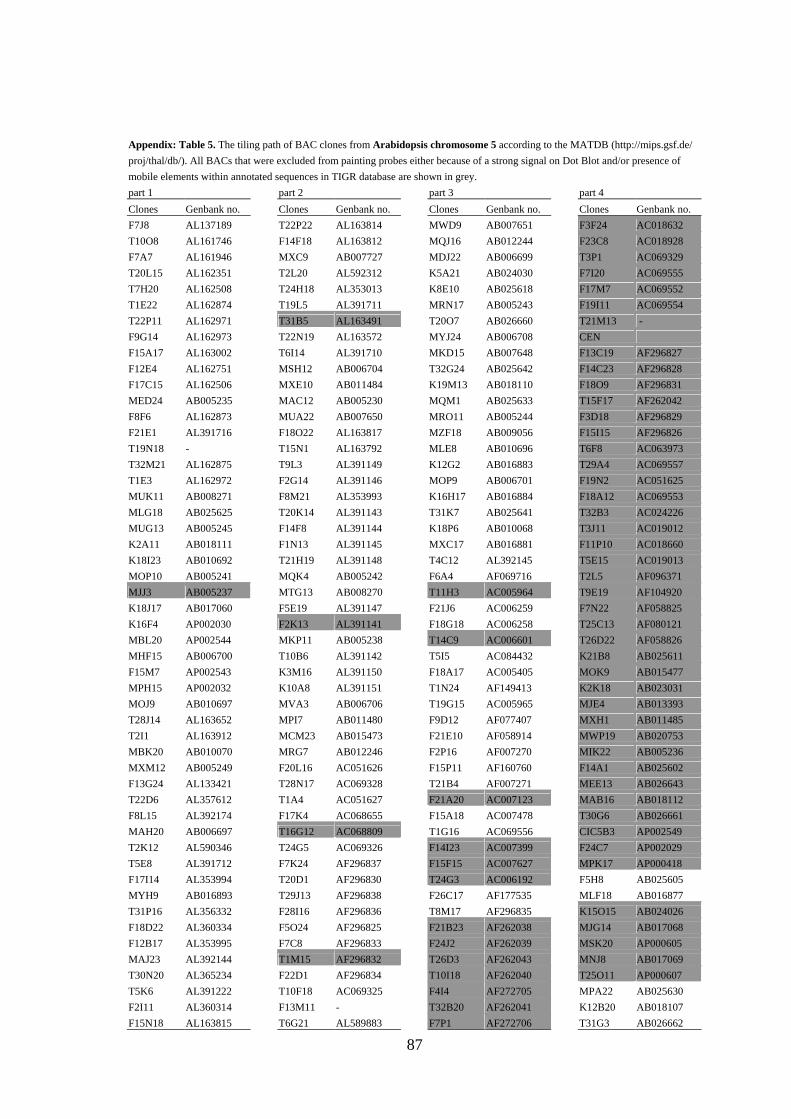
87
Appendix: Table 5. The tiling path of BAC clones from Arabidopsis chromosome 5 according to the MATDB (http://mips.gsf.de/
proj/thal/db/). All BACs that were excluded from painting probes either because of a strong signal on Dot Blot and/or presence of
mobile elements within annotated sequences in TIGR database are shown in grey.
part 1 part 2 part 3 part 4
Clones Genbank no. Clones Genbank no. Clones Genbank no. Clones Genbank no.
F7J8 AL137189 T22P22 AL163814 MWD9 AB007651 F3F24 AC018632
T10O8 AL161746 F14F18 AL163812 MQJ16 AB012244 F23C8 AC018928
F7A7 AL161946 MXC9 AB007727 MDJ22 AB006699 T3P1 AC069329
T20L15 AL162351 T2L20 AL592312 K5A21 AB024030 F7I20 AC069555
T7H20 AL162508 T24H18 AL353013 K8E10 AB025618 F17M7 AC069552
T1E22 AL162874 T19L5 AL391711 MRN17 AB005243 F19I11 AC069554
T22P11 AL162971 T31B5 AL163491 T20O7 AB026660 T21M13 -
F9G14 AL162973 T22N19 AL163572 MYJ24 AB006708 CEN
F15A17 AL163002 T6I14 AL391710 MKD15 AB007648 F13C19 AF296827
F12E4 AL162751 MSH12 AB006704 T32G24 AB025642 F14C23 AF296828
F17C15 AL162506 MXE10 AB011484 K19M13 AB018110 F18O9 AF296831
MED24 AB005235 MAC12 AB005230 MQM1 AB025633 T15F17 AF262042
F8F6 AL162873 MUA22 AB007650 MRO11 AB005244 F3D18 AF296829
F21E1 AL391716 F18O22 AL163817 MZF18 AB009056 F15I15 AF296826
T19N18 - T15N1 AL163792 MLE8 AB010696 T6F8 AC063973
T32M21 AL162875 T9L3 AL391149 K12G2 AB016883 T29A4 AC069557
T1E3 AL162972 F2G14 AL391146 MOP9 AB006701 F19N2 AC051625
MUK11 AB008271 F8M21 AL353993 K16H17 AB016884 F18A12 AC069553
MLG18 AB025625 T20K14 AL391143 T31K7 AB025641 T32B3 AC024226
MUG13 AB005245 F14F8 AL391144 K18P6 AB010068 T3J11 AC019012
K2A11 AB018111 F1N13 AL391145 MXC17 AB016881 F11P10 AC018660
K18I23 AB010692 T21H19 AL391148 T4C12 AL392145 T5E15 AC019013
MOP10 AB005241 MQK4 AB005242 F6A4 AF069716 T2L5 AF096371
MJJ3 AB005237 MTG13 AB008270 T11H3 AC005964 T9E19 AF104920
K18J17 AB017060 F5E19 AL391147 F21J6 AC006259 F7N22 AF058825
K16F4 AP002030 F2K13 AL391141 F18G18 AC006258 T25C13 AF080121
MBL20 AP002544 MKP11 AB005238 T14C9 AC006601 T26D22 AF058826
MHF15 AB006700 T10B6 AL391142 T5I5 AC084432 K21B8 AB025611
F15M7 AP002543 K3M16 AL391150 F18A17 AC005405 MOK9 AB015477
MPH15 AP002032 K10A8 AL391151 T1N24 AF149413 K2K18 AB023031
MOJ9 AB010697 MVA3 AB006706 T19G15 AC005965 MJE4 AB013393
T28J14 AL163652 MPI7 AB011480 F9D12 AF077407 MXH1 AB011485
T2I1 AL163912 MCM23 AB015473 F21E10 AF058914 MWP19 AB020753
MBK20 AB010070 MRG7 AB012246 F2P16 AF007270 MIK22 AB005236
MXM12 AB005249 F20L16 AC051626 F15P11 AF160760 F14A1 AB025602
F13G24 AL133421 T28N17 AC069328 T21B4 AF007271 MEE13 AB026643
T22D6 AL357612 T1A4 AC051627 F21A20 AC007123 MAB16 AB018112
F8L15 AL392174 F17K4 AC068655 F15A18 AC007478 T30G6 AB026661
MAH20 AB006697 T16G12 AC068809 T1G16 AC069556 CIC5B3 AP002549
T2K12 AL590346 T24G5 AC069326 F14I23 AC007399 F24C7 AP002029
T5E8 AL391712 F7K24 AF296837 F15F15 AC007627 MPK17 AP000418
F17I14 AL353994 T20D1 AF296830 T24G3 AC006192 F5H8 AB025605
MYH9 AB016893 T29J13 AF296838 F26C17 AF177535 MLF18 AB016877
T31P16 AL356332 F28I16 AF296836 T8M17 AF296835 K15O15 AB024026
F18D22 AL360334 F5O24 AF296825 F21B23 AF262038 MJG14 AB017068
F12B17 AL353995 F7C8 AF296833 F24J2 AF262039 MSK20 AP000605
MAJ23 AL392144 T1M15 AF296832 T26D3 AF262043 MNJ8 AB017069
T30N20 AL365234 F22D1 AF296834 T10I18 AF262040 T25O11 AP000607
T5K6 AL391222 T10F18 AC069325 F4I4 AF272705 MPA22 AB025630
F2I11 AL360314 F13M11 - T32B20 AF262041 K12B20 AB018107
F15N18 AL163815 T6G21 AL589883 F7P1 AF272706 T31G3 AB026662
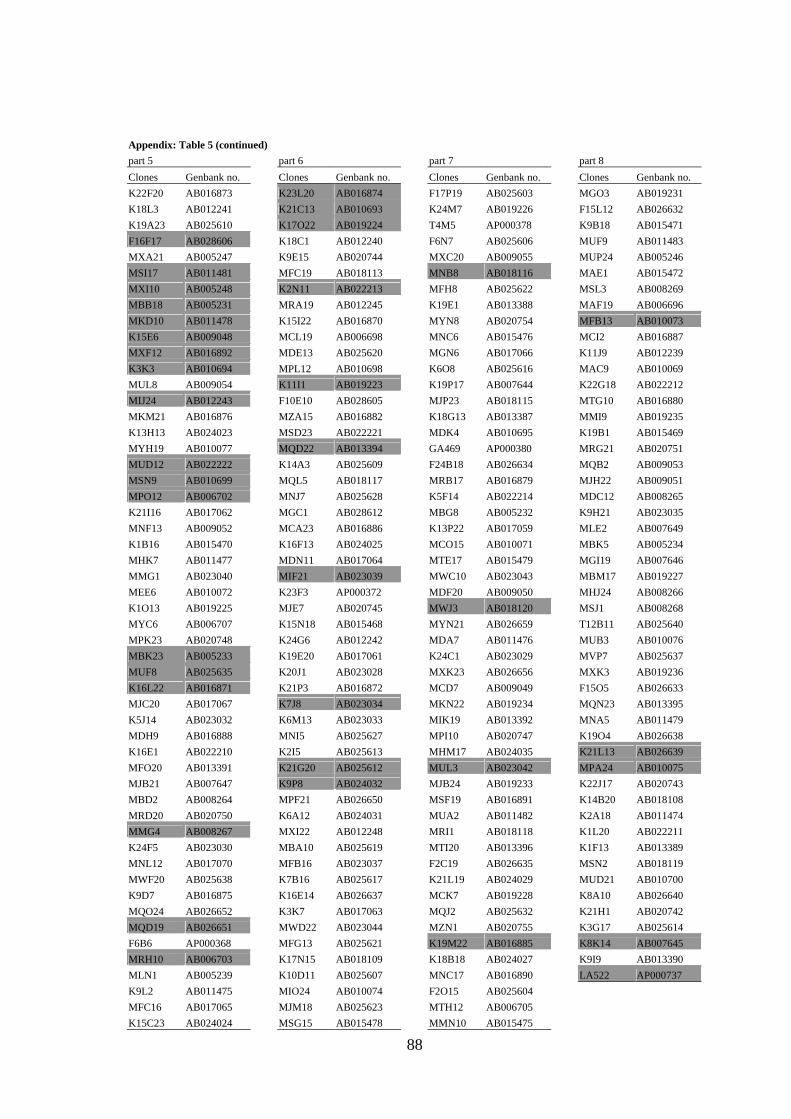
88
Appendix: Table 5 (continued)
part 5 part 6 part 7 part 8
Clones Genbank no. Clones Genbank no. Clones Genbank no. Clones Genbank no.
K22F20 AB016873 K23L20 AB016874 F17P19 AB025603 MGO3 AB019231
K18L3 AB012241 K21C13 AB010693 K24M7 AB019226 F15L12 AB026632
K19A23 AB025610 K17O22 AB019224 T4M5 AP000378 K9B18 AB015471
F16F17 AB028606 K18C1 AB012240 F6N7 AB025606 MUF9 AB011483
MXA21 AB005247 K9E15 AB020744 MXC20 AB009055 MUP24 AB005246
MSI17 AB011481 MFC19 AB018113 MNB8 AB018116 MAE1 AB015472
MXI10 AB005248 K2N11 AB022213 MFH8 AB025622 MSL3 AB008269
MBB18 AB005231 MRA19 AB012245 K19E1 AB013388 MAF19 AB006696
MKD10 AB011478 K15I22 AB016870 MYN8 AB020754 MFB13 AB010073
K15E6 AB009048 MCL19 AB006698 MNC6 AB015476 MCI2 AB016887
MXF12 AB016892 MDE13 AB025620 MGN6 AB017066 K11J9 AB012239
K3K3 AB010694 MPL12 AB010698 K6O8 AB025616 MAC9 AB010069
MUL8 AB009054 K11I1 AB019223 K19P17 AB007644 K22G18 AB022212
MIJ24 AB012243 F10E10 AB028605 MJP23 AB018115 MTG10 AB016880
MKM21 AB016876 MZA15 AB016882 K18G13 AB013387 MMI9 AB019235
K13H13 AB024023 MSD23 AB022221 MDK4 AB010695 K19B1 AB015469
MYH19 AB010077 MQD22 AB013394 GA469 AP000380 MRG21 AB020751
MUD12 AB022222 K14A3 AB025609 F24B18 AB026634 MQB2 AB009053
MSN9 AB010699 MQL5 AB018117 MRB17 AB016879 MJH22 AB009051
MPO12 AB006702 MNJ7 AB025628 K5F14 AB022214 MDC12 AB008265
K21I16 AB017062 MGC1 AB028612 MBG8 AB005232 K9H21 AB023035
MNF13 AB009052 MCA23 AB016886 K13P22 AB017059 MLE2 AB007649
K1B16 AB015470 K16F13 AB024025 MCO15 AB010071 MBK5 AB005234
MHK7 AB011477 MDN11 AB017064 MTE17 AB015479 MGI19 AB007646
MMG1 AB023040 MIF21 AB023039 MWC10 AB023043 MBM17 AB019227
MEE6 AB010072 K23F3 AP000372 MDF20 AB009050 MHJ24 AB008266
K1O13 AB019225 MJE7 AB020745 MWJ3 AB018120 MSJ1 AB008268
MYC6 AB006707 K15N18 AB015468 MYN21 AB026659 T12B11 AB025640
MPK23 AB020748 K24G6 AB012242 MDA7 AB011476 MUB3 AB010076
MBK23 AB005233 K19E20 AB017061 K24C1 AB023029 MVP7 AB025637
MUF8 AB025635 K20J1 AB023028 MXK23 AB026656 MXK3 AB019236
K16L22 AB016871 K21P3 AB016872 MCD7 AB009049 F15O5 AB026633
MJC20 AB017067 K7J8 AB023034 MKN22 AB019234 MQN23 AB013395
K5J14 AB023032 K6M13 AB023033 MIK19 AB013392 MNA5 AB011479
MDH9 AB016888 MNI5 AB025627 MPI10 AB020747 K19O4 AB026638
K16E1 AB022210 K2I5 AB025613 MHM17 AB024035 K21L13 AB026639
MFO20 AB013391 K21G20 AB025612 MUL3 AB023042 MPA24 AB010075
MJB21 AB007647 K9P8 AB024032 MJB24 AB019233 K22J17 AB020743
MBD2 AB008264 MPF21 AB026650 MSF19 AB016891 K14B20 AB018108
MRD20 AB020750 K6A12 AB024031 MUA2 AB011482 K2A18 AB011474
MMG4 AB008267 MXI22 AB012248 MRI1 AB018118 K1L20 AB022211
K24F5 AB023030 MBA10 AB025619 MTI20 AB013396 K1F13 AB013389
MNL12 AB017070 MFB16 AB023037 F2C19 AB026635 MSN2 AB018119
MWF20 AB025638 K7B16 AB025617 K21L19 AB024029 MUD21 AB010700
K9D7 AB016875 K16E14 AB026637 MCK7 AB019228 K8A10 AB026640
MQO24 AB026652 K3K7 AB017063 MQJ2 AB025632 K21H1 AB020742
MQD19 AB026651 MWD22 AB023044 MZN1 AB020755 K3G17 AB025614
F6B6 AP000368 MFG13 AB025621 K19M22 AB016885 K8K14 AB007645
MRH10 AB006703 K17N15 AB018109 K18B18 AB024027 K9I9 AB013390
MLN1 AB005239 K10D11 AB025607 MNC17 AB016890 LA522 AP000737
K9L2 AB011475 MIO24 AB010074 F2O15 AB025604
MFC16 AB017065 MJM18 AB025623 MTH12 AB006705
K15C23 AB024024 MSG15 AB015478 MMN10 AB015475
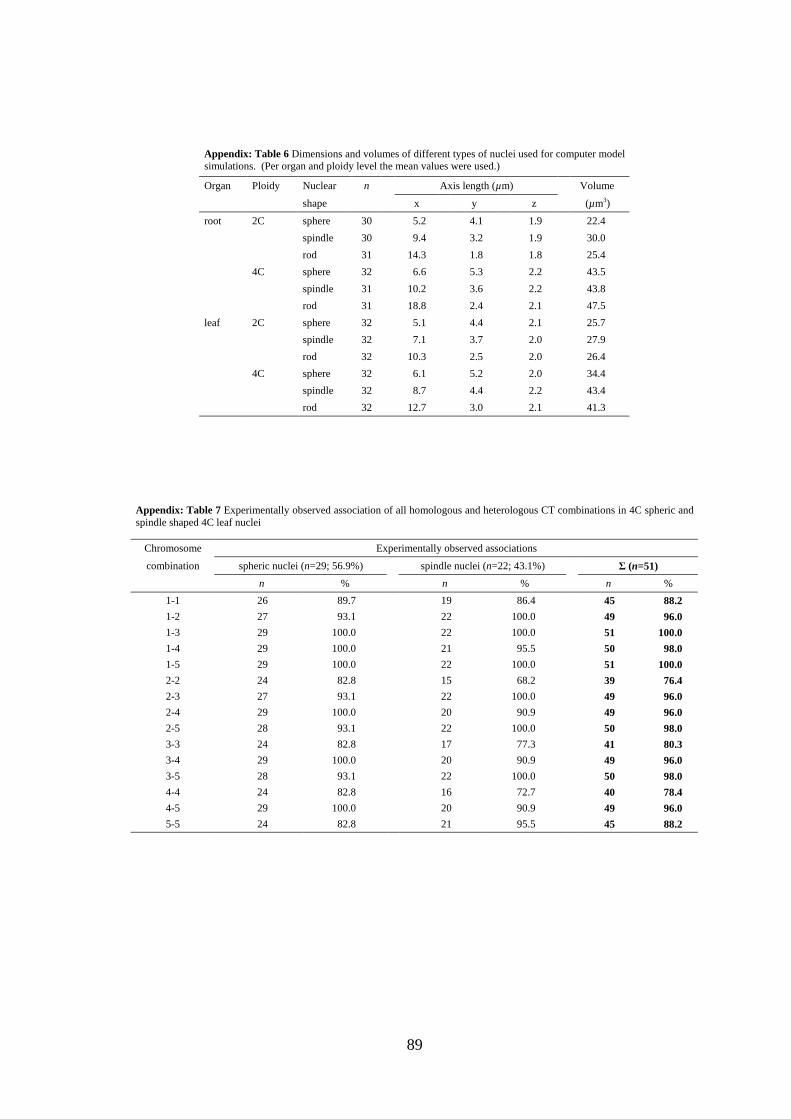
89
Appendix: Table 6 Dimensions and volumes of different types of nuclei used for computer model simulations. (Per organ and ploidy level the mean values were used.)
Organ Ploidy Nuclear n Axis length (µm) Volume
shape x y z (µm3)
root 2C sphere 30 5.2 4.1 1.9 22.4
spindle 30 9.4 3.2 1.9 30.0
rod 31 14.3 1.8 1.8 25.4
4C sphere 32 6.6 5.3 2.2 43.5
spindle 31 10.2 3.6 2.2 43.8
rod 31 18.8 2.4 2.1 47.5
leaf 2C sphere 32 5.1 4.4 2.1 25.7
spindle 32 7.1 3.7 2.0 27.9
rod 32 10.3 2.5 2.0 26.4
4C sphere 32 6.1 5.2 2.0 34.4
spindle 32 8.7 4.4 2.2 43.4
rod 32 12.7 3.0 2.1 41.3
Appendix: Table 7 Experimentally observed association of all homologous and heterologous CT combinations in 4C spheric and spindle shaped 4C leaf nuclei
Chromosome Experimentally observed associations
combination spheric nuclei (n=29; 56.9%) spindle nuclei (n=22; 43.1%) Σ (n=51)
n % n % n %
1-1 26 89.7 19 86.4 45 88.2
1-2 27 93.1 22 100.0 49 96.0
1-3 29 100.0 22 100.0 51 100.0
1-4 29 100.0 21 95.5 50 98.0
1-5 29 100.0 22 100.0 51 100.0
2-2 24 82.8 15 68.2 39 76.4
2-3 27 93.1 22 100.0 49 96.0
2-4 29 100.0 20 90.9 49 96.0
2-5 28 93.1 22 100.0 50 98.0
3-3 24 82.8 17 77.3 41 80.3
3-4 29 100.0 20 90.9 49 96.0
3-5 28 93.1 22 100.0 50 98.0
4-4 24 82.8 16 72.7 40 78.4
4-5 29 100.0 20 90.9 49 96.0
5-5 24 82.8 21 95.5 45 88.2

90
Appendix: Table 8 Values predicted by the SCD model for random association frequency of all homologous and heterologous CT combinations in nuclei of the three predominant nuclear shapes
Chromosome SCD model predicton
combination spheric nuclei (n=103) spindle nuclei (n=103) rod-shaped nuclei (n=103)
n % n % n %
1-1 934 93.4 747 74.7 445 44.5
1-2 1000 100.0 980 98.0 896 89.6
1-3 1000 100.0 986 98.6 904 90.4
1-4 1000 100.0 972 97.2 901 90.1
1-5 1000 100.0 985 98.5 921 92.1
2-2 817 81.7 657 65.7 436 43.6
2-3 999 99.9 969 96.9 881 88.1
2-4 995 99.5 967 96.7 865 86.5
2-5 1000 100.0 973 97.3 899 89.9
3-3 852 85.2 674 67.4 436 43.6
3-4 997 99.7 968 96.8 884 88.4
3-5 1000 100.0 965 96.5 900 90.0
4-4 785 78.5 560 56.0 381 38.1
4-5 1000 100.0 942 94.2 870 87.0
5-5 905 90.5 635 63.5 419 41.9

91
Appendix: Table 9 Experimentally observed associations of chromosome-arm territories in root and leaf nuclei of different shape and DNA content; T=top arm, B=bottom arm, +=associated, -=separated
Homologues Nuclei Experimentally observed associations
Organ Ploidy Shape n % T+B+ T+B- T-B+ T-B-
n % n % n % n %
Chromosome 1 leaf 2C sphere 85 70.2 46 54.1 21 24.7 4 12.9 7 8.3
spindle 29 24.0 9 31.1 3 10.3 7 24.1 14 34.5
rod 7 5.8 2 28.6 0 0.0 0 0.0 5 71.4
Σ 121 100.0 57 47.1 24 19.8 18 14.9 22 18.2
4C sphere 34 34 14 41.2 7 20.6 5 14.7 8 23.5
spindle 51 51 25 49.0 11 21.6 7 13.7 8 15.7
rod 15 15 8 53.4 2 13.3 0 0.0 5 33.3
Σ 100 100.0 47 47.0 20 20.0 12 12.0 21 21.0
8C sphere 33 32.7 16 48.5 3 9.1 5 15.1 9 27.3
spindle 62 61.4 27 43.6 12 19.3 7 11.3 16 25.8
rod 6 5.9 0 0.0 2 33.3 2 33.3 2 33.3
Σ 101 100.0 43 42.6 17 16.8 14 13.8 27 26.8
root 2C sphere 15 12.5 8 53.3 4 26.7 2 13.3 1 6.7
spindle 53 44.2 24 45.3 4 7.5 9 17.0 16 30.2
rod 52 43.3 13 25.0 11 21.1 5 9.6 23 44.2
Σ 120 100.0 45 37.5 19 15.8 16 13.4 40 33.3
4C sphere 15 12.5 5 33.3 4 26.7 5 33.3 1 6.7
spindle 71 59.2 30 42.3 17 23.9 17 23.9 7 9.9
rod 34 28.3 7 20.6 14 41.2 7 20.9 6 17.6
Σ 120 100.0 42 35.0 35 29.2 29 24.2 14 11.6
8C sphere 13 10.8 9 69.2 1 7.7 1 7.7 2 15.4
spindle 98 81.7 44 44.9 16 16.3 16 16.3 22 22.4
rod 9 7.5 2 22.2 1 11.1 0 0.0 6 66.7
Σ 120 100.0 55 45.8 18 15.0 17 14.2 30 25.0
Chromosome 2 leaf 2C sphere 62 51.6 33 53.2 5 8.1 7 11.3 17 27.4
spindle 50 41.7 21 42.0 3 6.0 14 28.0 12 24.0
rod 8 6.7 1 12.5 0 0.0 2 25.0 5 62.5
Σ 120 100.0 55 45.8 8 6.7 23 19.2 34 28.3
4C sphere 54 45.0 23 42.6 3 5.6 15 27.8 13 24.1
spindle 61 50.8 29 47.5 4 6.6 9 14.7 19 31.1
rod 5 4.1 2 40.0 0 0.0 3 60.0 0 0.0
Σ 120 100.0 54 45.0 7 5.8 27 22.5 32 26.7
Chromosome 3 leaf 4C sphere 51 50 25 49.0 14 27.4 3 5.9 9 17.6
spindle 50 49 22 43.1 13 25.5 3 5.9 11 21.6
rod 1 1 0 0.0 0 0.0 1 100.0 0 0.0
Σ 102 100.0 48 47.0 27 26.5 7 6.9 20 19.6
Chromosome 4 leaf 2C sphere 49 40.8 23 47.0 2 4.0 11 22.5 13 26.5
spindle 53 44.2 23 43.4 2 3.8 14 26.4 14 26.4
rod 18 15.0 5 27.8 0 0.0 6 33.3 7 38.9
Σ 120 100.0 51 42.5 4 3.3 31 25.8 34 28.4
4C sphere 76 63.3 32 41.6 7 9.0 19 24.7 19 24.7
spindle 41 34.2 14 35.0 5 12.5 12 30.0 9 22.5
rod 3 2.5 1 33.3 0 0.0 1 33.3 1 33.3
Σ 120 100.0 47 39.2 12 10.0 32 26.7 29 24.1
8C sphere 37 33.0 19 51.4 8 21.6 4 10.8 6 16.2
spindle 68 60.7 27 39.6 15 22.1 8 11.8 18 26.5
rod 7 6.3 1 14.3 1 14.3 0 0 5 71.4
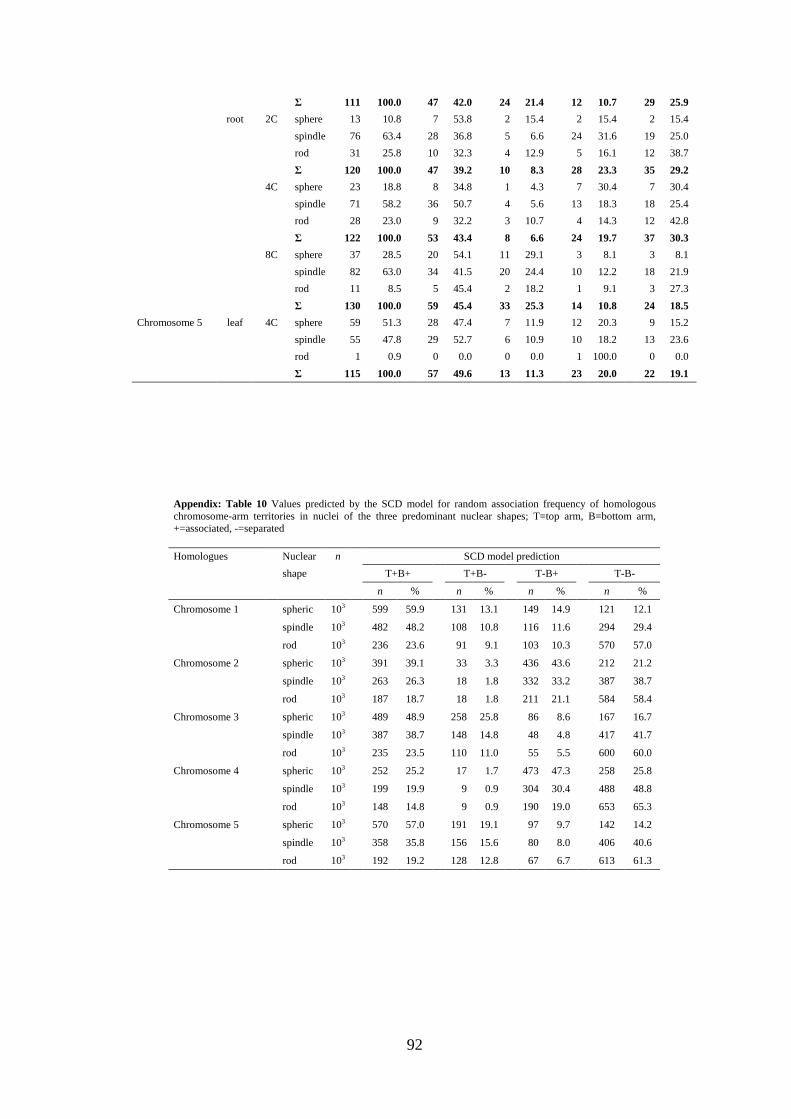
92
Σ 111 100.0 47 42.0 24 21.4 12 10.7 29 25.9
root 2C sphere 13 10.8 7 53.8 2 15.4 2 15.4 2 15.4
spindle 76 63.4 28 36.8 5 6.6 24 31.6 19 25.0
rod 31 25.8 10 32.3 4 12.9 5 16.1 12 38.7
Σ 120 100.0 47 39.2 10 8.3 28 23.3 35 29.2
4C sphere 23 18.8 8 34.8 1 4.3 7 30.4 7 30.4
spindle 71 58.2 36 50.7 4 5.6 13 18.3 18 25.4
rod 28 23.0 9 32.2 3 10.7 4 14.3 12 42.8
Σ 122 100.0 53 43.4 8 6.6 24 19.7 37 30.3
8C sphere 37 28.5 20 54.1 11 29.1 3 8.1 3 8.1
spindle 82 63.0 34 41.5 20 24.4 10 12.2 18 21.9
rod 11 8.5 5 45.4 2 18.2 1 9.1 3 27.3
Σ 130 100.0 59 45.4 33 25.3 14 10.8 24 18.5
Chromosome 5 leaf 4C sphere 59 51.3 28 47.4 7 11.9 12 20.3 9 15.2
spindle 55 47.8 29 52.7 6 10.9 10 18.2 13 23.6
rod 1 0.9 0 0.0 0 0.0 1 100.0 0 0.0
Σ 115 100.0 57 49.6 13 11.3 23 20.0 22 19.1
Appendix: Table 10 Values predicted by the SCD model for random association frequency of homologous chromosome-arm territories in nuclei of the three predominant nuclear shapes; T=top arm, B=bottom arm, +=associated, -=separated
Homologues Nuclear n SCD model prediction
shape T+B+ T+B- T-B+ T-B-
n % n % n % n %
Chromosome 1 spheric 103 599 59.9 131 13.1 149 14.9 121 12.1
spindle 103 482 48.2 108 10.8 116 11.6 294 29.4
rod 103 236 23.6 91 9.1 103 10.3 570 57.0
Chromosome 2 spheric 103 391 39.1 33 3.3 436 43.6 212 21.2
spindle 103 263 26.3 18 1.8 332 33.2 387 38.7
rod 103 187 18.7 18 1.8 211 21.1 584 58.4
Chromosome 3 spheric 103 489 48.9 258 25.8 86 8.6 167 16.7
spindle 103 387 38.7 148 14.8 48 4.8 417 41.7
rod 103 235 23.5 110 11.0 55 5.5 600 60.0
Chromosome 4 spheric 103 252 25.2 17 1.7 473 47.3 258 25.8
spindle 103 199 19.9 9 0.9 304 30.4 488 48.8
rod 103 148 14.8 9 0.9 190 19.0 653 65.3
Chromosome 5 spheric 103 570 57.0 191 19.1 97 9.7 142 14.2
spindle 103 358 35.8 156 15.6 80 8.0 406 40.6
rod 103 192 19.2 128 12.8 67 6.7 613 61.3